User login
Focused Ethnography of Diagnosis in Academic Medical Centers
Diagnostic error—defined as a failure to establish an accurate and timely explanation of the patient’s health problem—is an important source of patient harm.1 Data suggest that all patients will experience at least 1 diagnostic error in their lifetime.2-4 Not surprisingly, diagnostic errors are among the leading categories of paid malpractice claims in the United States.5
Despite diagnostic errors being morbid and sometimes deadly in the hospital,6,7 little is known about how residents and learners approach diagnostic decision making. Errors in diagnosis are believed to stem from cognitive or system failures,8 with errors in cognition believed to occur due to rapid, reflexive thinking operating in the absence of a more analytical, deliberate process. System-based problems (eg, lack of expert availability, technology barriers, and access to data) have also been cited as contributors.9 However, whether and how these apply to trainees is not known.
Therefore, we conducted a focused ethnography of inpatient medicine teams (ie, attendings, residents, interns, and medical students) in 2 affiliated teaching hospitals, aiming to (a) observe the process of diagnosis by trainees and (b) identify methods to improve the diagnostic process and prevent errors.
METHODS
We designed a multimethod, focused ethnographic study to examine diagnostic decision making in hospital settings.10,11 In contrast to anthropologic ethnographies that study entire fields using open-ended questions, our study was designed to examine the process of diagnosis from the perspective of clinicians engaged in this activity.11 This approach allowed us to capture diagnostic decisions and cognitive and system-based factors in a manner currently lacking in the literature.12
Setting and Participants
Between January 2016 and May 2016, we observed the members of four inpatient internal medicine teaching teams at 2 affiliated teaching hospitals. We purposefully selected teaching teams for observation because they are the primary model of care in academic settings and we have expertise in carrying out similar studies.13,14 Teaching teams typically consisted of a medical attending (senior-level physician), 1 senior resident (a second- or third-year postgraduate trainee), two interns (a trainee in their first postgraduate year), and two to four medical students. Teams were selected at random using existing schedules and followed Monday to Friday so as to permit observation of work on call and noncall days. Owing to manpower limitations, weekend and night shifts were not observed. However, overnight events were captured during morning rounds.
Most of the teams began rounds at 8:30 AM. Typically, rounds lasted for 90–120 min and concluded with a recap (ie, “running the list”) with a review of explicit plans for patients after they had been evaluated by the attending. This discussion often occurred in the team rooms, with the attending leading the discussion with the trainees.
Data Collection
A multidisciplinary team, including clinicians (eg, physicians, nurses), nonclinicians (eg, qualitative researchers, social scientists), and healthcare engineers, conducted the observations. We observed preround activities of interns and residents before arrival of the attending (7:00 AM - 8:30 AM), followed by morning rounds with the entire team, and afternoon work that included senior residents, interns, and students.
To capture multiple aspects of the diagnostic process, we collected data using field notes modeled on components of the National Academy of Science model for diagnosis (Appendix).1,15 This model encompasses phases of the diagnostic process (eg, data gathering, integration, formulation of a working diagnosis, treatment delivery, and outcomes) and the work system (team members, organization, technology and tools, physical environment, tasks).
Focus Groups and Interviews
At the end of weekly observations, we conducted focus groups with the residents and one-on- one interviews with the attendings. Focus groups with the residents were conducted to encourage a group discussion about the diagnostic process. Separate interviews with the attendings were performed to ensure that power differentials did not influence discussions. During focus groups, we specifically asked about challenges and possible solutions to improve diagnosis. Experienced qualitative methodologists (J.F., M.H., M.Q.) used semistructured interview guides for discussions (Appendix).
Data Analysis
After aggregating and reading the data, three reviewers (V.C., S.K., S.S.) began inductive analysis by handwriting notes and initial reflective thoughts to create preliminary codes. Multiple team members then reread the original field notes and the focus group/interview data to refine the preliminary codes and develop additional codes. Next, relationships between codes were identified and used to develop key themes. Triangulation of data collected from observations and interview/focus group sessions was carried out to compare data that we surmised with data that were verbalized by the team. The developed themes were discussed as a group to ensure consistency of major findings.
Ethical and Regulatory Oversight
This study was reviewed and approved by the Institutional Review Boards at the University of Michigan Health System (HUM-00106657) and the VA Ann Arbor Healthcare System (1-2016-010040).
RESULTS
Four teaching teams (4 attendings, 4 senior residents, 9 interns, and 14 medical students) were observed over 33 distinct shifts and 168 hours. Observations included morning rounds (96 h), postround call days (52 h), and postround non-call days (20 h). Morning rounds lasted an average of 127 min (range: 48-232 min) and included an average of 9 patients (range: 4-16 patients).
Themes Regarding the Diagnostic Process
We identified the following 4 primary themes related to the diagnostic process in teaching hospitals: (1) diagnosis is a social phenomenon; (2) data necessary to make diagnoses are fragmented; (3) distractions undermine the diagnostic process; and (4) time pressures interfere with diagnostic decision making (Appendix Table 1).
(1) Diagnosis is a Social Phenomenon.
Team members viewed the process of diagnosis as a social exchange of facts, findings, and strategies within a defined structure. The opportunity to discuss impressions with others was valued as a means to share, test, and process assumptions.
“Rounds are the most important part of the process. That is where we make most decisions in a collective, collaborative way with the attending present. We bounce ideas off each other.” (Intern)
Typical of social processes, variations based on time of day and schedule were observed. For instance, during call days, learners gathered data and formed working diagnosis and treatment plans with minimal attending interaction. This separation of roles and responsibilities introduced a hierarchy within diagnosis as follows:
“The interns would not call me first; they would talk to the senior resident and then if the senior thought he should chat with me, then they would call. But for the most part, they gather information and come up with the plan.” (Attending).
The work system was suited to facilitate social interactions. For instance, designated rooms (with team members informally assigned to a computer) provided physical proximity of the resident to interns and medical students. In this space, numerous informal discussions between team members (eg, “What do you think about this test?” “I’m not sure what to do about this finding.” “Should I call a [consult] on this patient?”) were observed. Although proximity to each other was viewed as beneficial, dangers to the social nature of diagnosis in the form of anchoring (ie, a cognitive bias where emphasis is placed on the first piece of data)16 were also mentioned. Similarly, the paradox associated with social proof (ie, the pressure to assume conformity within a group) was also observed as disagreement between team members and attendings rarely occurred during observations.
“I mean, they’re the attending, right? It’s hard to argue with them when they want a test or something done. When I do push back, it’s rare that others will support me–so it’s usually me and the attending.” (Resident)
“I would push back if I think it’s really bad for the patient or could cause harm–but the truth is, it doesn’t happen much.” (Intern)
(2) Data Necessary to Make Diagnoses are Fragmented
Team members universally cited fragmentation in data delivery, retrieval, and processing as a barrier to diagnosis. Team members indicated that test results might not be looked at or acted upon in a timely manner, and participants pointed to the electronic medical record as a source of this challenge.
“Before I knew about [the app for Epic], I would literally sit on the computer to get all the information we would need on rounds. Its key to making decisions. We often say we will do something, only to find the test result doesn’t support it–and then we’re back to square 1.” (Intern)
Information used by teams came from myriad sources (eg, patients, family members, electronic records) and from various settings (eg, emergency department, patient rooms, discussions with consultants). Additionally, test results often appeared without warning. Thus, availability of information was poorly aligned with clinical duties.
“They (the lab) will call us when a blood culture is positive or something is off. That is very helpful but it often comes later in the day, when we’re done with rounds.” (Resident)
The work system was highlighted as a key contributor to data fragmentation. Peculiarities of our electronic medical record (EMR) and how data were collected, stored, or presented were described as “frustrating,” and “unsafe,” by team members. Correspondingly, we frequently observed interns asking for assistance for tasks such as ordering tests or finding information despite being “trained” to use the EMR.
“People have to learn how to filter, how to recognize the most important points and link data streams together in terms of causality. But we assume they know where to find that information. It’s actually a very hard thing to do, for both the house staff and me.” (Attending)
(3) Distractions Undermine the Diagnostic Process
Distractions often created cognitive difficulties. For example, ambient noise and interruptions from neighbors working on other teams were cited as barriers to diagnosis. In addition, we observed several team members using headphones to drown out ambient noise while working on the computer.
“I know I shouldn’t do it (wear headphones), but I have no other way of turning down the noise so I can concentrate.” (Intern)
Similarly, the unpredictable nature and the volume of pages often interrupted thinking about diagnosis.
“Sometimes the pager just goes off all the time and (after making sure its not an urgent issue), I will just ignore it for a bit, especially if I am in the middle of something. It would be great if I could finish my thought process knowing I would not be interrupted.” (Resident)
To mitigate this problem, 1 attending described how he would proactively seek out nurses caring for his patients to “head off” questions (eg, “I will renew the restraints and medications this morning,” and “Is there anything you need in terms of orders for this patient that I can take care of now?”) that might lead to pages. Another resident described his approach as follows:
“I make it a point to tell the nurses where I will be hanging out and where they can find me if they have any questions. I tell them to come talk to me rather than page me since that will be less distracting.” (Resident).
Most of the interns described documentation work such as writing admission and progress notes in negative terms (“an academic exercise,” “part of the billing activity”). However, in the context of interruptions, some described this as helpful.
“The most valuable part of the thinking process was writing the assessment and plan because that’s actually my schema for all problems. It literally is the only time where I can sit and collect my thoughts to formulate a diagnosis and plan.” (Intern)
(4) Time Pressures Interfere With Diagnostic Decision Making
All team members spoke about the challenge of finding time for diagnosis during the workday. Often, they had to skip learning sessions for this purpose.
“They tell us we should go to morning report or noon conference but when I’m running around trying to get things done. I hate having to choose between my education and doing what’s best for the patient–but that’s often what it comes down to.” (Intern)
When specifically asked whether setting aside dedicated time to specifically review and formulate diagnoses would be valuable, respondents were uniformly enthusiastic. Team members described attentional conflicts as being the worst when “cross covering” other teams on call days, as their patient load effectively doubled during this time. Of note, cross-covering occurred when teams were also on call—and thus took them away from important diagnostic activities such as data gathering or synthesis for patients they were admitting.
“If you were to ever design a system where errors were likely–this is how you would design it: take a team with little supervision, double their patient load, keep them busy with new challenging cases and then ask questions about patients they know little about.” (Resident)
DISCUSSION
Although diagnostic errors have been called “the next frontier for patient safety,”17 little is known about the process, barriers, and facilitators to diagnosis in teaching hospitals. In this focused ethnography conducted at 2 academic medical centers, we identified multiple cognitive and system-level challenges and potential strategies to improve diagnosis from trainees engaged in this activity. Key themes identified by those we observed included the social nature of diagnosis, fragmented information delivery, constant distractions and interruptions, and time pressures. In turn, these insights allow us to generate strategies that can be applied to improve the diagnostic process in teaching hospitals.
Our study underscores the importance of social interactions in diagnosis. In contrast, most of the interventions to prevent diagnostic errors target individual providers through practices such as metacognition and “thinking about thinking.”18-20 These interventions are based on Daniel Kahnemann’s work on dual thought process. Type 1 thought processes are fast, subconscious, reflexive, largely intuitive, and more vulnerable to error. In contrast, Type 2 processes are slower, deliberate, analytic, and less prone to error.21 Although an individual’s Type 2 thought capacity is limited, a major goal of cognitive interventions is to encourage Type 2 over Type 1 thinking, an approach termed “de-biasing.”22-24 Unfortunately, cognitive interventions testing such approaches have suffered mixed results–perhaps because of lack of focus on collective wisdom or group thinking, which may be key to diagnosis from our findings.9,25 In this sense, morning rounds were a social gathering used to strategize and develop care plans, but with limited time to think about diagnosis.26 Introduction of defined periods for individuals to engage in diagnostic activities such as de-biasing (ie, asking “what else could this be)27 before or after rounds may provide an opportunity for reflection and improving diagnosis. In addition, embedding tools such as diagnosis expanders and checklists within these defined time slots28,29 may prove to be useful in reflecting on diagnosis and preventing diagnostic errors.
An unexpected yet important finding from this study were the challenges posed by distractions and the physical environment. Potentially maladaptive workarounds to these interruptions included use of headphones; more productive strategies included updating nurses with plans to avert pages and creating a list of activities to ensure that key tasks were not forgotten.30,31 Applying lessons from aviation, a focused effort to limit distractions during key portions of the day, might be worth considering for diagnostic safety.32 Similarly, improving the environment in which diagnosis occurs—including creating spaces that are quiet, orderly, and optimized for thinking—may be valuable.33Our study has limitations. First, our findings are limited to direct observations; we are thus unable to comment on how unobserved aspects of care (eg, cognitive processes) might have influenced our findings. Our observations of clinical care might also have introduced a Hawthorne effect. However, because we were closely integrated with teams and conducted focus groups to corroborate our assessments, we believe that this was not the case. Second, we did not identify diagnostic errors or link processes we observed to errors. Third, our approach is limited to 2 teaching centers, thereby limiting the generalizability of findings. Relatedly, we were only able to conduct observations during weekdays; differences in weekend and night resources might affect our insights.
The cognitive and system-based barriers faced by clinicians in teaching hospitals suggest that new methods to improve diagnosis are needed. Future interventions such as defined “time-outs” for diagnosis, strategies focused on limiting distractions, and methods to improve communication between team members are novel and have parallels in other industries. As challenges to quantify diagnostic errors abound,34 improving cognitive- and system-based factors via reflection through communication, concentration, and organization is necessary to improve medical decision making in academic medical centers.
Disclosures
None declared for all coauthors.
Funding
This project was supported by grant number P30HS024385 from the Agency for Healthcare Research and Quality. The funding source played no role in study design, data acquisition, analysis or decision to report these data. Dr. Chopra is supported by a career development award from the Agency of Healthcare Research and Quality (1-K08-HS022835-01). Dr. Krein is supported by a VA Health Services Research and Development Research Career Scientist Award (RCS 11-222). Dr. Singh is partially supported by Houston VA HSR&D Center for Innovations in Quality, Effectiveness and Safety (CIN 13-413). The content is solely the responsibility of the authors and does not necessarily represent the official views of the Agency for Healthcare Research and Quality or the Department of Veterans Affairs.
1. National Academies of Sciences, Engineering, and Medicine. 2015. Improving Diagnosis in Health Care. Washington, DC: The National Academies Press. http://www.nap.edu/21794. Accessed November 1; 2016:2015. https://doi.org/10.17226/21794.
2. Schiff GD, Hasan O, Kim S, et al. Diagnostic error in medicine: analysis of 583 physician-reported errors. Arch Intern Med. 2009;169(20):1881-1887. http://dx.doi.org/10.1001/archinternmed.2009.333. PubMed
3. Sonderegger-Iseli K, Burger S, Muntwyler J, Salomon F. Diagnostic errors in three medical eras: A necropsy study. Lancet. 2000;355(9220):2027-2031. http://dx.doi.org/10.1016/S0140-6736(00)02349-7. PubMed
4. Winters B, Custer J, Galvagno SM Jr, et al. Diagnostic errors in the intensive care unit: a systematic review of autopsy studies. BMJ Qual Saf. 2012;21(11):894-902. http://dx.doi.org/10.1136/bmjqs-2012-000803. PubMed
5. Saber Tehrani AS, Lee H, Mathews SC, et al. 25-Year summary of US malpractice claims for diagnostic errors 1986-2010: an analysis from the National Practitioner Data Bank. BMJ Qual Saf. 2013;22(8):672-680. http://dx.doi.org/10.1136/bmjqs-2012-001550. PubMed
6. Graber M, Gordon R, Franklin N. Reducing diagnostic errors in medicine: what’s the goal? Acad Med. 2002;77(10):981-992. http://dx.doi.org/10.1097/00001888-200210000-00009. PubMed
7. Gupta A, Snyder A, Kachalia A, Flanders S, Saint S, Chopra V. Malpractice claims related to diagnostic errors in the hospital. BMJ Qual Saf. 2018;27(1):53-60. 10.1136/bmjqs-2017-006774. PubMed
8. van Noord I, Eikens MP, Hamersma AM, de Bruijne MC. Application of root cause analysis on malpractice claim files related to diagnostic failures. Qual Saf Health Care. 2010;19(6):e21. http://dx.doi.org/10.1136/qshc.2008.029801. PubMed
9. Croskerry P, Petrie DA, Reilly JB, Tait G. Deciding about fast and slow decisions. Acad Med. 2014;89(2):197-200. 10.1097/ACM.0000000000000121. PubMed
10. Higginbottom GM, Pillay JJ, Boadu NY. Guidance on performing focused ethnographies with an emphasis on healthcare research. Qual Rep. 2013;18(9):1-6. https://doi.org/10.7939/R35M6287P.
11. Savage J. Participative observation: standing in the shoes of others? Qual Health Res. 2000;10(3):324-339. http://dx.doi.org/10.1177/104973200129118471. PubMed
12. Patton MQ. Qualitative Research and Evaluation Methods. 3rd ed. Thousand Oaks, CA: SAGE Publications; 2002.
13. Harrod M, Weston LE, Robinson C, Tremblay A, Greenstone CL, Forman J. “It goes beyond good camaraderie”: A qualitative study of the process of becoming an interprofessional healthcare “teamlet.” J Interprof Care. 2016;30(3):295-300. http://dx.doi.org/10.3109/13561820.2015.1130028. PubMed
14. Houchens N, Harrod M, Moody S, Fowler KE, Saint S. Techniques and behaviors associated with exemplary inpatient general medicine teaching: an exploratory qualitative study. J Hosp Med. 2017;12(7):503-509. http://dx.doi.org/10.12788/jhm.2763. PubMed
15. Mulhall A. In the field: notes on observation in qualitative research. J Adv Nurs. 2003;41(3):306-313. http://dx.doi.org/10.1046/j.1365-2648.2003.02514.x. PubMed
16. Zwaan L, Monteiro S, Sherbino J, Ilgen J, Howey B, Norman G. Is bias in the eye of the beholder? A vignette study to assess recognition of cognitive biases in clinical case workups. BMJ Qual Saf. 2017;26(2):104-110. http://dx.doi.org/10.1136/bmjqs-2015-005014. PubMed
17. Singh H, Graber ML. Improving diagnosis in health care--the next imperative for patient safety. N Engl J Med. 2015;373(26):2493-2495. http://dx.doi.org/10.1056/NEJMp1512241. PubMed
18. Croskerry P. From mindless to mindful practice--cognitive bias and clinical decision making. N Engl J Med. 2013;368(26):2445-2448. http://dx.doi.org/10.1056/NEJMp1303712. PubMed
19. van den Berge K, Mamede S. Cognitive diagnostic error in internal medicine. Eur J Intern Med. 2013;24(6):525-529. http://dx.doi.org/10.1016/j.ejim.2013.03.006. PubMed
20. Norman G, Sherbino J, Dore K, et al. The etiology of diagnostic errors: A controlled trial of system 1 versus system 2 reasoning. Acad Med. 2014;89(2):277-284. 10.1097/ACM.0000000000000105 PubMed
21. Dhaliwal G. Premature closure? Not so fast. BMJ Qual Saf. 2017;26(2):87-89. http://dx.doi.org/10.1136/bmjqs-2016-005267. PubMed
22. Croskerry P, Singhal G, Mamede S. Cognitive debiasing 1: Origins of bias and theory of debiasing. BMJ Qual Saf. 2013;22(suppl 2):ii58-iiii64. http://dx.doi.org/10.1136/bmjqs-2012-001712. PubMed
23. Croskerry P, Singhal G, Mamede S. Cognitive debiasing 2: Impediments to and strategies for change. BMJ Qual Saf. 2013;22(suppl 2):ii65-iiii72. http://dx.doi.org/10.1136/bmjqs-2012-001713. PubMed
24. Reilly JB, Ogdie AR, Von Feldt JM, Myers JS. Teaching about how doctors think: a longitudinal curriculum in cognitive bias and diagnostic error for residents. BMJ Qual Saf. 2013;22(12):1044-1050. http://dx.doi.org/10.1136/bmjqs-2013-001987. PubMed
25. Schmidt HG, Mamede S, van den Berge K, van Gog T, van Saase JL, Rikers RM. Exposure to media information about a disease can cause doctors to misdiagnose similar-looking clinical cases. Acad Med. 2014;89(2):285-291. http://dx.doi.org/10.1097/ACM.0000000000000107. PubMed
26. Hess BJ, Lipner RS, Thompson V, Holmboe ES, Graber ML. Blink or think: can further reflection improve initial diagnostic impressions? Acad Med. 2015;90(1):112-118. http://dx.doi.org/10.1097/ACM.0000000000000550. PubMed
27. Lambe KA, O’Reilly G, Kelly BD, Curristan S. Dual-process cognitive interventions to enhance diagnostic reasoning: A systematic review. BMJ Qual Saf. 2016;25(10):808-820. http://dx.doi.org/10.1136/bmjqs-2015-004417. PubMed
28. Graber ML, Kissam S, Payne VL, et al. Cognitive interventions to reduce diagnostic error: a narrative review. BMJ Qual Saf. 2012;21(7):535-557. http://dx.doi.org/10.1136/bmjqs-2011-000149. PubMed
29. McDonald KM, Matesic B, Contopoulos-Ioannidis DG, et al. Patient safety strategies targeted at diagnostic errors: a systematic review. Ann Intern Med. 2013;158(5 Pt 2):381-389. http://dx.doi.org/10.7326/0003-4819-158-5-201303051-00004. PubMed
30. Wray CM, Chaudhry S, Pincavage A, et al. Resident shift handoff strategies in US internal medicine residency programs. JAMA. 2016;316(21):2273-2275. http://dx.doi.org/10.1001/jama.2016.17786. PubMed
31. Choo KJ, Arora VM, Barach P, Johnson JK, Farnan JM. How do supervising physicians decide to entrust residents with unsupervised tasks? A qualitative analysis. J Hosp Med. 2014;9(3):169-175. http://dx.doi.org/10.1002/jhm.2150. PubMed
32. Carayon P, Wood KE. Patient safety - the role of human factors and systems engineering. Stud Health Technol Inform. 2010;153:23-46.
.http://dx.doi.org/10.1001/jama.2015.13453 PubMed
34. McGlynn EA, McDonald KM, Cassel CK. Measurement is essential for improving diagnosis and reducing diagnostic error: A report from the Institute of Medicine. JAMA. 2015;314(23):2501-2502.
.http://dx.doi.org/10.1136/bmjqs-2013-001812 PubMed
33. Carayon P, Xie A, Kianfar S. Human factors and ergonomics as a patient safety practice. BMJ Qual Saf. 2014;23(3):196-205. PubMed
Diagnostic error—defined as a failure to establish an accurate and timely explanation of the patient’s health problem—is an important source of patient harm.1 Data suggest that all patients will experience at least 1 diagnostic error in their lifetime.2-4 Not surprisingly, diagnostic errors are among the leading categories of paid malpractice claims in the United States.5
Despite diagnostic errors being morbid and sometimes deadly in the hospital,6,7 little is known about how residents and learners approach diagnostic decision making. Errors in diagnosis are believed to stem from cognitive or system failures,8 with errors in cognition believed to occur due to rapid, reflexive thinking operating in the absence of a more analytical, deliberate process. System-based problems (eg, lack of expert availability, technology barriers, and access to data) have also been cited as contributors.9 However, whether and how these apply to trainees is not known.
Therefore, we conducted a focused ethnography of inpatient medicine teams (ie, attendings, residents, interns, and medical students) in 2 affiliated teaching hospitals, aiming to (a) observe the process of diagnosis by trainees and (b) identify methods to improve the diagnostic process and prevent errors.
METHODS
We designed a multimethod, focused ethnographic study to examine diagnostic decision making in hospital settings.10,11 In contrast to anthropologic ethnographies that study entire fields using open-ended questions, our study was designed to examine the process of diagnosis from the perspective of clinicians engaged in this activity.11 This approach allowed us to capture diagnostic decisions and cognitive and system-based factors in a manner currently lacking in the literature.12
Setting and Participants
Between January 2016 and May 2016, we observed the members of four inpatient internal medicine teaching teams at 2 affiliated teaching hospitals. We purposefully selected teaching teams for observation because they are the primary model of care in academic settings and we have expertise in carrying out similar studies.13,14 Teaching teams typically consisted of a medical attending (senior-level physician), 1 senior resident (a second- or third-year postgraduate trainee), two interns (a trainee in their first postgraduate year), and two to four medical students. Teams were selected at random using existing schedules and followed Monday to Friday so as to permit observation of work on call and noncall days. Owing to manpower limitations, weekend and night shifts were not observed. However, overnight events were captured during morning rounds.
Most of the teams began rounds at 8:30 AM. Typically, rounds lasted for 90–120 min and concluded with a recap (ie, “running the list”) with a review of explicit plans for patients after they had been evaluated by the attending. This discussion often occurred in the team rooms, with the attending leading the discussion with the trainees.
Data Collection
A multidisciplinary team, including clinicians (eg, physicians, nurses), nonclinicians (eg, qualitative researchers, social scientists), and healthcare engineers, conducted the observations. We observed preround activities of interns and residents before arrival of the attending (7:00 AM - 8:30 AM), followed by morning rounds with the entire team, and afternoon work that included senior residents, interns, and students.
To capture multiple aspects of the diagnostic process, we collected data using field notes modeled on components of the National Academy of Science model for diagnosis (Appendix).1,15 This model encompasses phases of the diagnostic process (eg, data gathering, integration, formulation of a working diagnosis, treatment delivery, and outcomes) and the work system (team members, organization, technology and tools, physical environment, tasks).
Focus Groups and Interviews
At the end of weekly observations, we conducted focus groups with the residents and one-on- one interviews with the attendings. Focus groups with the residents were conducted to encourage a group discussion about the diagnostic process. Separate interviews with the attendings were performed to ensure that power differentials did not influence discussions. During focus groups, we specifically asked about challenges and possible solutions to improve diagnosis. Experienced qualitative methodologists (J.F., M.H., M.Q.) used semistructured interview guides for discussions (Appendix).
Data Analysis
After aggregating and reading the data, three reviewers (V.C., S.K., S.S.) began inductive analysis by handwriting notes and initial reflective thoughts to create preliminary codes. Multiple team members then reread the original field notes and the focus group/interview data to refine the preliminary codes and develop additional codes. Next, relationships between codes were identified and used to develop key themes. Triangulation of data collected from observations and interview/focus group sessions was carried out to compare data that we surmised with data that were verbalized by the team. The developed themes were discussed as a group to ensure consistency of major findings.
Ethical and Regulatory Oversight
This study was reviewed and approved by the Institutional Review Boards at the University of Michigan Health System (HUM-00106657) and the VA Ann Arbor Healthcare System (1-2016-010040).
RESULTS
Four teaching teams (4 attendings, 4 senior residents, 9 interns, and 14 medical students) were observed over 33 distinct shifts and 168 hours. Observations included morning rounds (96 h), postround call days (52 h), and postround non-call days (20 h). Morning rounds lasted an average of 127 min (range: 48-232 min) and included an average of 9 patients (range: 4-16 patients).
Themes Regarding the Diagnostic Process
We identified the following 4 primary themes related to the diagnostic process in teaching hospitals: (1) diagnosis is a social phenomenon; (2) data necessary to make diagnoses are fragmented; (3) distractions undermine the diagnostic process; and (4) time pressures interfere with diagnostic decision making (Appendix Table 1).
(1) Diagnosis is a Social Phenomenon.
Team members viewed the process of diagnosis as a social exchange of facts, findings, and strategies within a defined structure. The opportunity to discuss impressions with others was valued as a means to share, test, and process assumptions.
“Rounds are the most important part of the process. That is where we make most decisions in a collective, collaborative way with the attending present. We bounce ideas off each other.” (Intern)
Typical of social processes, variations based on time of day and schedule were observed. For instance, during call days, learners gathered data and formed working diagnosis and treatment plans with minimal attending interaction. This separation of roles and responsibilities introduced a hierarchy within diagnosis as follows:
“The interns would not call me first; they would talk to the senior resident and then if the senior thought he should chat with me, then they would call. But for the most part, they gather information and come up with the plan.” (Attending).
The work system was suited to facilitate social interactions. For instance, designated rooms (with team members informally assigned to a computer) provided physical proximity of the resident to interns and medical students. In this space, numerous informal discussions between team members (eg, “What do you think about this test?” “I’m not sure what to do about this finding.” “Should I call a [consult] on this patient?”) were observed. Although proximity to each other was viewed as beneficial, dangers to the social nature of diagnosis in the form of anchoring (ie, a cognitive bias where emphasis is placed on the first piece of data)16 were also mentioned. Similarly, the paradox associated with social proof (ie, the pressure to assume conformity within a group) was also observed as disagreement between team members and attendings rarely occurred during observations.
“I mean, they’re the attending, right? It’s hard to argue with them when they want a test or something done. When I do push back, it’s rare that others will support me–so it’s usually me and the attending.” (Resident)
“I would push back if I think it’s really bad for the patient or could cause harm–but the truth is, it doesn’t happen much.” (Intern)
(2) Data Necessary to Make Diagnoses are Fragmented
Team members universally cited fragmentation in data delivery, retrieval, and processing as a barrier to diagnosis. Team members indicated that test results might not be looked at or acted upon in a timely manner, and participants pointed to the electronic medical record as a source of this challenge.
“Before I knew about [the app for Epic], I would literally sit on the computer to get all the information we would need on rounds. Its key to making decisions. We often say we will do something, only to find the test result doesn’t support it–and then we’re back to square 1.” (Intern)
Information used by teams came from myriad sources (eg, patients, family members, electronic records) and from various settings (eg, emergency department, patient rooms, discussions with consultants). Additionally, test results often appeared without warning. Thus, availability of information was poorly aligned with clinical duties.
“They (the lab) will call us when a blood culture is positive or something is off. That is very helpful but it often comes later in the day, when we’re done with rounds.” (Resident)
The work system was highlighted as a key contributor to data fragmentation. Peculiarities of our electronic medical record (EMR) and how data were collected, stored, or presented were described as “frustrating,” and “unsafe,” by team members. Correspondingly, we frequently observed interns asking for assistance for tasks such as ordering tests or finding information despite being “trained” to use the EMR.
“People have to learn how to filter, how to recognize the most important points and link data streams together in terms of causality. But we assume they know where to find that information. It’s actually a very hard thing to do, for both the house staff and me.” (Attending)
(3) Distractions Undermine the Diagnostic Process
Distractions often created cognitive difficulties. For example, ambient noise and interruptions from neighbors working on other teams were cited as barriers to diagnosis. In addition, we observed several team members using headphones to drown out ambient noise while working on the computer.
“I know I shouldn’t do it (wear headphones), but I have no other way of turning down the noise so I can concentrate.” (Intern)
Similarly, the unpredictable nature and the volume of pages often interrupted thinking about diagnosis.
“Sometimes the pager just goes off all the time and (after making sure its not an urgent issue), I will just ignore it for a bit, especially if I am in the middle of something. It would be great if I could finish my thought process knowing I would not be interrupted.” (Resident)
To mitigate this problem, 1 attending described how he would proactively seek out nurses caring for his patients to “head off” questions (eg, “I will renew the restraints and medications this morning,” and “Is there anything you need in terms of orders for this patient that I can take care of now?”) that might lead to pages. Another resident described his approach as follows:
“I make it a point to tell the nurses where I will be hanging out and where they can find me if they have any questions. I tell them to come talk to me rather than page me since that will be less distracting.” (Resident).
Most of the interns described documentation work such as writing admission and progress notes in negative terms (“an academic exercise,” “part of the billing activity”). However, in the context of interruptions, some described this as helpful.
“The most valuable part of the thinking process was writing the assessment and plan because that’s actually my schema for all problems. It literally is the only time where I can sit and collect my thoughts to formulate a diagnosis and plan.” (Intern)
(4) Time Pressures Interfere With Diagnostic Decision Making
All team members spoke about the challenge of finding time for diagnosis during the workday. Often, they had to skip learning sessions for this purpose.
“They tell us we should go to morning report or noon conference but when I’m running around trying to get things done. I hate having to choose between my education and doing what’s best for the patient–but that’s often what it comes down to.” (Intern)
When specifically asked whether setting aside dedicated time to specifically review and formulate diagnoses would be valuable, respondents were uniformly enthusiastic. Team members described attentional conflicts as being the worst when “cross covering” other teams on call days, as their patient load effectively doubled during this time. Of note, cross-covering occurred when teams were also on call—and thus took them away from important diagnostic activities such as data gathering or synthesis for patients they were admitting.
“If you were to ever design a system where errors were likely–this is how you would design it: take a team with little supervision, double their patient load, keep them busy with new challenging cases and then ask questions about patients they know little about.” (Resident)
DISCUSSION
Although diagnostic errors have been called “the next frontier for patient safety,”17 little is known about the process, barriers, and facilitators to diagnosis in teaching hospitals. In this focused ethnography conducted at 2 academic medical centers, we identified multiple cognitive and system-level challenges and potential strategies to improve diagnosis from trainees engaged in this activity. Key themes identified by those we observed included the social nature of diagnosis, fragmented information delivery, constant distractions and interruptions, and time pressures. In turn, these insights allow us to generate strategies that can be applied to improve the diagnostic process in teaching hospitals.
Our study underscores the importance of social interactions in diagnosis. In contrast, most of the interventions to prevent diagnostic errors target individual providers through practices such as metacognition and “thinking about thinking.”18-20 These interventions are based on Daniel Kahnemann’s work on dual thought process. Type 1 thought processes are fast, subconscious, reflexive, largely intuitive, and more vulnerable to error. In contrast, Type 2 processes are slower, deliberate, analytic, and less prone to error.21 Although an individual’s Type 2 thought capacity is limited, a major goal of cognitive interventions is to encourage Type 2 over Type 1 thinking, an approach termed “de-biasing.”22-24 Unfortunately, cognitive interventions testing such approaches have suffered mixed results–perhaps because of lack of focus on collective wisdom or group thinking, which may be key to diagnosis from our findings.9,25 In this sense, morning rounds were a social gathering used to strategize and develop care plans, but with limited time to think about diagnosis.26 Introduction of defined periods for individuals to engage in diagnostic activities such as de-biasing (ie, asking “what else could this be)27 before or after rounds may provide an opportunity for reflection and improving diagnosis. In addition, embedding tools such as diagnosis expanders and checklists within these defined time slots28,29 may prove to be useful in reflecting on diagnosis and preventing diagnostic errors.
An unexpected yet important finding from this study were the challenges posed by distractions and the physical environment. Potentially maladaptive workarounds to these interruptions included use of headphones; more productive strategies included updating nurses with plans to avert pages and creating a list of activities to ensure that key tasks were not forgotten.30,31 Applying lessons from aviation, a focused effort to limit distractions during key portions of the day, might be worth considering for diagnostic safety.32 Similarly, improving the environment in which diagnosis occurs—including creating spaces that are quiet, orderly, and optimized for thinking—may be valuable.33Our study has limitations. First, our findings are limited to direct observations; we are thus unable to comment on how unobserved aspects of care (eg, cognitive processes) might have influenced our findings. Our observations of clinical care might also have introduced a Hawthorne effect. However, because we were closely integrated with teams and conducted focus groups to corroborate our assessments, we believe that this was not the case. Second, we did not identify diagnostic errors or link processes we observed to errors. Third, our approach is limited to 2 teaching centers, thereby limiting the generalizability of findings. Relatedly, we were only able to conduct observations during weekdays; differences in weekend and night resources might affect our insights.
The cognitive and system-based barriers faced by clinicians in teaching hospitals suggest that new methods to improve diagnosis are needed. Future interventions such as defined “time-outs” for diagnosis, strategies focused on limiting distractions, and methods to improve communication between team members are novel and have parallels in other industries. As challenges to quantify diagnostic errors abound,34 improving cognitive- and system-based factors via reflection through communication, concentration, and organization is necessary to improve medical decision making in academic medical centers.
Disclosures
None declared for all coauthors.
Funding
This project was supported by grant number P30HS024385 from the Agency for Healthcare Research and Quality. The funding source played no role in study design, data acquisition, analysis or decision to report these data. Dr. Chopra is supported by a career development award from the Agency of Healthcare Research and Quality (1-K08-HS022835-01). Dr. Krein is supported by a VA Health Services Research and Development Research Career Scientist Award (RCS 11-222). Dr. Singh is partially supported by Houston VA HSR&D Center for Innovations in Quality, Effectiveness and Safety (CIN 13-413). The content is solely the responsibility of the authors and does not necessarily represent the official views of the Agency for Healthcare Research and Quality or the Department of Veterans Affairs.
1. National Academies of Sciences, Engineering, and Medicine. 2015. Improving Diagnosis in Health Care. Washington, DC: The National Academies Press. http://www.nap.edu/21794. Accessed November 1; 2016:2015. https://doi.org/10.17226/21794.
2. Schiff GD, Hasan O, Kim S, et al. Diagnostic error in medicine: analysis of 583 physician-reported errors. Arch Intern Med. 2009;169(20):1881-1887. http://dx.doi.org/10.1001/archinternmed.2009.333. PubMed
3. Sonderegger-Iseli K, Burger S, Muntwyler J, Salomon F. Diagnostic errors in three medical eras: A necropsy study. Lancet. 2000;355(9220):2027-2031. http://dx.doi.org/10.1016/S0140-6736(00)02349-7. PubMed
4. Winters B, Custer J, Galvagno SM Jr, et al. Diagnostic errors in the intensive care unit: a systematic review of autopsy studies. BMJ Qual Saf. 2012;21(11):894-902. http://dx.doi.org/10.1136/bmjqs-2012-000803. PubMed
5. Saber Tehrani AS, Lee H, Mathews SC, et al. 25-Year summary of US malpractice claims for diagnostic errors 1986-2010: an analysis from the National Practitioner Data Bank. BMJ Qual Saf. 2013;22(8):672-680. http://dx.doi.org/10.1136/bmjqs-2012-001550. PubMed
6. Graber M, Gordon R, Franklin N. Reducing diagnostic errors in medicine: what’s the goal? Acad Med. 2002;77(10):981-992. http://dx.doi.org/10.1097/00001888-200210000-00009. PubMed
7. Gupta A, Snyder A, Kachalia A, Flanders S, Saint S, Chopra V. Malpractice claims related to diagnostic errors in the hospital. BMJ Qual Saf. 2018;27(1):53-60. 10.1136/bmjqs-2017-006774. PubMed
8. van Noord I, Eikens MP, Hamersma AM, de Bruijne MC. Application of root cause analysis on malpractice claim files related to diagnostic failures. Qual Saf Health Care. 2010;19(6):e21. http://dx.doi.org/10.1136/qshc.2008.029801. PubMed
9. Croskerry P, Petrie DA, Reilly JB, Tait G. Deciding about fast and slow decisions. Acad Med. 2014;89(2):197-200. 10.1097/ACM.0000000000000121. PubMed
10. Higginbottom GM, Pillay JJ, Boadu NY. Guidance on performing focused ethnographies with an emphasis on healthcare research. Qual Rep. 2013;18(9):1-6. https://doi.org/10.7939/R35M6287P.
11. Savage J. Participative observation: standing in the shoes of others? Qual Health Res. 2000;10(3):324-339. http://dx.doi.org/10.1177/104973200129118471. PubMed
12. Patton MQ. Qualitative Research and Evaluation Methods. 3rd ed. Thousand Oaks, CA: SAGE Publications; 2002.
13. Harrod M, Weston LE, Robinson C, Tremblay A, Greenstone CL, Forman J. “It goes beyond good camaraderie”: A qualitative study of the process of becoming an interprofessional healthcare “teamlet.” J Interprof Care. 2016;30(3):295-300. http://dx.doi.org/10.3109/13561820.2015.1130028. PubMed
14. Houchens N, Harrod M, Moody S, Fowler KE, Saint S. Techniques and behaviors associated with exemplary inpatient general medicine teaching: an exploratory qualitative study. J Hosp Med. 2017;12(7):503-509. http://dx.doi.org/10.12788/jhm.2763. PubMed
15. Mulhall A. In the field: notes on observation in qualitative research. J Adv Nurs. 2003;41(3):306-313. http://dx.doi.org/10.1046/j.1365-2648.2003.02514.x. PubMed
16. Zwaan L, Monteiro S, Sherbino J, Ilgen J, Howey B, Norman G. Is bias in the eye of the beholder? A vignette study to assess recognition of cognitive biases in clinical case workups. BMJ Qual Saf. 2017;26(2):104-110. http://dx.doi.org/10.1136/bmjqs-2015-005014. PubMed
17. Singh H, Graber ML. Improving diagnosis in health care--the next imperative for patient safety. N Engl J Med. 2015;373(26):2493-2495. http://dx.doi.org/10.1056/NEJMp1512241. PubMed
18. Croskerry P. From mindless to mindful practice--cognitive bias and clinical decision making. N Engl J Med. 2013;368(26):2445-2448. http://dx.doi.org/10.1056/NEJMp1303712. PubMed
19. van den Berge K, Mamede S. Cognitive diagnostic error in internal medicine. Eur J Intern Med. 2013;24(6):525-529. http://dx.doi.org/10.1016/j.ejim.2013.03.006. PubMed
20. Norman G, Sherbino J, Dore K, et al. The etiology of diagnostic errors: A controlled trial of system 1 versus system 2 reasoning. Acad Med. 2014;89(2):277-284. 10.1097/ACM.0000000000000105 PubMed
21. Dhaliwal G. Premature closure? Not so fast. BMJ Qual Saf. 2017;26(2):87-89. http://dx.doi.org/10.1136/bmjqs-2016-005267. PubMed
22. Croskerry P, Singhal G, Mamede S. Cognitive debiasing 1: Origins of bias and theory of debiasing. BMJ Qual Saf. 2013;22(suppl 2):ii58-iiii64. http://dx.doi.org/10.1136/bmjqs-2012-001712. PubMed
23. Croskerry P, Singhal G, Mamede S. Cognitive debiasing 2: Impediments to and strategies for change. BMJ Qual Saf. 2013;22(suppl 2):ii65-iiii72. http://dx.doi.org/10.1136/bmjqs-2012-001713. PubMed
24. Reilly JB, Ogdie AR, Von Feldt JM, Myers JS. Teaching about how doctors think: a longitudinal curriculum in cognitive bias and diagnostic error for residents. BMJ Qual Saf. 2013;22(12):1044-1050. http://dx.doi.org/10.1136/bmjqs-2013-001987. PubMed
25. Schmidt HG, Mamede S, van den Berge K, van Gog T, van Saase JL, Rikers RM. Exposure to media information about a disease can cause doctors to misdiagnose similar-looking clinical cases. Acad Med. 2014;89(2):285-291. http://dx.doi.org/10.1097/ACM.0000000000000107. PubMed
26. Hess BJ, Lipner RS, Thompson V, Holmboe ES, Graber ML. Blink or think: can further reflection improve initial diagnostic impressions? Acad Med. 2015;90(1):112-118. http://dx.doi.org/10.1097/ACM.0000000000000550. PubMed
27. Lambe KA, O’Reilly G, Kelly BD, Curristan S. Dual-process cognitive interventions to enhance diagnostic reasoning: A systematic review. BMJ Qual Saf. 2016;25(10):808-820. http://dx.doi.org/10.1136/bmjqs-2015-004417. PubMed
28. Graber ML, Kissam S, Payne VL, et al. Cognitive interventions to reduce diagnostic error: a narrative review. BMJ Qual Saf. 2012;21(7):535-557. http://dx.doi.org/10.1136/bmjqs-2011-000149. PubMed
29. McDonald KM, Matesic B, Contopoulos-Ioannidis DG, et al. Patient safety strategies targeted at diagnostic errors: a systematic review. Ann Intern Med. 2013;158(5 Pt 2):381-389. http://dx.doi.org/10.7326/0003-4819-158-5-201303051-00004. PubMed
30. Wray CM, Chaudhry S, Pincavage A, et al. Resident shift handoff strategies in US internal medicine residency programs. JAMA. 2016;316(21):2273-2275. http://dx.doi.org/10.1001/jama.2016.17786. PubMed
31. Choo KJ, Arora VM, Barach P, Johnson JK, Farnan JM. How do supervising physicians decide to entrust residents with unsupervised tasks? A qualitative analysis. J Hosp Med. 2014;9(3):169-175. http://dx.doi.org/10.1002/jhm.2150. PubMed
32. Carayon P, Wood KE. Patient safety - the role of human factors and systems engineering. Stud Health Technol Inform. 2010;153:23-46.
.http://dx.doi.org/10.1001/jama.2015.13453 PubMed
34. McGlynn EA, McDonald KM, Cassel CK. Measurement is essential for improving diagnosis and reducing diagnostic error: A report from the Institute of Medicine. JAMA. 2015;314(23):2501-2502.
.http://dx.doi.org/10.1136/bmjqs-2013-001812 PubMed
33. Carayon P, Xie A, Kianfar S. Human factors and ergonomics as a patient safety practice. BMJ Qual Saf. 2014;23(3):196-205. PubMed
© 2018 Society of Hospital Medicine
Perception of Resources Spent on Defensive Medicine and History of Being Sued Among Hospitalists: Results from a National Survey
Annual healthcare costs in the United States are over $3 trillion and are garnering significant national attention.1 The United States spends approximately 2.5 times more per capita on healthcare when compared to other developed nations.2 One source of unnecessary cost in healthcare is defensive medicine. Defensive medicine has been defined by Congress as occurring “when doctors order tests, procedures, or visits, or avoid certain high-risk patients or procedures, primarily (but not necessarily) because of concern about malpractice liability.”3
Though difficult to assess, in 1 study, defensive medicine was estimated to cost $45 billion annually.4 While general agreement exists that physicians practice defensive medicine, the extent of defensive practices and the subsequent impact on healthcare costs remain unclear. This is especially true for a group of clinicians that is rapidly increasing in number: hospitalists. Currently, there are more than 50,000 hospitalists in the United States,5 yet the prevalence of defensive medicine in this relatively new specialty is unknown. Inpatient care is complex and time constraints can impede establishing an optimal therapeutic relationship with the patient, potentially raising liability fears. We therefore sought to quantify hospitalist physician estimates of the cost of defensive medicine and assess correlates of their estimates. As being sued might spur defensive behaviors, we also assessed how many hospitalists reported being sued and whether this was associated with their estimates of defensive medicine.
METHODS
Survey Questionnaire
In a previously published survey-based analysis, we reported on physician practice and overuse for 2 common scenarios in hospital medicine: preoperative evaluation and management of uncomplicated syncope.6 After responding to the vignettes, each physician was asked to provide demographic and employment information and malpractice history. In addition, they were asked the following: In your best estimation, what percentage of healthcare-related resources (eg, hospital admissions, diagnostic testing, treatment) are spent purely because of defensive medicine concerns? __________% resources
Survey Sample & Administration
The survey was sent to a sample of 1753 hospitalists, randomly identified through the Society of Hospital Medicine’s (SHM) database of members and annual meeting attendees. It is estimated that almost 30% of practicing hospitalists in the United States are members of the SHM.5 A full description of the sampling methodology was previously published.6 Selected hospitalists were mailed surveys, a $20 financial incentive, and subsequent reminders between June and October 2011.
The study was exempted from institutional review board review by the University of Michigan and the VA Ann Arbor Healthcare System.
Variables
The primary outcome of interest was the response to the “% resources” estimated to be spent on defensive medicine. This was analyzed as a continuous variable. Independent variables included the following: VA employment, malpractice insurance payer, employer, history of malpractice lawsuit, sex, race, and years practicing as a physician.
Statistical Analysis
Analyses were conducted using SAS, version 9.4 (SAS Institute). Descriptive statistics were first calculated for all variables. Next, bivariable comparisons between the outcome variables and other variables of interest were performed. Multivariable comparisons were made using linear regression for the outcome of estimated resources spent on defensive medicine. A P value of < 0.05 was considered statistically significant.
RESULTS
Of the 1753 surveys mailed, 253 were excluded due to incorrect addresses or because the recipients were not practicing hospitalists. A total of 1020 were completed and returned, yielding a 68% response rate (1020 out of 1500 eligible). The hospitalist respondents were in practice for an average of 11 years (range 1-40 years). Respondents represented all 50 states and had a diverse background of experience and demographic characteristics, which has been previously described.6
Resources Estimated Spent on Defensive Medicine
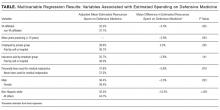

Hospitalists reported, on average, that they believed defensive medicine accounted for 37.5% (standard deviation, 20.2%) of all healthcare spending. Results from the multivariable regression are presented in the Table. Hospitalists affiliated with a VA hospital reported 5.5% less in resources spent on defensive medicine than those not affiliated with a VA hospital (32.2% VA vs 37.7% non-VA, P = 0.025). For every 10 years in practice, the estimate of resources spent on defensive medicine decreased by 3% (P = 0.003). Those who were male (36.4% male vs 39.4% female, P = 0.023) and non-Hispanic white (32.5% non-Hispanic white vs 44.7% other, P ≤ 0.001) also estimated less resources spent on defensive medicine. We did not find an association between a hospitalist reporting being sued and their perception of resources spent on defensive medicine.
Risk of Being Sued

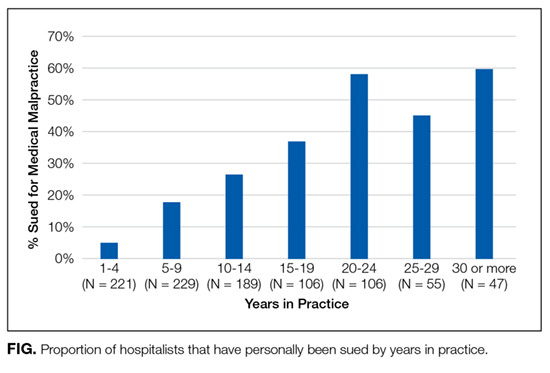
Over a quarter of our sample (25.6%) reported having been sued at least once for medical malpractice. The proportion of hospitalists that reported a history of being sued generally increased with more years of practice (Figure). For those who had been in practice for at least 20 years, more than half (55%) had been sued at least once during their career.
DISCUSSION
In a national survey, hospitalists estimated that almost 40% of all healthcare-related resources are spent purely because of defensive medicine concerns. This estimate was affected by personal demographic and employment factors. Our second major finding is that over one-quarter of a large random sample of hospitalist physicians reported being sued for malpractice.
Hospitalist perceptions of defensive medicine varied significantly based on employment at a VA hospital, with VA-affiliated hospitalists reporting less estimated spending on defensive medicine. This effect may reflect a less litigious environment within the VA, even though physicians practicing within the VA can be reported to the National Practitioner Data Bank.7 The different environment may be due to the VA’s patient mix (VA patients tend to be poorer, older, sicker, and have more mental illness)8; however, it could also be due to its de facto practice of a form of enterprise liability, in which, by law, the VA assumes responsibility for negligence, sheltering its physicians from direct liability.
We also found that the higher the number of years a hospitalist reported practicing, the lower the perception of resources being spent on defensive medicine. The reason for this finding is unclear. There has been a recent focus on high-value care and overspending, and perhaps younger hospitalists are more aware of these initiatives and thus have higher estimates. Additionally, non-Hispanic white male respondents estimated a lower amount spent on defensive medicine compared with other respondents. This is consistent with previous studies of risk perception which have noted a “white male effect” in which white males generally perceive a wide range of risks to be lower than female and non-white individuals, likely due to sociopolitical factors.9 Here, the white male effect is particularly interesting, considering that male physicians are almost 2.5 times as likely as female physicians to report being sued.10
Similar to prior studies,11 there was no association with personal liability claim experience and perceived resources spent on defensive medicine. It is unclear why personal experience of being sued does not appear to be associated with perceptions of defensive medicine practice. It is possible that the fear of being sued is worse than the actual experience or that physicians believe that lawsuits are either random events or inevitable and, as a result, do not change their practice patterns.
The lifetime risk of being named in a malpractice suit is substantial for hospitalists: in our study, over half of hospitalists in practice for 20 years or more reported they had been sued. This corresponds with the projection made by Jena and colleagues,12 which estimated that 55% of internal medicine physicians will be sued by the age of 45, a number just slightly higher than the average for all physicians.
Our study has important limitations. Our sample was of hospitalists and therefore may not be reflective of other medical specialties. Second, due to the nature of the study design, the responses to spending on defensive medicine may not represent actual practice. Third, we did not confirm details such as place of employment or history of lawsuit, and this may be subject to recall bias. However, physicians are unlikely to forget having been sued. Finally, this survey is observational and cross-sectional. Our data imply association rather than causation. Without longitudinal data, it is impossible to know if years of practice correlate with perceived defensive medicine spending due to a generational effect or a longitudinal effect (such as more confidence in diagnostic skills with more years of practice).
Despite these limitations, our survey has important policy implications. First, we found that defensive medicine is perceived by hospitalists to be costly. Although physicians likely overestimated the cost (37.5%, or an estimated $1 trillion is far higher than previous estimates of approximately 2% of all healthcare spending),4 it also demonstrates the extent to which physicians feel as though the medical care that is provided may be unnecessary. Second, at least a quarter of hospitalist physicians have been sued, and the risk of being named as a defendant in a lawsuit increases the longer they have been in clinical practice.
Given these findings, policies aimed to reduce the practice of defensive medicine may help the rising costs of healthcare. Reducing defensive medicine requires decreasing physician fears of liability and related reporting. Traditional tort reforms (with the exception of damage caps) have not been proven to do this. And damage caps can be inequitable, hard to pass, and even found to be unconstitutional in some states.13 However, other reform options hold promise in reducing liability fears, including enterprise liability, safe harbor legislation, and health courts.13 Finally, shared decision-making models may also provide a method to reduce defensive fears as well.6
Acknowledgments
The authors thank the Society of Hospital Medicine, Dr. Scott Flanders, Andrew Hickner, and David Ratz for their assistance with this project.
Disclosure
The authors received financial support from the Blue Cross Blue Shield of Michigan Foundation, the Department of Veterans Affairs Health Services Research and Development Center for Clinical Management Research, the University of Michigan Specialist-Hospitalist Allied Research Program, and the Ann Arbor University of Michigan VA Patient Safety Enhancement Program.
Disclaimer
The views expressed in this article are those of the authors and do not necessarily reflect the position or policy of Blue Cross Blue Shield of Michigan Foundation, the Department of Veterans Affairs, or the Society of Hospital Medicine.
1. Centers for Medicare & Medicaid Services. National Health Expenditures 2014 Highlights. 2015; https://www.cms.gov/Research-Statistics-Data-and-Systems/Statistics-Trends-and-Reports/NationalHealthExpendData/NationalHealthAccountsHistorical.html. Accessed on July 28, 2016.
2. OECD. Health expenditure per capita. Health at a Glance 2015. Paris: OECD Publishing; 2015.
3. U.S. Congress, Office of Technology Assessment. Defensive Medicine and Medical Malpractice. Washington, DC: U.S. Government Printing Office; July 1994. OTA-H-602.
4. Mello MM, Chandra A, Gawande AA, Studdert DM. National costs of the medical liability system. Health Aff (Millwood). 2010;29(9):1569-1577. PubMed
5. Society of Hospital Medicine. Society of Hospital Medicine: Membership. 2017; http://www.hospitalmedicine.org/Web/Membership/Web/Membership/Membership_Landing_Page.aspx?hkey=97f40c85-fdcd-411f-b3f6-e617bc38a2c5. Accessed on January 5, 2017.
6. Kachalia A, Berg A, Fagerlin A, et al. Overuse of testing in preoperative evaluation and syncope: a survey of hospitalists. Ann Intern Med. 2015;162(2):100-108. PubMed
7. Pugatch MB. Federal tort claims and military medical malpractice. J Legal Nurse Consulting. 2008;19(2):3-6.
8. Eibner C, Krull H, Brown K, et al. Current and projected characteristics and unique health care needs of the patient population served by the Department of Veterans Affairs. Santa Monica, CA: RAND Corporation; 2015. PubMed
9. Finucane ML, Slovic P, Mertz CK, Flynn J, Satterfield TA. Gender, race, and perceived risk: the ‘white male’ effect. Health, Risk & Society. 2000;2(2):159-172.
10. Unwin E, Woolf K, Wadlow C, Potts HW, Dacre J. Sex differences in medico-legal action against doctors: a systematic review and meta-analysis. BMC Med. 2015;13:172. PubMed
11. Glassman PA, Rolph JE, Petersen LP, Bradley MA, Kravitz RL. Physicians’ personal malpractice experiences are not related to defensive clinical practices. J Health Polit Policy Law. 1996;21(2):219-241. PubMed
12. Jena AB, Seabury S, Lakdawalla D, Chandra A. Malpractice risk according to physician specialty. N Engl J Med. 2011;365(7):629-636. PubMed
13. Mello MM, Studdert DM, Kachalia A. The medical liability climate and prospects for reform. JAMA. 2014;312(20):2146-2155. PubMed
Annual healthcare costs in the United States are over $3 trillion and are garnering significant national attention.1 The United States spends approximately 2.5 times more per capita on healthcare when compared to other developed nations.2 One source of unnecessary cost in healthcare is defensive medicine. Defensive medicine has been defined by Congress as occurring “when doctors order tests, procedures, or visits, or avoid certain high-risk patients or procedures, primarily (but not necessarily) because of concern about malpractice liability.”3
Though difficult to assess, in 1 study, defensive medicine was estimated to cost $45 billion annually.4 While general agreement exists that physicians practice defensive medicine, the extent of defensive practices and the subsequent impact on healthcare costs remain unclear. This is especially true for a group of clinicians that is rapidly increasing in number: hospitalists. Currently, there are more than 50,000 hospitalists in the United States,5 yet the prevalence of defensive medicine in this relatively new specialty is unknown. Inpatient care is complex and time constraints can impede establishing an optimal therapeutic relationship with the patient, potentially raising liability fears. We therefore sought to quantify hospitalist physician estimates of the cost of defensive medicine and assess correlates of their estimates. As being sued might spur defensive behaviors, we also assessed how many hospitalists reported being sued and whether this was associated with their estimates of defensive medicine.
METHODS
Survey Questionnaire
In a previously published survey-based analysis, we reported on physician practice and overuse for 2 common scenarios in hospital medicine: preoperative evaluation and management of uncomplicated syncope.6 After responding to the vignettes, each physician was asked to provide demographic and employment information and malpractice history. In addition, they were asked the following: In your best estimation, what percentage of healthcare-related resources (eg, hospital admissions, diagnostic testing, treatment) are spent purely because of defensive medicine concerns? __________% resources
Survey Sample & Administration
The survey was sent to a sample of 1753 hospitalists, randomly identified through the Society of Hospital Medicine’s (SHM) database of members and annual meeting attendees. It is estimated that almost 30% of practicing hospitalists in the United States are members of the SHM.5 A full description of the sampling methodology was previously published.6 Selected hospitalists were mailed surveys, a $20 financial incentive, and subsequent reminders between June and October 2011.
The study was exempted from institutional review board review by the University of Michigan and the VA Ann Arbor Healthcare System.
Variables
The primary outcome of interest was the response to the “% resources” estimated to be spent on defensive medicine. This was analyzed as a continuous variable. Independent variables included the following: VA employment, malpractice insurance payer, employer, history of malpractice lawsuit, sex, race, and years practicing as a physician.
Statistical Analysis
Analyses were conducted using SAS, version 9.4 (SAS Institute). Descriptive statistics were first calculated for all variables. Next, bivariable comparisons between the outcome variables and other variables of interest were performed. Multivariable comparisons were made using linear regression for the outcome of estimated resources spent on defensive medicine. A P value of < 0.05 was considered statistically significant.
RESULTS
Of the 1753 surveys mailed, 253 were excluded due to incorrect addresses or because the recipients were not practicing hospitalists. A total of 1020 were completed and returned, yielding a 68% response rate (1020 out of 1500 eligible). The hospitalist respondents were in practice for an average of 11 years (range 1-40 years). Respondents represented all 50 states and had a diverse background of experience and demographic characteristics, which has been previously described.6
Resources Estimated Spent on Defensive Medicine
Hospitalists reported, on average, that they believed defensive medicine accounted for 37.5% (standard deviation, 20.2%) of all healthcare spending. Results from the multivariable regression are presented in the Table. Hospitalists affiliated with a VA hospital reported 5.5% less in resources spent on defensive medicine than those not affiliated with a VA hospital (32.2% VA vs 37.7% non-VA, P = 0.025). For every 10 years in practice, the estimate of resources spent on defensive medicine decreased by 3% (P = 0.003). Those who were male (36.4% male vs 39.4% female, P = 0.023) and non-Hispanic white (32.5% non-Hispanic white vs 44.7% other, P ≤ 0.001) also estimated less resources spent on defensive medicine. We did not find an association between a hospitalist reporting being sued and their perception of resources spent on defensive medicine.
Risk of Being Sued
Over a quarter of our sample (25.6%) reported having been sued at least once for medical malpractice. The proportion of hospitalists that reported a history of being sued generally increased with more years of practice (Figure). For those who had been in practice for at least 20 years, more than half (55%) had been sued at least once during their career.
DISCUSSION
In a national survey, hospitalists estimated that almost 40% of all healthcare-related resources are spent purely because of defensive medicine concerns. This estimate was affected by personal demographic and employment factors. Our second major finding is that over one-quarter of a large random sample of hospitalist physicians reported being sued for malpractice.
Hospitalist perceptions of defensive medicine varied significantly based on employment at a VA hospital, with VA-affiliated hospitalists reporting less estimated spending on defensive medicine. This effect may reflect a less litigious environment within the VA, even though physicians practicing within the VA can be reported to the National Practitioner Data Bank.7 The different environment may be due to the VA’s patient mix (VA patients tend to be poorer, older, sicker, and have more mental illness)8; however, it could also be due to its de facto practice of a form of enterprise liability, in which, by law, the VA assumes responsibility for negligence, sheltering its physicians from direct liability.
We also found that the higher the number of years a hospitalist reported practicing, the lower the perception of resources being spent on defensive medicine. The reason for this finding is unclear. There has been a recent focus on high-value care and overspending, and perhaps younger hospitalists are more aware of these initiatives and thus have higher estimates. Additionally, non-Hispanic white male respondents estimated a lower amount spent on defensive medicine compared with other respondents. This is consistent with previous studies of risk perception which have noted a “white male effect” in which white males generally perceive a wide range of risks to be lower than female and non-white individuals, likely due to sociopolitical factors.9 Here, the white male effect is particularly interesting, considering that male physicians are almost 2.5 times as likely as female physicians to report being sued.10
Similar to prior studies,11 there was no association with personal liability claim experience and perceived resources spent on defensive medicine. It is unclear why personal experience of being sued does not appear to be associated with perceptions of defensive medicine practice. It is possible that the fear of being sued is worse than the actual experience or that physicians believe that lawsuits are either random events or inevitable and, as a result, do not change their practice patterns.
The lifetime risk of being named in a malpractice suit is substantial for hospitalists: in our study, over half of hospitalists in practice for 20 years or more reported they had been sued. This corresponds with the projection made by Jena and colleagues,12 which estimated that 55% of internal medicine physicians will be sued by the age of 45, a number just slightly higher than the average for all physicians.
Our study has important limitations. Our sample was of hospitalists and therefore may not be reflective of other medical specialties. Second, due to the nature of the study design, the responses to spending on defensive medicine may not represent actual practice. Third, we did not confirm details such as place of employment or history of lawsuit, and this may be subject to recall bias. However, physicians are unlikely to forget having been sued. Finally, this survey is observational and cross-sectional. Our data imply association rather than causation. Without longitudinal data, it is impossible to know if years of practice correlate with perceived defensive medicine spending due to a generational effect or a longitudinal effect (such as more confidence in diagnostic skills with more years of practice).
Despite these limitations, our survey has important policy implications. First, we found that defensive medicine is perceived by hospitalists to be costly. Although physicians likely overestimated the cost (37.5%, or an estimated $1 trillion is far higher than previous estimates of approximately 2% of all healthcare spending),4 it also demonstrates the extent to which physicians feel as though the medical care that is provided may be unnecessary. Second, at least a quarter of hospitalist physicians have been sued, and the risk of being named as a defendant in a lawsuit increases the longer they have been in clinical practice.
Given these findings, policies aimed to reduce the practice of defensive medicine may help the rising costs of healthcare. Reducing defensive medicine requires decreasing physician fears of liability and related reporting. Traditional tort reforms (with the exception of damage caps) have not been proven to do this. And damage caps can be inequitable, hard to pass, and even found to be unconstitutional in some states.13 However, other reform options hold promise in reducing liability fears, including enterprise liability, safe harbor legislation, and health courts.13 Finally, shared decision-making models may also provide a method to reduce defensive fears as well.6
Acknowledgments
The authors thank the Society of Hospital Medicine, Dr. Scott Flanders, Andrew Hickner, and David Ratz for their assistance with this project.
Disclosure
The authors received financial support from the Blue Cross Blue Shield of Michigan Foundation, the Department of Veterans Affairs Health Services Research and Development Center for Clinical Management Research, the University of Michigan Specialist-Hospitalist Allied Research Program, and the Ann Arbor University of Michigan VA Patient Safety Enhancement Program.
Disclaimer
The views expressed in this article are those of the authors and do not necessarily reflect the position or policy of Blue Cross Blue Shield of Michigan Foundation, the Department of Veterans Affairs, or the Society of Hospital Medicine.
1. Centers for Medicare & Medicaid Services. National Health Expenditures 2014 Highlights. 2015; https://www.cms.gov/Research-Statistics-Data-and-Systems/Statistics-Trends-and-Reports/NationalHealthExpendData/NationalHealthAccountsHistorical.html. Accessed on July 28, 2016.
2. OECD. Health expenditure per capita. Health at a Glance 2015. Paris: OECD Publishing; 2015.
3. U.S. Congress, Office of Technology Assessment. Defensive Medicine and Medical Malpractice. Washington, DC: U.S. Government Printing Office; July 1994. OTA-H-602.
4. Mello MM, Chandra A, Gawande AA, Studdert DM. National costs of the medical liability system. Health Aff (Millwood). 2010;29(9):1569-1577. PubMed
5. Society of Hospital Medicine. Society of Hospital Medicine: Membership. 2017; http://www.hospitalmedicine.org/Web/Membership/Web/Membership/Membership_Landing_Page.aspx?hkey=97f40c85-fdcd-411f-b3f6-e617bc38a2c5. Accessed on January 5, 2017.
6. Kachalia A, Berg A, Fagerlin A, et al. Overuse of testing in preoperative evaluation and syncope: a survey of hospitalists. Ann Intern Med. 2015;162(2):100-108. PubMed
7. Pugatch MB. Federal tort claims and military medical malpractice. J Legal Nurse Consulting. 2008;19(2):3-6.
8. Eibner C, Krull H, Brown K, et al. Current and projected characteristics and unique health care needs of the patient population served by the Department of Veterans Affairs. Santa Monica, CA: RAND Corporation; 2015. PubMed
9. Finucane ML, Slovic P, Mertz CK, Flynn J, Satterfield TA. Gender, race, and perceived risk: the ‘white male’ effect. Health, Risk & Society. 2000;2(2):159-172.
10. Unwin E, Woolf K, Wadlow C, Potts HW, Dacre J. Sex differences in medico-legal action against doctors: a systematic review and meta-analysis. BMC Med. 2015;13:172. PubMed
11. Glassman PA, Rolph JE, Petersen LP, Bradley MA, Kravitz RL. Physicians’ personal malpractice experiences are not related to defensive clinical practices. J Health Polit Policy Law. 1996;21(2):219-241. PubMed
12. Jena AB, Seabury S, Lakdawalla D, Chandra A. Malpractice risk according to physician specialty. N Engl J Med. 2011;365(7):629-636. PubMed
13. Mello MM, Studdert DM, Kachalia A. The medical liability climate and prospects for reform. JAMA. 2014;312(20):2146-2155. PubMed
© 2018 Society of Hospital Medicine
How Exemplary Teaching Physicians Interact with Hospitalized Patients
Approximately a century ago, Francis Peabody taught that “the secret of the care of the patient is in caring for the patient.”1 His advice remains true today. Despite the advent of novel diagnostic tests, technologically sophisticated interventional procedures, and life-saving medications, perhaps the most important skill a bedside clinician can use is the ability to connect with patients.
The literature on patient-physician interaction is vast2-11 and generally indicates that exemplary bedside clinicians are able to interact well with patients by being competent, trustworthy, personable, empathetic, and effective communicators. “Etiquette-based medicine,” first proposed by Kahn,12 emphasizes the importance of certain behaviors from physicians, such as introducing yourself and
Yet, improving patient-physician interactions remains necessary. A recent systematic review reported that almost half of the reviewed studies on the patient-physician relationship published between 2000 and 2014 conveyed the idea that the patient-physician relationship is deteriorating.13
As part of a broader study to understand the behaviors and approaches of exemplary inpatient attending physicians,14-16 we examined how 12 carefully selected physicians interacted with their patients during inpatient teaching rounds.
METHODS
Overview
We conducted a multisite study using an exploratory, qualitative approach to inquiry, which has been described previously.14-16 Our primary purpose was to study the attributes and behaviors of outstanding general medicine attendings in the setting of inpatient rounds. The focus of this article is on the attendings’ interactions with patients.
We used a modified snowball sampling approach17 to identify 12 exemplary physicians. First, we contacted individuals throughout the United States who were known to the principal investigator (S.S.) and asked for suggestions of excellent clinician educators (also referred to as attendings) for potential inclusion in the study. In addition to these personal contacts, other individuals unknown to the investigative team were contacted and asked to provide suggestions for attendings to include in the study. Specifically, the US News & World Report 2015 Top Medical Schools: Research Rankings,18 which are widely used to represent the best U.S. hospitals, were reviewed in an effort to identify attendings from a broad range of medical schools. Using this list, we identified other medical schools that were in the top 25 and were not already represented. We contacted the division chiefs of general internal (or hospital) medicine, chairs and chiefs of departments of internal medicine, and internal medicine residency program directors from these medical schools and asked for recommendations of attendings from both within and outside their institutions whom they considered to be great inpatient teachers.
This sampling method resulted in 59 potential participants. An internet search was conducted on each potential participant to obtain further information about the individuals and their institutions. Both personal characteristics (medical education, training, and educational awards) and organizational characteristics (geographic location, hospital size and affiliation, and patient population) were considered so that a variety of organizations and backgrounds were represented. Through this process, the list was narrowed to 16 attendings who were contacted to participate in the study, of which 12 agreed. The number of attendings examined was appropriate because saturation of metathemes can occur in as little as 6 interviews, and data saturation occurs at 12 interviews.19 The participants were asked to provide a list of their current learners (ie, residents and medical students) and 6 to 10 former learners to contact for interviews and focus groups.
Data Collection
Observations
Two researchers conducted the one-day site visits. One was a physician (S.S.) and the other a medical anthropologist (M.H.), and both have extensive experience in qualitative methods. The only exception was the site visit at the principal investigator’s own institution, which was conducted by the medical anthropologist and a nonpracticing physician who was unknown to the participants. The team structure varied slightly among different institutions but in general was composed of 1 attending, 1 senior medical resident, 1 to 2 interns, and approximately 2 medical students. Each site visit began with observing the attendings (n = 12) and current learners (n = 57) on morning rounds, which included their interactions with patients. These observations lasted approximately 2 to 3 hours. The observers took handwritten field notes, paying particular attention to group interactions, teaching approaches, and patient interactions. The observers stood outside the medical team circle and remained silent during rounds so as to be unobtrusive to the teams’ discussions. The observers discussed and compared their notes after each site visit.
Interviews and Focus Groups
The research team also conducted individual, semistructured interviews with the attendings (n = 12), focus groups with their current teams (n = 46), and interviews or focus groups with their former learners (n = 26). Current learners were asked open-ended questions about their roles on the teams, their opinions of the attendings, and the care the attendings provide to their patients. Because they were observed during rounds, the researchers asked for clarification about specific interactions observed during the teaching rounds. Depending on availability and location, former learners either participated in in-person focus groups or interviews on the day of the site visit, or in a later telephone interview. All interviews and focus groups were audio recorded and transcribed.
This study was deemed to be exempt from regulation by the University of Michigan Institutional Review Board. All participants were informed that their participation was completely voluntary and that they could refuse to answer any question.
Data Analysis
Data were analyzed using a thematic analysis approach,20 which involves reading through the data to identify patterns (and create codes) that relate to behaviors, experiences, meanings, and activities. The patterns are then grouped into themes to help further explain the findings.21 The research team members (S.S. and M.H.) met after the first site visit and developed initial ideas about meanings and possible patterns. One team member (M.H.) read all the transcripts from the site visit and, based on the data, developed a codebook to be used for this study. This process was repeated after every site visit, and the coding definitions were refined as necessary. All transcripts were reviewed to apply any new codes when they developed. NVivo® 10 software (QSR International, Melbourne, Australia) was used to assist with the qualitative data analysis.
To ensure consistency and identify relationships between codes, code reports listing all the data linked to a specific code were generated after all the field notes and transcripts were coded. Once verified, codes were grouped based on similarities and relationships into prominent themes related to physician-patient interactions by 2 team members (S.S. and M.H.), though all members reviewed them and concurred.
RESULTS
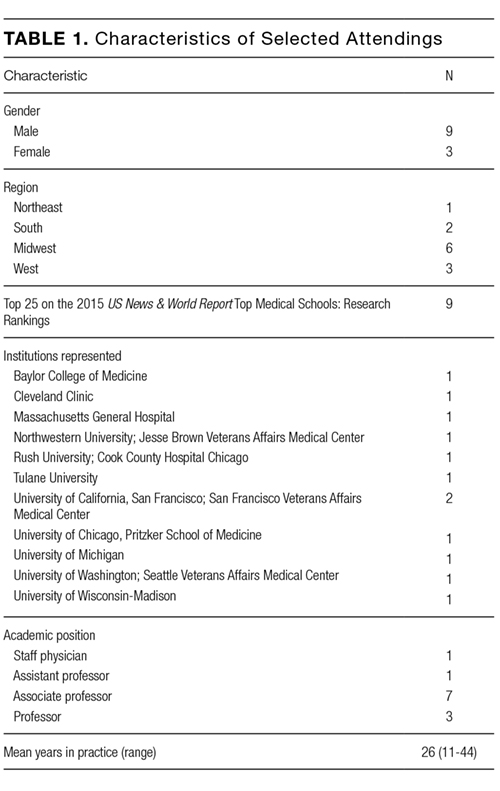
C are for the Patient’s Well-Being
The attendings we observed appeared to openly care for their patients’ well-being and were focused on the patients’ wants and needs. We noted that attendings were generally very attentive to the patients’ comfort. For example, we observed one attending sending the senior resident to find the patient’s nurse in order to obtain additional pain medications. The attending said to the patient several times, “I’m sorry you’re in so much pain.” When the team was leaving, she asked the intern to stay with the patient until the medications had been administered.
The attendings we observed could also be considered patient advocates, ensuring that patients received superb care. As one learner said about an attending who was attempting to have his patient listed for a liver transplant, “He is the biggest advocate for the patient that I have ever seen.” Regarding the balance between learning biomedical concepts and advocacy, another learner noted the following: “… there is always a teaching aspect, but he always makes sure that everything is taken care of for the patient…”
Building rapport creates and sustains bonds between people. Even though most of the attendings we observed primarily cared for hospitalized patients and had little long-term continuity with them, the attendings tended to take special care to talk with their patients about topics other than medicine to form a bond. This bonding between attending and patient was appreciated by learners. “Probably the most important thing I learned about patient care would be taking the time and really developing that relationship with patients,” said one of the former learners we interviewed. “There’s a question that he asks to a lot of our patients,” one learner told us, “especially our elderly patients, that [is], ‘What’s the most memorable moment in your life?’ So, he asks that question, and patient[s] open up and will share.”
The attendings often used touch to further solidify their relationships with their patients. We observed one attending who would touch her patients’ arms or knees when she was talking with them. Another attending would always shake the patient’s hand when leaving. Another attending would often lay his hand on the patient’s shoulder and help the patient sit up during the physical examination. Such humanistic behavior was noticed by learners. “She does a lot of comforting touch, particularly at the end of an exam,” said a current learner.
C onsideration of the “Big Picture”
Our exemplary attendings kept the “big picture” (that is, the patient’s overall medical and social needs) in clear focus. They behaved in a way to ensure that the patients understood the key points of their care and explained so the patients and families could understand. A current learner said, “[The attending] really makes sure that the patient understands what’s going on. And she always asks them, ‘What do you understand, what do you know, how can we fill in any blanks?’ And that makes the patient really involved in their own care, which I think is important.” This reflection was supported by direct observations. Attendings posed the following questions at the conclusion of patient interactions: “Tell me what you know.” “Tell me what our plan is.” “What did the lung doctors tell you yesterday?” These questions, which have been termed “teach-back” and are crucial for health literacy, were not meant to quiz the patient but rather to ensure the patient and family understood the plan.
We noticed that the attendings effectively explained clinical details and the plan of care to the patient while avoiding medical jargon. The following is an example of one interaction with a patient: “You threw up and created a tear in the food tube. Air got from that into the middle of the chest, not into the lungs. Air isn’t normally there. If it is just air, the body will reabsorb [it]... But we worry about bacteria getting in with the air. We need to figure out if it is an infection. We’re still trying to figure it out. Hang in there with us.” One learner commented, “… since we do bedside presentations, he has a great way of translating our gibberish, basically, to real language the patient understands.”
Finally, the attendings anticipated what patients would need in the outpatient setting. We observed that attendings stressed what the next steps would be during transitions of care. As one learner put it, “But he also thinks ahead; what do they need as an outpatient?” Another current learner commented on how another attending always asked about the social situations of his patients stating, “And then there is the social part of it. So, he is very much interested [in] where do they live? What is their support system? So, I think it has been a very holistic approach to patient care.”
R espect for the Patient
The attendings we observed were steadfastly respectful toward patients. As one attending told us, “The patient’s room is sacred space, and it’s a privilege for us to be there. And if we don’t earn that privilege, then we don’t get to go there.” We observed that the attendings generally referred to the patient as Mr. or Ms. (last name) rather than the patient’s first name unless the patient insisted. We also noticed that many of the attendings would introduce the team members to the patients or ask each member to introduce himself or herself. They also tended to leave the room and patient the way they were found, for example, by pushing the patient’s bedside table so that it was back within his or her reach or placing socks back onto the patient’s feet.
We noted that many of our attendings used appropriate humor with patients and families. As one learner explained, “I think Dr. [attending] makes most of our patients laugh during rounds. I don’t know if you noticed, but he really puts a smile on their face[s] whenever he walks in. … Maybe it would catch them off guard the first day, but after that, they are so happy to see him.”
Finally, we noticed that several of our attendings made sure to meet the patient at eye level during discussions by either kneeling or sitting on a chair. One of the attendings put it this way: “That’s a horrible power dynamic when you’re an inpatient and you’re sick and someone’s standing over you telling you things, and I like to be able to make eye contact with people, and often times that requires me to kneel down or to sit on a stool or to sit on the bed. … I feel like you’re able to connect with the people in a much better way…” Learners viewed this behavior favorably. As one told us, “[The attending] gets down to their level and makes sure that all of their questions are answered. So that is one thing that other attendings don’t necessarily do.”
DISCUSSION
In our national, qualitative study of 12 exemplary attending physicians, we found that these clinicians generally exhibited the following behaviors with patients. First, they were personable and caring and made significant attempts to connect with their patients. This occasionally took the form of using touch to comfort patients. Second, they tended to seek the “big picture” and tried to understand what patients would need upon hospital discharge. They communicated plans clearly to patients and families and inquired if those plans were understood. Finally, they showed respect toward their patients without fail. Such respect took many forms but included leaving the patient and room exactly as they were found and speaking with patients at eye level.
Our findings are largely consistent with other key studies in this field. Not surprisingly, the attendings we observed adhered to the major suggestions that Branch and colleagues2 put forth more than 15 years ago to improve the teaching of the humanistic dimension of the patient-physician relationship. Examples include greeting the patient, introducing team members and explaining each person’s role, asking open-ended questions, providing patient education, placing oneself at the same level as the patient, using appropriate touch, and being respectful. Weissmann et al.22 also found similar themes in their study of teaching physicians at 4 universities from 2003 to 2004. In that study, role-modeling was the primary method used by physician educators to teach the humanistic aspects of medical care, including nonverbal communication (eg, touch and eye contact), demonstration of respect, and building a personal connection with the patients.22In a focus group-based study performed at a teaching hospital in Boston, Ramani and Orlander23 concluded that both participating teachers and learners considered the patient’s bedside as a valuable venue to learn humanistic skills. Unfortunately, they also noted that there has been a decline in bedside teaching related to various factors, including documentation requirements and electronic medical records.23 Our attendings all demonstrated the value of teaching at a patient’s bedside. Not only could physical examination skills be demonstrated but role-modeling of interpersonal skills could be observed by learners.
Block and colleagues24 observed 29 interns in 732 patient encounters in 2 Baltimore training programs using Kahn’s “etiquette-based medicine” behaviors as a guide.12 They found that interns introduced themselves 40% of the time, explained their role 37% of the time, touched patients on 65% of visits (including as part of the physical examination), asked open-ended questions 75% of the time, and sat down with patients during only 9% of visits.24 Tackett et al.7 observed 24 hospitalists who collectively cared for 226 unique patients in 3 Baltimore-area hospitals. They found that each of the following behaviors was performed less than 30% of the time: explains role in care, shakes hand, and sits down.7 However, our attendings appeared to adhere to these behaviors to a much higher extent, though we did not quantify the interactions. This lends support to the notion that effective patient-physician interactions are the foundation of great teaching.
The attendings we observed (most of whom are inpatient based) tended to the contextual issues of the patients, such as their home environments and social support. Our exemplary physicians did what they could to ensure that patients received the appropriate follow-up care upon discharge.
Our study has important limitations. First, it was conducted in a limited number of US hospitals. The institutions represented were generally large, research-intensive, academic medical centers. Therefore, our findings may not apply to settings that are different from the hospitals studied. Second, our study included only 12 attendings and their learners, which may also limit the study’s generalizability. Third, we focused exclusively on teaching within general medicine rounds. Thus, our findings may not be generalizable to other subspecialties. Fourth, attendings were selected through a nonexhaustive method, increasing the potential for selection bias. However, the multisite design, the modified snowball sampling, and the inclusion of several types of institutions in the final participant pool introduced diversity to the final list. Former-learner responses were subject to recall bias. Finally, the study design is susceptible to observer bias. Attempts to reduce this included the diversity of the observers (ie, both a clinician and a nonclinician, the latter of whom was unfamiliar with medical education) and review of the data and coding by multiple research team members to ensure validity. Although we cannot discount the potential role of a Hawthorne effect on our data collection, the research team attempted to mitigate this by standing apart from the care teams and remaining unobtrusive during observations.
Limitations notwithstanding, we believe that our multisite study is important given the longstanding imperative to improve patient-physician interactions. We found empirical support for behaviors proposed by Branch and colleagues2 and Kahn12 in order to enhance these relationships. While others have studied attendings and their current learners,22 we add to the literature by also examining former learners’ perspectives on how the attendings’ teaching and role-modeling have created and sustained a lasting impact. The key findings of our national, qualitative study (care for the patient’s well-being, consideration of the “big picture,” and respect for the patient) can be readily adopted and honed by physicians to improve their interactions with hospitalized patients.
A cknowledgments
The findings and conclusions in this report are those of the authors and do not necessarily represent the official position of the US Department of Veterans Affairs.
F unding
Dr. Saint provided funding for this study using a University of Michigan endowment.
Disclosure
The authors declare no conflicts of interest.
1. Peabody FW. The care of the patient. JAMA. 1927;88(12):877-882. PubMed
2. Branch WT, Jr., Kern D, Haidet P, et al. The patient-physician relationship. Teaching the human dimensions of care in clinical settings. JAMA. 2001;286(9):1067-1074. PubMed
3. Frankel RM. Relationship-centered care and the patient-physician relationship. J Gen Intern Med. 2004;19(11):1163-1165. PubMed
4. Stewart MA. Effective physician-patient communication and health outcomes: a review. CMAJ. 1995;152(9):1423-1433. PubMed
5. Osmun WE, Brown JB, Stewart M, Graham S. Patients’ attitudes to comforting touch in family practice. Can Fam Physician. 2000;46:2411-2416. PubMed
6. Strasser F, Palmer JL, Willey J, et al. Impact of physician sitting versus standing during inpatient oncology consultations: patients’ preference and perception of compassion and duration. A randomized controlled trial. J Pain Symptom Manage. 2005;29(5):489-497. PubMed
7. Tackett S, Tad-y D, Rios R, Kisuule F, Wright S. Appraising the practice of etiquette-based medicine in the inpatient setting. J Gen Intern Med. 2013;28(7):908-913. PubMed
8. Gallagher TH, Levinson W. A prescription for protecting the doctor-patient relationship. Am J Manag Care. 2004;10(2, pt 1):61-68. PubMed
9. Braddock CH, 3rd, Snyder L. The doctor will see you shortly. The ethical significance of time for the patient-physician relationship. J Gen Intern Med. 2005;20(11):1057-1062. PubMed
10. Ong LM, de Haes JC, Hoos AM, Lammes FB. Doctor-patient communication: a review of the literature. Soc Sci Med. 1995;40(7):903-918. PubMed
11. Lee SJ, Back AL, Block SD, Stewart SK. Enhancing physician-patient communication. Hematology Am Soc Hematol Educ Program. 2002:464-483. PubMed
12. Kahn MW. Etiquette-based medicine. N Engl J Med. 2008;358(19):1988-1989. PubMed
13. Hoff T, Collinson GE. How Do We Talk About the Physician-Patient Relationship? What the Nonempirical Literature Tells Us. Med Care Res Rev. 2016. PubMed
14. Houchens N, Harrod M, Moody S, Fowler KE, Saint S. Techniques and behaviors associated with exemplary inpatient general medicine teaching: an exploratory qualitative study. J Hosp Med. 2017;12(7):503-509. PubMed
15. Houchens N, Harrod M, Fowler KE, Moody S., Saint S. Teaching “how” to think instead of “what” to think: how great inpatient physicians foster clinical reasoning. Am J Med. In Press.
16. Harrod M, Saint S, Stock RW. Teaching Inpatient Medicine: What Every Physician Needs to Know. New York, NY: Oxford University Press; 2017.
17. Richards L, Morse J. README FIRST for a User’s Guide to Qualitative Methods. 3rd ed. Los Angeles, CA: SAGE Publications Inc; 2013.
18. US News and World Report. Best Medical Schools: Research. 2014; http://grad-schools.usnews.rankingsandreviews.com/best-graduate-schools/top-medical-schools/research-rankings. Accessed on September 16, 2016.
19. Guest G, Bunce A, Johnson L. How many interviews are enough? An experiment with data saturation and variability. Field Methods. 2006;18(1):59-82.
20. Braun V, Clarke V. Using thematic analysis in psychology. Qual Res Psychol. 2006;3(2):77-101. PubMed
21. Aronson J. A pragmatic view of thematic analysis. Qual Rep. 1995;2(1):1-3.
22. Weissmann PF, Branch WT, Gracey CF, Haidet P, Frankel RM. Role modeling humanistic behavior: learning bedside manner from the experts. Acad Med. 2006;81(7):661-667. PubMed
23. Ramani S, Orlander JD. Human dimensions in bedside teaching: focus group discussions of teachers and learners. Teach Learn Med. 2013;25(4):312-318. PubMed
24. Block L, Hutzler L, Habicht R, et al. Do internal medicine interns practice etiquette-based communication? A critical look at the inpatient encounter. J Hosp Med. 2013;8(11):631-634. PubMed
Approximately a century ago, Francis Peabody taught that “the secret of the care of the patient is in caring for the patient.”1 His advice remains true today. Despite the advent of novel diagnostic tests, technologically sophisticated interventional procedures, and life-saving medications, perhaps the most important skill a bedside clinician can use is the ability to connect with patients.
The literature on patient-physician interaction is vast2-11 and generally indicates that exemplary bedside clinicians are able to interact well with patients by being competent, trustworthy, personable, empathetic, and effective communicators. “Etiquette-based medicine,” first proposed by Kahn,12 emphasizes the importance of certain behaviors from physicians, such as introducing yourself and
Yet, improving patient-physician interactions remains necessary. A recent systematic review reported that almost half of the reviewed studies on the patient-physician relationship published between 2000 and 2014 conveyed the idea that the patient-physician relationship is deteriorating.13
As part of a broader study to understand the behaviors and approaches of exemplary inpatient attending physicians,14-16 we examined how 12 carefully selected physicians interacted with their patients during inpatient teaching rounds.
METHODS
Overview
We conducted a multisite study using an exploratory, qualitative approach to inquiry, which has been described previously.14-16 Our primary purpose was to study the attributes and behaviors of outstanding general medicine attendings in the setting of inpatient rounds. The focus of this article is on the attendings’ interactions with patients.
We used a modified snowball sampling approach17 to identify 12 exemplary physicians. First, we contacted individuals throughout the United States who were known to the principal investigator (S.S.) and asked for suggestions of excellent clinician educators (also referred to as attendings) for potential inclusion in the study. In addition to these personal contacts, other individuals unknown to the investigative team were contacted and asked to provide suggestions for attendings to include in the study. Specifically, the US News & World Report 2015 Top Medical Schools: Research Rankings,18 which are widely used to represent the best U.S. hospitals, were reviewed in an effort to identify attendings from a broad range of medical schools. Using this list, we identified other medical schools that were in the top 25 and were not already represented. We contacted the division chiefs of general internal (or hospital) medicine, chairs and chiefs of departments of internal medicine, and internal medicine residency program directors from these medical schools and asked for recommendations of attendings from both within and outside their institutions whom they considered to be great inpatient teachers.
This sampling method resulted in 59 potential participants. An internet search was conducted on each potential participant to obtain further information about the individuals and their institutions. Both personal characteristics (medical education, training, and educational awards) and organizational characteristics (geographic location, hospital size and affiliation, and patient population) were considered so that a variety of organizations and backgrounds were represented. Through this process, the list was narrowed to 16 attendings who were contacted to participate in the study, of which 12 agreed. The number of attendings examined was appropriate because saturation of metathemes can occur in as little as 6 interviews, and data saturation occurs at 12 interviews.19 The participants were asked to provide a list of their current learners (ie, residents and medical students) and 6 to 10 former learners to contact for interviews and focus groups.
Data Collection
Observations
Two researchers conducted the one-day site visits. One was a physician (S.S.) and the other a medical anthropologist (M.H.), and both have extensive experience in qualitative methods. The only exception was the site visit at the principal investigator’s own institution, which was conducted by the medical anthropologist and a nonpracticing physician who was unknown to the participants. The team structure varied slightly among different institutions but in general was composed of 1 attending, 1 senior medical resident, 1 to 2 interns, and approximately 2 medical students. Each site visit began with observing the attendings (n = 12) and current learners (n = 57) on morning rounds, which included their interactions with patients. These observations lasted approximately 2 to 3 hours. The observers took handwritten field notes, paying particular attention to group interactions, teaching approaches, and patient interactions. The observers stood outside the medical team circle and remained silent during rounds so as to be unobtrusive to the teams’ discussions. The observers discussed and compared their notes after each site visit.
Interviews and Focus Groups
The research team also conducted individual, semistructured interviews with the attendings (n = 12), focus groups with their current teams (n = 46), and interviews or focus groups with their former learners (n = 26). Current learners were asked open-ended questions about their roles on the teams, their opinions of the attendings, and the care the attendings provide to their patients. Because they were observed during rounds, the researchers asked for clarification about specific interactions observed during the teaching rounds. Depending on availability and location, former learners either participated in in-person focus groups or interviews on the day of the site visit, or in a later telephone interview. All interviews and focus groups were audio recorded and transcribed.
This study was deemed to be exempt from regulation by the University of Michigan Institutional Review Board. All participants were informed that their participation was completely voluntary and that they could refuse to answer any question.
Data Analysis
Data were analyzed using a thematic analysis approach,20 which involves reading through the data to identify patterns (and create codes) that relate to behaviors, experiences, meanings, and activities. The patterns are then grouped into themes to help further explain the findings.21 The research team members (S.S. and M.H.) met after the first site visit and developed initial ideas about meanings and possible patterns. One team member (M.H.) read all the transcripts from the site visit and, based on the data, developed a codebook to be used for this study. This process was repeated after every site visit, and the coding definitions were refined as necessary. All transcripts were reviewed to apply any new codes when they developed. NVivo® 10 software (QSR International, Melbourne, Australia) was used to assist with the qualitative data analysis.
To ensure consistency and identify relationships between codes, code reports listing all the data linked to a specific code were generated after all the field notes and transcripts were coded. Once verified, codes were grouped based on similarities and relationships into prominent themes related to physician-patient interactions by 2 team members (S.S. and M.H.), though all members reviewed them and concurred.
RESULTS
C are for the Patient’s Well-Being
The attendings we observed appeared to openly care for their patients’ well-being and were focused on the patients’ wants and needs. We noted that attendings were generally very attentive to the patients’ comfort. For example, we observed one attending sending the senior resident to find the patient’s nurse in order to obtain additional pain medications. The attending said to the patient several times, “I’m sorry you’re in so much pain.” When the team was leaving, she asked the intern to stay with the patient until the medications had been administered.
The attendings we observed could also be considered patient advocates, ensuring that patients received superb care. As one learner said about an attending who was attempting to have his patient listed for a liver transplant, “He is the biggest advocate for the patient that I have ever seen.” Regarding the balance between learning biomedical concepts and advocacy, another learner noted the following: “… there is always a teaching aspect, but he always makes sure that everything is taken care of for the patient…”
Building rapport creates and sustains bonds between people. Even though most of the attendings we observed primarily cared for hospitalized patients and had little long-term continuity with them, the attendings tended to take special care to talk with their patients about topics other than medicine to form a bond. This bonding between attending and patient was appreciated by learners. “Probably the most important thing I learned about patient care would be taking the time and really developing that relationship with patients,” said one of the former learners we interviewed. “There’s a question that he asks to a lot of our patients,” one learner told us, “especially our elderly patients, that [is], ‘What’s the most memorable moment in your life?’ So, he asks that question, and patient[s] open up and will share.”
The attendings often used touch to further solidify their relationships with their patients. We observed one attending who would touch her patients’ arms or knees when she was talking with them. Another attending would always shake the patient’s hand when leaving. Another attending would often lay his hand on the patient’s shoulder and help the patient sit up during the physical examination. Such humanistic behavior was noticed by learners. “She does a lot of comforting touch, particularly at the end of an exam,” said a current learner.
C onsideration of the “Big Picture”
Our exemplary attendings kept the “big picture” (that is, the patient’s overall medical and social needs) in clear focus. They behaved in a way to ensure that the patients understood the key points of their care and explained so the patients and families could understand. A current learner said, “[The attending] really makes sure that the patient understands what’s going on. And she always asks them, ‘What do you understand, what do you know, how can we fill in any blanks?’ And that makes the patient really involved in their own care, which I think is important.” This reflection was supported by direct observations. Attendings posed the following questions at the conclusion of patient interactions: “Tell me what you know.” “Tell me what our plan is.” “What did the lung doctors tell you yesterday?” These questions, which have been termed “teach-back” and are crucial for health literacy, were not meant to quiz the patient but rather to ensure the patient and family understood the plan.
We noticed that the attendings effectively explained clinical details and the plan of care to the patient while avoiding medical jargon. The following is an example of one interaction with a patient: “You threw up and created a tear in the food tube. Air got from that into the middle of the chest, not into the lungs. Air isn’t normally there. If it is just air, the body will reabsorb [it]... But we worry about bacteria getting in with the air. We need to figure out if it is an infection. We’re still trying to figure it out. Hang in there with us.” One learner commented, “… since we do bedside presentations, he has a great way of translating our gibberish, basically, to real language the patient understands.”
Finally, the attendings anticipated what patients would need in the outpatient setting. We observed that attendings stressed what the next steps would be during transitions of care. As one learner put it, “But he also thinks ahead; what do they need as an outpatient?” Another current learner commented on how another attending always asked about the social situations of his patients stating, “And then there is the social part of it. So, he is very much interested [in] where do they live? What is their support system? So, I think it has been a very holistic approach to patient care.”
R espect for the Patient
The attendings we observed were steadfastly respectful toward patients. As one attending told us, “The patient’s room is sacred space, and it’s a privilege for us to be there. And if we don’t earn that privilege, then we don’t get to go there.” We observed that the attendings generally referred to the patient as Mr. or Ms. (last name) rather than the patient’s first name unless the patient insisted. We also noticed that many of the attendings would introduce the team members to the patients or ask each member to introduce himself or herself. They also tended to leave the room and patient the way they were found, for example, by pushing the patient’s bedside table so that it was back within his or her reach or placing socks back onto the patient’s feet.
We noted that many of our attendings used appropriate humor with patients and families. As one learner explained, “I think Dr. [attending] makes most of our patients laugh during rounds. I don’t know if you noticed, but he really puts a smile on their face[s] whenever he walks in. … Maybe it would catch them off guard the first day, but after that, they are so happy to see him.”
Finally, we noticed that several of our attendings made sure to meet the patient at eye level during discussions by either kneeling or sitting on a chair. One of the attendings put it this way: “That’s a horrible power dynamic when you’re an inpatient and you’re sick and someone’s standing over you telling you things, and I like to be able to make eye contact with people, and often times that requires me to kneel down or to sit on a stool or to sit on the bed. … I feel like you’re able to connect with the people in a much better way…” Learners viewed this behavior favorably. As one told us, “[The attending] gets down to their level and makes sure that all of their questions are answered. So that is one thing that other attendings don’t necessarily do.”
DISCUSSION
In our national, qualitative study of 12 exemplary attending physicians, we found that these clinicians generally exhibited the following behaviors with patients. First, they were personable and caring and made significant attempts to connect with their patients. This occasionally took the form of using touch to comfort patients. Second, they tended to seek the “big picture” and tried to understand what patients would need upon hospital discharge. They communicated plans clearly to patients and families and inquired if those plans were understood. Finally, they showed respect toward their patients without fail. Such respect took many forms but included leaving the patient and room exactly as they were found and speaking with patients at eye level.
Our findings are largely consistent with other key studies in this field. Not surprisingly, the attendings we observed adhered to the major suggestions that Branch and colleagues2 put forth more than 15 years ago to improve the teaching of the humanistic dimension of the patient-physician relationship. Examples include greeting the patient, introducing team members and explaining each person’s role, asking open-ended questions, providing patient education, placing oneself at the same level as the patient, using appropriate touch, and being respectful. Weissmann et al.22 also found similar themes in their study of teaching physicians at 4 universities from 2003 to 2004. In that study, role-modeling was the primary method used by physician educators to teach the humanistic aspects of medical care, including nonverbal communication (eg, touch and eye contact), demonstration of respect, and building a personal connection with the patients.22In a focus group-based study performed at a teaching hospital in Boston, Ramani and Orlander23 concluded that both participating teachers and learners considered the patient’s bedside as a valuable venue to learn humanistic skills. Unfortunately, they also noted that there has been a decline in bedside teaching related to various factors, including documentation requirements and electronic medical records.23 Our attendings all demonstrated the value of teaching at a patient’s bedside. Not only could physical examination skills be demonstrated but role-modeling of interpersonal skills could be observed by learners.
Block and colleagues24 observed 29 interns in 732 patient encounters in 2 Baltimore training programs using Kahn’s “etiquette-based medicine” behaviors as a guide.12 They found that interns introduced themselves 40% of the time, explained their role 37% of the time, touched patients on 65% of visits (including as part of the physical examination), asked open-ended questions 75% of the time, and sat down with patients during only 9% of visits.24 Tackett et al.7 observed 24 hospitalists who collectively cared for 226 unique patients in 3 Baltimore-area hospitals. They found that each of the following behaviors was performed less than 30% of the time: explains role in care, shakes hand, and sits down.7 However, our attendings appeared to adhere to these behaviors to a much higher extent, though we did not quantify the interactions. This lends support to the notion that effective patient-physician interactions are the foundation of great teaching.
The attendings we observed (most of whom are inpatient based) tended to the contextual issues of the patients, such as their home environments and social support. Our exemplary physicians did what they could to ensure that patients received the appropriate follow-up care upon discharge.
Our study has important limitations. First, it was conducted in a limited number of US hospitals. The institutions represented were generally large, research-intensive, academic medical centers. Therefore, our findings may not apply to settings that are different from the hospitals studied. Second, our study included only 12 attendings and their learners, which may also limit the study’s generalizability. Third, we focused exclusively on teaching within general medicine rounds. Thus, our findings may not be generalizable to other subspecialties. Fourth, attendings were selected through a nonexhaustive method, increasing the potential for selection bias. However, the multisite design, the modified snowball sampling, and the inclusion of several types of institutions in the final participant pool introduced diversity to the final list. Former-learner responses were subject to recall bias. Finally, the study design is susceptible to observer bias. Attempts to reduce this included the diversity of the observers (ie, both a clinician and a nonclinician, the latter of whom was unfamiliar with medical education) and review of the data and coding by multiple research team members to ensure validity. Although we cannot discount the potential role of a Hawthorne effect on our data collection, the research team attempted to mitigate this by standing apart from the care teams and remaining unobtrusive during observations.
Limitations notwithstanding, we believe that our multisite study is important given the longstanding imperative to improve patient-physician interactions. We found empirical support for behaviors proposed by Branch and colleagues2 and Kahn12 in order to enhance these relationships. While others have studied attendings and their current learners,22 we add to the literature by also examining former learners’ perspectives on how the attendings’ teaching and role-modeling have created and sustained a lasting impact. The key findings of our national, qualitative study (care for the patient’s well-being, consideration of the “big picture,” and respect for the patient) can be readily adopted and honed by physicians to improve their interactions with hospitalized patients.
A cknowledgments
The findings and conclusions in this report are those of the authors and do not necessarily represent the official position of the US Department of Veterans Affairs.
F unding
Dr. Saint provided funding for this study using a University of Michigan endowment.
Disclosure
The authors declare no conflicts of interest.
1. Peabody FW. The care of the patient. JAMA. 1927;88(12):877-882. PubMed
2. Branch WT, Jr., Kern D, Haidet P, et al. The patient-physician relationship. Teaching the human dimensions of care in clinical settings. JAMA. 2001;286(9):1067-1074. PubMed
3. Frankel RM. Relationship-centered care and the patient-physician relationship. J Gen Intern Med. 2004;19(11):1163-1165. PubMed
4. Stewart MA. Effective physician-patient communication and health outcomes: a review. CMAJ. 1995;152(9):1423-1433. PubMed
5. Osmun WE, Brown JB, Stewart M, Graham S. Patients’ attitudes to comforting touch in family practice. Can Fam Physician. 2000;46:2411-2416. PubMed
6. Strasser F, Palmer JL, Willey J, et al. Impact of physician sitting versus standing during inpatient oncology consultations: patients’ preference and perception of compassion and duration. A randomized controlled trial. J Pain Symptom Manage. 2005;29(5):489-497. PubMed
7. Tackett S, Tad-y D, Rios R, Kisuule F, Wright S. Appraising the practice of etiquette-based medicine in the inpatient setting. J Gen Intern Med. 2013;28(7):908-913. PubMed
8. Gallagher TH, Levinson W. A prescription for protecting the doctor-patient relationship. Am J Manag Care. 2004;10(2, pt 1):61-68. PubMed
9. Braddock CH, 3rd, Snyder L. The doctor will see you shortly. The ethical significance of time for the patient-physician relationship. J Gen Intern Med. 2005;20(11):1057-1062. PubMed
10. Ong LM, de Haes JC, Hoos AM, Lammes FB. Doctor-patient communication: a review of the literature. Soc Sci Med. 1995;40(7):903-918. PubMed
11. Lee SJ, Back AL, Block SD, Stewart SK. Enhancing physician-patient communication. Hematology Am Soc Hematol Educ Program. 2002:464-483. PubMed
12. Kahn MW. Etiquette-based medicine. N Engl J Med. 2008;358(19):1988-1989. PubMed
13. Hoff T, Collinson GE. How Do We Talk About the Physician-Patient Relationship? What the Nonempirical Literature Tells Us. Med Care Res Rev. 2016. PubMed
14. Houchens N, Harrod M, Moody S, Fowler KE, Saint S. Techniques and behaviors associated with exemplary inpatient general medicine teaching: an exploratory qualitative study. J Hosp Med. 2017;12(7):503-509. PubMed
15. Houchens N, Harrod M, Fowler KE, Moody S., Saint S. Teaching “how” to think instead of “what” to think: how great inpatient physicians foster clinical reasoning. Am J Med. In Press.
16. Harrod M, Saint S, Stock RW. Teaching Inpatient Medicine: What Every Physician Needs to Know. New York, NY: Oxford University Press; 2017.
17. Richards L, Morse J. README FIRST for a User’s Guide to Qualitative Methods. 3rd ed. Los Angeles, CA: SAGE Publications Inc; 2013.
18. US News and World Report. Best Medical Schools: Research. 2014; http://grad-schools.usnews.rankingsandreviews.com/best-graduate-schools/top-medical-schools/research-rankings. Accessed on September 16, 2016.
19. Guest G, Bunce A, Johnson L. How many interviews are enough? An experiment with data saturation and variability. Field Methods. 2006;18(1):59-82.
20. Braun V, Clarke V. Using thematic analysis in psychology. Qual Res Psychol. 2006;3(2):77-101. PubMed
21. Aronson J. A pragmatic view of thematic analysis. Qual Rep. 1995;2(1):1-3.
22. Weissmann PF, Branch WT, Gracey CF, Haidet P, Frankel RM. Role modeling humanistic behavior: learning bedside manner from the experts. Acad Med. 2006;81(7):661-667. PubMed
23. Ramani S, Orlander JD. Human dimensions in bedside teaching: focus group discussions of teachers and learners. Teach Learn Med. 2013;25(4):312-318. PubMed
24. Block L, Hutzler L, Habicht R, et al. Do internal medicine interns practice etiquette-based communication? A critical look at the inpatient encounter. J Hosp Med. 2013;8(11):631-634. PubMed
© 2017 Society of Hospital Medicine
Techniques and behaviors associated with exemplary inpatient general medicine teaching: an exploratory qualitative study
Clinician educators face numerous obstacles to their joint mission of facilitating learning while also ensuring high-quality and patient-centered care. Time constraints, including the institution of house officer duty hour limitations,1 shorter lengths of stay for hospitalized patients,2 and competing career responsibilities, combine to create a dynamic learning environment. Additionally, clinician educators must balance the autonomy of their learners with the safety of their patients. They must teach to multiple learning levels and work collaboratively with multiple disciplines to foster an effective team-based approach to patient care. Yet, many clinician educators have no formal training in pedagogical methods.3 Such challenges necessitate increased attention to the work of excellent clinician educators and their respective teaching approaches.
Many studies of clinical teaching rely primarily on survey data of attributes of good clinical teachers.3-7 While some studies have incorporated direct observations of teaching8,9 or interviews with clinician educators or learners,10,11 few have incorporated multiple perspectives from the current team and from former learners in order to provide a comprehensive picture of team-based learning.12
The goal of this study was to gain a thorough understanding, through multiple perspectives, of the techniques and behaviors used by exemplary educators within actual clinical environments. We studied attitudes, behaviors, and approaches of 12 such inpatient clinician educators.
METHODS
Study Design and Sampling
This was a multisite study using an exploratory qualitative approach to inquiry. This approach was used to study the techniques and behaviors of excellent attendings during inpatient general medicine rounds. A modified snowball sampling approach13 was used, meaning individuals known to one member of the research team (SS) were initially contacted and asked to identify clinician educators (also referred to as attendings) for potential inclusion in the study. In an effort to identify attendings from a broad range of medical schools, the “2015 U.S. News and World Report Top Medical Schools: Research” rankings14 were also reviewed, with priority given to the top 25, as these are widely used to represent the best US hospitals. In an attempt to invite attendings from diverse institutions, additional medical schools not in the top 25 as well as historically black medical schools were also included. Division chiefs and chairs of internal medicine and/or directors of internal medicine residency programs at these schools were contacted and asked for recommendations of attendings, both within and outside their institutions, who they considered to be great inpatient teachers. In addition, key experts who have won teaching awards or were known to be specialists in the field of medical education were asked to nominate one or two other outstanding attendings.

By using this sampling method, 59 potential participants were identified. An internet search was conducted to obtain information about the potential participants and their institutions. Organizational characteristics such as geographic location, hospital size and affiliation, and patient population, as well as individual characteristics such as gender, medical education and training, and educational awards received were considered so that a diversity of organizations and backgrounds was represented. The list was narrowed down to 16 attendings who were contacted via e-mail and asked to participate. Interested participants were asked for a list of their current team members and 6 to 10 former learners to contact for interviews and focus groups. Former learners were included in an effort to better understand lasting effects on learners from their exemplary teaching attendings. A total of 12 attending physicians agreed to participate (Table 1). Literature on field methods has shown that 12 interviews are found to be adequate in accomplishing data saturation.15 Although 2 attendings were located at the same institution, we decided to include them given that both are recognized as master clinician educators and were each recommended by several individuals from various institutions. Hospitals were located throughout the US and included both university-affiliated hospitals and Veterans Affairs medical centers. Despite efforts to include physicians from historically black colleges and universities, only one attending was identified, and they declined the request to participate.
Data Collection
Observations. The one-day site visits were mainly conducted by two research team members, a physician (SS) and a medical anthropologist (MH), both of whom have extensive experience in qualitative methods. Teams were not uniform but were generally comprised of 1 attending, 1 senior medical resident, 1 to 2 interns, and approximately 2 medical students. Occasionally, a pharmacist, clinical assistant, or other health professional accompanied the team on rounds. Not infrequently, the bedside nurse would explicitly be included in the discussion regarding his or her specific patient. Each site visit began with observing attendings (N = 12) and current learners (N = 57) during rounds. Each research team member recorded their own observations via handwritten field notes, paying particular attention to group interactions, teaching approach, conversations occurring within and peripheral to the team, patient-team interactions, and the physical environment. By standing outside of the medical team circle and remaining silent during rounds, research team members remained unobtrusive to the discussion and process of rounds. Materials the attendings used during their teaching rounds were also documented and collected. Rounds generally lasted 2 to 3 hours. After each site visit, the research team met to compare and combine field notes.
Interviews and Focus Groups. The research team then conducted individual, semi-structured interviews with the attendings, focus groups with their current team (N = 46), and interviews or focus groups with their former learners (N = 26; Supplement 1). Eleven of the current team members observed during rounds were unable to participate in the focus groups due to clinical duties. Because the current learners who participated in the focus groups were also observed during rounds, the research team was able to ask them open-ended questions regarding teaching rounds and their roles as learners within this environment. Former learners who were still at the hospital participated in separate focus groups or interviews. Former learners who were no longer present at the hospital were contacted by telephone and individually interviewed by one research team member (MH). All interviews and focus groups were audio-recorded and transcribed.
This study was determined to be exempt by the University of Michigan Institutional Review Board. All participants were informed that their participation was completely voluntary and that they could terminate their involvement at any time.
Data Analysis
Data were analyzed using a thematic analysis approach.16 Thematic analysis entails reading through the data to identify patterns (and create codes) that relate to behaviors, experiences, meanings, and activities. Once patterns have been identified, they are grouped according to similarity into themes, which help to further explain the findings.17
After the first site visit was completed, the research team members that participated (SS and MH) met to develop initial ideas about meanings and possible patterns. All transcripts were read by one team member (MH) and, based on review of the data, codes were developed, defined, and documented in a codebook. This process was repeated after every site visit using the codebook to expand or combine codes and refine definitions as necessary. If a new code was added, the previously coded data were reviewed to apply the new code. NVivo® 10 software (QSR International; Melbourne, Australia) was used to manage the data.
Once all field notes and transcripts were coded (MH), the code reports, which list all data described within a specific code, were run to ensure consistency and identify relationships between codes. Once coding was verified, codes were grouped based on similarities and relationships into salient themes by 3 members of the research team (NH, MH, and SM). Themes, along with their supporting codes, were then further defined to understand how these attendings worked to facilitate excellent teaching in clinical settings.

RESULTS
The coded interview data and field notes were categorized into broad, overlapping themes. Three of these major themes include (1) fostering positive relationships, (2) patient-centered teaching, and (3) collaboration and coaching. Table 2 lists each theme, salient behaviors, examples, and selected quotes that further elucidate its meaning.
Fostering Positive Relationships
Attending physicians took observable steps to develop positive relationships with their team members, which in turn created a safe learning environment. For instance, attendings used learners’ first names, demonstrated interest in their well-being, deployed humor, and generally displayed informal actions—uncrossed arms, “fist bump” when recognizing learners’ success, standing outside the circle of team members and leaning in to listen—during learner interactions. Attendings also made it a priority to get to know individuals on a personal level. As one current learner put it, “He asks about where we are from. He will try to find some kind of connection that he can establish with not only each of the team members but also with each of the patients.”
Additionally, attendings built positive relationships with their learners by responding thoughtfully to their input, even when learners’ evaluations of patients required modification. In turn, learners reported feeling safe to ask questions, admit uncertainty, and respectfully disagree with their attendings. As one attending reflected, “If I can get them into a place where they feel like the learning environment is someplace where they can make a mistake and know that that mistake does not necessarily mean that it’s going to cost them in their evaluation part, then I feel like that’s why it’s important.”
To build rapport and create a safe learning environment, attendings used a number of strategies to position themselves as learners alongside their team members. For instance, attendings indicated that they wanted their ideas questioned because they saw it as an opportunity to learn. Moreover, in conversations with learners, attendings demonstrated humility, admitting when they did not know something. One former learner noted, “There have been times when he has asked [a] question…nobody knows and then he admits that he doesn’t know either. So everybody goes and looks it up…The whole thing turns out to be a fun learning experience.”
Attendings demonstrated respect for their team members’ time by reading about patients before rounds, identifying learning opportunities during rounds, and integrating teaching points into the daily work of patient care. Teaching was not relegated exclusively to the conference room or confined to the traditional “chalk talk” before or after rounds but rather was assimilated into daily workflow. They appeared to be responsive to the needs of individual patients and the team, which allowed attendings to both directly oversee their patients’ care and overcome the challenges of multiple competing demands for time. The importance of this approach was made clear by one current learner who stated “…she does prepare before, especially you know on call days, she does prepare for the new patients before coming in to staff, which is really appreciated… it saves a lot of time on rounds.”
Attendings also included other health professionals in team discussions. Attendings used many of the same relationship-building techniques with these professionals as they did with learners and patients. They consistently asked these professionals to provide insight and direction in patients’ plans of care. A former learner commented, “He always asks the [nurse] what is her impression of the patient...he truly values the [nurse’s] opinion of the patient.” One attending reiterated this approach, stating “I don’t want them to think that anything I have to say is more valuable than our pharmacist or the [nurse].”
Patient-Centered Teaching
Attending physicians modeled numerous teaching techniques that focused learning around the patient. Attendings knew their patients well through review of the medical records, discussion with the patient, and personal examination. This preparation allowed attendings to focus on key teaching points in the context of the patient. One former learner noted, “He tended to bring up a variety of things that really fit well into the clinical scenario. So whether that is talking about what is the differential for a new symptom that just came up for this patient or kind of here is a new paper talking about this condition or maybe some other pearl of physical exam for a patient that has a certain physical condition.”
Attendings served as effective role models by being directly involved in examining and talking with patients as well as demonstrating excellent physical examination and communication techniques. One current learner articulated the importance of learning these skills by observing them done well: “I think he teaches by example and by doing, again, those little things: being attentive to the patients and being very careful during exams…I think those are things that you teach people by doing them, not by saying you need to do this better during the patient encounter.”
Collaboration and Coaching
Attending physicians used varied collaboration and coaching techniques to facilitate learning across the entire care team. During rounds, attendings utilized visual aids to reinforce key concepts and simplify complex topics. They also collaborated by using discussion rather than lecture to engage with team members. For instance, attendings used Socratic questioning, asking questions that lead learners through critical thinking and allow them to solve problems themselves, to guide learners’ decision-making. One former learner reported, “He never gives you the answer, and he always asks your opinion; ‘So what are your thoughts on this?’”
Coaching for success, rather than directing the various team members, was emphasized. Attendings did not wish to be seen as the “leaders” of the team. During rounds, one attending was noted to explain his role in ensuring that the team was building connections with others: “When we have a bad outcome, if it feels like your soul has been ripped out, then you’ve done something right. You’ve made that connection with the patient. My job, as your coach, was to build communication between all of us so we feel vested in each other and our patients.”
Attendings also fostered clinical reasoning skills in their learners by encouraging them to verbalize their thought processes aloud in order to clarify and check for understanding. Attendings also placed emphasis not simply on memorizing content but rather prioritization of the patient’s problems and thinking step by step through individual medical problems. One current learner applauded an attending who could “come up with schematics of how to approach problems rather than feeding us factual information of this paper or this trial.”
Additionally, attendings facilitated learning across the entire care team by differentiating their teaching to meet the needs of multiple learning levels. While the entire team was explicitly included in the learning process, attendings encouraged learners to play various roles, execute tasks, and answer questions depending on their educational level. Attendings positioned learners as leaders of the team by allowing them to talk without interruption and by encouraging them to take ownership of their patients’ care. One former learner stated, “She set expectations…we would be the ones who would be running the team, that you know it would very much be our team and that she is there to advise us and provide supervision but also safety for the patients as well.”

CONCLUSION
This study reveals the complex ways effective attendings build rapport, create a safe learning environment, utilize patient-centered teaching strategies, and engage in collaboration and coaching with all members of the team. These findings provide a framework of shared themes and their salient behaviors that may influence the success of inpatient general medicine clinician educators (Table 3).
There is a broad and voluminous literature on the subject of outstanding clinical teaching characteristics, much of which has shaped various faculty development curricula for decades. This study sought not to identify novel approaches of inpatient teaching necessarily but rather to closely examine the techniques and behaviors of clinician educators identified as exemplary. The findings affirm and reinforce the numerous, well-documented lists of personal attributes, techniques, and behaviors that resonate with learners, including creating a positive environment, demonstrating enthusiasm and interest in the learner, reading facial expressions, being student-centered, maintaining a high level of clinical knowledge, and utilizing effective communication skills.18-24 The strengths of this study lie within the nuanced and rich observations and discussions that move beyond learners’ Likert scale evaluations and responses.3-7,12 Input was sought from multiple perspectives on the care team, which provided detail from key stakeholders. Out of these comprehensive data arose several conclusions that extend the research literature on medical education.
In their seminal review, Sutkin et al.18 demonstrate that two thirds of characteristics of outstanding clinical teachers are “noncognitive” and that, “Perhaps what makes a clinical educator truly great depends less on the acquisition of cognitive skills such as medical knowledge and formulating learning objectives, and more on inherent, relationship-based, noncognitive attributes. Whereas cognitive abilities generally involve skills that may be taught and learned, albeit with difficulty, noncognitive abilities represent personal attributes, such as relationship skills, personality types, and emotional states, which are more difficult to develop and teach.”18 Our study, thus, adds to the literature by (1) highlighting examples of techniques and behaviors that encompass the crucial “noncognitive” arena and (2) informing best practices in teaching clinical medicine, especially those that resonate with learners, for future faculty development.
The findings highlight the role that relationships play in the teaching and learning of team-based medicine. Building rapport and sustaining successful relationships are cornerstones of effective teaching.18 For the attendings in this study, this manifested in observable, tangible behaviors such as greeting others by name, joking, using physical touch, and actively involving all team members, regardless of role or level of education. Previous literature has highlighted the importance of showing interest in learners.7,19,25-27 This study provides multiple and varied examples of ways in which interest might be displayed.
For patients, the critical role of relationships was evidenced through rapport building and attention to patients as people outside their acute hospitalization. For instance, attendings regularly put patients’ medical issues into context and anticipated future outpatient challenges. To the authors’ knowledge, previous scholarship has not significantly emphasized this form of contextualized medicine, which involves the mindful consideration of the ongoing needs patients may experience upon transitions of care.
Several participants highlighted humility as an important characteristic of effective clinician educators. Attendings recognized that the field produces more new knowledge than can possibly be assimilated and that uncertainty is a mainstay of modern medical care. Attendings frequently utilized self-deprecation to acknowledge doubt, a technique that created a collaborative environment in which learners also felt safe to ask questions. These findings support the viewpoints by Reilly and Beckman that humility and an appreciation for questions and push-back from learners encourage lifelong learning through role modeling.19,23 In responding to the interviewer’s question “And what happens when [the attending] is wrong?” one learner simply stated, “He makes fun of himself.”
This study has several limitations. First, it was conducted in a limited number of US based healthcare systems. The majority of institutions represented were larger, research intensive hospitals. While these hospitals were purposefully selected to provide a range in geography, size, type, and access to resources, the findings may differ in other settings. Second, it was conducted with a limited number of attendings and learners, which may limit the study’s generalizability. However, enough interviews were conducted to reach data saturation.15 Because evidence for a causal relationship between quality teaching and student and patient outcomes is lacking,18 we must rely on imperfect proxies for teaching excellence, including awards and recognition. This study attempted to identify exemplary educators through various means, but it is recognized that bias is likely. Third, because attendings provided lists of former learners, selection and recall biases may have been introduced, as attendings may have more readily identified former learners with whom they formed strong relationships. Fourth, focus was placed exclusively on teaching and learning within general medicine rounds. This was because there would be ample opportunity for teaching on this service, the structure of the teams and the types of patients would be comparable across sites, and the principal investigator was also a general medicine attending and would have a frame of reference for these types of rounds. Due to this narrow focus, the findings may not be generalizable to other subspecialties. Fifth, attendings were selected through a nonexhaustive method. However, the multisite design, the modified snowball sampling, and the inclusion of several types of institutions in the final participant pool introduced diversity to the final list. Finally, although we cannot discount the potential role of a Hawthorne effect on our data collection, the research team did attempt to mitigate this by standing apart from the care teams and remaining unobtrusive during observations.
Using a combination of interviews, focus group discussions, and direct observation, we identified consistent techniques and behaviors of excellent teaching attendings during inpatient general medicine rounds. We hope that all levels of clinician educators may use them to elevate their own teaching.
Disclosure
Dr. Saint is on a medical advisory board of Doximity, a new social networking site for physicians, and receives an honorarium. He is also on the scientific advisory board of Jvion, a healthcare technology company. Drs. Houchens, Harrod, Moody, and Ms. Fowler have no conflicts of interest.
1. Accreditation Council for Graduate Medical Education. Common program requirements. 2011. http://www.acgme.org/Portals/0/PDFs/Common_Program_Requirements_07012011[2].pdf. Accessed September 16, 2016.
2. Healthcare Cost and Utilization Project. Overview statistics for inpatient hospital stays. HCUP Facts and Figures: Statistics on Hospital-Based Care in the United States, 2009. Rockville, MD: Agency for Healthcare Research and Quality; 2011.
3. Busari JO, W eggelaar NM, Knottnerus AC, Greidanus PM, Scherpbier AJ. How medical residents perceive the quality of supervision provided by attending doctors in the clinical setting. Med Educ. 2005;39(7):696-703. PubMed
4. Smith CA, Varkey AB, Evans AT, Reilly BM. Evaluating the performance of inpatient attending physicians: a new instrument for today’s teaching hospitals. J Gen Intern Med. 2004;19(7):766-771. PubMed
5. Elnicki DM, Cooper A. Medical students’ perceptions of the elements of effective inpatient teaching by attending physicians and housestaff. J Gen Intern Med. 2005;20(7):635-639. PubMed
6. Buchel TL, Edwards FD. Characteristics of effective clinical teachers. Fam Med. 2005;37(1):30-35. PubMed
7. Guarino CM, Ko CY, Baker LC, Klein DJ, Quiter ES, Escarce JJ. Impact of instructional practices on student satisfaction with attendings’ teaching in the inpatient component of internal medicine clerkships. J Gen Intern Med. 2006;21(1):7-12. PubMed
8. Irby DM. How attending physicians make instructional decisions when conducting teaching rounds. Acad Med. 1992;67(10):630-638. PubMed
9. Beckman TJ. Lessons learned from a peer review of bedside teaching. Acad Med. 2004;79(4):343-346. PubMed
10. Wright SM, Carrese JA. Excellence in role modelling: insight and perspectives from the pros. CMAJ. 2002;167(6):638-643. PubMed
11. Castiglioni A, Shewchuk RM, Willett LL, Heudebert GR, Centor RM. A pilot study using nominal group technique to assess residents’ perceptions of successful attending rounds. J Gen Intern Med. 2008;23(7):1060-1065. PubMed
12. Bergman K, Gaitskill T. Faculty and student perceptions of effective clinical teachers: an extension study. J Prof Nurs. 1990;6(1):33-44. PubMed
13. Richards L, Morse J. README FIRST for a User’s Guide to Qualitative Methods. 3rd ed. Los Angeles, CA: SAGE Publications, Inc.; 2013.
14. U.S. News and World Report. Best Medical Schools: Research. 2014. http://grad-schools.usnews.rankingsandreviews.com/best-graduate-schools/top-medical-schools/research-rankings. Accessed September 16, 2016.
15. Guest G, Bunce A, Johnson L. How many interviews are enough? An experiment with data saturation and variability. Field Methods. 2006;18(1):59-82.
16. Braun V, Clarke V. Using thematic analysis in psychology. Qual Res Psychol. 2006;3(2):77-101.
17. Aronson J. A pragmatic view of thematic analysis. Qual Rep. 1995;2(1):1-3.
18. Sutkin G, Wagner E, Harris I, Schiffer R. What makes a good clinical teacher in medicine? A review of the literature. Acad Med. 2008;83(5):452-466. PubMed
19. Beckman TJ, Lee MC. Proposal for a collaborative approach to clinical teaching. Mayo Clin Proc. 2009;84(4):339-344. PubMed
20. Ramani S. Twelve tips to improve bedside teaching. Med Teach. 2003;25(2):112-115. PubMed
21. Irby DM. What clinical teachers in medicine need to know. Acad Med. 1994;69(5):333-342. PubMed
22. Wiese J, ed. Teaching in the Hospital. Philadelphia, PA: American College of Physicians; 2010.
23. Reilly BM. Inconvenient truths about effective clinical teaching. Lancet. 2007;370(9588):705-711. PubMed
24. Branch WT Jr, Kern D, Haidet P, et al. The patient-physician relationship. Teaching the human dimensions of care in clinical settings. JAMA. 2001;286(9):1067-1074. PubMed
25. McLeod PJ, Harden RM. Clinical teaching strategies for physicians. Med Teach. 1985;7(2):173-189. PubMed
26. Pinsky LE, Monson D, Irby DM. How excellent teachers are made: reflecting on success to improve teaching. Adv Health Sci Educ Theory Pract. 1998;3(3):207-215. PubMed
27. Ullian JA, Bland CJ, Simpson DE. An alternative approach to defining the role of the clinical teacher. Acad Med. 1994;69(10):832-838. PubMed
Clinician educators face numerous obstacles to their joint mission of facilitating learning while also ensuring high-quality and patient-centered care. Time constraints, including the institution of house officer duty hour limitations,1 shorter lengths of stay for hospitalized patients,2 and competing career responsibilities, combine to create a dynamic learning environment. Additionally, clinician educators must balance the autonomy of their learners with the safety of their patients. They must teach to multiple learning levels and work collaboratively with multiple disciplines to foster an effective team-based approach to patient care. Yet, many clinician educators have no formal training in pedagogical methods.3 Such challenges necessitate increased attention to the work of excellent clinician educators and their respective teaching approaches.
Many studies of clinical teaching rely primarily on survey data of attributes of good clinical teachers.3-7 While some studies have incorporated direct observations of teaching8,9 or interviews with clinician educators or learners,10,11 few have incorporated multiple perspectives from the current team and from former learners in order to provide a comprehensive picture of team-based learning.12
The goal of this study was to gain a thorough understanding, through multiple perspectives, of the techniques and behaviors used by exemplary educators within actual clinical environments. We studied attitudes, behaviors, and approaches of 12 such inpatient clinician educators.
METHODS
Study Design and Sampling
This was a multisite study using an exploratory qualitative approach to inquiry. This approach was used to study the techniques and behaviors of excellent attendings during inpatient general medicine rounds. A modified snowball sampling approach13 was used, meaning individuals known to one member of the research team (SS) were initially contacted and asked to identify clinician educators (also referred to as attendings) for potential inclusion in the study. In an effort to identify attendings from a broad range of medical schools, the “2015 U.S. News and World Report Top Medical Schools: Research” rankings14 were also reviewed, with priority given to the top 25, as these are widely used to represent the best US hospitals. In an attempt to invite attendings from diverse institutions, additional medical schools not in the top 25 as well as historically black medical schools were also included. Division chiefs and chairs of internal medicine and/or directors of internal medicine residency programs at these schools were contacted and asked for recommendations of attendings, both within and outside their institutions, who they considered to be great inpatient teachers. In addition, key experts who have won teaching awards or were known to be specialists in the field of medical education were asked to nominate one or two other outstanding attendings.
By using this sampling method, 59 potential participants were identified. An internet search was conducted to obtain information about the potential participants and their institutions. Organizational characteristics such as geographic location, hospital size and affiliation, and patient population, as well as individual characteristics such as gender, medical education and training, and educational awards received were considered so that a diversity of organizations and backgrounds was represented. The list was narrowed down to 16 attendings who were contacted via e-mail and asked to participate. Interested participants were asked for a list of their current team members and 6 to 10 former learners to contact for interviews and focus groups. Former learners were included in an effort to better understand lasting effects on learners from their exemplary teaching attendings. A total of 12 attending physicians agreed to participate (Table 1). Literature on field methods has shown that 12 interviews are found to be adequate in accomplishing data saturation.15 Although 2 attendings were located at the same institution, we decided to include them given that both are recognized as master clinician educators and were each recommended by several individuals from various institutions. Hospitals were located throughout the US and included both university-affiliated hospitals and Veterans Affairs medical centers. Despite efforts to include physicians from historically black colleges and universities, only one attending was identified, and they declined the request to participate.
Data Collection
Observations. The one-day site visits were mainly conducted by two research team members, a physician (SS) and a medical anthropologist (MH), both of whom have extensive experience in qualitative methods. Teams were not uniform but were generally comprised of 1 attending, 1 senior medical resident, 1 to 2 interns, and approximately 2 medical students. Occasionally, a pharmacist, clinical assistant, or other health professional accompanied the team on rounds. Not infrequently, the bedside nurse would explicitly be included in the discussion regarding his or her specific patient. Each site visit began with observing attendings (N = 12) and current learners (N = 57) during rounds. Each research team member recorded their own observations via handwritten field notes, paying particular attention to group interactions, teaching approach, conversations occurring within and peripheral to the team, patient-team interactions, and the physical environment. By standing outside of the medical team circle and remaining silent during rounds, research team members remained unobtrusive to the discussion and process of rounds. Materials the attendings used during their teaching rounds were also documented and collected. Rounds generally lasted 2 to 3 hours. After each site visit, the research team met to compare and combine field notes.
Interviews and Focus Groups. The research team then conducted individual, semi-structured interviews with the attendings, focus groups with their current team (N = 46), and interviews or focus groups with their former learners (N = 26; Supplement 1). Eleven of the current team members observed during rounds were unable to participate in the focus groups due to clinical duties. Because the current learners who participated in the focus groups were also observed during rounds, the research team was able to ask them open-ended questions regarding teaching rounds and their roles as learners within this environment. Former learners who were still at the hospital participated in separate focus groups or interviews. Former learners who were no longer present at the hospital were contacted by telephone and individually interviewed by one research team member (MH). All interviews and focus groups were audio-recorded and transcribed.
This study was determined to be exempt by the University of Michigan Institutional Review Board. All participants were informed that their participation was completely voluntary and that they could terminate their involvement at any time.
Data Analysis
Data were analyzed using a thematic analysis approach.16 Thematic analysis entails reading through the data to identify patterns (and create codes) that relate to behaviors, experiences, meanings, and activities. Once patterns have been identified, they are grouped according to similarity into themes, which help to further explain the findings.17
After the first site visit was completed, the research team members that participated (SS and MH) met to develop initial ideas about meanings and possible patterns. All transcripts were read by one team member (MH) and, based on review of the data, codes were developed, defined, and documented in a codebook. This process was repeated after every site visit using the codebook to expand or combine codes and refine definitions as necessary. If a new code was added, the previously coded data were reviewed to apply the new code. NVivo® 10 software (QSR International; Melbourne, Australia) was used to manage the data.
Once all field notes and transcripts were coded (MH), the code reports, which list all data described within a specific code, were run to ensure consistency and identify relationships between codes. Once coding was verified, codes were grouped based on similarities and relationships into salient themes by 3 members of the research team (NH, MH, and SM). Themes, along with their supporting codes, were then further defined to understand how these attendings worked to facilitate excellent teaching in clinical settings.
RESULTS
The coded interview data and field notes were categorized into broad, overlapping themes. Three of these major themes include (1) fostering positive relationships, (2) patient-centered teaching, and (3) collaboration and coaching. Table 2 lists each theme, salient behaviors, examples, and selected quotes that further elucidate its meaning.
Fostering Positive Relationships
Attending physicians took observable steps to develop positive relationships with their team members, which in turn created a safe learning environment. For instance, attendings used learners’ first names, demonstrated interest in their well-being, deployed humor, and generally displayed informal actions—uncrossed arms, “fist bump” when recognizing learners’ success, standing outside the circle of team members and leaning in to listen—during learner interactions. Attendings also made it a priority to get to know individuals on a personal level. As one current learner put it, “He asks about where we are from. He will try to find some kind of connection that he can establish with not only each of the team members but also with each of the patients.”
Additionally, attendings built positive relationships with their learners by responding thoughtfully to their input, even when learners’ evaluations of patients required modification. In turn, learners reported feeling safe to ask questions, admit uncertainty, and respectfully disagree with their attendings. As one attending reflected, “If I can get them into a place where they feel like the learning environment is someplace where they can make a mistake and know that that mistake does not necessarily mean that it’s going to cost them in their evaluation part, then I feel like that’s why it’s important.”
To build rapport and create a safe learning environment, attendings used a number of strategies to position themselves as learners alongside their team members. For instance, attendings indicated that they wanted their ideas questioned because they saw it as an opportunity to learn. Moreover, in conversations with learners, attendings demonstrated humility, admitting when they did not know something. One former learner noted, “There have been times when he has asked [a] question…nobody knows and then he admits that he doesn’t know either. So everybody goes and looks it up…The whole thing turns out to be a fun learning experience.”
Attendings demonstrated respect for their team members’ time by reading about patients before rounds, identifying learning opportunities during rounds, and integrating teaching points into the daily work of patient care. Teaching was not relegated exclusively to the conference room or confined to the traditional “chalk talk” before or after rounds but rather was assimilated into daily workflow. They appeared to be responsive to the needs of individual patients and the team, which allowed attendings to both directly oversee their patients’ care and overcome the challenges of multiple competing demands for time. The importance of this approach was made clear by one current learner who stated “…she does prepare before, especially you know on call days, she does prepare for the new patients before coming in to staff, which is really appreciated… it saves a lot of time on rounds.”
Attendings also included other health professionals in team discussions. Attendings used many of the same relationship-building techniques with these professionals as they did with learners and patients. They consistently asked these professionals to provide insight and direction in patients’ plans of care. A former learner commented, “He always asks the [nurse] what is her impression of the patient...he truly values the [nurse’s] opinion of the patient.” One attending reiterated this approach, stating “I don’t want them to think that anything I have to say is more valuable than our pharmacist or the [nurse].”
Patient-Centered Teaching
Attending physicians modeled numerous teaching techniques that focused learning around the patient. Attendings knew their patients well through review of the medical records, discussion with the patient, and personal examination. This preparation allowed attendings to focus on key teaching points in the context of the patient. One former learner noted, “He tended to bring up a variety of things that really fit well into the clinical scenario. So whether that is talking about what is the differential for a new symptom that just came up for this patient or kind of here is a new paper talking about this condition or maybe some other pearl of physical exam for a patient that has a certain physical condition.”
Attendings served as effective role models by being directly involved in examining and talking with patients as well as demonstrating excellent physical examination and communication techniques. One current learner articulated the importance of learning these skills by observing them done well: “I think he teaches by example and by doing, again, those little things: being attentive to the patients and being very careful during exams…I think those are things that you teach people by doing them, not by saying you need to do this better during the patient encounter.”
Collaboration and Coaching
Attending physicians used varied collaboration and coaching techniques to facilitate learning across the entire care team. During rounds, attendings utilized visual aids to reinforce key concepts and simplify complex topics. They also collaborated by using discussion rather than lecture to engage with team members. For instance, attendings used Socratic questioning, asking questions that lead learners through critical thinking and allow them to solve problems themselves, to guide learners’ decision-making. One former learner reported, “He never gives you the answer, and he always asks your opinion; ‘So what are your thoughts on this?’”
Coaching for success, rather than directing the various team members, was emphasized. Attendings did not wish to be seen as the “leaders” of the team. During rounds, one attending was noted to explain his role in ensuring that the team was building connections with others: “When we have a bad outcome, if it feels like your soul has been ripped out, then you’ve done something right. You’ve made that connection with the patient. My job, as your coach, was to build communication between all of us so we feel vested in each other and our patients.”
Attendings also fostered clinical reasoning skills in their learners by encouraging them to verbalize their thought processes aloud in order to clarify and check for understanding. Attendings also placed emphasis not simply on memorizing content but rather prioritization of the patient’s problems and thinking step by step through individual medical problems. One current learner applauded an attending who could “come up with schematics of how to approach problems rather than feeding us factual information of this paper or this trial.”
Additionally, attendings facilitated learning across the entire care team by differentiating their teaching to meet the needs of multiple learning levels. While the entire team was explicitly included in the learning process, attendings encouraged learners to play various roles, execute tasks, and answer questions depending on their educational level. Attendings positioned learners as leaders of the team by allowing them to talk without interruption and by encouraging them to take ownership of their patients’ care. One former learner stated, “She set expectations…we would be the ones who would be running the team, that you know it would very much be our team and that she is there to advise us and provide supervision but also safety for the patients as well.”
CONCLUSION
This study reveals the complex ways effective attendings build rapport, create a safe learning environment, utilize patient-centered teaching strategies, and engage in collaboration and coaching with all members of the team. These findings provide a framework of shared themes and their salient behaviors that may influence the success of inpatient general medicine clinician educators (Table 3).
There is a broad and voluminous literature on the subject of outstanding clinical teaching characteristics, much of which has shaped various faculty development curricula for decades. This study sought not to identify novel approaches of inpatient teaching necessarily but rather to closely examine the techniques and behaviors of clinician educators identified as exemplary. The findings affirm and reinforce the numerous, well-documented lists of personal attributes, techniques, and behaviors that resonate with learners, including creating a positive environment, demonstrating enthusiasm and interest in the learner, reading facial expressions, being student-centered, maintaining a high level of clinical knowledge, and utilizing effective communication skills.18-24 The strengths of this study lie within the nuanced and rich observations and discussions that move beyond learners’ Likert scale evaluations and responses.3-7,12 Input was sought from multiple perspectives on the care team, which provided detail from key stakeholders. Out of these comprehensive data arose several conclusions that extend the research literature on medical education.
In their seminal review, Sutkin et al.18 demonstrate that two thirds of characteristics of outstanding clinical teachers are “noncognitive” and that, “Perhaps what makes a clinical educator truly great depends less on the acquisition of cognitive skills such as medical knowledge and formulating learning objectives, and more on inherent, relationship-based, noncognitive attributes. Whereas cognitive abilities generally involve skills that may be taught and learned, albeit with difficulty, noncognitive abilities represent personal attributes, such as relationship skills, personality types, and emotional states, which are more difficult to develop and teach.”18 Our study, thus, adds to the literature by (1) highlighting examples of techniques and behaviors that encompass the crucial “noncognitive” arena and (2) informing best practices in teaching clinical medicine, especially those that resonate with learners, for future faculty development.
The findings highlight the role that relationships play in the teaching and learning of team-based medicine. Building rapport and sustaining successful relationships are cornerstones of effective teaching.18 For the attendings in this study, this manifested in observable, tangible behaviors such as greeting others by name, joking, using physical touch, and actively involving all team members, regardless of role or level of education. Previous literature has highlighted the importance of showing interest in learners.7,19,25-27 This study provides multiple and varied examples of ways in which interest might be displayed.
For patients, the critical role of relationships was evidenced through rapport building and attention to patients as people outside their acute hospitalization. For instance, attendings regularly put patients’ medical issues into context and anticipated future outpatient challenges. To the authors’ knowledge, previous scholarship has not significantly emphasized this form of contextualized medicine, which involves the mindful consideration of the ongoing needs patients may experience upon transitions of care.
Several participants highlighted humility as an important characteristic of effective clinician educators. Attendings recognized that the field produces more new knowledge than can possibly be assimilated and that uncertainty is a mainstay of modern medical care. Attendings frequently utilized self-deprecation to acknowledge doubt, a technique that created a collaborative environment in which learners also felt safe to ask questions. These findings support the viewpoints by Reilly and Beckman that humility and an appreciation for questions and push-back from learners encourage lifelong learning through role modeling.19,23 In responding to the interviewer’s question “And what happens when [the attending] is wrong?” one learner simply stated, “He makes fun of himself.”
This study has several limitations. First, it was conducted in a limited number of US based healthcare systems. The majority of institutions represented were larger, research intensive hospitals. While these hospitals were purposefully selected to provide a range in geography, size, type, and access to resources, the findings may differ in other settings. Second, it was conducted with a limited number of attendings and learners, which may limit the study’s generalizability. However, enough interviews were conducted to reach data saturation.15 Because evidence for a causal relationship between quality teaching and student and patient outcomes is lacking,18 we must rely on imperfect proxies for teaching excellence, including awards and recognition. This study attempted to identify exemplary educators through various means, but it is recognized that bias is likely. Third, because attendings provided lists of former learners, selection and recall biases may have been introduced, as attendings may have more readily identified former learners with whom they formed strong relationships. Fourth, focus was placed exclusively on teaching and learning within general medicine rounds. This was because there would be ample opportunity for teaching on this service, the structure of the teams and the types of patients would be comparable across sites, and the principal investigator was also a general medicine attending and would have a frame of reference for these types of rounds. Due to this narrow focus, the findings may not be generalizable to other subspecialties. Fifth, attendings were selected through a nonexhaustive method. However, the multisite design, the modified snowball sampling, and the inclusion of several types of institutions in the final participant pool introduced diversity to the final list. Finally, although we cannot discount the potential role of a Hawthorne effect on our data collection, the research team did attempt to mitigate this by standing apart from the care teams and remaining unobtrusive during observations.
Using a combination of interviews, focus group discussions, and direct observation, we identified consistent techniques and behaviors of excellent teaching attendings during inpatient general medicine rounds. We hope that all levels of clinician educators may use them to elevate their own teaching.
Disclosure
Dr. Saint is on a medical advisory board of Doximity, a new social networking site for physicians, and receives an honorarium. He is also on the scientific advisory board of Jvion, a healthcare technology company. Drs. Houchens, Harrod, Moody, and Ms. Fowler have no conflicts of interest.
1. Accreditation Council for Graduate Medical Education. Common program requirements. 2011. http://www.acgme.org/Portals/0/PDFs/Common_Program_Requirements_07012011[2].pdf. Accessed September 16, 2016.
2. Healthcare Cost and Utilization Project. Overview statistics for inpatient hospital stays. HCUP Facts and Figures: Statistics on Hospital-Based Care in the United States, 2009. Rockville, MD: Agency for Healthcare Research and Quality; 2011.
3. Busari JO, W eggelaar NM, Knottnerus AC, Greidanus PM, Scherpbier AJ. How medical residents perceive the quality of supervision provided by attending doctors in the clinical setting. Med Educ. 2005;39(7):696-703. PubMed
4. Smith CA, Varkey AB, Evans AT, Reilly BM. Evaluating the performance of inpatient attending physicians: a new instrument for today’s teaching hospitals. J Gen Intern Med. 2004;19(7):766-771. PubMed
5. Elnicki DM, Cooper A. Medical students’ perceptions of the elements of effective inpatient teaching by attending physicians and housestaff. J Gen Intern Med. 2005;20(7):635-639. PubMed
6. Buchel TL, Edwards FD. Characteristics of effective clinical teachers. Fam Med. 2005;37(1):30-35. PubMed
7. Guarino CM, Ko CY, Baker LC, Klein DJ, Quiter ES, Escarce JJ. Impact of instructional practices on student satisfaction with attendings’ teaching in the inpatient component of internal medicine clerkships. J Gen Intern Med. 2006;21(1):7-12. PubMed
8. Irby DM. How attending physicians make instructional decisions when conducting teaching rounds. Acad Med. 1992;67(10):630-638. PubMed
9. Beckman TJ. Lessons learned from a peer review of bedside teaching. Acad Med. 2004;79(4):343-346. PubMed
10. Wright SM, Carrese JA. Excellence in role modelling: insight and perspectives from the pros. CMAJ. 2002;167(6):638-643. PubMed
11. Castiglioni A, Shewchuk RM, Willett LL, Heudebert GR, Centor RM. A pilot study using nominal group technique to assess residents’ perceptions of successful attending rounds. J Gen Intern Med. 2008;23(7):1060-1065. PubMed
12. Bergman K, Gaitskill T. Faculty and student perceptions of effective clinical teachers: an extension study. J Prof Nurs. 1990;6(1):33-44. PubMed
13. Richards L, Morse J. README FIRST for a User’s Guide to Qualitative Methods. 3rd ed. Los Angeles, CA: SAGE Publications, Inc.; 2013.
14. U.S. News and World Report. Best Medical Schools: Research. 2014. http://grad-schools.usnews.rankingsandreviews.com/best-graduate-schools/top-medical-schools/research-rankings. Accessed September 16, 2016.
15. Guest G, Bunce A, Johnson L. How many interviews are enough? An experiment with data saturation and variability. Field Methods. 2006;18(1):59-82.
16. Braun V, Clarke V. Using thematic analysis in psychology. Qual Res Psychol. 2006;3(2):77-101.
17. Aronson J. A pragmatic view of thematic analysis. Qual Rep. 1995;2(1):1-3.
18. Sutkin G, Wagner E, Harris I, Schiffer R. What makes a good clinical teacher in medicine? A review of the literature. Acad Med. 2008;83(5):452-466. PubMed
19. Beckman TJ, Lee MC. Proposal for a collaborative approach to clinical teaching. Mayo Clin Proc. 2009;84(4):339-344. PubMed
20. Ramani S. Twelve tips to improve bedside teaching. Med Teach. 2003;25(2):112-115. PubMed
21. Irby DM. What clinical teachers in medicine need to know. Acad Med. 1994;69(5):333-342. PubMed
22. Wiese J, ed. Teaching in the Hospital. Philadelphia, PA: American College of Physicians; 2010.
23. Reilly BM. Inconvenient truths about effective clinical teaching. Lancet. 2007;370(9588):705-711. PubMed
24. Branch WT Jr, Kern D, Haidet P, et al. The patient-physician relationship. Teaching the human dimensions of care in clinical settings. JAMA. 2001;286(9):1067-1074. PubMed
25. McLeod PJ, Harden RM. Clinical teaching strategies for physicians. Med Teach. 1985;7(2):173-189. PubMed
26. Pinsky LE, Monson D, Irby DM. How excellent teachers are made: reflecting on success to improve teaching. Adv Health Sci Educ Theory Pract. 1998;3(3):207-215. PubMed
27. Ullian JA, Bland CJ, Simpson DE. An alternative approach to defining the role of the clinical teacher. Acad Med. 1994;69(10):832-838. PubMed
© 2017 Society of Hospital Medicine
Hand Hygiene Intervention in Japan
Healthcare‐associated infections are a major cause of illness and death in hospitalized patients, and preventing healthcare‐associated infection is a global challenge.[1] Worldwide, the prevalence of healthcare‐associated infections in developed and undeveloped countries ranges from 5.1% to 11.6% and 5.7% to 19.1%, respectively.[2] In the United States, roughly 2 million such infections occur annually, resulting in approximately 99,000 deaths[3] and estimated annual direct medical costs between $28.4 and $33.8 billion.[4] In Japan, nearly 9% of patients admitted to the intensive care unit (ICU) develop an infection during hospitalization,[5] and 5% of all patients hospitalized become infected with methicillin‐resistant Staphylococcus aureus.[6] The management of healthcare‐associated infections in Japan accounts for up to 5% of total annual healthcare costs, with an estimated $6.8 billion estimated to be potentially preventable.[7] In addition, healthcare‐associated infections are associated with increased length of stay in the hospital. Studies estimate surgical site infections extend length of stay by 9.7 days,[8] and bloodstream infections increase length of stay by 10 days.[9]
Improving hand hygiene practice for healthcare workers is considered a core strategy to decrease the incidence of healthcare‐associated infection.[6, 10] Specifically, the use of alcohol‐based hand rub is strongly recommended in acute care hospitals by both the World Health Organization (WHO) and the US Centers for Disease Control and Prevention.[11, 12] Improving hand hygiene adherence may reduce healthcare‐associated infection by 9% to 50%,[13, 14] and multiple studies have reported that greater use of alcohol‐based hand rubs results in significant reductions in healthcare‐associated infections.[14, 15]
Due to the difficulty in improving hand hygiene in various settings across the world, the WHO strategy for improving hand hygiene has been adopted and implemented by several studies in varying locations, such as Costa Rica, Italy, Mali, Pakistan, and Saudi Arabia.[16] Implementations of these multimodal strategies, following WHObased guidelines, have been shown to increase the level of hand hygiene adherence among healthcare workers and reduce infections at these locations.[14, 17, 18] This study expands upon that work by extending the same implementation strategy to assess the effectiveness of the introduction of alcohol‐based hand rub on hand hygiene practice at multiple hospitals in Japan.
In a previous article[19] we reported results from an observational study assessing healthcare worker hand hygiene adherence before touching the patient in 4 geographically diverse hospitals in Japan. The study reported that hand hygiene adherence in Japanese hospitals was lower than reported mean values from other international studies, and that greater adherence to hand hygiene should be encouraged. In this article, we present the results of a multimodal intervention intended to improve levels of healthcare worker hand hygiene in 3 of these hospitals.
METHODS
Participating Institutions
Three of the 4 hospitals participating in the prior observational study chose to participate in this intervention. Evaluation of hand hygiene practice was performed in at least 3 wards of each hospital including an inpatient surgical ward, an inpatient medicine ward, an ICU, or an emergency ward.
Table 1 lists the characteristics of the participating hospitals. Hospital A is a university‐affiliated, tertiary care medical center with 312 beds in East Japan. Although the hospital did not have an infection prevention unit or designated infection control nurses during the preintervention periods, the hospital hired a designated infection prevention nurse and established a department of infection prevention before this intervention in April 2012. Hospital B is a community‐based, tertiary care medical center with 428 beds, located in Midwest Japan. Although the facility had no infection control nurses at the outset of the study, a physician certified by the American Board of Internal Medicine and Infectious Diseases provided educational sessions of hand hygiene. Hospital B hired a designated infection prevention nurse and established a department of infection prevention in April 2012. Hospital C, located in Northern Japan, is a community‐based, tertiary care medical center with 562 beds. The department of infection prevention was established in 2010 and has 1 full‐time and 2 part‐time infection prevention nurses.
| Hospital A | Hospital B | Hospital C | ||||
|---|---|---|---|---|---|---|
| Preintervention | Postintervention | Preintervention | Postintervention | Preintervention | Postintervention | |
| ||||||
| Hospital characteristics | ||||||
| Location | East Japan | Midwest Japan | Northern Japan | |||
| Hospital type | University affiliated | Community based | Community based | |||
| Level of care | Tertiary care | Tertiary care | Tertiary care | |||
| Residency program | Yes | Yes | Yes | |||
| No. of beds | 250 | 312 | 428 | 428 | 550 | 562 |
| No. of employees | 398 | 475 | 1,035 | 1,263 | 1,500 | 1,568 |
| No. of physicians | 73 | 91 | 179 | 188 | 207 | 217 |
| No. of nurses | 172 | 210 | 410 | 540 | 616 | 800 |
| Infection control practice | ||||||
| Establishment of infection prevention units (year) | N/A | Yes (2012) | N/A | Yes (2012) | Yes (2010) | Yes |
| Employment of certified nurses in infection control (FTE) | 0 | 1 (1) | 0 | 1 (1) | 3 (1.5) | 3 (1.5) |
| Employment of ABIM‐IDcertified physician | 0 | 0 | 1 | 1 | 1 | 0 |
Role of the Funding Source
This study was unfunded. The prize for the contest was provided by an American collaborator (S.S.) who was not affiliated with any of the participating hospitals.
Intervention
In the prior preintervention study, hand hygiene adherence rates of healthcare workers were evaluated between July 2011 and November 2011.[19] To improve hand hygiene adherence in these facilities, we initiated a multimodal intervention based on WHO recommendations and the findings from the prior study. Each facility was provided the same guidance on how to improve hand hygiene adherence (Table 2) and encouraged to tailor the intervention to their local setting. As an added incentive, we initiated a contest, where the facility obtaining the highest hand hygiene adherence postintervention would win a trophy and 500,000 Japanese yen (approximately $5000 US dollars). The recommended strategies consisted of 15 components (Table 2): infrastructure (3 components), training and education (2 components), evaluation and feedback (5 components), reminder in the workplace (1 component), and institution safety climate (4 components). Of note, the participating institutions had already implemented a varying number of the intervention components prior to the start of the intervention. Each facility conducted a 6‐month intervention to improve hand hygiene adherence; however, the actual timing of interventions varied slightly by institution. Hospitals A and C conducted an intervention from October 2012 through March 2013, whereas hospital B's intervention was from April 2012 to September 2012. Details of the multimodal intervention performed at each participating hospital are shown in Table 3.
| Intervention Components | Description |
|---|---|
| 1. Infrastructure (3 components) | |
| Hand‐washing faucets for each room | At least 1 faucet and sink for each room was available. |
| Placement of alcohol hand rub at patient's room entrance | Alcohol hand rub was placed at all patient room entrances. |
| Portable alcohol hand rub distributed for each healthcare worker | Personal, portable alcohol hand rub dispensers were provided for healthcare workers who contact patients. |
| 2. Training/education (2 components) | |
| Educational resources | At least 1 physician or 1 nurse who provides educational sessions regarding hand hygiene practice was available. |
| Periodic seminars and lectures regarding hand hygiene education | Hospital‐wide hand hygiene seminar or educational activities were held during the intervention period. |
| 3. Evaluation and feedback (5 components) | |
| Evaluation of hand hygiene practice by direct observation | Hospitals utilize direct observation for healthcare worker's hand hygiene practice. |
| Evaluation of hand hygiene practice by monitoring the amount of alcohol hand rub consumption | Hospitals utilize the amount of alcohol hand rub consumption as a parameter for healthcare worker's hand hygiene practice. |
| Hand hygiene rate feedback at infection control committee | Hand hygiene adherence rate was reported and discussed at hospital infection control committee. |
| Hand hygiene rate feedback to the designated wards/units | Hand hygiene adherence rate was reported and discussed with healthcare workers at the designated wards/units where hand hygiene observation was performed. |
| Granting the award of top‐rated person of hand hygiene | Hospitals established the system to assess individual healthcare worker's hand hygiene adherence rate. |
| 4. Reminder in the workplace (1 components) | |
| Poster notification | Poster notification for hand hygiene practice was performed in the intervention period. |
| 5. Institutional safety climate (4 components) | |
| Commitment of hospital president or hospital executives | Hospital executives including the president agreed on the importance of hand hygiene practice and declared to healthcare workers to enhance hand hygiene practice during the intervention period. |
| Commitment of nurse managers and physician leaders | Commitment of improving hand hygiene practice by representative healthcare workers at the designated wards/units (eg, meeting by nurse manager or physician leaders at the designated wards/units and collaborative work with infection prevention services). |
| Meeting at the designated wards/units | A ward/unit‐level meeting or voluntary session for hands‐on hand hygiene practice by healthcare workers at the designated wards/units. |
| Identifying champions at the designated wards/units | An individual healthcare worker who contributed to improving hand hygiene practice was appointed. |
| Hospital A | Hospital Ba | Hospital C | ||||
|---|---|---|---|---|---|---|
| ||||||
| Intervention period | October 2012March 2013 | April 2012September 2012 | October 2012March 2013 | |||
| Evaluation of hand hygiene in the postintervention period | May 2013July 2013 | October 2012 | June 2013 | |||
| Suggested intervention components | Preintervention | Postintervention | Preintervention | Postintervention | Preintervention | Postintervention |
| No. of implemented components | 2/15 | 10/15 | 9/15 | 10/15 | 6/15 | 8/15 |
| Infrastructure (3 components) | ||||||
| Hand‐washing faucets for each room | No | No | Yes | Yes | Yes | Yes |
| Placement of alcohol hand rubs at patient's room entrance | Yes | Yes | Yes | Yes | Yes | Yes |
| Portable alcohol hand rub distributed for each healthcare worker | No | Yesb | No | Yesb | No | No |
| Training/education (2 components) | ||||||
| Educational resources | No | Yesb | Yes | Yesb | Yes | Yes |
| Periodic seminars and lectures regarding hand hygiene education | No | Yesb | Yes | Yes | Yes | Yes |
| Evaluation and feedback (5 components) | ||||||
| Evaluation of hand hygiene practice by direct observation | No | Yesb | Yes | Yes | No | No |
| Evaluation of hand hygiene practice by the amount of alcohol hand rub consumption | No | No | Yes | Yes | Yes | Yes |
| Hand hygiene rate feedback at infection control committee | No | Yesb | Yes | Yes | No | Yesb |
| Hand hygiene rate feedback to designated departments | No | Yesb | Yes | Yes | No | Yesb |
| Granting the award of top‐rated person | No | No | No | No | No | No |
| Reminders in the workplace (1 component) | ||||||
| Poster notification | Yes | Yes | Yes | Yes | Yes | Yes |
| 5. Institutional safety climate (4 components) | ||||||
| Commitment of hospital president or hospital executives | No | Yesb | No | No | No | No |
| Commitment of nurse managers and physicians leaders | No | Yesb | No | No | No | No |
| Meeting regarding hand hygiene practice by the designated wards/units | No | No | No | No | No | No |
| Identifying champions at the designated wards/units | No | No | No | No | No | No |
Observation of Hand Hygiene Practice
The same methods for hand hygiene observation used for the preintervention study was used for postintervention assessment. Ten distinct units across the 3 participating hospitals were evaluated for healthcare worker hand hygiene prior to patient contact. Three to 4 units were observed at each facility. One of the study authors (T.S.), a Japanese board‐certified infection control nurse, conducted all of the hand hygiene observations for both the preintervention and postintervention studies. Intraobserver variation was minimized by providing the same training outlined in the previous study.[19] Appropriate hand hygiene was defined as the use of soap and water or alcohol‐based hand rub before patient contact, which corresponds to the first moment of the WHO's 5 moments of hand hygiene.[11]
Hand hygiene practice prior to patient contact for each individual provider‐patient encounter was observed and recorded using the hand hygiene observation form adapted from a previous study by Saint et al.[6, 20] Identical to the preintervention study,[19] the form captured the following information: unit in which observations were performed, time of initiation and completion of observations, healthcare worker subgroup (physician or nurse), and the type of hand hygiene before patient contact (ie, hand washing with soap and water, use of alcohol‐based hand rub, or no hand hygiene). Unit physicians and nurses were informed that their clinical practices were going to be observed, but were not informed of the purpose of the observations (eg, hand hygiene adherence). To avoid interfering with clinical care delivery, the observer was given strict instructions to maintain a certain distance from the observed healthcare workers. The observer was instructed to leave immediately if asked for any reason by the unit staff or patients.
Statistical Analysis
Overall hand hygiene adherence rates were calculated and compared between the pre‐ and the postintervention periods. Comparison of hand hygiene adherence by healthcare worker subgroup and by hospital unit between the pre‐ and postintervention periods was also performed. Hand hygiene adherence rates were compared using JMP 9.0 and SAS 9.3 (SAS Institute Inc., Cary, NC). Comparison of hand hygiene adherence rates by observational periods was calculated by Pearson [2] tests, and 95% confidence intervals (CIs) were estimated using binomial distribution. Pearson correlations were used to determine the relationship of hand hygiene between physicians and nurses in the same unit. Two‐tailed P value0.05 was considered statistically significant. The study protocol was reviewed and approved by the ethics committees at the participating hospitals.
RESULTS
Data were collected from May 2013 to July 2013 in hospital A, in October 2012 in hospital B, and June 2013 in hospital C to ensure data were collected after the 6‐month intervention at each site. A total of 2982 observations of hand hygiene were performed in 10 distinct units across the 3 participating hospitals during the postintervention periods. Hand hygiene observations were performed during the day Monday through Friday between 8:30 am and 7:30 pm, with the majority occurring prior to 1:00 pm.
The overall postintervention hand hygiene adherence rate (in all 3 hospitals) was significantly higher at 32.7% (974/2982) adherence compared to 18.0% (482/2679) adherence in the preintervention period (P<0.001). An increased hand hygiene adherence rate in each participating hospital in the postintervention period was observed (Figure 1). Similar trends of higher overall hand hygiene adherence rates for both nurses and physicians in the postintervention period were seen. Use of alcohol‐based hand rub among those with appropriate hand hygiene was significantly higher, with 90.0% (880/974) using hand rub in the postintervention period versus 67.0% (322/482) in the preintervention period (P<0.001). Comparison of overall hand hygiene adherence rates by unit type and healthcare worker subgroup between the pre‐ and postintervention periods are shown in Table 4. Detailed comparisons of hand hygiene adherence rates for each hospital are available in the supplementary appendix. Although a significant improvement of hand hygiene practice was observed in the majority of participating units (6/10), there was a significant decline in hand hygiene practice in 2 units for nurses and 1 unit for physicians. Hand hygiene adherence rates by healthcare worker subgroups (both physicians and nurses) were significantly higher in the postintervention period than those in the preintervention period. Trends toward higher hand hygiene adherence rate of nurses in the postintervention period were observed (34.8% adherence for nurses compared to 30.4% adherence for physicians); the difference between nurses and physicians were not statistically significant (P=0.07).

| Ward/Unit | Healthcare Worker Subgroup | Preintervention Period | Postintervention Period | Improvement After Intervention (%) | P Value | ||
|---|---|---|---|---|---|---|---|
| No. of Observations | Hand hygiene Adherence (%) | No. of Observations | Hand Hygiene Adherence (%) | ||||
| |||||||
| All 3 hospitals | |||||||
| Surgery | Nurse | 455 | 20 | 480 | 40 | 20 | <0.001 |
| Physician | 424 | 18 | 448 | 43 | 25 | <0.001 | |
| All | 879 | 19 | 928 | 41 | 22 | <0.001 | |
| Medicine | Nurse | 455 | 23 | 508 | 39 | 16 | <0.001 |
| Physician | 435 | 15 | 452 | 33 | 18 | <0.001 | |
| All | 890 | 20 | 960 | 36 | 16 | <0.001 | |
| ICU | Nurse | 305 | 21 | 379 | 25 | 4 | 0.17 |
| Physician | 203 | 9 | 268 | 28 | 19 | <0.001 | |
| All | 508 | 16 | 647 | 26 | 10 | <0.001 | |
| ED | Nurse | 170 | 16 | 173 | 27 | 11 | 0.01 |
| Physician | 232 | 14 | 274 | 9 | ‐5 | 0.07 | |
| All | 402 | 15 | 447 | 16 | 1 | 0.64 | |
| All units | Nurse | 1385 | 21 | 1540 | 35 | 14 | <0.001 |
| Physician | 1294 | 15 | 1442 | 30 | 15 | <0.001 | |
| All | 2679 | 18 | 2982 | 33 | 15 | <0.001 | |
Hospital A achieved the highest postintervention adherence rates (39.9% adherence postintervention), as well as the greatest absolute improvement in hand hygiene (increase of 29.0%). There were significant improvements in 3 of the 4 participating units in hospital A, with the emergency department showing improvements only in the nurse subgroup. In hospital B, total hand hygiene adherence increased from 24.7% to 30.0% (P=0.01); however, this increase was mainly due to increase in hand hygiene adherence rates of nurses. There were significant increases in hand hygiene adherence rates for nurses in the medicine (+11%, P=0.04) and surgery wards (+14%, P=0.01), with nonsignificant increases for physicians (+10% medicine, P=0.07;+2% surgery, P=0.78). However, in the emergency department, nurses showed no significant improvement, and physicians had a significant decrease in adherence (15.7% preintervention vs 7.4% postintervention; P=0.02). In hospital C, total hand hygiene practice rates were significantly improved (from 18.9% to 26.5%; P<0.001); however, this was driven by improvements only in the surgical ward (14.6% preintervention to 42.3% postintervention; P<0.001). The rates for nurses declined significantly in both the medicine and ICU wards, leading to no observed improvements on those wards.
DISCUSSION
Our multicenter intervention study in Japan included observations from almost 3000 encounters between clinicians and patients. Before the intervention, the overall rate of hand hygiene adherence was 18%. After the multimodal intervention, the absolute increase in healthcare worker hand hygiene adherence was 15%. Although there was overall improvement, the adherence rates varied by hospital, with hospital A increasing by 29% and hospital B and C only attaining increases of 5% and 7%, respectively.
Despite the importance of hand hygiene of healthcare workers, it is challenging to increase hand hygiene adherence because it requires behavioral modification. Moreover, it remains uncertain what factors will affect healthcare worker behavior. We implemented pragmatic strategies to evaluate the efficacy of hand hygiene multimodal interventions based on internationally recognized WHO hand hygiene adherence strategies[11] and an institutional‐level contest with financial incentives. The findings in the current study help us understand not only how a multimodal intervention importantly improves hand hygiene adherence, but also what factors potentially make healthcare workers modify their behaviors.
In this study, we evaluated whether an institutional‐level contest with financial incentives contributed to improved hand hygiene adherence of healthcare workers. This study demonstrated improvement of hand hygiene practice after implementation of a multimodal hand hygiene intervention combined with an institutional‐level contest with financial incentives. The contest might have had a modest effect to help motivate the participating hospitals to improve their hand hygiene adherence rate. This is consistent with a previous study that demonstrated financial incentives were associated with modifying healthcare workers' hand hygiene practice.[21] However, we did not strictly standardize how the contest information was distributed in each participating institution and the objective assessment for changes in motivation by the contest was lacking in this study. Thus, changes in motivation by the contest with financial incentives likely varied by each participating institution. Further studies are needed to assess if this type of approach is worth pursuing.
We observed several noteworthy associations between the intervention components that were implemented at each facility and their improvement in hand hygiene adherence. Among the participating hospitals, hospital A was most successful with improving hand hygiene adherence, although all participating hospitals achieved a similar number of the 15 recommended intervention components during the intervention (8 to 10 per hospital). Interestingly, hospital A initiated the most new components during the intervention period (8 new components for a total of 10 out of 15), whereas hospital B and hospital C initiated only 1 or 2 new components during the intervention period. Hospital A also successfully involved hospital executives, and elicited the commitment of a nurse manager and physician leader. Consistent with a previous study,[22] we believe that involvement of hospital executives appears to be important to increase overall hand hygiene rate among healthcare workers.
In contrast, hospitals B and C did not involve senior executives or identify nurse or physician champions for all participating units. Based on the results in this study, we believe that the involvement of hospital executives is likely a key for the penetration of hospital‐wide hand hygiene culture among healthcare workers.
Although this study was unable to determine which components are precisely associated with improving hand hygiene adherence, the findings suggest initiating multiple intervention components at the same time may provide more motivation for change than initiating only 1 or 2 components at a time. It is also possible that certain intervention components were more beneficial than others. For example, hospital A, which achieved the most success, was the only hospital to obtain leadership support. Other studies have demonstrated that the presence of leadership appeared to play a key role in improving hand hygiene adherence.[23, 24] Moreover, a recent Japanese nationwide survey demonstrated higher safety centeredness was associated with regular use of standard infection prevention practice.[25] Consistent with a previous study, improving hand hygiene adherence cannot be simply achieved by improving infrastructure (eg, introduction of portable alcohol‐based hand rub) alone, but it depends on altering healthcare worker behavior.[26]
This study has several limitations. Because participating hospitals could tailor the specific interventions chosen for their facility, the improvement in hand hygiene adherence was likely multifactorial. We are unable in the existing study to determine a direct causal relationship between any of the individual intervention components and hand hygiene adherence. We are also unable to determine whether the improvements seen in hospital A were due to participation in the contest or due to the specific intervention components that were implemented. However, WHO hand hygiene guidelines point out that recognition of the importance of hand hygiene varies in different regions and countries, and the goal for hand hygiene interventions is to establish a culture of hand hygiene practice through pragmatic intervention strategies, frequent evaluation, and feedback to healthcare workers.[27] Thus, we prioritized pragmatic strategies to include in our intervention to promote hand hygiene adherence. Another limitation was the date of implementation of the multimodal intervention was slightly different at each facility. It was challenging to implement the intervention simultaneously across institutions due to competing priorities at each facility. Although the primary goal of hand hygiene is to reduce the burden of healthcare‐associated infection, we were unable to measure infection rates at the participating facilities. It is possible the presence of an external observer had an impact on the healthcare workers' behavior.[28] However, the healthcare workers were not informed as to what the observer was monitoring to minimize this potential effect. Lastly, the findings in this study provide immediate intervention effects but further study will be required to determine if these effects are sustainable.
Altering healthcare worker behavior is likely the key element to improve hand hygiene adherence, and behavioral modification may be achieved with the support of leadership at the unit and facility level. However, even though we found significant improvements in healthcare worker hand hygiene adherence after the intervention, the adherence rates are still relatively low compared to reported adherence rates from other countries,[29] suggesting further intervention is needed in this setting to optimize and hygiene practice. Because hand hygiene practice is a crucial strategy to prevent healthcare‐associated infections, every effort should be made to enhance the hand hygiene practice of healthcare workers.
Acknowledgements
The authors thank the International Ann Arbor Safety Collaborative (
Disclosure: Nothing to report.
- . Infection control—a problem for patient safety. N Engl J Med. 2003;348(7):651–656.
- World Health Organization. The burden of health care‐associated infection worldwide: a summary. Available at: http://www.who.int/gpsc/country_work/summary_20100430_en.pdf. Accessed October 6, 2014.
- , , , et al. Estimating health care‐associated infections and deaths in U.S. hospitals, 2002. Public Health Rep. 2007;122(2):160–166.
- . The direct medical costs of healthcare‐associated infections in U.S. hospitals and the benefits of prevention. Atlanta, GA: Centers for Disease Control and Prevention; 2009. Available at: http://www.cdc.gov/HAI/pdfs/hai/Scott_CostPaper.pdf. Accessed April 20, 2015.
- , , . Epidemiological approach to nosocomial infection surveillance data: the Japanese Nosocomial Infection Surveillance System. Environ Health Prev Med. 2008;13(1):30–35.
- , , , et al. Improving healthcare worker hand hygiene adherence before patient contact: a before‐and‐after five‐unit multimodal intervention in Tuscany. Qual Saf Health Care. 2009;18(6):429–433.
- . Economical efficiency of infection control. Antibiot Chemother (Northfield). 2004;20:635–638.
- , , , , , . Surgical site infection: incidence and impact on hospital utilization and treatment costs. Am J Infect Control. 2009;37(5):387–397.
- , , , , , . Hospital‐acquired, laboratory‐confirmed bloodstream infections: linking national surveillance data to clinical and financial hospital data to estimate increased length of stay and healthcare costs. J Hosp Infect. 2010;75(3):158–162.
- . APIC guideline for handwashing and hand antisepsis in health care settings. Am J Infect Control. 1995;23(4):251–269.
- World Health Organization. WHO Guidelines on Hand Hygiene in Health Care. Clean care is safer care: first global patient safety challenge. Geneva, Switzerland; 2009. Available at: http://www.who.int/gpsc/en/index.html. Accessed October 6, 2014.
- , ; Healthcare Infection Control Practices Advisory Committee, HICPAC SHEA APIC IDSA Hand Hygiene Task Force. Guideline for hand hygiene in health‐care settings. Recommendations of the Healthcare Infection Control Practices Advisory Committee and the HICPAC/SHEA/APIC/IDSA Hand Hygiene Task Force. Society for Healthcare Epidemiology of America/Association for Professionals in Infection Control/Infectious Diseases Society of America. MMWR Recomm Rep. 2002;51(RR‐16):1–45.
- National Patient Safety Agency. The economic case: implementing near‐patient alcohol hand rum in your trust. London, United Kingdom; 2004. Available at: http://www.npsa.nhs.uk/cleanyourhands/resource‐area/evidence‐base/?EntryId34=58433. Accessed October 9, 2014.
- , , , et al. Effectiveness of a hospital‐wide programme to improve compliance with hand hygiene. Infection Control Programme. Lancet. 2000;356(9238):1307–1312.
- , . Role of hand hygiene in healthcare‐associated infection prevention. J Hosp Infect. 2009;73(4):305–315.
- , , , et al. Global implementation of WHO's multimodal strategy for improvement of hand hygiene: a quasi‐experimental study. Lancet Infect Dis. 2013;13(10):843–851.
- , , , et al. Impact of the International Nosocomial Infection Control Consortium (INICC) multidimensional hand hygiene approach over 13 years in 51 cities of 19 limited‐resource countries from Latin America, Asia, the Middle East, and Europe. Infect Control Hosp Epidemiol. 2013;34(4):415–423.
- , , , . Bundling hand hygiene interventions and measurement to decrease health care‐associated infections. Am J Infect Control. 2012;40(4 suppl 1):S18–S27.
- , , , et al. Hand hygiene adherence among health care workers at Japanese hospitals: a multicenter observational study in Japan [published online April 8, 2014]. J Patient Saf. doi: 10.1097/PTS.0000000000000108.
- , , , et al. Marked variability in adherence to hand hygiene: a 5‐unit observational study in Tuscany. Am J Infect Control. 2009;37(4):306–310.
- , , , et al. Sustained improvement in hand hygiene adherence: utilizing shared accountability and financial incentives. Infect Control Hosp Epidemiol. 2013;34(11):1129–1136.
- , , , . Status of the implementation of the World Health Organization multimodal hand hygiene strategy in United States of America health care facilities. Am J Infect Control. 2014;42(3):224–230.
- , , , et al. The effect of leadership on hand hygiene: assessing hand hygiene adherence prior to patient contact in 2 infectious disease units in Tuscany. Infect Control Hosp Epidemiol. 2014;35(3):313–316.
- , , , , , . Impact of a hospital‐wide hand hygiene initiative on healthcare‐associated infections: results of an interrupted time series. BMJ Qual Saf. 2012;21(12):1019–1026.
- , , , , , . Health care‐associated infection prevention in Japan: the role of safety culture. Am J Infect Control. 2014;42(8):888–893.
- , , . Why healthcare workers don't wash their hands: a behavioral explanation. Infect Control Hosp Epidemiol. 2006;27(5):484–492.
- World Health Organization. Guide to implementation. A guide to the implementation of the WHO multimodal hand hygiene improvement strategy. Available at: http://whqlibdoc.who.int/hq/2009/WHO_IER_PSP_2009.02_eng.pdf. Accessed October 9, 2014.
- , , , et al. Compliance of health care workers with hand hygiene practices: independent advantages of overt and covert observers. PLoS One. 2013;8(1):e53746.
- , , , et al. Systematic review of studies on compliance with hand hygiene guidelines in hospital care. Infect Control Hosp Epidemiol. 2010;31(3):283–294.
Healthcare‐associated infections are a major cause of illness and death in hospitalized patients, and preventing healthcare‐associated infection is a global challenge.[1] Worldwide, the prevalence of healthcare‐associated infections in developed and undeveloped countries ranges from 5.1% to 11.6% and 5.7% to 19.1%, respectively.[2] In the United States, roughly 2 million such infections occur annually, resulting in approximately 99,000 deaths[3] and estimated annual direct medical costs between $28.4 and $33.8 billion.[4] In Japan, nearly 9% of patients admitted to the intensive care unit (ICU) develop an infection during hospitalization,[5] and 5% of all patients hospitalized become infected with methicillin‐resistant Staphylococcus aureus.[6] The management of healthcare‐associated infections in Japan accounts for up to 5% of total annual healthcare costs, with an estimated $6.8 billion estimated to be potentially preventable.[7] In addition, healthcare‐associated infections are associated with increased length of stay in the hospital. Studies estimate surgical site infections extend length of stay by 9.7 days,[8] and bloodstream infections increase length of stay by 10 days.[9]
Improving hand hygiene practice for healthcare workers is considered a core strategy to decrease the incidence of healthcare‐associated infection.[6, 10] Specifically, the use of alcohol‐based hand rub is strongly recommended in acute care hospitals by both the World Health Organization (WHO) and the US Centers for Disease Control and Prevention.[11, 12] Improving hand hygiene adherence may reduce healthcare‐associated infection by 9% to 50%,[13, 14] and multiple studies have reported that greater use of alcohol‐based hand rubs results in significant reductions in healthcare‐associated infections.[14, 15]
Due to the difficulty in improving hand hygiene in various settings across the world, the WHO strategy for improving hand hygiene has been adopted and implemented by several studies in varying locations, such as Costa Rica, Italy, Mali, Pakistan, and Saudi Arabia.[16] Implementations of these multimodal strategies, following WHObased guidelines, have been shown to increase the level of hand hygiene adherence among healthcare workers and reduce infections at these locations.[14, 17, 18] This study expands upon that work by extending the same implementation strategy to assess the effectiveness of the introduction of alcohol‐based hand rub on hand hygiene practice at multiple hospitals in Japan.
In a previous article[19] we reported results from an observational study assessing healthcare worker hand hygiene adherence before touching the patient in 4 geographically diverse hospitals in Japan. The study reported that hand hygiene adherence in Japanese hospitals was lower than reported mean values from other international studies, and that greater adherence to hand hygiene should be encouraged. In this article, we present the results of a multimodal intervention intended to improve levels of healthcare worker hand hygiene in 3 of these hospitals.
METHODS
Participating Institutions
Three of the 4 hospitals participating in the prior observational study chose to participate in this intervention. Evaluation of hand hygiene practice was performed in at least 3 wards of each hospital including an inpatient surgical ward, an inpatient medicine ward, an ICU, or an emergency ward.
Table 1 lists the characteristics of the participating hospitals. Hospital A is a university‐affiliated, tertiary care medical center with 312 beds in East Japan. Although the hospital did not have an infection prevention unit or designated infection control nurses during the preintervention periods, the hospital hired a designated infection prevention nurse and established a department of infection prevention before this intervention in April 2012. Hospital B is a community‐based, tertiary care medical center with 428 beds, located in Midwest Japan. Although the facility had no infection control nurses at the outset of the study, a physician certified by the American Board of Internal Medicine and Infectious Diseases provided educational sessions of hand hygiene. Hospital B hired a designated infection prevention nurse and established a department of infection prevention in April 2012. Hospital C, located in Northern Japan, is a community‐based, tertiary care medical center with 562 beds. The department of infection prevention was established in 2010 and has 1 full‐time and 2 part‐time infection prevention nurses.
| Hospital A | Hospital B | Hospital C | ||||
|---|---|---|---|---|---|---|
| Preintervention | Postintervention | Preintervention | Postintervention | Preintervention | Postintervention | |
| ||||||
| Hospital characteristics | ||||||
| Location | East Japan | Midwest Japan | Northern Japan | |||
| Hospital type | University affiliated | Community based | Community based | |||
| Level of care | Tertiary care | Tertiary care | Tertiary care | |||
| Residency program | Yes | Yes | Yes | |||
| No. of beds | 250 | 312 | 428 | 428 | 550 | 562 |
| No. of employees | 398 | 475 | 1,035 | 1,263 | 1,500 | 1,568 |
| No. of physicians | 73 | 91 | 179 | 188 | 207 | 217 |
| No. of nurses | 172 | 210 | 410 | 540 | 616 | 800 |
| Infection control practice | ||||||
| Establishment of infection prevention units (year) | N/A | Yes (2012) | N/A | Yes (2012) | Yes (2010) | Yes |
| Employment of certified nurses in infection control (FTE) | 0 | 1 (1) | 0 | 1 (1) | 3 (1.5) | 3 (1.5) |
| Employment of ABIM‐IDcertified physician | 0 | 0 | 1 | 1 | 1 | 0 |
Role of the Funding Source
This study was unfunded. The prize for the contest was provided by an American collaborator (S.S.) who was not affiliated with any of the participating hospitals.
Intervention
In the prior preintervention study, hand hygiene adherence rates of healthcare workers were evaluated between July 2011 and November 2011.[19] To improve hand hygiene adherence in these facilities, we initiated a multimodal intervention based on WHO recommendations and the findings from the prior study. Each facility was provided the same guidance on how to improve hand hygiene adherence (Table 2) and encouraged to tailor the intervention to their local setting. As an added incentive, we initiated a contest, where the facility obtaining the highest hand hygiene adherence postintervention would win a trophy and 500,000 Japanese yen (approximately $5000 US dollars). The recommended strategies consisted of 15 components (Table 2): infrastructure (3 components), training and education (2 components), evaluation and feedback (5 components), reminder in the workplace (1 component), and institution safety climate (4 components). Of note, the participating institutions had already implemented a varying number of the intervention components prior to the start of the intervention. Each facility conducted a 6‐month intervention to improve hand hygiene adherence; however, the actual timing of interventions varied slightly by institution. Hospitals A and C conducted an intervention from October 2012 through March 2013, whereas hospital B's intervention was from April 2012 to September 2012. Details of the multimodal intervention performed at each participating hospital are shown in Table 3.
| Intervention Components | Description |
|---|---|
| 1. Infrastructure (3 components) | |
| Hand‐washing faucets for each room | At least 1 faucet and sink for each room was available. |
| Placement of alcohol hand rub at patient's room entrance | Alcohol hand rub was placed at all patient room entrances. |
| Portable alcohol hand rub distributed for each healthcare worker | Personal, portable alcohol hand rub dispensers were provided for healthcare workers who contact patients. |
| 2. Training/education (2 components) | |
| Educational resources | At least 1 physician or 1 nurse who provides educational sessions regarding hand hygiene practice was available. |
| Periodic seminars and lectures regarding hand hygiene education | Hospital‐wide hand hygiene seminar or educational activities were held during the intervention period. |
| 3. Evaluation and feedback (5 components) | |
| Evaluation of hand hygiene practice by direct observation | Hospitals utilize direct observation for healthcare worker's hand hygiene practice. |
| Evaluation of hand hygiene practice by monitoring the amount of alcohol hand rub consumption | Hospitals utilize the amount of alcohol hand rub consumption as a parameter for healthcare worker's hand hygiene practice. |
| Hand hygiene rate feedback at infection control committee | Hand hygiene adherence rate was reported and discussed at hospital infection control committee. |
| Hand hygiene rate feedback to the designated wards/units | Hand hygiene adherence rate was reported and discussed with healthcare workers at the designated wards/units where hand hygiene observation was performed. |
| Granting the award of top‐rated person of hand hygiene | Hospitals established the system to assess individual healthcare worker's hand hygiene adherence rate. |
| 4. Reminder in the workplace (1 components) | |
| Poster notification | Poster notification for hand hygiene practice was performed in the intervention period. |
| 5. Institutional safety climate (4 components) | |
| Commitment of hospital president or hospital executives | Hospital executives including the president agreed on the importance of hand hygiene practice and declared to healthcare workers to enhance hand hygiene practice during the intervention period. |
| Commitment of nurse managers and physician leaders | Commitment of improving hand hygiene practice by representative healthcare workers at the designated wards/units (eg, meeting by nurse manager or physician leaders at the designated wards/units and collaborative work with infection prevention services). |
| Meeting at the designated wards/units | A ward/unit‐level meeting or voluntary session for hands‐on hand hygiene practice by healthcare workers at the designated wards/units. |
| Identifying champions at the designated wards/units | An individual healthcare worker who contributed to improving hand hygiene practice was appointed. |
| Hospital A | Hospital Ba | Hospital C | ||||
|---|---|---|---|---|---|---|
| ||||||
| Intervention period | October 2012March 2013 | April 2012September 2012 | October 2012March 2013 | |||
| Evaluation of hand hygiene in the postintervention period | May 2013July 2013 | October 2012 | June 2013 | |||
| Suggested intervention components | Preintervention | Postintervention | Preintervention | Postintervention | Preintervention | Postintervention |
| No. of implemented components | 2/15 | 10/15 | 9/15 | 10/15 | 6/15 | 8/15 |
| Infrastructure (3 components) | ||||||
| Hand‐washing faucets for each room | No | No | Yes | Yes | Yes | Yes |
| Placement of alcohol hand rubs at patient's room entrance | Yes | Yes | Yes | Yes | Yes | Yes |
| Portable alcohol hand rub distributed for each healthcare worker | No | Yesb | No | Yesb | No | No |
| Training/education (2 components) | ||||||
| Educational resources | No | Yesb | Yes | Yesb | Yes | Yes |
| Periodic seminars and lectures regarding hand hygiene education | No | Yesb | Yes | Yes | Yes | Yes |
| Evaluation and feedback (5 components) | ||||||
| Evaluation of hand hygiene practice by direct observation | No | Yesb | Yes | Yes | No | No |
| Evaluation of hand hygiene practice by the amount of alcohol hand rub consumption | No | No | Yes | Yes | Yes | Yes |
| Hand hygiene rate feedback at infection control committee | No | Yesb | Yes | Yes | No | Yesb |
| Hand hygiene rate feedback to designated departments | No | Yesb | Yes | Yes | No | Yesb |
| Granting the award of top‐rated person | No | No | No | No | No | No |
| Reminders in the workplace (1 component) | ||||||
| Poster notification | Yes | Yes | Yes | Yes | Yes | Yes |
| 5. Institutional safety climate (4 components) | ||||||
| Commitment of hospital president or hospital executives | No | Yesb | No | No | No | No |
| Commitment of nurse managers and physicians leaders | No | Yesb | No | No | No | No |
| Meeting regarding hand hygiene practice by the designated wards/units | No | No | No | No | No | No |
| Identifying champions at the designated wards/units | No | No | No | No | No | No |
Observation of Hand Hygiene Practice
The same methods for hand hygiene observation used for the preintervention study was used for postintervention assessment. Ten distinct units across the 3 participating hospitals were evaluated for healthcare worker hand hygiene prior to patient contact. Three to 4 units were observed at each facility. One of the study authors (T.S.), a Japanese board‐certified infection control nurse, conducted all of the hand hygiene observations for both the preintervention and postintervention studies. Intraobserver variation was minimized by providing the same training outlined in the previous study.[19] Appropriate hand hygiene was defined as the use of soap and water or alcohol‐based hand rub before patient contact, which corresponds to the first moment of the WHO's 5 moments of hand hygiene.[11]
Hand hygiene practice prior to patient contact for each individual provider‐patient encounter was observed and recorded using the hand hygiene observation form adapted from a previous study by Saint et al.[6, 20] Identical to the preintervention study,[19] the form captured the following information: unit in which observations were performed, time of initiation and completion of observations, healthcare worker subgroup (physician or nurse), and the type of hand hygiene before patient contact (ie, hand washing with soap and water, use of alcohol‐based hand rub, or no hand hygiene). Unit physicians and nurses were informed that their clinical practices were going to be observed, but were not informed of the purpose of the observations (eg, hand hygiene adherence). To avoid interfering with clinical care delivery, the observer was given strict instructions to maintain a certain distance from the observed healthcare workers. The observer was instructed to leave immediately if asked for any reason by the unit staff or patients.
Statistical Analysis
Overall hand hygiene adherence rates were calculated and compared between the pre‐ and the postintervention periods. Comparison of hand hygiene adherence by healthcare worker subgroup and by hospital unit between the pre‐ and postintervention periods was also performed. Hand hygiene adherence rates were compared using JMP 9.0 and SAS 9.3 (SAS Institute Inc., Cary, NC). Comparison of hand hygiene adherence rates by observational periods was calculated by Pearson [2] tests, and 95% confidence intervals (CIs) were estimated using binomial distribution. Pearson correlations were used to determine the relationship of hand hygiene between physicians and nurses in the same unit. Two‐tailed P value0.05 was considered statistically significant. The study protocol was reviewed and approved by the ethics committees at the participating hospitals.
RESULTS
Data were collected from May 2013 to July 2013 in hospital A, in October 2012 in hospital B, and June 2013 in hospital C to ensure data were collected after the 6‐month intervention at each site. A total of 2982 observations of hand hygiene were performed in 10 distinct units across the 3 participating hospitals during the postintervention periods. Hand hygiene observations were performed during the day Monday through Friday between 8:30 am and 7:30 pm, with the majority occurring prior to 1:00 pm.
The overall postintervention hand hygiene adherence rate (in all 3 hospitals) was significantly higher at 32.7% (974/2982) adherence compared to 18.0% (482/2679) adherence in the preintervention period (P<0.001). An increased hand hygiene adherence rate in each participating hospital in the postintervention period was observed (Figure 1). Similar trends of higher overall hand hygiene adherence rates for both nurses and physicians in the postintervention period were seen. Use of alcohol‐based hand rub among those with appropriate hand hygiene was significantly higher, with 90.0% (880/974) using hand rub in the postintervention period versus 67.0% (322/482) in the preintervention period (P<0.001). Comparison of overall hand hygiene adherence rates by unit type and healthcare worker subgroup between the pre‐ and postintervention periods are shown in Table 4. Detailed comparisons of hand hygiene adherence rates for each hospital are available in the supplementary appendix. Although a significant improvement of hand hygiene practice was observed in the majority of participating units (6/10), there was a significant decline in hand hygiene practice in 2 units for nurses and 1 unit for physicians. Hand hygiene adherence rates by healthcare worker subgroups (both physicians and nurses) were significantly higher in the postintervention period than those in the preintervention period. Trends toward higher hand hygiene adherence rate of nurses in the postintervention period were observed (34.8% adherence for nurses compared to 30.4% adherence for physicians); the difference between nurses and physicians were not statistically significant (P=0.07).
| Ward/Unit | Healthcare Worker Subgroup | Preintervention Period | Postintervention Period | Improvement After Intervention (%) | P Value | ||
|---|---|---|---|---|---|---|---|
| No. of Observations | Hand hygiene Adherence (%) | No. of Observations | Hand Hygiene Adherence (%) | ||||
| |||||||
| All 3 hospitals | |||||||
| Surgery | Nurse | 455 | 20 | 480 | 40 | 20 | <0.001 |
| Physician | 424 | 18 | 448 | 43 | 25 | <0.001 | |
| All | 879 | 19 | 928 | 41 | 22 | <0.001 | |
| Medicine | Nurse | 455 | 23 | 508 | 39 | 16 | <0.001 |
| Physician | 435 | 15 | 452 | 33 | 18 | <0.001 | |
| All | 890 | 20 | 960 | 36 | 16 | <0.001 | |
| ICU | Nurse | 305 | 21 | 379 | 25 | 4 | 0.17 |
| Physician | 203 | 9 | 268 | 28 | 19 | <0.001 | |
| All | 508 | 16 | 647 | 26 | 10 | <0.001 | |
| ED | Nurse | 170 | 16 | 173 | 27 | 11 | 0.01 |
| Physician | 232 | 14 | 274 | 9 | ‐5 | 0.07 | |
| All | 402 | 15 | 447 | 16 | 1 | 0.64 | |
| All units | Nurse | 1385 | 21 | 1540 | 35 | 14 | <0.001 |
| Physician | 1294 | 15 | 1442 | 30 | 15 | <0.001 | |
| All | 2679 | 18 | 2982 | 33 | 15 | <0.001 | |
Hospital A achieved the highest postintervention adherence rates (39.9% adherence postintervention), as well as the greatest absolute improvement in hand hygiene (increase of 29.0%). There were significant improvements in 3 of the 4 participating units in hospital A, with the emergency department showing improvements only in the nurse subgroup. In hospital B, total hand hygiene adherence increased from 24.7% to 30.0% (P=0.01); however, this increase was mainly due to increase in hand hygiene adherence rates of nurses. There were significant increases in hand hygiene adherence rates for nurses in the medicine (+11%, P=0.04) and surgery wards (+14%, P=0.01), with nonsignificant increases for physicians (+10% medicine, P=0.07;+2% surgery, P=0.78). However, in the emergency department, nurses showed no significant improvement, and physicians had a significant decrease in adherence (15.7% preintervention vs 7.4% postintervention; P=0.02). In hospital C, total hand hygiene practice rates were significantly improved (from 18.9% to 26.5%; P<0.001); however, this was driven by improvements only in the surgical ward (14.6% preintervention to 42.3% postintervention; P<0.001). The rates for nurses declined significantly in both the medicine and ICU wards, leading to no observed improvements on those wards.
DISCUSSION
Our multicenter intervention study in Japan included observations from almost 3000 encounters between clinicians and patients. Before the intervention, the overall rate of hand hygiene adherence was 18%. After the multimodal intervention, the absolute increase in healthcare worker hand hygiene adherence was 15%. Although there was overall improvement, the adherence rates varied by hospital, with hospital A increasing by 29% and hospital B and C only attaining increases of 5% and 7%, respectively.
Despite the importance of hand hygiene of healthcare workers, it is challenging to increase hand hygiene adherence because it requires behavioral modification. Moreover, it remains uncertain what factors will affect healthcare worker behavior. We implemented pragmatic strategies to evaluate the efficacy of hand hygiene multimodal interventions based on internationally recognized WHO hand hygiene adherence strategies[11] and an institutional‐level contest with financial incentives. The findings in the current study help us understand not only how a multimodal intervention importantly improves hand hygiene adherence, but also what factors potentially make healthcare workers modify their behaviors.
In this study, we evaluated whether an institutional‐level contest with financial incentives contributed to improved hand hygiene adherence of healthcare workers. This study demonstrated improvement of hand hygiene practice after implementation of a multimodal hand hygiene intervention combined with an institutional‐level contest with financial incentives. The contest might have had a modest effect to help motivate the participating hospitals to improve their hand hygiene adherence rate. This is consistent with a previous study that demonstrated financial incentives were associated with modifying healthcare workers' hand hygiene practice.[21] However, we did not strictly standardize how the contest information was distributed in each participating institution and the objective assessment for changes in motivation by the contest was lacking in this study. Thus, changes in motivation by the contest with financial incentives likely varied by each participating institution. Further studies are needed to assess if this type of approach is worth pursuing.
We observed several noteworthy associations between the intervention components that were implemented at each facility and their improvement in hand hygiene adherence. Among the participating hospitals, hospital A was most successful with improving hand hygiene adherence, although all participating hospitals achieved a similar number of the 15 recommended intervention components during the intervention (8 to 10 per hospital). Interestingly, hospital A initiated the most new components during the intervention period (8 new components for a total of 10 out of 15), whereas hospital B and hospital C initiated only 1 or 2 new components during the intervention period. Hospital A also successfully involved hospital executives, and elicited the commitment of a nurse manager and physician leader. Consistent with a previous study,[22] we believe that involvement of hospital executives appears to be important to increase overall hand hygiene rate among healthcare workers.
In contrast, hospitals B and C did not involve senior executives or identify nurse or physician champions for all participating units. Based on the results in this study, we believe that the involvement of hospital executives is likely a key for the penetration of hospital‐wide hand hygiene culture among healthcare workers.
Although this study was unable to determine which components are precisely associated with improving hand hygiene adherence, the findings suggest initiating multiple intervention components at the same time may provide more motivation for change than initiating only 1 or 2 components at a time. It is also possible that certain intervention components were more beneficial than others. For example, hospital A, which achieved the most success, was the only hospital to obtain leadership support. Other studies have demonstrated that the presence of leadership appeared to play a key role in improving hand hygiene adherence.[23, 24] Moreover, a recent Japanese nationwide survey demonstrated higher safety centeredness was associated with regular use of standard infection prevention practice.[25] Consistent with a previous study, improving hand hygiene adherence cannot be simply achieved by improving infrastructure (eg, introduction of portable alcohol‐based hand rub) alone, but it depends on altering healthcare worker behavior.[26]
This study has several limitations. Because participating hospitals could tailor the specific interventions chosen for their facility, the improvement in hand hygiene adherence was likely multifactorial. We are unable in the existing study to determine a direct causal relationship between any of the individual intervention components and hand hygiene adherence. We are also unable to determine whether the improvements seen in hospital A were due to participation in the contest or due to the specific intervention components that were implemented. However, WHO hand hygiene guidelines point out that recognition of the importance of hand hygiene varies in different regions and countries, and the goal for hand hygiene interventions is to establish a culture of hand hygiene practice through pragmatic intervention strategies, frequent evaluation, and feedback to healthcare workers.[27] Thus, we prioritized pragmatic strategies to include in our intervention to promote hand hygiene adherence. Another limitation was the date of implementation of the multimodal intervention was slightly different at each facility. It was challenging to implement the intervention simultaneously across institutions due to competing priorities at each facility. Although the primary goal of hand hygiene is to reduce the burden of healthcare‐associated infection, we were unable to measure infection rates at the participating facilities. It is possible the presence of an external observer had an impact on the healthcare workers' behavior.[28] However, the healthcare workers were not informed as to what the observer was monitoring to minimize this potential effect. Lastly, the findings in this study provide immediate intervention effects but further study will be required to determine if these effects are sustainable.
Altering healthcare worker behavior is likely the key element to improve hand hygiene adherence, and behavioral modification may be achieved with the support of leadership at the unit and facility level. However, even though we found significant improvements in healthcare worker hand hygiene adherence after the intervention, the adherence rates are still relatively low compared to reported adherence rates from other countries,[29] suggesting further intervention is needed in this setting to optimize and hygiene practice. Because hand hygiene practice is a crucial strategy to prevent healthcare‐associated infections, every effort should be made to enhance the hand hygiene practice of healthcare workers.
Acknowledgements
The authors thank the International Ann Arbor Safety Collaborative (
Disclosure: Nothing to report.
- . Infection control—a problem for patient safety. N Engl J Med. 2003;348(7):651–656.
- World Health Organization. The burden of health care‐associated infection worldwide: a summary. Available at: http://www.who.int/gpsc/country_work/summary_20100430_en.pdf. Accessed October 6, 2014.
- , , , et al. Estimating health care‐associated infections and deaths in U.S. hospitals, 2002. Public Health Rep. 2007;122(2):160–166.
- . The direct medical costs of healthcare‐associated infections in U.S. hospitals and the benefits of prevention. Atlanta, GA: Centers for Disease Control and Prevention; 2009. Available at: http://www.cdc.gov/HAI/pdfs/hai/Scott_CostPaper.pdf. Accessed April 20, 2015.
- , , . Epidemiological approach to nosocomial infection surveillance data: the Japanese Nosocomial Infection Surveillance System. Environ Health Prev Med. 2008;13(1):30–35.
- , , , et al. Improving healthcare worker hand hygiene adherence before patient contact: a before‐and‐after five‐unit multimodal intervention in Tuscany. Qual Saf Health Care. 2009;18(6):429–433.
- . Economical efficiency of infection control. Antibiot Chemother (Northfield). 2004;20:635–638.
- , , , , , . Surgical site infection: incidence and impact on hospital utilization and treatment costs. Am J Infect Control. 2009;37(5):387–397.
- , , , , , . Hospital‐acquired, laboratory‐confirmed bloodstream infections: linking national surveillance data to clinical and financial hospital data to estimate increased length of stay and healthcare costs. J Hosp Infect. 2010;75(3):158–162.
- . APIC guideline for handwashing and hand antisepsis in health care settings. Am J Infect Control. 1995;23(4):251–269.
- World Health Organization. WHO Guidelines on Hand Hygiene in Health Care. Clean care is safer care: first global patient safety challenge. Geneva, Switzerland; 2009. Available at: http://www.who.int/gpsc/en/index.html. Accessed October 6, 2014.
- , ; Healthcare Infection Control Practices Advisory Committee, HICPAC SHEA APIC IDSA Hand Hygiene Task Force. Guideline for hand hygiene in health‐care settings. Recommendations of the Healthcare Infection Control Practices Advisory Committee and the HICPAC/SHEA/APIC/IDSA Hand Hygiene Task Force. Society for Healthcare Epidemiology of America/Association for Professionals in Infection Control/Infectious Diseases Society of America. MMWR Recomm Rep. 2002;51(RR‐16):1–45.
- National Patient Safety Agency. The economic case: implementing near‐patient alcohol hand rum in your trust. London, United Kingdom; 2004. Available at: http://www.npsa.nhs.uk/cleanyourhands/resource‐area/evidence‐base/?EntryId34=58433. Accessed October 9, 2014.
- , , , et al. Effectiveness of a hospital‐wide programme to improve compliance with hand hygiene. Infection Control Programme. Lancet. 2000;356(9238):1307–1312.
- , . Role of hand hygiene in healthcare‐associated infection prevention. J Hosp Infect. 2009;73(4):305–315.
- , , , et al. Global implementation of WHO's multimodal strategy for improvement of hand hygiene: a quasi‐experimental study. Lancet Infect Dis. 2013;13(10):843–851.
- , , , et al. Impact of the International Nosocomial Infection Control Consortium (INICC) multidimensional hand hygiene approach over 13 years in 51 cities of 19 limited‐resource countries from Latin America, Asia, the Middle East, and Europe. Infect Control Hosp Epidemiol. 2013;34(4):415–423.
- , , , . Bundling hand hygiene interventions and measurement to decrease health care‐associated infections. Am J Infect Control. 2012;40(4 suppl 1):S18–S27.
- , , , et al. Hand hygiene adherence among health care workers at Japanese hospitals: a multicenter observational study in Japan [published online April 8, 2014]. J Patient Saf. doi: 10.1097/PTS.0000000000000108.
- , , , et al. Marked variability in adherence to hand hygiene: a 5‐unit observational study in Tuscany. Am J Infect Control. 2009;37(4):306–310.
- , , , et al. Sustained improvement in hand hygiene adherence: utilizing shared accountability and financial incentives. Infect Control Hosp Epidemiol. 2013;34(11):1129–1136.
- , , , . Status of the implementation of the World Health Organization multimodal hand hygiene strategy in United States of America health care facilities. Am J Infect Control. 2014;42(3):224–230.
- , , , et al. The effect of leadership on hand hygiene: assessing hand hygiene adherence prior to patient contact in 2 infectious disease units in Tuscany. Infect Control Hosp Epidemiol. 2014;35(3):313–316.
- , , , , , . Impact of a hospital‐wide hand hygiene initiative on healthcare‐associated infections: results of an interrupted time series. BMJ Qual Saf. 2012;21(12):1019–1026.
- , , , , , . Health care‐associated infection prevention in Japan: the role of safety culture. Am J Infect Control. 2014;42(8):888–893.
- , , . Why healthcare workers don't wash their hands: a behavioral explanation. Infect Control Hosp Epidemiol. 2006;27(5):484–492.
- World Health Organization. Guide to implementation. A guide to the implementation of the WHO multimodal hand hygiene improvement strategy. Available at: http://whqlibdoc.who.int/hq/2009/WHO_IER_PSP_2009.02_eng.pdf. Accessed October 9, 2014.
- , , , et al. Compliance of health care workers with hand hygiene practices: independent advantages of overt and covert observers. PLoS One. 2013;8(1):e53746.
- , , , et al. Systematic review of studies on compliance with hand hygiene guidelines in hospital care. Infect Control Hosp Epidemiol. 2010;31(3):283–294.
© 2015 Society of Hospital Medicine
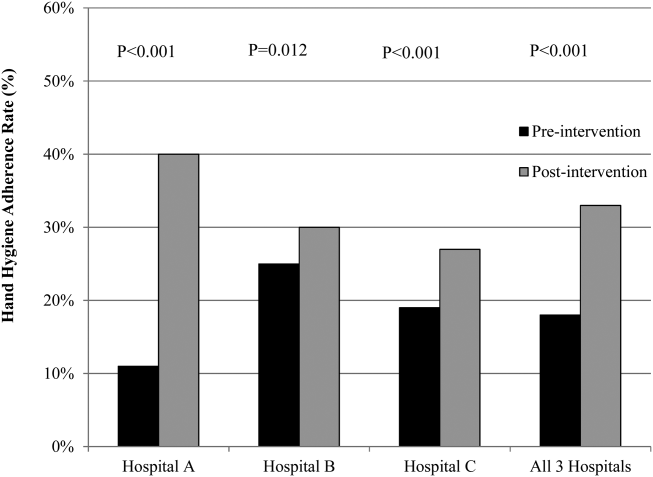
A3 to Improve STAT
STAT is an abbreviation of the Latin word statim, meaning immediately,[1] and has been a part of healthcare's lexicon for almost as long as there have been hospitals. STAT conveys a sense of urgency, compelling those who hear STAT to act quickly. Unfortunately, given the lack of a consistent understanding of STAT, the term in reality often has an alternate use: to hurry up or to complete sooner than routine, and is sometimes used to circumvent a system that is perceived to be too slow to accomplish a routine task in a timely manner.
As part of a larger systems redesign effort to improve patient safety and quality of care, an institutional review board (IRB)‐approved qualitative study was conducted on 2 medical‐surgical units in a US Department of Veterans Affairs (VA) hospital to explore communication patterns between physicians and nurses.[2] The study revealed wide variation in understanding between physicians and nurses on the ordering and administration of STAT medication. Physicians were unaware that when they placed a STAT order into the computerized patient record system (CPRS), nurses were not automatically alerted about the order. At this facility, nurses did not carry pagers. Although each unit had a supply of wireless telephones, they were often unreliable and therefore not used consistently. Nurses were required by policy to check the CPRS for new orders every 2 hours. This was an inefficient and possibly dangerous process,[3] because if a nurse was not expecting a STAT order, 2 hours could elapse before she or he saw the order in the CPRS and began to look for the medication. A follow‐up survey completed by physicians, nurses, pharmacists, and pharmacy technicians demonstrated stark differences on the definition of STAT and overlap with similar terms such as NOW and ASAP. Interviews with ordering providers indicated that 36% of the time a STAT was ordered it was not clinically urgent, but instead ordered STAT to speed up the process.
The STAT medication process was clearly in need of improvement, but previous quality improvement projects in our organization had varying degrees of success. For example, we used Lean methodology in an attempt to improve our discharge process. We conducted a modified rapid process discharge improvement workshop[4] structured in phases over 4 weeks. During the workshops, a strong emphasis remained on the solutions to the problem, and we were unable to help the team move from a mindset of fix it to create it. This limited the buy‐in of team members, the creativity of their ideas for improvement, and ultimately the momentum to improve the process.
In this article we describe our adaptation of A3 Thinking,[5, 6] a structure for guiding quality improvement based in Lean methodology, to improve the STAT medication process. We chose A3 Thinking for several reasons. A3 Thinking focuses on process improvement and thus aligned well with our interest in improving the STAT medication process. A3 Thinking also reveals otherwise hidden nonvalue‐added activities that should be eliminated.[7] Finally A3 Thinking reinforces a deeper understanding of the way the work is currently being done, providing critical information needed before making a change. This provides a tremendous opportunity to look at work differently and see opportunities for improvement.[8] Given these strengths as well as the lack of congruence between what the STAT process should consist of and how the STAT process was actually being used in our organization, A3 Thinking offered the best fit between an improvement process and the problem to be solved.
METHODS
A search of healthcare literature yielded very few studies on the STAT process.[9, 10] Only 1 intervention to improve the process was found, and this focused on a specific procedure.[10] An informal survey of local VA and non‐VA hospitals regarding their experiences with the STAT medication process revealed insufficient information to aid our efforts. We next searched the business and manufacturing literature and found examples of how the Lean methodology was successfully applied to other problems in healthcare, including improving pediatric surgery workflow and decreasing ventilator‐associated pneumonia.[11, 12]
Therefore, the STAT project was structured to adapt a problem‐solving process commonly used in Lean organizationsA3 Thinkingwhich challenges team members to work through a discovery phase to develop a shared understanding of the process, an envisioning phase to conceptualize an ideal process experience, and finally an experimentation phase to identify and trial possible solutions through prioritization, iterative testing, structured reflection, and adjustment on resulting changes. Our application of the term experimentation in this context is distinct from that of controlled experimentation in clinical research; the term is intended to convey iterative learning as changes are tested, evaluated, and modified during this quality improvement project. Figure 1 displays a conceptual model of our adaptation of A3 Thinking. As this was a quality‐improvement project, it was exempt from IRB review.

DISCOVERY
To begin the discovery phase, a workgroup consisting of representatives of all groups that had a role in the STAT process (ie, physician, pharmacist, nurse, pharmacy technician, clerk) gathered to identify the opportunity we are looking to address and learn from each other's individual experiences with the STAT medication process. The group was facilitated by an industrial engineer familiar with the A3 Thinking process. The team completed a mapping exercise to lay out, step‐by‐step, the current STAT medication process. This activity allowed the team to build shared empathy with others' experiences and to appreciate the challenges experienced by others through their individual responsibilities in the process. The current process was found to consist of 4 overarching components: a provider entered the STAT order into the CPRS; the order was verified by a pharmacist; a pharmacy technician delivered the medication to the unit (or a nurse retrieved the medication from the Omnicell (Omnicell Inc., Mountain View, CA), a proprietary automated medication dispensing system); and finally the nurse administered the medication to a patient.
A large, color‐coded flow map of the STAT medication process was constructed over several meetings to capture all perspectives and allow team members to gather feedback from their peers. To further our understanding of the current process, the team participated in a modified Go to the Gemba (ie, go to where the work is done)[13] on a real‐time STAT order. Once all workgroup members were satisfied that the flow map represented the current state of the STAT medication process, we came to a consensus on the goals needed to meet our main objective.
We agreed that our main objective was that STAT medication orders should be recognized, verified, and administered to patients in a timely and appropriate manner to ensure quality care. We identified 3 goals to meet this objective: (1) STAT should be consistently defined and understood by everyone; (2) an easy, intuitive STAT process should be available for all stakeholders; and (3) the STAT process should be transparent and ideally visual so that everyone involved can understand at which point in the process a specific STAT order is currently situated. We also identified additional information we would need to reach the goals.
Shortly after the process‐mapping sessions, 2 workgroup members conducted real‐time STAT order time studies to track medications from order to administration. Three time periods in the STAT process were identified for observation and measurement: the time from physician order entry in the CPRS to the time a pharmacist verified the medication, the time from verification to when the medication arrived on the nursing unit, and the time from arrival on the nursing unit to when that medication was administered. Using a data‐collection template, each time period was recorded, and 28 time studies were collected over 1 month. To monitor the progress of our initiatives, the time study was repeated 3 months into the project.
ENVISIONING
Following the discovery phase, the team was better equipped to identify the specific changes needed to achieve an improved process. The envisioning phase allowed the team freedom to imagine an ideal process barring any preconceived notion of constraints within the current process.
In 2 meetings we brainstormed as many improvement ideas as possible. To prioritize and focus our ideas, we developed a matrix (see Supporting Information, Appendix A, in the online version of this article), placing our ideas in 1 of 4 quadrants based on the anticipated effort to implement the change (x‐axis) and impact of making the change (y‐axis). The matrix helped us see that some ideas would be relatively simple to implement (eg, color‐coded bags for STAT medication delivery), whereas others would require more sophisticated efforts and involvement of other people (eg, monthly education sessions to resident physicians).
EXPERIMENTING
Experiments were conducted to meet each of the 3 goals identified above. The team used the outcomes of the prioritization exercise to identify initial experiments to test. To build momentum by showing progress and improvement with a few quick wins, the team began with low‐effort/high‐impact opportunities. Each experiment followed a standard Plan‐Do‐Study‐Act (PDSA) cycle to encourage reflection, learning, adaptation, and adjustment as a result of the experiential learning process.[5]
Goal 1: STAT Should Be Consistently Defined and Understood by Everyone
To address the first goal, a subgroup collected policies and procedures related to the STAT medication administration process. The policy defined a STAT medication as a medication that has the potential to significantly and negatively impact a patient's clinical condition if not given within 30 minutes. The group found that the policy requiring a 30‐minute time to administration was clinically appropriate, reinforcing our goals to create a practice congruent with the policy.
A subgroup led by the pharmacy department collected data related to STAT medications on the 3 medical‐surgical units. Within 1 month, 550 STAT medications were ordered, consisting of medications ranging from furosemide to nicotine lozenges, the latter being a medication clearly outside of the policy definition of STAT. The workgroup reviewed the information and realized education would be required to align practice with policy. According to our matrix, education was a high‐impact/high‐effort activity, so efforts were focused on the high‐impact/low‐effort activities initially. We addressed educational opportunities in later PDSA cycles.
Goal 2: An Easy, Intuitive STAT Process for All Stakeholders
The CPRS contains prefabricated templates that conform to regulatory requirements and ensure completeness. However, the CPRS does not intuitively enable ordering providers to choose the time for the first dose of a new routine medication. This often creates a situation where a provider orders the medication STAT, so that the medication can be given earlier than the CPRS would otherwise allow. Although there is a check box, Give additional dose now, it was not being used because it was visually obscure in the interface. The CPRS restricted our ability to change the template for ordering medications to include a specific time for first‐dose administration before defaulting to the routine order; thus, complementary countermeasures were trialed first. These are outlined in Table 1.
| Countermeasure | Intended Outcome |
|---|---|
| Remove duplicate dosing frequencies from medication order template | Reduce list of dosing frequencies to sort through to find desired selection |
| Develop 1‐page job aid for ordering providers to utilize | Assist in the correct methods of ordering STAT, NOW, and routine medications |
| Added STAT ONCE as a dosing frequency selection | Clarify the medication, if ordered STAT, will only be a 1‐time administration to avoid the recurrence of a STAT order should the orders be transferred to a new unit with the patient |
| Modify existing policies to add STAT ONCE option | Ensure documentation is congruent with new expectations |
| Educate interns and residents with the job aid and a hands‐on how to ordering exercise | Inform ordering physicians on the available references for ordering and educate according to desired practice |
| Provide interns and residents with a visual job aid at their workstation and a hands‐on how to ordering exercise | In addition to providing information and educating according to desired practice, provide a just‐in‐time reference resource |
Goal 3: The STAT Process Should Be Transparent and Ideally Visual
During the time studies, the time period from when the medication arrived on the unit to the time it was administered to the patient averaged 34 minutes. Of 28 STAT orders followed through the entire process, 5 pharmacy technicians (26%) were not informed of 19 STAT medication orders requiring delivery, and 12 nurses (63%) were not notified of the delivery of those 19 medications. The remaining 9 STAT medications were stocked in the Omnicell. Informal interviews with nurses and pharmacy technicians, as well as input from the nurses and pharmacy technicians in our workgroup, revealed several explanations for these findings.
First, the delivering technicians could not always find the patient's nurse, and because the delivery procedure was not standardized, there was no consistency between technicians in where medications were delivered. Second, each unit had a different medication inventory stored in the Omnicell, and the inventory was frequently changed (eg, due to unit‐specific needs, backorders), which made it difficult for nurses to keep track of what was available in Omnicell at any given time. Finally, the STAT medication was not consistently labeled with a visual STAT notation, so even if a nurse saw that new medications had been delivered, he or she would not be able to easily identify which was STAT. The team made several low‐tech process changes to improve the visibility of a STAT medication and ensure reliable communication upon delivery. A subgroup of pharmacists, technicians, and nurses developed and implemented the countermeasures described in Table 2.
| Countermeasure | Intended Outcome |
|---|---|
| Designate delivery preferences with the patient's nurse as the first preference and a set location in the med room as the only alternative preference | Attempt to deliver medications directly to the patient's nurse as frequently as possible to eliminate any unnecessary delays and avoid miscommunication |
| Identify a location in each unit's med room to place a red bin to deliver the STAT medications that are unable to be delivered to the patient's nurse directly | Provide 1 alternate location to retrieve STAT medications if the technician is unable to locate the patient's nurse to deliver the medication directly |
| Utilize a plastic bag with a red STAT indication for transportation of STAT medications to the units | Provide a visual to assist in pharmacy technicians prioritizing their deliveries to the inpatient units |
| Utilize red STAT magnets on the patient's door frame to signal nurses a medication had been delivered to the med room | Provide a visual to assist in timely recognition of a STAT medication delivery given the technician was unable to find the nurse to hand it off directly |
RESULTS
At the start of our project, the average time from STAT order to medication administration was 1 hour and 7 minutes (range, 6 minutes 2 hours and 22 minutes). As a result of the 2 sets of countermeasures outlined in Tables 1 and 2, the average total time from STAT order entry to administration decreased by 21% to an average of 53 minutes. The total time from medication delivery to administration decreased by 26% from 34 minutes to 25 minutes postimplementation. On average, 391 STAT medications were ordered per month during the project period, which represents a decrease of 9.5% from the 432 orders per month for the same time period the previous year. After implementing the countermeasures in Table 2, we followed another 26 STAT medications through the process to evaluate our efforts. Of 15 STAT medications requiring delivery, only 1 nurse (7%) was not notified of the delivery of a STAT medication, and 1 pharmacy technician (7%) was not informed the medication was STAT. The 151% increase in notification of nurses to delivery of a STAT medication suggests that use of the STAT bags, STAT magnets on patient doors, and whenever possible direct delivery of STAT medications to the nurse has improved communication between the technicians and nurses. Similarly, the 27% increase in technician awareness of a STAT designation suggests STAT is being better communicated to them. The improvement in awareness and notification of a STAT medication is summarized in Figure 2.
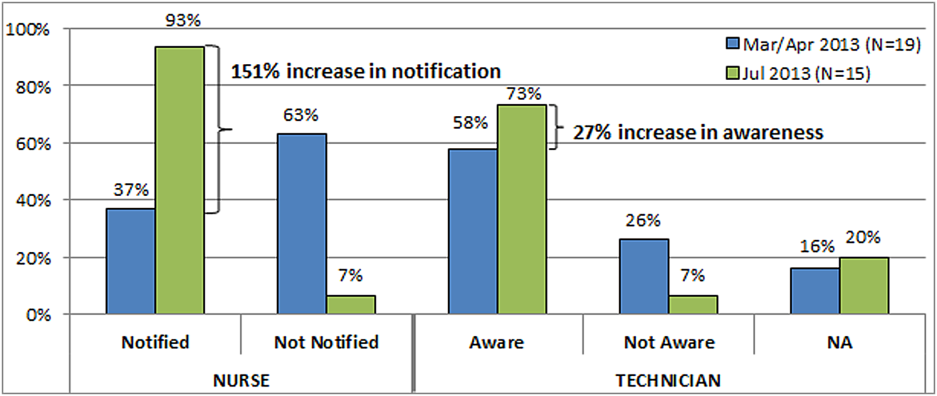
Due to time and financial constraints, the following limitations may have affected our findings. First, resident physicians were not directly represented in our discussions. Attending medicine hospitalists provided the physician perspective, which provides a biased view given their intimate knowledge of the CPRS and additional years of experience. Similarly, nurse perspectives were limited to staff and clinical nurse leaders. Last, our low‐cost approach was mandated by limited resources; a more resource‐rich environment may have devised alternative approaches.
CONCLUSIONS
Adapting A3 Thinking for process improvement was a low‐cost/low‐tech option for a VA facility. Having buy‐in from all levels was crucial to the success of the project. The size and diversity of the group was also very important, as different opinions and aspects of the process were represented. Cross‐discipline relationships and respect were formed, which will be valuable for collaboration in future projects. Although we focused on the STAT medication process, other quality‐improvement projects could also benefit from A3 Thinking. Moreover, there were enough people to serve as ambassadors, taking the project back to their work areas to share with their peers, gather consensus, and elicit additional feedback. The collaboration led to comprehensive understanding of the process, the nature of the problems within the process, and the complexity of solving the problem. For example, although the number of STAT orders did not decrease dramatically, we have learned from these experiments that we may need to change how we approach structuring additional experiments. Future work will focus on increasing communication between physicians and nurses when placing STAT medication orders, enhancing resident education to ensure appropriate use of the STAT designation, and continuing our efforts to improve the delivery process of STAT medications.
Other quality‐improvement methodologies we could have used include: total quality management (TQM), continuous quality improvement (CQI), business process redesign, Lean, Six Sigma, and others.[14] Differences between these can be broadly classified as putting an emphasis on people (eg, inclusion of front line staff in CQI or leadership in TQM) or on process (eg, understanding process function to reduce waste in Lean or statistical process control in Six Sigma).[14] Using A3 Thinking methodology was more useful than these others for the STAT medication process for some very important reasons. The A3 process not only led to a better understanding of the meaning of STAT across disciplines, increasing the intuitive nature, transparency and visual aspects of the whole process, but also promoted a collaborative, multidisciplinary, integrative culture, in which other hospital‐wide problems may be addressed in the future.
Acknowledgements
This work could not have been done without the contribution of all members of the STAT Improvement Workgroup, including Charles Alday; Allison Brenner, PharmD; Paula Carroll; Garry Davis; Michele Delaney, RN, MSN, CWCN; Mary East, MD; Stacy Frick, MSN, RN, CNL; Corry Gessner, CPhT; Kenya Harbin, MSN, RN, CNL; Crystal Heath, MS, RN‐BC; Tom Kerr, MPH; Diane Klemer, RPh; Diane Kohmescher, PharmD, BCPS; Sara Oberdick; Antanita Pickett; Ana Preda, CPhT; Joseph Pugh, RPh, MS; Gloria Salazar, CPhT; Samar Sheth, MD; Andrea Starnes, RN; Christine Wagner, PharmD; Leo Wallace; Roderick Williams; and Marilyn Woodruff.
Disclosures: This work was funded by a US Department of Veterans Affairs, Office of Systems Redesign Improvement Capability Grant and the Veterans in Partnership (VISN11) Healthcare Network. The findings and conclusions in this report are those of the authors and do not necessarily represent the position or policy of the US Department of Veterans Affairs. The authors have no other disclosures or conflicts to report.
- The American Heritage Medical Dictionary of the English Language website. 2011. Available at: http://ahdictionary.com/word/search.html?q=STAT. Accessed December 22, 2013.
- , , , , , . The use of multiple qualitative methods to characterize communication events between physicians and nurses [published online ahead of print January 31, 2014]. Health Commun. doi: 10.1080/10410236.2013.835894.
- , , . Fifteen best practice recommendations for bar‐code medication administration in the Veterans Health Administration. Jt Comm J Qual Saf. 2004;30(7):355–365.
- , , , , . Going lean in health care. Cambridge, MA: Institute for Healthcare Improvement; 2005. Available at: http://www.ihi.org. Accessed March 19, 2014.
- , . Understanding A3 Thinking: A Critical Component of Toyota's PDCA Management System. New York, NY: Productivity Press, Taylor 2008.
- . Managing to Learn: Using the A3 Management Process to Solve Problems, Gain Agreement, Mentor and Lead. Cambridge, MA: Lean Enterprise Institute; 2008.
- , , . Basics of quality improvement in health care. Mayo Clin Proc. 2007;82(6):735–739.
- , . A3 problem solving: unique features of the A3 problem solving method. Available at: http://leanhealthcarewest.com/Page/A3‐Problem‐Solving. Accessed March 27, 2014.
- , , . Evaluation of stat orders in a teaching hospital: a chart review. Clin Drug Investig. 2011;31(4):231–235.
- . Using STAT properly. Radiol Manage. 2006;28(1):26–30; quiz 31–33.
- , . The promise of Lean in health care. Mayo Clin Proc. 2013;88(1):74–82.
- , , , . Lean health care: what can hospitals learn from a world‐class automaker? J Hosp Med. 2006;1(3):191–199.
- . Gemba Kaizen: A Commonsense Approach to a Continuous Improvement Strategy. 2nd ed. New York, NY: McGraw‐Hill; 2012.
- . Pseudoinnovation: the development and spread of healthcare quality improvement methodologies. Int J Qual Health Care. 2009;21(3):153–159.
STAT is an abbreviation of the Latin word statim, meaning immediately,[1] and has been a part of healthcare's lexicon for almost as long as there have been hospitals. STAT conveys a sense of urgency, compelling those who hear STAT to act quickly. Unfortunately, given the lack of a consistent understanding of STAT, the term in reality often has an alternate use: to hurry up or to complete sooner than routine, and is sometimes used to circumvent a system that is perceived to be too slow to accomplish a routine task in a timely manner.
As part of a larger systems redesign effort to improve patient safety and quality of care, an institutional review board (IRB)‐approved qualitative study was conducted on 2 medical‐surgical units in a US Department of Veterans Affairs (VA) hospital to explore communication patterns between physicians and nurses.[2] The study revealed wide variation in understanding between physicians and nurses on the ordering and administration of STAT medication. Physicians were unaware that when they placed a STAT order into the computerized patient record system (CPRS), nurses were not automatically alerted about the order. At this facility, nurses did not carry pagers. Although each unit had a supply of wireless telephones, they were often unreliable and therefore not used consistently. Nurses were required by policy to check the CPRS for new orders every 2 hours. This was an inefficient and possibly dangerous process,[3] because if a nurse was not expecting a STAT order, 2 hours could elapse before she or he saw the order in the CPRS and began to look for the medication. A follow‐up survey completed by physicians, nurses, pharmacists, and pharmacy technicians demonstrated stark differences on the definition of STAT and overlap with similar terms such as NOW and ASAP. Interviews with ordering providers indicated that 36% of the time a STAT was ordered it was not clinically urgent, but instead ordered STAT to speed up the process.
The STAT medication process was clearly in need of improvement, but previous quality improvement projects in our organization had varying degrees of success. For example, we used Lean methodology in an attempt to improve our discharge process. We conducted a modified rapid process discharge improvement workshop[4] structured in phases over 4 weeks. During the workshops, a strong emphasis remained on the solutions to the problem, and we were unable to help the team move from a mindset of fix it to create it. This limited the buy‐in of team members, the creativity of their ideas for improvement, and ultimately the momentum to improve the process.
In this article we describe our adaptation of A3 Thinking,[5, 6] a structure for guiding quality improvement based in Lean methodology, to improve the STAT medication process. We chose A3 Thinking for several reasons. A3 Thinking focuses on process improvement and thus aligned well with our interest in improving the STAT medication process. A3 Thinking also reveals otherwise hidden nonvalue‐added activities that should be eliminated.[7] Finally A3 Thinking reinforces a deeper understanding of the way the work is currently being done, providing critical information needed before making a change. This provides a tremendous opportunity to look at work differently and see opportunities for improvement.[8] Given these strengths as well as the lack of congruence between what the STAT process should consist of and how the STAT process was actually being used in our organization, A3 Thinking offered the best fit between an improvement process and the problem to be solved.
METHODS
A search of healthcare literature yielded very few studies on the STAT process.[9, 10] Only 1 intervention to improve the process was found, and this focused on a specific procedure.[10] An informal survey of local VA and non‐VA hospitals regarding their experiences with the STAT medication process revealed insufficient information to aid our efforts. We next searched the business and manufacturing literature and found examples of how the Lean methodology was successfully applied to other problems in healthcare, including improving pediatric surgery workflow and decreasing ventilator‐associated pneumonia.[11, 12]
Therefore, the STAT project was structured to adapt a problem‐solving process commonly used in Lean organizationsA3 Thinkingwhich challenges team members to work through a discovery phase to develop a shared understanding of the process, an envisioning phase to conceptualize an ideal process experience, and finally an experimentation phase to identify and trial possible solutions through prioritization, iterative testing, structured reflection, and adjustment on resulting changes. Our application of the term experimentation in this context is distinct from that of controlled experimentation in clinical research; the term is intended to convey iterative learning as changes are tested, evaluated, and modified during this quality improvement project. Figure 1 displays a conceptual model of our adaptation of A3 Thinking. As this was a quality‐improvement project, it was exempt from IRB review.
DISCOVERY
To begin the discovery phase, a workgroup consisting of representatives of all groups that had a role in the STAT process (ie, physician, pharmacist, nurse, pharmacy technician, clerk) gathered to identify the opportunity we are looking to address and learn from each other's individual experiences with the STAT medication process. The group was facilitated by an industrial engineer familiar with the A3 Thinking process. The team completed a mapping exercise to lay out, step‐by‐step, the current STAT medication process. This activity allowed the team to build shared empathy with others' experiences and to appreciate the challenges experienced by others through their individual responsibilities in the process. The current process was found to consist of 4 overarching components: a provider entered the STAT order into the CPRS; the order was verified by a pharmacist; a pharmacy technician delivered the medication to the unit (or a nurse retrieved the medication from the Omnicell (Omnicell Inc., Mountain View, CA), a proprietary automated medication dispensing system); and finally the nurse administered the medication to a patient.
A large, color‐coded flow map of the STAT medication process was constructed over several meetings to capture all perspectives and allow team members to gather feedback from their peers. To further our understanding of the current process, the team participated in a modified Go to the Gemba (ie, go to where the work is done)[13] on a real‐time STAT order. Once all workgroup members were satisfied that the flow map represented the current state of the STAT medication process, we came to a consensus on the goals needed to meet our main objective.
We agreed that our main objective was that STAT medication orders should be recognized, verified, and administered to patients in a timely and appropriate manner to ensure quality care. We identified 3 goals to meet this objective: (1) STAT should be consistently defined and understood by everyone; (2) an easy, intuitive STAT process should be available for all stakeholders; and (3) the STAT process should be transparent and ideally visual so that everyone involved can understand at which point in the process a specific STAT order is currently situated. We also identified additional information we would need to reach the goals.
Shortly after the process‐mapping sessions, 2 workgroup members conducted real‐time STAT order time studies to track medications from order to administration. Three time periods in the STAT process were identified for observation and measurement: the time from physician order entry in the CPRS to the time a pharmacist verified the medication, the time from verification to when the medication arrived on the nursing unit, and the time from arrival on the nursing unit to when that medication was administered. Using a data‐collection template, each time period was recorded, and 28 time studies were collected over 1 month. To monitor the progress of our initiatives, the time study was repeated 3 months into the project.
ENVISIONING
Following the discovery phase, the team was better equipped to identify the specific changes needed to achieve an improved process. The envisioning phase allowed the team freedom to imagine an ideal process barring any preconceived notion of constraints within the current process.
In 2 meetings we brainstormed as many improvement ideas as possible. To prioritize and focus our ideas, we developed a matrix (see Supporting Information, Appendix A, in the online version of this article), placing our ideas in 1 of 4 quadrants based on the anticipated effort to implement the change (x‐axis) and impact of making the change (y‐axis). The matrix helped us see that some ideas would be relatively simple to implement (eg, color‐coded bags for STAT medication delivery), whereas others would require more sophisticated efforts and involvement of other people (eg, monthly education sessions to resident physicians).
EXPERIMENTING
Experiments were conducted to meet each of the 3 goals identified above. The team used the outcomes of the prioritization exercise to identify initial experiments to test. To build momentum by showing progress and improvement with a few quick wins, the team began with low‐effort/high‐impact opportunities. Each experiment followed a standard Plan‐Do‐Study‐Act (PDSA) cycle to encourage reflection, learning, adaptation, and adjustment as a result of the experiential learning process.[5]
Goal 1: STAT Should Be Consistently Defined and Understood by Everyone
To address the first goal, a subgroup collected policies and procedures related to the STAT medication administration process. The policy defined a STAT medication as a medication that has the potential to significantly and negatively impact a patient's clinical condition if not given within 30 minutes. The group found that the policy requiring a 30‐minute time to administration was clinically appropriate, reinforcing our goals to create a practice congruent with the policy.
A subgroup led by the pharmacy department collected data related to STAT medications on the 3 medical‐surgical units. Within 1 month, 550 STAT medications were ordered, consisting of medications ranging from furosemide to nicotine lozenges, the latter being a medication clearly outside of the policy definition of STAT. The workgroup reviewed the information and realized education would be required to align practice with policy. According to our matrix, education was a high‐impact/high‐effort activity, so efforts were focused on the high‐impact/low‐effort activities initially. We addressed educational opportunities in later PDSA cycles.
Goal 2: An Easy, Intuitive STAT Process for All Stakeholders
The CPRS contains prefabricated templates that conform to regulatory requirements and ensure completeness. However, the CPRS does not intuitively enable ordering providers to choose the time for the first dose of a new routine medication. This often creates a situation where a provider orders the medication STAT, so that the medication can be given earlier than the CPRS would otherwise allow. Although there is a check box, Give additional dose now, it was not being used because it was visually obscure in the interface. The CPRS restricted our ability to change the template for ordering medications to include a specific time for first‐dose administration before defaulting to the routine order; thus, complementary countermeasures were trialed first. These are outlined in Table 1.
| Countermeasure | Intended Outcome |
|---|---|
| Remove duplicate dosing frequencies from medication order template | Reduce list of dosing frequencies to sort through to find desired selection |
| Develop 1‐page job aid for ordering providers to utilize | Assist in the correct methods of ordering STAT, NOW, and routine medications |
| Added STAT ONCE as a dosing frequency selection | Clarify the medication, if ordered STAT, will only be a 1‐time administration to avoid the recurrence of a STAT order should the orders be transferred to a new unit with the patient |
| Modify existing policies to add STAT ONCE option | Ensure documentation is congruent with new expectations |
| Educate interns and residents with the job aid and a hands‐on how to ordering exercise | Inform ordering physicians on the available references for ordering and educate according to desired practice |
| Provide interns and residents with a visual job aid at their workstation and a hands‐on how to ordering exercise | In addition to providing information and educating according to desired practice, provide a just‐in‐time reference resource |
Goal 3: The STAT Process Should Be Transparent and Ideally Visual
During the time studies, the time period from when the medication arrived on the unit to the time it was administered to the patient averaged 34 minutes. Of 28 STAT orders followed through the entire process, 5 pharmacy technicians (26%) were not informed of 19 STAT medication orders requiring delivery, and 12 nurses (63%) were not notified of the delivery of those 19 medications. The remaining 9 STAT medications were stocked in the Omnicell. Informal interviews with nurses and pharmacy technicians, as well as input from the nurses and pharmacy technicians in our workgroup, revealed several explanations for these findings.
First, the delivering technicians could not always find the patient's nurse, and because the delivery procedure was not standardized, there was no consistency between technicians in where medications were delivered. Second, each unit had a different medication inventory stored in the Omnicell, and the inventory was frequently changed (eg, due to unit‐specific needs, backorders), which made it difficult for nurses to keep track of what was available in Omnicell at any given time. Finally, the STAT medication was not consistently labeled with a visual STAT notation, so even if a nurse saw that new medications had been delivered, he or she would not be able to easily identify which was STAT. The team made several low‐tech process changes to improve the visibility of a STAT medication and ensure reliable communication upon delivery. A subgroup of pharmacists, technicians, and nurses developed and implemented the countermeasures described in Table 2.
| Countermeasure | Intended Outcome |
|---|---|
| Designate delivery preferences with the patient's nurse as the first preference and a set location in the med room as the only alternative preference | Attempt to deliver medications directly to the patient's nurse as frequently as possible to eliminate any unnecessary delays and avoid miscommunication |
| Identify a location in each unit's med room to place a red bin to deliver the STAT medications that are unable to be delivered to the patient's nurse directly | Provide 1 alternate location to retrieve STAT medications if the technician is unable to locate the patient's nurse to deliver the medication directly |
| Utilize a plastic bag with a red STAT indication for transportation of STAT medications to the units | Provide a visual to assist in pharmacy technicians prioritizing their deliveries to the inpatient units |
| Utilize red STAT magnets on the patient's door frame to signal nurses a medication had been delivered to the med room | Provide a visual to assist in timely recognition of a STAT medication delivery given the technician was unable to find the nurse to hand it off directly |
RESULTS
At the start of our project, the average time from STAT order to medication administration was 1 hour and 7 minutes (range, 6 minutes 2 hours and 22 minutes). As a result of the 2 sets of countermeasures outlined in Tables 1 and 2, the average total time from STAT order entry to administration decreased by 21% to an average of 53 minutes. The total time from medication delivery to administration decreased by 26% from 34 minutes to 25 minutes postimplementation. On average, 391 STAT medications were ordered per month during the project period, which represents a decrease of 9.5% from the 432 orders per month for the same time period the previous year. After implementing the countermeasures in Table 2, we followed another 26 STAT medications through the process to evaluate our efforts. Of 15 STAT medications requiring delivery, only 1 nurse (7%) was not notified of the delivery of a STAT medication, and 1 pharmacy technician (7%) was not informed the medication was STAT. The 151% increase in notification of nurses to delivery of a STAT medication suggests that use of the STAT bags, STAT magnets on patient doors, and whenever possible direct delivery of STAT medications to the nurse has improved communication between the technicians and nurses. Similarly, the 27% increase in technician awareness of a STAT designation suggests STAT is being better communicated to them. The improvement in awareness and notification of a STAT medication is summarized in Figure 2.
Due to time and financial constraints, the following limitations may have affected our findings. First, resident physicians were not directly represented in our discussions. Attending medicine hospitalists provided the physician perspective, which provides a biased view given their intimate knowledge of the CPRS and additional years of experience. Similarly, nurse perspectives were limited to staff and clinical nurse leaders. Last, our low‐cost approach was mandated by limited resources; a more resource‐rich environment may have devised alternative approaches.
CONCLUSIONS
Adapting A3 Thinking for process improvement was a low‐cost/low‐tech option for a VA facility. Having buy‐in from all levels was crucial to the success of the project. The size and diversity of the group was also very important, as different opinions and aspects of the process were represented. Cross‐discipline relationships and respect were formed, which will be valuable for collaboration in future projects. Although we focused on the STAT medication process, other quality‐improvement projects could also benefit from A3 Thinking. Moreover, there were enough people to serve as ambassadors, taking the project back to their work areas to share with their peers, gather consensus, and elicit additional feedback. The collaboration led to comprehensive understanding of the process, the nature of the problems within the process, and the complexity of solving the problem. For example, although the number of STAT orders did not decrease dramatically, we have learned from these experiments that we may need to change how we approach structuring additional experiments. Future work will focus on increasing communication between physicians and nurses when placing STAT medication orders, enhancing resident education to ensure appropriate use of the STAT designation, and continuing our efforts to improve the delivery process of STAT medications.
Other quality‐improvement methodologies we could have used include: total quality management (TQM), continuous quality improvement (CQI), business process redesign, Lean, Six Sigma, and others.[14] Differences between these can be broadly classified as putting an emphasis on people (eg, inclusion of front line staff in CQI or leadership in TQM) or on process (eg, understanding process function to reduce waste in Lean or statistical process control in Six Sigma).[14] Using A3 Thinking methodology was more useful than these others for the STAT medication process for some very important reasons. The A3 process not only led to a better understanding of the meaning of STAT across disciplines, increasing the intuitive nature, transparency and visual aspects of the whole process, but also promoted a collaborative, multidisciplinary, integrative culture, in which other hospital‐wide problems may be addressed in the future.
Acknowledgements
This work could not have been done without the contribution of all members of the STAT Improvement Workgroup, including Charles Alday; Allison Brenner, PharmD; Paula Carroll; Garry Davis; Michele Delaney, RN, MSN, CWCN; Mary East, MD; Stacy Frick, MSN, RN, CNL; Corry Gessner, CPhT; Kenya Harbin, MSN, RN, CNL; Crystal Heath, MS, RN‐BC; Tom Kerr, MPH; Diane Klemer, RPh; Diane Kohmescher, PharmD, BCPS; Sara Oberdick; Antanita Pickett; Ana Preda, CPhT; Joseph Pugh, RPh, MS; Gloria Salazar, CPhT; Samar Sheth, MD; Andrea Starnes, RN; Christine Wagner, PharmD; Leo Wallace; Roderick Williams; and Marilyn Woodruff.
Disclosures: This work was funded by a US Department of Veterans Affairs, Office of Systems Redesign Improvement Capability Grant and the Veterans in Partnership (VISN11) Healthcare Network. The findings and conclusions in this report are those of the authors and do not necessarily represent the position or policy of the US Department of Veterans Affairs. The authors have no other disclosures or conflicts to report.
- The American Heritage Medical Dictionary of the English Language website. 2011. Available at: http://ahdictionary.com/word/search.html?q=STAT. Accessed December 22, 2013.
- , , , , , . The use of multiple qualitative methods to characterize communication events between physicians and nurses [published online ahead of print January 31, 2014]. Health Commun. doi: 10.1080/10410236.2013.835894.
- , , . Fifteen best practice recommendations for bar‐code medication administration in the Veterans Health Administration. Jt Comm J Qual Saf. 2004;30(7):355–365.
- , , , , . Going lean in health care. Cambridge, MA: Institute for Healthcare Improvement; 2005. Available at: http://www.ihi.org. Accessed March 19, 2014.
- , . Understanding A3 Thinking: A Critical Component of Toyota's PDCA Management System. New York, NY: Productivity Press, Taylor 2008.
- . Managing to Learn: Using the A3 Management Process to Solve Problems, Gain Agreement, Mentor and Lead. Cambridge, MA: Lean Enterprise Institute; 2008.
- , , . Basics of quality improvement in health care. Mayo Clin Proc. 2007;82(6):735–739.
- , . A3 problem solving: unique features of the A3 problem solving method. Available at: http://leanhealthcarewest.com/Page/A3‐Problem‐Solving. Accessed March 27, 2014.
- , , . Evaluation of stat orders in a teaching hospital: a chart review. Clin Drug Investig. 2011;31(4):231–235.
- . Using STAT properly. Radiol Manage. 2006;28(1):26–30; quiz 31–33.
- , . The promise of Lean in health care. Mayo Clin Proc. 2013;88(1):74–82.
- , , , . Lean health care: what can hospitals learn from a world‐class automaker? J Hosp Med. 2006;1(3):191–199.
- . Gemba Kaizen: A Commonsense Approach to a Continuous Improvement Strategy. 2nd ed. New York, NY: McGraw‐Hill; 2012.
- . Pseudoinnovation: the development and spread of healthcare quality improvement methodologies. Int J Qual Health Care. 2009;21(3):153–159.
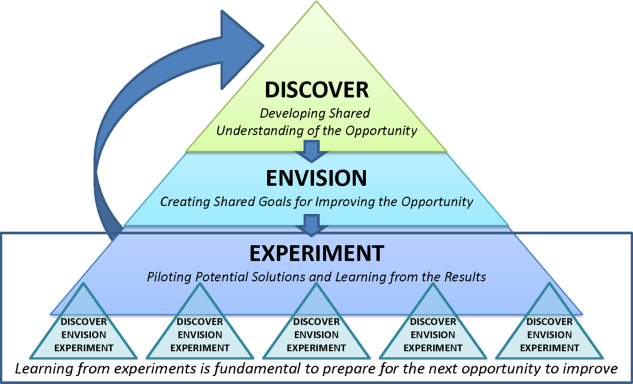
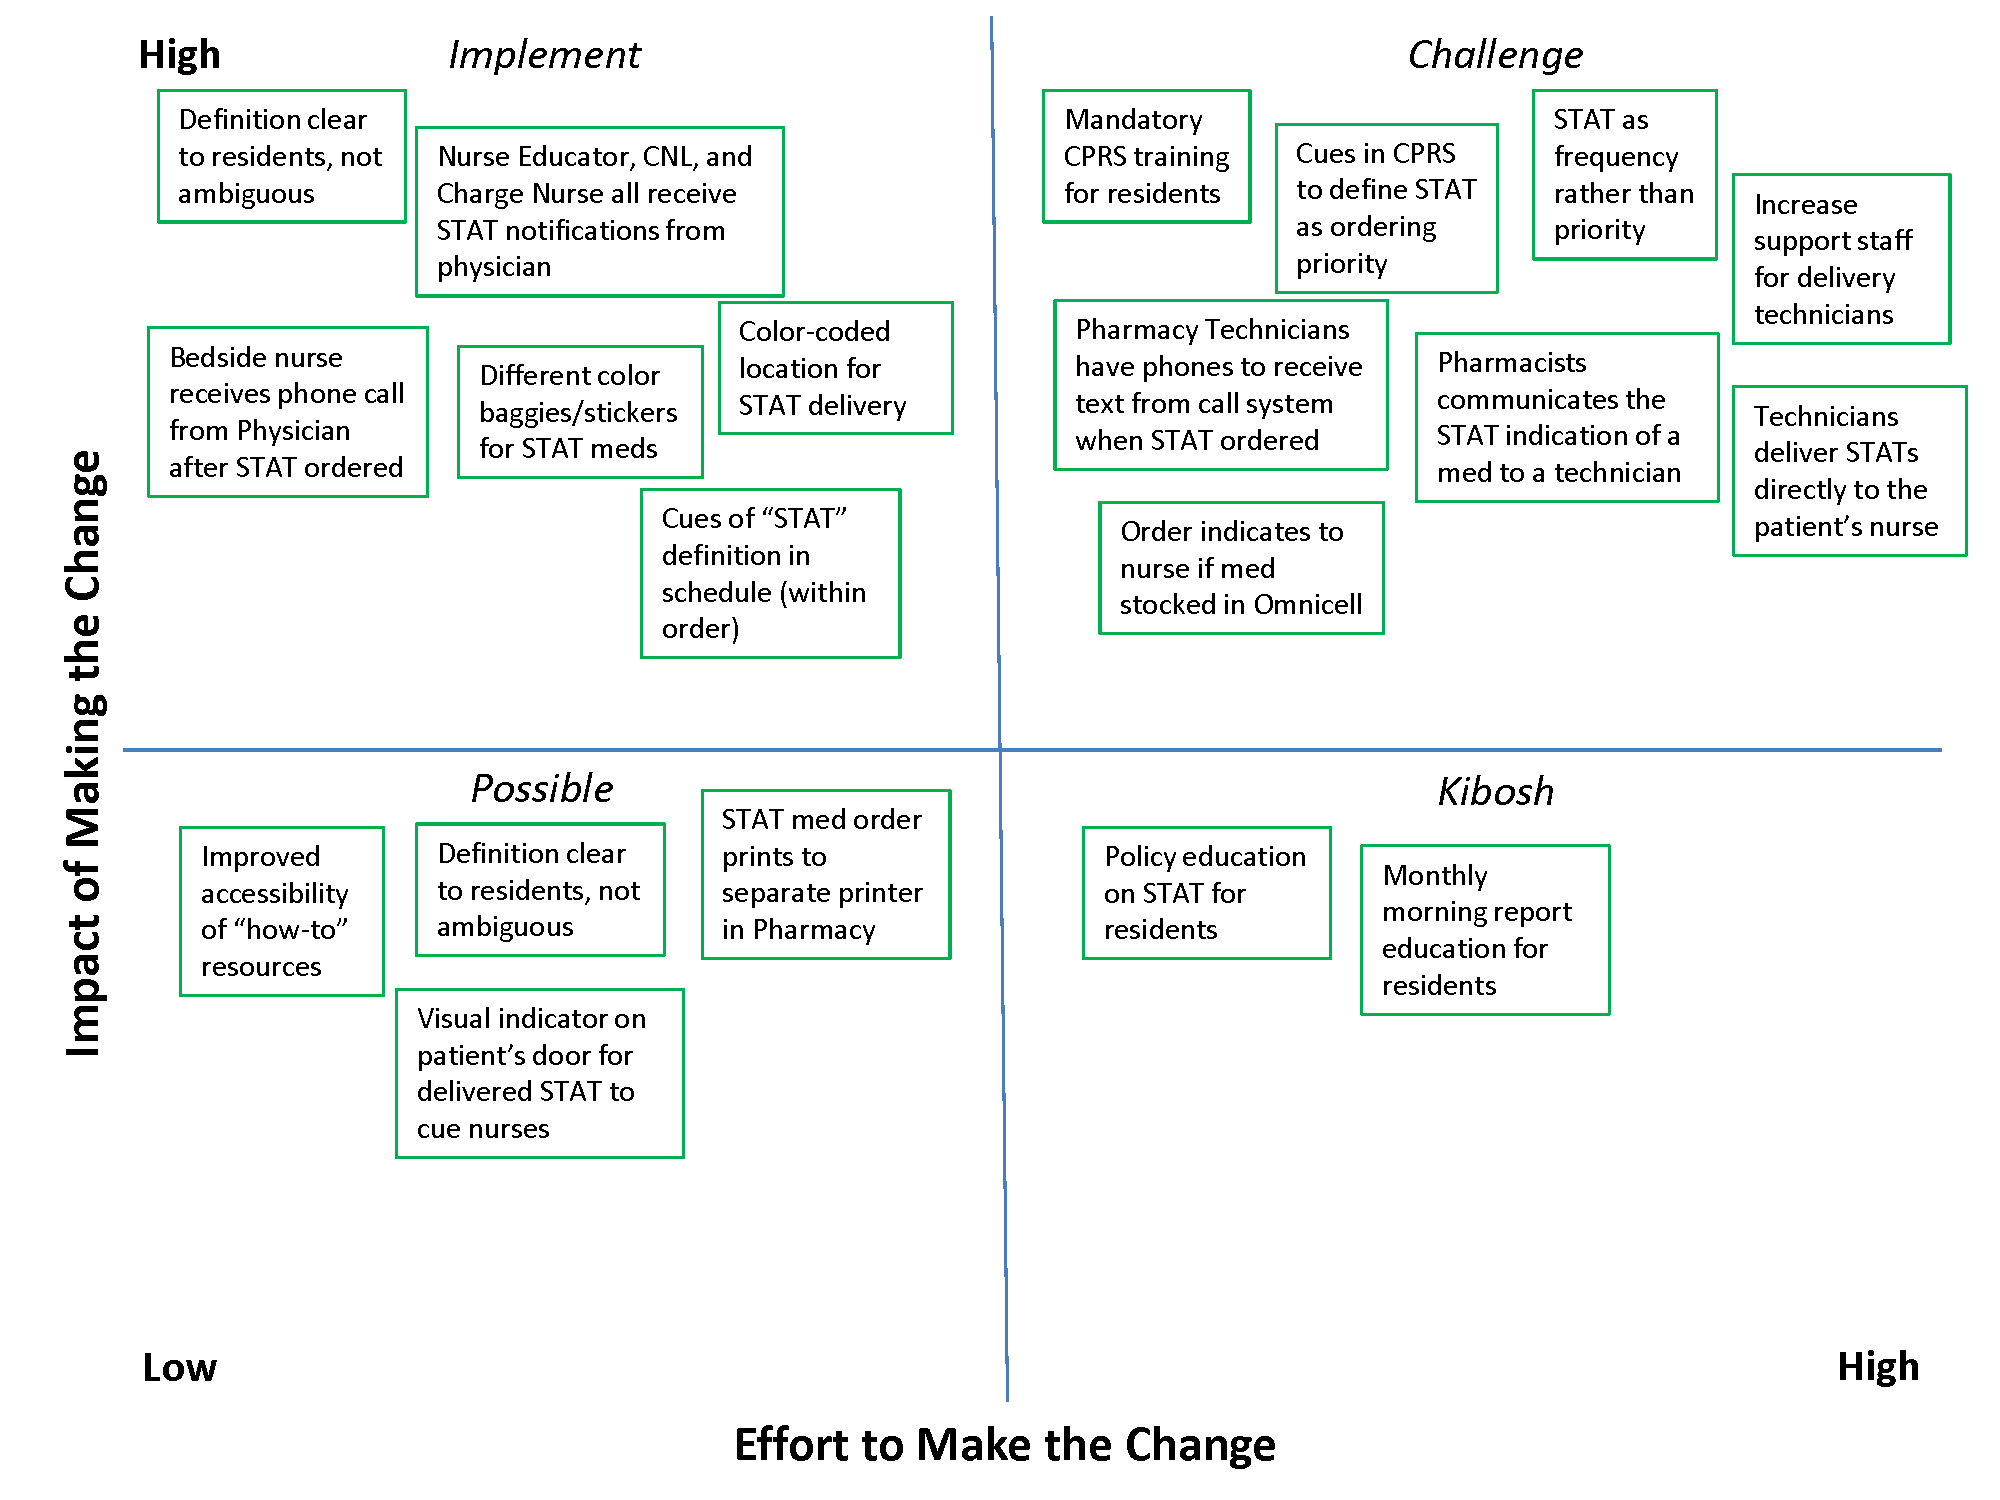
Evaluating an Academic Hospitalist Service
Improving quality while reducing costs remains important for hospitals across the United States, including the approximately 150 hospitals that are part of the Veterans Affairs (VA) healthcare system.[1, 2] The field of hospital medicine has grown rapidly, leading to predictions that the majority of inpatient care in the United States eventually will be delivered by hospitalists.[3, 4] In 2010, 57% of US hospitals had hospitalists on staff, including 87% of hospitals with 200 beds,[5] and nearly 80% of VA hospitals.[6]
The demand for hospitalists within teaching hospitals has grown in part as a response to the mandate to reduce residency work hours.[7] Furthermore, previous research has found that hospitalist care is associated with modest reductions in length of stay (LOS) and weak but inconsistent differences in quality.[8] The educational effect of hospitalists has been far less examined. The limited number of studies published to date suggests that hospitalists may improve resident learning and house‐officer satisfaction in academic medical centers and community teaching hospitals[9, 10, 11] and provide positive experiences for medical students12,13; however, Wachter et al reported no significant changes in clinical outcomes or patient, faculty, and house‐staff satisfaction in a newly designed hospital medicine service in San Francisco.[14] Additionally, whether using hospitalists influences nurse‐physician communication[15] is unknown.
Recognizing the limited and sometimes conflicting evidence about the hospitalist model, we report the results of a 3‐year quasi‐experimental evaluation of the experience at our medical center with academic hospitalists. As part of a VA Systems Redesign Improvement Capability Grantknown as the Hospital Outcomes Program of Excellence (HOPE) Initiativewe created a hospitalist‐based medicine team focused on quality improvement, medical education, and patient outcomes.
METHODS
Setting and Design
The main hospital of the VA Ann Arbor Healthcare System, located in Ann Arbor, Michigan, operates 105 acute‐care beds and 40 extended‐care beds. At the time of this evaluation, the medicine service consisted of 4 internal medicine teamsGold, Silver, Burgundy, and Yelloweach of which was responsible for admitting patients on a rotating basis every fourth day, with limited numbers of admissions occurring between each team's primary admitting day. Each team is led by an attending physician, a board‐certified (or board‐eligible) general internist or subspecialist who is also a faculty member at the University of Michigan Medical School. Each team has a senior medical resident, 2 to 3 interns, and 3 to 5 medical students (mostly third‐year students). In total, there are approximately 50 senior medical residents, 60 interns, and 170 medical students who rotate through the medicine service each year. Traditional rounding involves the medical students and interns receiving sign‐out from the overnight team in the morning, then pre‐rounding on each patient by obtaining an interval history, performing an exam, and checking any test results. A tentative plan of care is formed with the senior medical resident, usually by discussing each patient very quickly in the team room. Attending rounds are then conducted, with the physician team visiting each patient one by one to review and plan all aspects of care in detail. When time allows, small segments of teaching may occur during these attending work rounds. This system had been in place for >20 years.
Resulting in part from a grant received from the VA Systems Redesign Central Office (ie, the HOPE Initiative), the Gold team was modified in July 2009 and an academic hospitalist (S.S.) was assigned to head this team. Specific hospitalists were selected by the Associate Chief of Medicine (S.S.) and the Chief of Medicine (R.H.M.) to serve as Gold team attendings on a regular basis. The other teams continued to be overseen by the Chief of Medicine, and the Gold team remained within the medicine service. Characteristics of the Gold and nonGold team attendings can be found in Table 1. The 3 other teams initially were noninterventional concurrent control groups. However, during the second year of the evaluation, the Silver team adopted some of the initiatives as a result of the preliminary findings observed on Gold. Specifically, in the second year of the evaluation, approximately 42% of attendings on the Silver team were from the Gold team. This increased in the third year to 67% of coverage by Gold team attendings on the Silver team. The evaluation of the Gold team ended in June 2012.
| Characteristic | Gold Team | Non‐Gold Teams |
|---|---|---|
| Total number of attendings | 14 | 57 |
| Sex, % | ||
| Male | 79 | 58 |
| Female | 21 | 42 |
| Median years postresidency (range) | 10 (130) | 7 (141) |
| Subspecialists, % | 14 | 40 |
| Median days on service per year (range) | 53 (574) | 30 (592) |
The clinical interventions implemented on the Gold team were quality‐improvement work and were therefore exempt from institutional review board review. Human subjects' approval was, however, received to conduct interviews as part of a qualitative assessment.
Clinical Interventions
Several interventions involving the clinical care delivered were introduced on the Gold team, with a focus on improving communication among healthcare workers (Table 2).
| Clinical Interventions | Educational Interventions |
|---|---|
| Modified structure of attending rounds | Modified structure of attending rounds |
| Circle of Concern rounds | Attending reading list |
| Clinical Care Coordinator | Nifty Fifty reading list for learners |
| Regular attending team meetings | Website to provide expectations to learners |
| Two‐month per year commitment by attendings |
Structure of Attending Rounds
The structure of morning rounds was modified on the Gold team. Similar to the traditional structure, medical students and interns on the Gold team receive sign‐out from the overnight team in the morning. However, interns and students may or may not conduct pre‐rounds on each patient. The majority of time between sign‐out and the arrival of the attending physician is spent on work rounds. The senior resident leads rounds with the interns and students, discussing each patient while focusing on overnight events and current symptoms, new physical‐examination findings, and laboratory and test data. The plan of care to be presented to the attending is then formulated with the senior resident. The attending physician then leads Circle of Concern rounds with an expanded team, including a charge nurse, a clinical pharmacist, and a nurse Clinical Care Coordinator. Attending rounds tend to use an E‐AP format: significant Events overnight are discussed, followed by an Assessment & Plan by problem for the top active problems. Using this model, the attendings are able to focus more on teaching and discussing the patient plan than in the traditional model (in which the learner presents the details of the subjective, objective, laboratory, and radiographic data, with limited time left for the assessment and plan for each problem).
Circle of Concern Rounds
Suzanne Gordon described the Circle of Concern in her book Nursing Against the Odds.[16] From her observations, she noted that physicians typically form a circle to discuss patient care during rounds. The circle expands when another physician joins the group; however, the circle does not similarly expand to include nurses when they approach the group. Instead, nurses typically remain on the periphery, listening silently or trying to communicate to physicians' backs.[16] Thus, to promote nurse‐physician communication, Circle of Concern rounds were formally introduced on the Gold team. Each morning, the charge nurse rounds with the team and is encouraged to bring up nursing concerns. The inpatient clinical pharmacist is also included 2 to 3 times per week to help provide education to residents and students and perform medication reconciliation.
Clinical Care Coordinator
The role of the nurse Clinical Care Coordinatoralso introduced on the Gold teamis to provide continuity of patient care, facilitate interdisciplinary communication, facilitate patient discharge, ensure appropriate appointments are scheduled, communicate with the ambulatory care service to ensure proper transition between inpatient and outpatient care, and help educate residents and students on VA procedures and resources.
Regular Gold Team Meetings
All Gold team attendings are expected to dedicate 2 months per year to inpatient service (divided into half‐month blocks), instead of the average 1 month per year for attendings on the other teams. The Gold team attendings, unlike the other teams, also attend bimonthly meetings to discuss strategies for running the team.
Educational Interventions
Given the high number of learners on the medicine service, we wanted to enhance the educational experience for our learners. We thus implemented various interventions, in addition to the change in the structure of rounds, as described below.
Reading List for Learners: The Nifty Fifty
Because reading about clinical medicine is an integral part of medical education, we make explicit our expectation that residents and students read something clinically relevant every day. To promote this, we have provided a Nifty Fifty reading list of key articles. The PDF of each article is provided, along with a brief summary highlighting key points.
Reading List for Gold Attendings and Support Staff
To promote a common understanding of leadership techniques, management books are provided to Gold attending physicians and other members of the team (eg, Care Coordinator, nurse researcher, systems redesign engineer). One book is discussed at each Gold team meeting (Table 3), with participants taking turns leading the discussion.
| Book Title | Author(s) |
|---|---|
| The One Minute Manager | Ken Blanchard and Spencer Johnson |
| Good to Great | Jim Collins |
| Good to Great and the Social Sectors | Jim Collins |
| The Checklist Manifesto: How to Get Things Right | Atul Gawande |
| The Five Dysfunctions of a Team: A Leadership Fable | Patrick Lencioni |
| Getting to Yes: Negotiating Agreement Without Giving In | Roger Fisher, William Ury, and Bruce Patton |
| The Effective Executive: The Definitive Guide to Getting the Right Things Done | Peter Drucker |
| A Sense of Urgency | John Kotter |
| The Power of Positive Deviance: How Unlikely Innovators Solve the World's Toughest Problems | Richard Pascale, Jerry Sternin, and Monique Sternin |
| On the Mend: Revolutionizing Healthcare to Save Lives and Transform the Industry | John Toussaint and Roger Gerard |
| Outliers: The Story of Success | Malcolm Gladwell |
| Nursing Against the Odds: How Health Care Cost Cutting, Media Stereotypes, and Medical Hubris Undermine Nurses and Patient Care | Suzanne Gordon |
| How the Mighty Fall and Why Some Companies Never Give In | Jim Collins |
| What the Best College Teachers Do | Ken Bain |
| The Creative Destruction of Medicine | Eric Topol |
| What Got You Here Won't Get You There: How Successful People Become Even More Successful! | Marshall Goldsmith |
Website
A HOPE Initiative website was created (
Qualitative Assessment
To evaluate our efforts, we conducted a thorough qualitative assessment during the third year of the program. A total of 35 semistructured qualitative interviews were conducted with patients and staff from all levels of the organization, including senior leadership. The qualitative assessment was led by research staff from the Center for Clinical Management Research, who were minimally involved in the redesign effort and could provide an unbiased view of the initiative. Field notes from the semistructured interviews were analyzed, with themes developed using a descriptive approach and through discussion by a multidisciplinary team, which included building team consensus on findings that were supported by clear evidence in the data.[17]
Quantitative Outcome Measures
Clinical Outcomes
To determine if our communication and educational interventions had an impact on patient care, we used hospital administrative data to evaluate admission rates, LOS, and readmission rates for all 4 of the medicine teams. Additional clinical measures were assessed as needed. For example, we monitored the impact of the clinical pharmacist during a 4‐week pilot study by asking the Clinical Care Coordinator to track the proportion of patient encounters (n=170) in which the clinical pharmacist changed management or provided education to team members. Additionally, 2 staff surveys were conducted. The first survey focused on healthcare‐worker communication and was given to inpatient nurses and physicians (including attendings, residents, and medical students) who were recently on an inpatient medical service rotation. The survey included questions from previously validated communication measures,[18, 19, 20] as well as study‐specific questions. The second survey evaluated the new role of the Clinical Care Coordinator (Appendix). Both physicians and nurses who interacted with the Gold team's Clinical Care Coordinator were asked to complete this survey.
Educational Outcomes
To assess the educational interventions, we used learner evaluations of attendings, by both residents and medical students, and standardized internal medicine National Board of Medical Examiners Subject Examination (or shelf) scores for third‐year medical students. A separate evaluation of medical student perceptions of the rounding structure introduced on the Gold team using survey design has already been published.[21]
Statistical Analyses
Data from all sources were analyzed using SAS 9.3 (SAS Institute, Inc., Cary, NC). Outliers for the LOS variable were removed from the analysis. Means and frequency distributions were examined for all variables. Student t tests and [2] tests of independence were used to compare data between groups. Multivariable linear regression models controlling for time (preintervention vs postintervention) were used to assess the effect of the HOPE Initiative on patient LOS and readmission rates. In all cases, 2‐tailed P values of 0.05 or less were considered statistically significant.
Role of the Funding Source
The VA Office of Systems Redesign provided funding but was not involved in the design or conduct of the study, data analysis, or preparation of the manuscript.
RESULTS
Clinical Outcomes
Patient Outcomes
Our multivariable linear regression analysis, controlling for time, showed a significant reduction in LOS of approximately 0.3 days on all teams after the HOPE Initiative began (P=0.004). There were no significant differences between the Gold and non‐Gold teams in the multivariate models when controlling for time for any of the patient‐outcome measures. The number of admissions increased for all 4 medical teams (Figure 1), but, as shown in Figures 2 and 3, the readmission rates for all teams remained relatively stable over this same period of time.

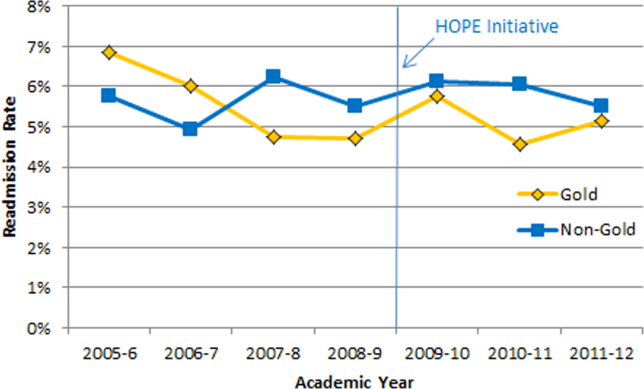

Clinical Pharmacist on Gold Team Rounds
The inpatient clinical pharmacist changed the management plan for 22% of the patients seen on rounds. Contributions from the clinical pharmacist included adjusting the dosing of ordered medication and correcting medication reconciliation. Education and pharmaceutical information was provided to the team in another 6% of the 170 consecutive patient encounters evaluated.
Perception of Circle of Concern Rounds
Circle of Concern rounds were generally well‐received by both nurses and physicians. In a healthcare‐worker communication survey, completed by 38 physicians (62% response rate) and 48 nurses (54% response rate), the majority of both physicians (83%) and nurses (68%) felt Circle of Concern rounds improved communication.
Nurse Perception of Communication
The healthcare‐worker communication survey asked inpatient nurses to rate communication between nurses and physicians on each of the 4 medicine teams. Significantly more nurses were satisfied with communication with the Gold team (71%) compared with the other 3 medicine teams (53%; P=0.02) (Figure 4).
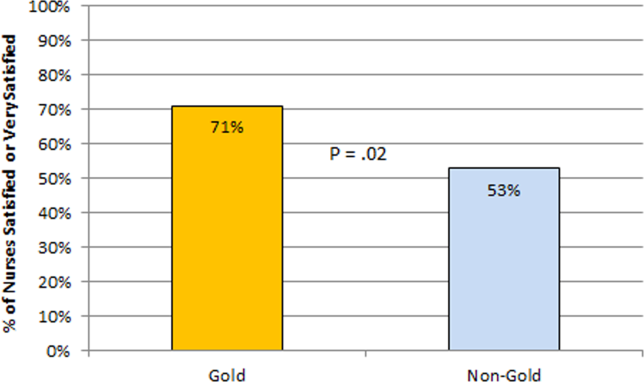
Perception of the Clinical Care Coordinator
In total, 20 physicians (87% response rate) and 10 nurses (56% response rate) completed the Clinical Care Coordinator survey. The physician results were overwhelmingly positive: 100% were satisfied or very satisfied with the role; 100% felt each team should have a Clinical Care Coordinator; and 100% agreed or strongly agreed that the Clinical Care Coordinator ensures that appropriate follow‐up is arranged, provides continuity of care, assists with interdisciplinary communication, and helps facilitate discharge. The majority of nurses was also satisfied or very satisfied with the Clinical Care Coordinator role and felt each team should have one.
Educational Outcomes
House Officer Evaluation of Attendings
Monthly evaluations of attending physicians by house officers (Figure 5) revealed that prior to the HOPE Initiative, little differences were observed between teams, as would be expected because attending assignment was largely random. After the intervention date of July 2009, however, significant differences were noted, with Gold team attendings receiving significantly higher teaching evaluations immediately after the introduction of the HOPE Initiative. Although ratings for Gold attendings remained more favorable, the difference was no longer statistically significant in the second and third year of the initiative, likely due to Gold attendings serving on other medicine teams, which contributed to an improvement in ratings of all attendings.
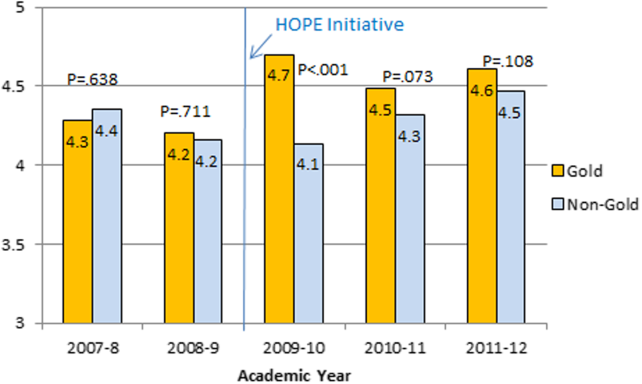
Medical Student Evaluation of Attendings
Monthly evaluations of attending physicians by third‐year medical students (Figure 6) revealed differences between the Gold attendings and all others, with the attendings that joined the Gold team in 2009 receiving higher teaching evaluations even before the HOPE Initiative started. However, this difference remained statistically significant in years 2 and 3 postinitiative, despite the addition of 4 new junior attendings.
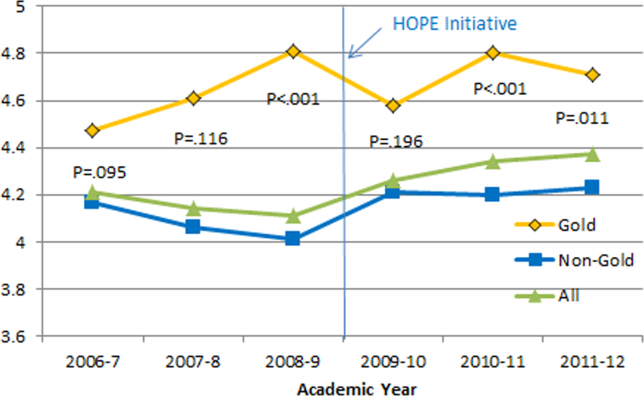
Medical Student Medicine Shelf Scores
The national average on the shelf exam, which reflects learning after the internal medicine third‐year clerkship, has ranged from 75 to 78 for the past several years, with University of Michigan students averaging significantly higher scores prior to and after the HOPE Initiative. However, following the HOPE Initiative, third‐year medical students on the Gold team scored significantly higher on the shelf exam compared with their colleagues on the non‐Gold teams (84 vs 82; P=0.006). This difference in the shelf exam scores, although small, is statistically significant. It represents a measurable improvement in shelf scores in our system and demonstrates the potential educational benefit for the students. Over this same time period, scores on the United States Medical Licensing Exam, given to medical students at the beginning of their third year, remained stable (233 preHOPE Initiative; 234 postHOPE Initiative).
Qualitative Assessment
Qualitative data collected as part of our evaluation of the HOPE Initiative also suggested that nurse‐physician communication had improved since the start of the project. In particular, they reported positively on the Gold team in general, the Circle of Concern rounds, and the Clinical Care Coordinator (Table 4).
| Staff Type | Statement1 |
|---|---|
| |
| Nurse | [Gold is] above and beyond other [teams]. Other teams don't run as smoothly. |
| Nurse | There has been a difference in communication [on Gold]. You can tell the difference in how they communicate with staff. We know the Clinical Care Coordinator or charge nurse is rounding with that team, so there is more communication. |
| Nurse | The most important thing that has improved communication is the Circle of Concern rounds. |
| Physician | [The Gold Clinical Care Coordinator] expedites care, not only what to do but who to call. She can convey the urgency. On rounds she is able to break off, put in an order, place a call, talk to a patient. Things that we would do at 11 AM she gets to at 9 AM. A couple of hours may not seem like much, but sometimes it can make the difference between things happening that day instead of the next. |
| Physician | The Clinical Care Coordinator is completely indispensable. Major benefit to providing care to Veterans. |
| Physician | I like to think Gold has lifted all of the teams to a higher level. |
| Medical student | It may be due to personalities vs the Gold [team] itself, but there is more emphasis on best practices. Are we following guidelines even if it is not related to the primary reason for admission? |
| Medical student | Gold is very collegial and nurses/physicians know one another by name. Physicians request rather than order; this sets a good example to me on how to approach the nurses. |
| Chief resident | [Gold attendings] encourage senior residents to take charge and run the team, although the attending is there for back‐up and support. This provides great learning for the residents. Interns and medical students also are affected because they have to step up their game as well. |
DISCUSSION
Within academic medical centers, hospitalists are expected to care for patients, teach, and help improve the quality and efficiency of hospital‐based care.[7] The Department of Veterans Affairs runs the largest integrated healthcare system in the United States, with approximately 80% of VA hospitals having hospital medicine programs. Overall, one‐third of US residents perform part of their residency training at a VA hospital.[22, 23] Thus, the effects of a system‐wide change at a VA hospital may have implications throughout the country. We studied one such intervention. Our primary findings are that we were able to improve communication and learner education with minimal effects on patient outcomes. While overall LOS decreased slightly postintervention, after taking into account secular trends, readmission rates did not.
We are not the first to evaluate a hospital medicine team using a quasi‐experimental design. For example, Meltzer and colleagues evaluated a hospitalist program at the University of Chicago Medical Center and found that, by the second year of operation, hospitalist care was associated with significantly shorter LOS (0.49 days), reduced costs, and decreased mortality.[24] Auerbach also evaluated a newly created hospital medicine service, finding decreased LOS (0.61 days), lower costs, and lower risk of mortality by the second year of the program.[25]
Improving nurse‐physician communication is considered important for avoiding medical error,[26] yet there has been limited empirical study of methods to improve communication within the medical profession.[27] Based both on our surveys and qualitative interviews, healthcare‐worker communication appeared to improve on the Gold team during the study. A key component of this improvement is likely related to instituting Circle of Concern rounds, in which nurses joined the medical team during attending rounds. Such an intervention likely helped to address organizational silence[28] and enhance the psychological safety of the nursing staff, because the attending physician was proactive about soliciting the input of nurses during rounds.[29] Such leader inclusivenesswords and deeds exhibited by leaders that invite and appreciate others' contributionscan aid interdisciplinary teams in overcoming the negative effects of status differences, thereby promoting collaboration.[29] The inclusion of nurses on rounds is also relationship‐building, which Gotlib Conn and colleagues found was important to improved interprofessional communication and collaboration.[30] In the future, using a tool such as the Teamwork Effectiveness Assessment Module (TEAM) developed by the American Board of Internal Medicine[31] could provide further evaluation of the impact on interprofessional teamwork and communication.
The focus on learner education, though evaluated in prior studies, is also novel. One previous survey of medical students showed that engaging students in substantive discussions is associated with greater student satisfaction.[32] Another survey of medical students found that attendings who were enthusiastic about teaching, inspired confidence in knowledge and skills, provided useful feedback, and encouraged increased student responsibility were viewed as more effective teachers.[33] No previous study that we are aware of, however, has looked at actual educational outcomes, such as shelf scores. The National Board of Medical Examiners reports that the Medicine subject exam is scaled to have a mean of 70 and a standard deviation of 8.[34] Thus, a mean increase in score of 2 points is small, but not trivial. This shows improvement in a hard educational outcome. Additionally, 2 points, although small in the context of total score and standard deviation, may make a substantial difference to an individual student in terms of overall grade, and, thus, residency applications. Our finding that third‐year medical students on the Gold team performed significantly better than University of Michigan third‐year medical students on other teams is an intriguing finding that warrants confirmation. On the other hand, this finding is consistent with a previous report evaluating learner satisfaction in which Bodnar et al found improved ratings of quantity and quality of teaching on teams with a nontraditional structure (Gold team).[21] Moreover, despite relatively few studies, the reason underlying the educational benefit of hospitalists should surprise few. The hospitalist model ensures that learners are supervised by physicians who are experts in the care of hospitalized patients.[35] Hospitalists hired at teaching hospitals to work on services with learners are generally chosen because they possess superior educational skills.[7]
Our findings should be interpreted in the context of the following limitations. First, our study focused on a single academically affiliated VA hospital. As other VA hospitals are pursuing a similar approach (eg, the Houston and Detroit VA medical centers), replicating our results will be important. Second, the VA system, although the largest integrated healthcare system in the United States, has unique characteristicssuch as an integrated electronic health record and predominantly male patient populationthat may make generalizations to the larger US healthcare system challenging. Third, there was a slightly lower response rate among nurses on a few of the surveys to evaluate our efforts; however, this rate of response is standard at our facility. Finally, our evaluation lacks an empirical measure of healthcare‐worker communication, such as incident reports.
Despite these limitations, our results have important implications. Using both quantitative and qualitative assessment, we found that academic hospitalists have the ability to improve healthcare‐worker communication and enhance learner education without increasing LOS. These findings are directly applicable to VA medical centers and potentially applicable to other academic medical centers.
Acknowledgments
The authors thank Milisa Manojlovich, PhD, RN, Edward Kennedy, MS, and Andrew Hickner, MSI, for help with preparation of this manuscript.
Disclosures: This work was funded by a US Department of Veterans Affairs, Office of Systems Redesign Improvement Capability grant. The findings and conclusions in this report are those of the authors and do not necessarily represent the position or policy of the Department of Veterans Affairs. Dr. Saint reports receiving travel reimbursement for giving invited talks at the Society of Hospital Medicine's National Meeting, as well as serving on the advisory boards of Doximity and Jvion.
APPENDIX
Survey to Evaluate the Care Coordinator Position
| Yes | No | Not Sure | |
| Q1. Are you familiar with the role of the Care Coordinator on the Gold Service (Susan Lee)? | 1 | 2 | 3 |
Please indicate how much you agree or disagree with the statements below.
| Strongly Agree | Agree | Neutral | Disagree | Strongly Disagree | Don't Know | |
| Q2. The Care Coordinator ensures that appropriate primary care follow‐up and any other appropriate services are arranged. | 1 | 2 | 3 | 4 | 5 | 9 |
| Q3. The Care Coordinator provides continuity of patient care on the Gold Service. | 1 | 2 | 3 | 4 | 5 | 9 |
| Q4. The Care Coordinator helps educate House Officers and Medical Students on VA processes (e.g., CPRS). | 1 | 2 | 3 | 4 | 5 | 9 |
| Q5. The Care Coordinator assists with interdisciplinary communication between the medical team and other services (e.g., nursing, ambulatory care, pharmacy, social work) | 1 | 2 | 3 | 4 | 5 | 9 |
| Q6. The Care Coordinator helps facilitate patient discharge. | 1 | 2 | 3 | 4 | 5 | 9 |
| Q7. The Care Coordinator initiates communication with the ambulatory care teams to coordinate care. | 1 | 2 | 3 | 4 | 5 | 9 |
| Yes | No | |
| Q8. Are you a physician (attending or resident), or medical student who has been on more than one medical team at the VA (Gold, Silver, Burgundy, or Yellow)? | 1 | 2 |
If no, please skip to Q13
If yes, comparing your experience on the Gold Service (with the Care Coordinator) to your experience on any of the other services (Silver, Burgundy, or Yellow):
| Not at All | Very Little | Somewhat | To a Great Extent | |
| Q9. To what extent does the presence of a Care Coordinator affect patient care? | 1 | 2 | 3 | 4 |
| Q10. To what extent does the presence of a Care Coordinator improve patient flow? | 1 | 2 | 3 | 4 |
| Q11. To what extent does the presence of a Care Coordinator assist with education? | 1 | 2 | 3 | 4 |
| Q12. To what extent does the presence of a Care Coordinator contribute to attending rounds? | 1 | 2 | 3 | 4 |
| Yes | No | |
| Q13. Do you work [as a nurse] in ambulatory care? | 1 | 2 |
If no, please skip to Q17.
If yes, comparing your experience with the Gold Service (with the Care Coordinator) to the other services (Silver, Burgundy, or Yellow):
| Not at All | Very Little | Somewhat | To a Great Extent | |
| Q14. To what extent does the presence of a Care Coordinator improve coordination of care between inpatient and outpatient services? | 1 | 2 | 3 | 4 |
| Q15. To what extent does the presence of a Care Coordinator help identify high risk patients who require follow‐up? | 1 | 2 | 3 | 4 |
| Q16. To what extent does the presence of a Care Coordinator ensure follow‐up appointments are scheduled? | 1 | 2 | 3 | 4 |
| Yes | No | Not Sure | |
| Q17. Do you think each medical team should have a Care Coordinator? | 1 | 2 | 3 |
| Q18. Are there any additional tasks or duties you think would improve the effectiveness of the Care Coordinator? |
| Very Satisfied | Satisfied | Neutral | Dissatisfied | Very Dissatisfied | |
| Q19. Overall how satisfied are you with the role of the Care Coordinator on the Gold Service? | 1 | 2 | 3 | 4 | 5 |
| Q20. Do you have any other comments about the role of the Care Coordinator? |
| Q21. What is your position? |
| 1. Physician (attending or resident) or medical student |
| 2. Nurse (inpatient or ambulatory care) |
- Kohn LT, Corrigan JM, Donaldson MS, eds. To Err Is Human: Building a Safer Health System. Washington, D.C.: National Academies Press; 2000.
- Institute of Medicine of the National Academies. Crossing the Quality Chasm: A New Health System for the 21st Century. Washington, D.C.: National Academies Press; 2001.
- , , , . Growth in the care of older patients by hospitalists in the United States. N Engl J Med. 2009;360(11):1102–1112.
- . Growth in care provided by hospitalists. N Engl J Med. 2009;360(26):2789–2791.
- American Hospital Association. AHA Annual Survey of Hospitals, 2010. Chicago, IL: Health Forum, LLC; 2010.
- , , , . Preventing hospital‐acquired infections: a national survey of practices reported by U.S. hospitals in 2005 and 2009. J Gen Intern Med. 2012;27(7):773–779.
- , . Hospitalists in teaching hospitals: opportunities but not without danger. J Gen Intern Med. 2004;19(4):392–393.
- , . Do hospitalist physicians improve the quality of inpatient care delivery? A systematic review of process, efficiency and outcome measures. BMC Med. 2011;9:58.
- , , , . Effect of hospitalist attending physicians on trainee educational experiences: a systematic review. J Hosp Med. 2009;4(8):490–498.
- , , , , , . Resident satisfaction on an academic hospitalist service: time to teach. Am J Med. 2002;112(7):597–601.
- , , , et al. The positive impact of initiation of hospitalist clinician educators. J Gen Intern Med. 2004;19(4):293–301.
- , . Third‐year medical students' evaluation of hospitalist and nonhospitalist faculty during the inpatient portion of their pediatrics clerkships. J Hosp Med. 2007;2(1):17–22.
- , , , . Medical student evaluation of the quality of hospitalist and nonhospitalist teaching faculty on inpatient medicine rotations. Acad Med. 2004;79(1):78–82.
- , , , , . Reorganizing an academic medical service: impact on cost, quality, patient satisfaction, and education. JAMA. 1998;279(19):1560–1565.
- . Nurse/physician communication through a sensemaking lens: shifting the paradigm to improve patient safety. Med Care. 2010;48(11):941–946.
- . Nursing Against the Odds: How Health Care Cost Cutting, Media Stereotypes, and Medical Hubris Undermine Nurses and Patient Care. Ithaca, NY: Cornell University Press; 2005.
- . Focus on research methods: whatever happened to qualitative description? Res Nurs Health. 2000;23:334–340.
- , , , , . Organizational assessment in intensive care units (ICUs): construct development, reliability, and validity of the ICU nurse‐physician questionnaire. Med Care. 1991;29(8):709–726.
- . Development of an instrument to measure collaboration and satisfaction about care decisions. J Adv Nurs. 1994;20(1):176–182.
- . Development of the practice environment scale of the Nursing Work Index. Res Nurs Health. 2002;25(3):176–188.
- , , . Does the structure of inpatient rounds affect medical student education? Int J Med Educ. 2013;4:96–100.
- U.S. Department of Veterans Affairs, Office of Academic Affiliations. Medical and Dental Education Program. Available at: http://www.va. gov/oaa/GME_default.asp. Published 2012. Accessed May 08, 2013.
- , . Graduate medical education, 2011–2012. JAMA. 2012;308(21):2264–2279.
- , , , et al. Effects of physician experience on costs and outcomes on an academic general medicine service: results of a trial of hospitalists. Ann Intern Med. 2002;137(11):866–874.
- , , , , , . Implementation of a voluntary hospitalist service at a community teaching hospital: improved clinical efficiency and patient outcomes. Ann Intern Med. 2002;137(11):859–865.
- , , . Communication failures: an insidious contributor to medical mishaps. Acad Med. 2004;79(2):186–194.
- , , . ‘It depends': medical residents' perspectives on working with nurses. Am J Nurs. 2009;109(7):34–44.
- , . Organizational silence: a barrier to change and development in a pluralistic world. Acad Manage Rev. 2000;25(4):706–725.
- , . Making it safe: the effects of leader inclusiveness and professional status on psychological safety and improvement efforts in health care teams. J Organiz Behav. 2006;27:941–966.
- , , , , . Interprofessional communication with hospitalist and consultant physicians in general internal medicine: a qualitative study. BMC Health Serv Res. 2012;12:437.
- , , , , , . A new tool to give hospitalists feedback to improve interprofessional teamwork and advance patient care. Health Aff (Millwood). 2012;31(11):2485–2492.
- , , , , , . Impact of instructional practices on student satisfaction with attendings' teaching in the inpatient component of internal medicine clerkships. J Gen Intern Med. 2006;21(1):7–12.
- , . Medical students' perceptions of the elements of effective inpatient teaching by attending physicians and housestaff. J Gen Intern Med. 2005;20(7):635–639.
- National Board of Medical Examiners Subject Examination Program. Internal Medicine Advanced Clinical Examination, score interpretation guide. Available at: http://www.nbme.org/PDF/SampleScoreReports/Internal_Medicine_ACE_Score_Report.pdf. Published 2011. Accessed September 13, 2013.
- . The impact of hospitalists on medical education and the academic health system. Ann Intern Med. 1999;130(4 part 2):364–367.
Improving quality while reducing costs remains important for hospitals across the United States, including the approximately 150 hospitals that are part of the Veterans Affairs (VA) healthcare system.[1, 2] The field of hospital medicine has grown rapidly, leading to predictions that the majority of inpatient care in the United States eventually will be delivered by hospitalists.[3, 4] In 2010, 57% of US hospitals had hospitalists on staff, including 87% of hospitals with 200 beds,[5] and nearly 80% of VA hospitals.[6]
The demand for hospitalists within teaching hospitals has grown in part as a response to the mandate to reduce residency work hours.[7] Furthermore, previous research has found that hospitalist care is associated with modest reductions in length of stay (LOS) and weak but inconsistent differences in quality.[8] The educational effect of hospitalists has been far less examined. The limited number of studies published to date suggests that hospitalists may improve resident learning and house‐officer satisfaction in academic medical centers and community teaching hospitals[9, 10, 11] and provide positive experiences for medical students12,13; however, Wachter et al reported no significant changes in clinical outcomes or patient, faculty, and house‐staff satisfaction in a newly designed hospital medicine service in San Francisco.[14] Additionally, whether using hospitalists influences nurse‐physician communication[15] is unknown.
Recognizing the limited and sometimes conflicting evidence about the hospitalist model, we report the results of a 3‐year quasi‐experimental evaluation of the experience at our medical center with academic hospitalists. As part of a VA Systems Redesign Improvement Capability Grantknown as the Hospital Outcomes Program of Excellence (HOPE) Initiativewe created a hospitalist‐based medicine team focused on quality improvement, medical education, and patient outcomes.
METHODS
Setting and Design
The main hospital of the VA Ann Arbor Healthcare System, located in Ann Arbor, Michigan, operates 105 acute‐care beds and 40 extended‐care beds. At the time of this evaluation, the medicine service consisted of 4 internal medicine teamsGold, Silver, Burgundy, and Yelloweach of which was responsible for admitting patients on a rotating basis every fourth day, with limited numbers of admissions occurring between each team's primary admitting day. Each team is led by an attending physician, a board‐certified (or board‐eligible) general internist or subspecialist who is also a faculty member at the University of Michigan Medical School. Each team has a senior medical resident, 2 to 3 interns, and 3 to 5 medical students (mostly third‐year students). In total, there are approximately 50 senior medical residents, 60 interns, and 170 medical students who rotate through the medicine service each year. Traditional rounding involves the medical students and interns receiving sign‐out from the overnight team in the morning, then pre‐rounding on each patient by obtaining an interval history, performing an exam, and checking any test results. A tentative plan of care is formed with the senior medical resident, usually by discussing each patient very quickly in the team room. Attending rounds are then conducted, with the physician team visiting each patient one by one to review and plan all aspects of care in detail. When time allows, small segments of teaching may occur during these attending work rounds. This system had been in place for >20 years.
Resulting in part from a grant received from the VA Systems Redesign Central Office (ie, the HOPE Initiative), the Gold team was modified in July 2009 and an academic hospitalist (S.S.) was assigned to head this team. Specific hospitalists were selected by the Associate Chief of Medicine (S.S.) and the Chief of Medicine (R.H.M.) to serve as Gold team attendings on a regular basis. The other teams continued to be overseen by the Chief of Medicine, and the Gold team remained within the medicine service. Characteristics of the Gold and nonGold team attendings can be found in Table 1. The 3 other teams initially were noninterventional concurrent control groups. However, during the second year of the evaluation, the Silver team adopted some of the initiatives as a result of the preliminary findings observed on Gold. Specifically, in the second year of the evaluation, approximately 42% of attendings on the Silver team were from the Gold team. This increased in the third year to 67% of coverage by Gold team attendings on the Silver team. The evaluation of the Gold team ended in June 2012.
| Characteristic | Gold Team | Non‐Gold Teams |
|---|---|---|
| Total number of attendings | 14 | 57 |
| Sex, % | ||
| Male | 79 | 58 |
| Female | 21 | 42 |
| Median years postresidency (range) | 10 (130) | 7 (141) |
| Subspecialists, % | 14 | 40 |
| Median days on service per year (range) | 53 (574) | 30 (592) |
The clinical interventions implemented on the Gold team were quality‐improvement work and were therefore exempt from institutional review board review. Human subjects' approval was, however, received to conduct interviews as part of a qualitative assessment.
Clinical Interventions
Several interventions involving the clinical care delivered were introduced on the Gold team, with a focus on improving communication among healthcare workers (Table 2).
| Clinical Interventions | Educational Interventions |
|---|---|
| Modified structure of attending rounds | Modified structure of attending rounds |
| Circle of Concern rounds | Attending reading list |
| Clinical Care Coordinator | Nifty Fifty reading list for learners |
| Regular attending team meetings | Website to provide expectations to learners |
| Two‐month per year commitment by attendings |
Structure of Attending Rounds
The structure of morning rounds was modified on the Gold team. Similar to the traditional structure, medical students and interns on the Gold team receive sign‐out from the overnight team in the morning. However, interns and students may or may not conduct pre‐rounds on each patient. The majority of time between sign‐out and the arrival of the attending physician is spent on work rounds. The senior resident leads rounds with the interns and students, discussing each patient while focusing on overnight events and current symptoms, new physical‐examination findings, and laboratory and test data. The plan of care to be presented to the attending is then formulated with the senior resident. The attending physician then leads Circle of Concern rounds with an expanded team, including a charge nurse, a clinical pharmacist, and a nurse Clinical Care Coordinator. Attending rounds tend to use an E‐AP format: significant Events overnight are discussed, followed by an Assessment & Plan by problem for the top active problems. Using this model, the attendings are able to focus more on teaching and discussing the patient plan than in the traditional model (in which the learner presents the details of the subjective, objective, laboratory, and radiographic data, with limited time left for the assessment and plan for each problem).
Circle of Concern Rounds
Suzanne Gordon described the Circle of Concern in her book Nursing Against the Odds.[16] From her observations, she noted that physicians typically form a circle to discuss patient care during rounds. The circle expands when another physician joins the group; however, the circle does not similarly expand to include nurses when they approach the group. Instead, nurses typically remain on the periphery, listening silently or trying to communicate to physicians' backs.[16] Thus, to promote nurse‐physician communication, Circle of Concern rounds were formally introduced on the Gold team. Each morning, the charge nurse rounds with the team and is encouraged to bring up nursing concerns. The inpatient clinical pharmacist is also included 2 to 3 times per week to help provide education to residents and students and perform medication reconciliation.
Clinical Care Coordinator
The role of the nurse Clinical Care Coordinatoralso introduced on the Gold teamis to provide continuity of patient care, facilitate interdisciplinary communication, facilitate patient discharge, ensure appropriate appointments are scheduled, communicate with the ambulatory care service to ensure proper transition between inpatient and outpatient care, and help educate residents and students on VA procedures and resources.
Regular Gold Team Meetings
All Gold team attendings are expected to dedicate 2 months per year to inpatient service (divided into half‐month blocks), instead of the average 1 month per year for attendings on the other teams. The Gold team attendings, unlike the other teams, also attend bimonthly meetings to discuss strategies for running the team.
Educational Interventions
Given the high number of learners on the medicine service, we wanted to enhance the educational experience for our learners. We thus implemented various interventions, in addition to the change in the structure of rounds, as described below.
Reading List for Learners: The Nifty Fifty
Because reading about clinical medicine is an integral part of medical education, we make explicit our expectation that residents and students read something clinically relevant every day. To promote this, we have provided a Nifty Fifty reading list of key articles. The PDF of each article is provided, along with a brief summary highlighting key points.
Reading List for Gold Attendings and Support Staff
To promote a common understanding of leadership techniques, management books are provided to Gold attending physicians and other members of the team (eg, Care Coordinator, nurse researcher, systems redesign engineer). One book is discussed at each Gold team meeting (Table 3), with participants taking turns leading the discussion.
| Book Title | Author(s) |
|---|---|
| The One Minute Manager | Ken Blanchard and Spencer Johnson |
| Good to Great | Jim Collins |
| Good to Great and the Social Sectors | Jim Collins |
| The Checklist Manifesto: How to Get Things Right | Atul Gawande |
| The Five Dysfunctions of a Team: A Leadership Fable | Patrick Lencioni |
| Getting to Yes: Negotiating Agreement Without Giving In | Roger Fisher, William Ury, and Bruce Patton |
| The Effective Executive: The Definitive Guide to Getting the Right Things Done | Peter Drucker |
| A Sense of Urgency | John Kotter |
| The Power of Positive Deviance: How Unlikely Innovators Solve the World's Toughest Problems | Richard Pascale, Jerry Sternin, and Monique Sternin |
| On the Mend: Revolutionizing Healthcare to Save Lives and Transform the Industry | John Toussaint and Roger Gerard |
| Outliers: The Story of Success | Malcolm Gladwell |
| Nursing Against the Odds: How Health Care Cost Cutting, Media Stereotypes, and Medical Hubris Undermine Nurses and Patient Care | Suzanne Gordon |
| How the Mighty Fall and Why Some Companies Never Give In | Jim Collins |
| What the Best College Teachers Do | Ken Bain |
| The Creative Destruction of Medicine | Eric Topol |
| What Got You Here Won't Get You There: How Successful People Become Even More Successful! | Marshall Goldsmith |
Website
A HOPE Initiative website was created (
Qualitative Assessment
To evaluate our efforts, we conducted a thorough qualitative assessment during the third year of the program. A total of 35 semistructured qualitative interviews were conducted with patients and staff from all levels of the organization, including senior leadership. The qualitative assessment was led by research staff from the Center for Clinical Management Research, who were minimally involved in the redesign effort and could provide an unbiased view of the initiative. Field notes from the semistructured interviews were analyzed, with themes developed using a descriptive approach and through discussion by a multidisciplinary team, which included building team consensus on findings that were supported by clear evidence in the data.[17]
Quantitative Outcome Measures
Clinical Outcomes
To determine if our communication and educational interventions had an impact on patient care, we used hospital administrative data to evaluate admission rates, LOS, and readmission rates for all 4 of the medicine teams. Additional clinical measures were assessed as needed. For example, we monitored the impact of the clinical pharmacist during a 4‐week pilot study by asking the Clinical Care Coordinator to track the proportion of patient encounters (n=170) in which the clinical pharmacist changed management or provided education to team members. Additionally, 2 staff surveys were conducted. The first survey focused on healthcare‐worker communication and was given to inpatient nurses and physicians (including attendings, residents, and medical students) who were recently on an inpatient medical service rotation. The survey included questions from previously validated communication measures,[18, 19, 20] as well as study‐specific questions. The second survey evaluated the new role of the Clinical Care Coordinator (Appendix). Both physicians and nurses who interacted with the Gold team's Clinical Care Coordinator were asked to complete this survey.
Educational Outcomes
To assess the educational interventions, we used learner evaluations of attendings, by both residents and medical students, and standardized internal medicine National Board of Medical Examiners Subject Examination (or shelf) scores for third‐year medical students. A separate evaluation of medical student perceptions of the rounding structure introduced on the Gold team using survey design has already been published.[21]
Statistical Analyses
Data from all sources were analyzed using SAS 9.3 (SAS Institute, Inc., Cary, NC). Outliers for the LOS variable were removed from the analysis. Means and frequency distributions were examined for all variables. Student t tests and [2] tests of independence were used to compare data between groups. Multivariable linear regression models controlling for time (preintervention vs postintervention) were used to assess the effect of the HOPE Initiative on patient LOS and readmission rates. In all cases, 2‐tailed P values of 0.05 or less were considered statistically significant.
Role of the Funding Source
The VA Office of Systems Redesign provided funding but was not involved in the design or conduct of the study, data analysis, or preparation of the manuscript.
RESULTS
Clinical Outcomes
Patient Outcomes
Our multivariable linear regression analysis, controlling for time, showed a significant reduction in LOS of approximately 0.3 days on all teams after the HOPE Initiative began (P=0.004). There were no significant differences between the Gold and non‐Gold teams in the multivariate models when controlling for time for any of the patient‐outcome measures. The number of admissions increased for all 4 medical teams (Figure 1), but, as shown in Figures 2 and 3, the readmission rates for all teams remained relatively stable over this same period of time.
Clinical Pharmacist on Gold Team Rounds
The inpatient clinical pharmacist changed the management plan for 22% of the patients seen on rounds. Contributions from the clinical pharmacist included adjusting the dosing of ordered medication and correcting medication reconciliation. Education and pharmaceutical information was provided to the team in another 6% of the 170 consecutive patient encounters evaluated.
Perception of Circle of Concern Rounds
Circle of Concern rounds were generally well‐received by both nurses and physicians. In a healthcare‐worker communication survey, completed by 38 physicians (62% response rate) and 48 nurses (54% response rate), the majority of both physicians (83%) and nurses (68%) felt Circle of Concern rounds improved communication.
Nurse Perception of Communication
The healthcare‐worker communication survey asked inpatient nurses to rate communication between nurses and physicians on each of the 4 medicine teams. Significantly more nurses were satisfied with communication with the Gold team (71%) compared with the other 3 medicine teams (53%; P=0.02) (Figure 4).
Perception of the Clinical Care Coordinator
In total, 20 physicians (87% response rate) and 10 nurses (56% response rate) completed the Clinical Care Coordinator survey. The physician results were overwhelmingly positive: 100% were satisfied or very satisfied with the role; 100% felt each team should have a Clinical Care Coordinator; and 100% agreed or strongly agreed that the Clinical Care Coordinator ensures that appropriate follow‐up is arranged, provides continuity of care, assists with interdisciplinary communication, and helps facilitate discharge. The majority of nurses was also satisfied or very satisfied with the Clinical Care Coordinator role and felt each team should have one.
Educational Outcomes
House Officer Evaluation of Attendings
Monthly evaluations of attending physicians by house officers (Figure 5) revealed that prior to the HOPE Initiative, little differences were observed between teams, as would be expected because attending assignment was largely random. After the intervention date of July 2009, however, significant differences were noted, with Gold team attendings receiving significantly higher teaching evaluations immediately after the introduction of the HOPE Initiative. Although ratings for Gold attendings remained more favorable, the difference was no longer statistically significant in the second and third year of the initiative, likely due to Gold attendings serving on other medicine teams, which contributed to an improvement in ratings of all attendings.
Medical Student Evaluation of Attendings
Monthly evaluations of attending physicians by third‐year medical students (Figure 6) revealed differences between the Gold attendings and all others, with the attendings that joined the Gold team in 2009 receiving higher teaching evaluations even before the HOPE Initiative started. However, this difference remained statistically significant in years 2 and 3 postinitiative, despite the addition of 4 new junior attendings.
Medical Student Medicine Shelf Scores
The national average on the shelf exam, which reflects learning after the internal medicine third‐year clerkship, has ranged from 75 to 78 for the past several years, with University of Michigan students averaging significantly higher scores prior to and after the HOPE Initiative. However, following the HOPE Initiative, third‐year medical students on the Gold team scored significantly higher on the shelf exam compared with their colleagues on the non‐Gold teams (84 vs 82; P=0.006). This difference in the shelf exam scores, although small, is statistically significant. It represents a measurable improvement in shelf scores in our system and demonstrates the potential educational benefit for the students. Over this same time period, scores on the United States Medical Licensing Exam, given to medical students at the beginning of their third year, remained stable (233 preHOPE Initiative; 234 postHOPE Initiative).
Qualitative Assessment
Qualitative data collected as part of our evaluation of the HOPE Initiative also suggested that nurse‐physician communication had improved since the start of the project. In particular, they reported positively on the Gold team in general, the Circle of Concern rounds, and the Clinical Care Coordinator (Table 4).
| Staff Type | Statement1 |
|---|---|
| |
| Nurse | [Gold is] above and beyond other [teams]. Other teams don't run as smoothly. |
| Nurse | There has been a difference in communication [on Gold]. You can tell the difference in how they communicate with staff. We know the Clinical Care Coordinator or charge nurse is rounding with that team, so there is more communication. |
| Nurse | The most important thing that has improved communication is the Circle of Concern rounds. |
| Physician | [The Gold Clinical Care Coordinator] expedites care, not only what to do but who to call. She can convey the urgency. On rounds she is able to break off, put in an order, place a call, talk to a patient. Things that we would do at 11 AM she gets to at 9 AM. A couple of hours may not seem like much, but sometimes it can make the difference between things happening that day instead of the next. |
| Physician | The Clinical Care Coordinator is completely indispensable. Major benefit to providing care to Veterans. |
| Physician | I like to think Gold has lifted all of the teams to a higher level. |
| Medical student | It may be due to personalities vs the Gold [team] itself, but there is more emphasis on best practices. Are we following guidelines even if it is not related to the primary reason for admission? |
| Medical student | Gold is very collegial and nurses/physicians know one another by name. Physicians request rather than order; this sets a good example to me on how to approach the nurses. |
| Chief resident | [Gold attendings] encourage senior residents to take charge and run the team, although the attending is there for back‐up and support. This provides great learning for the residents. Interns and medical students also are affected because they have to step up their game as well. |
DISCUSSION
Within academic medical centers, hospitalists are expected to care for patients, teach, and help improve the quality and efficiency of hospital‐based care.[7] The Department of Veterans Affairs runs the largest integrated healthcare system in the United States, with approximately 80% of VA hospitals having hospital medicine programs. Overall, one‐third of US residents perform part of their residency training at a VA hospital.[22, 23] Thus, the effects of a system‐wide change at a VA hospital may have implications throughout the country. We studied one such intervention. Our primary findings are that we were able to improve communication and learner education with minimal effects on patient outcomes. While overall LOS decreased slightly postintervention, after taking into account secular trends, readmission rates did not.
We are not the first to evaluate a hospital medicine team using a quasi‐experimental design. For example, Meltzer and colleagues evaluated a hospitalist program at the University of Chicago Medical Center and found that, by the second year of operation, hospitalist care was associated with significantly shorter LOS (0.49 days), reduced costs, and decreased mortality.[24] Auerbach also evaluated a newly created hospital medicine service, finding decreased LOS (0.61 days), lower costs, and lower risk of mortality by the second year of the program.[25]
Improving nurse‐physician communication is considered important for avoiding medical error,[26] yet there has been limited empirical study of methods to improve communication within the medical profession.[27] Based both on our surveys and qualitative interviews, healthcare‐worker communication appeared to improve on the Gold team during the study. A key component of this improvement is likely related to instituting Circle of Concern rounds, in which nurses joined the medical team during attending rounds. Such an intervention likely helped to address organizational silence[28] and enhance the psychological safety of the nursing staff, because the attending physician was proactive about soliciting the input of nurses during rounds.[29] Such leader inclusivenesswords and deeds exhibited by leaders that invite and appreciate others' contributionscan aid interdisciplinary teams in overcoming the negative effects of status differences, thereby promoting collaboration.[29] The inclusion of nurses on rounds is also relationship‐building, which Gotlib Conn and colleagues found was important to improved interprofessional communication and collaboration.[30] In the future, using a tool such as the Teamwork Effectiveness Assessment Module (TEAM) developed by the American Board of Internal Medicine[31] could provide further evaluation of the impact on interprofessional teamwork and communication.
The focus on learner education, though evaluated in prior studies, is also novel. One previous survey of medical students showed that engaging students in substantive discussions is associated with greater student satisfaction.[32] Another survey of medical students found that attendings who were enthusiastic about teaching, inspired confidence in knowledge and skills, provided useful feedback, and encouraged increased student responsibility were viewed as more effective teachers.[33] No previous study that we are aware of, however, has looked at actual educational outcomes, such as shelf scores. The National Board of Medical Examiners reports that the Medicine subject exam is scaled to have a mean of 70 and a standard deviation of 8.[34] Thus, a mean increase in score of 2 points is small, but not trivial. This shows improvement in a hard educational outcome. Additionally, 2 points, although small in the context of total score and standard deviation, may make a substantial difference to an individual student in terms of overall grade, and, thus, residency applications. Our finding that third‐year medical students on the Gold team performed significantly better than University of Michigan third‐year medical students on other teams is an intriguing finding that warrants confirmation. On the other hand, this finding is consistent with a previous report evaluating learner satisfaction in which Bodnar et al found improved ratings of quantity and quality of teaching on teams with a nontraditional structure (Gold team).[21] Moreover, despite relatively few studies, the reason underlying the educational benefit of hospitalists should surprise few. The hospitalist model ensures that learners are supervised by physicians who are experts in the care of hospitalized patients.[35] Hospitalists hired at teaching hospitals to work on services with learners are generally chosen because they possess superior educational skills.[7]
Our findings should be interpreted in the context of the following limitations. First, our study focused on a single academically affiliated VA hospital. As other VA hospitals are pursuing a similar approach (eg, the Houston and Detroit VA medical centers), replicating our results will be important. Second, the VA system, although the largest integrated healthcare system in the United States, has unique characteristicssuch as an integrated electronic health record and predominantly male patient populationthat may make generalizations to the larger US healthcare system challenging. Third, there was a slightly lower response rate among nurses on a few of the surveys to evaluate our efforts; however, this rate of response is standard at our facility. Finally, our evaluation lacks an empirical measure of healthcare‐worker communication, such as incident reports.
Despite these limitations, our results have important implications. Using both quantitative and qualitative assessment, we found that academic hospitalists have the ability to improve healthcare‐worker communication and enhance learner education without increasing LOS. These findings are directly applicable to VA medical centers and potentially applicable to other academic medical centers.
Acknowledgments
The authors thank Milisa Manojlovich, PhD, RN, Edward Kennedy, MS, and Andrew Hickner, MSI, for help with preparation of this manuscript.
Disclosures: This work was funded by a US Department of Veterans Affairs, Office of Systems Redesign Improvement Capability grant. The findings and conclusions in this report are those of the authors and do not necessarily represent the position or policy of the Department of Veterans Affairs. Dr. Saint reports receiving travel reimbursement for giving invited talks at the Society of Hospital Medicine's National Meeting, as well as serving on the advisory boards of Doximity and Jvion.
APPENDIX
Survey to Evaluate the Care Coordinator Position
| Yes | No | Not Sure | |
| Q1. Are you familiar with the role of the Care Coordinator on the Gold Service (Susan Lee)? | 1 | 2 | 3 |
Please indicate how much you agree or disagree with the statements below.
| Strongly Agree | Agree | Neutral | Disagree | Strongly Disagree | Don't Know | |
| Q2. The Care Coordinator ensures that appropriate primary care follow‐up and any other appropriate services are arranged. | 1 | 2 | 3 | 4 | 5 | 9 |
| Q3. The Care Coordinator provides continuity of patient care on the Gold Service. | 1 | 2 | 3 | 4 | 5 | 9 |
| Q4. The Care Coordinator helps educate House Officers and Medical Students on VA processes (e.g., CPRS). | 1 | 2 | 3 | 4 | 5 | 9 |
| Q5. The Care Coordinator assists with interdisciplinary communication between the medical team and other services (e.g., nursing, ambulatory care, pharmacy, social work) | 1 | 2 | 3 | 4 | 5 | 9 |
| Q6. The Care Coordinator helps facilitate patient discharge. | 1 | 2 | 3 | 4 | 5 | 9 |
| Q7. The Care Coordinator initiates communication with the ambulatory care teams to coordinate care. | 1 | 2 | 3 | 4 | 5 | 9 |
| Yes | No | |
| Q8. Are you a physician (attending or resident), or medical student who has been on more than one medical team at the VA (Gold, Silver, Burgundy, or Yellow)? | 1 | 2 |
If no, please skip to Q13
If yes, comparing your experience on the Gold Service (with the Care Coordinator) to your experience on any of the other services (Silver, Burgundy, or Yellow):
| Not at All | Very Little | Somewhat | To a Great Extent | |
| Q9. To what extent does the presence of a Care Coordinator affect patient care? | 1 | 2 | 3 | 4 |
| Q10. To what extent does the presence of a Care Coordinator improve patient flow? | 1 | 2 | 3 | 4 |
| Q11. To what extent does the presence of a Care Coordinator assist with education? | 1 | 2 | 3 | 4 |
| Q12. To what extent does the presence of a Care Coordinator contribute to attending rounds? | 1 | 2 | 3 | 4 |
| Yes | No | |
| Q13. Do you work [as a nurse] in ambulatory care? | 1 | 2 |
If no, please skip to Q17.
If yes, comparing your experience with the Gold Service (with the Care Coordinator) to the other services (Silver, Burgundy, or Yellow):
| Not at All | Very Little | Somewhat | To a Great Extent | |
| Q14. To what extent does the presence of a Care Coordinator improve coordination of care between inpatient and outpatient services? | 1 | 2 | 3 | 4 |
| Q15. To what extent does the presence of a Care Coordinator help identify high risk patients who require follow‐up? | 1 | 2 | 3 | 4 |
| Q16. To what extent does the presence of a Care Coordinator ensure follow‐up appointments are scheduled? | 1 | 2 | 3 | 4 |
| Yes | No | Not Sure | |
| Q17. Do you think each medical team should have a Care Coordinator? | 1 | 2 | 3 |
| Q18. Are there any additional tasks or duties you think would improve the effectiveness of the Care Coordinator? |
| Very Satisfied | Satisfied | Neutral | Dissatisfied | Very Dissatisfied | |
| Q19. Overall how satisfied are you with the role of the Care Coordinator on the Gold Service? | 1 | 2 | 3 | 4 | 5 |
| Q20. Do you have any other comments about the role of the Care Coordinator? |
| Q21. What is your position? |
| 1. Physician (attending or resident) or medical student |
| 2. Nurse (inpatient or ambulatory care) |
- Kohn LT, Corrigan JM, Donaldson MS, eds. To Err Is Human: Building a Safer Health System. Washington, D.C.: National Academies Press; 2000.
- Institute of Medicine of the National Academies. Crossing the Quality Chasm: A New Health System for the 21st Century. Washington, D.C.: National Academies Press; 2001.
- , , , . Growth in the care of older patients by hospitalists in the United States. N Engl J Med. 2009;360(11):1102–1112.
- . Growth in care provided by hospitalists. N Engl J Med. 2009;360(26):2789–2791.
- American Hospital Association. AHA Annual Survey of Hospitals, 2010. Chicago, IL: Health Forum, LLC; 2010.
- , , , . Preventing hospital‐acquired infections: a national survey of practices reported by U.S. hospitals in 2005 and 2009. J Gen Intern Med. 2012;27(7):773–779.
- , . Hospitalists in teaching hospitals: opportunities but not without danger. J Gen Intern Med. 2004;19(4):392–393.
- , . Do hospitalist physicians improve the quality of inpatient care delivery? A systematic review of process, efficiency and outcome measures. BMC Med. 2011;9:58.
- , , , . Effect of hospitalist attending physicians on trainee educational experiences: a systematic review. J Hosp Med. 2009;4(8):490–498.
- , , , , , . Resident satisfaction on an academic hospitalist service: time to teach. Am J Med. 2002;112(7):597–601.
- , , , et al. The positive impact of initiation of hospitalist clinician educators. J Gen Intern Med. 2004;19(4):293–301.
- , . Third‐year medical students' evaluation of hospitalist and nonhospitalist faculty during the inpatient portion of their pediatrics clerkships. J Hosp Med. 2007;2(1):17–22.
- , , , . Medical student evaluation of the quality of hospitalist and nonhospitalist teaching faculty on inpatient medicine rotations. Acad Med. 2004;79(1):78–82.
- , , , , . Reorganizing an academic medical service: impact on cost, quality, patient satisfaction, and education. JAMA. 1998;279(19):1560–1565.
- . Nurse/physician communication through a sensemaking lens: shifting the paradigm to improve patient safety. Med Care. 2010;48(11):941–946.
- . Nursing Against the Odds: How Health Care Cost Cutting, Media Stereotypes, and Medical Hubris Undermine Nurses and Patient Care. Ithaca, NY: Cornell University Press; 2005.
- . Focus on research methods: whatever happened to qualitative description? Res Nurs Health. 2000;23:334–340.
- , , , , . Organizational assessment in intensive care units (ICUs): construct development, reliability, and validity of the ICU nurse‐physician questionnaire. Med Care. 1991;29(8):709–726.
- . Development of an instrument to measure collaboration and satisfaction about care decisions. J Adv Nurs. 1994;20(1):176–182.
- . Development of the practice environment scale of the Nursing Work Index. Res Nurs Health. 2002;25(3):176–188.
- , , . Does the structure of inpatient rounds affect medical student education? Int J Med Educ. 2013;4:96–100.
- U.S. Department of Veterans Affairs, Office of Academic Affiliations. Medical and Dental Education Program. Available at: http://www.va. gov/oaa/GME_default.asp. Published 2012. Accessed May 08, 2013.
- , . Graduate medical education, 2011–2012. JAMA. 2012;308(21):2264–2279.
- , , , et al. Effects of physician experience on costs and outcomes on an academic general medicine service: results of a trial of hospitalists. Ann Intern Med. 2002;137(11):866–874.
- , , , , , . Implementation of a voluntary hospitalist service at a community teaching hospital: improved clinical efficiency and patient outcomes. Ann Intern Med. 2002;137(11):859–865.
- , , . Communication failures: an insidious contributor to medical mishaps. Acad Med. 2004;79(2):186–194.
- , , . ‘It depends': medical residents' perspectives on working with nurses. Am J Nurs. 2009;109(7):34–44.
- , . Organizational silence: a barrier to change and development in a pluralistic world. Acad Manage Rev. 2000;25(4):706–725.
- , . Making it safe: the effects of leader inclusiveness and professional status on psychological safety and improvement efforts in health care teams. J Organiz Behav. 2006;27:941–966.
- , , , , . Interprofessional communication with hospitalist and consultant physicians in general internal medicine: a qualitative study. BMC Health Serv Res. 2012;12:437.
- , , , , , . A new tool to give hospitalists feedback to improve interprofessional teamwork and advance patient care. Health Aff (Millwood). 2012;31(11):2485–2492.
- , , , , , . Impact of instructional practices on student satisfaction with attendings' teaching in the inpatient component of internal medicine clerkships. J Gen Intern Med. 2006;21(1):7–12.
- , . Medical students' perceptions of the elements of effective inpatient teaching by attending physicians and housestaff. J Gen Intern Med. 2005;20(7):635–639.
- National Board of Medical Examiners Subject Examination Program. Internal Medicine Advanced Clinical Examination, score interpretation guide. Available at: http://www.nbme.org/PDF/SampleScoreReports/Internal_Medicine_ACE_Score_Report.pdf. Published 2011. Accessed September 13, 2013.
- . The impact of hospitalists on medical education and the academic health system. Ann Intern Med. 1999;130(4 part 2):364–367.
© 2013 Society of The Authors. Journal of Hospital Medicine published by Wiley Periodicals, Inc. on behalf of Society of Hospital Medicine.