User login
Regional Variation in Standardized Costs of Care at Children’s Hospitals
With some areas of the country spending close to 3 times more on healthcare than others, regional variation in healthcare spending has been the focus of national attention.1-7 Since 1973, the Dartmouth Institute has studied regional variation in healthcare utilization and spending and concluded that variation is “unwarranted” because it is driven by providers’ practice patterns rather than differences in medical need, patient preferences, or evidence-based medicine.8-11 However, critics of the Dartmouth Institute’s findings argue that their approach does not adequately adjust for community-level income, and that higher costs in some areas reflect greater patient needs that are not reflected in illness acuity alone.12-14
While Medicare data have made it possible to study variations in spending for the senior population, fragmentation of insurance coverage and nonstandardized data structures make studying the pediatric population more difficult. However, the Children’s Hospital Association’s (CHA) Pediatric Health Information System (PHIS) has made large-scale comparisons more feasible. To overcome challenges associated with using charges and nonuniform cost data, PHIS-derived standardized costs provide new opportunities for comparisons.15,16 Initial analyses using PHIS data showed significant interhospital variations in costs of care,15 but they did not adjust for differences in populations and assess the drivers of variation. A more recent study that controlled for payer status, comorbidities, and illness severity found that intensive care unit (ICU) utilization varied significantly for children hospitalized for asthma, suggesting that hospital practice patterns drive differences in cost.17
This study uses PHIS data to analyze regional variations in standardized costs of care for 3 conditions for which children are hospitalized. To assess potential drivers of variation, the study investigates the effects of patient-level demographic and illness-severity variables as well as encounter-level variables on costs of care. It also estimates cost savings from reducing variation.
METHODS
Data Source
This retrospective cohort study uses the PHIS database (CHA, Overland Park, KS), which includes 48 freestanding children’s hospitals located in noncompeting markets across the United States and accounts for approximately 20% of pediatric hospitalizations. PHIS includes patient demographics, International Classification of Diseases, 9th Revision (ICD-9) diagnosis and procedure codes, as well as hospital charges. In addition to total charges, PHIS reports imaging, laboratory, pharmacy, and “other” charges. The “other” category aggregates clinical, supply, room, and nursing charges (including facility fees and ancillary staff services).
Inclusion Criteria
Inpatient- and observation-status hospitalizations for asthma, diabetic ketoacidosis (DKA), and acute gastroenteritis (AGE) at 46 PHIS hospitals from October 2014 to September 2015 were included. Two hospitals were excluded because of missing data. Hospitalizations for patients >18 years were excluded.
Hospitalizations were categorized by using All Patient Refined-Diagnosis Related Groups (APR-DRGs) version 24 (3M Health Information Systems, St. Paul, MN)18 based on the ICD-9 diagnosis and procedure codes assigned during the episode of care. Analyses included APR-DRG 141 (asthma), primary diagnosis ICD-9 codes 250.11 and 250.13 (DKA), and APR-DRG 249 (AGE). ICD-9 codes were used for DKA for increased specificity.19 These conditions were chosen to represent 3 clinical scenarios: (1) a diagnosis for which hospitals differ on whether certain aspects of care are provided in the ICU (asthma), (2) a diagnosis that frequently includes care in an ICU (DKA), and (3) a diagnosis that typically does not include ICU care (AGE).19
Study Design
To focus the analysis on variation in resource utilization across hospitals rather than variations in hospital item charges, each billed resource was assigned a standardized cost.15,16 For each clinical transaction code (CTC), the median unit cost was calculated for each hospital. The median of the hospital medians was defined as the standardized unit cost for that CTC.
The primary outcome variable was the total standardized cost for the hospitalization adjusted for patient-level demographic and illness-severity variables. Patient demographic and illness-severity covariates included age, race, gender, ZIP code-based median annual household income (HHI), rural-urban location, distance from home ZIP code to the hospital, chronic condition indicator (CCI), and severity-of-illness (SOI). When assessing drivers of variation, encounter-level covariates were added, including length of stay (LOS) in hours, ICU utilization, and 7-day readmission (an imprecise measure to account for quality of care during the index visit). The contribution of imaging, laboratory, pharmacy, and “other” costs was also considered.
Median annual HHI for patients’ home ZIP code was obtained from 2010 US Census data. Community-level HHI, a proxy for socioeconomic status (SES),20,21 was classified into categories based on the 2015 US federal poverty level (FPL) for a family of 422: HHI-1 = ≤ 1.5 × FPL; HHI-2 = 1.5 to 2 × FPL; HHI-3 = 2 to 3 × FPL; HHI-4 = ≥ 3 × FPL. Rural-urban commuting area (RUCA) codes were used to determine the rural-urban classification of the patient’s home.23 The distance from home ZIP code to the hospital was included as an additional control for illness severity because patients traveling longer distances are often more sick and require more resources.24
The Agency for Healthcare Research and Quality CCI classification system was used to identify the presence of a chronic condition.25 For asthma, CCI was flagged if the patient had a chronic condition other than asthma; for DKA, CCI was flagged if the patient had a chronic condition other than DKA; and for AGE, CCI was flagged if the patient had any chronic condition.
The APR-DRG system provides a 4-level SOI score with each APR-DRG category. Patient factors, such as comorbid diagnoses, are considered in severity scores generated through 3M’s proprietary algorithms.18
For the first analysis, the 46 hospitals were categorized into 7 geographic regions based on 2010 US Census Divisions.26 To overcome small hospital sample sizes, Mountain and Pacific were combined into West, and Middle Atlantic and New England were combined into North East. Because PHIS hospitals are located in noncompeting geographic regions, for the second analysis, we examined hospital-level variation (considering each hospital as its own region).
Data Analysis
To focus the analysis on “typical” patients and produce more robust estimates of central tendencies, the top and bottom 5% of hospitalizations with the most extreme standardized costs by condition were trimmed.27 Standardized costs were log-transformed because of their nonnormal distribution and analyzed by using linear mixed models. Covariates were added stepwise to assess the proportion of the variance explained by each predictor. Post-hoc tests with conservative single-step stepwise mutation model corrections for multiple testing were used to compare adjusted costs. Statistical analyses were performed using SAS version 9.3 (SAS Institute, Cary, NC). P values < 0.05 were considered significant. The Children’s Hospital of Philadelphia Institutional Review Board did not classify this study as human subjects research.
RESULTS
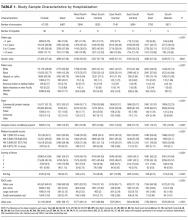

During the study period, there were 26,430 hospitalizations for asthma, 5056 for DKA, and 16,274 for AGE (Table 1).
Variation Across Census Regions
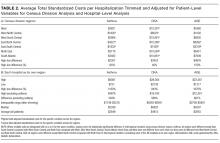
After adjusting for patient-level demographic and illness-severity variables, differences in adjusted total standardized costs remained between regions (P < 0.001). Although no region was an outlier compared to the overall mean for any of the conditions, regions were statistically different in pairwise comparison. The East North Central, South Atlantic, and West South Central regions had the highest adjusted total standardized costs for each of the conditions. The East South Central and West North Central regions had the lowest costs for each of the conditions. Adjusted total standardized costs were 120% higher for asthma ($1920 vs $4227), 46% higher for DKA ($7429 vs $10,881), and 150% higher for AGE ($3316 vs $8292) in the highest-cost region compared with the lowest-cost region (Table 2A).
Variation Within Census Regions

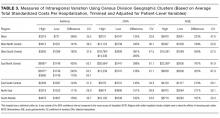
After controlling for patient-level demographic and illness-severity variables, standardized costs were different across hospitals in the same region (P < 0.001; panel A in Figure). This was true for all conditions in each region. Differences between the lowest- and highest-cost hospitals within the same region ranged from 111% to 420% for asthma, 101% to 398% for DKA, and 166% to 787% for AGE (Table 3).
Variation Across Hospitals (Each Hospital as Its Own Region)
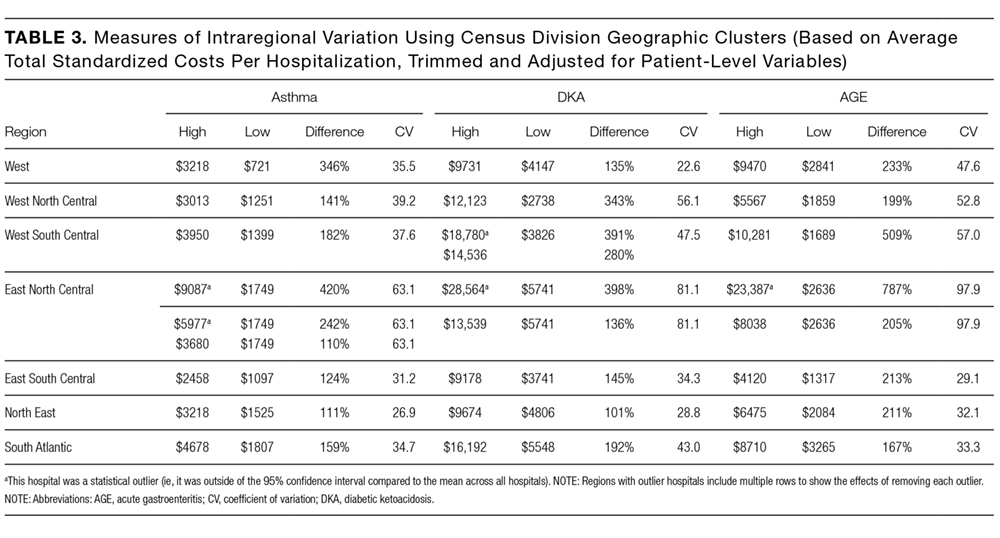
One hospital had the highest adjusted standardized costs for all 3 conditions ($9087 for asthma, $28,564 for DKA, and $23,387 for AGE) and was outside of the 95% confidence interval compared with the overall means. The second highest-cost hospitals for asthma ($5977) and AGE ($18,780) were also outside of the 95% confidence interval. After removing these outliers, the difference between the highest- and lowest-cost hospitals was 549% for asthma ($721 vs $4678), 491% for DKA ($2738 vs $16,192), and 681% for AGE ($1317 vs $10,281; Table 2B).
Drivers of Variation Across Census Regions
Patient-level demographic and illness-severity variables explained very little of the variation in standardized costs across regions. For each of the conditions, age, race, gender, community-level HHI, RUCA, and distance from home to the hospital each accounted for <1.5% of variation, while SOI and CCI each accounted for <5%. Overall, patient-level variables explained 5.5%, 3.7%, and 6.7% of variation for asthma, DKA, and AGE.
Encounter-level variables explained a much larger percentage of the variation in costs. LOS accounted for 17.8% of the variation for asthma, 9.8% for DKA, and 8.7% for AGE. ICU utilization explained 6.9% of the variation for asthma and 12.5% for DKA; ICU use was not a major driver for AGE. Seven-day readmissions accounted for <0.5% for each of the conditions. The combination of patient-level and encounter-level variables explained 27%, 24%, and 15% of the variation for asthma, DKA, and AGE.
Drivers of Variation Across Hospitals
For each of the conditions, patient-level demographic variables each accounted for <2% of variation in costs between hospitals. SOI accounted for 4.5% of the variation for asthma and CCI accounted for 5.2% for AGE. Overall, patient-level variables explained 6.9%, 5.3%, and 7.3% of variation for asthma, DKA, and AGE.
Encounter-level variables accounted for a much larger percentage of the variation in cost. LOS explained 25.4% for asthma, 13.3% for DKA, and 14.2% for AGE. ICU utilization accounted for 13.4% for asthma and 21.9% for DKA; ICU use was not a major driver for AGE. Seven-day readmissions accounted for <0.5% for each of the conditions. Together, patient-level and encounter-level variables explained 40%, 36%, and 22% of variation for asthma, DKA, and AGE.
Imaging, Laboratory, Pharmacy, and “Other” Costs
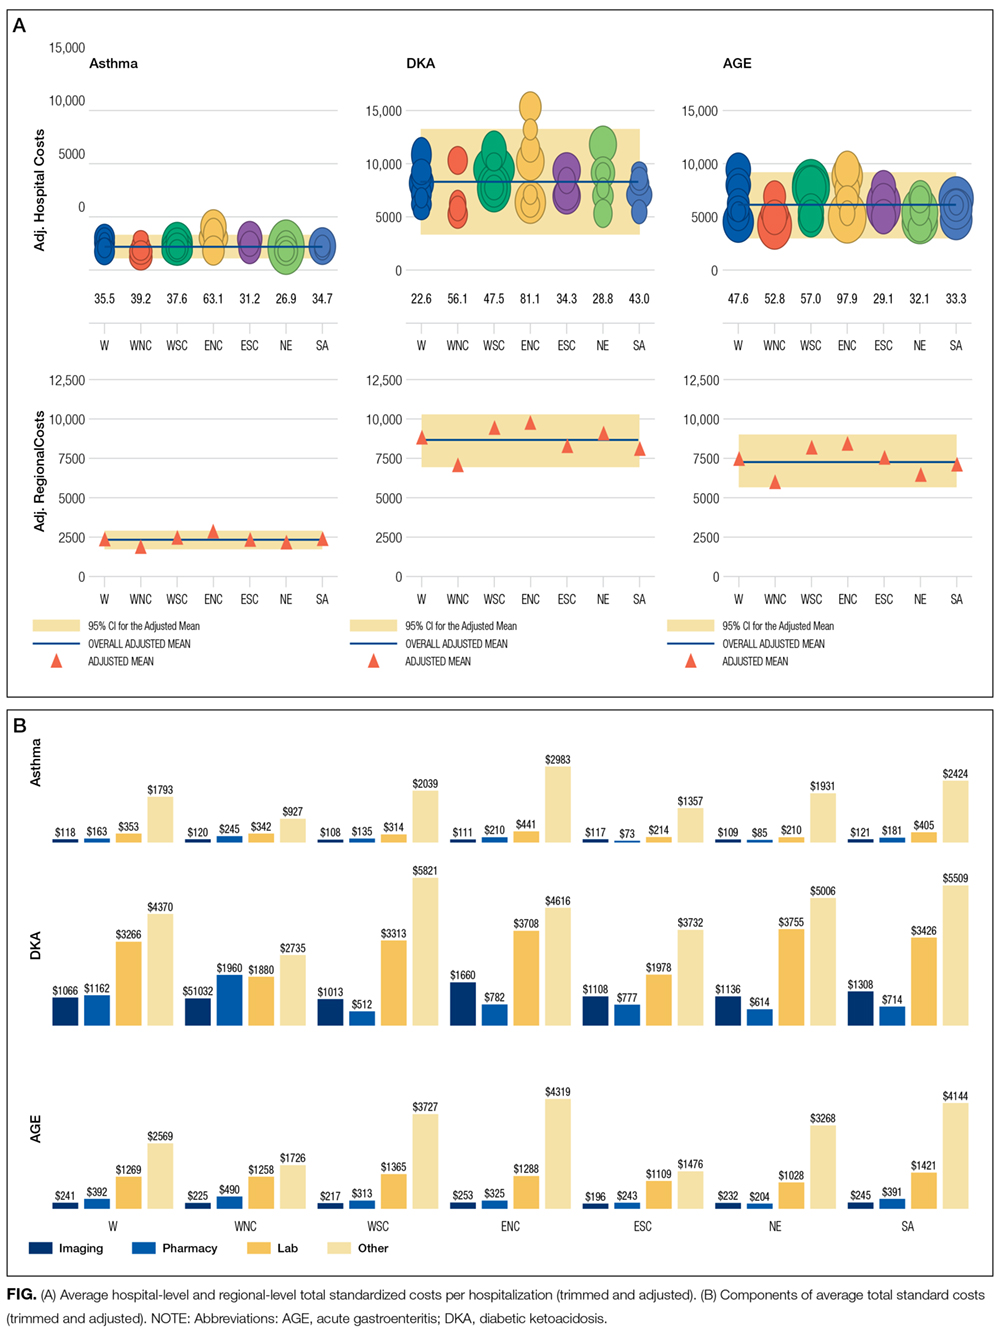
The largest contributor to total costs adjusted for patient-level factors for all conditions was “other,” which aggregates room, nursing, clinical, and supply charges (panel B in Figure). When considering drivers of variation, this category explained >50% for each of the conditions. The next largest contributor to total costs was laboratory charges, which accounted for 15% of the variation across regions for asthma and 11% for DKA. Differences in imaging accounted for 18% of the variation for DKA and 15% for AGE. Differences in pharmacy charges accounted for <4% of the variation for each of the conditions. Adding the 4 cost components to the other patient- and encounter-level covariates, the model explained 81%, 78%, and 72% of the variation across census regions for asthma, DKA, and AGE.
For the hospital-level analysis, differences in “other” remained the largest driver of cost variation. For asthma, “other” explained 61% of variation, while pharmacy, laboratory, and imaging each accounted for <8%. For DKA, differences in imaging accounted for 18% of the variation and laboratory charges accounted for 12%. For AGE, imaging accounted for 15% of the variation. Adding the 4 cost components to the other patient- and encounter-level covariates, the model explained 81%, 72%, and 67% of the variation for asthma, DKA, and AGE.
Cost Savings
If all hospitals in this cohort with adjusted standardized costs above the national PHIS average achieved costs equal to the national PHIS average, estimated annual savings in adjusted standardized costs for these 3 conditions would be $69.1 million. If each hospital with adjusted costs above the average within its census region achieved costs equal to its regional average, estimated annual savings in adjusted standardized costs for these conditions would be $25.2 million.
DISCUSSION
This study reported on the regional variation in costs of care for 3 conditions treated at 46 children’s hospitals across 7 geographic regions, and it demonstrated that variations in costs of care exist in pediatrics. This study used standardized costs to compare utilization patterns across hospitals and adjusted for several patient-level demographic and illness-severity factors, and it found that differences in costs of care for children hospitalized with asthma, DKA, and AGE remained both between and within regions.
These variations are noteworthy, as hospitals strive to improve the value of healthcare. If the higher-cost hospitals in this cohort could achieve costs equal to the national PHIS averages, estimated annual savings in adjusted standardized costs for these conditions alone would equal $69.1 million. If higher-cost hospitals relative to the average in their own region reduced costs to their regional averages, annual standardized cost savings could equal $25.2 million for these conditions.
The differences observed are also significant in that they provide a foundation for exploring whether lower-cost regions or lower-cost hospitals achieve comparable quality outcomes.28 If so, studying what those hospitals do to achieve outcomes more efficiently can serve as the basis for the establishment of best practices.29 Standardizing best practices through protocols, pathways, and care-model redesign can reduce potentially unnecessary spending.30
Our findings showed that patient-level demographic and illness-severity covariates, including community-level HHI and SOI, did not consistently explain cost differences. Instead, LOS and ICU utilization were associated with higher costs.17,19 When considering the effect of the 4 cost components on the variation in total standardized costs between regions and between hospitals, the fact that the “other” category accounted for the largest percent of the variation is not surprising, because the cost of room occupancy and nursing services increases with longer LOS and more time in the ICU. Other individual cost components that were major drivers of variation were laboratory utilization for asthma and imaging for DKA and AGE31 (though they accounted for a much smaller proportion of total adjusted costs).19
To determine if these factors are modifiable, more information is needed to explain why practices differ. Many factors may contribute to varying utilization patterns, including differences in capabilities and resources (in the hospital and in the community) and patient volumes. For example, some hospitals provide continuous albuterol for status asthmaticus only in ICUs, while others provide it on regular units.32 But if certain hospitals do not have adequate resources or volumes to effectively care for certain populations outside of the ICU, their higher-value approach (considering quality and cost) may be to utilize ICU beds, even if some other hospitals care for those patients on non-ICU floors. Another possibility is that family preferences about care delivery (such as how long children stay in the hospital) may vary across regions.33
Other evidence suggests that physician practice and spending patterns are strongly influenced by the practices of the region where they trained.34 Because physicians often practice close to where they trained,35,36 this may partially explain how regional patterns are reinforced.
Even considering all mentioned covariates, our model did not fully explain variation in standardized costs. After adding the cost components as covariates, between one-third and one-fifth of the variation remained unexplained. It is possible that this unexplained variation stemmed from unmeasured patient-level factors.
In addition, while proxies for SES, including community-level HHI, did not significantly predict differences in costs across regions, it is possible that SES affected LOS differently in different regions. Previous studies have suggested that lower SES is associated with longer LOS.37 If this effect is more pronounced in certain regions (potentially because of differences in social service infrastructures), SES may be contributing to variations in cost through LOS.
Our findings were subject to limitations. First, this study only examined 3 diagnoses and did not include surgical or less common conditions. Second, while PHIS includes tertiary care, academic, and freestanding children’s hospitals, it does not include general hospitals, which is where most pediatric patients receive care.38 Third, we used ZIP code-based median annual HHI to account for SES, and we used ZIP codes to determine the distance to the hospital and rural-urban location of patients’ homes. These approximations lack precision because SES and distances vary within ZIP codes.39 Fourth, while adjusted standardized costs allow for comparisons between hospitals, they do not represent actual costs to patients or individual hospitals. Additionally, when determining whether variation remained after controlling for patient-level variables, we included SOI as a reflection of illness-severity at presentation. However, in practice, SOI scores may be assigned partially based on factors determined during the hospitalization.18 Finally, the use of other regional boundaries or the selection of different hospitals may yield different results.
CONCLUSION
This study reveals regional variations in costs of care for 3 inpatient pediatric conditions. Future studies should explore whether lower-cost regions or lower-cost hospitals achieve comparable quality outcomes. To the extent that variation is driven by modifiable factors and lower spending does not compromise outcomes, these data may prompt reviews of care models to reduce unwarranted variation and improve the value of care delivery at local, regional, and national levels.
Disclosure
Internal funds from the CHA and The Children’s Hospital of Philadelphia supported the conduct of this work. The authors have no financial interests, relationships, or affiliations relevant to the subject matter or materials discussed in the manuscript to disclose. The authors have no potential conflicts of interest relevant to the subject matter or materials discussed in the manuscript to disclose
1. Fisher E, Skinner J. Making Sense of Geographic Variations in Health Care: The New IOM Report. 2013; http://healthaffairs.org/blog/2013/07/24/making-sense-of-geographic-variations-in-health-care-the-new-iom-report/. Accessed on April 11, 2014.
With some areas of the country spending close to 3 times more on healthcare than others, regional variation in healthcare spending has been the focus of national attention.1-7 Since 1973, the Dartmouth Institute has studied regional variation in healthcare utilization and spending and concluded that variation is “unwarranted” because it is driven by providers’ practice patterns rather than differences in medical need, patient preferences, or evidence-based medicine.8-11 However, critics of the Dartmouth Institute’s findings argue that their approach does not adequately adjust for community-level income, and that higher costs in some areas reflect greater patient needs that are not reflected in illness acuity alone.12-14
While Medicare data have made it possible to study variations in spending for the senior population, fragmentation of insurance coverage and nonstandardized data structures make studying the pediatric population more difficult. However, the Children’s Hospital Association’s (CHA) Pediatric Health Information System (PHIS) has made large-scale comparisons more feasible. To overcome challenges associated with using charges and nonuniform cost data, PHIS-derived standardized costs provide new opportunities for comparisons.15,16 Initial analyses using PHIS data showed significant interhospital variations in costs of care,15 but they did not adjust for differences in populations and assess the drivers of variation. A more recent study that controlled for payer status, comorbidities, and illness severity found that intensive care unit (ICU) utilization varied significantly for children hospitalized for asthma, suggesting that hospital practice patterns drive differences in cost.17
This study uses PHIS data to analyze regional variations in standardized costs of care for 3 conditions for which children are hospitalized. To assess potential drivers of variation, the study investigates the effects of patient-level demographic and illness-severity variables as well as encounter-level variables on costs of care. It also estimates cost savings from reducing variation.
METHODS
Data Source
This retrospective cohort study uses the PHIS database (CHA, Overland Park, KS), which includes 48 freestanding children’s hospitals located in noncompeting markets across the United States and accounts for approximately 20% of pediatric hospitalizations. PHIS includes patient demographics, International Classification of Diseases, 9th Revision (ICD-9) diagnosis and procedure codes, as well as hospital charges. In addition to total charges, PHIS reports imaging, laboratory, pharmacy, and “other” charges. The “other” category aggregates clinical, supply, room, and nursing charges (including facility fees and ancillary staff services).
Inclusion Criteria
Inpatient- and observation-status hospitalizations for asthma, diabetic ketoacidosis (DKA), and acute gastroenteritis (AGE) at 46 PHIS hospitals from October 2014 to September 2015 were included. Two hospitals were excluded because of missing data. Hospitalizations for patients >18 years were excluded.
Hospitalizations were categorized by using All Patient Refined-Diagnosis Related Groups (APR-DRGs) version 24 (3M Health Information Systems, St. Paul, MN)18 based on the ICD-9 diagnosis and procedure codes assigned during the episode of care. Analyses included APR-DRG 141 (asthma), primary diagnosis ICD-9 codes 250.11 and 250.13 (DKA), and APR-DRG 249 (AGE). ICD-9 codes were used for DKA for increased specificity.19 These conditions were chosen to represent 3 clinical scenarios: (1) a diagnosis for which hospitals differ on whether certain aspects of care are provided in the ICU (asthma), (2) a diagnosis that frequently includes care in an ICU (DKA), and (3) a diagnosis that typically does not include ICU care (AGE).19
Study Design
To focus the analysis on variation in resource utilization across hospitals rather than variations in hospital item charges, each billed resource was assigned a standardized cost.15,16 For each clinical transaction code (CTC), the median unit cost was calculated for each hospital. The median of the hospital medians was defined as the standardized unit cost for that CTC.
The primary outcome variable was the total standardized cost for the hospitalization adjusted for patient-level demographic and illness-severity variables. Patient demographic and illness-severity covariates included age, race, gender, ZIP code-based median annual household income (HHI), rural-urban location, distance from home ZIP code to the hospital, chronic condition indicator (CCI), and severity-of-illness (SOI). When assessing drivers of variation, encounter-level covariates were added, including length of stay (LOS) in hours, ICU utilization, and 7-day readmission (an imprecise measure to account for quality of care during the index visit). The contribution of imaging, laboratory, pharmacy, and “other” costs was also considered.
Median annual HHI for patients’ home ZIP code was obtained from 2010 US Census data. Community-level HHI, a proxy for socioeconomic status (SES),20,21 was classified into categories based on the 2015 US federal poverty level (FPL) for a family of 422: HHI-1 = ≤ 1.5 × FPL; HHI-2 = 1.5 to 2 × FPL; HHI-3 = 2 to 3 × FPL; HHI-4 = ≥ 3 × FPL. Rural-urban commuting area (RUCA) codes were used to determine the rural-urban classification of the patient’s home.23 The distance from home ZIP code to the hospital was included as an additional control for illness severity because patients traveling longer distances are often more sick and require more resources.24
The Agency for Healthcare Research and Quality CCI classification system was used to identify the presence of a chronic condition.25 For asthma, CCI was flagged if the patient had a chronic condition other than asthma; for DKA, CCI was flagged if the patient had a chronic condition other than DKA; and for AGE, CCI was flagged if the patient had any chronic condition.
The APR-DRG system provides a 4-level SOI score with each APR-DRG category. Patient factors, such as comorbid diagnoses, are considered in severity scores generated through 3M’s proprietary algorithms.18
For the first analysis, the 46 hospitals were categorized into 7 geographic regions based on 2010 US Census Divisions.26 To overcome small hospital sample sizes, Mountain and Pacific were combined into West, and Middle Atlantic and New England were combined into North East. Because PHIS hospitals are located in noncompeting geographic regions, for the second analysis, we examined hospital-level variation (considering each hospital as its own region).
Data Analysis
To focus the analysis on “typical” patients and produce more robust estimates of central tendencies, the top and bottom 5% of hospitalizations with the most extreme standardized costs by condition were trimmed.27 Standardized costs were log-transformed because of their nonnormal distribution and analyzed by using linear mixed models. Covariates were added stepwise to assess the proportion of the variance explained by each predictor. Post-hoc tests with conservative single-step stepwise mutation model corrections for multiple testing were used to compare adjusted costs. Statistical analyses were performed using SAS version 9.3 (SAS Institute, Cary, NC). P values < 0.05 were considered significant. The Children’s Hospital of Philadelphia Institutional Review Board did not classify this study as human subjects research.
RESULTS
During the study period, there were 26,430 hospitalizations for asthma, 5056 for DKA, and 16,274 for AGE (Table 1).
Variation Across Census Regions
After adjusting for patient-level demographic and illness-severity variables, differences in adjusted total standardized costs remained between regions (P < 0.001). Although no region was an outlier compared to the overall mean for any of the conditions, regions were statistically different in pairwise comparison. The East North Central, South Atlantic, and West South Central regions had the highest adjusted total standardized costs for each of the conditions. The East South Central and West North Central regions had the lowest costs for each of the conditions. Adjusted total standardized costs were 120% higher for asthma ($1920 vs $4227), 46% higher for DKA ($7429 vs $10,881), and 150% higher for AGE ($3316 vs $8292) in the highest-cost region compared with the lowest-cost region (Table 2A).
Variation Within Census Regions
After controlling for patient-level demographic and illness-severity variables, standardized costs were different across hospitals in the same region (P < 0.001; panel A in Figure). This was true for all conditions in each region. Differences between the lowest- and highest-cost hospitals within the same region ranged from 111% to 420% for asthma, 101% to 398% for DKA, and 166% to 787% for AGE (Table 3).
Variation Across Hospitals (Each Hospital as Its Own Region)
One hospital had the highest adjusted standardized costs for all 3 conditions ($9087 for asthma, $28,564 for DKA, and $23,387 for AGE) and was outside of the 95% confidence interval compared with the overall means. The second highest-cost hospitals for asthma ($5977) and AGE ($18,780) were also outside of the 95% confidence interval. After removing these outliers, the difference between the highest- and lowest-cost hospitals was 549% for asthma ($721 vs $4678), 491% for DKA ($2738 vs $16,192), and 681% for AGE ($1317 vs $10,281; Table 2B).
Drivers of Variation Across Census Regions
Patient-level demographic and illness-severity variables explained very little of the variation in standardized costs across regions. For each of the conditions, age, race, gender, community-level HHI, RUCA, and distance from home to the hospital each accounted for <1.5% of variation, while SOI and CCI each accounted for <5%. Overall, patient-level variables explained 5.5%, 3.7%, and 6.7% of variation for asthma, DKA, and AGE.
Encounter-level variables explained a much larger percentage of the variation in costs. LOS accounted for 17.8% of the variation for asthma, 9.8% for DKA, and 8.7% for AGE. ICU utilization explained 6.9% of the variation for asthma and 12.5% for DKA; ICU use was not a major driver for AGE. Seven-day readmissions accounted for <0.5% for each of the conditions. The combination of patient-level and encounter-level variables explained 27%, 24%, and 15% of the variation for asthma, DKA, and AGE.
Drivers of Variation Across Hospitals
For each of the conditions, patient-level demographic variables each accounted for <2% of variation in costs between hospitals. SOI accounted for 4.5% of the variation for asthma and CCI accounted for 5.2% for AGE. Overall, patient-level variables explained 6.9%, 5.3%, and 7.3% of variation for asthma, DKA, and AGE.
Encounter-level variables accounted for a much larger percentage of the variation in cost. LOS explained 25.4% for asthma, 13.3% for DKA, and 14.2% for AGE. ICU utilization accounted for 13.4% for asthma and 21.9% for DKA; ICU use was not a major driver for AGE. Seven-day readmissions accounted for <0.5% for each of the conditions. Together, patient-level and encounter-level variables explained 40%, 36%, and 22% of variation for asthma, DKA, and AGE.
Imaging, Laboratory, Pharmacy, and “Other” Costs
The largest contributor to total costs adjusted for patient-level factors for all conditions was “other,” which aggregates room, nursing, clinical, and supply charges (panel B in Figure). When considering drivers of variation, this category explained >50% for each of the conditions. The next largest contributor to total costs was laboratory charges, which accounted for 15% of the variation across regions for asthma and 11% for DKA. Differences in imaging accounted for 18% of the variation for DKA and 15% for AGE. Differences in pharmacy charges accounted for <4% of the variation for each of the conditions. Adding the 4 cost components to the other patient- and encounter-level covariates, the model explained 81%, 78%, and 72% of the variation across census regions for asthma, DKA, and AGE.
For the hospital-level analysis, differences in “other” remained the largest driver of cost variation. For asthma, “other” explained 61% of variation, while pharmacy, laboratory, and imaging each accounted for <8%. For DKA, differences in imaging accounted for 18% of the variation and laboratory charges accounted for 12%. For AGE, imaging accounted for 15% of the variation. Adding the 4 cost components to the other patient- and encounter-level covariates, the model explained 81%, 72%, and 67% of the variation for asthma, DKA, and AGE.
Cost Savings
If all hospitals in this cohort with adjusted standardized costs above the national PHIS average achieved costs equal to the national PHIS average, estimated annual savings in adjusted standardized costs for these 3 conditions would be $69.1 million. If each hospital with adjusted costs above the average within its census region achieved costs equal to its regional average, estimated annual savings in adjusted standardized costs for these conditions would be $25.2 million.
DISCUSSION
This study reported on the regional variation in costs of care for 3 conditions treated at 46 children’s hospitals across 7 geographic regions, and it demonstrated that variations in costs of care exist in pediatrics. This study used standardized costs to compare utilization patterns across hospitals and adjusted for several patient-level demographic and illness-severity factors, and it found that differences in costs of care for children hospitalized with asthma, DKA, and AGE remained both between and within regions.
These variations are noteworthy, as hospitals strive to improve the value of healthcare. If the higher-cost hospitals in this cohort could achieve costs equal to the national PHIS averages, estimated annual savings in adjusted standardized costs for these conditions alone would equal $69.1 million. If higher-cost hospitals relative to the average in their own region reduced costs to their regional averages, annual standardized cost savings could equal $25.2 million for these conditions.
The differences observed are also significant in that they provide a foundation for exploring whether lower-cost regions or lower-cost hospitals achieve comparable quality outcomes.28 If so, studying what those hospitals do to achieve outcomes more efficiently can serve as the basis for the establishment of best practices.29 Standardizing best practices through protocols, pathways, and care-model redesign can reduce potentially unnecessary spending.30
Our findings showed that patient-level demographic and illness-severity covariates, including community-level HHI and SOI, did not consistently explain cost differences. Instead, LOS and ICU utilization were associated with higher costs.17,19 When considering the effect of the 4 cost components on the variation in total standardized costs between regions and between hospitals, the fact that the “other” category accounted for the largest percent of the variation is not surprising, because the cost of room occupancy and nursing services increases with longer LOS and more time in the ICU. Other individual cost components that were major drivers of variation were laboratory utilization for asthma and imaging for DKA and AGE31 (though they accounted for a much smaller proportion of total adjusted costs).19
To determine if these factors are modifiable, more information is needed to explain why practices differ. Many factors may contribute to varying utilization patterns, including differences in capabilities and resources (in the hospital and in the community) and patient volumes. For example, some hospitals provide continuous albuterol for status asthmaticus only in ICUs, while others provide it on regular units.32 But if certain hospitals do not have adequate resources or volumes to effectively care for certain populations outside of the ICU, their higher-value approach (considering quality and cost) may be to utilize ICU beds, even if some other hospitals care for those patients on non-ICU floors. Another possibility is that family preferences about care delivery (such as how long children stay in the hospital) may vary across regions.33
Other evidence suggests that physician practice and spending patterns are strongly influenced by the practices of the region where they trained.34 Because physicians often practice close to where they trained,35,36 this may partially explain how regional patterns are reinforced.
Even considering all mentioned covariates, our model did not fully explain variation in standardized costs. After adding the cost components as covariates, between one-third and one-fifth of the variation remained unexplained. It is possible that this unexplained variation stemmed from unmeasured patient-level factors.
In addition, while proxies for SES, including community-level HHI, did not significantly predict differences in costs across regions, it is possible that SES affected LOS differently in different regions. Previous studies have suggested that lower SES is associated with longer LOS.37 If this effect is more pronounced in certain regions (potentially because of differences in social service infrastructures), SES may be contributing to variations in cost through LOS.
Our findings were subject to limitations. First, this study only examined 3 diagnoses and did not include surgical or less common conditions. Second, while PHIS includes tertiary care, academic, and freestanding children’s hospitals, it does not include general hospitals, which is where most pediatric patients receive care.38 Third, we used ZIP code-based median annual HHI to account for SES, and we used ZIP codes to determine the distance to the hospital and rural-urban location of patients’ homes. These approximations lack precision because SES and distances vary within ZIP codes.39 Fourth, while adjusted standardized costs allow for comparisons between hospitals, they do not represent actual costs to patients or individual hospitals. Additionally, when determining whether variation remained after controlling for patient-level variables, we included SOI as a reflection of illness-severity at presentation. However, in practice, SOI scores may be assigned partially based on factors determined during the hospitalization.18 Finally, the use of other regional boundaries or the selection of different hospitals may yield different results.
CONCLUSION
This study reveals regional variations in costs of care for 3 inpatient pediatric conditions. Future studies should explore whether lower-cost regions or lower-cost hospitals achieve comparable quality outcomes. To the extent that variation is driven by modifiable factors and lower spending does not compromise outcomes, these data may prompt reviews of care models to reduce unwarranted variation and improve the value of care delivery at local, regional, and national levels.
Disclosure
Internal funds from the CHA and The Children’s Hospital of Philadelphia supported the conduct of this work. The authors have no financial interests, relationships, or affiliations relevant to the subject matter or materials discussed in the manuscript to disclose. The authors have no potential conflicts of interest relevant to the subject matter or materials discussed in the manuscript to disclose
1. Fisher E, Skinner J. Making Sense of Geographic Variations in Health Care: The New IOM Report. 2013; http://healthaffairs.org/blog/2013/07/24/making-sense-of-geographic-variations-in-health-care-the-new-iom-report/. Accessed on April 11, 2014.
1. Fisher E, Skinner J. Making Sense of Geographic Variations in Health Care: The New IOM Report. 2013; http://healthaffairs.org/blog/2013/07/24/making-sense-of-geographic-variations-in-health-care-the-new-iom-report/. Accessed on April 11, 2014.
© 2017 Society of Hospital Medicine
Readmission Analysis Using Fault Tree
As physicians strive to increase the value of healthcare delivery, there has been increased focus on improving the quality of care that patients receive while lowering per capita costs. A provision of the Affordable Care Act implemented in 2012 identified all‐cause 30‐day readmission rates as a measure of hospital quality, and as part of the Act's Hospital Readmission and Reduction Program, Medicare now penalizes hospitals with higher than expected all‐cause readmissions rates for adult patients with certain conditions by lowering reimbursements.[1] Although readmissions are not yet commonly used to determine reimbursements for pediatric hospitals, several states are penalizing higher than expected readmission rates for Medicaid enrollees,[2, 3] using an imprecise algorithm to determine which readmissions resulted from low‐quality care during the index admission.[4, 5, 6]
There is growing concern, however, that readmission rates are not an accurate gauge of the quality of care patients receive while in the hospital or during the discharge process to prepare them for their transition home.[7, 8, 9, 10] This is especially true in pediatric settings, where overall readmission rates are much lower than in adult settings, many readmissions are expected as part of a patient's planned course of care, and variation in readmission rates between hospitals is correlated with the percentage of patients with certain complex chronic conditions.[1, 7, 11] Thus, there is increasing agreement that hospitals and external evaluators need to shift the focus from all‐cause readmissions to a reliable, consistent, and fair measure of potentially preventable readmissions.[12, 13] In addition to being a more useful quality metric, analyzing preventable readmissions will help hospitals focus resources on patients with potentially modifiable risk factors and develop meaningful quality‐improvement initiatives to improve inpatient care as well as the discharge process to prepare families for their transition to home.[14]
Although previous studies have attempted to distinguish preventable from nonpreventable readmissions, many reported significant challenges in completing reviews efficiently, achieving consistency in how readmissions were classified, and attaining consensus on final determinations.[12, 13, 14] Studies have also demonstrated that the algorithms some states are using to streamline preventability reviews and determine reimbursements overestimate the rate of potentially preventable readmissions.[4, 5, 6]
To increase the efficiency of preventability reviews and reduce the subjectivity involved in reaching final determinations, while still accounting for the nuances necessary to conduct a fair review, a quality‐improvement team from the Division of General Pediatrics at The Children's Hospital of Philadelphia (CHOP) implemented a fault tree analysis tool based on a framework developed by Howard Parker at Intermountain Primary Children's Hospital. The CHOP team coded this framework into a secure Web‐based data‐collection tool in the form of a decision tree to guide reviewers through a logical progression of questions that result in 1 of 18 root causes of readmissions, 8 of which are considered potentially preventable. We hypothesized that this method would help reviewers efficiently reach consensus on the root causes of hospital readmissions, and thus help the division and the hospital focus efforts on developing relevant quality‐improvement initiatives.
METHODS
Inclusion Criteria and Study Design
This study was conducted at CHOP, a 535‐bed urban, tertiary‐care, freestanding children's hospital with approximately 29,000 annual discharges. Of those discharges, 7000 to 8000 are from the general pediatrics service, meaning that the attending of record was a general pediatrician. Patients were included in the study if (1) they were discharged from the general pediatrics service between January 2014 and December 2014, and (2) they were readmitted to the hospital, for any reason, within 15 days of discharge. Because this analysis was done as part of a quality‐improvement initiative, it focuses on 15‐day, early readmissions to target cases with a higher probability of being potentially preventable from the perspective of the hospital care team.[10, 12, 13] Patients under observation status during the index admission or the readmission were included. However, patients who returned to the emergency department but were not admitted to an inpatient unit were excluded. Objective details about each case, including the patient's name, demographics, chart number, and diagnosis code, were pre‐loaded from EPIC (Epic Systems Corp., Verona, WI) into REDCap (Research Electronic Data Capture;
A panel of 10 general pediatricians divided up the cases to perform retrospective chart reviews. For each case, REDCap guided reviewers through the fault tree analysis. Reviewers met monthly to discuss difficult cases and reach consensus on any identified ambiguities in the process. After all cases were reviewed once, 3 panel members independently reviewed a random selection of cases to measure inter‐rater reliability and confirm reproducibility of final determinations. The inter‐rater reliability statistic was calculated using Stata 12.1 (StataCorp LP, College Station, TX). During chart reviews, panel members were not blinded to the identity of physicians and other staff members caring for the patients under review. CHOP's institutional review board determined this study to be exempt from ongoing review.
Fault Tree Analysis
Using the decision tree framework for analyzing readmissions that was developed at Intermountain Primary Children's Hospital, the REDCap tool prompted reviewers with a series of sequential questions, each with mutually exclusive options. Using imbedded branching logic to select follow‐up questions, the tool guided reviewers to 1 of 18 terminal nodes, each representing a potential root cause of the readmission. Of those 18 potential causes, 8 were considered potentially preventable. A diagram of the fault tree framework, color coded to indicate which nodes were considered potentially preventable, is shown in Figure 1.

RESULTS
In 2014, 7252 patients were discharged from the general pediatrics service at CHOP. Of those patients, 248 were readmitted within 15 days for an overall general pediatrics 15‐day readmission rate of 3.4%.
Preventability Analysis
Of the 248 readmissions, 233 (94.0%) were considered not preventable. The most common cause for readmission, which accounted for 145 cases (58.5%), was a patient developing an unpredictable problem related to the index diagnosis or a natural progression of the disease that required readmission. The second most common cause, which accounted for 53 cases (21.4%), was a patient developing a new condition unrelated to the index diagnosis or a readmission unrelated to the quality of care received during the index stay. The third most frequent cause, which accounted for 11 cases (4.4%), was a legitimate nonclinical readmission due to lack of alternative resources, psychosocial or economic factors, or case‐specific factors. Other nonpreventable causes of readmission, including scheduled readmissions, each accounted for 7 or fewer cases and <3% of total readmissions.
The 15 readmissions considered potentially preventable accounted for 6.0% of total readmissions and 0.2% of total discharges from the general pediatrics service in 2014. The most common cause of preventable readmissions, which accounted for 6 cases, was premature discharge. The second most common cause, which accounted for 4 cases, was a problem resulting from nosocomial or iatrogenic factors. Other potentially preventable causes included delayed detection of problem (3 cases), inappropriate readmission (1 case), and inadequate postdischarge care planning (1 case).
A breakdown of fault tree results, including examples of cases associated with each terminal node, is shown in Table 1. Information about general pediatrics patients and readmitted patients is included in Tables 2 and 3. A breakdown of determinations for each reviewer is included in Supporting Table 1 in the online version of this article.
| Fault Tree Terminal Node | Root Cause of Readmission | No. of Cases | % of Total Readmissions | % Within Preventability Category | % of Total Discharges |
|---|---|---|---|---|---|
| |||||
| 2 (Potentially Preventable) | Problematic condition on discharge. Example:* Index admission: Infant with history of prematurity admitted with RSV and rhinovirus bronchiolitis. Had some waxing and waning symptoms. Just prior to discharge, noted to have increased work of breathing related to feeds. Readmission: 12 hours later with tachypnea, retractions, and hypoxia. | 6 | 2.4% | 40.0% | 0.08% |
| 3 (Potentially Preventable) | Nosocomial/Iatrogenic factors. Example*: Index admission: Toddler admitted with fever and neutropenia. Treated with antibiotics 24 hours. Diagnosed with viral illness and discharged home. Readmission: symptomatic Clostridum difficile infection. | 4 | 1.6% | 26.7% | 0.06% |
| 8 (Potentially Preventable) | Detection/treatment of problem was delayed and not appropriately facilitated. Example:* Index admission: Preteen admitted with abdominal pain, concern for appendicitis. Ultrasound and abdominal MRI negative for appendicitis. Symptoms improved. Tolerated PO. Readmission: 3 days later with similar abdominal pain. Diagnosed with constipation with significant improvement following clean‐out. | 3 | 1.2% | 20.0% | 0.04% |
| 1 (Potentially Preventable) | Inappropriate readmission. Example:* Index admission: Infant with laryngomalacia admitted with bronchiolitis. Readmission: Continued mild bronchiolitis symptoms but did not require oxygen or suctioning, normal CXR. | 1 | 0.4% | 6.7% | 0.01% |
| 5 (Potentially Preventable) | Resulted from inadequate postdischarge care planning. Example:* Index diagnosis: Infant with vomiting, prior admissions, and extensive evaluation, diagnosed with milk protein allergy and GERD. PPI increased. Readmission: Persistent symptoms, required NGT feeds supplementation. | 1 | 0.4% | 6.7% | 0.01% |
| 4 (Potentially Preventable) | Resulted from a preventable complication and hospital/physician did not take the appropriate steps to minimize likelihood of complication. | ||||
| 6 (Potentially Preventable) | Resulted from improper care by patient/family and effort by hospital/physician to ensure correct postdischarge care was inadequate. | ||||
| 7 (Potentially Preventable) | Resulted from inadequate care by community services and effort by hospital/physician to ensure correct postdischarge care was inadequate. | ||||
| 15 | 6.0% | 100% | 0.2% | ||
| 12 (Not Preventable) | Problem was unpredictable. Example:* Index admission: Infant admitted with gastroenteritis and dehydration with an anion gap metabolic acidosis. Vomiting and diarrhea improved, rehydrated, acidosis improved. Readmission: 1 day later, presented with emesis and fussiness. Readmitted for metabolic acidosis. | 145 | 58.5% | 62.2% | 2.00% |
| 10 (Not Preventable) | Patient developed new condition unrelated to index diagnosis or quality of care. Example:* Index admission: Toddler admitted with cellulitis. Readmission: Bronchiolitis (did not meet CDC guidelines for nosocomial infection). | 53 | 21.4% | 22.7% | 0.73% |
| 9 (Not Preventable) | Legitimate nonclinical readmission. Example:* Index admission: Infant admitted with second episode of bronchiolitis. Readmission: 4 days later with mild diarrhea. Tolerated PO challenge in emergency department. Admitted due to parental anxiety. | 11 | 4.4% | 4.7% | 0.15% |
| 17 (Not Preventable) | Problem resulted from improper care by patient/family but effort by hospital/physician to ensure correct postdischarge care was appropriate. Example:* Index admission: Infant admitted with diarrhea, diagnosed with milk protein allergy. Discharged on soy formula. Readmission: Developed vomiting and diarrhea with cow milk formula. | 7 | 2.8% | 3.0% | 0.10% |
| 11 (Not Preventable) | Scheduled readmission. Example:* Index admission: Infant with conjunctivitis and preseptal cellulitis with nasolacrimal duct obstruction. Readmission: Postoperatively following scheduled nasolacrimal duct repair. | 7 | 2.8% | 3.0% | 0.10% |
| 14 (Not Preventable) | Detection/treatment of problem was delayed, but earlier detection was not feasible. Example:* Index admission: Preteen admitted with fever, abdominal pain, and elevated inflammatory markers. Fever resolved and symptoms improved. Diagnosed with unspecified viral infection. Readmission: 4 days later with lower extremity pyomyositis and possible osteomyelitis. | 4 | 1.6% | 1.7% | 0.06% |
| 15 (Not Preventable) | Detection/treatment of problem was delayed, earlier detection was feasible, but detection was appropriately facilitated. Example:* Index admission: Infant with history of laryngomalacia and GER admitted with an ALTE. No events during hospitalization. Appropriate workup and cleared by consultants for discharge. Zantac increased. Readmission: Infant had similar ALTE events within a week after discharge. Ultimately underwent supraglottoplasty. | 2 | 0.8% | 0.9% | 0.03% |
| 13 (Not Preventable) | Resulted from preventable complication but efforts to minimize likelihood were appropriate. Example:* Index admission: Patient on GJ feeds admitted for dislodged GJ. Extensive conversations between primary team and multiple consulting services regarding best type of tube. Determined that no other tube options were appropriate. Temporizing measures were initiated. Readmission: GJ tube dislodged again. | 2 | 0.8% | 0.9% | 0.03% |
| 18 (Not Preventable) | Resulted from medication side effect (after watch period). Example:* Index admission: Preteen with MSSA bacteremia spread to other organs. Sent home on appropriate IV antibiotics. Readmission: Fever, rash, increased LFTs. Blood cultures negative. Presumed drug reaction. Fevers resolved with alternate medication. | 2 | 0.8% | 0.9% | 0.03% |
| 16 (Not Preventable) | Resulted from inadequate care by community services, but effort by hospital/physician to ensure correct postdischarge care was appropriate. | ||||
| 233 | 94.0% | 100% | 3.2% | ||
| Fault Tree Terminal Node | Root Cause of Potentially Preventable Readmission with Case Descriptions* |
|---|---|
| |
| 2 (Potentially Preventable) | Problematic condition on discharge |
| Case 1: Index admission: Infant with history of prematurity admitted with RSV and rhinovirus bronchiolitis. Had some waxing and waning symptoms. Just prior to discharge, noted to have increased work of breathing related to feeds. Readmission: 12 hours later with tachypnea, retractions, and hypoxia. | |
| Case 2: Index admission: Toddler admitted with febrile seizure in setting of gastroenteritis. Poor PO intake during hospitalization. Readmission: 1 day later with dehydration. | |
| Case 3: Index admission: Infant admitted with a prolonged complex febrile seizure. Workup included an unremarkable lumbar puncture. No additional seizures. No inpatient imaging obtained. Readmission: Abnormal outpatient MRI requiring intervention. | |
| Case 4: Index admission: Teenager with wheezing and history of chronic daily symptoms. Discharged <24 hours later on albuterol every 4 hours and prednisone. Readmission: 1 day later, seen by primary care physician with persistent asthma flare. | |
| Case 5: Index admission: Exfull‐term infant admitted with bronchiolitis, early in course. At time of discharge, had been off oxygen for 24 hours, but last recorded respiratory rate was >70. Readmission: 1 day later due to continued tachypnea and increased work of breathing. No hypoxia. CXR normal. | |
| Case 6: Exfull‐term infant admitted with bilious emesis, diarrhea, and dehydration. Ultrasound of pylorus, UGI, and BMP all normal. Tolerated oral intake but had emesis and loose stools prior to discharge. Readmission: <48 hours later with severe metabolic acidosis. | |
| 3 (Potentially Preventable) | Nosocomial/ematrogenic factors |
| Case 1: Index admission: Toddler admitted with fever and neutropenia. Treated with antibiotics 24 hours. Diagnosed with viral illness and discharged home. Readmission: Symptomatic Clostridum difficile infection. | |
| Case 2: Index admission: Patient with autism admitted with viral gastroenteritis. Readmission: Presumed nosocominal upper respiratory infection. | |
| Case 3: Index admission: Infant admitted with bronchiolitis. Recovered from initial infection. Readmission: New upper respiratory infection and presumed nosocomial infection. | |
| Case 4: Index admission: <28‐day‐old full‐term neonate presenting with neonatal fever and rash. Full septic workup performed and all cultures negative at 24 hours. Readmission: CSF culture positive at 36 hours and readmitted while awaiting speciation. Discharged once culture grew out a contaminant. | |
| 8 (Potentially Preventable) | Detection/treatment of problem was delayed and/or not appropriately facilitated |
| Case 1: Index admission: Preteen admitted with abdominal pain, concern for appendicitis. Ultrasound and MRI abdomen negative for appendicitis. Symptoms improved. Tolerated PO. Readmission: 3 days later with similar abdominal pain. Diagnosed with constipation with significant improvement following clean‐out. | |
| Case 2: Index admission: Infant with history of macrocephaly presented with fever and full fontanelle. Head CT showed mild prominence of the extra‐axial space, and lumbar puncture was normal. Readmission: Patient developed torticollis. MRI demonstrated a malignant lesion. | |
| Case 3: Index admission: School‐age child with RLQ abdominal pain, fever, leukocytosis, and indeterminate RLQ abdominal ultrasound. Twelve‐hour observation with no further fevers. Pain and appetite improved. Readmission: 1 day later with fever, anorexia, and abdominal pain. RLQ ultrasound unchanged. Appendectomy performed with inflamed appendix. | |
| 1 (Potentially Preventable) | Inappropriate readmission |
| Case 1: Index admission: Infant with laryngomalacia admitted with bronchiolitis. Readmission: Continued mild bronchiolitis symptoms but did not require oxygen or suctioning. Normal CXR. | |
| 5 (Potentially Preventable) | Resulted from inadequate postdischarge care planning |
| Case 1: Index diagnosis: Infant with vomiting, prior admissions, and extensive evaluation, diagnosed with milk protein allergy and GERD. PPI increased. Readmission: Persistent symptoms, required NGT feeds supplementation. | |
| All General Pediatrics Patients in 2014 | General Pediatric Readmitted Patients in 2014 | ||||
|---|---|---|---|---|---|
| Major Diagnosis Category at Index Admission | No. | % | Major Diagnosis Category at Index Admission | No. | % |
| |||||
| Respiratory | 2,723 | 37.5% | Respiratory | 79 | 31.9% |
| Digestive | 748 | 10.3% | Digestive | 41 | 16.5% |
| Ear, nose, mouth, throat | 675 | 9.3% | Ear, nose, mouth, throat | 24 | 9.7% |
| Skin, subcutaneous tissue | 480 | 6.6% | Musculoskeletal and connective tissue | 14 | 5.6% |
| Infectious, parasitic, systemic | 455 | 6.3% | Nervous | 13 | 5.2% |
| Factors influencing health status | 359 | 5.0% | Endocrine, nutritional, metabolic | 13 | 5.2% |
| Endocrine, nutritional, metabolic | 339 | 4.7% | Infectious, parasitic, systemic | 12 | 4.8% |
| Nervous | 239 | 3.3% | Newborn, neonate, perinatal period | 11 | 4.4% |
| Musculoskeletal and connective tissue | 228 | 3.1% | Hepatobiliary system and pancreas | 8 | 3.2% |
| Newborn, neonate, perinatal period | 206 | 2.8% | Skin, subcutaneous tissue | 8 | 3.2% |
| Other* | 800 | 11.0% | Other | 25 | 10.1% |
| Total | 7,252 | 100% | Total | 248 | 100% |
Inter‐Rater Reliability Analysis
A random selection of 50 cases (20% of total readmissions) was selected for a second review to test the tool's inter‐rater reliability. The second review resulted in the same terminal node for 44 (86%) of the cross‐checked files ( = 0.79; 95% confidence interval: 0.60‐0.98). Of the 6 cross‐checked files that ended at different nodes, 5 resulted in the same final determination about preventability. Only 1 of the cross‐checks (2% of total cross‐checked files) resulted in a different conclusion about preventability.
Efficiency Analysis
Reviewers reported that using the tool to reach a determination about preventability took approximately 20 minutes per case. Thus, initial reviews on the 248 cases required approximately 82.6 reviewer hours. Divided across 10 reviewers, this resulted in 8 to 9 hours of review time per reviewer over the year.
DISCUSSION
As part of an effort to direct quality‐improvement initiatives, this project used a Web‐based fault tree tool to identify root causes of general pediatrics readmissions at a freestanding children's hospital and classify them as either preventable or not preventable. The project also investigated the efficiency and inter‐rater reliability of the tool, which was designed to systematically guide physicians through the chart review process to a final determination about preventability. The project confirmed that using the tool helped reviewers reach final determinations about preventability efficiently with a high degree of consistency. It also confirmed that only a very small percentage of general pediatrics 15‐day readmissions are potentially preventable. Specifically, potentially preventable readmissions accounted for only 6.0% of total readmissions and 0.2% of general pediatrics discharges in 2014. Although our analysis focused on 15‐day readmissions, the fault tree methodology can be applied to any timeframe.
Previous studies attempting to distinguish preventable from nonpreventable readmissions, which used a range of methodologies to reach final determinations, reported that their review process was both time intensive and highly subjective. One study, which had 4 reviewers independently review charts and assign each case a preventability score on a 5‐point Likert scale, reported that reviewers disagreed on the final determination in 62.5% of cases.[12] Another study had 2 physicians independently review a selection of cases and assign a preventability score on a scale from 0 to 3. Scores for the 2 reviewers were added together, and cases above a certain composite threshold were classified as preventable. Despite being time‐intensive, this method resulted in only moderate agreement among physicians about the likelihood of preventability (weighted statistic of 0.44).[14] A more recent study, in which 2 physicians independently classified readmissions into 1 of 4 predefined categories, also reported only moderate agreement between reviewers ( = 0.44).[13] Other methods that have been reported include classifying readmissions as preventable only if multiple reviewers independently agreed, and using a third reviewer as a tie‐breaker.[14]
In an attempt to identify potentially preventable readmissions without using chart reviews, 3M (St. Paul, MN) developed its Potentially Preventable Readmissions software (3M‐PPR), which uses administrative data to identify which readmissions were potentially preventable. Although this automated approach is less time intensive, evidence suggests that due to a lack of nuance, the algorithm significantly overestimates the percentage of readmissions that are potentially preventable.[4, 5] A study that used 3M‐PPR to assess 1.7 million hospitalizations across 58 children's hospitals found that the algorithm classified 81% of sickle cell crisis and asthma readmissions, and 83% of bronchiolitis readmissions as potentially preventable.[10, 11] However, many readmissions for asthma and bronchiolitis are due to social factors that are outside of a hospital's direct control,[4, 5] and at many hospitals, readmissions for sickle cell crisis are part of a high‐value care model that weighs length of stay against potential readmissions. In addition, when assessing readmissions 7, 15, and 30 days after discharge, the algorithm classified almost the same percentage as potentially preventable, which is inconsistent with the notion that readmissions are more likely to have been preventable if they occurred closer to the initial discharge.[4, 13] Another study that assessed the performance of the software in the adult population reported that the algorithm performed with 85% sensitivity, but only 28% specificity.[5, 6]
The results of this quality‐improvement project indicate that using the fault tree tool to guide physicians through the chart review process helped address some of the shortcomings of methods reported in previous studies, by increasing the efficiency and reducing the subjectivity of final determinations, while still accounting for the nuances necessary to conduct a fair review. Because the tool provided a systematic framework for reviews, each case was completed in approximately 20 minutes, and because the process was the same for all reviewers, inter‐rater reliability was extremely high. In 86% of cross‐checked cases, the second reviewer ended at the same terminal node in the decision tree as the original reviewer, and in 98% of cross‐checked cases the second reviewer reached the same conclusion about preventability, even if they did not end at the same terminal node. Even accounting for agreement due to chance, the statistic of 0.79 confirmed that there was substantial agreement among reviewers about final determinations. Because the tool is easily adaptable, other hospitals can adopt this framework for their own preventability reviews and quality‐improvement initiatives.
Using the fault tree tool to access root causes of all 15‐day general pediatric readmissions helped the division focus quality‐improvement efforts on the most common causes of potentially preventable readmissions. Because 40% of potentially preventable readmissions were due to premature discharges, this prompted quality‐improvement teams to focus efforts on improving and clarifying the division's discharge criteria and clinical pathways. The division also initiated processes to improve discharge planning, including improved teaching of discharge instructions and having families pick up prescriptions prior to discharge.
Although these results did help the division identify a few areas of focus to potentially reduce readmissions, the fact that the overall 15‐day readmission rate for general pediatrics, as well as the percentage of readmissions and total discharges that were deemed potentially preventable, were so low (3.4%, 6.0%, and 0.2%, respectively), supports those who question whether prioritizing pediatric readmissions is the best place for hospitals to focus quality‐improvement efforts.[10, 12, 15, 16] As these results indicate, most pediatric readmissions are not preventable, and thus consistent with an efficient, effective, timely, patient‐centered, and equitable health system. Other studies have also shown that because overall and condition‐specific readmissions at pediatric hospitals are low, few pediatric hospitals are high or low performing for readmissions, and thus readmission rates are likely not a good measure of hospital quality.[8]
However, other condition‐specific studies of readmissions in pediatrics have indicated that there are some areas of opportunity to identify populations at high risk for readmission. One study found that although pneumonia‐specific 30‐day readmission rates in a national cohort of children hospitalized with pneumonia was only 3.1%, the chances of readmission were higher for children <1 year old, children with chronic comorbidities or complicated pneumonia, and children cared for in hospitals with lower volumes of pneumonia admissions.[17] Another study found that 17.1% of adolescents in a statewide database were readmitted post‐tonsillectomy for pain, nausea, and dehydration.[18] Thus, adapting the tool to identify root causes of condition‐specific or procedure‐specific readmissions, especially for surgical patients, may be an area of opportunity for future quality‐improvement efforts.[5] However, for general pediatrics, shifting the focus from reducing readmissions to improving the quality of care patients receive in the hospital, improving the discharge process, and adopting a population health approach to mitigate external risk factors, may be appropriate.
This project was subject to limitations. First, because it was conducted at a single site and only on general pediatrics patients, results may not be generalizable to other hospitals or other pediatric divisions. Thus, future studies might use the fault tree framework to assess preventability of pediatric readmissions in other divisions or specialties. Second, because readmissions to other hospitals were not included in the sample, the overall readmissions rate is likely underestimated.[19] However, it is unclear how this would affect the rate of potentially preventable readmissions. Third, although the fault tree framework reduced the subjectivity of the review process, there is still a degree of subjectivity inherent at each decision node. To minimize this, reviewers should try to discuss and come to consensus on how they are making determinations at each juncture in the decision tree. Similarly, because reviewers' answers to decision‐tree questions rely heavily on chart documentation, reviews may be compromised by unclear or incomplete documentation. For example, if information about steps the hospital team took to prepare a family for discharge were not properly documented, it would be difficult to determine whether appropriate steps were taken to minimize the likelihood of a complication. In the case of insufficient documentation of relevant social concerns, cases may be incorrectly classified as preventable, because addressing social issues is often not within a hospital's direct control. Finally, because reviewers were not blinded to the original discharging physician, there may have been some unconscious bias of unknown direction in the reviews.
CONCLUSION
Using the Web‐based fault tree tool helped physicians to identify the root causes of hospital readmissions and classify them as preventable or not preventable in a standardized, efficient, and consistent way, while still accounting for the nuances necessary to conduct a fair review. Thus, other hospitals should consider adopting this framework for their own preventability reviews and quality‐improvement initiatives. However, this project also confirmed that only a very small percentage of general pediatrics 15‐day readmissions are potentially preventable, suggesting that general pediatrics readmissions are not an appropriate measure of hospital quality. Instead, adapting the tool to identify root causes of condition‐specific or procedure‐specific readmission rates may be an area of opportunity for future quality‐improvement efforts.
Disclosures: This work was supported through internal funds from The Children's Hospital of Philadelphia. The authors have no financial interests, relationships or affiliations relevant to the subject matter or materials discussed in the article to disclose. The authors have no potential conflicts of interest relevant to the subject matter or materials discussed in the article to disclose.
- , . Pediatric readmissions as a hospital quality measure. JAMA. 2013;309(4):396–398.
- Texas Health and Human Services Commission. Potentially preventable readmissions in the Texas Medicaid population, state fiscal year 2012. Available at: http://www.hhsc.state.tx.us/reports/2013/ppr‐report.pdf. Published November 2013. Accessed August 16, 2015.
- Illinois Department of Healthcare and Family Services. Quality initiative to reduce hospital potentially preventable readmissions (PPR): Status update. Available at: http://www.illinois.gov/hfs/SiteCollectionDocuments/PPRPolicyStatusUpdate.pdf. Published September 3, 2014. Accessed August 16, 2015.
- , , , et al. Rates and impact of potentially preventable readmissions at children's hospitals. J Pediatr. 2015;166(3):613–619.e615.
- , . Preventing pediatric readmissions: which ones and how? J Pediatr. 2015;166(3):519–520.
- , , , , , . Manual and automated methods for identifying potentially preventable readmissions: a comparison in a large healthcare system. BMC Med Inform Decis Mak. 2014;14:28.
- , . Section on hospital medicine leadership and staff. Hosp Pediatr. 2013;3(4):390–393.
- , , , et al. Measuring hospital quality using pediatric readmission and revisit rates. Pediatrics. 2013;132(3):429–436.
- , . Hospital readmissions—not just a measure of quality. JAMA. 2011;306(16):1796–1797.
- , . Preventing readmissions in children: how do we do that? Hosp Pediatr. 2015;5(11):602–604.
- , , , et al. Pediatric readmission prevalence and variability across hospitals. JAMA. 2013;309(4):372–380.
- , , , , , . Preventability of early readmissions at a children's hospital. Pediatrics. 2013;131(1):e171–e181.
- , , , et al. An examination of physician‐, caregiver‐, and disease‐related factors associated with readmission from a pediatric hospital medicine service. Hosp Pediatr. 2015;5(11):566–573.
- , , , et al. Clinical preventability of 30‐day readmission after percutaneous coronary intervention. J Am Heart Assoc. 2014;3(5):e001290.
- . 3M algorithm overestimates preventable pediatric readmissions. Hospitalist News website. Available at: http://www.ehospitalistnews.com/specialty‐focus/pediatrics/single‐article‐page/3m‐algorithm‐overestimates‐preventable‐pediatric‐readmissions.html. Published August 16, 2013. Accessed August 16, 2015.
- . The 30‐day readmission rate: not a quality measure but an accountability measure. An Ounce of Evidence: Health Policy blog. Available at: https://blogs.sph.harvard.edu/ashish‐jha/?s=30‐day+readmission+rate. Published February 14, 2013. Accessed August 16, 2015.
- , , , et al. Readmissions among children previously hospitalized with pneumonia. Pediatrics. 2014;134(1):100–109.
- , , . A population‐based study of acute care revisits following tonsillectomy. J Pediatr. 2015;166(3):607–612.e605.
- , , , et al. Same‐hospital readmission rates as a measure of pediatric quality of care. JAMA Pediatr. 2015;169(10):905–912.
As physicians strive to increase the value of healthcare delivery, there has been increased focus on improving the quality of care that patients receive while lowering per capita costs. A provision of the Affordable Care Act implemented in 2012 identified all‐cause 30‐day readmission rates as a measure of hospital quality, and as part of the Act's Hospital Readmission and Reduction Program, Medicare now penalizes hospitals with higher than expected all‐cause readmissions rates for adult patients with certain conditions by lowering reimbursements.[1] Although readmissions are not yet commonly used to determine reimbursements for pediatric hospitals, several states are penalizing higher than expected readmission rates for Medicaid enrollees,[2, 3] using an imprecise algorithm to determine which readmissions resulted from low‐quality care during the index admission.[4, 5, 6]
There is growing concern, however, that readmission rates are not an accurate gauge of the quality of care patients receive while in the hospital or during the discharge process to prepare them for their transition home.[7, 8, 9, 10] This is especially true in pediatric settings, where overall readmission rates are much lower than in adult settings, many readmissions are expected as part of a patient's planned course of care, and variation in readmission rates between hospitals is correlated with the percentage of patients with certain complex chronic conditions.[1, 7, 11] Thus, there is increasing agreement that hospitals and external evaluators need to shift the focus from all‐cause readmissions to a reliable, consistent, and fair measure of potentially preventable readmissions.[12, 13] In addition to being a more useful quality metric, analyzing preventable readmissions will help hospitals focus resources on patients with potentially modifiable risk factors and develop meaningful quality‐improvement initiatives to improve inpatient care as well as the discharge process to prepare families for their transition to home.[14]
Although previous studies have attempted to distinguish preventable from nonpreventable readmissions, many reported significant challenges in completing reviews efficiently, achieving consistency in how readmissions were classified, and attaining consensus on final determinations.[12, 13, 14] Studies have also demonstrated that the algorithms some states are using to streamline preventability reviews and determine reimbursements overestimate the rate of potentially preventable readmissions.[4, 5, 6]
To increase the efficiency of preventability reviews and reduce the subjectivity involved in reaching final determinations, while still accounting for the nuances necessary to conduct a fair review, a quality‐improvement team from the Division of General Pediatrics at The Children's Hospital of Philadelphia (CHOP) implemented a fault tree analysis tool based on a framework developed by Howard Parker at Intermountain Primary Children's Hospital. The CHOP team coded this framework into a secure Web‐based data‐collection tool in the form of a decision tree to guide reviewers through a logical progression of questions that result in 1 of 18 root causes of readmissions, 8 of which are considered potentially preventable. We hypothesized that this method would help reviewers efficiently reach consensus on the root causes of hospital readmissions, and thus help the division and the hospital focus efforts on developing relevant quality‐improvement initiatives.
METHODS
Inclusion Criteria and Study Design
This study was conducted at CHOP, a 535‐bed urban, tertiary‐care, freestanding children's hospital with approximately 29,000 annual discharges. Of those discharges, 7000 to 8000 are from the general pediatrics service, meaning that the attending of record was a general pediatrician. Patients were included in the study if (1) they were discharged from the general pediatrics service between January 2014 and December 2014, and (2) they were readmitted to the hospital, for any reason, within 15 days of discharge. Because this analysis was done as part of a quality‐improvement initiative, it focuses on 15‐day, early readmissions to target cases with a higher probability of being potentially preventable from the perspective of the hospital care team.[10, 12, 13] Patients under observation status during the index admission or the readmission were included. However, patients who returned to the emergency department but were not admitted to an inpatient unit were excluded. Objective details about each case, including the patient's name, demographics, chart number, and diagnosis code, were pre‐loaded from EPIC (Epic Systems Corp., Verona, WI) into REDCap (Research Electronic Data Capture;
A panel of 10 general pediatricians divided up the cases to perform retrospective chart reviews. For each case, REDCap guided reviewers through the fault tree analysis. Reviewers met monthly to discuss difficult cases and reach consensus on any identified ambiguities in the process. After all cases were reviewed once, 3 panel members independently reviewed a random selection of cases to measure inter‐rater reliability and confirm reproducibility of final determinations. The inter‐rater reliability statistic was calculated using Stata 12.1 (StataCorp LP, College Station, TX). During chart reviews, panel members were not blinded to the identity of physicians and other staff members caring for the patients under review. CHOP's institutional review board determined this study to be exempt from ongoing review.
Fault Tree Analysis
Using the decision tree framework for analyzing readmissions that was developed at Intermountain Primary Children's Hospital, the REDCap tool prompted reviewers with a series of sequential questions, each with mutually exclusive options. Using imbedded branching logic to select follow‐up questions, the tool guided reviewers to 1 of 18 terminal nodes, each representing a potential root cause of the readmission. Of those 18 potential causes, 8 were considered potentially preventable. A diagram of the fault tree framework, color coded to indicate which nodes were considered potentially preventable, is shown in Figure 1.
RESULTS
In 2014, 7252 patients were discharged from the general pediatrics service at CHOP. Of those patients, 248 were readmitted within 15 days for an overall general pediatrics 15‐day readmission rate of 3.4%.
Preventability Analysis
Of the 248 readmissions, 233 (94.0%) were considered not preventable. The most common cause for readmission, which accounted for 145 cases (58.5%), was a patient developing an unpredictable problem related to the index diagnosis or a natural progression of the disease that required readmission. The second most common cause, which accounted for 53 cases (21.4%), was a patient developing a new condition unrelated to the index diagnosis or a readmission unrelated to the quality of care received during the index stay. The third most frequent cause, which accounted for 11 cases (4.4%), was a legitimate nonclinical readmission due to lack of alternative resources, psychosocial or economic factors, or case‐specific factors. Other nonpreventable causes of readmission, including scheduled readmissions, each accounted for 7 or fewer cases and <3% of total readmissions.
The 15 readmissions considered potentially preventable accounted for 6.0% of total readmissions and 0.2% of total discharges from the general pediatrics service in 2014. The most common cause of preventable readmissions, which accounted for 6 cases, was premature discharge. The second most common cause, which accounted for 4 cases, was a problem resulting from nosocomial or iatrogenic factors. Other potentially preventable causes included delayed detection of problem (3 cases), inappropriate readmission (1 case), and inadequate postdischarge care planning (1 case).
A breakdown of fault tree results, including examples of cases associated with each terminal node, is shown in Table 1. Information about general pediatrics patients and readmitted patients is included in Tables 2 and 3. A breakdown of determinations for each reviewer is included in Supporting Table 1 in the online version of this article.
| Fault Tree Terminal Node | Root Cause of Readmission | No. of Cases | % of Total Readmissions | % Within Preventability Category | % of Total Discharges |
|---|---|---|---|---|---|
| |||||
| 2 (Potentially Preventable) | Problematic condition on discharge. Example:* Index admission: Infant with history of prematurity admitted with RSV and rhinovirus bronchiolitis. Had some waxing and waning symptoms. Just prior to discharge, noted to have increased work of breathing related to feeds. Readmission: 12 hours later with tachypnea, retractions, and hypoxia. | 6 | 2.4% | 40.0% | 0.08% |
| 3 (Potentially Preventable) | Nosocomial/Iatrogenic factors. Example*: Index admission: Toddler admitted with fever and neutropenia. Treated with antibiotics 24 hours. Diagnosed with viral illness and discharged home. Readmission: symptomatic Clostridum difficile infection. | 4 | 1.6% | 26.7% | 0.06% |
| 8 (Potentially Preventable) | Detection/treatment of problem was delayed and not appropriately facilitated. Example:* Index admission: Preteen admitted with abdominal pain, concern for appendicitis. Ultrasound and abdominal MRI negative for appendicitis. Symptoms improved. Tolerated PO. Readmission: 3 days later with similar abdominal pain. Diagnosed with constipation with significant improvement following clean‐out. | 3 | 1.2% | 20.0% | 0.04% |
| 1 (Potentially Preventable) | Inappropriate readmission. Example:* Index admission: Infant with laryngomalacia admitted with bronchiolitis. Readmission: Continued mild bronchiolitis symptoms but did not require oxygen or suctioning, normal CXR. | 1 | 0.4% | 6.7% | 0.01% |
| 5 (Potentially Preventable) | Resulted from inadequate postdischarge care planning. Example:* Index diagnosis: Infant with vomiting, prior admissions, and extensive evaluation, diagnosed with milk protein allergy and GERD. PPI increased. Readmission: Persistent symptoms, required NGT feeds supplementation. | 1 | 0.4% | 6.7% | 0.01% |
| 4 (Potentially Preventable) | Resulted from a preventable complication and hospital/physician did not take the appropriate steps to minimize likelihood of complication. | ||||
| 6 (Potentially Preventable) | Resulted from improper care by patient/family and effort by hospital/physician to ensure correct postdischarge care was inadequate. | ||||
| 7 (Potentially Preventable) | Resulted from inadequate care by community services and effort by hospital/physician to ensure correct postdischarge care was inadequate. | ||||
| 15 | 6.0% | 100% | 0.2% | ||
| 12 (Not Preventable) | Problem was unpredictable. Example:* Index admission: Infant admitted with gastroenteritis and dehydration with an anion gap metabolic acidosis. Vomiting and diarrhea improved, rehydrated, acidosis improved. Readmission: 1 day later, presented with emesis and fussiness. Readmitted for metabolic acidosis. | 145 | 58.5% | 62.2% | 2.00% |
| 10 (Not Preventable) | Patient developed new condition unrelated to index diagnosis or quality of care. Example:* Index admission: Toddler admitted with cellulitis. Readmission: Bronchiolitis (did not meet CDC guidelines for nosocomial infection). | 53 | 21.4% | 22.7% | 0.73% |
| 9 (Not Preventable) | Legitimate nonclinical readmission. Example:* Index admission: Infant admitted with second episode of bronchiolitis. Readmission: 4 days later with mild diarrhea. Tolerated PO challenge in emergency department. Admitted due to parental anxiety. | 11 | 4.4% | 4.7% | 0.15% |
| 17 (Not Preventable) | Problem resulted from improper care by patient/family but effort by hospital/physician to ensure correct postdischarge care was appropriate. Example:* Index admission: Infant admitted with diarrhea, diagnosed with milk protein allergy. Discharged on soy formula. Readmission: Developed vomiting and diarrhea with cow milk formula. | 7 | 2.8% | 3.0% | 0.10% |
| 11 (Not Preventable) | Scheduled readmission. Example:* Index admission: Infant with conjunctivitis and preseptal cellulitis with nasolacrimal duct obstruction. Readmission: Postoperatively following scheduled nasolacrimal duct repair. | 7 | 2.8% | 3.0% | 0.10% |
| 14 (Not Preventable) | Detection/treatment of problem was delayed, but earlier detection was not feasible. Example:* Index admission: Preteen admitted with fever, abdominal pain, and elevated inflammatory markers. Fever resolved and symptoms improved. Diagnosed with unspecified viral infection. Readmission: 4 days later with lower extremity pyomyositis and possible osteomyelitis. | 4 | 1.6% | 1.7% | 0.06% |
| 15 (Not Preventable) | Detection/treatment of problem was delayed, earlier detection was feasible, but detection was appropriately facilitated. Example:* Index admission: Infant with history of laryngomalacia and GER admitted with an ALTE. No events during hospitalization. Appropriate workup and cleared by consultants for discharge. Zantac increased. Readmission: Infant had similar ALTE events within a week after discharge. Ultimately underwent supraglottoplasty. | 2 | 0.8% | 0.9% | 0.03% |
| 13 (Not Preventable) | Resulted from preventable complication but efforts to minimize likelihood were appropriate. Example:* Index admission: Patient on GJ feeds admitted for dislodged GJ. Extensive conversations between primary team and multiple consulting services regarding best type of tube. Determined that no other tube options were appropriate. Temporizing measures were initiated. Readmission: GJ tube dislodged again. | 2 | 0.8% | 0.9% | 0.03% |
| 18 (Not Preventable) | Resulted from medication side effect (after watch period). Example:* Index admission: Preteen with MSSA bacteremia spread to other organs. Sent home on appropriate IV antibiotics. Readmission: Fever, rash, increased LFTs. Blood cultures negative. Presumed drug reaction. Fevers resolved with alternate medication. | 2 | 0.8% | 0.9% | 0.03% |
| 16 (Not Preventable) | Resulted from inadequate care by community services, but effort by hospital/physician to ensure correct postdischarge care was appropriate. | ||||
| 233 | 94.0% | 100% | 3.2% | ||
| Fault Tree Terminal Node | Root Cause of Potentially Preventable Readmission with Case Descriptions* |
|---|---|
| |
| 2 (Potentially Preventable) | Problematic condition on discharge |
| Case 1: Index admission: Infant with history of prematurity admitted with RSV and rhinovirus bronchiolitis. Had some waxing and waning symptoms. Just prior to discharge, noted to have increased work of breathing related to feeds. Readmission: 12 hours later with tachypnea, retractions, and hypoxia. | |
| Case 2: Index admission: Toddler admitted with febrile seizure in setting of gastroenteritis. Poor PO intake during hospitalization. Readmission: 1 day later with dehydration. | |
| Case 3: Index admission: Infant admitted with a prolonged complex febrile seizure. Workup included an unremarkable lumbar puncture. No additional seizures. No inpatient imaging obtained. Readmission: Abnormal outpatient MRI requiring intervention. | |
| Case 4: Index admission: Teenager with wheezing and history of chronic daily symptoms. Discharged <24 hours later on albuterol every 4 hours and prednisone. Readmission: 1 day later, seen by primary care physician with persistent asthma flare. | |
| Case 5: Index admission: Exfull‐term infant admitted with bronchiolitis, early in course. At time of discharge, had been off oxygen for 24 hours, but last recorded respiratory rate was >70. Readmission: 1 day later due to continued tachypnea and increased work of breathing. No hypoxia. CXR normal. | |
| Case 6: Exfull‐term infant admitted with bilious emesis, diarrhea, and dehydration. Ultrasound of pylorus, UGI, and BMP all normal. Tolerated oral intake but had emesis and loose stools prior to discharge. Readmission: <48 hours later with severe metabolic acidosis. | |
| 3 (Potentially Preventable) | Nosocomial/ematrogenic factors |
| Case 1: Index admission: Toddler admitted with fever and neutropenia. Treated with antibiotics 24 hours. Diagnosed with viral illness and discharged home. Readmission: Symptomatic Clostridum difficile infection. | |
| Case 2: Index admission: Patient with autism admitted with viral gastroenteritis. Readmission: Presumed nosocominal upper respiratory infection. | |
| Case 3: Index admission: Infant admitted with bronchiolitis. Recovered from initial infection. Readmission: New upper respiratory infection and presumed nosocomial infection. | |
| Case 4: Index admission: <28‐day‐old full‐term neonate presenting with neonatal fever and rash. Full septic workup performed and all cultures negative at 24 hours. Readmission: CSF culture positive at 36 hours and readmitted while awaiting speciation. Discharged once culture grew out a contaminant. | |
| 8 (Potentially Preventable) | Detection/treatment of problem was delayed and/or not appropriately facilitated |
| Case 1: Index admission: Preteen admitted with abdominal pain, concern for appendicitis. Ultrasound and MRI abdomen negative for appendicitis. Symptoms improved. Tolerated PO. Readmission: 3 days later with similar abdominal pain. Diagnosed with constipation with significant improvement following clean‐out. | |
| Case 2: Index admission: Infant with history of macrocephaly presented with fever and full fontanelle. Head CT showed mild prominence of the extra‐axial space, and lumbar puncture was normal. Readmission: Patient developed torticollis. MRI demonstrated a malignant lesion. | |
| Case 3: Index admission: School‐age child with RLQ abdominal pain, fever, leukocytosis, and indeterminate RLQ abdominal ultrasound. Twelve‐hour observation with no further fevers. Pain and appetite improved. Readmission: 1 day later with fever, anorexia, and abdominal pain. RLQ ultrasound unchanged. Appendectomy performed with inflamed appendix. | |
| 1 (Potentially Preventable) | Inappropriate readmission |
| Case 1: Index admission: Infant with laryngomalacia admitted with bronchiolitis. Readmission: Continued mild bronchiolitis symptoms but did not require oxygen or suctioning. Normal CXR. | |
| 5 (Potentially Preventable) | Resulted from inadequate postdischarge care planning |
| Case 1: Index diagnosis: Infant with vomiting, prior admissions, and extensive evaluation, diagnosed with milk protein allergy and GERD. PPI increased. Readmission: Persistent symptoms, required NGT feeds supplementation. | |
| All General Pediatrics Patients in 2014 | General Pediatric Readmitted Patients in 2014 | ||||
|---|---|---|---|---|---|
| Major Diagnosis Category at Index Admission | No. | % | Major Diagnosis Category at Index Admission | No. | % |
| |||||
| Respiratory | 2,723 | 37.5% | Respiratory | 79 | 31.9% |
| Digestive | 748 | 10.3% | Digestive | 41 | 16.5% |
| Ear, nose, mouth, throat | 675 | 9.3% | Ear, nose, mouth, throat | 24 | 9.7% |
| Skin, subcutaneous tissue | 480 | 6.6% | Musculoskeletal and connective tissue | 14 | 5.6% |
| Infectious, parasitic, systemic | 455 | 6.3% | Nervous | 13 | 5.2% |
| Factors influencing health status | 359 | 5.0% | Endocrine, nutritional, metabolic | 13 | 5.2% |
| Endocrine, nutritional, metabolic | 339 | 4.7% | Infectious, parasitic, systemic | 12 | 4.8% |
| Nervous | 239 | 3.3% | Newborn, neonate, perinatal period | 11 | 4.4% |
| Musculoskeletal and connective tissue | 228 | 3.1% | Hepatobiliary system and pancreas | 8 | 3.2% |
| Newborn, neonate, perinatal period | 206 | 2.8% | Skin, subcutaneous tissue | 8 | 3.2% |
| Other* | 800 | 11.0% | Other | 25 | 10.1% |
| Total | 7,252 | 100% | Total | 248 | 100% |
Inter‐Rater Reliability Analysis
A random selection of 50 cases (20% of total readmissions) was selected for a second review to test the tool's inter‐rater reliability. The second review resulted in the same terminal node for 44 (86%) of the cross‐checked files ( = 0.79; 95% confidence interval: 0.60‐0.98). Of the 6 cross‐checked files that ended at different nodes, 5 resulted in the same final determination about preventability. Only 1 of the cross‐checks (2% of total cross‐checked files) resulted in a different conclusion about preventability.
Efficiency Analysis
Reviewers reported that using the tool to reach a determination about preventability took approximately 20 minutes per case. Thus, initial reviews on the 248 cases required approximately 82.6 reviewer hours. Divided across 10 reviewers, this resulted in 8 to 9 hours of review time per reviewer over the year.
DISCUSSION
As part of an effort to direct quality‐improvement initiatives, this project used a Web‐based fault tree tool to identify root causes of general pediatrics readmissions at a freestanding children's hospital and classify them as either preventable or not preventable. The project also investigated the efficiency and inter‐rater reliability of the tool, which was designed to systematically guide physicians through the chart review process to a final determination about preventability. The project confirmed that using the tool helped reviewers reach final determinations about preventability efficiently with a high degree of consistency. It also confirmed that only a very small percentage of general pediatrics 15‐day readmissions are potentially preventable. Specifically, potentially preventable readmissions accounted for only 6.0% of total readmissions and 0.2% of general pediatrics discharges in 2014. Although our analysis focused on 15‐day readmissions, the fault tree methodology can be applied to any timeframe.
Previous studies attempting to distinguish preventable from nonpreventable readmissions, which used a range of methodologies to reach final determinations, reported that their review process was both time intensive and highly subjective. One study, which had 4 reviewers independently review charts and assign each case a preventability score on a 5‐point Likert scale, reported that reviewers disagreed on the final determination in 62.5% of cases.[12] Another study had 2 physicians independently review a selection of cases and assign a preventability score on a scale from 0 to 3. Scores for the 2 reviewers were added together, and cases above a certain composite threshold were classified as preventable. Despite being time‐intensive, this method resulted in only moderate agreement among physicians about the likelihood of preventability (weighted statistic of 0.44).[14] A more recent study, in which 2 physicians independently classified readmissions into 1 of 4 predefined categories, also reported only moderate agreement between reviewers ( = 0.44).[13] Other methods that have been reported include classifying readmissions as preventable only if multiple reviewers independently agreed, and using a third reviewer as a tie‐breaker.[14]
In an attempt to identify potentially preventable readmissions without using chart reviews, 3M (St. Paul, MN) developed its Potentially Preventable Readmissions software (3M‐PPR), which uses administrative data to identify which readmissions were potentially preventable. Although this automated approach is less time intensive, evidence suggests that due to a lack of nuance, the algorithm significantly overestimates the percentage of readmissions that are potentially preventable.[4, 5] A study that used 3M‐PPR to assess 1.7 million hospitalizations across 58 children's hospitals found that the algorithm classified 81% of sickle cell crisis and asthma readmissions, and 83% of bronchiolitis readmissions as potentially preventable.[10, 11] However, many readmissions for asthma and bronchiolitis are due to social factors that are outside of a hospital's direct control,[4, 5] and at many hospitals, readmissions for sickle cell crisis are part of a high‐value care model that weighs length of stay against potential readmissions. In addition, when assessing readmissions 7, 15, and 30 days after discharge, the algorithm classified almost the same percentage as potentially preventable, which is inconsistent with the notion that readmissions are more likely to have been preventable if they occurred closer to the initial discharge.[4, 13] Another study that assessed the performance of the software in the adult population reported that the algorithm performed with 85% sensitivity, but only 28% specificity.[5, 6]
The results of this quality‐improvement project indicate that using the fault tree tool to guide physicians through the chart review process helped address some of the shortcomings of methods reported in previous studies, by increasing the efficiency and reducing the subjectivity of final determinations, while still accounting for the nuances necessary to conduct a fair review. Because the tool provided a systematic framework for reviews, each case was completed in approximately 20 minutes, and because the process was the same for all reviewers, inter‐rater reliability was extremely high. In 86% of cross‐checked cases, the second reviewer ended at the same terminal node in the decision tree as the original reviewer, and in 98% of cross‐checked cases the second reviewer reached the same conclusion about preventability, even if they did not end at the same terminal node. Even accounting for agreement due to chance, the statistic of 0.79 confirmed that there was substantial agreement among reviewers about final determinations. Because the tool is easily adaptable, other hospitals can adopt this framework for their own preventability reviews and quality‐improvement initiatives.
Using the fault tree tool to access root causes of all 15‐day general pediatric readmissions helped the division focus quality‐improvement efforts on the most common causes of potentially preventable readmissions. Because 40% of potentially preventable readmissions were due to premature discharges, this prompted quality‐improvement teams to focus efforts on improving and clarifying the division's discharge criteria and clinical pathways. The division also initiated processes to improve discharge planning, including improved teaching of discharge instructions and having families pick up prescriptions prior to discharge.
Although these results did help the division identify a few areas of focus to potentially reduce readmissions, the fact that the overall 15‐day readmission rate for general pediatrics, as well as the percentage of readmissions and total discharges that were deemed potentially preventable, were so low (3.4%, 6.0%, and 0.2%, respectively), supports those who question whether prioritizing pediatric readmissions is the best place for hospitals to focus quality‐improvement efforts.[10, 12, 15, 16] As these results indicate, most pediatric readmissions are not preventable, and thus consistent with an efficient, effective, timely, patient‐centered, and equitable health system. Other studies have also shown that because overall and condition‐specific readmissions at pediatric hospitals are low, few pediatric hospitals are high or low performing for readmissions, and thus readmission rates are likely not a good measure of hospital quality.[8]
However, other condition‐specific studies of readmissions in pediatrics have indicated that there are some areas of opportunity to identify populations at high risk for readmission. One study found that although pneumonia‐specific 30‐day readmission rates in a national cohort of children hospitalized with pneumonia was only 3.1%, the chances of readmission were higher for children <1 year old, children with chronic comorbidities or complicated pneumonia, and children cared for in hospitals with lower volumes of pneumonia admissions.[17] Another study found that 17.1% of adolescents in a statewide database were readmitted post‐tonsillectomy for pain, nausea, and dehydration.[18] Thus, adapting the tool to identify root causes of condition‐specific or procedure‐specific readmissions, especially for surgical patients, may be an area of opportunity for future quality‐improvement efforts.[5] However, for general pediatrics, shifting the focus from reducing readmissions to improving the quality of care patients receive in the hospital, improving the discharge process, and adopting a population health approach to mitigate external risk factors, may be appropriate.
This project was subject to limitations. First, because it was conducted at a single site and only on general pediatrics patients, results may not be generalizable to other hospitals or other pediatric divisions. Thus, future studies might use the fault tree framework to assess preventability of pediatric readmissions in other divisions or specialties. Second, because readmissions to other hospitals were not included in the sample, the overall readmissions rate is likely underestimated.[19] However, it is unclear how this would affect the rate of potentially preventable readmissions. Third, although the fault tree framework reduced the subjectivity of the review process, there is still a degree of subjectivity inherent at each decision node. To minimize this, reviewers should try to discuss and come to consensus on how they are making determinations at each juncture in the decision tree. Similarly, because reviewers' answers to decision‐tree questions rely heavily on chart documentation, reviews may be compromised by unclear or incomplete documentation. For example, if information about steps the hospital team took to prepare a family for discharge were not properly documented, it would be difficult to determine whether appropriate steps were taken to minimize the likelihood of a complication. In the case of insufficient documentation of relevant social concerns, cases may be incorrectly classified as preventable, because addressing social issues is often not within a hospital's direct control. Finally, because reviewers were not blinded to the original discharging physician, there may have been some unconscious bias of unknown direction in the reviews.
CONCLUSION
Using the Web‐based fault tree tool helped physicians to identify the root causes of hospital readmissions and classify them as preventable or not preventable in a standardized, efficient, and consistent way, while still accounting for the nuances necessary to conduct a fair review. Thus, other hospitals should consider adopting this framework for their own preventability reviews and quality‐improvement initiatives. However, this project also confirmed that only a very small percentage of general pediatrics 15‐day readmissions are potentially preventable, suggesting that general pediatrics readmissions are not an appropriate measure of hospital quality. Instead, adapting the tool to identify root causes of condition‐specific or procedure‐specific readmission rates may be an area of opportunity for future quality‐improvement efforts.
Disclosures: This work was supported through internal funds from The Children's Hospital of Philadelphia. The authors have no financial interests, relationships or affiliations relevant to the subject matter or materials discussed in the article to disclose. The authors have no potential conflicts of interest relevant to the subject matter or materials discussed in the article to disclose.
- , . Pediatric readmissions as a hospital quality measure. JAMA. 2013;309(4):396–398.
- Texas Health and Human Services Commission. Potentially preventable readmissions in the Texas Medicaid population, state fiscal year 2012. Available at: http://www.hhsc.state.tx.us/reports/2013/ppr‐report.pdf. Published November 2013. Accessed August 16, 2015.
- Illinois Department of Healthcare and Family Services. Quality initiative to reduce hospital potentially preventable readmissions (PPR): Status update. Available at: http://www.illinois.gov/hfs/SiteCollectionDocuments/PPRPolicyStatusUpdate.pdf. Published September 3, 2014. Accessed August 16, 2015.
- , , , et al. Rates and impact of potentially preventable readmissions at children's hospitals. J Pediatr. 2015;166(3):613–619.e615.
- , . Preventing pediatric readmissions: which ones and how? J Pediatr. 2015;166(3):519–520.
- , , , , , . Manual and automated methods for identifying potentially preventable readmissions: a comparison in a large healthcare system. BMC Med Inform Decis Mak. 2014;14:28.
- , . Section on hospital medicine leadership and staff. Hosp Pediatr. 2013;3(4):390–393.
- , , , et al. Measuring hospital quality using pediatric readmission and revisit rates. Pediatrics. 2013;132(3):429–436.
- , . Hospital readmissions—not just a measure of quality. JAMA. 2011;306(16):1796–1797.
- , . Preventing readmissions in children: how do we do that? Hosp Pediatr. 2015;5(11):602–604.
- , , , et al. Pediatric readmission prevalence and variability across hospitals. JAMA. 2013;309(4):372–380.
- , , , , , . Preventability of early readmissions at a children's hospital. Pediatrics. 2013;131(1):e171–e181.
- , , , et al. An examination of physician‐, caregiver‐, and disease‐related factors associated with readmission from a pediatric hospital medicine service. Hosp Pediatr. 2015;5(11):566–573.
- , , , et al. Clinical preventability of 30‐day readmission after percutaneous coronary intervention. J Am Heart Assoc. 2014;3(5):e001290.
- . 3M algorithm overestimates preventable pediatric readmissions. Hospitalist News website. Available at: http://www.ehospitalistnews.com/specialty‐focus/pediatrics/single‐article‐page/3m‐algorithm‐overestimates‐preventable‐pediatric‐readmissions.html. Published August 16, 2013. Accessed August 16, 2015.
- . The 30‐day readmission rate: not a quality measure but an accountability measure. An Ounce of Evidence: Health Policy blog. Available at: https://blogs.sph.harvard.edu/ashish‐jha/?s=30‐day+readmission+rate. Published February 14, 2013. Accessed August 16, 2015.
- , , , et al. Readmissions among children previously hospitalized with pneumonia. Pediatrics. 2014;134(1):100–109.
- , , . A population‐based study of acute care revisits following tonsillectomy. J Pediatr. 2015;166(3):607–612.e605.
- , , , et al. Same‐hospital readmission rates as a measure of pediatric quality of care. JAMA Pediatr. 2015;169(10):905–912.
© 2016 Society of Hospital Medicine
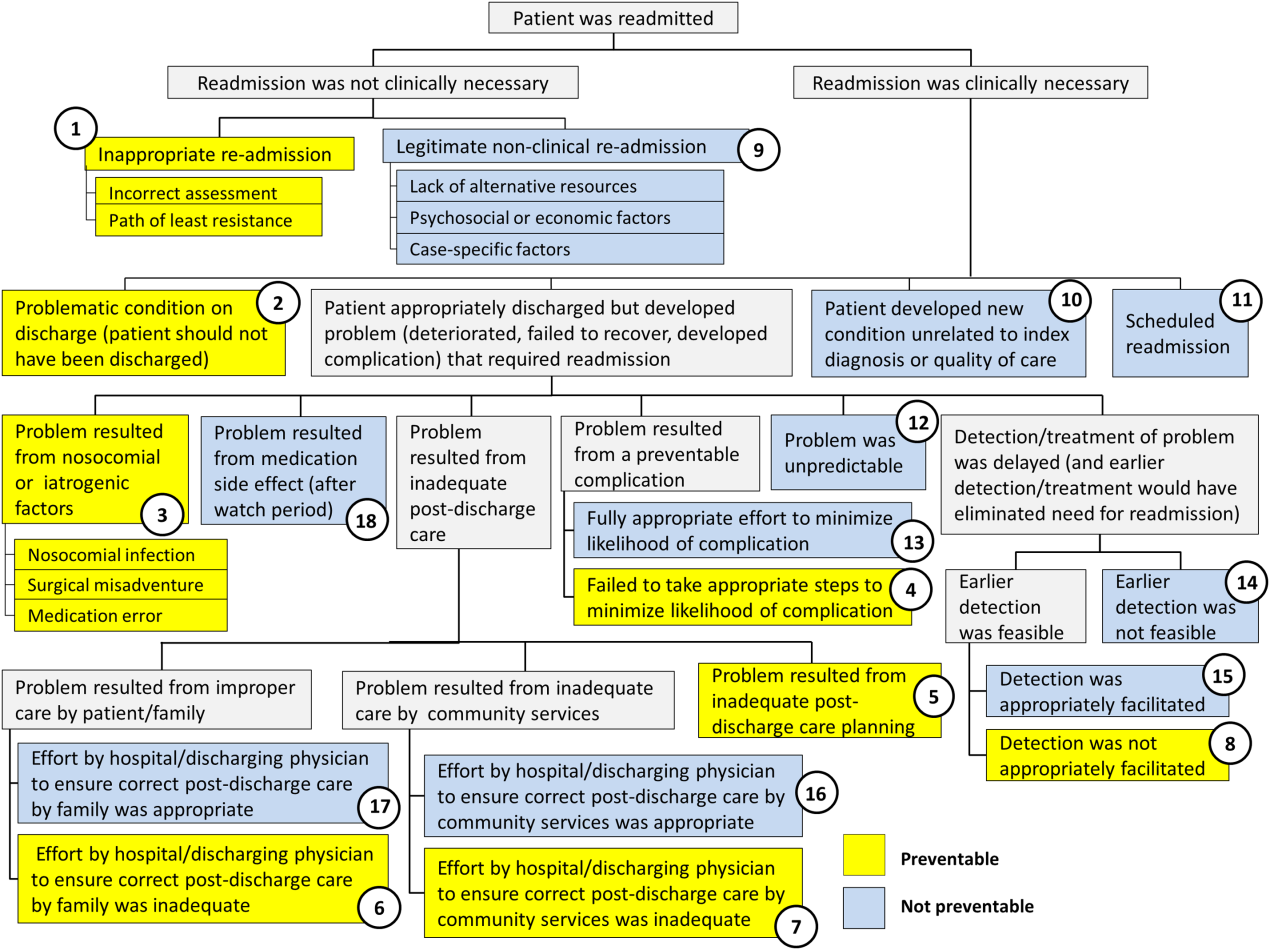
Patient Flow Composite Measurement
Patient flow refers to the management and movement of patients in a healthcare facility. Healthcare institutions utilize patient flow analyses to evaluate and improve aspects of the patient experience including safety, effectiveness, efficiency, timeliness, patient centeredness, and equity.[1, 2, 3, 4, 5, 6, 7, 8] Hospitals can evaluate patient flow using specific metrics, such as time in emergency department (ED) or percent of discharges completed by a certain time of day. However, no single metric can represent the full spectrum of processes inherent to patient flow. For example, ED length of stay (LOS) is dependent on inpatient occupancy, which is dependent on discharge timeliness. Each of these activities depends on various smaller activities, such as cleaning rooms or identifying available beds.
Evaluating the quality that healthcare organizations deliver is growing in importance.[9] Composite scores are being used increasingly to assess clinical processes and outcomes for professionals and institutions.[10, 11] Where various aspects of performance coexist, composite measures can incorporate multiple metrics into a comprehensive summary.[12, 13, 14, 15, 16] They also allow organizations to track a range of metrics for more holistic, comprehensive evaluations.[9, 13]
This article describes a balanced scorecard with composite scoring used at a large urban children's hospital to evaluate patient flow and direct improvement resources where they are needed most.
METHODS
The Children's Hospital of Philadelphia identified patient flow improvement as an operating plan initiative. Previously, performance was measured with a series of independent measures including time from ED arrival to transfer to the inpatient floor, and time from discharge order to room vacancy. These metrics were dismissed as sole measures of flow because they did not reflect the complexity and interdependence of processes or improvement efforts. There were also concerns that efforts to improve a measure caused unintended consequences for others, which at best lead to little overall improvement, and at worst reduced performance elsewhere in the value chain. For example, to meet a goal time for entering discharge orders, physicians could enter orders earlier. But, if patients were not actually ready to leave, their beds were not made available any earlier. Similarly, bed management staff could rush to meet a goal for speed of unit assignment, but this could cause an increase in patients admitted to the wrong specialty floor.
To address these concerns, a group of physicians, nurses, quality improvement specialists, and researchers designed a patient flow scorecard with composite measurement. Five domains of patient flow were identified: (1) ED and ED‐to‐inpatient transition, (2) bed management, (3) discharge process, (4) room turnover and environmental services department (ESD) activities, and (5) scheduling and utilization. Component measures for each domain were selected for 1 of 3 purposes: (1) to correspond to processes of importance to flow and improvement work, (2) to act as adjusters for factors that affect performance, or (3) to act as balancing measures so that progress in a measure would not result in the degradation of another. Each domain was assigned 20 points, which were distributed across the domain's components based on a consensus of the component's relative importance to overall domain performance (Figure 1). Data from the previous year were used as guidelines for setting performance percentile goals. For example, a goal of 80% in 60 minutes for arrival to physician evaluation meant that 80% of patients should see a physician within 1 hour of arriving at the ED.
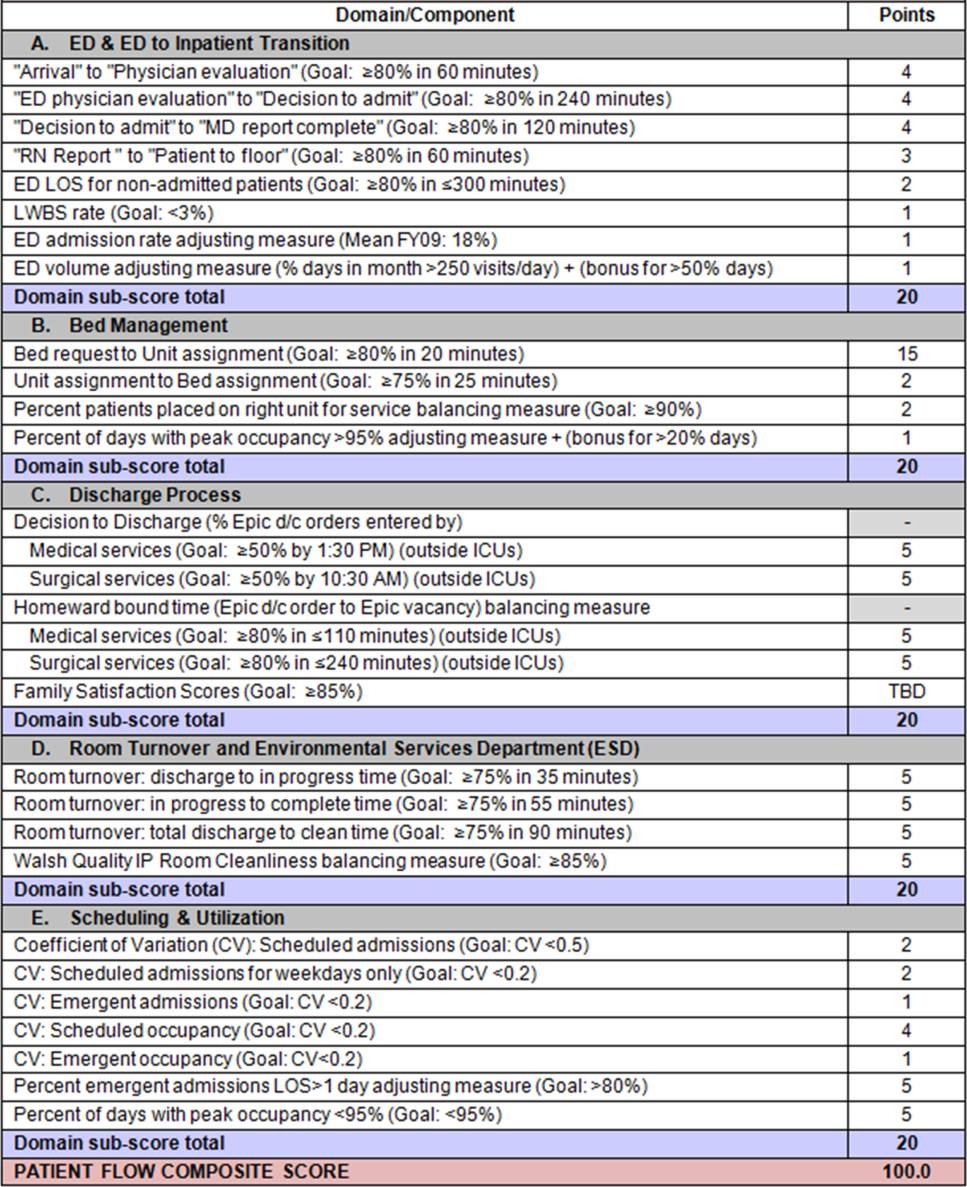
Scores were also categorized to correspond to commonly used color descriptors.[17] For each component measure, performance meeting or exceeding the goal fell into the green category. Performances <10 percentage points below the goal fell into the yellow category, and performances below that level fell into the red category. Domain‐level scores and overall composite scores were also assigned colors. Performance at or above 80% (16 on the 20‐point domain scale, or 80 on the 100‐point overall scale) were designated green, scores between 70% and 79% were yellow, and scores below 70% were red.
DOMAINS OF THE PATIENT FLOW COMPOSITE SCORE
ED and ED‐to‐Inpatient Transition
Patient progression from the ED to an inpatient unit was separated into 4 steps (Figure 1A): (1) arrival to physician evaluation, (2) ED physician evaluation to decision to admit, (3) decision to admit to medical doctor (MD) report complete, and (4) registered nurse (RN) report to patient to floor. Four additional metrics included: (5) ED LOS for nonadmitted patients, (6) leaving without being seen (LWBS) rate, (7) ED admission rate, and (8) ED volume.
Arrival to physician evaluation measures time between patient arrival in the ED and self‐assignment by the first doctor or nurse practitioner in the electronic record, with a goal of 80% of patients seen within 60 minutes. The component score is calculated as percent of patients meeting this goal (ie, seen within 60 minutes) component weight. ED physician evaluation to decision to admit measures time from the start of the physician evaluation to the decision to admit, using bed request as a proxy; the goal was 80% within 4 hours. Decision to admit to MD report complete measures time from bed request to patient sign‐out to the inpatient floor, with a goal of 80% within 2 hours. RN report to patient to floor measures time from sign‐out to the patient leaving the ED, with a goal of 80% within 1 hour. ED LOS for nonadmitted patients measures time in the ED for patients who are not admitted, and the goal was 80% in <5 hours. The domain also tracks the LWBS rate, with a goal of keeping it below 3%. Its component score is calculated as percent patients seen component weight. ED admission rate is an adjusting factor for the severity of patients visiting the ED. Its component score is calculated as (percent of patients visiting the ED who are admitted to the hospital 5) component weight. Because the average admission rate is around 20%, the percent admitted is multiplied by 5 to more effectively adjust for high‐severity patients. ED volume is an adjusting factor that accounts for high volume. Its component score is calculated as percent of days in a month with more than 250 visits (a threshold chosen by the ED team) component weight. If these days exceed 50%, that percent would be added to the component score as an additional adjustment for excessive volume.
Bed Management
The bed management domain measures how efficiently and effectively patients are assigned to units and beds using 4 metrics (Figure 1B): (1) bed request to unit assignment, (2) unit assignment to bed assignment, (3) percentage of patients placed on right unit for service, and (4) percent of days with peak occupancy >95%.
Bed request to unit assignment measures time from the ED request for a bed in the electronic system to patient being assigned to a unit, with a goal of 80% of assignments made within 20 minutes. Unit assignment to bed assignment measures time from unit assignment to bed assignment, with a goal of 75% within 25 minutes. Because this goal was set to 75% rather than 80%, this component score was multiplied by 80/75 so that all component scores could be compared on the same scale. Percentage of patients placed on right unit for service is a balancing measure for speed of assignment. Because the goal was set to 90% rather than 80%, this component score was also multiplied by an adjusting factor (80/90) so that all components could be compared on the same scale. Percent of days with peak occupancy >95% is an adjusting measure that reflects that locating an appropriate bed takes longer when the hospital is approaching full occupancy. Its component score is calculated as (percent of days with peak occupancy >95% + 1) component weight. The was added to more effectively adjust for high occupancy. If more than 20% of days had peak occupancy greater than 95%, that percent would be added to the component score as an additional adjustment for excessive capacity.
Discharge Process
The discharge process domain measures the efficiency of patient discharge using 2 metrics (Figure 1C): (1) decision to discharge and (2) homeward bound time.
Decision to discharge tracks when clinicians enter electronic discharge orders. The goal was 50% by 1:30 pm for medical services and 10:30 am for surgical services. This encourages physicians to enter discharge orders early to enable downstream discharge work to begin. The component score is calculated as percent entered by goal time component weight (80/50) to adjust the 50% goal up to 80% so all component scores could be compared on the same scale. Homeward bound time measures the time between the discharge order and room vacancy as entered by the unit clerk, with a goal of 80% of patients leaving within 110 minutes for medical services and 240 minutes for surgical services. This balancing measure captures the fact that entering discharge orders early does not facilitate flow if the patients do not actually leave the hospital.
Room Turnover and Environmental Services Department
The room turnover and ESD domain measures the quality of the room turnover processes using 4 metrics (Figure 1D): (1) discharge to in progress time, (2) in progress to complete time, (3) total discharge to clean time, and (4) room cleanliness.
Discharge to in progress time measures time from patient vacancy until ESD staff enters the room, with a goal of 75% within 35 minutes. Because the goal was set to 75% rather than 80%, this component score was multiplied by 80/75 so all component scores could be compared on the same scale. In progress to complete time measures time as entered in the electronic health record from ESD staff entering the room to the room being clean, with a goal of 75% within 55 minutes. The component score is calculated identically to the previous metric. Total discharge to clean time measures the length of the total process, with a goal of 75% within 90 minutes. This component score was also multiplied by 80/75 so that all component scores could be compared on the same scale. Although this repeats the first 2 measures, given workflow and interface issues with our electronic health record (Epic, Epic Systems Corporation, Verona Wisconsin), it is necessary to include a total end‐to‐end measure in addition to the subparts. Patient and family ratings of room cleanliness serve as balancing measures, with the component score calculated as percent satisfaction component weight (80/85) to adjust the 85% satisfaction goal to 80% so all component scores could be compared on the same scale.
Scheduling and Utilization
The scheduling and utilization domain measures hospital operations and variations in bed utilization using 7 metrics including (Figure 1E): (1) coefficient of variation (CV): scheduled admissions, (2) CV: scheduled admissions for weekdays only, (3) CV: emergent admissions, (4) CV: scheduled occupancy, (5) CV: emergent occupancy, (6) percent emergent admissions with LOS >1 day, and (7) percent of days with peak occupancy <95%.
The CV, standard deviation divided by the mean of a distribution, is a measure of dispersion. Because it is a normalized value reported as a percentage, CV can be used to compare variability when sample sizes differ. CV: scheduled admissions captures the variability in admissions coded as an elective across all days in a month. The raw CV score is the standard deviation of the elective admissions for each day divided by the mean. The component score is (1 CV) component weight. A higher CV indicates greater variability, and yields a lower component score. CV on scheduled and emergent occupancy is derived from peak daily occupancy. Percent emergent admissions with LOS >1 day captures the efficiency of bed use, because high volumes of short‐stay patients increases turnover work. Its component score is calculated as the percent of emergent admissions in a month with LOS >1 day component weight. Percent of days with peak occupancy <95% incentivizes the hospital to avoid full occupancy, because effective flow requires that some beds remain open.[18, 19] Its component score is calculated as the percent of days in the month with peak occupancy <95% component weight. Although a similar measure, percent of days with peak occupancy >95%, was an adjusting factor in the bed management domain, it is included again here, because this factor has a unique effect on both domains.
RESULTS
The balanced scorecard with composite measures provided improvement teams and administrators with a picture of patient flow (Figure 2). The overall score provided a global perspective on patient flow over time and captured trends in performance during various states of hospital occupancy. One trend that it captured was an association between high volume and poor composite scores (Figure 3). Notably, the H1N1 influenza pandemic in the fall of 2009 and the turnover of computer systems in January 2011 can be linked to dips in performance. The changes between fiscal years reflect a shift in baseline metrics.
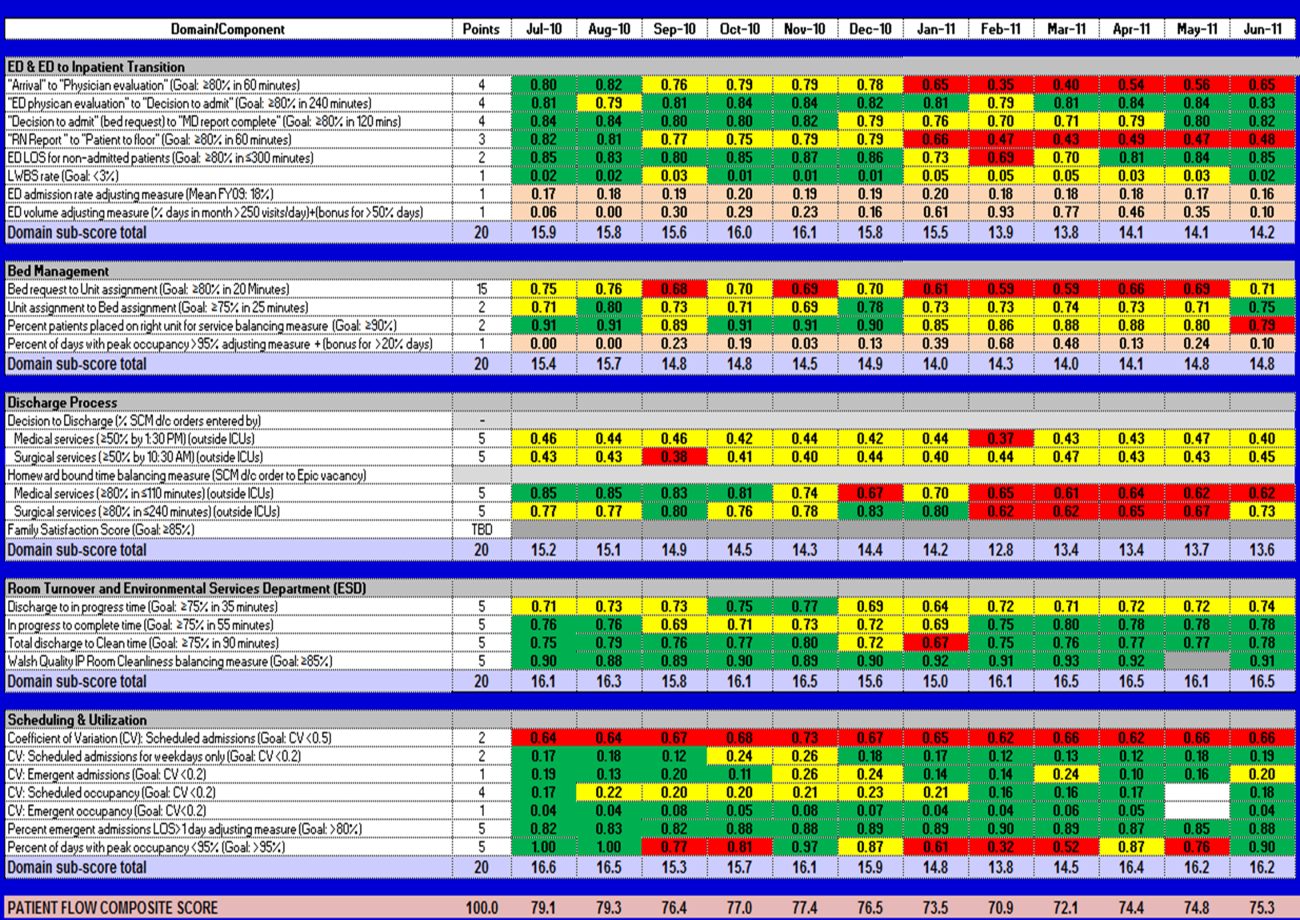
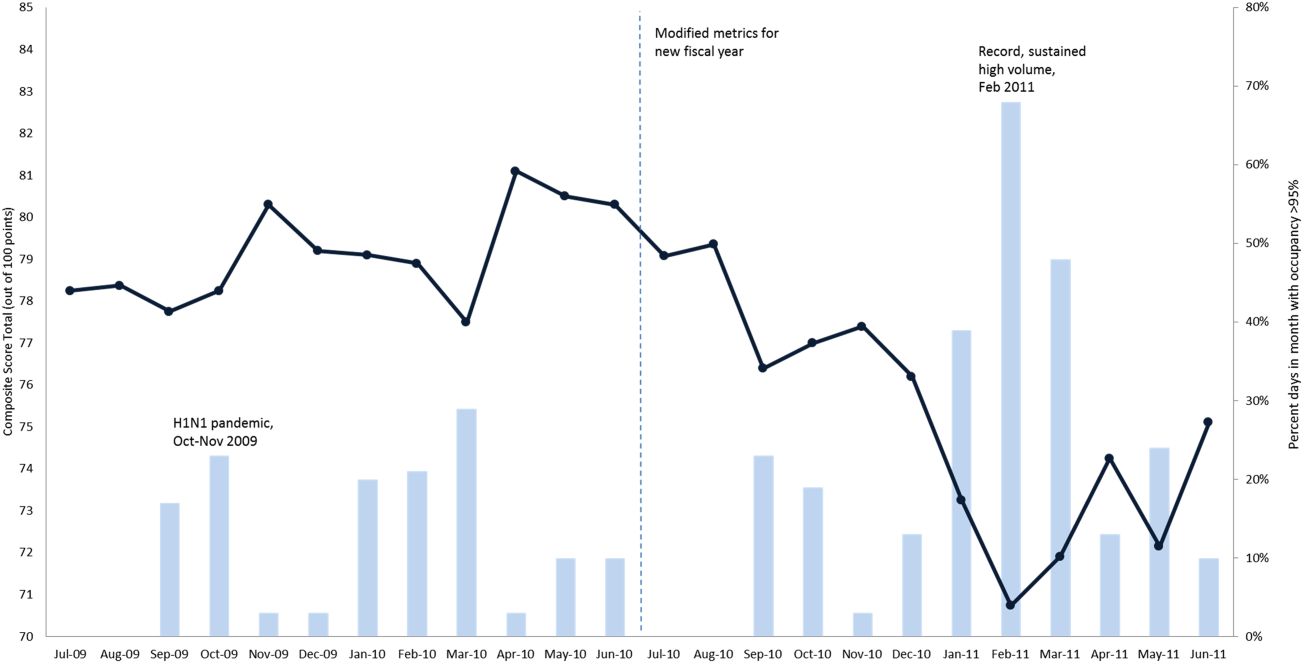
In addition to the overall composite score, the domain level and individual component scores allowed for more specific evaluation of variables affecting quality of care and enabled targeted improvement activities (Figure 4). For example, in December 2010 and January 2011, room turnover and ESD domain scores dropped, especially in the total discharge to clean time component. In response, the ESD made staffing adjustments, and starting in February 2011, component scores and the domain score improved. Feedback from the scheduling and utilization domain scores also initiated positive change. In August 2010, the CV: scheduled occupancy component score started to drop. In response, certain elective admissions were shifted to weekends to distribute hospital occupancy more evenly throughout the week. By February 2011, the component returned to its goal level. This continual evaluation of performance motivates continual improvement.
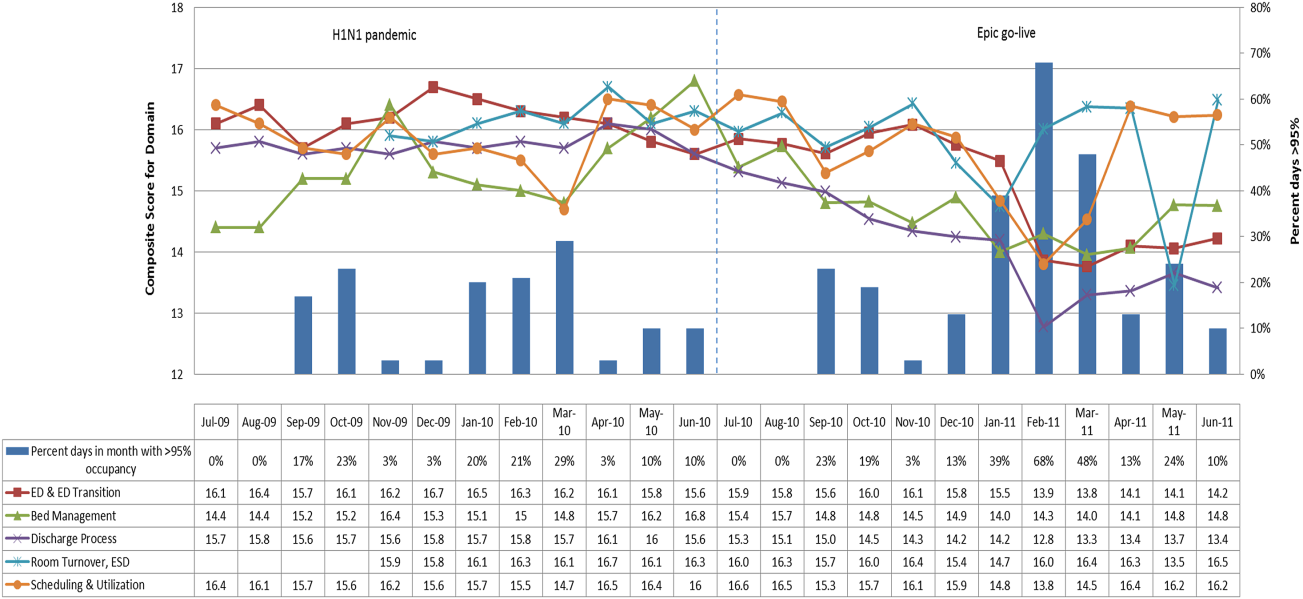
DISCUSSION
The use of a patient flow balanced scorecard with composite measurement overcomes pitfalls associated with a single or unaggregated measure. Aggregate scores alone mask important differences and relationships among components.[13] For example, 2 domains may be inversely related, or a provider with an overall average score might score above average in 1 domain but below in another. The composite scorecard, however, shows individual component and domain scores in addition to an aggregate score. The individual component and domain level scores highlight specific areas that need improvement and allow attention to be directed to those areas.
Additionally, a composite score is more likely to engage the range of staff involved in patient flow. Scaling out of 100 points and the red‐yellow‐green model are familiar for operations performance and can be easily understood.[17] Moreover, a composite score allows for dynamic performance goals while maintaining a stable measurement structure. For example, standardized LOS ratios, readmission rates, and denied hospital days can be added to the scorecard to provide more information and balancing measures.
Although balanced scorecards with composites can make holistic performance visible across multiple operational domains, they have some disadvantages. First, because there is a degree of complexity associated with a measure that incorporates multiple aspects of flow, certain elements, such as the relationship between a metric and its balancing measure, may not be readily apparent. Second, composite measures may not provide actionable information if the measure is not clearly related to a process that can be improved.[13, 14] Third, individual metrics may not be replicable between locations, so composites may need to be individualized to each setting.[10, 20]
Improving patient flow is a goal at many hospitals. Although measurement is crucial to identifying and mitigating variations, measuring the multidimensional aspects of flow and their impact on quality is difficult. Our scorecard, with composite measurement, addresses the need for an improved method to assess patient flow and improve quality by tracking care processes simultaneously.
Acknowledgements
The authors thank Bhuvaneswari Jayaraman for her contributions to the original calculations for the first version of the composite score.
Disclosures: Internal funds from The Children's Hospital of Philadelphia supported the conduct of this work. The authors report no conflicts of interest.
- AHA Solutions. Patient Flow Challenges Assessment 2009. Chicago, IL: American Hospital Association; 2009.
- , , , et al. The impact of emergency department crowding measures on time to antibiotics for patients with community‐acquired pneumonia. Ann Emerg Med. 2007;50(5):510–516.
- . Practice variation: implications for our health care system. Manag Care. 2004;13(9 suppl):3–7.
- . Managing variability in patient flow is the key to improving access to care, nursing staffing, quality of care, and reducing its cost. Paper presented at: Institute of Medicine; June 24, 2004; Washington, DC.
- , , . Developing models for patient flow and daily surge capacity research. Acad Emerg Med. 2006;13(11):1109–1113.
- , , , , . Patient flow variability and unplanned readmissions to an intensive care unit. Crit Care Med. 2009;37(11):2882–2887.
- , , , , , . Scheduled admissions and high occupancy at a children's hospital. J Hosp Med. 2011;6(2):81–87.
- , , . Frequent overcrowding in US emergency departments. Acad Emerg Med. 2001;8(2):151–155.
- Institute of Medicine. Performance measurement: accelerating improvement. Available at: http://www.iom.edu/Reports/2005/Performance‐Measurement‐Accelerating‐Improvement.aspx. Published December 1, 2005. Accessed December 5, 2012.
- , , , . Emergency department performance measures and benchmarking summit. Acad Emerg Med. 2006;13(10):1074–1080.
- . The Surgical Infection Prevention and Surgical Care Improvement Projects: promises and pitfalls. Am Surg. 2006;72(11):1010–1016; discussion 1021–1030, 1133–1048.
- , , . Patient safety quality indicators. Composite measures workgroup. Final report. Rockville, MD; Agency for Healthcare Research and Quality; 2008.
- , , , et al. ACCF/AHA 2010 position statement on composite measures for healthcare performance assessment: a report of the American College of Cardiology Foundation/American Heart Association Task Force on performance measures (Writing Committee to develop a position statement on composite measures). Circulation. 2010;121(15):1780–1791.
- , . A five‐point checklist to help performance reports incentivize improvement and effectively guide patients. Health Aff (Millwood). 2012;31(3):612–618.
- , , , , . Composite measures for profiling hospitals on surgical morbidity. Ann Surg. 2013;257(1):67–72.
- , . All‐or‐none measurement raises the bar on performance. JAMA. 2006;295(10):1168–1170.
- , , , et al. Quality improvement. Red light‐green light: from kids' game to discharge tool. Healthc Q. 2011;14:77–81.
- , , , . Myths of ideal hospital occupancy. Med J Aust. 2010;192(1):42–43.
- , . Emergency department overcrowding in the United States: an emerging threat to patient safety and public health. Emerg Med J. 2003;20(5):402–405.
- , , , . Emergency department crowding: consensus development of potential measures. Ann Emerg Med. 2003;42(6):824–834.
Patient flow refers to the management and movement of patients in a healthcare facility. Healthcare institutions utilize patient flow analyses to evaluate and improve aspects of the patient experience including safety, effectiveness, efficiency, timeliness, patient centeredness, and equity.[1, 2, 3, 4, 5, 6, 7, 8] Hospitals can evaluate patient flow using specific metrics, such as time in emergency department (ED) or percent of discharges completed by a certain time of day. However, no single metric can represent the full spectrum of processes inherent to patient flow. For example, ED length of stay (LOS) is dependent on inpatient occupancy, which is dependent on discharge timeliness. Each of these activities depends on various smaller activities, such as cleaning rooms or identifying available beds.
Evaluating the quality that healthcare organizations deliver is growing in importance.[9] Composite scores are being used increasingly to assess clinical processes and outcomes for professionals and institutions.[10, 11] Where various aspects of performance coexist, composite measures can incorporate multiple metrics into a comprehensive summary.[12, 13, 14, 15, 16] They also allow organizations to track a range of metrics for more holistic, comprehensive evaluations.[9, 13]
This article describes a balanced scorecard with composite scoring used at a large urban children's hospital to evaluate patient flow and direct improvement resources where they are needed most.
METHODS
The Children's Hospital of Philadelphia identified patient flow improvement as an operating plan initiative. Previously, performance was measured with a series of independent measures including time from ED arrival to transfer to the inpatient floor, and time from discharge order to room vacancy. These metrics were dismissed as sole measures of flow because they did not reflect the complexity and interdependence of processes or improvement efforts. There were also concerns that efforts to improve a measure caused unintended consequences for others, which at best lead to little overall improvement, and at worst reduced performance elsewhere in the value chain. For example, to meet a goal time for entering discharge orders, physicians could enter orders earlier. But, if patients were not actually ready to leave, their beds were not made available any earlier. Similarly, bed management staff could rush to meet a goal for speed of unit assignment, but this could cause an increase in patients admitted to the wrong specialty floor.
To address these concerns, a group of physicians, nurses, quality improvement specialists, and researchers designed a patient flow scorecard with composite measurement. Five domains of patient flow were identified: (1) ED and ED‐to‐inpatient transition, (2) bed management, (3) discharge process, (4) room turnover and environmental services department (ESD) activities, and (5) scheduling and utilization. Component measures for each domain were selected for 1 of 3 purposes: (1) to correspond to processes of importance to flow and improvement work, (2) to act as adjusters for factors that affect performance, or (3) to act as balancing measures so that progress in a measure would not result in the degradation of another. Each domain was assigned 20 points, which were distributed across the domain's components based on a consensus of the component's relative importance to overall domain performance (Figure 1). Data from the previous year were used as guidelines for setting performance percentile goals. For example, a goal of 80% in 60 minutes for arrival to physician evaluation meant that 80% of patients should see a physician within 1 hour of arriving at the ED.
Scores were also categorized to correspond to commonly used color descriptors.[17] For each component measure, performance meeting or exceeding the goal fell into the green category. Performances <10 percentage points below the goal fell into the yellow category, and performances below that level fell into the red category. Domain‐level scores and overall composite scores were also assigned colors. Performance at or above 80% (16 on the 20‐point domain scale, or 80 on the 100‐point overall scale) were designated green, scores between 70% and 79% were yellow, and scores below 70% were red.
DOMAINS OF THE PATIENT FLOW COMPOSITE SCORE
ED and ED‐to‐Inpatient Transition
Patient progression from the ED to an inpatient unit was separated into 4 steps (Figure 1A): (1) arrival to physician evaluation, (2) ED physician evaluation to decision to admit, (3) decision to admit to medical doctor (MD) report complete, and (4) registered nurse (RN) report to patient to floor. Four additional metrics included: (5) ED LOS for nonadmitted patients, (6) leaving without being seen (LWBS) rate, (7) ED admission rate, and (8) ED volume.
Arrival to physician evaluation measures time between patient arrival in the ED and self‐assignment by the first doctor or nurse practitioner in the electronic record, with a goal of 80% of patients seen within 60 minutes. The component score is calculated as percent of patients meeting this goal (ie, seen within 60 minutes) component weight. ED physician evaluation to decision to admit measures time from the start of the physician evaluation to the decision to admit, using bed request as a proxy; the goal was 80% within 4 hours. Decision to admit to MD report complete measures time from bed request to patient sign‐out to the inpatient floor, with a goal of 80% within 2 hours. RN report to patient to floor measures time from sign‐out to the patient leaving the ED, with a goal of 80% within 1 hour. ED LOS for nonadmitted patients measures time in the ED for patients who are not admitted, and the goal was 80% in <5 hours. The domain also tracks the LWBS rate, with a goal of keeping it below 3%. Its component score is calculated as percent patients seen component weight. ED admission rate is an adjusting factor for the severity of patients visiting the ED. Its component score is calculated as (percent of patients visiting the ED who are admitted to the hospital 5) component weight. Because the average admission rate is around 20%, the percent admitted is multiplied by 5 to more effectively adjust for high‐severity patients. ED volume is an adjusting factor that accounts for high volume. Its component score is calculated as percent of days in a month with more than 250 visits (a threshold chosen by the ED team) component weight. If these days exceed 50%, that percent would be added to the component score as an additional adjustment for excessive volume.
Bed Management
The bed management domain measures how efficiently and effectively patients are assigned to units and beds using 4 metrics (Figure 1B): (1) bed request to unit assignment, (2) unit assignment to bed assignment, (3) percentage of patients placed on right unit for service, and (4) percent of days with peak occupancy >95%.
Bed request to unit assignment measures time from the ED request for a bed in the electronic system to patient being assigned to a unit, with a goal of 80% of assignments made within 20 minutes. Unit assignment to bed assignment measures time from unit assignment to bed assignment, with a goal of 75% within 25 minutes. Because this goal was set to 75% rather than 80%, this component score was multiplied by 80/75 so that all component scores could be compared on the same scale. Percentage of patients placed on right unit for service is a balancing measure for speed of assignment. Because the goal was set to 90% rather than 80%, this component score was also multiplied by an adjusting factor (80/90) so that all components could be compared on the same scale. Percent of days with peak occupancy >95% is an adjusting measure that reflects that locating an appropriate bed takes longer when the hospital is approaching full occupancy. Its component score is calculated as (percent of days with peak occupancy >95% + 1) component weight. The was added to more effectively adjust for high occupancy. If more than 20% of days had peak occupancy greater than 95%, that percent would be added to the component score as an additional adjustment for excessive capacity.
Discharge Process
The discharge process domain measures the efficiency of patient discharge using 2 metrics (Figure 1C): (1) decision to discharge and (2) homeward bound time.
Decision to discharge tracks when clinicians enter electronic discharge orders. The goal was 50% by 1:30 pm for medical services and 10:30 am for surgical services. This encourages physicians to enter discharge orders early to enable downstream discharge work to begin. The component score is calculated as percent entered by goal time component weight (80/50) to adjust the 50% goal up to 80% so all component scores could be compared on the same scale. Homeward bound time measures the time between the discharge order and room vacancy as entered by the unit clerk, with a goal of 80% of patients leaving within 110 minutes for medical services and 240 minutes for surgical services. This balancing measure captures the fact that entering discharge orders early does not facilitate flow if the patients do not actually leave the hospital.
Room Turnover and Environmental Services Department
The room turnover and ESD domain measures the quality of the room turnover processes using 4 metrics (Figure 1D): (1) discharge to in progress time, (2) in progress to complete time, (3) total discharge to clean time, and (4) room cleanliness.
Discharge to in progress time measures time from patient vacancy until ESD staff enters the room, with a goal of 75% within 35 minutes. Because the goal was set to 75% rather than 80%, this component score was multiplied by 80/75 so all component scores could be compared on the same scale. In progress to complete time measures time as entered in the electronic health record from ESD staff entering the room to the room being clean, with a goal of 75% within 55 minutes. The component score is calculated identically to the previous metric. Total discharge to clean time measures the length of the total process, with a goal of 75% within 90 minutes. This component score was also multiplied by 80/75 so that all component scores could be compared on the same scale. Although this repeats the first 2 measures, given workflow and interface issues with our electronic health record (Epic, Epic Systems Corporation, Verona Wisconsin), it is necessary to include a total end‐to‐end measure in addition to the subparts. Patient and family ratings of room cleanliness serve as balancing measures, with the component score calculated as percent satisfaction component weight (80/85) to adjust the 85% satisfaction goal to 80% so all component scores could be compared on the same scale.
Scheduling and Utilization
The scheduling and utilization domain measures hospital operations and variations in bed utilization using 7 metrics including (Figure 1E): (1) coefficient of variation (CV): scheduled admissions, (2) CV: scheduled admissions for weekdays only, (3) CV: emergent admissions, (4) CV: scheduled occupancy, (5) CV: emergent occupancy, (6) percent emergent admissions with LOS >1 day, and (7) percent of days with peak occupancy <95%.
The CV, standard deviation divided by the mean of a distribution, is a measure of dispersion. Because it is a normalized value reported as a percentage, CV can be used to compare variability when sample sizes differ. CV: scheduled admissions captures the variability in admissions coded as an elective across all days in a month. The raw CV score is the standard deviation of the elective admissions for each day divided by the mean. The component score is (1 CV) component weight. A higher CV indicates greater variability, and yields a lower component score. CV on scheduled and emergent occupancy is derived from peak daily occupancy. Percent emergent admissions with LOS >1 day captures the efficiency of bed use, because high volumes of short‐stay patients increases turnover work. Its component score is calculated as the percent of emergent admissions in a month with LOS >1 day component weight. Percent of days with peak occupancy <95% incentivizes the hospital to avoid full occupancy, because effective flow requires that some beds remain open.[18, 19] Its component score is calculated as the percent of days in the month with peak occupancy <95% component weight. Although a similar measure, percent of days with peak occupancy >95%, was an adjusting factor in the bed management domain, it is included again here, because this factor has a unique effect on both domains.
RESULTS
The balanced scorecard with composite measures provided improvement teams and administrators with a picture of patient flow (Figure 2). The overall score provided a global perspective on patient flow over time and captured trends in performance during various states of hospital occupancy. One trend that it captured was an association between high volume and poor composite scores (Figure 3). Notably, the H1N1 influenza pandemic in the fall of 2009 and the turnover of computer systems in January 2011 can be linked to dips in performance. The changes between fiscal years reflect a shift in baseline metrics.
In addition to the overall composite score, the domain level and individual component scores allowed for more specific evaluation of variables affecting quality of care and enabled targeted improvement activities (Figure 4). For example, in December 2010 and January 2011, room turnover and ESD domain scores dropped, especially in the total discharge to clean time component. In response, the ESD made staffing adjustments, and starting in February 2011, component scores and the domain score improved. Feedback from the scheduling and utilization domain scores also initiated positive change. In August 2010, the CV: scheduled occupancy component score started to drop. In response, certain elective admissions were shifted to weekends to distribute hospital occupancy more evenly throughout the week. By February 2011, the component returned to its goal level. This continual evaluation of performance motivates continual improvement.
DISCUSSION
The use of a patient flow balanced scorecard with composite measurement overcomes pitfalls associated with a single or unaggregated measure. Aggregate scores alone mask important differences and relationships among components.[13] For example, 2 domains may be inversely related, or a provider with an overall average score might score above average in 1 domain but below in another. The composite scorecard, however, shows individual component and domain scores in addition to an aggregate score. The individual component and domain level scores highlight specific areas that need improvement and allow attention to be directed to those areas.
Additionally, a composite score is more likely to engage the range of staff involved in patient flow. Scaling out of 100 points and the red‐yellow‐green model are familiar for operations performance and can be easily understood.[17] Moreover, a composite score allows for dynamic performance goals while maintaining a stable measurement structure. For example, standardized LOS ratios, readmission rates, and denied hospital days can be added to the scorecard to provide more information and balancing measures.
Although balanced scorecards with composites can make holistic performance visible across multiple operational domains, they have some disadvantages. First, because there is a degree of complexity associated with a measure that incorporates multiple aspects of flow, certain elements, such as the relationship between a metric and its balancing measure, may not be readily apparent. Second, composite measures may not provide actionable information if the measure is not clearly related to a process that can be improved.[13, 14] Third, individual metrics may not be replicable between locations, so composites may need to be individualized to each setting.[10, 20]
Improving patient flow is a goal at many hospitals. Although measurement is crucial to identifying and mitigating variations, measuring the multidimensional aspects of flow and their impact on quality is difficult. Our scorecard, with composite measurement, addresses the need for an improved method to assess patient flow and improve quality by tracking care processes simultaneously.
Acknowledgements
The authors thank Bhuvaneswari Jayaraman for her contributions to the original calculations for the first version of the composite score.
Disclosures: Internal funds from The Children's Hospital of Philadelphia supported the conduct of this work. The authors report no conflicts of interest.
- AHA Solutions. Patient Flow Challenges Assessment 2009. Chicago, IL: American Hospital Association; 2009.
- , , , et al. The impact of emergency department crowding measures on time to antibiotics for patients with community‐acquired pneumonia. Ann Emerg Med. 2007;50(5):510–516.
- . Practice variation: implications for our health care system. Manag Care. 2004;13(9 suppl):3–7.
- . Managing variability in patient flow is the key to improving access to care, nursing staffing, quality of care, and reducing its cost. Paper presented at: Institute of Medicine; June 24, 2004; Washington, DC.
- , , . Developing models for patient flow and daily surge capacity research. Acad Emerg Med. 2006;13(11):1109–1113.
- , , , , . Patient flow variability and unplanned readmissions to an intensive care unit. Crit Care Med. 2009;37(11):2882–2887.
- , , , , , . Scheduled admissions and high occupancy at a children's hospital. J Hosp Med. 2011;6(2):81–87.
- , , . Frequent overcrowding in US emergency departments. Acad Emerg Med. 2001;8(2):151–155.
- Institute of Medicine. Performance measurement: accelerating improvement. Available at: http://www.iom.edu/Reports/2005/Performance‐Measurement‐Accelerating‐Improvement.aspx. Published December 1, 2005. Accessed December 5, 2012.
- , , , . Emergency department performance measures and benchmarking summit. Acad Emerg Med. 2006;13(10):1074–1080.
- . The Surgical Infection Prevention and Surgical Care Improvement Projects: promises and pitfalls. Am Surg. 2006;72(11):1010–1016; discussion 1021–1030, 1133–1048.
- , , . Patient safety quality indicators. Composite measures workgroup. Final report. Rockville, MD; Agency for Healthcare Research and Quality; 2008.
- , , , et al. ACCF/AHA 2010 position statement on composite measures for healthcare performance assessment: a report of the American College of Cardiology Foundation/American Heart Association Task Force on performance measures (Writing Committee to develop a position statement on composite measures). Circulation. 2010;121(15):1780–1791.
- , . A five‐point checklist to help performance reports incentivize improvement and effectively guide patients. Health Aff (Millwood). 2012;31(3):612–618.
- , , , , . Composite measures for profiling hospitals on surgical morbidity. Ann Surg. 2013;257(1):67–72.
- , . All‐or‐none measurement raises the bar on performance. JAMA. 2006;295(10):1168–1170.
- , , , et al. Quality improvement. Red light‐green light: from kids' game to discharge tool. Healthc Q. 2011;14:77–81.
- , , , . Myths of ideal hospital occupancy. Med J Aust. 2010;192(1):42–43.
- , . Emergency department overcrowding in the United States: an emerging threat to patient safety and public health. Emerg Med J. 2003;20(5):402–405.
- , , , . Emergency department crowding: consensus development of potential measures. Ann Emerg Med. 2003;42(6):824–834.
