User login
Patient Flow Composite Measurement
Patient flow refers to the management and movement of patients in a healthcare facility. Healthcare institutions utilize patient flow analyses to evaluate and improve aspects of the patient experience including safety, effectiveness, efficiency, timeliness, patient centeredness, and equity.[1, 2, 3, 4, 5, 6, 7, 8] Hospitals can evaluate patient flow using specific metrics, such as time in emergency department (ED) or percent of discharges completed by a certain time of day. However, no single metric can represent the full spectrum of processes inherent to patient flow. For example, ED length of stay (LOS) is dependent on inpatient occupancy, which is dependent on discharge timeliness. Each of these activities depends on various smaller activities, such as cleaning rooms or identifying available beds.
Evaluating the quality that healthcare organizations deliver is growing in importance.[9] Composite scores are being used increasingly to assess clinical processes and outcomes for professionals and institutions.[10, 11] Where various aspects of performance coexist, composite measures can incorporate multiple metrics into a comprehensive summary.[12, 13, 14, 15, 16] They also allow organizations to track a range of metrics for more holistic, comprehensive evaluations.[9, 13]
This article describes a balanced scorecard with composite scoring used at a large urban children's hospital to evaluate patient flow and direct improvement resources where they are needed most.
METHODS
The Children's Hospital of Philadelphia identified patient flow improvement as an operating plan initiative. Previously, performance was measured with a series of independent measures including time from ED arrival to transfer to the inpatient floor, and time from discharge order to room vacancy. These metrics were dismissed as sole measures of flow because they did not reflect the complexity and interdependence of processes or improvement efforts. There were also concerns that efforts to improve a measure caused unintended consequences for others, which at best lead to little overall improvement, and at worst reduced performance elsewhere in the value chain. For example, to meet a goal time for entering discharge orders, physicians could enter orders earlier. But, if patients were not actually ready to leave, their beds were not made available any earlier. Similarly, bed management staff could rush to meet a goal for speed of unit assignment, but this could cause an increase in patients admitted to the wrong specialty floor.
To address these concerns, a group of physicians, nurses, quality improvement specialists, and researchers designed a patient flow scorecard with composite measurement. Five domains of patient flow were identified: (1) ED and ED‐to‐inpatient transition, (2) bed management, (3) discharge process, (4) room turnover and environmental services department (ESD) activities, and (5) scheduling and utilization. Component measures for each domain were selected for 1 of 3 purposes: (1) to correspond to processes of importance to flow and improvement work, (2) to act as adjusters for factors that affect performance, or (3) to act as balancing measures so that progress in a measure would not result in the degradation of another. Each domain was assigned 20 points, which were distributed across the domain's components based on a consensus of the component's relative importance to overall domain performance (Figure 1). Data from the previous year were used as guidelines for setting performance percentile goals. For example, a goal of 80% in 60 minutes for arrival to physician evaluation meant that 80% of patients should see a physician within 1 hour of arriving at the ED.
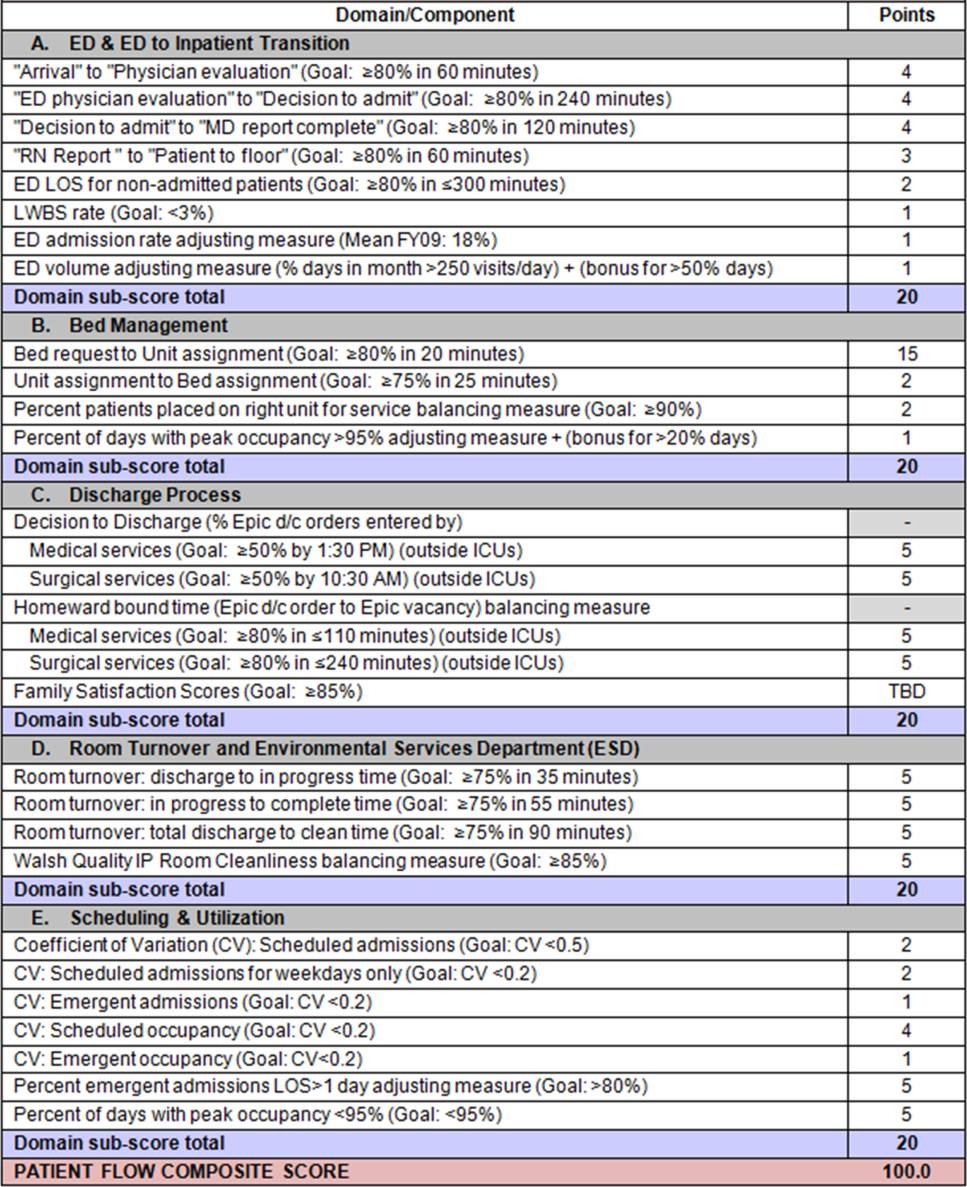
Scores were also categorized to correspond to commonly used color descriptors.[17] For each component measure, performance meeting or exceeding the goal fell into the green category. Performances <10 percentage points below the goal fell into the yellow category, and performances below that level fell into the red category. Domain‐level scores and overall composite scores were also assigned colors. Performance at or above 80% (16 on the 20‐point domain scale, or 80 on the 100‐point overall scale) were designated green, scores between 70% and 79% were yellow, and scores below 70% were red.
DOMAINS OF THE PATIENT FLOW COMPOSITE SCORE
ED and ED‐to‐Inpatient Transition
Patient progression from the ED to an inpatient unit was separated into 4 steps (Figure 1A): (1) arrival to physician evaluation, (2) ED physician evaluation to decision to admit, (3) decision to admit to medical doctor (MD) report complete, and (4) registered nurse (RN) report to patient to floor. Four additional metrics included: (5) ED LOS for nonadmitted patients, (6) leaving without being seen (LWBS) rate, (7) ED admission rate, and (8) ED volume.
Arrival to physician evaluation measures time between patient arrival in the ED and self‐assignment by the first doctor or nurse practitioner in the electronic record, with a goal of 80% of patients seen within 60 minutes. The component score is calculated as percent of patients meeting this goal (ie, seen within 60 minutes) component weight. ED physician evaluation to decision to admit measures time from the start of the physician evaluation to the decision to admit, using bed request as a proxy; the goal was 80% within 4 hours. Decision to admit to MD report complete measures time from bed request to patient sign‐out to the inpatient floor, with a goal of 80% within 2 hours. RN report to patient to floor measures time from sign‐out to the patient leaving the ED, with a goal of 80% within 1 hour. ED LOS for nonadmitted patients measures time in the ED for patients who are not admitted, and the goal was 80% in <5 hours. The domain also tracks the LWBS rate, with a goal of keeping it below 3%. Its component score is calculated as percent patients seen component weight. ED admission rate is an adjusting factor for the severity of patients visiting the ED. Its component score is calculated as (percent of patients visiting the ED who are admitted to the hospital 5) component weight. Because the average admission rate is around 20%, the percent admitted is multiplied by 5 to more effectively adjust for high‐severity patients. ED volume is an adjusting factor that accounts for high volume. Its component score is calculated as percent of days in a month with more than 250 visits (a threshold chosen by the ED team) component weight. If these days exceed 50%, that percent would be added to the component score as an additional adjustment for excessive volume.
Bed Management
The bed management domain measures how efficiently and effectively patients are assigned to units and beds using 4 metrics (Figure 1B): (1) bed request to unit assignment, (2) unit assignment to bed assignment, (3) percentage of patients placed on right unit for service, and (4) percent of days with peak occupancy >95%.
Bed request to unit assignment measures time from the ED request for a bed in the electronic system to patient being assigned to a unit, with a goal of 80% of assignments made within 20 minutes. Unit assignment to bed assignment measures time from unit assignment to bed assignment, with a goal of 75% within 25 minutes. Because this goal was set to 75% rather than 80%, this component score was multiplied by 80/75 so that all component scores could be compared on the same scale. Percentage of patients placed on right unit for service is a balancing measure for speed of assignment. Because the goal was set to 90% rather than 80%, this component score was also multiplied by an adjusting factor (80/90) so that all components could be compared on the same scale. Percent of days with peak occupancy >95% is an adjusting measure that reflects that locating an appropriate bed takes longer when the hospital is approaching full occupancy. Its component score is calculated as (percent of days with peak occupancy >95% + 1) component weight. The was added to more effectively adjust for high occupancy. If more than 20% of days had peak occupancy greater than 95%, that percent would be added to the component score as an additional adjustment for excessive capacity.
Discharge Process
The discharge process domain measures the efficiency of patient discharge using 2 metrics (Figure 1C): (1) decision to discharge and (2) homeward bound time.
Decision to discharge tracks when clinicians enter electronic discharge orders. The goal was 50% by 1:30 pm for medical services and 10:30 am for surgical services. This encourages physicians to enter discharge orders early to enable downstream discharge work to begin. The component score is calculated as percent entered by goal time component weight (80/50) to adjust the 50% goal up to 80% so all component scores could be compared on the same scale. Homeward bound time measures the time between the discharge order and room vacancy as entered by the unit clerk, with a goal of 80% of patients leaving within 110 minutes for medical services and 240 minutes for surgical services. This balancing measure captures the fact that entering discharge orders early does not facilitate flow if the patients do not actually leave the hospital.
Room Turnover and Environmental Services Department
The room turnover and ESD domain measures the quality of the room turnover processes using 4 metrics (Figure 1D): (1) discharge to in progress time, (2) in progress to complete time, (3) total discharge to clean time, and (4) room cleanliness.
Discharge to in progress time measures time from patient vacancy until ESD staff enters the room, with a goal of 75% within 35 minutes. Because the goal was set to 75% rather than 80%, this component score was multiplied by 80/75 so all component scores could be compared on the same scale. In progress to complete time measures time as entered in the electronic health record from ESD staff entering the room to the room being clean, with a goal of 75% within 55 minutes. The component score is calculated identically to the previous metric. Total discharge to clean time measures the length of the total process, with a goal of 75% within 90 minutes. This component score was also multiplied by 80/75 so that all component scores could be compared on the same scale. Although this repeats the first 2 measures, given workflow and interface issues with our electronic health record (Epic, Epic Systems Corporation, Verona Wisconsin), it is necessary to include a total end‐to‐end measure in addition to the subparts. Patient and family ratings of room cleanliness serve as balancing measures, with the component score calculated as percent satisfaction component weight (80/85) to adjust the 85% satisfaction goal to 80% so all component scores could be compared on the same scale.
Scheduling and Utilization
The scheduling and utilization domain measures hospital operations and variations in bed utilization using 7 metrics including (Figure 1E): (1) coefficient of variation (CV): scheduled admissions, (2) CV: scheduled admissions for weekdays only, (3) CV: emergent admissions, (4) CV: scheduled occupancy, (5) CV: emergent occupancy, (6) percent emergent admissions with LOS >1 day, and (7) percent of days with peak occupancy <95%.
The CV, standard deviation divided by the mean of a distribution, is a measure of dispersion. Because it is a normalized value reported as a percentage, CV can be used to compare variability when sample sizes differ. CV: scheduled admissions captures the variability in admissions coded as an elective across all days in a month. The raw CV score is the standard deviation of the elective admissions for each day divided by the mean. The component score is (1 CV) component weight. A higher CV indicates greater variability, and yields a lower component score. CV on scheduled and emergent occupancy is derived from peak daily occupancy. Percent emergent admissions with LOS >1 day captures the efficiency of bed use, because high volumes of short‐stay patients increases turnover work. Its component score is calculated as the percent of emergent admissions in a month with LOS >1 day component weight. Percent of days with peak occupancy <95% incentivizes the hospital to avoid full occupancy, because effective flow requires that some beds remain open.[18, 19] Its component score is calculated as the percent of days in the month with peak occupancy <95% component weight. Although a similar measure, percent of days with peak occupancy >95%, was an adjusting factor in the bed management domain, it is included again here, because this factor has a unique effect on both domains.
RESULTS
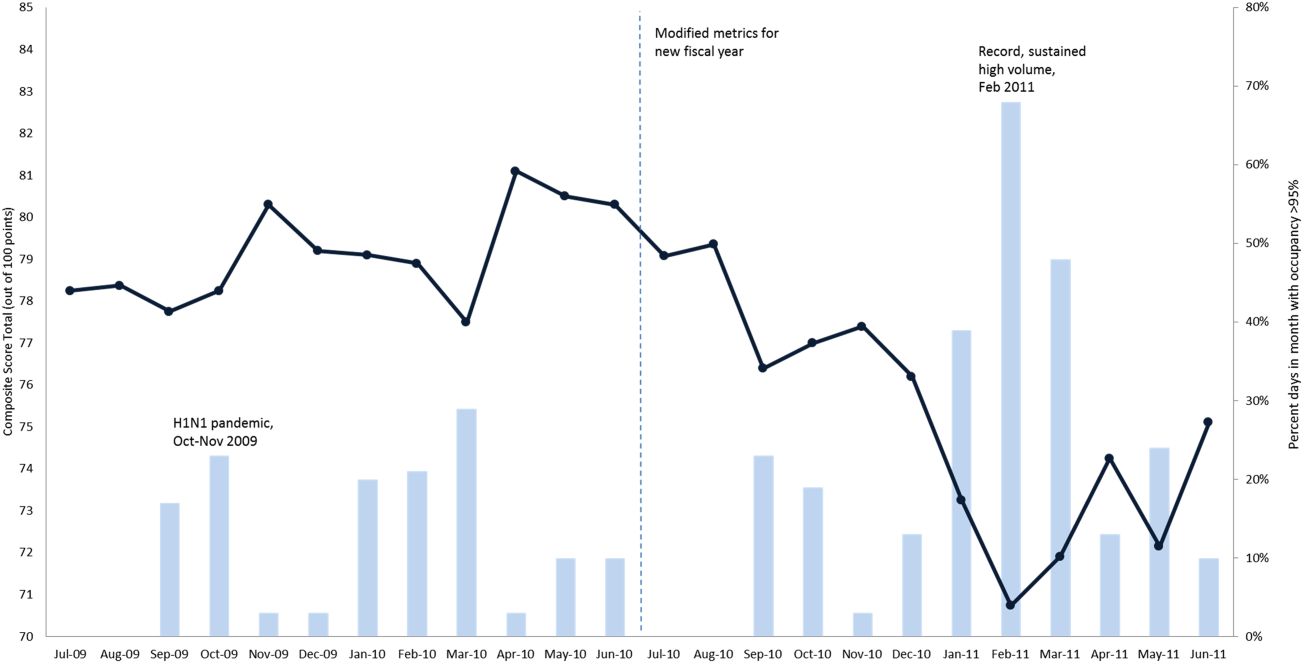
The balanced scorecard with composite measures provided improvement teams and administrators with a picture of patient flow (Figure 2). The overall score provided a global perspective on patient flow over time and captured trends in performance during various states of hospital occupancy. One trend that it captured was an association between high volume and poor composite scores (Figure 3). Notably, the H1N1 influenza pandemic in the fall of 2009 and the turnover of computer systems in January 2011 can be linked to dips in performance. The changes between fiscal years reflect a shift in baseline metrics.
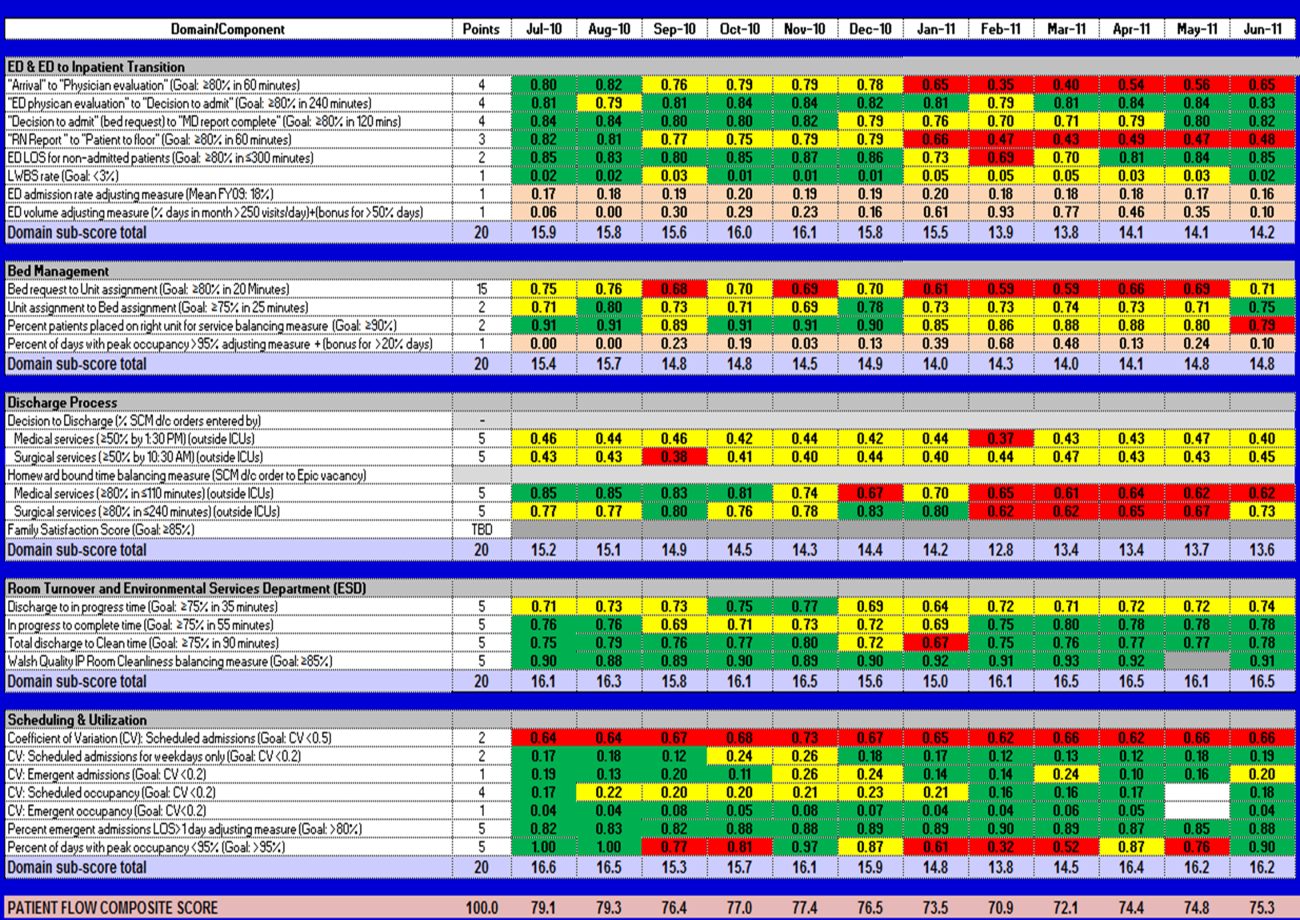
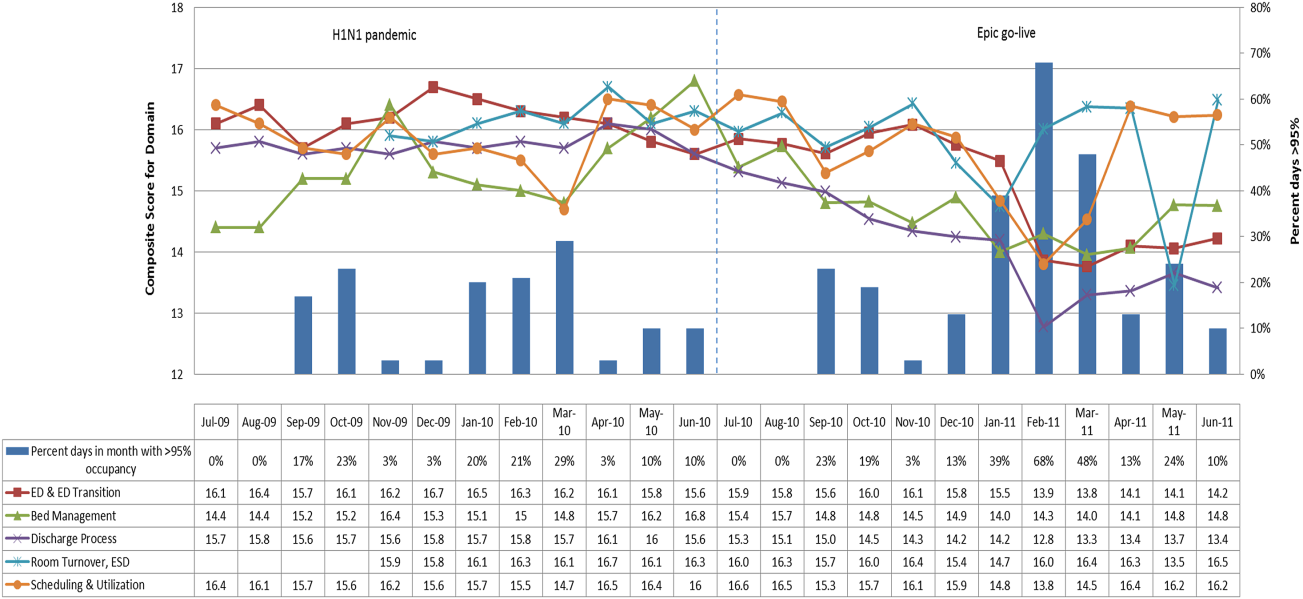
In addition to the overall composite score, the domain level and individual component scores allowed for more specific evaluation of variables affecting quality of care and enabled targeted improvement activities (Figure 4). For example, in December 2010 and January 2011, room turnover and ESD domain scores dropped, especially in the total discharge to clean time component. In response, the ESD made staffing adjustments, and starting in February 2011, component scores and the domain score improved. Feedback from the scheduling and utilization domain scores also initiated positive change. In August 2010, the CV: scheduled occupancy component score started to drop. In response, certain elective admissions were shifted to weekends to distribute hospital occupancy more evenly throughout the week. By February 2011, the component returned to its goal level. This continual evaluation of performance motivates continual improvement.
DISCUSSION
The use of a patient flow balanced scorecard with composite measurement overcomes pitfalls associated with a single or unaggregated measure. Aggregate scores alone mask important differences and relationships among components.[13] For example, 2 domains may be inversely related, or a provider with an overall average score might score above average in 1 domain but below in another. The composite scorecard, however, shows individual component and domain scores in addition to an aggregate score. The individual component and domain level scores highlight specific areas that need improvement and allow attention to be directed to those areas.
Additionally, a composite score is more likely to engage the range of staff involved in patient flow. Scaling out of 100 points and the red‐yellow‐green model are familiar for operations performance and can be easily understood.[17] Moreover, a composite score allows for dynamic performance goals while maintaining a stable measurement structure. For example, standardized LOS ratios, readmission rates, and denied hospital days can be added to the scorecard to provide more information and balancing measures.
Although balanced scorecards with composites can make holistic performance visible across multiple operational domains, they have some disadvantages. First, because there is a degree of complexity associated with a measure that incorporates multiple aspects of flow, certain elements, such as the relationship between a metric and its balancing measure, may not be readily apparent. Second, composite measures may not provide actionable information if the measure is not clearly related to a process that can be improved.[13, 14] Third, individual metrics may not be replicable between locations, so composites may need to be individualized to each setting.[10, 20]
Improving patient flow is a goal at many hospitals. Although measurement is crucial to identifying and mitigating variations, measuring the multidimensional aspects of flow and their impact on quality is difficult. Our scorecard, with composite measurement, addresses the need for an improved method to assess patient flow and improve quality by tracking care processes simultaneously.
Acknowledgements
The authors thank Bhuvaneswari Jayaraman for her contributions to the original calculations for the first version of the composite score.
Disclosures: Internal funds from The Children's Hospital of Philadelphia supported the conduct of this work. The authors report no conflicts of interest.
- AHA Solutions. Patient Flow Challenges Assessment 2009. Chicago, IL: American Hospital Association; 2009.
- , , , et al. The impact of emergency department crowding measures on time to antibiotics for patients with community‐acquired pneumonia. Ann Emerg Med. 2007;50(5):510–516.
- . Practice variation: implications for our health care system. Manag Care. 2004;13(9 suppl):3–7.
- . Managing variability in patient flow is the key to improving access to care, nursing staffing, quality of care, and reducing its cost. Paper presented at: Institute of Medicine; June 24, 2004; Washington, DC.
- , , . Developing models for patient flow and daily surge capacity research. Acad Emerg Med. 2006;13(11):1109–1113.
- , , , , . Patient flow variability and unplanned readmissions to an intensive care unit. Crit Care Med. 2009;37(11):2882–2887.
- , , , , , . Scheduled admissions and high occupancy at a children's hospital. J Hosp Med. 2011;6(2):81–87.
- , , . Frequent overcrowding in US emergency departments. Acad Emerg Med. 2001;8(2):151–155.
- Institute of Medicine. Performance measurement: accelerating improvement. Available at: http://www.iom.edu/Reports/2005/Performance‐Measurement‐Accelerating‐Improvement.aspx. Published December 1, 2005. Accessed December 5, 2012.
- , , , . Emergency department performance measures and benchmarking summit. Acad Emerg Med. 2006;13(10):1074–1080.
- . The Surgical Infection Prevention and Surgical Care Improvement Projects: promises and pitfalls. Am Surg. 2006;72(11):1010–1016; discussion 1021–1030, 1133–1048.
- , , . Patient safety quality indicators. Composite measures workgroup. Final report. Rockville, MD; Agency for Healthcare Research and Quality; 2008.
- , , , et al. ACCF/AHA 2010 position statement on composite measures for healthcare performance assessment: a report of the American College of Cardiology Foundation/American Heart Association Task Force on performance measures (Writing Committee to develop a position statement on composite measures). Circulation. 2010;121(15):1780–1791.
- , . A five‐point checklist to help performance reports incentivize improvement and effectively guide patients. Health Aff (Millwood). 2012;31(3):612–618.
- , , , , . Composite measures for profiling hospitals on surgical morbidity. Ann Surg. 2013;257(1):67–72.
- , . All‐or‐none measurement raises the bar on performance. JAMA. 2006;295(10):1168–1170.
- , , , et al. Quality improvement. Red light‐green light: from kids' game to discharge tool. Healthc Q. 2011;14:77–81.
- , , , . Myths of ideal hospital occupancy. Med J Aust. 2010;192(1):42–43.
- , . Emergency department overcrowding in the United States: an emerging threat to patient safety and public health. Emerg Med J. 2003;20(5):402–405.
- , , , . Emergency department crowding: consensus development of potential measures. Ann Emerg Med. 2003;42(6):824–834.
Patient flow refers to the management and movement of patients in a healthcare facility. Healthcare institutions utilize patient flow analyses to evaluate and improve aspects of the patient experience including safety, effectiveness, efficiency, timeliness, patient centeredness, and equity.[1, 2, 3, 4, 5, 6, 7, 8] Hospitals can evaluate patient flow using specific metrics, such as time in emergency department (ED) or percent of discharges completed by a certain time of day. However, no single metric can represent the full spectrum of processes inherent to patient flow. For example, ED length of stay (LOS) is dependent on inpatient occupancy, which is dependent on discharge timeliness. Each of these activities depends on various smaller activities, such as cleaning rooms or identifying available beds.
Evaluating the quality that healthcare organizations deliver is growing in importance.[9] Composite scores are being used increasingly to assess clinical processes and outcomes for professionals and institutions.[10, 11] Where various aspects of performance coexist, composite measures can incorporate multiple metrics into a comprehensive summary.[12, 13, 14, 15, 16] They also allow organizations to track a range of metrics for more holistic, comprehensive evaluations.[9, 13]
This article describes a balanced scorecard with composite scoring used at a large urban children's hospital to evaluate patient flow and direct improvement resources where they are needed most.
METHODS
The Children's Hospital of Philadelphia identified patient flow improvement as an operating plan initiative. Previously, performance was measured with a series of independent measures including time from ED arrival to transfer to the inpatient floor, and time from discharge order to room vacancy. These metrics were dismissed as sole measures of flow because they did not reflect the complexity and interdependence of processes or improvement efforts. There were also concerns that efforts to improve a measure caused unintended consequences for others, which at best lead to little overall improvement, and at worst reduced performance elsewhere in the value chain. For example, to meet a goal time for entering discharge orders, physicians could enter orders earlier. But, if patients were not actually ready to leave, their beds were not made available any earlier. Similarly, bed management staff could rush to meet a goal for speed of unit assignment, but this could cause an increase in patients admitted to the wrong specialty floor.
To address these concerns, a group of physicians, nurses, quality improvement specialists, and researchers designed a patient flow scorecard with composite measurement. Five domains of patient flow were identified: (1) ED and ED‐to‐inpatient transition, (2) bed management, (3) discharge process, (4) room turnover and environmental services department (ESD) activities, and (5) scheduling and utilization. Component measures for each domain were selected for 1 of 3 purposes: (1) to correspond to processes of importance to flow and improvement work, (2) to act as adjusters for factors that affect performance, or (3) to act as balancing measures so that progress in a measure would not result in the degradation of another. Each domain was assigned 20 points, which were distributed across the domain's components based on a consensus of the component's relative importance to overall domain performance (Figure 1). Data from the previous year were used as guidelines for setting performance percentile goals. For example, a goal of 80% in 60 minutes for arrival to physician evaluation meant that 80% of patients should see a physician within 1 hour of arriving at the ED.
Scores were also categorized to correspond to commonly used color descriptors.[17] For each component measure, performance meeting or exceeding the goal fell into the green category. Performances <10 percentage points below the goal fell into the yellow category, and performances below that level fell into the red category. Domain‐level scores and overall composite scores were also assigned colors. Performance at or above 80% (16 on the 20‐point domain scale, or 80 on the 100‐point overall scale) were designated green, scores between 70% and 79% were yellow, and scores below 70% were red.
DOMAINS OF THE PATIENT FLOW COMPOSITE SCORE
ED and ED‐to‐Inpatient Transition
Patient progression from the ED to an inpatient unit was separated into 4 steps (Figure 1A): (1) arrival to physician evaluation, (2) ED physician evaluation to decision to admit, (3) decision to admit to medical doctor (MD) report complete, and (4) registered nurse (RN) report to patient to floor. Four additional metrics included: (5) ED LOS for nonadmitted patients, (6) leaving without being seen (LWBS) rate, (7) ED admission rate, and (8) ED volume.
Arrival to physician evaluation measures time between patient arrival in the ED and self‐assignment by the first doctor or nurse practitioner in the electronic record, with a goal of 80% of patients seen within 60 minutes. The component score is calculated as percent of patients meeting this goal (ie, seen within 60 minutes) component weight. ED physician evaluation to decision to admit measures time from the start of the physician evaluation to the decision to admit, using bed request as a proxy; the goal was 80% within 4 hours. Decision to admit to MD report complete measures time from bed request to patient sign‐out to the inpatient floor, with a goal of 80% within 2 hours. RN report to patient to floor measures time from sign‐out to the patient leaving the ED, with a goal of 80% within 1 hour. ED LOS for nonadmitted patients measures time in the ED for patients who are not admitted, and the goal was 80% in <5 hours. The domain also tracks the LWBS rate, with a goal of keeping it below 3%. Its component score is calculated as percent patients seen component weight. ED admission rate is an adjusting factor for the severity of patients visiting the ED. Its component score is calculated as (percent of patients visiting the ED who are admitted to the hospital 5) component weight. Because the average admission rate is around 20%, the percent admitted is multiplied by 5 to more effectively adjust for high‐severity patients. ED volume is an adjusting factor that accounts for high volume. Its component score is calculated as percent of days in a month with more than 250 visits (a threshold chosen by the ED team) component weight. If these days exceed 50%, that percent would be added to the component score as an additional adjustment for excessive volume.
Bed Management
The bed management domain measures how efficiently and effectively patients are assigned to units and beds using 4 metrics (Figure 1B): (1) bed request to unit assignment, (2) unit assignment to bed assignment, (3) percentage of patients placed on right unit for service, and (4) percent of days with peak occupancy >95%.
Bed request to unit assignment measures time from the ED request for a bed in the electronic system to patient being assigned to a unit, with a goal of 80% of assignments made within 20 minutes. Unit assignment to bed assignment measures time from unit assignment to bed assignment, with a goal of 75% within 25 minutes. Because this goal was set to 75% rather than 80%, this component score was multiplied by 80/75 so that all component scores could be compared on the same scale. Percentage of patients placed on right unit for service is a balancing measure for speed of assignment. Because the goal was set to 90% rather than 80%, this component score was also multiplied by an adjusting factor (80/90) so that all components could be compared on the same scale. Percent of days with peak occupancy >95% is an adjusting measure that reflects that locating an appropriate bed takes longer when the hospital is approaching full occupancy. Its component score is calculated as (percent of days with peak occupancy >95% + 1) component weight. The was added to more effectively adjust for high occupancy. If more than 20% of days had peak occupancy greater than 95%, that percent would be added to the component score as an additional adjustment for excessive capacity.
Discharge Process
The discharge process domain measures the efficiency of patient discharge using 2 metrics (Figure 1C): (1) decision to discharge and (2) homeward bound time.
Decision to discharge tracks when clinicians enter electronic discharge orders. The goal was 50% by 1:30 pm for medical services and 10:30 am for surgical services. This encourages physicians to enter discharge orders early to enable downstream discharge work to begin. The component score is calculated as percent entered by goal time component weight (80/50) to adjust the 50% goal up to 80% so all component scores could be compared on the same scale. Homeward bound time measures the time between the discharge order and room vacancy as entered by the unit clerk, with a goal of 80% of patients leaving within 110 minutes for medical services and 240 minutes for surgical services. This balancing measure captures the fact that entering discharge orders early does not facilitate flow if the patients do not actually leave the hospital.
Room Turnover and Environmental Services Department
The room turnover and ESD domain measures the quality of the room turnover processes using 4 metrics (Figure 1D): (1) discharge to in progress time, (2) in progress to complete time, (3) total discharge to clean time, and (4) room cleanliness.
Discharge to in progress time measures time from patient vacancy until ESD staff enters the room, with a goal of 75% within 35 minutes. Because the goal was set to 75% rather than 80%, this component score was multiplied by 80/75 so all component scores could be compared on the same scale. In progress to complete time measures time as entered in the electronic health record from ESD staff entering the room to the room being clean, with a goal of 75% within 55 minutes. The component score is calculated identically to the previous metric. Total discharge to clean time measures the length of the total process, with a goal of 75% within 90 minutes. This component score was also multiplied by 80/75 so that all component scores could be compared on the same scale. Although this repeats the first 2 measures, given workflow and interface issues with our electronic health record (Epic, Epic Systems Corporation, Verona Wisconsin), it is necessary to include a total end‐to‐end measure in addition to the subparts. Patient and family ratings of room cleanliness serve as balancing measures, with the component score calculated as percent satisfaction component weight (80/85) to adjust the 85% satisfaction goal to 80% so all component scores could be compared on the same scale.
Scheduling and Utilization
The scheduling and utilization domain measures hospital operations and variations in bed utilization using 7 metrics including (Figure 1E): (1) coefficient of variation (CV): scheduled admissions, (2) CV: scheduled admissions for weekdays only, (3) CV: emergent admissions, (4) CV: scheduled occupancy, (5) CV: emergent occupancy, (6) percent emergent admissions with LOS >1 day, and (7) percent of days with peak occupancy <95%.
The CV, standard deviation divided by the mean of a distribution, is a measure of dispersion. Because it is a normalized value reported as a percentage, CV can be used to compare variability when sample sizes differ. CV: scheduled admissions captures the variability in admissions coded as an elective across all days in a month. The raw CV score is the standard deviation of the elective admissions for each day divided by the mean. The component score is (1 CV) component weight. A higher CV indicates greater variability, and yields a lower component score. CV on scheduled and emergent occupancy is derived from peak daily occupancy. Percent emergent admissions with LOS >1 day captures the efficiency of bed use, because high volumes of short‐stay patients increases turnover work. Its component score is calculated as the percent of emergent admissions in a month with LOS >1 day component weight. Percent of days with peak occupancy <95% incentivizes the hospital to avoid full occupancy, because effective flow requires that some beds remain open.[18, 19] Its component score is calculated as the percent of days in the month with peak occupancy <95% component weight. Although a similar measure, percent of days with peak occupancy >95%, was an adjusting factor in the bed management domain, it is included again here, because this factor has a unique effect on both domains.
RESULTS
The balanced scorecard with composite measures provided improvement teams and administrators with a picture of patient flow (Figure 2). The overall score provided a global perspective on patient flow over time and captured trends in performance during various states of hospital occupancy. One trend that it captured was an association between high volume and poor composite scores (Figure 3). Notably, the H1N1 influenza pandemic in the fall of 2009 and the turnover of computer systems in January 2011 can be linked to dips in performance. The changes between fiscal years reflect a shift in baseline metrics.
In addition to the overall composite score, the domain level and individual component scores allowed for more specific evaluation of variables affecting quality of care and enabled targeted improvement activities (Figure 4). For example, in December 2010 and January 2011, room turnover and ESD domain scores dropped, especially in the total discharge to clean time component. In response, the ESD made staffing adjustments, and starting in February 2011, component scores and the domain score improved. Feedback from the scheduling and utilization domain scores also initiated positive change. In August 2010, the CV: scheduled occupancy component score started to drop. In response, certain elective admissions were shifted to weekends to distribute hospital occupancy more evenly throughout the week. By February 2011, the component returned to its goal level. This continual evaluation of performance motivates continual improvement.
DISCUSSION
The use of a patient flow balanced scorecard with composite measurement overcomes pitfalls associated with a single or unaggregated measure. Aggregate scores alone mask important differences and relationships among components.[13] For example, 2 domains may be inversely related, or a provider with an overall average score might score above average in 1 domain but below in another. The composite scorecard, however, shows individual component and domain scores in addition to an aggregate score. The individual component and domain level scores highlight specific areas that need improvement and allow attention to be directed to those areas.
Additionally, a composite score is more likely to engage the range of staff involved in patient flow. Scaling out of 100 points and the red‐yellow‐green model are familiar for operations performance and can be easily understood.[17] Moreover, a composite score allows for dynamic performance goals while maintaining a stable measurement structure. For example, standardized LOS ratios, readmission rates, and denied hospital days can be added to the scorecard to provide more information and balancing measures.
Although balanced scorecards with composites can make holistic performance visible across multiple operational domains, they have some disadvantages. First, because there is a degree of complexity associated with a measure that incorporates multiple aspects of flow, certain elements, such as the relationship between a metric and its balancing measure, may not be readily apparent. Second, composite measures may not provide actionable information if the measure is not clearly related to a process that can be improved.[13, 14] Third, individual metrics may not be replicable between locations, so composites may need to be individualized to each setting.[10, 20]
Improving patient flow is a goal at many hospitals. Although measurement is crucial to identifying and mitigating variations, measuring the multidimensional aspects of flow and their impact on quality is difficult. Our scorecard, with composite measurement, addresses the need for an improved method to assess patient flow and improve quality by tracking care processes simultaneously.
Acknowledgements
The authors thank Bhuvaneswari Jayaraman for her contributions to the original calculations for the first version of the composite score.
Disclosures: Internal funds from The Children's Hospital of Philadelphia supported the conduct of this work. The authors report no conflicts of interest.
- AHA Solutions. Patient Flow Challenges Assessment 2009. Chicago, IL: American Hospital Association; 2009.
- , , , et al. The impact of emergency department crowding measures on time to antibiotics for patients with community‐acquired pneumonia. Ann Emerg Med. 2007;50(5):510–516.
- . Practice variation: implications for our health care system. Manag Care. 2004;13(9 suppl):3–7.
- . Managing variability in patient flow is the key to improving access to care, nursing staffing, quality of care, and reducing its cost. Paper presented at: Institute of Medicine; June 24, 2004; Washington, DC.
- , , . Developing models for patient flow and daily surge capacity research. Acad Emerg Med. 2006;13(11):1109–1113.
- , , , , . Patient flow variability and unplanned readmissions to an intensive care unit. Crit Care Med. 2009;37(11):2882–2887.
- , , , , , . Scheduled admissions and high occupancy at a children's hospital. J Hosp Med. 2011;6(2):81–87.
- , , . Frequent overcrowding in US emergency departments. Acad Emerg Med. 2001;8(2):151–155.
- Institute of Medicine. Performance measurement: accelerating improvement. Available at: http://www.iom.edu/Reports/2005/Performance‐Measurement‐Accelerating‐Improvement.aspx. Published December 1, 2005. Accessed December 5, 2012.
- , , , . Emergency department performance measures and benchmarking summit. Acad Emerg Med. 2006;13(10):1074–1080.
- . The Surgical Infection Prevention and Surgical Care Improvement Projects: promises and pitfalls. Am Surg. 2006;72(11):1010–1016; discussion 1021–1030, 1133–1048.
- , , . Patient safety quality indicators. Composite measures workgroup. Final report. Rockville, MD; Agency for Healthcare Research and Quality; 2008.
- , , , et al. ACCF/AHA 2010 position statement on composite measures for healthcare performance assessment: a report of the American College of Cardiology Foundation/American Heart Association Task Force on performance measures (Writing Committee to develop a position statement on composite measures). Circulation. 2010;121(15):1780–1791.
- , . A five‐point checklist to help performance reports incentivize improvement and effectively guide patients. Health Aff (Millwood). 2012;31(3):612–618.
- , , , , . Composite measures for profiling hospitals on surgical morbidity. Ann Surg. 2013;257(1):67–72.
- , . All‐or‐none measurement raises the bar on performance. JAMA. 2006;295(10):1168–1170.
- , , , et al. Quality improvement. Red light‐green light: from kids' game to discharge tool. Healthc Q. 2011;14:77–81.
- , , , . Myths of ideal hospital occupancy. Med J Aust. 2010;192(1):42–43.
- , . Emergency department overcrowding in the United States: an emerging threat to patient safety and public health. Emerg Med J. 2003;20(5):402–405.
- , , , . Emergency department crowding: consensus development of potential measures. Ann Emerg Med. 2003;42(6):824–834.
