User login
Caring for Patients on Insulin Pumps
Delivery of insulin via continuous subcutaneous insulin infusion (CSII), or insulin pump, has gained wide acceptance. It is estimated that 400,000 patients with type 1 diabetes mellitus (T1DM) are using insulin pumps.[1] A registry for T1DM in the United States indicated that 50% of the 25,833 participants were using an insulin pump.[2] Use of CSII in type 2 DM (T2DM) is also increasing.[3]
Patients with DM are 3 as likely to be hospitalized than patients without DM.[4] Twenty percent to 30% of adult hospitalized patients have a known diagnosis of DM.[5] It is therefore to be expected that patients on CSII will be seen with increased frequency in the hospital setting. This leads to potential difficultiesinpatient healthcare providers may not be familiar with insulin pumps, and patients may not be aware of complexities associated with pump usage in the hospital.
This article will review CSII usage in the hospital, offering strategies for management in partnership with the patient based on our experiences and processes developed in our institution.
SHOULD CONTINUOUS SUBCUTANEOUS INSULIN INFUSION BE CONTINUED IN THE HOSPITAL?
The American Diabetes Association advocates (1) allowing patients who are physically and mentally able to continue CSII when hospitalized, (2) having a hospital policy for CSII use, and (3) having hospital personnel with expertise on pump management.[6] The American Association of Clinical Endocrinologists echoes much of the same and suggests contacting the specialist responsible for the pump in the ambulatory setting for decisions on adjustments in the hospitalized patient,[7] which at times may not be feasible.
The logic and benefits of basal‐bolus insulin dosing (ie, giving basal insulin to account for fasting requirements, plus bolus insulin to cover nutritional and correctional needs) have been well‐described.[8, 9, 10] In randomized clinical trials on patients admitted to general medical and surgical floors, basal‐bolus insulin (long‐acting basal insulin plus mealtime fast‐acting insulin injections) resulted in better glycemic control and reduced infection rates compared with sliding‐scale therapy (waiting for high blood glucoses before giving insulin, instead of giving it proactively to prevent hyperglycemia).[9, 10] At present, insulin delivery via the insulin pump is the best commercially available method to deliver insulin in a basal‐bolus manner in ambulatory patients. It thus makes sense to continue CSII in the hospital if patients are able to manage their pumps, though there are no randomized trials answering this question as of yet.
Studies on insulin pumps in the hospital are sparse. In one group's latest retrospective study of 136 patients over a 6‐year period, CSII was continued during the entire hospital stay in 65% of the hospitalizations, was used intermittently in 20%, and was discontinued with alternative insulin regimens given in 15%.[11] Mean glucose was 178 47 mg/dL (mean standard deviation), with no significant difference between groups. There were fewer episodes of severe hyperglycemia among those who continued on the pump compared with the other groups, and fewer episodes of hypoglycemia in those who continued on vs those taken off the pump. There was 1 episode of an infusion catheter kinking, resulting in nonfatal hyperglycemia, but no reported pump‐site infections, mechanical pump failure, or diabetic ketoacidosis (DKA) among patients remaining on CSII.
CLINICAL VIGNETTES
The following cases illustrate potential challenges with CSII use that we have encountered in the hospital.
The Patient Needing Transition to Multiple Daily Insulin Injections
A 29‐year‐old male with T1DM, on CSII, was admitted for fever and chills. His latest glycated hemoglobin (HbA1c) level was 6.8%. His glucose levels started rising, and he wished to be taken off the insulin pump. He was started by the primary team on multiple daily insulin injections (MDII) with insulin glargine and insulin lispro. His glucose levels continued to rise, so an intravenous (IV) insulin infusion was started. Endocrinology was then consulted. The patient's condition was concerning for the potential development of DKA, so he was kept on IV insulin. When he was ready for transitioning to subcutaneous insulin, the pump had been taken home by a family member, and the patient could not recall his CSII basal rates but knew his total basal insulin dose, carbohydrate ratio, and sensitivity factor. Endocrinology assisted in transitioning him from the insulin infusion to MDII based on these recalled doses. When the insulin pump was available, the pump settings were interrogated, and he was transitioned back to it.
Key points:
- Having key hospital personnel trained on CSII, including interrogating the pump's settings, facilitates the transitioning of these patients from one hospital unit, or level of care, to another.
- Accessing the pump's settings involves pushing several buttons on the insulin pump. Because key hospital personnel will encounter patients on different insulin pumps, it may be helpful to keep menu maps handy as a quick reference. A menu map will show at a glance where certain information can be found, such as the basal insulin rate or the sensitivity factor (see examples in Figures 1 and 2).[12, 13]
- Knowing the HbA1c will help determine if pump use has been effective.


The Patient With Technical Problems
An 84‐year‐old gentleman with T2DM was admitted for heart failure and aortic valve replacement. His HbA1c was 6.2%, and he had had several outpatient hypoglycemic events. While on CSII in the hospital, his point of care testing (POCT) glucose readings ranged from 105 to 260 mg/dL. On the afternoon of the third hospital day, POCT readings stayed above 220 mg/dL and rose to 348 mg/dL on the fourth hospital morning, despite multiple blousing and changing the insulin, insertion site, reservoir cartridge, and pump tubing. There was no evidence of infection and no medication change that would have impacted glucose levels. Review of his procedures revealed that he had undergone computed tomography (CT) on the morning of hospital day 3 and wore his pump while being scanned. The pump company was notified.
Key points:
- Patients, and medical and nursing staff, should be reminded to remove insulin pumps for CT scans, magnetic resonance imaging, x‐rays, or other tests with high electromagnetic fields.
- If there is a suspicion of pump malfunction from such a procedure, notify the pump company.
The Patient Who Can Benefit From Inpatient Education
A 70‐year‐old female with T1DM was admitted for heart failure. The patient had been using CSII for 20 years. Her latest HbA1c was 6.9%. She had 1 hypoglycemic event every 1 to 2 weeks. In the hospital, she experienced 2 hypoglycemic events within 3 days, both around bedtime. It was discovered that the patient was giving a bolus of insulin for elevated glucose levels based on the hospital POCT, and when the meal arrived (3060 minutes later), she again delivered a bolus based on her own glucometer reading plus insulin based on the carbohydrates in her meal. The patient was then instructed to request the POCT when her meal tray arrived, and she was taught how to use the pump's built‐in calculator. Glucose excursions improved.
Key points:
- Patients on CSII, though able to exercise autonomy in managing their insulin doses, may also need assistance in dosing insulin properly.
- Although pump education is ideally done on an outpatient basis, hospital‐based providers may encounter patients who need reinforcement of their training while hospitalized. Hospital personnel trained on insulin pumps (such as physicians, nurse practitioners, physician assistants, and certified diabetes educators) can help augment the patient's knowledge while in the hospital. In the absence of such key personnel, patient safety has to be addressed with re‐evaluation of the need to discontinue the pump and switch to multiple doses of subcutaneous insulin.
STEPS IN TAKING CARE OF PATIENTS ON CONTINUOUS SUBCUTANEOUS INSULIN INFUSION
Initial Patient Assessment
On admission, patients are asked whether they use an insulin pump. This is included in the nursing assessment form. If they do, the physician is notified.
The insulin pump might be missed unless specifically asked for because (1) the insulin pump may be thought of more as a device rather than a medication, and (2) the insulin pump may be worn in less obvious areas, not only on the abdomen where providers are more apt to detect it.
Hospital Policy and Insulin Orders
Written hospital policies on how to safely manage patients presenting with an insulin pump will delineate patients who can safely be allowed to continue on the pump, and the responsibilities that come along with this. Our institution has such a policy. Experts from both the legal and biomedical engineering departments were consulted when the policy was crafted. Patients must be fully alert, able, and willing to self‐manage the pump. General contraindications to pump use in the hospital, such as altered mental status or DKA, are listed in Table 1. In addition, patients in the intensive care units are best managed on an IV insulin infusion during their critical illness, in keeping with several society guidelines.[14] Controlling severe hyperglycemia and DKA with multiple boluses through the insulin pump can potentially lead to stacking of insulin with subsequent hypoglycemia.
| Altered state of consciousness |
| Suicidal ideation |
| Prolonged instability of blood glucose levels |
| Diabetic ketoacidosis |
| Patient/family inability or refusal to participate in own care |
| Insulin‐pump malfunction |
| Lack of appropriate supplies for the insulin pump |
| Other circumstances as identified by the physician, resident, or licensed independent practitioner |
In our institution, a computerized insulin pump order set has to be activated. Apart from insulin, POCT, and hypoglycemia‐management orders, this order set contains documents aimed at balancing patient autonomy with delivery of appropriate and safe medical care that the bedside nurse goes over with the patient (Table 2). By policy at our institution, insulin should be dispensed from the hospital's pharmacy (except for that already in the pump), so the order set is linked to the pharmacy and a 3‐mL insulin vial is delivered to the hospital floor and stored in the patient‐specific medication bin. The order set triggers an Endocrinology consult so that the patient can be assessed by key trained personnel.
|
| CSII pump therapy patient agreement |
| Delineates the conditions for continuing on CSII and those for whom it may be discontinued |
| Terms of use and release of liability for patient‐owned equipment |
| Delineates the patient's responsibility for the pump and supplies |
| Patient‐maintained flow sheet for inpatient CSII |
| Includes blood glucose levels (obtained by nurse or patient‐care assistant with the hospital glucose meter) |
| Includes insulin doses (basal, bolus) |
| Includes carbohydrate intake in grams |
Patient Diagnosis
It is important to try to distinguish T1DM vs T2DM, as patients with T1DM are prone to ketoacidosis when the pump is disconnected.
Patient Assessment by the Endocrinology Consult Service
Hospitalized patients on the pump have varying degrees of pump knowledge and skill sets. We have encountered highly trained patients who meticulously count their carbohydrates and double‐check the insulin doses calculated by the built‐in pump calculator, and those who have knowledge gaps because their physicians, and not they themselves, change pump settings at the clinic visits.
Therefore, the Endocrinology consult team members (comprising physicians, nurse practitioners, and certified diabetes educators) go through the following items to be able to order the insulin correctly, assess whether patients are still able and willing to continue on their pump despite their illness, formulate alternative insulin regimens as needed, or help empower patients who may have forgotten some aspects of pump management:
- Insulin pump manufacturer/model.
- Insulin used in the pump.
- Often fast‐acting insulin (lispro, aspart, or glulisine).
- Some patients use regular insulin.
- A few patients use U500 insulin (5 more potent than other insulins).
- Insulin doses/pump settings.
Patients are assessed for:
- Hypoglycemia awareness.
- Previous glucose control.
- Bolus calculation (either using the built‐in calculator, computing this mentally, or using a different calculator).
- Ability to deliver a bolus (including vision and dexterity challenges).
- Ability to change the basal rate, or set a temporary rate, and suspend insulin delivery.
Discussion on Options for Inpatient Management
After assessment, education is provided as needed. If there are concerns on the part of the patient, the primary team, or the Endocrinology team about safe continuation of CSII during the hospitalization, then alternative insulin regimens are discussed. Patients who cannot access their basal rates and cannot adjust the doses are not able to self‐manage; they should be taken off the pump and treated with multiple subcutaneous insulin doses. Conversion to MDII is discussed under Interruption of Continuous Subcutaneous Insulin Infusion for Short and Prolonged Periods.
Provision of Pump Information for Hospital Healthcare Providers
Users of CSII, even if perfectly competent using their pumps in the ambulatory setting, may need assistance in the hospital for various reasons. They may not know what to do for surgical or radiologic procedures (discussed below) and may not be familiar with hospital policies involving CSII. Hospital providers trained on insulin pumps may need a refresher on locating a particular pump setting.
The provider can call the toll‐free number on the back of the pump for assistance (Table 3). Insulin‐pump companies also have menu maps to aid in finding information on pump settings (samples shown in Figures 1 and 2).[12, 13] Documentation of the patient's pump settings will assist in CSII dose changes during the acute illness or assist in switching to MDII if needed. The following information need to be collected:
| Animas Corporation | 877‐937‐7867 |
| Insulet Corporation | 800‐591‐3455 |
| Medtronic | 800‐826‐2099 |
| Roche Diagnostics | 800‐688‐4578 |
Basal Rate
This is the hourly insulin rate delivered for the patient's insulin needs even when not eating. The patient might have one or multiple basal rates in a day, or a different pattern on some days. Because the patient's activity in the hospital will be different from the usual ambulatory activity, we recommend that patients choose only 1 pattern.
Bolus
This is the insulin to cover meals or to correct for hyperglycemia, or both. The patient has to activate buttons for delivery. The patient may or may not be using the built‐in pump calculator.
Carbohydrate Ratio
This is the amount of insulin per quantity of carbohydrate consumed. When patients are initially placed on the insulin pump, they are given a carbohydrate ratio that is derived from a calculation called the rule of 500. In the rule of 500, the number 500 is divided by the patient's total daily insulin dose while on multiple subcutaneous insulin shots. For example, if the patient was on insulin glargine 13 units daily and insulin lispro 4 units 3 daily with meals, 500 divided by 25 gives us a carbohydrate ratio of 20 grams of carbohydrate for 1 unit of insulin (or conversely called insulin‐to‐carbohydrate ratio of 1 unit of insulin for every 20 grams of carbohydrate).
This often comes out to 1 unit for every 1530 grams of carbohydrates in patients with T1DM, and 1 unit for every 515 grams of carbohydrate in patients with T2DM, reflecting the need for a higher insulin dose in the latter.
It is best to ask the patient how many units he or she usually takes for a meal, or to present the patient with an example of a meal and ask how much he or she would take. We have encountered a patient whose carbohydrate ratio was 1, but upon further inquiry, the patient demonstrated that he actually bolused 1 unit for every 1 serving (or 1 unit for every 15 grams) of carbohydrate.
Sensitivity Factor
This is the amount of insulin that would bring the blood glucose to goal. For example, if the patient requires 1 unit of insulin to bring down the blood glucose from 170 mg/dL to 120 mg/dL, then the sensitivity factor of 50 would be seen on the pump screen. Similar to the carbohydrate ratio, a sensitivity factor is calculated when patients are initially placed on the insulin pump. This time, the rule of 1800 is used, where the number 1800 is divided by the patient's total daily insulin dose. In patients with T1DM, this often comes to 30100 mg/dL per 1 unit of insulin; or, conversely, 1 unit for every 30100 mg/dL glucose. For patients with T2DM, this is often 1 unit for every 1025 mg/dL glucose.
This insulin dose is given in addition to the dose resulting from the carbohydrate ratio, or alone if the patient is not eating.
Target
This is the blood glucose goal for the patient, which might be too tight in the presence of acute illness, and therefore would have to be modified. The American Diabetes Association, Endocrine Society, and American Association of Clinical Endocrinologists recommend premeal glucose targets of <140 mg/dL in hospitalized noncritically ill patients on insulin, with re‐evaluation of the insulin dose when premeal glucose levels fall below 100 mg/dL and dose adjustment if they are <70mg/dLunless there is an obvious explanation, such as a missed meal.[14, 15]
Point‐of‐Care Testing for Glucose Monitoring
Our policy specifies that the hospital glucose meter is the meter of record upon which dose adjustments are based. Point‐of‐care testing is performed by our patient care nursing assistants or bedside nurses. The timing is typically before meals, at bedtime, between 2 and 3 AM, and with allowance for other times that patients are used to checking when they were at home, such as after meals. Frequent POCT has to be especially borne in mind for patients with hypoglycemia unawareness. Some patients are used to checking with their own home glucose meters in between these times, and we do work with them with the understanding that dose‐change decisions are based on the hospital glucose meter readings.
Dose Adjustments
Continuous subcutaneous insulin infusion dose adjustments for hypoglycemia and hyperglycemia are usually done in 10% to 20% decrements/emncrements. Our Endocrinology team discusses these with the patients and ensures that the new settings are entered into the pump and into the order set.
INTERRUPTION OF CONTINUOUS SUBCUTANEOUS INSULIN INFUSION FOR SHORT AND PROLONGED PERIODS
Patients with T1DM should not be left without basal insulin. However, pump interruption for 30 minutes to an hour often does not lead to problems. Beyond an hour and certainly closer to 2 to 3 hours off the pump, the patient should be given a subcutaneous insulin injection if the patient is left without easy access to the insulin pump.
The subcutaneous insulin dose for temporary pump suspension can be roughly calculated as hourly basal rate multiplier, where the multiplier is the number of hours that the patient is expected to be disconnected from the pump (for example, hourly basal rate of 0.85 unit/hour 3 hours = 2.55 units, which can be rounded off to 2 or 3 units depending on the patient's general glucose control).
When it has been determined that the patient should come off the pump for substantial periods of time, then subcutaneous insulin injections should be given. This is imperative for the prevention of DKA in patients with T1DM, and highly recommended for maintenance of good glycemic control for patients with T2DM.
Basal Dose
In most cases, these situations stretch for greater than 24 hours, such as surgery and the anticipated recovery from anesthesia. We favor long‐acting insulin for basal needs, given 2 hours before discontinuing the pump. The total basal insulin dose per day can be given as the starting long‐acting insulin dose and then adjusted as needed. The total daily basal insulin dose can be retrieved from the insulin pump. In one study on T1DM patients using insulin lispro on the pump, total daily basal dose was given as insulin glargine without adverse effects.[16] If there is concern for hypoglycemia, then the dose can be reduced by 10% to 20%. Care should be made to ascertain that the basal insulin delivered via the pump is appropriate.
There are several ways to estimate this:
- If the daily total basal and the total prandial insulin requirements approximate a 50:50 ratio, then the basal rate via the pump is appropriate.
- If the daily total basal rate via the pump is similar to a weight‐based estimate of the basal dose (often 0.150.2 units/kg/day in patients with T1DM, 0.20.3 units/kg/day for T2DM, and higher in both cases with longer duration of DM or greater insulin resistance), then the basal rate via the pump is appropriate.
Bolus Dose
Patients can still continue to calculate their sensitivity factor and carbohydrate ratio and request for the equivalent dose of insulin. In the ideal situation, bedside nurses would be taught how to calculate this ratio and dose rapid‐acting insulin accordingly should the patient need to come off the insulin pump. Because of the logistic difficulties of making this uniform in our institution, we have worked instead on providing patients with information on the carbohydrate content of their meal tray. If the pump is discontinued, the patient would continue to calculate their prandial insulin based on their carbohydrates ratio and indicate to the nurse how much he/she would need. Our subcutaneous insulin orders for MDII allow for us to put a range of insulin doses based on the patient's typical insulin needs for mealtime.
Pump Removal for Certain Hospital Procedures
Patients may not remember that the pump has to be removed before entering high‐radiation areas. The pump owner manuals tell patients not to use the pump when going for magnetic resonance imaging, CT scans, or x‐rays, or near equipment with high electromagnetic fields.
Interrogation of the Pump
If there is concern about pump malfunction, patients should be switched to MDII. The pump company can be contacted for pump interrogation and provision of a temporary pump (Table 3).
Pump Disconnection
In our institution, the Radiology department has signage instructing patients to inform the technician if they are wearing an insulin pump. The pump is handed off to a family member or stored until the procedure is over. Another option is to leave it with the bedside nurse or the floor nurse manager for safekeeping. This is less ideal, because the wait for the radiologic procedure might take longer than expected and the patient is left without any insulin on board.
Interruption of Continuous Subcutaneous Insulin Infusion for Surgical Procedures
In our institution, the anesthesiology department has worked with the Endocrinology, Surgery and Medicine departments regarding patients with insulin pumps. Discontinuation of CSII is recommended for surgical procedures longer than 1 hour; patients are asked to continue on the insulin pump until they are taken to the preoperative suite, at which point they are placed on IV insulin infusion. Ideally, there should be an overlap of 1530 minutes. Providing an alternative continuous source of insulin during pump interruption is important, especially for patients with T1DM.[17]
Pump Resumption
Once the patient is ready to resume the pump, any subcutaneous insulin that was delivered and might still be active has to be accounted for and subtracted from the basal pump dose so that hypoglycemia is avoided. An alternative would be to wait until the last basal subcutaneous insulin dose is expected to be cleared before restarting CSII.
SUMMARY
As patients on an insulin pump are increasingly seen in the hospital, inpatient providers have to be able to adapt to these patients' needs. Inpatient providers need to have a working knowledge of the insulin pump. Alternative methods of insulin delivery will have to be discussed with the patient to assure continued safety in the hospital.
Disclosures
Dr. Lansang has served as a Sanofi Advisory Board member.
- http://www.rncos.com/Press_Releases/US‐to‐Dominate‐the‐Global‐Insulin‐Pump‐Market.htm. Accessed on October 25, 2013.
- , , , , , ;T1D Exchange Clinic Network. The T1D exchange clinic registry. J Clin Endocrinol Metab. 2012;97(12):4383–4389.
- , , , et al. Resource utilization with insulin pump therapy for type 2 diabetes mellitus. Am J Manag Care. 2010;16(12):892–896.
- , , , , . Diabetes‐related hospitalization and hospital‐related utilization. In: Diabetes in America. 2nd ed. Bethesda, MD: National Diabetes Data Group, National Institute of Diabetes and Digestive and Kidney Diseases; 1995:553–569. Available at: http://diabetes.niddk.nih.gov/dm/pubs/america/pdf/chapter27.pdf. Accessed February 21, 2013.
- , , , , , . Hyperglycemia: an independent marker of in‐hospital mortality in patients with undiagnosed diabetes. J Clin Endocrinol Metab. 2002;87(3):978–982.
- American Diabetes Association. Standards of medical care in diabetes—2012. Diabetes Care. 2012;35(suppl 1):S11–S63.
- , , , et al;AACE Insulin Pump Management Task Force. Statement by the American Association of Clinical Endocrinologists Consensus Panel on insulin pump management. Endocr Pract. 2010;16(5):746–762.
- , , , et al;American Diabetes Association Diabetes in Hospitals Writing Committee. Management of diabetes and hyperglycemia in hospitals [published correction appears in Diabetes Care. 2004;27(5):1255]. Diabetes Care. 2004;27(2):553–591.
- , , , et al. Randomized study of basal‐bolus insulin therapy in the inpatient management of patients with type 2 diabetes (RABBIT 2 trial). Diabetes Care. 2007;30(9):2181–2186.
- , , , et al. Randomized study of basal‐bolus insulin therapy in the inpatient management of patients with type 2 diabetes undergoing general surgery (RABBIT 2 surgery). Diabetes Care. 2011;34(2):256–261.
- , , , , , . Transitioning insulin pump therapy from the outpatient to the inpatient setting: a review of 6 years' experience with 253 cases. J Diabetes Sci Technol. 2012;6(5):995–1002.
- Medtronic Paradigm Revel insulin pump [menu map]. Northridge, CA: Medtronic. Available at: http://www.medtronicdiabetes.com/sites/default/files/library/download‐library/workbooks/x23_menu_map.pdf. Updated January 22, 2010. Accessed February 2013.
- OneTouch Ping insulin pump [menu map]. West Chester, PA: Animas Corporation.
- , , , et al. American Association of Clinical Endocrinologists and American Diabetes Association consensus statement on inpatient glycemic control. Endocr Pract. 2009;15(4):353–369.
- , , , et al. Management of hyperglycemia in hospitalized patients in non‐critical care setting: an Endocrine Society clinical practice guideline. J Clin Endocrinol Metab. 2012;97(1):16–38.
- , , , . Switch to multiple daily injections with insulin glargine and insulin lispro from continuous subcutaneous insulin infusion with insulin lispro: a randomized, open‐label study using a continuous glucose monitoring system. Endocr Pract. 2005;11(3):157–164.
- , , , , . Perioperative glycemic management in insulin pump patients undergoing noncardiac surgery. Curr Pharm Des. 2012;18(38):6204–6214.
Delivery of insulin via continuous subcutaneous insulin infusion (CSII), or insulin pump, has gained wide acceptance. It is estimated that 400,000 patients with type 1 diabetes mellitus (T1DM) are using insulin pumps.[1] A registry for T1DM in the United States indicated that 50% of the 25,833 participants were using an insulin pump.[2] Use of CSII in type 2 DM (T2DM) is also increasing.[3]
Patients with DM are 3 as likely to be hospitalized than patients without DM.[4] Twenty percent to 30% of adult hospitalized patients have a known diagnosis of DM.[5] It is therefore to be expected that patients on CSII will be seen with increased frequency in the hospital setting. This leads to potential difficultiesinpatient healthcare providers may not be familiar with insulin pumps, and patients may not be aware of complexities associated with pump usage in the hospital.
This article will review CSII usage in the hospital, offering strategies for management in partnership with the patient based on our experiences and processes developed in our institution.
SHOULD CONTINUOUS SUBCUTANEOUS INSULIN INFUSION BE CONTINUED IN THE HOSPITAL?
The American Diabetes Association advocates (1) allowing patients who are physically and mentally able to continue CSII when hospitalized, (2) having a hospital policy for CSII use, and (3) having hospital personnel with expertise on pump management.[6] The American Association of Clinical Endocrinologists echoes much of the same and suggests contacting the specialist responsible for the pump in the ambulatory setting for decisions on adjustments in the hospitalized patient,[7] which at times may not be feasible.
The logic and benefits of basal‐bolus insulin dosing (ie, giving basal insulin to account for fasting requirements, plus bolus insulin to cover nutritional and correctional needs) have been well‐described.[8, 9, 10] In randomized clinical trials on patients admitted to general medical and surgical floors, basal‐bolus insulin (long‐acting basal insulin plus mealtime fast‐acting insulin injections) resulted in better glycemic control and reduced infection rates compared with sliding‐scale therapy (waiting for high blood glucoses before giving insulin, instead of giving it proactively to prevent hyperglycemia).[9, 10] At present, insulin delivery via the insulin pump is the best commercially available method to deliver insulin in a basal‐bolus manner in ambulatory patients. It thus makes sense to continue CSII in the hospital if patients are able to manage their pumps, though there are no randomized trials answering this question as of yet.
Studies on insulin pumps in the hospital are sparse. In one group's latest retrospective study of 136 patients over a 6‐year period, CSII was continued during the entire hospital stay in 65% of the hospitalizations, was used intermittently in 20%, and was discontinued with alternative insulin regimens given in 15%.[11] Mean glucose was 178 47 mg/dL (mean standard deviation), with no significant difference between groups. There were fewer episodes of severe hyperglycemia among those who continued on the pump compared with the other groups, and fewer episodes of hypoglycemia in those who continued on vs those taken off the pump. There was 1 episode of an infusion catheter kinking, resulting in nonfatal hyperglycemia, but no reported pump‐site infections, mechanical pump failure, or diabetic ketoacidosis (DKA) among patients remaining on CSII.
CLINICAL VIGNETTES
The following cases illustrate potential challenges with CSII use that we have encountered in the hospital.
The Patient Needing Transition to Multiple Daily Insulin Injections
A 29‐year‐old male with T1DM, on CSII, was admitted for fever and chills. His latest glycated hemoglobin (HbA1c) level was 6.8%. His glucose levels started rising, and he wished to be taken off the insulin pump. He was started by the primary team on multiple daily insulin injections (MDII) with insulin glargine and insulin lispro. His glucose levels continued to rise, so an intravenous (IV) insulin infusion was started. Endocrinology was then consulted. The patient's condition was concerning for the potential development of DKA, so he was kept on IV insulin. When he was ready for transitioning to subcutaneous insulin, the pump had been taken home by a family member, and the patient could not recall his CSII basal rates but knew his total basal insulin dose, carbohydrate ratio, and sensitivity factor. Endocrinology assisted in transitioning him from the insulin infusion to MDII based on these recalled doses. When the insulin pump was available, the pump settings were interrogated, and he was transitioned back to it.
Key points:
- Having key hospital personnel trained on CSII, including interrogating the pump's settings, facilitates the transitioning of these patients from one hospital unit, or level of care, to another.
- Accessing the pump's settings involves pushing several buttons on the insulin pump. Because key hospital personnel will encounter patients on different insulin pumps, it may be helpful to keep menu maps handy as a quick reference. A menu map will show at a glance where certain information can be found, such as the basal insulin rate or the sensitivity factor (see examples in Figures 1 and 2).[12, 13]
- Knowing the HbA1c will help determine if pump use has been effective.
The Patient With Technical Problems
An 84‐year‐old gentleman with T2DM was admitted for heart failure and aortic valve replacement. His HbA1c was 6.2%, and he had had several outpatient hypoglycemic events. While on CSII in the hospital, his point of care testing (POCT) glucose readings ranged from 105 to 260 mg/dL. On the afternoon of the third hospital day, POCT readings stayed above 220 mg/dL and rose to 348 mg/dL on the fourth hospital morning, despite multiple blousing and changing the insulin, insertion site, reservoir cartridge, and pump tubing. There was no evidence of infection and no medication change that would have impacted glucose levels. Review of his procedures revealed that he had undergone computed tomography (CT) on the morning of hospital day 3 and wore his pump while being scanned. The pump company was notified.
Key points:
- Patients, and medical and nursing staff, should be reminded to remove insulin pumps for CT scans, magnetic resonance imaging, x‐rays, or other tests with high electromagnetic fields.
- If there is a suspicion of pump malfunction from such a procedure, notify the pump company.
The Patient Who Can Benefit From Inpatient Education
A 70‐year‐old female with T1DM was admitted for heart failure. The patient had been using CSII for 20 years. Her latest HbA1c was 6.9%. She had 1 hypoglycemic event every 1 to 2 weeks. In the hospital, she experienced 2 hypoglycemic events within 3 days, both around bedtime. It was discovered that the patient was giving a bolus of insulin for elevated glucose levels based on the hospital POCT, and when the meal arrived (3060 minutes later), she again delivered a bolus based on her own glucometer reading plus insulin based on the carbohydrates in her meal. The patient was then instructed to request the POCT when her meal tray arrived, and she was taught how to use the pump's built‐in calculator. Glucose excursions improved.
Key points:
- Patients on CSII, though able to exercise autonomy in managing their insulin doses, may also need assistance in dosing insulin properly.
- Although pump education is ideally done on an outpatient basis, hospital‐based providers may encounter patients who need reinforcement of their training while hospitalized. Hospital personnel trained on insulin pumps (such as physicians, nurse practitioners, physician assistants, and certified diabetes educators) can help augment the patient's knowledge while in the hospital. In the absence of such key personnel, patient safety has to be addressed with re‐evaluation of the need to discontinue the pump and switch to multiple doses of subcutaneous insulin.
STEPS IN TAKING CARE OF PATIENTS ON CONTINUOUS SUBCUTANEOUS INSULIN INFUSION
Initial Patient Assessment
On admission, patients are asked whether they use an insulin pump. This is included in the nursing assessment form. If they do, the physician is notified.
The insulin pump might be missed unless specifically asked for because (1) the insulin pump may be thought of more as a device rather than a medication, and (2) the insulin pump may be worn in less obvious areas, not only on the abdomen where providers are more apt to detect it.
Hospital Policy and Insulin Orders
Written hospital policies on how to safely manage patients presenting with an insulin pump will delineate patients who can safely be allowed to continue on the pump, and the responsibilities that come along with this. Our institution has such a policy. Experts from both the legal and biomedical engineering departments were consulted when the policy was crafted. Patients must be fully alert, able, and willing to self‐manage the pump. General contraindications to pump use in the hospital, such as altered mental status or DKA, are listed in Table 1. In addition, patients in the intensive care units are best managed on an IV insulin infusion during their critical illness, in keeping with several society guidelines.[14] Controlling severe hyperglycemia and DKA with multiple boluses through the insulin pump can potentially lead to stacking of insulin with subsequent hypoglycemia.
| Altered state of consciousness |
| Suicidal ideation |
| Prolonged instability of blood glucose levels |
| Diabetic ketoacidosis |
| Patient/family inability or refusal to participate in own care |
| Insulin‐pump malfunction |
| Lack of appropriate supplies for the insulin pump |
| Other circumstances as identified by the physician, resident, or licensed independent practitioner |
In our institution, a computerized insulin pump order set has to be activated. Apart from insulin, POCT, and hypoglycemia‐management orders, this order set contains documents aimed at balancing patient autonomy with delivery of appropriate and safe medical care that the bedside nurse goes over with the patient (Table 2). By policy at our institution, insulin should be dispensed from the hospital's pharmacy (except for that already in the pump), so the order set is linked to the pharmacy and a 3‐mL insulin vial is delivered to the hospital floor and stored in the patient‐specific medication bin. The order set triggers an Endocrinology consult so that the patient can be assessed by key trained personnel.
|
| CSII pump therapy patient agreement |
| Delineates the conditions for continuing on CSII and those for whom it may be discontinued |
| Terms of use and release of liability for patient‐owned equipment |
| Delineates the patient's responsibility for the pump and supplies |
| Patient‐maintained flow sheet for inpatient CSII |
| Includes blood glucose levels (obtained by nurse or patient‐care assistant with the hospital glucose meter) |
| Includes insulin doses (basal, bolus) |
| Includes carbohydrate intake in grams |
Patient Diagnosis
It is important to try to distinguish T1DM vs T2DM, as patients with T1DM are prone to ketoacidosis when the pump is disconnected.
Patient Assessment by the Endocrinology Consult Service
Hospitalized patients on the pump have varying degrees of pump knowledge and skill sets. We have encountered highly trained patients who meticulously count their carbohydrates and double‐check the insulin doses calculated by the built‐in pump calculator, and those who have knowledge gaps because their physicians, and not they themselves, change pump settings at the clinic visits.
Therefore, the Endocrinology consult team members (comprising physicians, nurse practitioners, and certified diabetes educators) go through the following items to be able to order the insulin correctly, assess whether patients are still able and willing to continue on their pump despite their illness, formulate alternative insulin regimens as needed, or help empower patients who may have forgotten some aspects of pump management:
- Insulin pump manufacturer/model.
- Insulin used in the pump.
- Often fast‐acting insulin (lispro, aspart, or glulisine).
- Some patients use regular insulin.
- A few patients use U500 insulin (5 more potent than other insulins).
- Insulin doses/pump settings.
Patients are assessed for:
- Hypoglycemia awareness.
- Previous glucose control.
- Bolus calculation (either using the built‐in calculator, computing this mentally, or using a different calculator).
- Ability to deliver a bolus (including vision and dexterity challenges).
- Ability to change the basal rate, or set a temporary rate, and suspend insulin delivery.
Discussion on Options for Inpatient Management
After assessment, education is provided as needed. If there are concerns on the part of the patient, the primary team, or the Endocrinology team about safe continuation of CSII during the hospitalization, then alternative insulin regimens are discussed. Patients who cannot access their basal rates and cannot adjust the doses are not able to self‐manage; they should be taken off the pump and treated with multiple subcutaneous insulin doses. Conversion to MDII is discussed under Interruption of Continuous Subcutaneous Insulin Infusion for Short and Prolonged Periods.
Provision of Pump Information for Hospital Healthcare Providers
Users of CSII, even if perfectly competent using their pumps in the ambulatory setting, may need assistance in the hospital for various reasons. They may not know what to do for surgical or radiologic procedures (discussed below) and may not be familiar with hospital policies involving CSII. Hospital providers trained on insulin pumps may need a refresher on locating a particular pump setting.
The provider can call the toll‐free number on the back of the pump for assistance (Table 3). Insulin‐pump companies also have menu maps to aid in finding information on pump settings (samples shown in Figures 1 and 2).[12, 13] Documentation of the patient's pump settings will assist in CSII dose changes during the acute illness or assist in switching to MDII if needed. The following information need to be collected:
| Animas Corporation | 877‐937‐7867 |
| Insulet Corporation | 800‐591‐3455 |
| Medtronic | 800‐826‐2099 |
| Roche Diagnostics | 800‐688‐4578 |
Basal Rate
This is the hourly insulin rate delivered for the patient's insulin needs even when not eating. The patient might have one or multiple basal rates in a day, or a different pattern on some days. Because the patient's activity in the hospital will be different from the usual ambulatory activity, we recommend that patients choose only 1 pattern.
Bolus
This is the insulin to cover meals or to correct for hyperglycemia, or both. The patient has to activate buttons for delivery. The patient may or may not be using the built‐in pump calculator.
Carbohydrate Ratio
This is the amount of insulin per quantity of carbohydrate consumed. When patients are initially placed on the insulin pump, they are given a carbohydrate ratio that is derived from a calculation called the rule of 500. In the rule of 500, the number 500 is divided by the patient's total daily insulin dose while on multiple subcutaneous insulin shots. For example, if the patient was on insulin glargine 13 units daily and insulin lispro 4 units 3 daily with meals, 500 divided by 25 gives us a carbohydrate ratio of 20 grams of carbohydrate for 1 unit of insulin (or conversely called insulin‐to‐carbohydrate ratio of 1 unit of insulin for every 20 grams of carbohydrate).
This often comes out to 1 unit for every 1530 grams of carbohydrates in patients with T1DM, and 1 unit for every 515 grams of carbohydrate in patients with T2DM, reflecting the need for a higher insulin dose in the latter.
It is best to ask the patient how many units he or she usually takes for a meal, or to present the patient with an example of a meal and ask how much he or she would take. We have encountered a patient whose carbohydrate ratio was 1, but upon further inquiry, the patient demonstrated that he actually bolused 1 unit for every 1 serving (or 1 unit for every 15 grams) of carbohydrate.
Sensitivity Factor
This is the amount of insulin that would bring the blood glucose to goal. For example, if the patient requires 1 unit of insulin to bring down the blood glucose from 170 mg/dL to 120 mg/dL, then the sensitivity factor of 50 would be seen on the pump screen. Similar to the carbohydrate ratio, a sensitivity factor is calculated when patients are initially placed on the insulin pump. This time, the rule of 1800 is used, where the number 1800 is divided by the patient's total daily insulin dose. In patients with T1DM, this often comes to 30100 mg/dL per 1 unit of insulin; or, conversely, 1 unit for every 30100 mg/dL glucose. For patients with T2DM, this is often 1 unit for every 1025 mg/dL glucose.
This insulin dose is given in addition to the dose resulting from the carbohydrate ratio, or alone if the patient is not eating.
Target
This is the blood glucose goal for the patient, which might be too tight in the presence of acute illness, and therefore would have to be modified. The American Diabetes Association, Endocrine Society, and American Association of Clinical Endocrinologists recommend premeal glucose targets of <140 mg/dL in hospitalized noncritically ill patients on insulin, with re‐evaluation of the insulin dose when premeal glucose levels fall below 100 mg/dL and dose adjustment if they are <70mg/dLunless there is an obvious explanation, such as a missed meal.[14, 15]
Point‐of‐Care Testing for Glucose Monitoring
Our policy specifies that the hospital glucose meter is the meter of record upon which dose adjustments are based. Point‐of‐care testing is performed by our patient care nursing assistants or bedside nurses. The timing is typically before meals, at bedtime, between 2 and 3 AM, and with allowance for other times that patients are used to checking when they were at home, such as after meals. Frequent POCT has to be especially borne in mind for patients with hypoglycemia unawareness. Some patients are used to checking with their own home glucose meters in between these times, and we do work with them with the understanding that dose‐change decisions are based on the hospital glucose meter readings.
Dose Adjustments
Continuous subcutaneous insulin infusion dose adjustments for hypoglycemia and hyperglycemia are usually done in 10% to 20% decrements/emncrements. Our Endocrinology team discusses these with the patients and ensures that the new settings are entered into the pump and into the order set.
INTERRUPTION OF CONTINUOUS SUBCUTANEOUS INSULIN INFUSION FOR SHORT AND PROLONGED PERIODS
Patients with T1DM should not be left without basal insulin. However, pump interruption for 30 minutes to an hour often does not lead to problems. Beyond an hour and certainly closer to 2 to 3 hours off the pump, the patient should be given a subcutaneous insulin injection if the patient is left without easy access to the insulin pump.
The subcutaneous insulin dose for temporary pump suspension can be roughly calculated as hourly basal rate multiplier, where the multiplier is the number of hours that the patient is expected to be disconnected from the pump (for example, hourly basal rate of 0.85 unit/hour 3 hours = 2.55 units, which can be rounded off to 2 or 3 units depending on the patient's general glucose control).
When it has been determined that the patient should come off the pump for substantial periods of time, then subcutaneous insulin injections should be given. This is imperative for the prevention of DKA in patients with T1DM, and highly recommended for maintenance of good glycemic control for patients with T2DM.
Basal Dose
In most cases, these situations stretch for greater than 24 hours, such as surgery and the anticipated recovery from anesthesia. We favor long‐acting insulin for basal needs, given 2 hours before discontinuing the pump. The total basal insulin dose per day can be given as the starting long‐acting insulin dose and then adjusted as needed. The total daily basal insulin dose can be retrieved from the insulin pump. In one study on T1DM patients using insulin lispro on the pump, total daily basal dose was given as insulin glargine without adverse effects.[16] If there is concern for hypoglycemia, then the dose can be reduced by 10% to 20%. Care should be made to ascertain that the basal insulin delivered via the pump is appropriate.
There are several ways to estimate this:
- If the daily total basal and the total prandial insulin requirements approximate a 50:50 ratio, then the basal rate via the pump is appropriate.
- If the daily total basal rate via the pump is similar to a weight‐based estimate of the basal dose (often 0.150.2 units/kg/day in patients with T1DM, 0.20.3 units/kg/day for T2DM, and higher in both cases with longer duration of DM or greater insulin resistance), then the basal rate via the pump is appropriate.
Bolus Dose
Patients can still continue to calculate their sensitivity factor and carbohydrate ratio and request for the equivalent dose of insulin. In the ideal situation, bedside nurses would be taught how to calculate this ratio and dose rapid‐acting insulin accordingly should the patient need to come off the insulin pump. Because of the logistic difficulties of making this uniform in our institution, we have worked instead on providing patients with information on the carbohydrate content of their meal tray. If the pump is discontinued, the patient would continue to calculate their prandial insulin based on their carbohydrates ratio and indicate to the nurse how much he/she would need. Our subcutaneous insulin orders for MDII allow for us to put a range of insulin doses based on the patient's typical insulin needs for mealtime.
Pump Removal for Certain Hospital Procedures
Patients may not remember that the pump has to be removed before entering high‐radiation areas. The pump owner manuals tell patients not to use the pump when going for magnetic resonance imaging, CT scans, or x‐rays, or near equipment with high electromagnetic fields.
Interrogation of the Pump
If there is concern about pump malfunction, patients should be switched to MDII. The pump company can be contacted for pump interrogation and provision of a temporary pump (Table 3).
Pump Disconnection
In our institution, the Radiology department has signage instructing patients to inform the technician if they are wearing an insulin pump. The pump is handed off to a family member or stored until the procedure is over. Another option is to leave it with the bedside nurse or the floor nurse manager for safekeeping. This is less ideal, because the wait for the radiologic procedure might take longer than expected and the patient is left without any insulin on board.
Interruption of Continuous Subcutaneous Insulin Infusion for Surgical Procedures
In our institution, the anesthesiology department has worked with the Endocrinology, Surgery and Medicine departments regarding patients with insulin pumps. Discontinuation of CSII is recommended for surgical procedures longer than 1 hour; patients are asked to continue on the insulin pump until they are taken to the preoperative suite, at which point they are placed on IV insulin infusion. Ideally, there should be an overlap of 1530 minutes. Providing an alternative continuous source of insulin during pump interruption is important, especially for patients with T1DM.[17]
Pump Resumption
Once the patient is ready to resume the pump, any subcutaneous insulin that was delivered and might still be active has to be accounted for and subtracted from the basal pump dose so that hypoglycemia is avoided. An alternative would be to wait until the last basal subcutaneous insulin dose is expected to be cleared before restarting CSII.
SUMMARY
As patients on an insulin pump are increasingly seen in the hospital, inpatient providers have to be able to adapt to these patients' needs. Inpatient providers need to have a working knowledge of the insulin pump. Alternative methods of insulin delivery will have to be discussed with the patient to assure continued safety in the hospital.
Disclosures
Dr. Lansang has served as a Sanofi Advisory Board member.
- http://www.rncos.com/Press_Releases/US‐to‐Dominate‐the‐Global‐Insulin‐Pump‐Market.htm. Accessed on October 25, 2013.
- , , , , , ;T1D Exchange Clinic Network. The T1D exchange clinic registry. J Clin Endocrinol Metab. 2012;97(12):4383–4389.
- , , , et al. Resource utilization with insulin pump therapy for type 2 diabetes mellitus. Am J Manag Care. 2010;16(12):892–896.
- , , , , . Diabetes‐related hospitalization and hospital‐related utilization. In: Diabetes in America. 2nd ed. Bethesda, MD: National Diabetes Data Group, National Institute of Diabetes and Digestive and Kidney Diseases; 1995:553–569. Available at: http://diabetes.niddk.nih.gov/dm/pubs/america/pdf/chapter27.pdf. Accessed February 21, 2013.
- , , , , , . Hyperglycemia: an independent marker of in‐hospital mortality in patients with undiagnosed diabetes. J Clin Endocrinol Metab. 2002;87(3):978–982.
- American Diabetes Association. Standards of medical care in diabetes—2012. Diabetes Care. 2012;35(suppl 1):S11–S63.
- , , , et al;AACE Insulin Pump Management Task Force. Statement by the American Association of Clinical Endocrinologists Consensus Panel on insulin pump management. Endocr Pract. 2010;16(5):746–762.
- , , , et al;American Diabetes Association Diabetes in Hospitals Writing Committee. Management of diabetes and hyperglycemia in hospitals [published correction appears in Diabetes Care. 2004;27(5):1255]. Diabetes Care. 2004;27(2):553–591.
- , , , et al. Randomized study of basal‐bolus insulin therapy in the inpatient management of patients with type 2 diabetes (RABBIT 2 trial). Diabetes Care. 2007;30(9):2181–2186.
- , , , et al. Randomized study of basal‐bolus insulin therapy in the inpatient management of patients with type 2 diabetes undergoing general surgery (RABBIT 2 surgery). Diabetes Care. 2011;34(2):256–261.
- , , , , , . Transitioning insulin pump therapy from the outpatient to the inpatient setting: a review of 6 years' experience with 253 cases. J Diabetes Sci Technol. 2012;6(5):995–1002.
- Medtronic Paradigm Revel insulin pump [menu map]. Northridge, CA: Medtronic. Available at: http://www.medtronicdiabetes.com/sites/default/files/library/download‐library/workbooks/x23_menu_map.pdf. Updated January 22, 2010. Accessed February 2013.
- OneTouch Ping insulin pump [menu map]. West Chester, PA: Animas Corporation.
- , , , et al. American Association of Clinical Endocrinologists and American Diabetes Association consensus statement on inpatient glycemic control. Endocr Pract. 2009;15(4):353–369.
- , , , et al. Management of hyperglycemia in hospitalized patients in non‐critical care setting: an Endocrine Society clinical practice guideline. J Clin Endocrinol Metab. 2012;97(1):16–38.
- , , , . Switch to multiple daily injections with insulin glargine and insulin lispro from continuous subcutaneous insulin infusion with insulin lispro: a randomized, open‐label study using a continuous glucose monitoring system. Endocr Pract. 2005;11(3):157–164.
- , , , , . Perioperative glycemic management in insulin pump patients undergoing noncardiac surgery. Curr Pharm Des. 2012;18(38):6204–6214.
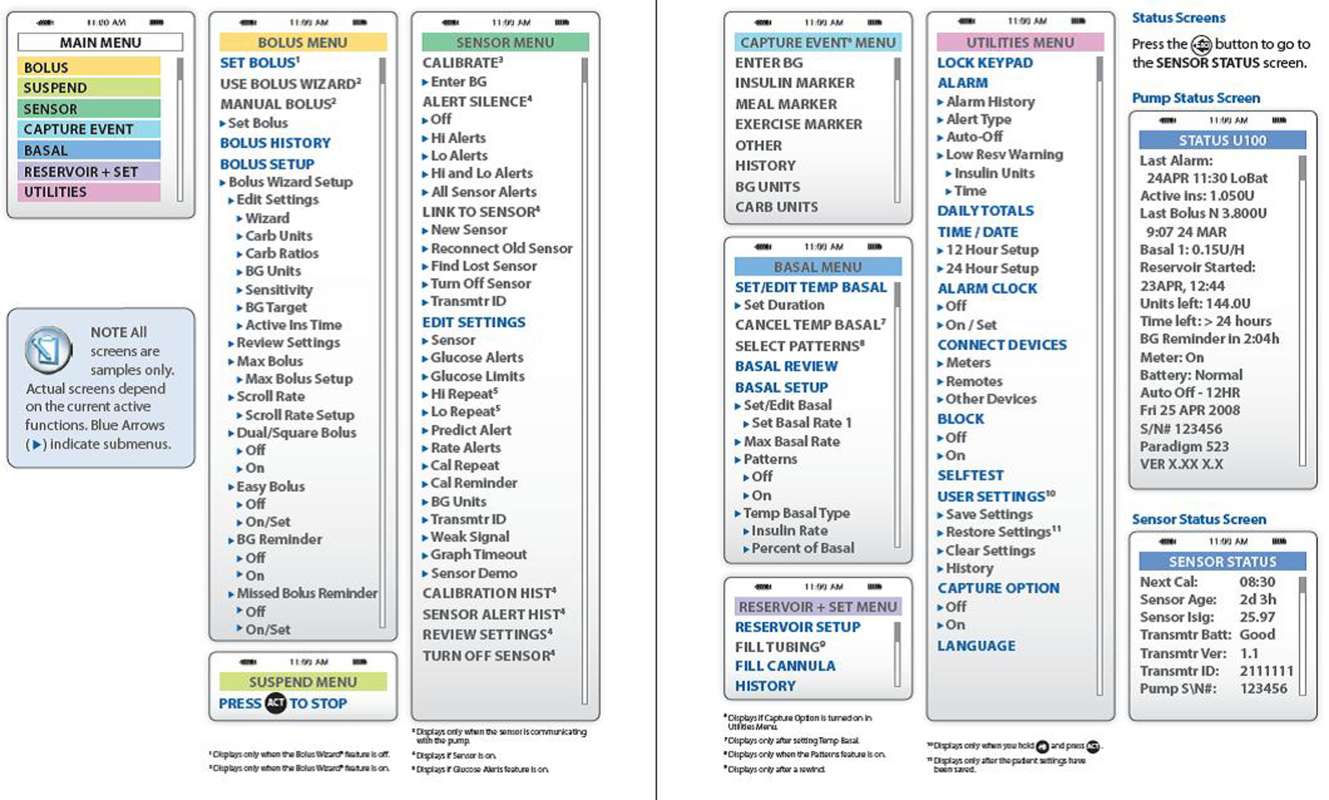
Ideal Transitions of Care
Across the country, hospitals are rolling out programs to reduce readmissions. These range from patient education around their disease process and medications, improvements in discharge planning, medication reconciliation, outpatient appointments scheduled prior to discharge, and follow‐up phone calls, among others.[1, 2] Several collaboratives such as Project Better Outcomes by Optimizing Safe Transitions[3] and Hospital Medicine Reengineering Network[4] have formed to test, study, and share lessons learned from these inpatient‐based interventions. Because financial penalties thus far have focused on decreases in inpatient reimbursement by the Centers for Medicare and Medicaid Services (CMS), most of the interventions to reduce hospital readmissions have been concentrated in the inpatient domain. It is unclear whether new payment arrangements with CMS or commercial insurers, such as bundled payments and accountable care organizations (ACOs), will pressure primary care physicians (PCPs) to further develop outpatient‐based interventions.
In this article, I provide a PCP's perspective of how inpatient and outpatient providers can partner to create the ideal care transition from hospital to home. Although others have conducted systematic reviews or surveys of interventions to reduce hospital readmissions,[2, 5, 6, 7] I will start from a vision of an ideal transition, and then evaluate evidence supporting each step. I will also highlight areas where new reimbursement codes can help support an idealized transitions‐of‐care program.
ON HOSPITAL ADMISSION
Many PCPs consider the beginning of the care continuum to rest in the primary care practice and relationship. Over time, PCPs develop relationships with their patients, understanding the patients' values toward health and healthcare, learning their social support system and home environment, and documenting a clinical course of chronic diseases, including which therapies have and have not worked well. From a PCP perspective, it seems natural to be involved in care at the point of hospital admission. Some emergency departments (EDs) and hospital admissions offices have automated systems to email or fax PCPs admission notifications. Others rely on providers to make this connection.
Ideally, PCP communication would occur early in the hospitalization, especially for medically or socially complex patients, for 3 main reasons: (1) The PCP can offer insights on goals of care or therapies attempted in the past that may reduce unnecessary procedures, decrease length of stay, and improve patient satisfaction; (2) Reconciling medications that the patient should be taking and the list the patient reports may highlight noncompliance and trigger education around medication compliance prior to discharge; (3) Early PCP involvement may improve discharge planning efficiency, whereby the inpatient and outpatient teams agree on medical and social issues to be addressed for a safe discharge. Although there are no published studies that show communication early in the hospitalization impacts clinical outcomes, a national survey of hospitalists highlighted concerns about poor information exchange, particularly around medical history and outpatient medications, at the time of admission.[8]
As new financial models push healthcare providers to manage a population of patients under a global budget, inpatient and outpatient providers will need to communicate and collaborate at a level that is new for most institutions and providers.[9] Because early markers of success are based on financial savings, this means further reducing length of stay and transferring more care to the outpatient arena, tapping into community and home care resources. Involving PCPs early in the admission may help inpatient providers meet these goals.
DURING HOSPITALIZATION
Several publications from hospitalists have evaluated inpatient‐based interventions to reduce readmissions and improve care transitions.[10, 11, 12] Table 1 summarizes 6 steps that can improve communication and collaboration.
|
| 1. Involve the PCP in discharge planning early in the hospitalization.[1] |
| 2. Notify the PCP on hospital discharge.[44] |
| 3. Ensure the discharge summary is available at the time of discharge.[44] Several elements should be included in all discharge summaries:[45] |
| a. Home services ordered, home agency, timing of initiation of services. |
| b. Medication changes.[21] |
| c. Status of active problems at time of discharge.[11] |
| d. Follow‐up appointments, especially specialty follow‐up. |
| e. Tests pending at discharge or follow‐up required after discharge (eg, follow‐up CT scan in 6 months for incidental lung nodule).[11, 46, 47] |
| f. Equipment ordered. |
| 4. Schedule follow‐up appointment with appropriate outpatient provider by discharge.[11, 29] |
| 5. Ensure new prescriptions or changes to prescriptions are available at patient's pharmacy and any needed insurance preauthorization has been approved. |
| 6. Educate patient about disease process, medication adherence, lifestyle changes, and symptoms to monitor for after discharge.[22, 48, 49] |
AFTER HOSPITAL DISCHARGE
Immediately after hospital discharge, there are 7 steps that PCPs and their clinic staff can follow to support a safe transition from hospital to home. The literature supports several individual steps, but not the full package. I am proposing that primary care clinics adopt all 7 steps in an ideal transitions‐of‐care program.
Step 1: Telephone Call Within 72 Hours of Discharge
Many hospitals ask nurses or customer service staff to call patients immediately after hospital discharge. Call content ranges from reviewing discharge instructions and symptoms to satisfaction with hospital care. Even though a 2006 Cochrane review did not find a positive impact of hospital‐based postdischarge phone calls on readmission rates,[13] recent studies among select populations found small but significant reductions.[14, 15] Others have looked at fulfilling this role in the outpatient setting.[16, 17] A recent systematic review of primary care clinic‐based postdischarge phone calls showed no impact on readmission rates, but only 3 studies were included.[18] Health plan‐initiated telephone calls to plan members after hospital discharge reported a 22% reduction in readmissions.[19, 20] Because there is no standardization in telephone call content, reviews of inpatient‐based and clinic‐based interventions cited methodological challenges in drawing conclusions about impact.
Although education around disease process, lifestyle changes, and medication adherence can be effectively provided by staff from the hospital, clinic, or health plan, the outpatient clinic should assume primary responsibility for some components of the postdischarge call. First, if a patient does not have a follow‐up appointment after discharge, the clinic nurse can schedule the appointment directly. Second, medication discrepancies after hospital discharge pose safety risks.[21, 22, 23] Although inpatient nurses may review discharge medications, it is the primary care nurse who can reconcile the discharge medication list with the prehospitalization medication list and identify discrepancies. The outpatient nurse has easier access to the PCP to address discrepancies. Third, the primary care nurse can provide education around red‐flag symptoms for which to call the clinic and information on after‐hours clinic access, an area that patients have specifically requested as standard after discharge.[24] If the patient reports new symptoms, the clinic nurse has easy access to the PCP for management advice, as well as the clinic schedule for an urgent appointment. Having the primary care practice house posthospitalization phone calls allows for more efficient troubleshooting of postdischarge issues.
In January 2013, CMS introduced new codes for primary care‐based care coordination after hospitalization. Current procedural terminology (CPT) codes 99495 and 99496 can be used by PCPs who complete 2 steps: (1) document discussion with a patient or caregiver about care transitions within 2 days of discharge, and (2) have a face‐to‐face visit with the patient within 2 weeks or 1 week, respectively.[25] Reimbursement for these codes is substantial3.96 work relative value units (RVUs) for 99495 and 5.81 work RVUs for 99496considerably more than a level IV visit for complex follow‐up care (2.43 work RVUs). Primary care practices may find that reimbursement for these care coordination codes helps cover additional costs of nurses, case managers, or social workers assisting with posthospital care. The financial impact on primary care practices may increase if commercial insurers accept these CPT codes and reimburse at levels comparable to the CMS.
CMS approved reimbursement for posthospitalization phone calls despite mixed evidence on the impact of the intervention, presumably because it is perceived that early follow‐up may lead to benefits that cannot be easily captured in research studies, and simply represents good patient care. Two challenges in showing an impact of these phone calls are lack of standardization and small sample size. However, implementation of the care‐coordination CPT codes will require more standardization and potentially a much larger number of patients who receive posthospitalization phone calls. This allows for a much more robust evaluation of the intervention.
Step 2: Follow‐up Appointment With PCP or Most Appropriate Continuity Provider
Early follow‐up with an appropriate outpatient provider has been associated with reduced hospital readmissions for patients with congestive heart failure, chronic obstructive pulmonary disease, and psychiatric illnesses,[26, 27, 28, 29] but this finding has not been consistent across all patient populations.[5, 30] It is not well understood if the follow‐up appointment needs to be within a specific time frame, especially if the patient is already being touched once by the system through the posthospitalization call. General consensus falls within 7 days for patients at moderate to high risk for readmissions.[31, 32] Regardless of risk, follow‐up visits must occur within 2 weeks of discharge to claim the CMS reimbursement for posthospitalization care coordination, and higher reimbursement is offered if it occurs within 1 week.
Step 3: Care Coordination
A nurse, social worker, or case manager partnering with the PCP on care coordination may improve the patient experience and outcomes.[17, 24] Although the inpatient social worker or case manager may have helped address some housing, financial, home care, and durable medical equipment needs, often these issues are not completely resolved at discharge. There should be a seamless handoff between inpatient and outpatient care coordinators.
Although some primary care practices include social workers, case managers, or health coaches, many have general clinic nurses functioning in these roles. One way to help fund these roles is through the care coordination CPT codes as previously described. Another consideration, as the financial model for funding care across the care continuum changes, is to have inpatient social workers and case managers work jointly with inpatient and outpatient providers, following patients to the outpatient setting until their social needs are met. This arrangement is more feasible for integrated delivery systems or primary care clinics with contractual agreements with local hospitals, an emerging trend in markets across the United States.[33] Other resources for care coordination include health plan case managers and local community nonprofits. In 2011, CMS launched the Community‐Based Care Transitions Program (CCTP), which will award up to $500 million in funding over 5 years to community‐based organizations to assist Medicare patients with care transitions.[34]
One way of operationalizing care coordination, especially in primary care clinics that do not have an embedded social worker or case manager, is to offer a team‐based appointment in conjunction with the physician postdischarge visit. A healthcare team member (nurse, experienced medical assistant, pharmacist) reviews hospital discharge records, educates the patient about the reasons for hospitalization and how to prevent readmission, performs detailed review of medications, follows up on any pending test results, reviews home care orders or durable medical equipment orders, and identifies any psychosocial issues that need to be addressed. All findings are documented in the patient chart and available for review at the beginning of the physician visit. With the team previsit in place, the physician can focus on the medical problems.
Step 4: Repeat Process Above Until Active Issues Are Stabilized
For some patients, steps 1 through 4 may need to be repeated until active medical and psychosocial issues are stabilized. Creating clinic infrastructure to support patients who may need to return weekly for titration of medications or monitoring of lab values until they normalize can prevent unnecessary ED visits. Patients with psychosocial issues will likely need longitudinal support, as these issues often take months to resolve.
Step 5: Create Access in Clinic for Patients With New Symptoms
Even after the first posthospitalization visit, patients may need to return to their PCP because of new symptoms or for active monitoring. In many parts of the country, PCP access is limited.[33] To meet patient demand for timely appointments, many primary care practices have piloted advanced access scheduling, reserving the majority of appointments for same‐day patient requests. However, evaluations show that the same‐day appointment goals of advanced access are difficult to achieve for most practices.[35] Despite challenges to same‐day access for the general clinic population, it is critical to create access for patients recently hospitalized, as many are at high risk for an ED visit or another hospital admission.
Step 6: Know Your Numbers
A basic tenet of quality improvement is measuring baseline performance and performance at intermediate time points during an intervention.[36] A recent Cochrane review found that feeding back performance to physicians can lead to potentially important improvements in practice.[37] In an Institute for Healthcare Improvement how‐to guide for improving care transitions, measuring readmission rates is 1 step in their Model for Improvement.[32] However, few primary care clinics are actively monitoring their readmission rates. One basic challenge is data availability. Primary care clinics affiliated with a hospital can obtain discharge and readmissions data from the hospital, but patients may also be hospitalized at other facilities. Insurers would be the best source of hospital discharge data, and some payors supply PCPs with risk‐adjusted performance metrics.[38, 39] As ACOs mature, primary care clinics can partner with payors to obtain data and begin trending their hospital discharge and readmission rates. In the interim, trending readmission rates at a single affiliated institution and filtering by service, discharge diagnosis, or payor may reveal areas for intervention.
Step 7: Know Your Readmitted Patients
Similar to knowing the primary care clinic's overall discharge and readmission numbers, it is also important to know the population of frequently readmitted patients. Even though some PCPs may be able to recall these patients by memory, it is important to review these patients' charts and identify preventable factors related to readmission, especially system‐related factors. Conducting reviews can be time intensive and add new demands for busy PCPs. However, many clinics already conduct morbidity and mortality conferences and case reviews as part of improving patient satisfaction, service, and outcomes. Case reviews of frequently admitted patients can fall under these established activities.
IMPLICATIONS
In this vision of the ideal care transition, I am suggesting a shift in culture from a predominantly hospital‐based program to a program that spans the care continuum and requires active participation and ownership from the PCP's team. It will require inpatient and outpatient providers to communicate early and frequently during the hospitalization, sharing patient information efficiently and working collaboratively as part of a larger team to meet the medical and psychosocial needs of the patient. This concept is not new, but has not been supported financially from payors.[1, 9, 40] Most PCPs operate on margins that cannot support additional PCP time to coordinate care for patients or staff to assist (although many PCPs believe this is the role of the primary care medical home).[33] Some payors agree that stipends to support infrastructure change are needed to improve patient outcomes.[17, 38, 39]
Even though every envisioned step does not require additional funding, new payment arrangements under ACOs and bundled payments may offer opportunities for PCPs to assume a larger role in care transitions and secure funding to pay for interventions. However, primary care practices must be positioned to negotiate favorable global payment agreements, be willing to assume risks associated with global payments, and prioritize management of medically and socially complex patients who are at risk for preventable ED visits and hospitalizations. PCPs who are not participating in ACOs or bundled payments, or those who are risk adverse, may be able to finance pieces of this vision with the new care coordination CPT codes supported by Medicare (and possibly commercial payors in the future). They may also partner with community groups participating in CCTP for additional support. Others focus on the long‐term benefits of ACO‐like structures rather than the short‐term investments needed.[41]
Are all 14 steps proposed above essential? Without doubt, this vision will be difficult to fully operationalize and requires coordination and support from many distinct groups. Should all patients be offered a basic package of interventions, reserving the full package for those who are identified as highest risk for poor outcomes after hospital discharge? There is already some support around specialized interventions for patients at high risk for readmissions,[32, 41] and risk prediction models have been introduced to identify these individuals.[42] Or should we approach this as a menu of interventions from which to choose, tailoring interventions to individual patient needs? These questions should be tested, as our experience in coordinating care across the continuum matures. With over 100 ACOs formed in Medicare alone[43] and many more with commercial insurers, our understanding in this area will grow in the next 5 years.
CONCLUSIONS
As cost containment measures in healthcare target preventable readmissions, hospitals and primary care physicians are increasingly encouraged to improve transitions along the care continuum. In this article, I offer 1 PCP's vision of the ideal transitions‐of‐care program from hospital to home. This article focuses on steps that can be taken by PCPs and their clinic staff; it does not address the role of outpatient specialists, home care agencies, or community support groups in care transitions. Operationalizing this vision requires commitment from the hospital and clinic leadership, as well as buy‐in from front‐line providers. More research is required to understand the marginal impact of each component of this vision, as well as the comprehensive package of interventions proposed, on patient outcomes. New financial models with payors and hospitals may make it easier for primary care clinics to test this vision. Current financial incentives are likely still inadequate to fully align care along the continuum, but they offer some support for more PCPs to take an active role. The time has come to shift our traditional view of transitions of care from a hospital‐centric set of interventions toward one that spans the entire care continuum and includes primary care physicians and their clinic staff as key partners.
Acknowledgments
The author thanks Jeffrey Fujimoto for his assistance with the literature review.
Disclosures: Ning Tang, MD, is supported by a University of California, Center for Health Quality and Innovation grant. Dr. Tang has no financial conflicts of interests.
- , , . Reducing hospital readmissions: lessons from top‐performing hospitals. The Commonwealth Fund Synthesis Report. April 2011. Available at: http://www.commonwealthfund.org/Publications/Case‐Studies/2011/Apr/Reducing‐Hospital‐Readmissions.aspx. Accessed January 30, 2013.
- , . Effective Interventions to Reduce Rehospitalizations: A Survey of the Published Evidence. Cambridge, MA: Institute for Healthcare Improvement; 2009.
- Society of Hospital Medicine. Project BOOST. Available at: www.hospitalmedicine.org/BOOST/. Accessed January 30, 2013.
- American Association of Medical Colleges. HOMERUN Executive Summary. Available at: https://members.aamc.org/eweb/upload/HOMERUN%20summary%202012.pdf. Accessed January 30, 2013.
- , , , , . Interventions to reduce 30‐day rehospitalization: a systematic review. Ann Intern Med. 2011;155:520–528.
- , , , et al. Contemporary evidence about hospital strategies for reducing 30‐day readmissions. J Am Coll Cardiol. 2012;60:607–614.
- , , , et al. Improving patient handovers from hospital to primary care: a systematic review. Ann Intern Med. 2012;157:417–428.
- , , , . Hospitalists and care transitions: the divorce of inpatient and outpatient care. Health Aff. 2008;27:1315–1327.
- , , . Recasting readmissions by placing the hospital role in community context. JAMA. 2013;309:351–352.
- , , , . Promoting effective transitions of care at hospital discharge: a review of key issues for hospitalists. J Hosp Med. 2007;2:314–323.
- , , , et al. Transition of care for hospitalized elderly patients—development of a discharge checklist for hospitalists. J Hosp Med. 2006;1:354–360.
- . Transitioning the patient with acute coronary syndrome from inpatient to primary care. J Hosp Med. 2010;5(suppl):S8–S14.
- , . Telephone follow‐up, initiated by a hospital‐based health professional, for postdischarge problems in patients discharged from hospital to home. Cochrane Database Syst Rev. 2006;(4):CD004510.
- , , , . Post‐discharge intervention in vulnerable, chronically ill patients. J Hosp Med. 2012;7:124–130.
- , , , et al. Low‐cost transitional care with nurse managers making mostly phone contact with patients cut rehospitalization at a VA hospital. Health Aff. 2012;31:2659–2668.
- , , , . Redefining and redesigning hospital discharge to enhance patient care: a randomized control study. J Gen Intern Med. 2008;23:1228–1233.
- , , , et al. How Geisinger's advanced medical home model argues the case for rapid‐cycle innovation. Health Aff. 2010;29:2047–2053. .
- , , . Telephone follow‐up as a primary care intervention for postdischarge outcomes improvement: a systematic review. Am J Med. 2012;125:915–921.
- , , , , . The impact of postdischarge telephonic follow‐up on hospital readmissions. Popul Health Manag. 2011;14:27–32.
- , , , , . Prioritized post‐discharge telephonic outreach reduces hospital readmissions for select high‐risk patients. Am J Manag Care. 2012;18:838–844.
- , , , et al. Association of ICU or hospital admission with unintentional discontinuation of medications for chronic diseases. JAMA. 2011;306:840–847.
- , , , et al. Effect of a pharmacist intervention on clinically important medication errors after hospital discharge. Ann Intern Med. 2012;157:1–10.
- , , , , , . Relationship of health literacy to intentional and unintentional non‐adherence of hospital discharge medications. J Gen Intern Med. 2012;27:173–178.
- , , , , . Patient experiences of transitioning from hospital to home: an ethnographic quality improvement project. J Hosp Med. 2012;7:382–387.
- . Medicare finalizes physician pay for new care coordination benefit. American Medical News. November 12, 2012. Available at: http://www.ama‐assn.org/amednews/2012/11/12/gvl11112.htm. Accessed February 8, 2013.
- , , , , . Outpatient follow‐up visit and 30‐day emergency department visit and readmission in patients hospitalized for chronic obstructive pulmonary disease. Arch Intern Med. 2010;170:1664–1670.
- , , . Post‐hospitalization transitions: examining the effects of timing of primary care provider follow‐up. J Hosp Med. 2010;5:392–397.
- , , , et al. Relationship between early physician follow‐up and 30‐day readmission among Medicare beneficiaries hospitalized for heart failure. JAMA. 2010;303:1716–1722.
- , , . Effects of discharge planning and compliance with outpatient appointments on readmission rates. Psychiatr Serv. 2000;51:885–889.
- , , , , . Do timely outpatient follow‐up visits decrease hospital readmission rates? Am J Med Qual. 2012;27:11–15.
- Project BOOST. Tool for addressing risk: a geriatric evaluation for transitions. Available at: http://www.hospitalmedicine.org/ResourceRoomRedesign/RR_CareTransitions/PDFs/TARGET.pdf. Accessed February 3, 2013.
- , , , , . How‐to Guide: Improving Transitions from the Hospital to Community Settings to Reduce Avoidable Rehospitalizations. Cambridge, MA: Institute for Healthcare Improvement; 2012.
- , . Primary care: current problems and proposed solutions. Health Aff. 2010;29:799–805.
- Center for Medicare and Medicaid Innovation. Community‐based Care Transitions Program. Available at: http://innovation.cms.gov/initiatives/CCTP/#collapse‐tableDetails. Accessed February 8, 2013.
- , , . Advanced access scheduling outcomes: a systematic review. Arch Intern Med. 2011;171:1150–1159.
- , , , . The Improvement Guide: A Practical Approach to Enhancing Organizational Performance. 2nd ed. San Francisco, CA: Jossey‐Bass Publishers; 2009.
- , , , et al. Audit and feedback: effects on professional practice and healthcare outcomes. Cochrane Database Syst Rev. 2012;(6):CD000259.
- Agency for Healthcare Research and Quality. Policy Innovation Profile. Insurer provides financial incentives, infrastructure, and other support to stimulate provider participation in quality improvement collaborations. June 6, 2012. Available at: http://www.innovations.ahrq.gov/content.aspx?id=3641. Accessed February 8, 2013.
- , , , . Private‐payer innovation in Massachusetts: The “Alternative Quality Contract.” Health Aff. 2011;30:51–61.
- , ; AMA Expert Panel on Care Transitions. There and home again, safely: five responsibilities of ambulatory practices in high quality care transitions. American Medical Association; Chicago, IL; 2013. Available at: www.ama‐assn.org/go/patientsafety. Accessed February 22, 2013.
- Agency for Healthcare Research and Quality. Policy Innovation Profile. Medical center establishes infrastructure to manage care under capitated contracts, leading to better chronic care management and lower utilization and costs. October 3, 2012. Available at: http://www.innovations.ahrq.gov/content.aspx?id=3651. Accessed February 8, 2013.
- , , , et al. Risk prediction models for hospital readmission: a systematic review. JAMA. 2011;306:1688–1698.
- Centers for Medicare and Medicaid Services. More doctors, hospitals partner to coordinate care for people with Medicare: providers form 106 new accountable care organizations. Press release January 10, 2013. Available at: http://www.cms.gov/apps/media/press/release.asp?Counter=4501297:831–841.
- , , , et al. Transitions of care consensus policy statement American College of Physicians‐Society of General Internal Medicine‐Society of Hospital Medicine‐American Geriatrics Society‐American College of Emergency Physicians‐Society of Academic Emergency Medicine. J Gen Intern Med. 2009;24:971–976.
- , , , et al. Patient safety concerns arising from test results that return after hospital discharge. Ann Intern Med. 2005;143(2):121–128.
- , , . Tying up loose ends: discharging patients with unresolved medical issues. Arch Intern Med. 2007;167:1305–1311.
- , , , , , . Perceptions of readmitted patients on the transition from hospital to home. J Hosp Med. 2012;7:709–712.
- , . Patients' understanding of their treatment plans and diagnosis at discharge. Mayo Clin Proc. 2005;80:991–994.
Across the country, hospitals are rolling out programs to reduce readmissions. These range from patient education around their disease process and medications, improvements in discharge planning, medication reconciliation, outpatient appointments scheduled prior to discharge, and follow‐up phone calls, among others.[1, 2] Several collaboratives such as Project Better Outcomes by Optimizing Safe Transitions[3] and Hospital Medicine Reengineering Network[4] have formed to test, study, and share lessons learned from these inpatient‐based interventions. Because financial penalties thus far have focused on decreases in inpatient reimbursement by the Centers for Medicare and Medicaid Services (CMS), most of the interventions to reduce hospital readmissions have been concentrated in the inpatient domain. It is unclear whether new payment arrangements with CMS or commercial insurers, such as bundled payments and accountable care organizations (ACOs), will pressure primary care physicians (PCPs) to further develop outpatient‐based interventions.
In this article, I provide a PCP's perspective of how inpatient and outpatient providers can partner to create the ideal care transition from hospital to home. Although others have conducted systematic reviews or surveys of interventions to reduce hospital readmissions,[2, 5, 6, 7] I will start from a vision of an ideal transition, and then evaluate evidence supporting each step. I will also highlight areas where new reimbursement codes can help support an idealized transitions‐of‐care program.
ON HOSPITAL ADMISSION
Many PCPs consider the beginning of the care continuum to rest in the primary care practice and relationship. Over time, PCPs develop relationships with their patients, understanding the patients' values toward health and healthcare, learning their social support system and home environment, and documenting a clinical course of chronic diseases, including which therapies have and have not worked well. From a PCP perspective, it seems natural to be involved in care at the point of hospital admission. Some emergency departments (EDs) and hospital admissions offices have automated systems to email or fax PCPs admission notifications. Others rely on providers to make this connection.
Ideally, PCP communication would occur early in the hospitalization, especially for medically or socially complex patients, for 3 main reasons: (1) The PCP can offer insights on goals of care or therapies attempted in the past that may reduce unnecessary procedures, decrease length of stay, and improve patient satisfaction; (2) Reconciling medications that the patient should be taking and the list the patient reports may highlight noncompliance and trigger education around medication compliance prior to discharge; (3) Early PCP involvement may improve discharge planning efficiency, whereby the inpatient and outpatient teams agree on medical and social issues to be addressed for a safe discharge. Although there are no published studies that show communication early in the hospitalization impacts clinical outcomes, a national survey of hospitalists highlighted concerns about poor information exchange, particularly around medical history and outpatient medications, at the time of admission.[8]
As new financial models push healthcare providers to manage a population of patients under a global budget, inpatient and outpatient providers will need to communicate and collaborate at a level that is new for most institutions and providers.[9] Because early markers of success are based on financial savings, this means further reducing length of stay and transferring more care to the outpatient arena, tapping into community and home care resources. Involving PCPs early in the admission may help inpatient providers meet these goals.
DURING HOSPITALIZATION
Several publications from hospitalists have evaluated inpatient‐based interventions to reduce readmissions and improve care transitions.[10, 11, 12] Table 1 summarizes 6 steps that can improve communication and collaboration.
|
| 1. Involve the PCP in discharge planning early in the hospitalization.[1] |
| 2. Notify the PCP on hospital discharge.[44] |
| 3. Ensure the discharge summary is available at the time of discharge.[44] Several elements should be included in all discharge summaries:[45] |
| a. Home services ordered, home agency, timing of initiation of services. |
| b. Medication changes.[21] |
| c. Status of active problems at time of discharge.[11] |
| d. Follow‐up appointments, especially specialty follow‐up. |
| e. Tests pending at discharge or follow‐up required after discharge (eg, follow‐up CT scan in 6 months for incidental lung nodule).[11, 46, 47] |
| f. Equipment ordered. |
| 4. Schedule follow‐up appointment with appropriate outpatient provider by discharge.[11, 29] |
| 5. Ensure new prescriptions or changes to prescriptions are available at patient's pharmacy and any needed insurance preauthorization has been approved. |
| 6. Educate patient about disease process, medication adherence, lifestyle changes, and symptoms to monitor for after discharge.[22, 48, 49] |
AFTER HOSPITAL DISCHARGE
Immediately after hospital discharge, there are 7 steps that PCPs and their clinic staff can follow to support a safe transition from hospital to home. The literature supports several individual steps, but not the full package. I am proposing that primary care clinics adopt all 7 steps in an ideal transitions‐of‐care program.
Step 1: Telephone Call Within 72 Hours of Discharge
Many hospitals ask nurses or customer service staff to call patients immediately after hospital discharge. Call content ranges from reviewing discharge instructions and symptoms to satisfaction with hospital care. Even though a 2006 Cochrane review did not find a positive impact of hospital‐based postdischarge phone calls on readmission rates,[13] recent studies among select populations found small but significant reductions.[14, 15] Others have looked at fulfilling this role in the outpatient setting.[16, 17] A recent systematic review of primary care clinic‐based postdischarge phone calls showed no impact on readmission rates, but only 3 studies were included.[18] Health plan‐initiated telephone calls to plan members after hospital discharge reported a 22% reduction in readmissions.[19, 20] Because there is no standardization in telephone call content, reviews of inpatient‐based and clinic‐based interventions cited methodological challenges in drawing conclusions about impact.
Although education around disease process, lifestyle changes, and medication adherence can be effectively provided by staff from the hospital, clinic, or health plan, the outpatient clinic should assume primary responsibility for some components of the postdischarge call. First, if a patient does not have a follow‐up appointment after discharge, the clinic nurse can schedule the appointment directly. Second, medication discrepancies after hospital discharge pose safety risks.[21, 22, 23] Although inpatient nurses may review discharge medications, it is the primary care nurse who can reconcile the discharge medication list with the prehospitalization medication list and identify discrepancies. The outpatient nurse has easier access to the PCP to address discrepancies. Third, the primary care nurse can provide education around red‐flag symptoms for which to call the clinic and information on after‐hours clinic access, an area that patients have specifically requested as standard after discharge.[24] If the patient reports new symptoms, the clinic nurse has easy access to the PCP for management advice, as well as the clinic schedule for an urgent appointment. Having the primary care practice house posthospitalization phone calls allows for more efficient troubleshooting of postdischarge issues.
In January 2013, CMS introduced new codes for primary care‐based care coordination after hospitalization. Current procedural terminology (CPT) codes 99495 and 99496 can be used by PCPs who complete 2 steps: (1) document discussion with a patient or caregiver about care transitions within 2 days of discharge, and (2) have a face‐to‐face visit with the patient within 2 weeks or 1 week, respectively.[25] Reimbursement for these codes is substantial3.96 work relative value units (RVUs) for 99495 and 5.81 work RVUs for 99496considerably more than a level IV visit for complex follow‐up care (2.43 work RVUs). Primary care practices may find that reimbursement for these care coordination codes helps cover additional costs of nurses, case managers, or social workers assisting with posthospital care. The financial impact on primary care practices may increase if commercial insurers accept these CPT codes and reimburse at levels comparable to the CMS.
CMS approved reimbursement for posthospitalization phone calls despite mixed evidence on the impact of the intervention, presumably because it is perceived that early follow‐up may lead to benefits that cannot be easily captured in research studies, and simply represents good patient care. Two challenges in showing an impact of these phone calls are lack of standardization and small sample size. However, implementation of the care‐coordination CPT codes will require more standardization and potentially a much larger number of patients who receive posthospitalization phone calls. This allows for a much more robust evaluation of the intervention.
Step 2: Follow‐up Appointment With PCP or Most Appropriate Continuity Provider
Early follow‐up with an appropriate outpatient provider has been associated with reduced hospital readmissions for patients with congestive heart failure, chronic obstructive pulmonary disease, and psychiatric illnesses,[26, 27, 28, 29] but this finding has not been consistent across all patient populations.[5, 30] It is not well understood if the follow‐up appointment needs to be within a specific time frame, especially if the patient is already being touched once by the system through the posthospitalization call. General consensus falls within 7 days for patients at moderate to high risk for readmissions.[31, 32] Regardless of risk, follow‐up visits must occur within 2 weeks of discharge to claim the CMS reimbursement for posthospitalization care coordination, and higher reimbursement is offered if it occurs within 1 week.
Step 3: Care Coordination
A nurse, social worker, or case manager partnering with the PCP on care coordination may improve the patient experience and outcomes.[17, 24] Although the inpatient social worker or case manager may have helped address some housing, financial, home care, and durable medical equipment needs, often these issues are not completely resolved at discharge. There should be a seamless handoff between inpatient and outpatient care coordinators.
Although some primary care practices include social workers, case managers, or health coaches, many have general clinic nurses functioning in these roles. One way to help fund these roles is through the care coordination CPT codes as previously described. Another consideration, as the financial model for funding care across the care continuum changes, is to have inpatient social workers and case managers work jointly with inpatient and outpatient providers, following patients to the outpatient setting until their social needs are met. This arrangement is more feasible for integrated delivery systems or primary care clinics with contractual agreements with local hospitals, an emerging trend in markets across the United States.[33] Other resources for care coordination include health plan case managers and local community nonprofits. In 2011, CMS launched the Community‐Based Care Transitions Program (CCTP), which will award up to $500 million in funding over 5 years to community‐based organizations to assist Medicare patients with care transitions.[34]
One way of operationalizing care coordination, especially in primary care clinics that do not have an embedded social worker or case manager, is to offer a team‐based appointment in conjunction with the physician postdischarge visit. A healthcare team member (nurse, experienced medical assistant, pharmacist) reviews hospital discharge records, educates the patient about the reasons for hospitalization and how to prevent readmission, performs detailed review of medications, follows up on any pending test results, reviews home care orders or durable medical equipment orders, and identifies any psychosocial issues that need to be addressed. All findings are documented in the patient chart and available for review at the beginning of the physician visit. With the team previsit in place, the physician can focus on the medical problems.
Step 4: Repeat Process Above Until Active Issues Are Stabilized
For some patients, steps 1 through 4 may need to be repeated until active medical and psychosocial issues are stabilized. Creating clinic infrastructure to support patients who may need to return weekly for titration of medications or monitoring of lab values until they normalize can prevent unnecessary ED visits. Patients with psychosocial issues will likely need longitudinal support, as these issues often take months to resolve.
Step 5: Create Access in Clinic for Patients With New Symptoms
Even after the first posthospitalization visit, patients may need to return to their PCP because of new symptoms or for active monitoring. In many parts of the country, PCP access is limited.[33] To meet patient demand for timely appointments, many primary care practices have piloted advanced access scheduling, reserving the majority of appointments for same‐day patient requests. However, evaluations show that the same‐day appointment goals of advanced access are difficult to achieve for most practices.[35] Despite challenges to same‐day access for the general clinic population, it is critical to create access for patients recently hospitalized, as many are at high risk for an ED visit or another hospital admission.
Step 6: Know Your Numbers
A basic tenet of quality improvement is measuring baseline performance and performance at intermediate time points during an intervention.[36] A recent Cochrane review found that feeding back performance to physicians can lead to potentially important improvements in practice.[37] In an Institute for Healthcare Improvement how‐to guide for improving care transitions, measuring readmission rates is 1 step in their Model for Improvement.[32] However, few primary care clinics are actively monitoring their readmission rates. One basic challenge is data availability. Primary care clinics affiliated with a hospital can obtain discharge and readmissions data from the hospital, but patients may also be hospitalized at other facilities. Insurers would be the best source of hospital discharge data, and some payors supply PCPs with risk‐adjusted performance metrics.[38, 39] As ACOs mature, primary care clinics can partner with payors to obtain data and begin trending their hospital discharge and readmission rates. In the interim, trending readmission rates at a single affiliated institution and filtering by service, discharge diagnosis, or payor may reveal areas for intervention.
Step 7: Know Your Readmitted Patients
Similar to knowing the primary care clinic's overall discharge and readmission numbers, it is also important to know the population of frequently readmitted patients. Even though some PCPs may be able to recall these patients by memory, it is important to review these patients' charts and identify preventable factors related to readmission, especially system‐related factors. Conducting reviews can be time intensive and add new demands for busy PCPs. However, many clinics already conduct morbidity and mortality conferences and case reviews as part of improving patient satisfaction, service, and outcomes. Case reviews of frequently admitted patients can fall under these established activities.
IMPLICATIONS
In this vision of the ideal care transition, I am suggesting a shift in culture from a predominantly hospital‐based program to a program that spans the care continuum and requires active participation and ownership from the PCP's team. It will require inpatient and outpatient providers to communicate early and frequently during the hospitalization, sharing patient information efficiently and working collaboratively as part of a larger team to meet the medical and psychosocial needs of the patient. This concept is not new, but has not been supported financially from payors.[1, 9, 40] Most PCPs operate on margins that cannot support additional PCP time to coordinate care for patients or staff to assist (although many PCPs believe this is the role of the primary care medical home).[33] Some payors agree that stipends to support infrastructure change are needed to improve patient outcomes.[17, 38, 39]
Even though every envisioned step does not require additional funding, new payment arrangements under ACOs and bundled payments may offer opportunities for PCPs to assume a larger role in care transitions and secure funding to pay for interventions. However, primary care practices must be positioned to negotiate favorable global payment agreements, be willing to assume risks associated with global payments, and prioritize management of medically and socially complex patients who are at risk for preventable ED visits and hospitalizations. PCPs who are not participating in ACOs or bundled payments, or those who are risk adverse, may be able to finance pieces of this vision with the new care coordination CPT codes supported by Medicare (and possibly commercial payors in the future). They may also partner with community groups participating in CCTP for additional support. Others focus on the long‐term benefits of ACO‐like structures rather than the short‐term investments needed.[41]
Are all 14 steps proposed above essential? Without doubt, this vision will be difficult to fully operationalize and requires coordination and support from many distinct groups. Should all patients be offered a basic package of interventions, reserving the full package for those who are identified as highest risk for poor outcomes after hospital discharge? There is already some support around specialized interventions for patients at high risk for readmissions,[32, 41] and risk prediction models have been introduced to identify these individuals.[42] Or should we approach this as a menu of interventions from which to choose, tailoring interventions to individual patient needs? These questions should be tested, as our experience in coordinating care across the continuum matures. With over 100 ACOs formed in Medicare alone[43] and many more with commercial insurers, our understanding in this area will grow in the next 5 years.
CONCLUSIONS
As cost containment measures in healthcare target preventable readmissions, hospitals and primary care physicians are increasingly encouraged to improve transitions along the care continuum. In this article, I offer 1 PCP's vision of the ideal transitions‐of‐care program from hospital to home. This article focuses on steps that can be taken by PCPs and their clinic staff; it does not address the role of outpatient specialists, home care agencies, or community support groups in care transitions. Operationalizing this vision requires commitment from the hospital and clinic leadership, as well as buy‐in from front‐line providers. More research is required to understand the marginal impact of each component of this vision, as well as the comprehensive package of interventions proposed, on patient outcomes. New financial models with payors and hospitals may make it easier for primary care clinics to test this vision. Current financial incentives are likely still inadequate to fully align care along the continuum, but they offer some support for more PCPs to take an active role. The time has come to shift our traditional view of transitions of care from a hospital‐centric set of interventions toward one that spans the entire care continuum and includes primary care physicians and their clinic staff as key partners.
Acknowledgments
The author thanks Jeffrey Fujimoto for his assistance with the literature review.
Disclosures: Ning Tang, MD, is supported by a University of California, Center for Health Quality and Innovation grant. Dr. Tang has no financial conflicts of interests.
- , , . Reducing hospital readmissions: lessons from top‐performing hospitals. The Commonwealth Fund Synthesis Report. April 2011. Available at: http://www.commonwealthfund.org/Publications/Case‐Studies/2011/Apr/Reducing‐Hospital‐Readmissions.aspx. Accessed January 30, 2013.
- , . Effective Interventions to Reduce Rehospitalizations: A Survey of the Published Evidence. Cambridge, MA: Institute for Healthcare Improvement; 2009.
- Society of Hospital Medicine. Project BOOST. Available at: www.hospitalmedicine.org/BOOST/. Accessed January 30, 2013.
- American Association of Medical Colleges. HOMERUN Executive Summary. Available at: https://members.aamc.org/eweb/upload/HOMERUN%20summary%202012.pdf. Accessed January 30, 2013.
- , , , , . Interventions to reduce 30‐day rehospitalization: a systematic review. Ann Intern Med. 2011;155:520–528.
- , , , et al. Contemporary evidence about hospital strategies for reducing 30‐day readmissions. J Am Coll Cardiol. 2012;60:607–614.
- , , , et al. Improving patient handovers from hospital to primary care: a systematic review. Ann Intern Med. 2012;157:417–428.
- , , , . Hospitalists and care transitions: the divorce of inpatient and outpatient care. Health Aff. 2008;27:1315–1327.
- , , . Recasting readmissions by placing the hospital role in community context. JAMA. 2013;309:351–352.
- , , , . Promoting effective transitions of care at hospital discharge: a review of key issues for hospitalists. J Hosp Med. 2007;2:314–323.
- , , , et al. Transition of care for hospitalized elderly patients—development of a discharge checklist for hospitalists. J Hosp Med. 2006;1:354–360.
- . Transitioning the patient with acute coronary syndrome from inpatient to primary care. J Hosp Med. 2010;5(suppl):S8–S14.
- , . Telephone follow‐up, initiated by a hospital‐based health professional, for postdischarge problems in patients discharged from hospital to home. Cochrane Database Syst Rev. 2006;(4):CD004510.
- , , , . Post‐discharge intervention in vulnerable, chronically ill patients. J Hosp Med. 2012;7:124–130.
- , , , et al. Low‐cost transitional care with nurse managers making mostly phone contact with patients cut rehospitalization at a VA hospital. Health Aff. 2012;31:2659–2668.
- , , , . Redefining and redesigning hospital discharge to enhance patient care: a randomized control study. J Gen Intern Med. 2008;23:1228–1233.
- , , , et al. How Geisinger's advanced medical home model argues the case for rapid‐cycle innovation. Health Aff. 2010;29:2047–2053. .
- , , . Telephone follow‐up as a primary care intervention for postdischarge outcomes improvement: a systematic review. Am J Med. 2012;125:915–921.
- , , , , . The impact of postdischarge telephonic follow‐up on hospital readmissions. Popul Health Manag. 2011;14:27–32.
- , , , , . Prioritized post‐discharge telephonic outreach reduces hospital readmissions for select high‐risk patients. Am J Manag Care. 2012;18:838–844.
- , , , et al. Association of ICU or hospital admission with unintentional discontinuation of medications for chronic diseases. JAMA. 2011;306:840–847.
- , , , et al. Effect of a pharmacist intervention on clinically important medication errors after hospital discharge. Ann Intern Med. 2012;157:1–10.
- , , , , , . Relationship of health literacy to intentional and unintentional non‐adherence of hospital discharge medications. J Gen Intern Med. 2012;27:173–178.
- , , , , . Patient experiences of transitioning from hospital to home: an ethnographic quality improvement project. J Hosp Med. 2012;7:382–387.
- . Medicare finalizes physician pay for new care coordination benefit. American Medical News. November 12, 2012. Available at: http://www.ama‐assn.org/amednews/2012/11/12/gvl11112.htm. Accessed February 8, 2013.
- , , , , . Outpatient follow‐up visit and 30‐day emergency department visit and readmission in patients hospitalized for chronic obstructive pulmonary disease. Arch Intern Med. 2010;170:1664–1670.
- , , . Post‐hospitalization transitions: examining the effects of timing of primary care provider follow‐up. J Hosp Med. 2010;5:392–397.
- , , , et al. Relationship between early physician follow‐up and 30‐day readmission among Medicare beneficiaries hospitalized for heart failure. JAMA. 2010;303:1716–1722.
- , , . Effects of discharge planning and compliance with outpatient appointments on readmission rates. Psychiatr Serv. 2000;51:885–889.
- , , , , . Do timely outpatient follow‐up visits decrease hospital readmission rates? Am J Med Qual. 2012;27:11–15.
- Project BOOST. Tool for addressing risk: a geriatric evaluation for transitions. Available at: http://www.hospitalmedicine.org/ResourceRoomRedesign/RR_CareTransitions/PDFs/TARGET.pdf. Accessed February 3, 2013.
- , , , , . How‐to Guide: Improving Transitions from the Hospital to Community Settings to Reduce Avoidable Rehospitalizations. Cambridge, MA: Institute for Healthcare Improvement; 2012.
- , . Primary care: current problems and proposed solutions. Health Aff. 2010;29:799–805.
- Center for Medicare and Medicaid Innovation. Community‐based Care Transitions Program. Available at: http://innovation.cms.gov/initiatives/CCTP/#collapse‐tableDetails. Accessed February 8, 2013.
- , , . Advanced access scheduling outcomes: a systematic review. Arch Intern Med. 2011;171:1150–1159.
- , , , . The Improvement Guide: A Practical Approach to Enhancing Organizational Performance. 2nd ed. San Francisco, CA: Jossey‐Bass Publishers; 2009.
- , , , et al. Audit and feedback: effects on professional practice and healthcare outcomes. Cochrane Database Syst Rev. 2012;(6):CD000259.
- Agency for Healthcare Research and Quality. Policy Innovation Profile. Insurer provides financial incentives, infrastructure, and other support to stimulate provider participation in quality improvement collaborations. June 6, 2012. Available at: http://www.innovations.ahrq.gov/content.aspx?id=3641. Accessed February 8, 2013.
- , , , . Private‐payer innovation in Massachusetts: The “Alternative Quality Contract.” Health Aff. 2011;30:51–61.
- , ; AMA Expert Panel on Care Transitions. There and home again, safely: five responsibilities of ambulatory practices in high quality care transitions. American Medical Association; Chicago, IL; 2013. Available at: www.ama‐assn.org/go/patientsafety. Accessed February 22, 2013.
- Agency for Healthcare Research and Quality. Policy Innovation Profile. Medical center establishes infrastructure to manage care under capitated contracts, leading to better chronic care management and lower utilization and costs. October 3, 2012. Available at: http://www.innovations.ahrq.gov/content.aspx?id=3651. Accessed February 8, 2013.
- , , , et al. Risk prediction models for hospital readmission: a systematic review. JAMA. 2011;306:1688–1698.
- Centers for Medicare and Medicaid Services. More doctors, hospitals partner to coordinate care for people with Medicare: providers form 106 new accountable care organizations. Press release January 10, 2013. Available at: http://www.cms.gov/apps/media/press/release.asp?Counter=4501297:831–841.
- , , , et al. Transitions of care consensus policy statement American College of Physicians‐Society of General Internal Medicine‐Society of Hospital Medicine‐American Geriatrics Society‐American College of Emergency Physicians‐Society of Academic Emergency Medicine. J Gen Intern Med. 2009;24:971–976.
- , , , et al. Patient safety concerns arising from test results that return after hospital discharge. Ann Intern Med. 2005;143(2):121–128.
- , , . Tying up loose ends: discharging patients with unresolved medical issues. Arch Intern Med. 2007;167:1305–1311.
- , , , , , . Perceptions of readmitted patients on the transition from hospital to home. J Hosp Med. 2012;7:709–712.
- , . Patients' understanding of their treatment plans and diagnosis at discharge. Mayo Clin Proc. 2005;80:991–994.
Intellectual Agenda for Hospitalists
The practice of bloodletting, performed using sticks, thorns, bones, or anything sharp, probably began in Egypt about 3,000 years ago.[1] The practice continued in Greece, where Hippocrates recommended bloodletting to balance the body's four humorsblood, phlegm, yellow bile, and black bileand continued during Roman times under the influence of Galen. In the United States, perhaps the most infamous use of bloodletting was when doctors reportedly bled as much as 5 U of blood from George Washington before he died from what was probably either acute epiglottitis or streptococcal pharyngitis.[2, 3] Although many infectious organisms, especially malaria parasites, require iron to proliferateand therefore may be less virulent in iron‐deficient people[4]acute near‐exsanguination undoubtedly did more harm than good in the elderly ex‐president.
But the practice of bloodletting continued and even flourished. In 1833 alone, France reportedly imported more than 40 million leeches to assist in bloodletting,[5] which oftentimes was thought to be sufficiently aggressive only when the patient actually fainted. Enthusiasm for bloodletting declined in the second half of the 19th century, influenced in part by a nonrandomized study that compared mortality rates among patients who were bled early in their illness with those who were bled later.[6] Nevertheless, Sir William Osler still recommended small amounts of bloodletting for pneumonia in his last edition of his famous textbook, The Principles and Practice of Medicine, published in 1920.[7] By 1927, however, the first edition of the Cecil's A Textbook of Medicine thankfully no longer recommended venesection except to treat conditions such as pulmonary edema.[8]
Why would I start this essay with a history of bloodletting? Surely, one might argue, nothing could be less relevant to a modern discussion of the quality of in‐hospital medical care. The substantial literature on quality improvement emphasizes the practical implementation of strategies to increase the appropriate adherence to processes that are known to improve outcomes. A number of common quality measures quickly come to mind: the use of aspirin, ‐blockers, angiotensin‐converting enzyme inhibitors, and statins in post‐myocardial infarction patients without contraindications,[9, 10] the rapid initiation of appropriate antibiotics to patients with community‐acquired pneumonia,[11] and early endoscopy for patients with acute upper gastrointestinal hemorrhage.[12] I could go on and on, listing in‐hospital interventions supported by class 1 evidence from more than one definitive randomized trial. In essentially all of these situations, the creation of quality metrics, often accompanied by measurement and feedback, have improved adherence and undoubtedly saved lives. But although adherence has improved, the explosion in evidence‐based medicine means that even the best hospitals may be in perpetual catch‐up mode as they try to ensure adherence with the next wave of improvement interventions.
Unfortunately, every now and then a lot of attention is paid to meeting a quality metric that turns out to be misguided. Perhaps the best recent in‐hospital example was the metric of prophylactic ‐blocker use before major noncardiac surgery. Although this recommendation initially appeared to be based on reasonable data,[13] the large Perioperative Ischemic Evaluation Study (POISE) trial showed that reductions in rates of myocardial infarction were more than offset by an increased risk of stroke and other complications; therefore, average‐risk patients actually did worse, not better, with the ‐blocker regimen used in the trial. Although some have questioned whether these results were a function of the precise ‐blocker regimen that was used, the results of POISE are actually remarkably consistent with prior data on the risk of myocardial infarction and stroke.[14, 15] What was really different was the relative importance of these and other end points in patients whose risk of cardiac death was lower than those of higher risk patients in prior studies. But more recently, an even more disturbing reality has emerged: a number of key reports on which the guidelines were based came from an investigator whose publications included data that could not be confirmed when his studies were reviewed by his home institution.[16] Regardless of the precise reasons, we no longer routinely recommend an intervention that at one time was a key quality indicator.
The ‐blocker fiasco brings me back to bloodletting. In the early 19th century, a hypothetical visionary physician interested in quality improvement would likely have looked for ways to improve the efficiency and reduce the cost of bloodletting. Perhaps the leeches could be bigger, hungrier, or applied in a more effective fashion? Or perhaps vacuum tubes would have been invented sooner?
Of course, I am overemphasizing to prove a point. I truly believe that more and more of what we recommend is based on solid evidence to document, at least for now, that we are doing the right thing. If we do it more often and in more people, net benefit will be realized.
What does all this mean for the future of hospital medicine and its emerging research endeavors? For me at least, the message is pretty clear. First, we must be careful not to over extrapolate from limited studies in high risk patients, or we will jump to more conclusions like we did with ‐blockers. Second, most advances in medicine require new and better data.
How can new clinical data be generated most quickly and efficiently? One‐off studies at individual institutions are logistically and financially challenging, whereas an enduring research infrastructure is a treasure that can study a series of questions as they arise. The Thrombolysis in Myocardial Infarction Study Group has published scores of papers looking at a series of interventions in patients with acute myocardial infarction and the acute coronary syndrome.[17, 18] The Acute Respiratory Distress Syndrome Network has demonstrated the value of lower tidal volumes and less aggressive fluid strategies in patients with respiratory failure.[19, 20]
The success of these large, multicenter research networks should become the paradigm for the study of common hospital problems, ranging from the conditions that result in admission on the medical service to the problems that have engendered surgical comanagement services. New data can be gleaned by studying the medical care system, by studying routinely gathered administrative and clinical data, or even better yet, by gathering prospective data on patients and their diseases. For hospitalized patients, a variety of unanswered questions remain regarding the epidemiology of common diseases, the value of diagnostic tests, the impact of various therapies and treatment protocols, and the incremental value of new technologies, ranging from self‐monitoring to handheld ultrasound. High‐quality research may address the genetic epidemiology of why one person is admitted with pneumococcal pneumonia, whereas family members seem perfectly healthy; which patients with a particular diagnosis might be managed for different lengths of time in different settings; what physical findings or diagnostic tests best stratify prognosis; what new technologies are truly worth their cost; and especially, what therapies really work.
I do not dispute that hospital medicine researchers should try to improve the current use of interventions that are deemed to be valuable right now. But if that is all the field does, it will be a huge disappointment. Hospitalists should not be relegated to being adherence police who spend their collective research energy finding ways to force themselves to follow recommendations based on data gathered by others.
Hospital medicine researchers are uniquely positioned to discover new information that will change what should be done and help create the quality metrics for the future. Unless both of these two goalsimproving the implementation of today's knowledge and generating new and better knowledgeare part of the research agenda, we run the risk that some of the best minds in internal medicine may, when all is said and done, have spent an inordinate number of IQ hours on what, a century from now, will be reminiscent of improving the quality of bloodletting.
- . Bloodletting over the centuries. NY State J Med. 1980;80:2022–2028.
- . The death of George Washington: an end to the controversy? Am Surg. 2008;74:770–774.
- . The death of George Washington (1732–1799) and the history of cynanche. J Med Biogr. 2005;13:225–231.
- , . Hepcidin and the iron‐infection axis. Science. 2012;338:768–772.
- . Leech therapy: a history. J Hist Dent. 2005;53:25–27.
- . Pierre‐Charles‐Alexandre Louis and the evaluation of bloodletting. J R Soc Med. 2006;99:158–160.
- , . The Principles and Practice of Medicine. New York, NY: Appleton and Co.; 1920.
- Cecil RL, Kennedy F, eds. A Textbook of Medicine by American Authors. 1st ed. Philadelphia, PA: WB Saunders; 1927.
- Department of Health and Human Services. Hospital Compare: hospital process of care measures tables. Available at: http://www.hospitalcompare.hhs.gov/staticpages/for‐consumers/poc/explainations‐of‐measures.aspx. Accessed January 3, 2013.
- , , . Trends in the use of lipid‐lowering medications at discharge in patients with acute myocardial infarction: 1998 to 2006. Am Heart J. 2009;157:185–194.
- , , , et al. Guideline‐concordant therapy and reduced mortality and length of stay in adults with community‐acquired pneumonia: playing by the rules. Arch Intern Med. 2009;169:1525–1531.
- , , , et al. International consensus recommendations on the management of patients with nonvariceal upper gastrointestinal bleeding. Ann Intern Med. 2010;152:101–113.
- , . β‐blockers and reduction of cardiac events in noncardiac surgery. JAMA. 2002;287:1445–1447.
- , , , et al; POISE Study Group. Effects of extended‐release metoprolol succinate in patients undergoing non‐cardiac surgery (POISE trial): a randomised controlled trial. Lancet. 2008;371:1839–1847.
- , , , et al. Perioperative beta blockers in patients having non‐cardiac surgery: a meta‐analysis. Lancet. 2008;372:1962–1976.
- Report on the 2012 follow‐up investigation of possible breaches of academic integrity. Erasmus MC Follow‐up Investigation Committee, 2012. Available at: http://www.eramusmc.nl. . Accessed January 3, 2013.
- , , , et al. Rivaroxaban in patients with a recent acute coronary syndrome. N Engl J Med. 2012;366:9–19.
- , , , et al. Addition of clopidogrel to aspirin and fibrinolytic therapy for myocardial infarction with ST‐segment elevation. N Engl J Med. 2005;352:1179–1189.
- Acute Respiratory Distress Syndrome Network: ventilation with lower tidal volumes as compared with traditional tidal volumes for acute lung injury and the acute respiratory distress syndrome. N Engl J Med. 2000;342:1301–1308.
- The National Heart, Lung, and Blood Institute Acute Respiratory Distress Syndrome (ARDS) Clinical Trials Network: comparison of two fluid‐management strategies in acute lung injury. N Engl J Med. 2006;354:2564–2575.
The practice of bloodletting, performed using sticks, thorns, bones, or anything sharp, probably began in Egypt about 3,000 years ago.[1] The practice continued in Greece, where Hippocrates recommended bloodletting to balance the body's four humorsblood, phlegm, yellow bile, and black bileand continued during Roman times under the influence of Galen. In the United States, perhaps the most infamous use of bloodletting was when doctors reportedly bled as much as 5 U of blood from George Washington before he died from what was probably either acute epiglottitis or streptococcal pharyngitis.[2, 3] Although many infectious organisms, especially malaria parasites, require iron to proliferateand therefore may be less virulent in iron‐deficient people[4]acute near‐exsanguination undoubtedly did more harm than good in the elderly ex‐president.
But the practice of bloodletting continued and even flourished. In 1833 alone, France reportedly imported more than 40 million leeches to assist in bloodletting,[5] which oftentimes was thought to be sufficiently aggressive only when the patient actually fainted. Enthusiasm for bloodletting declined in the second half of the 19th century, influenced in part by a nonrandomized study that compared mortality rates among patients who were bled early in their illness with those who were bled later.[6] Nevertheless, Sir William Osler still recommended small amounts of bloodletting for pneumonia in his last edition of his famous textbook, The Principles and Practice of Medicine, published in 1920.[7] By 1927, however, the first edition of the Cecil's A Textbook of Medicine thankfully no longer recommended venesection except to treat conditions such as pulmonary edema.[8]
Why would I start this essay with a history of bloodletting? Surely, one might argue, nothing could be less relevant to a modern discussion of the quality of in‐hospital medical care. The substantial literature on quality improvement emphasizes the practical implementation of strategies to increase the appropriate adherence to processes that are known to improve outcomes. A number of common quality measures quickly come to mind: the use of aspirin, ‐blockers, angiotensin‐converting enzyme inhibitors, and statins in post‐myocardial infarction patients without contraindications,[9, 10] the rapid initiation of appropriate antibiotics to patients with community‐acquired pneumonia,[11] and early endoscopy for patients with acute upper gastrointestinal hemorrhage.[12] I could go on and on, listing in‐hospital interventions supported by class 1 evidence from more than one definitive randomized trial. In essentially all of these situations, the creation of quality metrics, often accompanied by measurement and feedback, have improved adherence and undoubtedly saved lives. But although adherence has improved, the explosion in evidence‐based medicine means that even the best hospitals may be in perpetual catch‐up mode as they try to ensure adherence with the next wave of improvement interventions.
Unfortunately, every now and then a lot of attention is paid to meeting a quality metric that turns out to be misguided. Perhaps the best recent in‐hospital example was the metric of prophylactic ‐blocker use before major noncardiac surgery. Although this recommendation initially appeared to be based on reasonable data,[13] the large Perioperative Ischemic Evaluation Study (POISE) trial showed that reductions in rates of myocardial infarction were more than offset by an increased risk of stroke and other complications; therefore, average‐risk patients actually did worse, not better, with the ‐blocker regimen used in the trial. Although some have questioned whether these results were a function of the precise ‐blocker regimen that was used, the results of POISE are actually remarkably consistent with prior data on the risk of myocardial infarction and stroke.[14, 15] What was really different was the relative importance of these and other end points in patients whose risk of cardiac death was lower than those of higher risk patients in prior studies. But more recently, an even more disturbing reality has emerged: a number of key reports on which the guidelines were based came from an investigator whose publications included data that could not be confirmed when his studies were reviewed by his home institution.[16] Regardless of the precise reasons, we no longer routinely recommend an intervention that at one time was a key quality indicator.
The ‐blocker fiasco brings me back to bloodletting. In the early 19th century, a hypothetical visionary physician interested in quality improvement would likely have looked for ways to improve the efficiency and reduce the cost of bloodletting. Perhaps the leeches could be bigger, hungrier, or applied in a more effective fashion? Or perhaps vacuum tubes would have been invented sooner?
Of course, I am overemphasizing to prove a point. I truly believe that more and more of what we recommend is based on solid evidence to document, at least for now, that we are doing the right thing. If we do it more often and in more people, net benefit will be realized.
What does all this mean for the future of hospital medicine and its emerging research endeavors? For me at least, the message is pretty clear. First, we must be careful not to over extrapolate from limited studies in high risk patients, or we will jump to more conclusions like we did with ‐blockers. Second, most advances in medicine require new and better data.
How can new clinical data be generated most quickly and efficiently? One‐off studies at individual institutions are logistically and financially challenging, whereas an enduring research infrastructure is a treasure that can study a series of questions as they arise. The Thrombolysis in Myocardial Infarction Study Group has published scores of papers looking at a series of interventions in patients with acute myocardial infarction and the acute coronary syndrome.[17, 18] The Acute Respiratory Distress Syndrome Network has demonstrated the value of lower tidal volumes and less aggressive fluid strategies in patients with respiratory failure.[19, 20]
The success of these large, multicenter research networks should become the paradigm for the study of common hospital problems, ranging from the conditions that result in admission on the medical service to the problems that have engendered surgical comanagement services. New data can be gleaned by studying the medical care system, by studying routinely gathered administrative and clinical data, or even better yet, by gathering prospective data on patients and their diseases. For hospitalized patients, a variety of unanswered questions remain regarding the epidemiology of common diseases, the value of diagnostic tests, the impact of various therapies and treatment protocols, and the incremental value of new technologies, ranging from self‐monitoring to handheld ultrasound. High‐quality research may address the genetic epidemiology of why one person is admitted with pneumococcal pneumonia, whereas family members seem perfectly healthy; which patients with a particular diagnosis might be managed for different lengths of time in different settings; what physical findings or diagnostic tests best stratify prognosis; what new technologies are truly worth their cost; and especially, what therapies really work.
I do not dispute that hospital medicine researchers should try to improve the current use of interventions that are deemed to be valuable right now. But if that is all the field does, it will be a huge disappointment. Hospitalists should not be relegated to being adherence police who spend their collective research energy finding ways to force themselves to follow recommendations based on data gathered by others.
Hospital medicine researchers are uniquely positioned to discover new information that will change what should be done and help create the quality metrics for the future. Unless both of these two goalsimproving the implementation of today's knowledge and generating new and better knowledgeare part of the research agenda, we run the risk that some of the best minds in internal medicine may, when all is said and done, have spent an inordinate number of IQ hours on what, a century from now, will be reminiscent of improving the quality of bloodletting.
- . Bloodletting over the centuries. NY State J Med. 1980;80:2022–2028.
- . The death of George Washington: an end to the controversy? Am Surg. 2008;74:770–774.
- . The death of George Washington (1732–1799) and the history of cynanche. J Med Biogr. 2005;13:225–231.
- , . Hepcidin and the iron‐infection axis. Science. 2012;338:768–772.
- . Leech therapy: a history. J Hist Dent. 2005;53:25–27.
- . Pierre‐Charles‐Alexandre Louis and the evaluation of bloodletting. J R Soc Med. 2006;99:158–160.
- , . The Principles and Practice of Medicine. New York, NY: Appleton and Co.; 1920.
- Cecil RL, Kennedy F, eds. A Textbook of Medicine by American Authors. 1st ed. Philadelphia, PA: WB Saunders; 1927.
- Department of Health and Human Services. Hospital Compare: hospital process of care measures tables. Available at: http://www.hospitalcompare.hhs.gov/staticpages/for‐consumers/poc/explainations‐of‐measures.aspx. Accessed January 3, 2013.
- , , . Trends in the use of lipid‐lowering medications at discharge in patients with acute myocardial infarction: 1998 to 2006. Am Heart J. 2009;157:185–194.
- , , , et al. Guideline‐concordant therapy and reduced mortality and length of stay in adults with community‐acquired pneumonia: playing by the rules. Arch Intern Med. 2009;169:1525–1531.
- , , , et al. International consensus recommendations on the management of patients with nonvariceal upper gastrointestinal bleeding. Ann Intern Med. 2010;152:101–113.
- , . β‐blockers and reduction of cardiac events in noncardiac surgery. JAMA. 2002;287:1445–1447.
- , , , et al; POISE Study Group. Effects of extended‐release metoprolol succinate in patients undergoing non‐cardiac surgery (POISE trial): a randomised controlled trial. Lancet. 2008;371:1839–1847.
- , , , et al. Perioperative beta blockers in patients having non‐cardiac surgery: a meta‐analysis. Lancet. 2008;372:1962–1976.
- Report on the 2012 follow‐up investigation of possible breaches of academic integrity. Erasmus MC Follow‐up Investigation Committee, 2012. Available at: http://www.eramusmc.nl. . Accessed January 3, 2013.
- , , , et al. Rivaroxaban in patients with a recent acute coronary syndrome. N Engl J Med. 2012;366:9–19.
- , , , et al. Addition of clopidogrel to aspirin and fibrinolytic therapy for myocardial infarction with ST‐segment elevation. N Engl J Med. 2005;352:1179–1189.
- Acute Respiratory Distress Syndrome Network: ventilation with lower tidal volumes as compared with traditional tidal volumes for acute lung injury and the acute respiratory distress syndrome. N Engl J Med. 2000;342:1301–1308.
- The National Heart, Lung, and Blood Institute Acute Respiratory Distress Syndrome (ARDS) Clinical Trials Network: comparison of two fluid‐management strategies in acute lung injury. N Engl J Med. 2006;354:2564–2575.
Academic Hospitalist Balanced Scorecard
The field of hospital medicine, now the fastest growing specialty in medical history,[1] was born out of pressure to improve the efficiency and quality of clinical care in US hospitals.[2] Delivering safe and high‐value clinical care is a central goal of the field and has been an essential component of its growth and success.
The clinical demands on academic hospitalists have grown recently, fueled by the need to staff services previously covered by housestaff, whose hours are now restricted. Despite these new demands, expectations have grown in other arenas as well. Academic hospitalist groups (AHGs) are often expected to make significant contributions in quality improvement, patient safety, education, research, and administration. With broad expectations beyond clinical care, AHGs face unique challenges. Groups that focus mainly on providing coverage and improving clinical performance may find that they are unable to fully contribute in these other domains. To be successful, AHGs must develop strategies that balance their energies, resources, and performance.
The balanced scorecard (BSC) was introduced by Kaplan and Norton in 1992 to allow corporations to view their performance broadly, rather than narrowly focusing on financial measures. The BSC requires organizations to develop a balanced portfolio of performance metrics across 4 key perspectives: financial, customers, internal processes, and learning and growth. Metrics within these perspectives should help answer fundamental questions about the organization (Table 1).[3] Over time, the BSC evolved from a performance measurement tool to a strategic management system.[4] Successful organizations translate their mission and vision to specific strategic objectives in each of the 4 perspectives, delineate how these objectives will help the organization reach its vision with a strategy map,[5] and then utilize the BSC to track and monitor performance to ensure that the vision is achieved.[6]
| BSC Perspective | Traditional Questions[3] | Questions Revised for AHCs |
|---|---|---|
| ||
| Financial | How do we look to our shareholders? | What financial condition must we be in to allow us to accomplish our mission? |
| Customers | How do customers see us? | How do we ensure that our services and products add the level of value desired by our stakeholders? |
| Internal processes | What must we excel at? | How do we produce our products and services to add maximum value for our customers and stakeholders? |
| Learning and growth | How can we continue to improve and create value? | How do we ensure that we change and improve in order to achieve our vision? |
Although originally conceived for businesses, the BSC has found its way into the healthcare industry, with reports of successful implementation in organizations ranging from individual departments to research collaboratives[7] to national healthcare systems.[8] However, there are few reports of BSC implementation in academic health centers.[9, 10] Because most academic centers are not‐for‐profit, Zelman suggests that the 4 BSC perspectives be modified to better fit their unique characteristics (Table 1).[11] To the best of our knowledge, there is no literature describing the development of a BSC in an academic hospitalist group. In this article, we describe the development of, and early experiences with, an academic hospital medicine BSC developed as part of a strategic planning initiative.
METHODS
The University of California, San Francisco (UCSF) Division of Hospital Medicine (DHM) was established in 2005. Currently, there are more than 50 faculty members, having doubled in the last 4 years. In addition to staffing several housestaff and nonhousestaff clinical services, faculty are involved in a wide variety of nonclinical endeavors at local and national levels. They participate and lead initiatives in education, faculty development, patient safety, care efficiency, quality improvement, information technology, and global health. There is an active research enterprise that generates nearly $5 million in grant funding annually.
Needs Assessment
During a division retreat in 2009, faculty identified several areas in need of improvement, including: clinical care processes, educational promotion, faculty development, and work‐life balance. Based on these needs, divisional mission and vision statements were created (Table 2).
|
| Our mission: to provide the highest quality clinical care, education, research, and innovation in academic hospital medicine. |
| Our vision: to be the best division of hospital medicine by promoting excellence, integrity, innovation, and professional satisfaction among our faculty, trainees, and staff. |
Division leadership made it a priority to create a strategic plan to address these wide‐ranging issues. To accomplish this, we recognized the need to develop a formal way of translating our vision into specific and measurable objectives, establish systems of performance measurement, improve accountability, and effectively communicate these strategic goals to the group. Based on these needs, we set out to develop a divisional BSC.
Development
At the time of BSC development, the DHM was organized into 4 functional areas: quality and safety, education, faculty development, and academics and research. A task force was formed, comprised of 8 senior faculty representing these key areas. The mission and vision statements were used as the foundation for the development of division goals and objectives. The group was careful to choose objectives within each of the 4 BSC perspectives for academic centers, as defined by Zelman (Table 1). The taskforce then brainstormed specific metrics that would track performance within the 4 functional areas. The only stipulation during this process was that the metrics had to meet the following criteria:
- Important to the division and to the individual faculty members
- Measurable through either current or developed processes
- Data are valid and their validity trusted by the faculty members
- Amenable to improvement by faculty (ie, through their individual action they could impact the metric)
From the subsequent list of metrics, we used a modified Delphi method to rank‐order them by importance to arrive at our final set of metrics. Kaplan and Norton noted that focusing on a manageable number of metrics (ie, a handful in each BSC perspective) is important for an achievable strategic vision.[6] With the metrics chosen, we identified data sources or developed new systems to collect data for which there was no current source. We assigned individuals responsible for collecting and analyzing the data, identified local or national benchmarks, if available, and established performance targets for the coming year, when possible.
The BSC is updated quarterly, and results are presented to the division during a noon meeting and posted on the division website. Metrics are re‐evaluated on a yearly basis. They are continued, modified, or discarded depending on performance and/or changes in strategic priorities.
The initial BSC focused on division‐wide metrics and performance. Early efforts to develop the scorecard were framed as experimental, with no clear decision taken regarding how metrics might ultimately be used to improve performance (ie, how public to make both individual and group results, whether to tie bonus payments to performance).
RESULTS
There were 41 initial metrics considered by the division BSC task force (Table 3). Of these, 16 were chosen for the initial BSC through the modified Delphi method. Over the past 2 years, these initial metrics have been modified to reflect current strategic goals and objectives. Figure 1 illustrates the BSC for fiscal year (FY) 2012. An online version of this, complete with graphical representations of the data and metric definitions, can be found at
| Quality, Safety, and Operations | Education | Academics and Research | Faculty Development |
|---|---|---|---|
| |||
| Appropriate level of care | CME courses taught | Abstracts accepted | Attendance and participation |
| Billing and documentation | Curriculum development | Academic reputation | Being an agent of change |
| Clinical efficiency | Student/housestaff feedback | Grant funding | Division citizenship |
| Clinical professionalism | Mentoring | Mentorship | Job satisfaction |
| Communication | Quality of teaching rounds | Papers published | Mentorship |
| Core measures performance | Participation in national organizations | Committees and task forces | |
| Practice evidence‐based medicine | |||
| Fund of knowledge | |||
| Guideline adherence | |||
| Unplanned transfers to ICU | |||
| Implementation and initiation of projects | |||
| Length of stay | |||
| Medical errors | |||
| Mortality | |||
| Multidisciplinary approach to patient care | |||
| Multisource feedback evaluations | |||
| Never events | |||
| Patient‐centered care | |||
| Patient satisfaction | |||
| Practice‐based learning | |||
| Procedures | |||
| Readmissions | |||
| Reputation and expertise | |||
| Seeing patient on the day of admission | |||
| Quality of transfers of care | |||
DISCUSSION
Like many hospitalist groups, our division has experienced tremendous growth, both in our numbers and the breadth of roles that we fill. With this growth has come increasing expectations in multiple domains, competing priorities, and limited resources. We successfully developed a BSC as a tool to help our division reach its vision: balancing high quality clinical care, education, academics, and faculty development while maintaining a strong sense of community. We have found that the BSC has helped us meet several key goals.
The first goal was to allow for a broad view of our performance. This is the BSC's most basic function, and we saw immediate and tangible benefits. The scorecard provided a broad snapshot of our performance in a single place. For example, in the clinical domain, we saw that our direct cost per case was increasing despite our adjusted average length of stay remaining stable from FY2010‐FY2011. In academics and research, we saw that the number of abstracts accepted at national meetings increased by almost 30% in FY2011 (Figure 1).
The second goal was to create transparency and accountability. By measuring performance and displaying it on the division Web site, the BSC has promoted transparency. If performance does not meet our targets, the division as a whole becomes accountable. Leadership must understand why performance fell short and initiate changes to improve it. For instance, the rising direct cost per case has spurred the development of a high‐value care committee tasked with finding ways of reducing cost while providing high‐quality care.[12]
The third goal was to communicate goals and engage our faculty. As our division has grown, ensuring a shared vision among our entire faculty became an increasing challenge. The BSC functions as a communication platform between leadership and faculty, and yielded multiple benefits. As the metrics were born out of our mission and vision, the BSC has become a tangible representation of our core values. Moreover, individual faculty can see that they are part of a greater, high‐performing organization and realize they can impact the group's performance through their individual effort. For example, this has helped promote receptivity to carefully disseminated individual performance measures for billing and documentation, and patient satisfaction, in conjunction with faculty development in these areas.
The fourth goal was to ensure that we use data to guide strategic decisions. We felt that strategic decisions needed to be based on objective, rather than perceived or anecdotal, information. This meant translating our vision into measurable objectives that would drive performance improvement. For example, before the BSC, we were committed to the dissemination of our research and innovations. Yet, we quickly realized that we did not have a system to collect even basic data on academic performancea deficit we filled by leveraging information gathered from online databases and faculty curricula vitae. These data allowed us, for the first time, to objectively reflect on this as a strategic goal and to have an ongoing mechanism to monitor academic productivity.
Lessons Learned/Keys to Success
With our initial experience, we have gained insight that may be helpful to other AHGs considering implementing a BSC. First, and most importantly, AHGs should take the necessary time to build consensus and buy‐in. Particularly in areas where data are analyzed for the first time, faculty are often wary about the validity of the data or the purpose and utility of performance measurement. Faculty may be concerned about how collection of performance data could affect promotion or create a hostile and competitive work environment.
This concern grows when one moves from division‐wide to individual data. It is inevitable that the collection and dissemination of performance data will create some level of discomfort among faculty members, which can be a force for improvement or for angst. These issues should be anticipated, discussed, and actively managed. It is critical to be transparent with how data will be used. We have made clear that the transition from group to individual performance data, and from simple transparency to incentives, will be done thoughtfully and with tremendous input from our faculty. This tension can also be mitigated by choosing metrics that are internally driven, rather than determined by external groups (ie, following the principle that the measures should be important to the division and individual faculty members).
Next, the process of developing a mature BSC takes time. Much of our first year was spent developing systems for measurement, collecting data, and determining appropriate comparators and targets. The data in the first BSC functioned mainly as a baseline marker of performance. Some metrics, particularly in education and academics, had no national or local benchmarks. In these cases we identified comparable groups (such as other medical teaching services or other well‐established AHGs) or merely used our prior year's performance as a benchmark. Also, some of our metrics did not initially have performance targets. In most instances, this was because this was the first time that we looked at these data, and it was unclear what an appropriate target would be until more data became available.
Moving into our third year, we are seeing a natural evolution in the BSC's use. Some metrics that were initially chosen have been replaced or modified to reflect changing goals and priorities. Functional directors participate in choosing and developing performance metrics in their area. Previously, there was no formal structure for these groups to develop and measure strategic objectives and be accountable for performance improvement. They are now expected to define goals with measurable outcomes, to report progress to division leadership, and to develop their own scorecard to track performance. Each group chooses 2 to 4 metrics within their domain that are the most important for the division to improve on, which are then included in the division BSC.
We have also made efforts to build synergy between our BSC and performance goals set by external groups. Although continuing to favor metrics that are internally driven and meaningful to our faculty, we recognize that our goals must also reflect the needs and interests of broader stakeholders. For example, hand hygiene rates and patient satisfaction scores are UCSF medical center and divisional priorities (the former includes them in a financial incentive system for managers, staff, and many physicians) and are incorporated into the BSC as division‐wide incentive metrics.
Limitations
Our project has several limitations. It was conducted at a single institution, and our metrics may not be generalizable to other groups. However, the main goal of this article was not to focus on specific metrics but the process that we undertook to choose and develop them. Other institutions will likely identify different metrics based on their specific strategic objectives. We are also early in our experience with the BSC, and it is still not clear what effect it will have on the desired outcomes for our objectives. However, Henriksen recently reported that implementing a BSC at a large academic health center, in parallel with other performance improvement initiatives, resulted in substantial improvement in their chosen performance metrics.[13]
Despite the several years of development, we still view this as an early version of a BSC. To fully realize its benefits, an organization must choose metrics that will not simply measure performance but drive it. Our current BSC relies primarily on lagging measures, which show what our performance has been, and includes few leading metrics, which can predict trends in performance. As explained by Kaplan and Norton, this type of BSC risks skewing toward controlling rather than driving performance.[14] A mature BSC will include a mix of leading and lagging indicators, the combination illustrating a logical progression from measurement to performance. For instance, we measure total grant funding per year, which is a lagging indicator. However, to be most effective we could measure the percent of faculty who have attended grant‐writing workshops, the number of new grant sources identified, or the number of grant proposals submitted each quarter. These leading indicators would allow us to see performance trends that could be improved before the final outcome, total grant funding, is realized.
Finally, the issues surrounding the acceptability of this overall strategy will likely hinge on how we implement the more complex steps that relate to transparency, individual attribution, and perhaps ultimately incentives. Success in this area depends as much on culture as on strategy.
Next Steps
The next major step in the evolution of the BSC, and part of a broader faculty development program, will be the development of individual BSCs. They will be created using a similar methodology and allow faculty to reflect on their performance compared to peers and recognized benchmarks. Ideally, this will allow hospitalists in our group to establish personal strategic plans and monitor their performance over time. Individualizing these BSCs will be critical; although a research‐oriented faculty member might be striving for more than 5 publications and a large grant in a year, a clinician‐educator may seek outstanding teaching reviews and completion of a key quality improvement project. Both efforts need to be highly valued, and the divisional BSC should roll up these varied individual goals into a balanced whole.
In conclusion, we successfully developed and implemented a BSC to aid in strategic planning. The BSC ensures that we make strategic decisions using data, identify internally driven objectives, develop systems of performance measurement, and increase transparency and accountability. Our hope is that this description of the development of our BSC will be useful to other groups considering a similar endeavor.
Acknowledgments
The authors thank Noori Dhillon, Sadaf Akbaryar, Katie Quinn, Gerri Berg, and Maria Novelero for data collection and analysis. The authors also thank the faculty and staff who participated in the development process of the BSC.
Disclosure
Nothing to report.
- . The hospitalist field turns 15: new opportunities and challenges. J Hosp Med. 2011;6(4):E1–E4.
- , . The emerging role of “hospitalists” in the American health care system. N Engl J Med. 1996;335(7):514–517.
- , . The balanced scorecard—measures that drive performance. Harv Bus Rev. 1992;70(1):71–79.
- , . Using the balanced scorecard as a strategic management system. Harv Bus Rev. 1996;74(1):75–85.
- , . Having trouble with your strategy? Then map it. Harv Bus Rev. 2000;78:167–176, 202.
- , . Putting the balanced scorecard to work. Harv Bus Rev. 1993;71:134–147.
- , , , et al. Development and implementation of a performance measure tool in an academic pediatric research network. Contemp Clin Trials. 2010;31(5):429–437.
- , . Lives in the balance: an analysis of the balanced scorecard (BSC) in healthcare organizations. Int J Prod Perform Manag. 2007;57(1):6–21.
- , . The “Balanced Scorecard”: development and implementation in an academic clinical department. Acad Med. 1999;74(2):114–122.
- . Introducing a balanced scorecard management system in a university anesthesiology department. Anesth Analg. 2002;95(6):1731–1738, table of contents.
- , , , , . Issues for academic health centers to consider before implementing a balanced‐scorecard effort. Acad Med. 1999;74(12):1269–1277.
- , . Cents and sensitivity—teaching physicians to think about costs. N Engl J Med. 2012;367(2):99–101.
- , , , et al. 10‐year experience integrating strategic performance improvement initiatives: can the balanced scorecard, Six Sigma, and team training all thrive in a single hospital? In: Henriksen K, Battles JB, Keyes MA, Grady ML, eds. Advances in Patient Safety: New Directions and Alternative Approaches. Vol 3. Performance and Tools. Rockville, MD: Agency for Healthcare Research and Quality; 2008. Available at: http://www.ncbi.nlm.nih.gov/books/NBK43660. Accessed 15 June 2011.
- , . Linking the balanced scorecard to strategy. Calif Manage Rev. 1996;39(1):53–79.
The field of hospital medicine, now the fastest growing specialty in medical history,[1] was born out of pressure to improve the efficiency and quality of clinical care in US hospitals.[2] Delivering safe and high‐value clinical care is a central goal of the field and has been an essential component of its growth and success.
The clinical demands on academic hospitalists have grown recently, fueled by the need to staff services previously covered by housestaff, whose hours are now restricted. Despite these new demands, expectations have grown in other arenas as well. Academic hospitalist groups (AHGs) are often expected to make significant contributions in quality improvement, patient safety, education, research, and administration. With broad expectations beyond clinical care, AHGs face unique challenges. Groups that focus mainly on providing coverage and improving clinical performance may find that they are unable to fully contribute in these other domains. To be successful, AHGs must develop strategies that balance their energies, resources, and performance.
The balanced scorecard (BSC) was introduced by Kaplan and Norton in 1992 to allow corporations to view their performance broadly, rather than narrowly focusing on financial measures. The BSC requires organizations to develop a balanced portfolio of performance metrics across 4 key perspectives: financial, customers, internal processes, and learning and growth. Metrics within these perspectives should help answer fundamental questions about the organization (Table 1).[3] Over time, the BSC evolved from a performance measurement tool to a strategic management system.[4] Successful organizations translate their mission and vision to specific strategic objectives in each of the 4 perspectives, delineate how these objectives will help the organization reach its vision with a strategy map,[5] and then utilize the BSC to track and monitor performance to ensure that the vision is achieved.[6]
| BSC Perspective | Traditional Questions[3] | Questions Revised for AHCs |
|---|---|---|
| ||
| Financial | How do we look to our shareholders? | What financial condition must we be in to allow us to accomplish our mission? |
| Customers | How do customers see us? | How do we ensure that our services and products add the level of value desired by our stakeholders? |
| Internal processes | What must we excel at? | How do we produce our products and services to add maximum value for our customers and stakeholders? |
| Learning and growth | How can we continue to improve and create value? | How do we ensure that we change and improve in order to achieve our vision? |
Although originally conceived for businesses, the BSC has found its way into the healthcare industry, with reports of successful implementation in organizations ranging from individual departments to research collaboratives[7] to national healthcare systems.[8] However, there are few reports of BSC implementation in academic health centers.[9, 10] Because most academic centers are not‐for‐profit, Zelman suggests that the 4 BSC perspectives be modified to better fit their unique characteristics (Table 1).[11] To the best of our knowledge, there is no literature describing the development of a BSC in an academic hospitalist group. In this article, we describe the development of, and early experiences with, an academic hospital medicine BSC developed as part of a strategic planning initiative.
METHODS
The University of California, San Francisco (UCSF) Division of Hospital Medicine (DHM) was established in 2005. Currently, there are more than 50 faculty members, having doubled in the last 4 years. In addition to staffing several housestaff and nonhousestaff clinical services, faculty are involved in a wide variety of nonclinical endeavors at local and national levels. They participate and lead initiatives in education, faculty development, patient safety, care efficiency, quality improvement, information technology, and global health. There is an active research enterprise that generates nearly $5 million in grant funding annually.
Needs Assessment
During a division retreat in 2009, faculty identified several areas in need of improvement, including: clinical care processes, educational promotion, faculty development, and work‐life balance. Based on these needs, divisional mission and vision statements were created (Table 2).
|
| Our mission: to provide the highest quality clinical care, education, research, and innovation in academic hospital medicine. |
| Our vision: to be the best division of hospital medicine by promoting excellence, integrity, innovation, and professional satisfaction among our faculty, trainees, and staff. |
Division leadership made it a priority to create a strategic plan to address these wide‐ranging issues. To accomplish this, we recognized the need to develop a formal way of translating our vision into specific and measurable objectives, establish systems of performance measurement, improve accountability, and effectively communicate these strategic goals to the group. Based on these needs, we set out to develop a divisional BSC.
Development
At the time of BSC development, the DHM was organized into 4 functional areas: quality and safety, education, faculty development, and academics and research. A task force was formed, comprised of 8 senior faculty representing these key areas. The mission and vision statements were used as the foundation for the development of division goals and objectives. The group was careful to choose objectives within each of the 4 BSC perspectives for academic centers, as defined by Zelman (Table 1). The taskforce then brainstormed specific metrics that would track performance within the 4 functional areas. The only stipulation during this process was that the metrics had to meet the following criteria:
- Important to the division and to the individual faculty members
- Measurable through either current or developed processes
- Data are valid and their validity trusted by the faculty members
- Amenable to improvement by faculty (ie, through their individual action they could impact the metric)
From the subsequent list of metrics, we used a modified Delphi method to rank‐order them by importance to arrive at our final set of metrics. Kaplan and Norton noted that focusing on a manageable number of metrics (ie, a handful in each BSC perspective) is important for an achievable strategic vision.[6] With the metrics chosen, we identified data sources or developed new systems to collect data for which there was no current source. We assigned individuals responsible for collecting and analyzing the data, identified local or national benchmarks, if available, and established performance targets for the coming year, when possible.
The BSC is updated quarterly, and results are presented to the division during a noon meeting and posted on the division website. Metrics are re‐evaluated on a yearly basis. They are continued, modified, or discarded depending on performance and/or changes in strategic priorities.
The initial BSC focused on division‐wide metrics and performance. Early efforts to develop the scorecard were framed as experimental, with no clear decision taken regarding how metrics might ultimately be used to improve performance (ie, how public to make both individual and group results, whether to tie bonus payments to performance).
RESULTS
There were 41 initial metrics considered by the division BSC task force (Table 3). Of these, 16 were chosen for the initial BSC through the modified Delphi method. Over the past 2 years, these initial metrics have been modified to reflect current strategic goals and objectives. Figure 1 illustrates the BSC for fiscal year (FY) 2012. An online version of this, complete with graphical representations of the data and metric definitions, can be found at
| Quality, Safety, and Operations | Education | Academics and Research | Faculty Development |
|---|---|---|---|
| |||
| Appropriate level of care | CME courses taught | Abstracts accepted | Attendance and participation |
| Billing and documentation | Curriculum development | Academic reputation | Being an agent of change |
| Clinical efficiency | Student/housestaff feedback | Grant funding | Division citizenship |
| Clinical professionalism | Mentoring | Mentorship | Job satisfaction |
| Communication | Quality of teaching rounds | Papers published | Mentorship |
| Core measures performance | Participation in national organizations | Committees and task forces | |
| Practice evidence‐based medicine | |||
| Fund of knowledge | |||
| Guideline adherence | |||
| Unplanned transfers to ICU | |||
| Implementation and initiation of projects | |||
| Length of stay | |||
| Medical errors | |||
| Mortality | |||
| Multidisciplinary approach to patient care | |||
| Multisource feedback evaluations | |||
| Never events | |||
| Patient‐centered care | |||
| Patient satisfaction | |||
| Practice‐based learning | |||
| Procedures | |||
| Readmissions | |||
| Reputation and expertise | |||
| Seeing patient on the day of admission | |||
| Quality of transfers of care | |||
DISCUSSION
Like many hospitalist groups, our division has experienced tremendous growth, both in our numbers and the breadth of roles that we fill. With this growth has come increasing expectations in multiple domains, competing priorities, and limited resources. We successfully developed a BSC as a tool to help our division reach its vision: balancing high quality clinical care, education, academics, and faculty development while maintaining a strong sense of community. We have found that the BSC has helped us meet several key goals.
The first goal was to allow for a broad view of our performance. This is the BSC's most basic function, and we saw immediate and tangible benefits. The scorecard provided a broad snapshot of our performance in a single place. For example, in the clinical domain, we saw that our direct cost per case was increasing despite our adjusted average length of stay remaining stable from FY2010‐FY2011. In academics and research, we saw that the number of abstracts accepted at national meetings increased by almost 30% in FY2011 (Figure 1).
The second goal was to create transparency and accountability. By measuring performance and displaying it on the division Web site, the BSC has promoted transparency. If performance does not meet our targets, the division as a whole becomes accountable. Leadership must understand why performance fell short and initiate changes to improve it. For instance, the rising direct cost per case has spurred the development of a high‐value care committee tasked with finding ways of reducing cost while providing high‐quality care.[12]
The third goal was to communicate goals and engage our faculty. As our division has grown, ensuring a shared vision among our entire faculty became an increasing challenge. The BSC functions as a communication platform between leadership and faculty, and yielded multiple benefits. As the metrics were born out of our mission and vision, the BSC has become a tangible representation of our core values. Moreover, individual faculty can see that they are part of a greater, high‐performing organization and realize they can impact the group's performance through their individual effort. For example, this has helped promote receptivity to carefully disseminated individual performance measures for billing and documentation, and patient satisfaction, in conjunction with faculty development in these areas.
The fourth goal was to ensure that we use data to guide strategic decisions. We felt that strategic decisions needed to be based on objective, rather than perceived or anecdotal, information. This meant translating our vision into measurable objectives that would drive performance improvement. For example, before the BSC, we were committed to the dissemination of our research and innovations. Yet, we quickly realized that we did not have a system to collect even basic data on academic performancea deficit we filled by leveraging information gathered from online databases and faculty curricula vitae. These data allowed us, for the first time, to objectively reflect on this as a strategic goal and to have an ongoing mechanism to monitor academic productivity.
Lessons Learned/Keys to Success
With our initial experience, we have gained insight that may be helpful to other AHGs considering implementing a BSC. First, and most importantly, AHGs should take the necessary time to build consensus and buy‐in. Particularly in areas where data are analyzed for the first time, faculty are often wary about the validity of the data or the purpose and utility of performance measurement. Faculty may be concerned about how collection of performance data could affect promotion or create a hostile and competitive work environment.
This concern grows when one moves from division‐wide to individual data. It is inevitable that the collection and dissemination of performance data will create some level of discomfort among faculty members, which can be a force for improvement or for angst. These issues should be anticipated, discussed, and actively managed. It is critical to be transparent with how data will be used. We have made clear that the transition from group to individual performance data, and from simple transparency to incentives, will be done thoughtfully and with tremendous input from our faculty. This tension can also be mitigated by choosing metrics that are internally driven, rather than determined by external groups (ie, following the principle that the measures should be important to the division and individual faculty members).
Next, the process of developing a mature BSC takes time. Much of our first year was spent developing systems for measurement, collecting data, and determining appropriate comparators and targets. The data in the first BSC functioned mainly as a baseline marker of performance. Some metrics, particularly in education and academics, had no national or local benchmarks. In these cases we identified comparable groups (such as other medical teaching services or other well‐established AHGs) or merely used our prior year's performance as a benchmark. Also, some of our metrics did not initially have performance targets. In most instances, this was because this was the first time that we looked at these data, and it was unclear what an appropriate target would be until more data became available.
Moving into our third year, we are seeing a natural evolution in the BSC's use. Some metrics that were initially chosen have been replaced or modified to reflect changing goals and priorities. Functional directors participate in choosing and developing performance metrics in their area. Previously, there was no formal structure for these groups to develop and measure strategic objectives and be accountable for performance improvement. They are now expected to define goals with measurable outcomes, to report progress to division leadership, and to develop their own scorecard to track performance. Each group chooses 2 to 4 metrics within their domain that are the most important for the division to improve on, which are then included in the division BSC.
We have also made efforts to build synergy between our BSC and performance goals set by external groups. Although continuing to favor metrics that are internally driven and meaningful to our faculty, we recognize that our goals must also reflect the needs and interests of broader stakeholders. For example, hand hygiene rates and patient satisfaction scores are UCSF medical center and divisional priorities (the former includes them in a financial incentive system for managers, staff, and many physicians) and are incorporated into the BSC as division‐wide incentive metrics.
Limitations
Our project has several limitations. It was conducted at a single institution, and our metrics may not be generalizable to other groups. However, the main goal of this article was not to focus on specific metrics but the process that we undertook to choose and develop them. Other institutions will likely identify different metrics based on their specific strategic objectives. We are also early in our experience with the BSC, and it is still not clear what effect it will have on the desired outcomes for our objectives. However, Henriksen recently reported that implementing a BSC at a large academic health center, in parallel with other performance improvement initiatives, resulted in substantial improvement in their chosen performance metrics.[13]
Despite the several years of development, we still view this as an early version of a BSC. To fully realize its benefits, an organization must choose metrics that will not simply measure performance but drive it. Our current BSC relies primarily on lagging measures, which show what our performance has been, and includes few leading metrics, which can predict trends in performance. As explained by Kaplan and Norton, this type of BSC risks skewing toward controlling rather than driving performance.[14] A mature BSC will include a mix of leading and lagging indicators, the combination illustrating a logical progression from measurement to performance. For instance, we measure total grant funding per year, which is a lagging indicator. However, to be most effective we could measure the percent of faculty who have attended grant‐writing workshops, the number of new grant sources identified, or the number of grant proposals submitted each quarter. These leading indicators would allow us to see performance trends that could be improved before the final outcome, total grant funding, is realized.
Finally, the issues surrounding the acceptability of this overall strategy will likely hinge on how we implement the more complex steps that relate to transparency, individual attribution, and perhaps ultimately incentives. Success in this area depends as much on culture as on strategy.
Next Steps
The next major step in the evolution of the BSC, and part of a broader faculty development program, will be the development of individual BSCs. They will be created using a similar methodology and allow faculty to reflect on their performance compared to peers and recognized benchmarks. Ideally, this will allow hospitalists in our group to establish personal strategic plans and monitor their performance over time. Individualizing these BSCs will be critical; although a research‐oriented faculty member might be striving for more than 5 publications and a large grant in a year, a clinician‐educator may seek outstanding teaching reviews and completion of a key quality improvement project. Both efforts need to be highly valued, and the divisional BSC should roll up these varied individual goals into a balanced whole.
In conclusion, we successfully developed and implemented a BSC to aid in strategic planning. The BSC ensures that we make strategic decisions using data, identify internally driven objectives, develop systems of performance measurement, and increase transparency and accountability. Our hope is that this description of the development of our BSC will be useful to other groups considering a similar endeavor.
Acknowledgments
The authors thank Noori Dhillon, Sadaf Akbaryar, Katie Quinn, Gerri Berg, and Maria Novelero for data collection and analysis. The authors also thank the faculty and staff who participated in the development process of the BSC.
Disclosure
Nothing to report.
- . The hospitalist field turns 15: new opportunities and challenges. J Hosp Med. 2011;6(4):E1–E4.
- , . The emerging role of “hospitalists” in the American health care system. N Engl J Med. 1996;335(7):514–517.
- , . The balanced scorecard—measures that drive performance. Harv Bus Rev. 1992;70(1):71–79.
- , . Using the balanced scorecard as a strategic management system. Harv Bus Rev. 1996;74(1):75–85.
- , . Having trouble with your strategy? Then map it. Harv Bus Rev. 2000;78:167–176, 202.
- , . Putting the balanced scorecard to work. Harv Bus Rev. 1993;71:134–147.
- , , , et al. Development and implementation of a performance measure tool in an academic pediatric research network. Contemp Clin Trials. 2010;31(5):429–437.
- , . Lives in the balance: an analysis of the balanced scorecard (BSC) in healthcare organizations. Int J Prod Perform Manag. 2007;57(1):6–21.
- , . The “Balanced Scorecard”: development and implementation in an academic clinical department. Acad Med. 1999;74(2):114–122.
- . Introducing a balanced scorecard management system in a university anesthesiology department. Anesth Analg. 2002;95(6):1731–1738, table of contents.
- , , , , . Issues for academic health centers to consider before implementing a balanced‐scorecard effort. Acad Med. 1999;74(12):1269–1277.
- , . Cents and sensitivity—teaching physicians to think about costs. N Engl J Med. 2012;367(2):99–101.
- , , , et al. 10‐year experience integrating strategic performance improvement initiatives: can the balanced scorecard, Six Sigma, and team training all thrive in a single hospital? In: Henriksen K, Battles JB, Keyes MA, Grady ML, eds. Advances in Patient Safety: New Directions and Alternative Approaches. Vol 3. Performance and Tools. Rockville, MD: Agency for Healthcare Research and Quality; 2008. Available at: http://www.ncbi.nlm.nih.gov/books/NBK43660. Accessed 15 June 2011.
- , . Linking the balanced scorecard to strategy. Calif Manage Rev. 1996;39(1):53–79.

Training a Hospitalist Workforce
DEVELOPMENT OF THE POSITION PAPER
In June of 2011, the executive leadership of the Society of Critical Care Medicine (SCCM) and the Society of Hospital Medicine (SHM) convened a daylong summit to discuss intensive care unit (ICU) workforce issues as they affect intensivists and hospitalists. Attendees included the executive leadership of both societies and invited participants with cross‐disciplinary expertise in hospital medicine and critical care medicine.0
| Pathway | Prerequisites | Duration | Minimum Clinical Training Requirements | Research Requirement |
|---|---|---|---|---|
| ||||
| Medical critical care39 | Complete a 3‐yr internal medicine program | 24 mo for general internists 12 mo for internists who are enrolled in, or have completed, an accredited 2‐yr IM fellowship | 6 mo MICU | Research required; no duration is stipulated |
| 3 mo other ICU | Research requirement waived for 1‐yr fellows | |||
| 3 mo elective (determined by individual program) | ||||
| Pulmonary critical care40 | Complete a 3‐yr internal medicine program | 36 mo | 9 mo of critical care (identical to medical critical care) | Research required, but duration not specified; generally 1218 mo |
| 9 mo of pulmonary medicine | ||||
| 6 mo of relevant electives encouraged | ||||
| 30 mo of pulmonary clinic | ||||
| Surgical critical care41, 42 | Complete at least 3 yr of training in general surgery, neurosurgery, urology, or OB/GYN | 12 mo | 8 mo in SICU | No research requirement |
| 2 mo in other ICUs | ||||
| 2 mo in relevant non‐ICU electives | ||||
| Anesthesiology critical care43 | Complete a 4‐yr anesthesiology program | 12 mo | 9 mo in ICU | No research requirement |
| 3 mo in clinical activities or research relevant to critical care | ||||
| Emergency medicine critical care | Complete an emergency medicine program and maintain ABEM board certification | 24 mo | 6 mo MICU | Research required; no duration is stipulated |
| 3 mo other ICU | ||||
| 3 mo elective (determined by individual program) | ||||
| Pediatric critical care | Complete a pediatrics or anesthesiology program | 36 mo | At least 12 mo of relevant clinical rotations; no other specifications | At least 12 mo of research |
The summit was convened to address the following issues:
-
Defining hospitalists' roles in providing ICU coverage in the presence or absence of intensivists.
-
Developing standardized and universally recognized supplementary training pathways for hospitalists who practice in the ICU.
-
Identifying clinical, logistical, and political barriers that might impair or preclude such training.
At the close of the summit, the executive leadership of both societies agreed that they had sufficient consensus on the aforementioned issues to delegate a subgroup of participants to formulate a position paper. The authors of the position paper were selected based upon their diverse professional experience, senior leadership in both SHM and SCCM, and their cross‐disciplinary expertise in hospital medicine and critical care medicine. Four of the 5 authors (E.M.S., J.R.D., M.J.G., P.A.L.) are board‐certified intensivists. Three (E.M.S., J.R.D., M.J.G.) are members of both SCCM and SHM, 2 (M.J.G., J.R.D.) are Past‐Presidents of SHM, and 1 (P.A.L.) is Immediate Past‐President of SCCM. E.M.S. and D.D.D. are current members of the SHM Board of Directors.
After the summit, the authors held several conference calls to review the structure and content of the position paper. The boards of directors of both societies independently approved a draft of the paper and the executive leadership of both societies approved subsequent revisions. The position paper was submitted for joint publication in the Journal of Hospital Medicine and Critical Care Medicine and underwent formal peer‐review by reviewers representing both societies.
INTRODUCTION
The growing shortage of intensivists and its implications for hospitalized Americans is well documented and remains an ongoing concern for hospitals, clinicians, payers, and the federal government.17 Despite numerous recommendations that intensivists manage critically ill adults,8, 9 most American hospitals cannot and will not meet this proposed standard.10, 11 When surveyed, only 20% of Michigan hospitals participating in the Keystone Project responded that they staffed their ICUs exclusively with board‐certified intensivists, and 75% maintained open ICU staffing models.12 The mismatch between intensivist supply and demand is expected to worsen as inpatient volume and acuity grow in concert with an aging and increasingly comorbid American population, yet with the exception of a 2010 agreement between the American Board of Internal Medicine (ABIM) and American Board of Emergency Medicine (ABEM) to cosponsor a medical critical care fellowship pathway for emergency medicine (EM) physicians, little has changed to expand the intensivist trainee pipeline. Although the addition of a sanctioned EM critical care pathway is a positive development, it is unlikely to significantly impact the intensivist shortage in the near term. Between 2000 and 2007, 43 emergency medicine physicians entered non‐board sanctioned American critical care fellowships,13 while in the 20112012 academic year, 1957 trainees are enrolled in adult critical care medicine fellowships (surgery, anesthesia, medical critical care, and pulmonary/critical care).14 It remains to be seen if the availability of a formal critical care pathway will significantly increase the numbers of emergency medicine physicians who pursue critical care training.
The growing intensivist shortage has coincided with the appearance of hospitalists, physicians who focus on the care of hospitalized medical patients, on the healthcare landscape.15 Increasing from 2000 to 34,000 practitioners in 15 years, hospital medicine is the fastest growing specialty in organized medicine, with an estimated plateau of as many as 50,000 practitioners.16 As of 2009, hospitalists were present in 89% of hospitals with over 200 beds, largely replacing primary care physicians as the managers of ICU patients in non‐tertiary hospital settings.16 In surveys performed by the Society of Hospital Medicine, 75% of hospitalists reported that they practice in the ICU, often shouldering much of the responsibility for managing critically ill patients.17 In 37.5% of Michigan Keystone Project hospitals, hospitalists served as attending physicians of record in the ICU.10 Although legitimate concerns have been raised about whether hospitalists are uniformly qualified to practice in the ICU, this issue has become moot at many hospitals where intensivists are either in short supply or entirely absent.1821 As previously noted by Heisler,22 the issue is no longer whether hospitalists should practice in the ICU, but rather to ensure that they do so safely, effectively, and seamlessly in collaboration with intensivists, or independently when intensivists are unavailable.
POTENTIAL VALUE OF HOSPITALISTS IN THE ICU
Hospital medicine and critical care medicine share similar competencies and values. Eighty‐five percent of practicing hospitalists are internists, who have historically been well trained to manage acutely ill hospitalized patients. Categorical internal medicine (IM) training emphasizes acute inpatient medicine, with residents spending approximately two‐thirds of their training time in the hospital. Many of the cognitive skills required for practicing critical care medicine are encompassed in categorical IM training, as well as in the Core Competencies in Hospital Medicine.23, 24 Furthermore, hospitalist staffing models are specifically adapted to meet the needs of acutely ill patients. With their consistent presence in the hospital (many programs provide 24:7 in‐house coverage), hospitalists see patients several times a day if necessary and can respond to their acute needs in real time. In many institutions, hospitalists are tasked as first responders to in‐house emergencies, often covering ICUs when intensivists are unavailable.
Most importantly, hospital medicine and critical care medicine are philosophically aligned. Both disciplines are defined by their location of practice rather than by an organ system or constellation of diseases. Both specialties embrace hospital‐based process improvement, lead multidisciplinary teams, and champion quality and safety initiatives.23, 25 Hospitalists and intensivists routinely collaborate to improve hospital care through shared protocol implementation, patient throughput management, and quality improvement initiatives. The ideology and mechanics of high‐performing hospitalist and intensivist programs are extremely similar.
LIMITATIONS OF HOSPITALISTS IN ICUs
Although the majority of hospitalists are general internists, individual hospitalists' skills may be heterogeneous, reflecting differences in training and clinical practice experience prior to becoming hospitalists. A hospitalist entering practice directly from a rigorous categorical IM training program will likely have different skills and knowledge than an ambulatory‐based general internist who makes a mid‐career switch to hospital medicine. Furthermore, increasingly stringent restrictions on housestaff work hours and patient loads, coupled with increasing emphasis on ambulatory medicine, have substantially decreased IM residents' cumulative exposure to acutely ill inpatients and inpatient procedures, raising concerns that the current generation of IM residents are less well‐prepared to manage ICU patients than their predecessors. The growing prevalence of family practitioners in the adult hospitalist workforce (currently estimated at 6%8%), who generally are not as rigorously or comprehensively trained in critical care medicine as internists, further complicates efforts to broadly categorize adult hospitalists' ICU skills.26, 27
Once hospitalists enter the workforce, they have few formal opportunities to significantly advance their critical care knowledge and skills. Existing critical care educational offerings are generally limited to 1‐ or 2‐day critical care refresher courses or narrowly focused ICU skills courses, such as acute airway management or critical care ultrasonography. These courses, while valuable, are often insufficient for hospitalists who need to broaden their general critical care knowledge base or obtain skills that they did not acquire in residency training. The result is a hospitalist workforce that practices in the ICU but has limited opportunity to enhance the skills and knowledge necessary to do so safely and competently.
ENHANCING HOSPITALISTS' SKILLS TO PROVIDE CRITICAL CARE SERVICES
In the absence of a systemic solution to the intensivist shortage, the healthcare marketplace is independently developing alternative critical care delivery solutions, such as deploying telemedicine systems and expanding the roles of nurse practitioners and physician assistants in the ICU. To a lesser extent, there have been calls for hospitalists to fill similar intensivist extender roles in the ICU, and Heisler and others have suggested developing limited, competency‐based critical care training to allow hospitalists to manage a subset of ICU patients, either independently or collaboratively with intensivists.22 Several healthcare systems are in various stages of developing such critical care training programs for their hospitalists, many of whom already practice in the ICU. These programs will likely blend fellowship‐level training with supervised attending duties in the ICU, with the expectation that graduates will be able to independently manage a portion of an ICU population (Timothy G. Buchman, MD, PhD, Department of Surgery, Emory University School of Medicine, personal communication, May 11, 2011).
Although informal hospitalist training programs could make an important contribution to ICU staffing, they raise new concerns as well. In the absence of uniform, formal training and evaluation standards, the quality and consistency of these homegrown programs could vary widely, with participants developing critical care skills and competencies that might not conform to requirements set forth by the Accreditation Council for Graduate Medical Education (ACGME). Even if training could be standardized, the practical implementation of a 2‐tier intensivist model would create extreme political and operational challenges for hospitals, which would be required to differentially credential and privilege providers with similar training and overlapping patient responsibilities. In light of these complexities and uncertainties, hospitalists might be unwilling to risk investing in lengthy training offering uncertain recognition and delineation of what they can and cannot do in the ICU.
A more durable long‐term solution is to create an ACGME‐sanctioned and accredited critical care certification pathway for IM hospitalists, with the express goal of expanding the intensivist workforce by attracting practicing hospitalists to critical care fellowship training. Hospitalists who complete such training would be full‐fledged intensivists, subject to the same privileges and expectations as any other intensivist.
We believe that many hospitalists could acquire the competencies necessary to become board‐eligible intensivists in less than the 2 years currently required for general internists to complete critical care medicine training. The existence of 6 unique pathways for critical care training and board certification in the United States, all maintaining unique training criteria and durations of training, strongly suggests that competent intensivists can be trained through disparate pathways to achieve equivalent outcomes (Table 1). For example, both surgical and anesthesia critical care programs require only a single added year of training following their respective residency training programs.28, 29 Of the 24 months that comprise a medical critical care fellowship, only 12 months of clinical duties are required, with the remainder allocated to electives, quality‐improvement initiatives, research, and other academic pursuits.30 The ACGME and ABIM have tacitly acknowledged that medical critical care training is achievable in less than 2 years, by allowing those who enter or complete accredited 2‐year fellowships in other medical specialties to obtain critical care certification with a single additional year of critical care training.30 If infectious disease and nephrology fellows can become competent intensivists with a single year of critical care training, it is reasonable to believe that experienced IM hospitalists can do so as well.
Offering a 1‐year critical care fellowship training track for experienced IM hospitalists will require careful consideration of which components of existing 2‐year critical care fellowship can be removed or condensed without materially compromising the quality of training. Hospitalists participating in a condensed 1‐year training program would need the maturity and experience to hit the ground running, mandating a robust entry bar predicated upon relevant prior clinical practice experience. We believe that 3 sequential years of prior hospitalist practice experience is a reasonable prerequisite for participation. Additionally, eligible hospitalists would need to participate in the (currently voluntary) ABIM Focused Practice in Hospital Medicine Maintenance of Certification (MOC) process,31 which mandates completion of hospital‐based education and practice improvement modules. Prior training and participation in quality improvement (QI) processes could supplant some of the scholarly activity that is currently expected during the nonclinical portion of a traditional 2‐year medical critical care fellowship, and candidates would be required to have completed at least one meaningful hospital‐based QI initiative while still in practice.
Although new curricular standards would need to be developed, 1‐year medical intensivist fellowships could coexist alongside 2‐year fellowships within a single critical care training program, as is the case when internal medicine fellows in other specialties complete an added year of critical care fellowship. However, to meaningfully impact the intensivist shortage, the number and capacity of medical critical care fellowships, which currently train approximately 10% of the critical care workforce, would need to significantly expand.13
Importantly, the impact that critical care‐trained hospitalists will have on the quality and safety of patient care in the ICU will require evaluation and study. We presume that inserting this new cohort of intensivists into previously unmanaged or undermanaged ICUs will improve care, but this, like many other uncertainties regarding optimal models of ICU staffing, should be subject to rigorous and objective examination through additional clinical research.10, 3236
Offering a 1‐year critical care training track will raise new challenges. Skepticism about the rigor and content of 1‐year programs may foster the perception that graduates are inadequately trained or skilled to function at the level of other board‐certified intensivists. It is also possible that a 1‐year hospitalistcritical care fellowship could divert trainees from traditional critical care programs, offsetting net gains in the number of intensivists. However, we suspect that a 1‐year fellowship program will attract primarily practicing hospitalists, while 2‐year tracks will continue to attract IM residents. We conceptualize participation in a 1‐year hospitalistcritical care fellowship program as a (minimum) 4‐year post‐residency commitment, consisting of at least 3 years of clinical practice as a hospitalist, followed by 1 year of critical care fellowship training. Internal medicine residents would find a shorter pathway to intensivist practice by enrolling in traditional 2‐year critical care or even 3‐year pulmonary/critical care training programs. The compensation advantage afforded to intensivists relative to hospitalists (approximately $100,000 per year) would offset any financial advantage gained by shaving a year off of critical care fellowship training.37, 38 We also suspect that those seeking careers in academic medicine would almost exclusively opt for a traditional 2‐year training pathway.
Finally, while Europe and Australia offer a single common pathway to critical care certification, the United States maintains multiple, independent, specialty‐specific training pathways, each with unique durations, requirements, and certification processes. Although consideration of this important issue is beyond the scope of this paper, we believe that developing a hospitalist‐intensivist workforce should be part of a broader initiative to reform critical care training to better meet the demand for intensivists across the spectrum of American ICUs. Adopting a global intensivist training strategy that is specialty‐independent and specific to critical care medicine may result in a more consistent, collaborative, and interoperable critical care workforce.
CONCLUSION
American critical care training programs have failed to produce enough intensivists to meet demand, and this mismatch between supply and demand will substantially worsen over upcoming decades. Hospitals and healthcare systems, faced with the mandate to provide care for their ICU populations, have already innovated to offset this shortage through the use of telemedicine and the extension of nonphysician providers into ICUs. As the gap between intensivist supply and demand widens, healthcare systems will be increasingly likely to pursue more radical solutions, up to and including independently training their own critical care workforces. We believe that there are better alternatives.
Hospitalists have rapidly proliferated to become the dominant provider of inpatient medical care in American hospitals and are already providing a substantial amount of critical care. As such, they remain a largely untapped and potentially significant source of new intensivists. The skills, competencies, and values embodied in hospital medicine are already highly congruent with those of critical care. By virtue of their numbers and penetrance into the vast majority of large American hospitals, hospitalists are well situated to make a substantial impact on the intensivist shortage. If only 5% of the projected hospitalist workforce were to receive the critical care training that we propose, 2500 new intensivists would enter the critical care workforce, substantially decreasing the impact of the national intensivist shortage.12
Internal medicine hospitalists who obtain additional training as intensivists would also bring new capabilities and flexibility to hospitals seeking to implement intensivist programs. In smaller hospitals that cannot support freestanding intensivist programs, hospitalist‐intensivists might divide their time between ICU and ward duties. In larger hospitals, these clinicians might function exclusively as intensivists alongside their traditionally trained peers. Whether they affiliate as hospitalists, intensivists, or something else entirely will largely depend upon the roles that they fulfill, the governance of their institutions, and the departments that most effectively meet their clinical and organizational needs.
Bringing qualified hospitalists into the critical care workforce through rigorous sanctioned and accredited 1‐year training programs, will open a new intensivist training pipeline and potentially offer more critically ill patients the benefit of providers who are unequivocally qualified to care for them. Similarly, unification of critical care training and certification across disciplines will better focus efforts to expand the intensivist workforce, more efficiently leverage limited training resources, and facilitate standardization of critical care skills, policies, and procedures across the nation's ICUs. Although moving this agenda forward may be logistically challenging and politically daunting, we believe that the results will be worth the effort.
Acknowledgements
Disclosure: All authors disclose no relevant or financial conflicts of interest. This position paper also published in Critical Care Medicine. (Siegal EM, Dressler DD, Dichter JR, Gorman MJ, Lipsett PA. Training a Hospitalist Workforce to Address the Intensivist Shortage in American Hospitals: A Position Paper From the Society of Hospital Medicine and the Society of Critical Care Medicine. Crit Care Med. 2012;40(6):19521956).
- ,,,,.Current and projected workforce requirements for care of the critically ill and patients with pulmonary disease: can we meet the requirements of an aging population?JAMA.2000;284(21):2762–2770.
- Health Resources and Services Administration report to Congress: the critical care workforce: a study of the supply and demand for critical care physicians. Available at: http://www.bhpr.hrsa.gov/healthworkforce/reports/criticalcare/default.htm. Accessed April 24,2011.
- ,,, et al.The critical care crisis in the United States: a report from the profession.Chest.2004;125(4):1514–1517.
- ,,,,,.The critical care medicine crisis: a call for federal action. A white paper from the critical care professional societies.Chest.2004;125(4):1518–1521.
- .Critical care workforce.Crit Care Med.2008;36(4):1350–1353.
- .Critical care workforce crisis: time to look in the mirror.Crit Care Med.2008;36(4):1385–1386.
- ,,, et al.Prioritizing the organization and management of intensive care services in the Unites States: the PrOMIS conference.Crit Care Med.2007;35:1103–1111.
- ,,,,.Association between ICU physician staffing and outcomes: a systematic review.Crit Care Med.1999;27:A43.
- The Leapfrog Group Factsheet. ICU Physician Staffing (IPS). Available at: http://www.leapfroggroup.org/media/file/FactSheet_IPS.pdf. Accessed November 20,2011.
- ,,,,,.Physician staffing patterns and clinical outcomes in critically ill patients: a systematic review.JAMA.2002;288(17):2151–2162.
- ,,,,,.Association between critical care physician management and patient mortality in the intensive care unit.Ann Intern Med.2008;148(11):801–809.
- ,,, et al.Characteristics of intensive care units in Michigan: not an open and closed case.J Hosp Med.2010;5(1):4–9.
- ,,.Current practice, demographics and trends of critical care trained emergency physicians in the United States.Acad Emer Med.2010;17:325–329.
- List of ACGME Accredited Programs and Sponsoring Institutions. Available at: http://www.acgme.org/adspublic. Accessed February 22,2012.
- ,.The emerging role of “hospitalists” in the American health care system.N Engl J Med.1996;335:514–517.
- American Hospital Association.2009 Annual Survey.Chicago, IL:American Hospital Association;2009.
- 2005–2006 Society of Hospital Medicine Compensation and Productivity Survey. Available at: http://www.hospitalmedicine.org/AM/Template.cfm?Section=Surveys24(4):2–3.
- .Hospitalists in the intensive care unit: an intensivist perspective.The Hospitalist.1999;3(4):5.
- .The new intensivists.The Hospitalist. October2008.
- .Intensive care unit staffing: an academic debate but a community crisis.Crit Care Med.2012;40(3):1032.
- .Hospitalists and intensivists: partners in caring for the critically ill—the time has come.J Hosp Med.2010;5:1–3.
- ,,,,.The core competencies in hospital medicine: a framework for curriculum development.J Hosp Med.2006;1(suppl 1):2–95.
- ,,,,.The core competencies in hospital medicine: development and methodology.J Hosp Med.2006;1:48–56.
- ,,, et al.An intervention to decrease catheter‐related bloodstream infections in the ICU.N Engl J Med.2006;355:2725–2732.
- ACGME Internal Medicine Program Requirements. Available at: http://www.acgme.org/acwebsite/rrc_140/140_prindex.asp. Accessed November 20,2011.
- ACGME Program Requirements for Resident Education in Internal Medicine. Available at: http://www.acgme.org/acWebsite/reviewComment/140_internal_medicine_PRs_R
DEVELOPMENT OF THE POSITION PAPER
In June of 2011, the executive leadership of the Society of Critical Care Medicine (SCCM) and the Society of Hospital Medicine (SHM) convened a daylong summit to discuss intensive care unit (ICU) workforce issues as they affect intensivists and hospitalists. Attendees included the executive leadership of both societies and invited participants with cross‐disciplinary expertise in hospital medicine and critical care medicine.0
| Pathway | Prerequisites | Duration | Minimum Clinical Training Requirements | Research Requirement |
|---|---|---|---|---|
| ||||
| Medical critical care39 | Complete a 3‐yr internal medicine program | 24 mo for general internists 12 mo for internists who are enrolled in, or have completed, an accredited 2‐yr IM fellowship | 6 mo MICU | Research required; no duration is stipulated |
| 3 mo other ICU | Research requirement waived for 1‐yr fellows | |||
| 3 mo elective (determined by individual program) | ||||
| Pulmonary critical care40 | Complete a 3‐yr internal medicine program | 36 mo | 9 mo of critical care (identical to medical critical care) | Research required, but duration not specified; generally 1218 mo |
| 9 mo of pulmonary medicine | ||||
| 6 mo of relevant electives encouraged | ||||
| 30 mo of pulmonary clinic | ||||
| Surgical critical care41, 42 | Complete at least 3 yr of training in general surgery, neurosurgery, urology, or OB/GYN | 12 mo | 8 mo in SICU | No research requirement |
| 2 mo in other ICUs | ||||
| 2 mo in relevant non‐ICU electives | ||||
| Anesthesiology critical care43 | Complete a 4‐yr anesthesiology program | 12 mo | 9 mo in ICU | No research requirement |
| 3 mo in clinical activities or research relevant to critical care | ||||
| Emergency medicine critical care | Complete an emergency medicine program and maintain ABEM board certification | 24 mo | 6 mo MICU | Research required; no duration is stipulated |
| 3 mo other ICU | ||||
| 3 mo elective (determined by individual program) | ||||
| Pediatric critical care | Complete a pediatrics or anesthesiology program | 36 mo | At least 12 mo of relevant clinical rotations; no other specifications | At least 12 mo of research |
The summit was convened to address the following issues:
-
Defining hospitalists' roles in providing ICU coverage in the presence or absence of intensivists.
-
Developing standardized and universally recognized supplementary training pathways for hospitalists who practice in the ICU.
-
Identifying clinical, logistical, and political barriers that might impair or preclude such training.
At the close of the summit, the executive leadership of both societies agreed that they had sufficient consensus on the aforementioned issues to delegate a subgroup of participants to formulate a position paper. The authors of the position paper were selected based upon their diverse professional experience, senior leadership in both SHM and SCCM, and their cross‐disciplinary expertise in hospital medicine and critical care medicine. Four of the 5 authors (E.M.S., J.R.D., M.J.G., P.A.L.) are board‐certified intensivists. Three (E.M.S., J.R.D., M.J.G.) are members of both SCCM and SHM, 2 (M.J.G., J.R.D.) are Past‐Presidents of SHM, and 1 (P.A.L.) is Immediate Past‐President of SCCM. E.M.S. and D.D.D. are current members of the SHM Board of Directors.
After the summit, the authors held several conference calls to review the structure and content of the position paper. The boards of directors of both societies independently approved a draft of the paper and the executive leadership of both societies approved subsequent revisions. The position paper was submitted for joint publication in the Journal of Hospital Medicine and Critical Care Medicine and underwent formal peer‐review by reviewers representing both societies.
INTRODUCTION
The growing shortage of intensivists and its implications for hospitalized Americans is well documented and remains an ongoing concern for hospitals, clinicians, payers, and the federal government.17 Despite numerous recommendations that intensivists manage critically ill adults,8, 9 most American hospitals cannot and will not meet this proposed standard.10, 11 When surveyed, only 20% of Michigan hospitals participating in the Keystone Project responded that they staffed their ICUs exclusively with board‐certified intensivists, and 75% maintained open ICU staffing models.12 The mismatch between intensivist supply and demand is expected to worsen as inpatient volume and acuity grow in concert with an aging and increasingly comorbid American population, yet with the exception of a 2010 agreement between the American Board of Internal Medicine (ABIM) and American Board of Emergency Medicine (ABEM) to cosponsor a medical critical care fellowship pathway for emergency medicine (EM) physicians, little has changed to expand the intensivist trainee pipeline. Although the addition of a sanctioned EM critical care pathway is a positive development, it is unlikely to significantly impact the intensivist shortage in the near term. Between 2000 and 2007, 43 emergency medicine physicians entered non‐board sanctioned American critical care fellowships,13 while in the 20112012 academic year, 1957 trainees are enrolled in adult critical care medicine fellowships (surgery, anesthesia, medical critical care, and pulmonary/critical care).14 It remains to be seen if the availability of a formal critical care pathway will significantly increase the numbers of emergency medicine physicians who pursue critical care training.
The growing intensivist shortage has coincided with the appearance of hospitalists, physicians who focus on the care of hospitalized medical patients, on the healthcare landscape.15 Increasing from 2000 to 34,000 practitioners in 15 years, hospital medicine is the fastest growing specialty in organized medicine, with an estimated plateau of as many as 50,000 practitioners.16 As of 2009, hospitalists were present in 89% of hospitals with over 200 beds, largely replacing primary care physicians as the managers of ICU patients in non‐tertiary hospital settings.16 In surveys performed by the Society of Hospital Medicine, 75% of hospitalists reported that they practice in the ICU, often shouldering much of the responsibility for managing critically ill patients.17 In 37.5% of Michigan Keystone Project hospitals, hospitalists served as attending physicians of record in the ICU.10 Although legitimate concerns have been raised about whether hospitalists are uniformly qualified to practice in the ICU, this issue has become moot at many hospitals where intensivists are either in short supply or entirely absent.1821 As previously noted by Heisler,22 the issue is no longer whether hospitalists should practice in the ICU, but rather to ensure that they do so safely, effectively, and seamlessly in collaboration with intensivists, or independently when intensivists are unavailable.
POTENTIAL VALUE OF HOSPITALISTS IN THE ICU
Hospital medicine and critical care medicine share similar competencies and values. Eighty‐five percent of practicing hospitalists are internists, who have historically been well trained to manage acutely ill hospitalized patients. Categorical internal medicine (IM) training emphasizes acute inpatient medicine, with residents spending approximately two‐thirds of their training time in the hospital. Many of the cognitive skills required for practicing critical care medicine are encompassed in categorical IM training, as well as in the Core Competencies in Hospital Medicine.23, 24 Furthermore, hospitalist staffing models are specifically adapted to meet the needs of acutely ill patients. With their consistent presence in the hospital (many programs provide 24:7 in‐house coverage), hospitalists see patients several times a day if necessary and can respond to their acute needs in real time. In many institutions, hospitalists are tasked as first responders to in‐house emergencies, often covering ICUs when intensivists are unavailable.
Most importantly, hospital medicine and critical care medicine are philosophically aligned. Both disciplines are defined by their location of practice rather than by an organ system or constellation of diseases. Both specialties embrace hospital‐based process improvement, lead multidisciplinary teams, and champion quality and safety initiatives.23, 25 Hospitalists and intensivists routinely collaborate to improve hospital care through shared protocol implementation, patient throughput management, and quality improvement initiatives. The ideology and mechanics of high‐performing hospitalist and intensivist programs are extremely similar.
LIMITATIONS OF HOSPITALISTS IN ICUs
Although the majority of hospitalists are general internists, individual hospitalists' skills may be heterogeneous, reflecting differences in training and clinical practice experience prior to becoming hospitalists. A hospitalist entering practice directly from a rigorous categorical IM training program will likely have different skills and knowledge than an ambulatory‐based general internist who makes a mid‐career switch to hospital medicine. Furthermore, increasingly stringent restrictions on housestaff work hours and patient loads, coupled with increasing emphasis on ambulatory medicine, have substantially decreased IM residents' cumulative exposure to acutely ill inpatients and inpatient procedures, raising concerns that the current generation of IM residents are less well‐prepared to manage ICU patients than their predecessors. The growing prevalence of family practitioners in the adult hospitalist workforce (currently estimated at 6%8%), who generally are not as rigorously or comprehensively trained in critical care medicine as internists, further complicates efforts to broadly categorize adult hospitalists' ICU skills.26, 27
Once hospitalists enter the workforce, they have few formal opportunities to significantly advance their critical care knowledge and skills. Existing critical care educational offerings are generally limited to 1‐ or 2‐day critical care refresher courses or narrowly focused ICU skills courses, such as acute airway management or critical care ultrasonography. These courses, while valuable, are often insufficient for hospitalists who need to broaden their general critical care knowledge base or obtain skills that they did not acquire in residency training. The result is a hospitalist workforce that practices in the ICU but has limited opportunity to enhance the skills and knowledge necessary to do so safely and competently.
ENHANCING HOSPITALISTS' SKILLS TO PROVIDE CRITICAL CARE SERVICES
In the absence of a systemic solution to the intensivist shortage, the healthcare marketplace is independently developing alternative critical care delivery solutions, such as deploying telemedicine systems and expanding the roles of nurse practitioners and physician assistants in the ICU. To a lesser extent, there have been calls for hospitalists to fill similar intensivist extender roles in the ICU, and Heisler and others have suggested developing limited, competency‐based critical care training to allow hospitalists to manage a subset of ICU patients, either independently or collaboratively with intensivists.22 Several healthcare systems are in various stages of developing such critical care training programs for their hospitalists, many of whom already practice in the ICU. These programs will likely blend fellowship‐level training with supervised attending duties in the ICU, with the expectation that graduates will be able to independently manage a portion of an ICU population (Timothy G. Buchman, MD, PhD, Department of Surgery, Emory University School of Medicine, personal communication, May 11, 2011).
Although informal hospitalist training programs could make an important contribution to ICU staffing, they raise new concerns as well. In the absence of uniform, formal training and evaluation standards, the quality and consistency of these homegrown programs could vary widely, with participants developing critical care skills and competencies that might not conform to requirements set forth by the Accreditation Council for Graduate Medical Education (ACGME). Even if training could be standardized, the practical implementation of a 2‐tier intensivist model would create extreme political and operational challenges for hospitals, which would be required to differentially credential and privilege providers with similar training and overlapping patient responsibilities. In light of these complexities and uncertainties, hospitalists might be unwilling to risk investing in lengthy training offering uncertain recognition and delineation of what they can and cannot do in the ICU.
A more durable long‐term solution is to create an ACGME‐sanctioned and accredited critical care certification pathway for IM hospitalists, with the express goal of expanding the intensivist workforce by attracting practicing hospitalists to critical care fellowship training. Hospitalists who complete such training would be full‐fledged intensivists, subject to the same privileges and expectations as any other intensivist.
We believe that many hospitalists could acquire the competencies necessary to become board‐eligible intensivists in less than the 2 years currently required for general internists to complete critical care medicine training. The existence of 6 unique pathways for critical care training and board certification in the United States, all maintaining unique training criteria and durations of training, strongly suggests that competent intensivists can be trained through disparate pathways to achieve equivalent outcomes (Table 1). For example, both surgical and anesthesia critical care programs require only a single added year of training following their respective residency training programs.28, 29 Of the 24 months that comprise a medical critical care fellowship, only 12 months of clinical duties are required, with the remainder allocated to electives, quality‐improvement initiatives, research, and other academic pursuits.30 The ACGME and ABIM have tacitly acknowledged that medical critical care training is achievable in less than 2 years, by allowing those who enter or complete accredited 2‐year fellowships in other medical specialties to obtain critical care certification with a single additional year of critical care training.30 If infectious disease and nephrology fellows can become competent intensivists with a single year of critical care training, it is reasonable to believe that experienced IM hospitalists can do so as well.
Offering a 1‐year critical care fellowship training track for experienced IM hospitalists will require careful consideration of which components of existing 2‐year critical care fellowship can be removed or condensed without materially compromising the quality of training. Hospitalists participating in a condensed 1‐year training program would need the maturity and experience to hit the ground running, mandating a robust entry bar predicated upon relevant prior clinical practice experience. We believe that 3 sequential years of prior hospitalist practice experience is a reasonable prerequisite for participation. Additionally, eligible hospitalists would need to participate in the (currently voluntary) ABIM Focused Practice in Hospital Medicine Maintenance of Certification (MOC) process,31 which mandates completion of hospital‐based education and practice improvement modules. Prior training and participation in quality improvement (QI) processes could supplant some of the scholarly activity that is currently expected during the nonclinical portion of a traditional 2‐year medical critical care fellowship, and candidates would be required to have completed at least one meaningful hospital‐based QI initiative while still in practice.
Although new curricular standards would need to be developed, 1‐year medical intensivist fellowships could coexist alongside 2‐year fellowships within a single critical care training program, as is the case when internal medicine fellows in other specialties complete an added year of critical care fellowship. However, to meaningfully impact the intensivist shortage, the number and capacity of medical critical care fellowships, which currently train approximately 10% of the critical care workforce, would need to significantly expand.13
Importantly, the impact that critical care‐trained hospitalists will have on the quality and safety of patient care in the ICU will require evaluation and study. We presume that inserting this new cohort of intensivists into previously unmanaged or undermanaged ICUs will improve care, but this, like many other uncertainties regarding optimal models of ICU staffing, should be subject to rigorous and objective examination through additional clinical research.10, 3236
Offering a 1‐year critical care training track will raise new challenges. Skepticism about the rigor and content of 1‐year programs may foster the perception that graduates are inadequately trained or skilled to function at the level of other board‐certified intensivists. It is also possible that a 1‐year hospitalistcritical care fellowship could divert trainees from traditional critical care programs, offsetting net gains in the number of intensivists. However, we suspect that a 1‐year fellowship program will attract primarily practicing hospitalists, while 2‐year tracks will continue to attract IM residents. We conceptualize participation in a 1‐year hospitalistcritical care fellowship program as a (minimum) 4‐year post‐residency commitment, consisting of at least 3 years of clinical practice as a hospitalist, followed by 1 year of critical care fellowship training. Internal medicine residents would find a shorter pathway to intensivist practice by enrolling in traditional 2‐year critical care or even 3‐year pulmonary/critical care training programs. The compensation advantage afforded to intensivists relative to hospitalists (approximately $100,000 per year) would offset any financial advantage gained by shaving a year off of critical care fellowship training.37, 38 We also suspect that those seeking careers in academic medicine would almost exclusively opt for a traditional 2‐year training pathway.
Finally, while Europe and Australia offer a single common pathway to critical care certification, the United States maintains multiple, independent, specialty‐specific training pathways, each with unique durations, requirements, and certification processes. Although consideration of this important issue is beyond the scope of this paper, we believe that developing a hospitalist‐intensivist workforce should be part of a broader initiative to reform critical care training to better meet the demand for intensivists across the spectrum of American ICUs. Adopting a global intensivist training strategy that is specialty‐independent and specific to critical care medicine may result in a more consistent, collaborative, and interoperable critical care workforce.
CONCLUSION
American critical care training programs have failed to produce enough intensivists to meet demand, and this mismatch between supply and demand will substantially worsen over upcoming decades. Hospitals and healthcare systems, faced with the mandate to provide care for their ICU populations, have already innovated to offset this shortage through the use of telemedicine and the extension of nonphysician providers into ICUs. As the gap between intensivist supply and demand widens, healthcare systems will be increasingly likely to pursue more radical solutions, up to and including independently training their own critical care workforces. We believe that there are better alternatives.
Hospitalists have rapidly proliferated to become the dominant provider of inpatient medical care in American hospitals and are already providing a substantial amount of critical care. As such, they remain a largely untapped and potentially significant source of new intensivists. The skills, competencies, and values embodied in hospital medicine are already highly congruent with those of critical care. By virtue of their numbers and penetrance into the vast majority of large American hospitals, hospitalists are well situated to make a substantial impact on the intensivist shortage. If only 5% of the projected hospitalist workforce were to receive the critical care training that we propose, 2500 new intensivists would enter the critical care workforce, substantially decreasing the impact of the national intensivist shortage.12
Internal medicine hospitalists who obtain additional training as intensivists would also bring new capabilities and flexibility to hospitals seeking to implement intensivist programs. In smaller hospitals that cannot support freestanding intensivist programs, hospitalist‐intensivists might divide their time between ICU and ward duties. In larger hospitals, these clinicians might function exclusively as intensivists alongside their traditionally trained peers. Whether they affiliate as hospitalists, intensivists, or something else entirely will largely depend upon the roles that they fulfill, the governance of their institutions, and the departments that most effectively meet their clinical and organizational needs.
Bringing qualified hospitalists into the critical care workforce through rigorous sanctioned and accredited 1‐year training programs, will open a new intensivist training pipeline and potentially offer more critically ill patients the benefit of providers who are unequivocally qualified to care for them. Similarly, unification of critical care training and certification across disciplines will better focus efforts to expand the intensivist workforce, more efficiently leverage limited training resources, and facilitate standardization of critical care skills, policies, and procedures across the nation's ICUs. Although moving this agenda forward may be logistically challenging and politically daunting, we believe that the results will be worth the effort.
Acknowledgements
Disclosure: All authors disclose no relevant or financial conflicts of interest. This position paper also published in Critical Care Medicine. (Siegal EM, Dressler DD, Dichter JR, Gorman MJ, Lipsett PA. Training a Hospitalist Workforce to Address the Intensivist Shortage in American Hospitals: A Position Paper From the Society of Hospital Medicine and the Society of Critical Care Medicine. Crit Care Med. 2012;40(6):19521956).
- ,,,,.Current and projected workforce requirements for care of the critically ill and patients with pulmonary disease: can we meet the requirements of an aging population?JAMA.2000;284(21):2762–2770.
- Health Resources and Services Administration report to Congress: the critical care workforce: a study of the supply and demand for critical care physicians. Available at: http://www.bhpr.hrsa.gov/healthworkforce/reports/criticalcare/default.htm. Accessed April 24,2011.
- ,,, et al.The critical care crisis in the United States: a report from the profession.Chest.2004;125(4):1514–1517.
- ,,,,,.The critical care medicine crisis: a call for federal action. A white paper from the critical care professional societies.Chest.2004;125(4):1518–1521.
- .Critical care workforce.Crit Care Med.2008;36(4):1350–1353.
- .Critical care workforce crisis: time to look in the mirror.Crit Care Med.2008;36(4):1385–1386.
- ,,, et al.Prioritizing the organization and management of intensive care services in the Unites States: the PrOMIS conference.Crit Care Med.2007;35:1103–1111.
- ,,,,.Association between ICU physician staffing and outcomes: a systematic review.Crit Care Med.1999;27:A43.
- The Leapfrog Group Factsheet. ICU Physician Staffing (IPS). Available at: http://www.leapfroggroup.org/media/file/FactSheet_IPS.pdf. Accessed November 20,2011.
- ,,,,,.Physician staffing patterns and clinical outcomes in critically ill patients: a systematic review.JAMA.2002;288(17):2151–2162.
- ,,,,,.Association between critical care physician management and patient mortality in the intensive care unit.Ann Intern Med.2008;148(11):801–809.
- ,,, et al.Characteristics of intensive care units in Michigan: not an open and closed case.J Hosp Med.2010;5(1):4–9.
- ,,.Current practice, demographics and trends of critical care trained emergency physicians in the United States.Acad Emer Med.2010;17:325–329.
- List of ACGME Accredited Programs and Sponsoring Institutions. Available at: http://www.acgme.org/adspublic. Accessed February 22,2012.
- ,.The emerging role of “hospitalists” in the American health care system.N Engl J Med.1996;335:514–517.
- American Hospital Association.2009 Annual Survey.Chicago, IL:American Hospital Association;2009.
- 2005–2006 Society of Hospital Medicine Compensation and Productivity Survey. Available at: http://www.hospitalmedicine.org/AM/Template.cfm?Section=Surveys24(4):2–3.
- .Hospitalists in the intensive care unit: an intensivist perspective.The Hospitalist.1999;3(4):5.
- .The new intensivists.The Hospitalist. October2008.
- .Intensive care unit staffing: an academic debate but a community crisis.Crit Care Med.2012;40(3):1032.
- .Hospitalists and intensivists: partners in caring for the critically ill—the time has come.J Hosp Med.2010;5:1–3.
- ,,,,.The core competencies in hospital medicine: a framework for curriculum development.J Hosp Med.2006;1(suppl 1):2–95.
- ,,,,.The core competencies in hospital medicine: development and methodology.J Hosp Med.2006;1:48–56.
- ,,, et al.An intervention to decrease catheter‐related bloodstream infections in the ICU.N Engl J Med.2006;355:2725–2732.
- ACGME Internal Medicine Program Requirements. Available at: http://www.acgme.org/acwebsite/rrc_140/140_prindex.asp. Accessed November 20,2011.
- ACGME Program Requirements for Resident Education in Internal Medicine. Available at: http://www.acgme.org/acWebsite/reviewComment/140_internal_medicine_PRs_R
Care Transitions for the Underserved
Hospital readmissions are common and costly, and represent a significant burden to the healthcare system. The challenges of postdischarge medication uncertainty, lack of self‐management support, and lack of timely access to health professionals1 are compounded in uninsured and Medicaid individuals by limited access to medications and primary care, financial strain, insecure housing, and limited social support.2
Our hospital cares for a large number of uninsured and low‐income publicly insured patients. The Portland area safety‐net, which consists of a network of 14 federally qualified health centers and free clinics, has limited capacity for uncompensated care. Uninsured patientsand to a lesser degree, Medicaid patientshave difficulty establishing primary care. Prior to the implementation of our program, uninsured and Medicaid patients without a usual source of care were given a list of safety‐net clinics at discharge, but frequently could not access appointments or navigate the complex system. There were no well‐developed partnerships between hospital and outpatient clinics for uninsured or Medicaid patients. The hospital lacked a systematic approach to securing postdischarge follow‐up and peridischarge patient education, and uninsured patients were financially responsible for most medications upon discharge. The costs of uncompensated or undercompensated potentially preventable readmissions for these patients, along with the recognition of gaps in quality, ultimately provided the rationale for a medical center‐funded transitional care intervention for uninsured and low‐income publicly insured patients.
Several transitional care improvement programs have shown effectiveness in reducing hospital readmissions,1, 35 but most have been conducted in settings where patients have secure access to outpatient care, and none have focused specifically on uninsured or Medicaid patients. Moreover, the development of these programs requires time and capital. Transitional care programs that have published results, to date, have been funded through government or private foundation grants1, 35; however, broader implementation of transitional care innovations will require financial and intellectual engagement of healthcare institutions themselves.
This report describes development of the Care Transitions Innovation (C‐TraIn), a multicomponent transitional care intervention for uninsured and low‐income publicly insured adults at a large, urban academic medical center, Oregon Health & Science University (OHSU). Because institutional funding and engagement is critical to the sustainability and scalability of similar programs, we also describe our process for gaining institutional support. Our hypothesis is that C‐TraIn can reduce readmissions and emergency department (ED) use at 30 days after hospital discharge, compared with usual care.
METHODS
Engaging Institutional Leaders
Early and continued efforts to engage hospital administrators were integral to our ultimate success in gaining institutional funding and leadership support. Initially, we convened what we called a Health Systems Morbidity and Mortality conference, featuring an uninsured patient who told of his postdischarge experiences and costly, potentially preventable readmission. We invited a broad array of potential stakeholders, including representatives from hospital administration, hospital case managers and social workers, community safety‐net providers, inpatient and outpatient physicians, residents, and medical students. Our patient was previously admitted to OHSU and diagnosed with pneumonia, hypothyroidism, sleep apnea, and depression. At discharge, he was given a list of low‐cost clinics; however, he was unable to arrange follow‐up, could not afford prescriptions, and felt overwhelmed trying to navigate a complex system. Consequently, he received no outpatient healthcare and his illnesses progressed. Unable to stay awake as a long‐haul trucker, he lost his job and subsequently his housing, and was readmitted to the intensive care unit with severe hypercarbic respiratory failure, volume overload, and hypothyroidism. The $130,000 charge for his 19‐day rehospitalization was largely un‐recuperated by the hospital. The case was a stark example of the patient‐safety and financial costs of fragmented care, and the conference was a nidus for further institutional engagement and program development, the key steps of which are described in Table 1.
| Time | Key Step | How Step Was Achieved | Take Home Points |
|---|---|---|---|
| |||
| July 2008July 2009 | 1. Identified key stakeholders | Considered varied stakeholders impacted by transitional care gaps for uninsured and Medicaid patients | Casting a wide net early in the process promoted high level of engagement and allowed self‐identification of some stakeholders |
| 2. Framed problems and opportunities; exposed costs of existing system shortcomings | Educational conference (that we called a Health Systems M&M) fostered a blame‐free environment to explore varied perspectives | Individual patient story made policy issue more accessible to a wide range of stakeholders | |
| Discussion of exposed drivers and costs of misaligned incentives; highlighted inroads to developing a business case for change | |||
| Oct 2008June 2009 | 3. Identified administrative allies and leaders with high bridging capital | Follow‐up with administrator after Health System M&M allowed further identification of key administrative stakeholders | Administrator insight highlighted institutional priorities and strategic plans |
| Ongoing meetings over 9 moto advocate for change, explore support for program development | Key ally within administration facilitated conversation with executive leadership whose support was a critical for program success | ||
| July 2009June 2010 | 4. Framed processes locally with continued involvement from multiple stakeholders | Performed multicomponent needs assessment | Patient assessment included inpatients for ease of survey administration |
| Utilized efforts of student volunteers for low‐budget option | |||
| Existing administrative support aided patient tracking | |||
| Non‐integrated health system and lack of claims data for uninsured limited usefulness of administrative utilization data | |||
| 5. Performed cost analysis to further support the business and quality case | Used OHSU data from needs assessment patient sample to estimate potential costs and savings of saved readmissions and avoided ED visits | Business case highlighted existing costs to OHSU for uncompensated care; program presented a solution to realign incentives and better allocate existing hospital expenditures | |
| Qualitative patient interviews exposed opportunity for quality improvement | Highlighted pilot as an opportunity for institutional learning about transitional care improvements | ||
| 6. Use needs assessment to map intervention | Drew upon local and national health systems expertise through literature review and consultation with local and national program leaders | OHSU's Care Transitions Innovation (C‐TraIn) includes elements aimed at improving access, patient education, care coordination, and systems integration (Table 2) | |
| Matched patient needs to specific elements of program design | |||
Planning the Intervention
Findings from a patient needs assessment and community stakeholder meetingsdescribed belowdirectly informed a multicomponent intervention that includes linkages and payment for medical homes for uninsured patients who lack access to outpatient care, a transitional care nurse whose care bridges inpatient and outpatient settings, inpatient pharmacy consultation, and provision of 30 days of medications at hospital discharge for uninsured patients (Table 2).
| Program Element | Description | Resources per 200 Patients |
|---|---|---|
| ||
| Transitional care RN | Augments patient education and care coordination in the hospital until 30 days after discharge. Tasks include: | 1.0 FTE nurse salary* |
| developing a personal health record with inpatients | ||
| completing a home visit within 72 hr of discharge to focus on medication reconciliation and patient self‐management | ||
| low‐risk patients receive 3 calls and no home visit (see Supporting Information, Appendix 1, in the online version of this article) | ||
| 2 subsequent phone calls to provide additional coaching, identify unmet needs, and close the loop on incomplete financial paperwork | ||
| The nurse provides a warm handoff with clinic staff, assists in scheduling timely posthospital follow‐up, and assures timely transfer of DC summaries. She coordinates posthospital care management with Medicaid case‐workers when available. | ||
| Pharmacy | Consultation: Inpatient pharmacists reconcile and simplify medication regimens, educate patients, and assess adherence barriers. | 0.4 FTE inpatient pharmacist salary |
| Prescription support: For uninsured patients, pharmacists guide MD prescribing towards medications available on the C‐TraIn value‐based formulary, a low‐cost formulary that reflects medications available through $4 plans, a Medicaid formulary, and FQHC on‐site pharmacies. | Estimated $12/prescription; 6.5 prescriptions/patient | |
| Uninsured patients are given 30 days of bridging prescription medications at hospital discharge free of charge. | ||
| Outpatient medical home and specialty care linkages | OHSU has partnered with outpatient clinics on a per‐patient basis to support funding of primary care for uninsured patients who lack a usual source of care. Clinics also provide coordinated care for Medicaid patients without assigned primary care, and have committed to engaging in continuous quality improvement. Clinics include an academic general internal medicine practice, an FQHC specializing in addiction and care for the homeless, and an FQHC that serves a low‐income rural population. | Estimated 8 primary care visits/yr at $205/visit (FQHC reimbursement rate) equates to $1640/ patient/yr. |
| Timely posthospital specialty care related to index admission diagnoses is coordinated through OHSU's outpatient specialty clinics. | ||
| Monthly care coordination meetings | We convene a diverse team of community clinic champions, OHSU inpatient and outpatient pharmacy and nurse representatives, hospital administrative support, and a CareOregon representive. | |
| At each meeting, we review individual patient cases, seek feedback from diverse, and previously siloed, team members, and engage in ongoing quality improvement. | ||
Needs Assessment
We conducted a mixed‐methods needs assessment of consecutive nonelderly adult inpatients (<65 years old) admitted to general medicine and cardiology, between July and October 2009, with no insurance, Medicaid, or MedicareMedicaid. Five volunteer medical and pre‐medical students surveyed 116 patients (see Supporting Information survey, Appendix 2, in the online version of this article). Forty patients reported prior admission within the last 6 months. With these participants, we conducted in‐depth semi‐structured interviews assessing self‐perceived transitional care barriers. Investigators drew preliminary themes from the interviews but delayed a scientifically rigorous qualitative analysis, given a compressed timeline in which to meet program development needs. Of the 116 patients surveyed, 22 had MedicareMedicaid. Given that many of these patients discharged to skilled nursing facilities, we focused program development using data from the 94 uninsured and Medicaid patients (Table 3).
| Uninsured (n = 43 patients) | Medicaid (n = 51 patients) | |
|---|---|---|
| ||
| Lack usual source of care (%) | 33.3 | 11.1* |
| Self‐reported 6 mo rehospitalization (%) | 60.0 | 48.6 |
| Average no. Rx prior to hospitalization | 4.4 | 13.8 |
| Barriers to taking meds as prescribed (%) | 42.9 | 21.6* |
| Cost of meds as leading barrier (%) | 30.0 | 2.9* |
| Marginal housing (%) | 40.5 | 32.4 |
| Low health literacy (%) | 41.5 | 41.7 |
| Transportation barrier (%) | 11.9 | 31.4* |
| Comorbid depression (%) | 54.8 | 45.9 |
| Income <30 K (%) | 79.5 | 96.8 |
Finding 1: Thirty‐three percent of uninsured and 11% of Medicaid patients lacked a usual source of care. This was highest among Portland‐area residents (45%). Program element: We forged relationships with 3 outpatient clinics and developed a contractual relationship whereby OHSU pays for medical homes for uninsured patients lacking usual care. Finding 2: Patients were unclear as to how to self‐manage care or who to contact with questions after hospitalization. Program element: Transitional care nurse provides intensive peridischarge education, performs home visits within 3 days of discharge, and serves as a point person for patients during the peridischarge period. Finding 3: Among uninsured patients, cost was the leading barrier to taking medications as prescribed and often led to self‐rationing of medications without provider input. Program element: We developed a low‐cost, value‐based formulary for uninsured patients that parallels partnering clinic formularies, $4 plans, and medication assistance programs. After 30 days of program‐funded medications, patients then get medications through these other sources. Inpatient pharmacists consult on all patients to reconcile medications, identify access and adherence gaps, provide patient education, and communicate across settings. Finding 4: Comorbid depression was common. Program element: We sought partnerships with clinics with integrated mental health services. Finding 5: Over half of patients live in 3 counties surrounding Portland. Program element: We restricted our intervention to patients residing in local counties and included postdischarge home visits in our model. Partnering clinics match patient geographic distribution. Finding 6: Self‐ reported 6‐month readmission (60%) rates exceeded rates estimated by hospital administrative data (18%), supporting qualitative findings that patients seek care at numerous hospitals. Program element: Given that utilization claims data are unavailable for the uninsured, we included phone follow‐up surveys to assess self‐reported utilization 30 days postdischarge. Finding 7: Using administrative data, we estimated that the hospital loses an average of $11,000 per readmission per patient in direct, unremunerated costs. Indirect costs (such as costs of hospital staff) and opportunity costs (of potential revenue from an insured patient occupying the bed) were excluded, thus presenting a conservative estimate of cost savings. Program element: We used local cost data to support the business case and emphasize potential value of an up‐front investment in transitional care.
Defining the Setting
We convened a series of 3 work group meetings with diverse internal and external stakeholders (Table 4) to further define an intervention in the context of local health system realities. Work groups shaped the program in several specific ways. First, community clinic leaders emphasized that limited specialty access is an important barrier when caring for recently hospitalized uninsured and Medicaid patients. They felt expanded postdischarge access to specialists would be important to increase their capacity for recently discharged patients. Thus, we streamlined patients' posthospital specialty access for conditions treated during hospitalization. Second, initially we considered linking with 1 clinic; however, health systems researchers and clinic providers cautioned us, suggesting that partnering with multiple clinics would make our work more broadly applicable. Finally, pharmacists and financial assistance staff revealed that financial assistance forms are often not completed during hospitalization because inpatients lack access to income documentation. This led us to incorporate help with financial paperwork into the postdischarge intervention.
| Clinical staff |
| Hospital medicine physician |
| General internal medicine physician |
| Hospital ward nurse staff |
| Pharmacy (inpatient, outpatient, medication assistance programs) |
| Care management/social work |
| Emergency medicine |
| Health system leadership |
| Hospital administrative leadership |
| Primary care clinic leadership |
| Safety‐net clinic leadership |
| Specialty clinic leadership |
| Hospital business development and strategic planning |
| CareOregon (Medicaid managed care) leadership |
| Other |
| Patients |
| Health systems researchers |
| Clinical informatics |
| Hospital financials (billing, financial screening, admitting) |
Pilot Testing
We conducted pilot testing over 4 weeks, incorporating a Plan‐Do‐Study‐Act approach. For example, our transitional care nurse initially used an intervention guide with a list of steps outlined; however, we quickly discovered that the multiple and varied needs of this patient populationincluding housing, transportation, and foodwere overwhelming and pulled the nurse in many directions. In consultation with our quality improvement experts, we reframed the intervention guide as a checklist to be completed for each patient.
Pilot testing also underscored the importance of monthly meetings to promote shared learning and create a forum for communication and problem solving across settings. During these meetings, patient case discussions inform continuous quality improvement and promote energy‐sustaining team‐building. Information is then disseminated to each clinic site and arm of the intervention through a designated champion from each group. We also planned to meet monthly with the hospital executive director to balance service and research needs, and engage in rapid‐cycle change throughout our 1‐year demonstration project.
Funding the Program
We talked to others with experience implementing nurse‐led transitional care interventions. Based on these discussions, we anticipated our nurse would be able to see 200 patients over the course of 1 year, and we developed our budget accordingly (Table 2). From our needs assessment, we knew 60% of patients reported at least 1 hospitalization in the 6 months prior. If we assumed that 60% (120) of the 200 patients randomized to our intervention would get readmitted, then a 20% reduction would lead to 24 avoided readmissions and translate into $264,000 in savings for the health system. Even though the hospital would not reap all of these savings, as patients get admitted to other area hospitals, hospital administration acknowledged the value of setting the stage for community‐wide solutions. Moreover, the benefit was felt to extend beyond financial savings to improved quality and institutional learning around transitional care.
PROGRAM EVALUATION
We are conducting a clustered, randomized controlled trial to evaluate C‐TraIn's impact on quality, access, and high‐cost utilization at 30 days after hospital discharge. Results are anticipated in mid‐2012. We chose to perform an analysis clustered by admitting team, because communication between the C‐TraIn nurse, physician team, and pharmacist consult services could introduce secular change effects that could impact the care received by other patients on a given team. There are 5 general medicine resident teams, 1 hospitalist service, and 1 cardiology service, and the physician personnel for each team changes from month to month. Because the cardiology and hospitalist services differ slightly from resident teams, we chose a randomized cross‐over design such that intervention and control teams are redesignated every 3 months. To enhance internal validity, study personnel who enroll patients and administer baseline and 30‐day surveys are blinded to intervention status. We are collecting data on prior utilization, usual source of care, outpatient access, insurance, patient activation,6 functional status,7, 8 self‐rated health,7 health literacy, care transitions education,9 alcohol and substance abuse, and social support.10 Our primary outcome will be self‐reported 30‐day hospital readmission and ED use. We will also evaluate administrative claims data to identify 30‐day OHSU readmission and ED utilization rates. We will assess whether improved access to medications, rates of outpatient follow‐up and time to follow‐up mediate any effect on primary outcomes. Secondary outcomes will include outpatient utilization, patient activation, self‐rated health, and functional status.
Given limited experience with transitional care programs in socioeconomically disadvantaged patients, we are measuring acceptability and feasibility by tracking rates of those declining the intervention, and through semi‐structured interviews at 30 days. We are monitoring fidelity to core elements of the program through chart and checklist reviews, and seeking provider feedback through in‐person meetings with key implementers. To ensure possibility of broader adoption beyond OHSU, we are developing a toolkit that defines core program elements and can be adapted for use in various settings.
DISCUSSION
Using a process of broad stakeholder engagement, exposure of financial incentives, and data‐driven understanding of institutional and population needs, we built consensus and gained institutional financial commitment for implementation of a multicomponent transitional care program for uninsured and Medicaid patients. Our experience is relevant to other hospital systems, and may have particular relevance to academic medical centers, whose tripartite mission of clinical care, research, and education make them a natural place for healthcare reform.11
Several key lessons from our experience may be widely applicable. First, key administrative allies helped us understand institutional priorities and identify key institutional change‐agents. Though initial attempts to gain support were met cautiously, persistent advocacy, development of a strong business case, and support from several administrative allies compelled further leadership support. Second, unlike traditional grant funding cycles, hospital budgets operate in real‐time rapid‐change cycles, necessitating rapid data collection, analysis, and program design. Such demands could potentially threaten the viability of the program itself, or result in premature diffusion of novel practices into disparate populations. Communication with administrative leadership about the value of sound research design within the context of faster‐paced institutional needs was important and allowed time for data‐driven program development and diffusion. Simultaneously, we recognized the need to move quickly, provide regular progress updates, and use existing institutional resources, such as volunteer students and business development office, when possible.
We found that cross‐site hospitalcommunity partnerships are an essential program element. Partnership occurs through a payment agreement and through active engagement in ongoing quality improvement, including clinic representation at monthly team meetings. Clinic partnerships have enabled multidisciplinary cross‐site communication and relationships that facilitate innovation across routinely siloed elements of the system, allowing the team to anticipate and respond to patient problems before they lead to readmissions or poor outcomes. Our experience matches findings from recent program evaluations that found that care coordination attempts are unsuccessful without strong cross‐site linkages.12 These linkages are especially challenging and needed for uninsured and Medicaid patients, given their traditional lack of access and the additional social and financial barriers that influence their care.13
Limitations of our study include: implementation at a single, academic medical center; secular changes (which we mitigate against using randomized trial design); and potential for low power, if readmission rates are lower than anticipated from needs assessment data. Additionally, the need for a willing and invested program champion to coordinate an often messy, complex intervention may limit generalizability.
While transitional care programs continue to proliferate in response to increasingly recognized gaps in a fragmented care system,14, 15 few interventions specifically address the needs of socioeconomically disadvantaged patients. The major study that did5 was conducted in Massachusetts, where many patients received care through a state Free Care program and robust local safety‐net. Others have largely been tested in integrated care settings,1 and target patients who are part of managed care programs.1, 4, 16
To our knowledge, there are no well‐described programs that include explicit purchasing of outpatient medical homes for uninsured patients who would not otherwise have access to care. Our experience shifts the paradigm of the role of hospitals in care for the uninsured and underinsured: instead of a reactive, uncoordinated role, we assert that the hospital's strategic up‐front allocation of resources has a sound business, quality, and ethical foundation. This is especially important, given a new era of payment reform and coordinated care organizations. There is an opportunity to both improve quality for the uninsured and Medicaid patients, control costs, and gain valuable experience that can inform transitional care improvements for broader patient populations. If our study is successful in reducing readmissions, there may be important implications as to how to redefine the hospital's role in outpatient access to care linkages, especially for uninsured and Medicaid patients.
Acknowledgements
The authors acknowledge Char Riley, Dawn Whitney, and Tara Harben of OHSU, as well as volunteer research assistants Amie Leaverton, Molly McClain, Emily Johnson, Travis Geraci, and Claudia Sells.
- ,,,.The care transitions intervention: results of a randomized controlled trial.Arch Intern Med.2006;166(17):1822–1828.
- ,,,,.Medicaid patients at high risk for frequent hospital admission: real‐time identification and remediable risks.J Urban Health.2009;86(2):230–241.
- ,,,,,.Transitional care of older adults hospitalized with heart failure: a randomized, controlled trial.J Am Geriatr Soc.2004;52(5):675–684.
- ,,,,.The effect of Evercare on hospital use.J Am Geriatr Soc.2003;51(10):1427–1434.
- ,,, et al.A reengineered hospital discharge program to decrease rehospitalization: a randomized trial.Ann Intern Med.2009;150(3):178–187.
- ,,,.Development of the patient activation measure (PAM): conceptualizing and measuring activation in patients and consumers.Health Serv Res.2004;39(4 pt 1):1005–1026.
- The EuroQol Group.EuroQol—a new facility for the measurement of health‐related quality of life.Health Policy.1990;16(3):199–208.
- ,,,,,.Trajectories of life‐space mobility after hospitalization.Ann Intern Med.2009;150(6):372–378.
- ,,.Assessing the quality of preparation for posthospital care from the patient's perspective: the care transitions measure.Med Care.2005;43(3):246–255.
- ,,,.Assessing social support: the social support questionnaire.J Pers Soc Psychol.1983;44(1):127–139.
- .Payment reform and the mission of academic medical centers.N Engl J Med.2010;363(19):1784–1786.
- ,,,.Effects of care coordination on hospitalization, quality of care, and health care expenditures among Medicare beneficiaries: 15 randomized trials.JAMA.2009;301(6):603–618.
- ,,,.Post‐discharge intervention in vulnerable, chronically ill patients.J Hosp Med.2012;7(2):124–130.
- ,,, et al.Discharge planning from hospital to home.Cochrane Database Syst Rev.2010(1):000313.
- .Preventing the rebound: improving care transition in hospital discharge processes.Aust Health Rev.2010;34(4):445–451.
- ,,, et al.Comprehensive discharge planning and home follow‐up of hospitalized elders: a randomized clinical trial.JAMA.1999;281(7):613–620.
Hospital readmissions are common and costly, and represent a significant burden to the healthcare system. The challenges of postdischarge medication uncertainty, lack of self‐management support, and lack of timely access to health professionals1 are compounded in uninsured and Medicaid individuals by limited access to medications and primary care, financial strain, insecure housing, and limited social support.2
Our hospital cares for a large number of uninsured and low‐income publicly insured patients. The Portland area safety‐net, which consists of a network of 14 federally qualified health centers and free clinics, has limited capacity for uncompensated care. Uninsured patientsand to a lesser degree, Medicaid patientshave difficulty establishing primary care. Prior to the implementation of our program, uninsured and Medicaid patients without a usual source of care were given a list of safety‐net clinics at discharge, but frequently could not access appointments or navigate the complex system. There were no well‐developed partnerships between hospital and outpatient clinics for uninsured or Medicaid patients. The hospital lacked a systematic approach to securing postdischarge follow‐up and peridischarge patient education, and uninsured patients were financially responsible for most medications upon discharge. The costs of uncompensated or undercompensated potentially preventable readmissions for these patients, along with the recognition of gaps in quality, ultimately provided the rationale for a medical center‐funded transitional care intervention for uninsured and low‐income publicly insured patients.
Several transitional care improvement programs have shown effectiveness in reducing hospital readmissions,1, 35 but most have been conducted in settings where patients have secure access to outpatient care, and none have focused specifically on uninsured or Medicaid patients. Moreover, the development of these programs requires time and capital. Transitional care programs that have published results, to date, have been funded through government or private foundation grants1, 35; however, broader implementation of transitional care innovations will require financial and intellectual engagement of healthcare institutions themselves.
This report describes development of the Care Transitions Innovation (C‐TraIn), a multicomponent transitional care intervention for uninsured and low‐income publicly insured adults at a large, urban academic medical center, Oregon Health & Science University (OHSU). Because institutional funding and engagement is critical to the sustainability and scalability of similar programs, we also describe our process for gaining institutional support. Our hypothesis is that C‐TraIn can reduce readmissions and emergency department (ED) use at 30 days after hospital discharge, compared with usual care.
METHODS
Engaging Institutional Leaders
Early and continued efforts to engage hospital administrators were integral to our ultimate success in gaining institutional funding and leadership support. Initially, we convened what we called a Health Systems Morbidity and Mortality conference, featuring an uninsured patient who told of his postdischarge experiences and costly, potentially preventable readmission. We invited a broad array of potential stakeholders, including representatives from hospital administration, hospital case managers and social workers, community safety‐net providers, inpatient and outpatient physicians, residents, and medical students. Our patient was previously admitted to OHSU and diagnosed with pneumonia, hypothyroidism, sleep apnea, and depression. At discharge, he was given a list of low‐cost clinics; however, he was unable to arrange follow‐up, could not afford prescriptions, and felt overwhelmed trying to navigate a complex system. Consequently, he received no outpatient healthcare and his illnesses progressed. Unable to stay awake as a long‐haul trucker, he lost his job and subsequently his housing, and was readmitted to the intensive care unit with severe hypercarbic respiratory failure, volume overload, and hypothyroidism. The $130,000 charge for his 19‐day rehospitalization was largely un‐recuperated by the hospital. The case was a stark example of the patient‐safety and financial costs of fragmented care, and the conference was a nidus for further institutional engagement and program development, the key steps of which are described in Table 1.
| Time | Key Step | How Step Was Achieved | Take Home Points |
|---|---|---|---|
| |||
| July 2008July 2009 | 1. Identified key stakeholders | Considered varied stakeholders impacted by transitional care gaps for uninsured and Medicaid patients | Casting a wide net early in the process promoted high level of engagement and allowed self‐identification of some stakeholders |
| 2. Framed problems and opportunities; exposed costs of existing system shortcomings | Educational conference (that we called a Health Systems M&M) fostered a blame‐free environment to explore varied perspectives | Individual patient story made policy issue more accessible to a wide range of stakeholders | |
| Discussion of exposed drivers and costs of misaligned incentives; highlighted inroads to developing a business case for change | |||
| Oct 2008June 2009 | 3. Identified administrative allies and leaders with high bridging capital | Follow‐up with administrator after Health System M&M allowed further identification of key administrative stakeholders | Administrator insight highlighted institutional priorities and strategic plans |
| Ongoing meetings over 9 moto advocate for change, explore support for program development | Key ally within administration facilitated conversation with executive leadership whose support was a critical for program success | ||
| July 2009June 2010 | 4. Framed processes locally with continued involvement from multiple stakeholders | Performed multicomponent needs assessment | Patient assessment included inpatients for ease of survey administration |
| Utilized efforts of student volunteers for low‐budget option | |||
| Existing administrative support aided patient tracking | |||
| Non‐integrated health system and lack of claims data for uninsured limited usefulness of administrative utilization data | |||
| 5. Performed cost analysis to further support the business and quality case | Used OHSU data from needs assessment patient sample to estimate potential costs and savings of saved readmissions and avoided ED visits | Business case highlighted existing costs to OHSU for uncompensated care; program presented a solution to realign incentives and better allocate existing hospital expenditures | |
| Qualitative patient interviews exposed opportunity for quality improvement | Highlighted pilot as an opportunity for institutional learning about transitional care improvements | ||
| 6. Use needs assessment to map intervention | Drew upon local and national health systems expertise through literature review and consultation with local and national program leaders | OHSU's Care Transitions Innovation (C‐TraIn) includes elements aimed at improving access, patient education, care coordination, and systems integration (Table 2) | |
| Matched patient needs to specific elements of program design | |||
Planning the Intervention
Findings from a patient needs assessment and community stakeholder meetingsdescribed belowdirectly informed a multicomponent intervention that includes linkages and payment for medical homes for uninsured patients who lack access to outpatient care, a transitional care nurse whose care bridges inpatient and outpatient settings, inpatient pharmacy consultation, and provision of 30 days of medications at hospital discharge for uninsured patients (Table 2).
| Program Element | Description | Resources per 200 Patients |
|---|---|---|
| ||
| Transitional care RN | Augments patient education and care coordination in the hospital until 30 days after discharge. Tasks include: | 1.0 FTE nurse salary* |
| developing a personal health record with inpatients | ||
| completing a home visit within 72 hr of discharge to focus on medication reconciliation and patient self‐management | ||
| low‐risk patients receive 3 calls and no home visit (see Supporting Information, Appendix 1, in the online version of this article) | ||
| 2 subsequent phone calls to provide additional coaching, identify unmet needs, and close the loop on incomplete financial paperwork | ||
| The nurse provides a warm handoff with clinic staff, assists in scheduling timely posthospital follow‐up, and assures timely transfer of DC summaries. She coordinates posthospital care management with Medicaid case‐workers when available. | ||
| Pharmacy | Consultation: Inpatient pharmacists reconcile and simplify medication regimens, educate patients, and assess adherence barriers. | 0.4 FTE inpatient pharmacist salary |
| Prescription support: For uninsured patients, pharmacists guide MD prescribing towards medications available on the C‐TraIn value‐based formulary, a low‐cost formulary that reflects medications available through $4 plans, a Medicaid formulary, and FQHC on‐site pharmacies. | Estimated $12/prescription; 6.5 prescriptions/patient | |
| Uninsured patients are given 30 days of bridging prescription medications at hospital discharge free of charge. | ||
| Outpatient medical home and specialty care linkages | OHSU has partnered with outpatient clinics on a per‐patient basis to support funding of primary care for uninsured patients who lack a usual source of care. Clinics also provide coordinated care for Medicaid patients without assigned primary care, and have committed to engaging in continuous quality improvement. Clinics include an academic general internal medicine practice, an FQHC specializing in addiction and care for the homeless, and an FQHC that serves a low‐income rural population. | Estimated 8 primary care visits/yr at $205/visit (FQHC reimbursement rate) equates to $1640/ patient/yr. |
| Timely posthospital specialty care related to index admission diagnoses is coordinated through OHSU's outpatient specialty clinics. | ||
| Monthly care coordination meetings | We convene a diverse team of community clinic champions, OHSU inpatient and outpatient pharmacy and nurse representatives, hospital administrative support, and a CareOregon representive. | |
| At each meeting, we review individual patient cases, seek feedback from diverse, and previously siloed, team members, and engage in ongoing quality improvement. | ||
Needs Assessment
We conducted a mixed‐methods needs assessment of consecutive nonelderly adult inpatients (<65 years old) admitted to general medicine and cardiology, between July and October 2009, with no insurance, Medicaid, or MedicareMedicaid. Five volunteer medical and pre‐medical students surveyed 116 patients (see Supporting Information survey, Appendix 2, in the online version of this article). Forty patients reported prior admission within the last 6 months. With these participants, we conducted in‐depth semi‐structured interviews assessing self‐perceived transitional care barriers. Investigators drew preliminary themes from the interviews but delayed a scientifically rigorous qualitative analysis, given a compressed timeline in which to meet program development needs. Of the 116 patients surveyed, 22 had MedicareMedicaid. Given that many of these patients discharged to skilled nursing facilities, we focused program development using data from the 94 uninsured and Medicaid patients (Table 3).
| Uninsured (n = 43 patients) | Medicaid (n = 51 patients) | |
|---|---|---|
| ||
| Lack usual source of care (%) | 33.3 | 11.1* |
| Self‐reported 6 mo rehospitalization (%) | 60.0 | 48.6 |
| Average no. Rx prior to hospitalization | 4.4 | 13.8 |
| Barriers to taking meds as prescribed (%) | 42.9 | 21.6* |
| Cost of meds as leading barrier (%) | 30.0 | 2.9* |
| Marginal housing (%) | 40.5 | 32.4 |
| Low health literacy (%) | 41.5 | 41.7 |
| Transportation barrier (%) | 11.9 | 31.4* |
| Comorbid depression (%) | 54.8 | 45.9 |
| Income <30 K (%) | 79.5 | 96.8 |
Finding 1: Thirty‐three percent of uninsured and 11% of Medicaid patients lacked a usual source of care. This was highest among Portland‐area residents (45%). Program element: We forged relationships with 3 outpatient clinics and developed a contractual relationship whereby OHSU pays for medical homes for uninsured patients lacking usual care. Finding 2: Patients were unclear as to how to self‐manage care or who to contact with questions after hospitalization. Program element: Transitional care nurse provides intensive peridischarge education, performs home visits within 3 days of discharge, and serves as a point person for patients during the peridischarge period. Finding 3: Among uninsured patients, cost was the leading barrier to taking medications as prescribed and often led to self‐rationing of medications without provider input. Program element: We developed a low‐cost, value‐based formulary for uninsured patients that parallels partnering clinic formularies, $4 plans, and medication assistance programs. After 30 days of program‐funded medications, patients then get medications through these other sources. Inpatient pharmacists consult on all patients to reconcile medications, identify access and adherence gaps, provide patient education, and communicate across settings. Finding 4: Comorbid depression was common. Program element: We sought partnerships with clinics with integrated mental health services. Finding 5: Over half of patients live in 3 counties surrounding Portland. Program element: We restricted our intervention to patients residing in local counties and included postdischarge home visits in our model. Partnering clinics match patient geographic distribution. Finding 6: Self‐ reported 6‐month readmission (60%) rates exceeded rates estimated by hospital administrative data (18%), supporting qualitative findings that patients seek care at numerous hospitals. Program element: Given that utilization claims data are unavailable for the uninsured, we included phone follow‐up surveys to assess self‐reported utilization 30 days postdischarge. Finding 7: Using administrative data, we estimated that the hospital loses an average of $11,000 per readmission per patient in direct, unremunerated costs. Indirect costs (such as costs of hospital staff) and opportunity costs (of potential revenue from an insured patient occupying the bed) were excluded, thus presenting a conservative estimate of cost savings. Program element: We used local cost data to support the business case and emphasize potential value of an up‐front investment in transitional care.
Defining the Setting
We convened a series of 3 work group meetings with diverse internal and external stakeholders (Table 4) to further define an intervention in the context of local health system realities. Work groups shaped the program in several specific ways. First, community clinic leaders emphasized that limited specialty access is an important barrier when caring for recently hospitalized uninsured and Medicaid patients. They felt expanded postdischarge access to specialists would be important to increase their capacity for recently discharged patients. Thus, we streamlined patients' posthospital specialty access for conditions treated during hospitalization. Second, initially we considered linking with 1 clinic; however, health systems researchers and clinic providers cautioned us, suggesting that partnering with multiple clinics would make our work more broadly applicable. Finally, pharmacists and financial assistance staff revealed that financial assistance forms are often not completed during hospitalization because inpatients lack access to income documentation. This led us to incorporate help with financial paperwork into the postdischarge intervention.
| Clinical staff |
| Hospital medicine physician |
| General internal medicine physician |
| Hospital ward nurse staff |
| Pharmacy (inpatient, outpatient, medication assistance programs) |
| Care management/social work |
| Emergency medicine |
| Health system leadership |
| Hospital administrative leadership |
| Primary care clinic leadership |
| Safety‐net clinic leadership |
| Specialty clinic leadership |
| Hospital business development and strategic planning |
| CareOregon (Medicaid managed care) leadership |
| Other |
| Patients |
| Health systems researchers |
| Clinical informatics |
| Hospital financials (billing, financial screening, admitting) |
Pilot Testing
We conducted pilot testing over 4 weeks, incorporating a Plan‐Do‐Study‐Act approach. For example, our transitional care nurse initially used an intervention guide with a list of steps outlined; however, we quickly discovered that the multiple and varied needs of this patient populationincluding housing, transportation, and foodwere overwhelming and pulled the nurse in many directions. In consultation with our quality improvement experts, we reframed the intervention guide as a checklist to be completed for each patient.
Pilot testing also underscored the importance of monthly meetings to promote shared learning and create a forum for communication and problem solving across settings. During these meetings, patient case discussions inform continuous quality improvement and promote energy‐sustaining team‐building. Information is then disseminated to each clinic site and arm of the intervention through a designated champion from each group. We also planned to meet monthly with the hospital executive director to balance service and research needs, and engage in rapid‐cycle change throughout our 1‐year demonstration project.
Funding the Program
We talked to others with experience implementing nurse‐led transitional care interventions. Based on these discussions, we anticipated our nurse would be able to see 200 patients over the course of 1 year, and we developed our budget accordingly (Table 2). From our needs assessment, we knew 60% of patients reported at least 1 hospitalization in the 6 months prior. If we assumed that 60% (120) of the 200 patients randomized to our intervention would get readmitted, then a 20% reduction would lead to 24 avoided readmissions and translate into $264,000 in savings for the health system. Even though the hospital would not reap all of these savings, as patients get admitted to other area hospitals, hospital administration acknowledged the value of setting the stage for community‐wide solutions. Moreover, the benefit was felt to extend beyond financial savings to improved quality and institutional learning around transitional care.
PROGRAM EVALUATION
We are conducting a clustered, randomized controlled trial to evaluate C‐TraIn's impact on quality, access, and high‐cost utilization at 30 days after hospital discharge. Results are anticipated in mid‐2012. We chose to perform an analysis clustered by admitting team, because communication between the C‐TraIn nurse, physician team, and pharmacist consult services could introduce secular change effects that could impact the care received by other patients on a given team. There are 5 general medicine resident teams, 1 hospitalist service, and 1 cardiology service, and the physician personnel for each team changes from month to month. Because the cardiology and hospitalist services differ slightly from resident teams, we chose a randomized cross‐over design such that intervention and control teams are redesignated every 3 months. To enhance internal validity, study personnel who enroll patients and administer baseline and 30‐day surveys are blinded to intervention status. We are collecting data on prior utilization, usual source of care, outpatient access, insurance, patient activation,6 functional status,7, 8 self‐rated health,7 health literacy, care transitions education,9 alcohol and substance abuse, and social support.10 Our primary outcome will be self‐reported 30‐day hospital readmission and ED use. We will also evaluate administrative claims data to identify 30‐day OHSU readmission and ED utilization rates. We will assess whether improved access to medications, rates of outpatient follow‐up and time to follow‐up mediate any effect on primary outcomes. Secondary outcomes will include outpatient utilization, patient activation, self‐rated health, and functional status.
Given limited experience with transitional care programs in socioeconomically disadvantaged patients, we are measuring acceptability and feasibility by tracking rates of those declining the intervention, and through semi‐structured interviews at 30 days. We are monitoring fidelity to core elements of the program through chart and checklist reviews, and seeking provider feedback through in‐person meetings with key implementers. To ensure possibility of broader adoption beyond OHSU, we are developing a toolkit that defines core program elements and can be adapted for use in various settings.
DISCUSSION
Using a process of broad stakeholder engagement, exposure of financial incentives, and data‐driven understanding of institutional and population needs, we built consensus and gained institutional financial commitment for implementation of a multicomponent transitional care program for uninsured and Medicaid patients. Our experience is relevant to other hospital systems, and may have particular relevance to academic medical centers, whose tripartite mission of clinical care, research, and education make them a natural place for healthcare reform.11
Several key lessons from our experience may be widely applicable. First, key administrative allies helped us understand institutional priorities and identify key institutional change‐agents. Though initial attempts to gain support were met cautiously, persistent advocacy, development of a strong business case, and support from several administrative allies compelled further leadership support. Second, unlike traditional grant funding cycles, hospital budgets operate in real‐time rapid‐change cycles, necessitating rapid data collection, analysis, and program design. Such demands could potentially threaten the viability of the program itself, or result in premature diffusion of novel practices into disparate populations. Communication with administrative leadership about the value of sound research design within the context of faster‐paced institutional needs was important and allowed time for data‐driven program development and diffusion. Simultaneously, we recognized the need to move quickly, provide regular progress updates, and use existing institutional resources, such as volunteer students and business development office, when possible.
We found that cross‐site hospitalcommunity partnerships are an essential program element. Partnership occurs through a payment agreement and through active engagement in ongoing quality improvement, including clinic representation at monthly team meetings. Clinic partnerships have enabled multidisciplinary cross‐site communication and relationships that facilitate innovation across routinely siloed elements of the system, allowing the team to anticipate and respond to patient problems before they lead to readmissions or poor outcomes. Our experience matches findings from recent program evaluations that found that care coordination attempts are unsuccessful without strong cross‐site linkages.12 These linkages are especially challenging and needed for uninsured and Medicaid patients, given their traditional lack of access and the additional social and financial barriers that influence their care.13
Limitations of our study include: implementation at a single, academic medical center; secular changes (which we mitigate against using randomized trial design); and potential for low power, if readmission rates are lower than anticipated from needs assessment data. Additionally, the need for a willing and invested program champion to coordinate an often messy, complex intervention may limit generalizability.
While transitional care programs continue to proliferate in response to increasingly recognized gaps in a fragmented care system,14, 15 few interventions specifically address the needs of socioeconomically disadvantaged patients. The major study that did5 was conducted in Massachusetts, where many patients received care through a state Free Care program and robust local safety‐net. Others have largely been tested in integrated care settings,1 and target patients who are part of managed care programs.1, 4, 16
To our knowledge, there are no well‐described programs that include explicit purchasing of outpatient medical homes for uninsured patients who would not otherwise have access to care. Our experience shifts the paradigm of the role of hospitals in care for the uninsured and underinsured: instead of a reactive, uncoordinated role, we assert that the hospital's strategic up‐front allocation of resources has a sound business, quality, and ethical foundation. This is especially important, given a new era of payment reform and coordinated care organizations. There is an opportunity to both improve quality for the uninsured and Medicaid patients, control costs, and gain valuable experience that can inform transitional care improvements for broader patient populations. If our study is successful in reducing readmissions, there may be important implications as to how to redefine the hospital's role in outpatient access to care linkages, especially for uninsured and Medicaid patients.
Acknowledgements
The authors acknowledge Char Riley, Dawn Whitney, and Tara Harben of OHSU, as well as volunteer research assistants Amie Leaverton, Molly McClain, Emily Johnson, Travis Geraci, and Claudia Sells.
- ,,,.The care transitions intervention: results of a randomized controlled trial.Arch Intern Med.2006;166(17):1822–1828.
- ,,,,.Medicaid patients at high risk for frequent hospital admission: real‐time identification and remediable risks.J Urban Health.2009;86(2):230–241.
- ,,,,,.Transitional care of older adults hospitalized with heart failure: a randomized, controlled trial.J Am Geriatr Soc.2004;52(5):675–684.
- ,,,,.The effect of Evercare on hospital use.J Am Geriatr Soc.2003;51(10):1427–1434.
- ,,, et al.A reengineered hospital discharge program to decrease rehospitalization: a randomized trial.Ann Intern Med.2009;150(3):178–187.
- ,,,.Development of the patient activation measure (PAM): conceptualizing and measuring activation in patients and consumers.Health Serv Res.2004;39(4 pt 1):1005–1026.
- The EuroQol Group.EuroQol—a new facility for the measurement of health‐related quality of life.Health Policy.1990;16(3):199–208.
- ,,,,,.Trajectories of life‐space mobility after hospitalization.Ann Intern Med.2009;150(6):372–378.
- ,,.Assessing the quality of preparation for posthospital care from the patient's perspective: the care transitions measure.Med Care.2005;43(3):246–255.
- ,,,.Assessing social support: the social support questionnaire.J Pers Soc Psychol.1983;44(1):127–139.
- .Payment reform and the mission of academic medical centers.N Engl J Med.2010;363(19):1784–1786.
- ,,,.Effects of care coordination on hospitalization, quality of care, and health care expenditures among Medicare beneficiaries: 15 randomized trials.JAMA.2009;301(6):603–618.
- ,,,.Post‐discharge intervention in vulnerable, chronically ill patients.J Hosp Med.2012;7(2):124–130.
- ,,, et al.Discharge planning from hospital to home.Cochrane Database Syst Rev.2010(1):000313.
- .Preventing the rebound: improving care transition in hospital discharge processes.Aust Health Rev.2010;34(4):445–451.
- ,,, et al.Comprehensive discharge planning and home follow‐up of hospitalized elders: a randomized clinical trial.JAMA.1999;281(7):613–620.
Improving Sleep in Hospitalized Patients
In recent years, the philosophy of major hospitals has become more patient‐centered with increased focus on outcomes, safety, and patient satisfaction. To this end, many hospitals are looking for innovative ways not only to optimize quality of care, but also to improve patient satisfaction.
Sleep is a domain in which the goals of improving patient outcomes and satisfaction can be mutually achieved. Poor sleep has become a prevalent problem, and a single night of complete sleep loss can result in the undesirable consequences of daytime sleepiness, lethargy, irritability, confusion, and poor short‐term memory.1, 2 Literature has also suggested that chronic partial sleep loss can have significant consequences for safety, mood stability, neurological and medical functioning, and quality of life.38 The importance of acknowledging the relationship between sleep and a patient's level of functioning is magnified in the context of hospitalized patients, particularly those undergoing neurological inpatient care. Changes in level of alertness due to sleep loss can have serious implications for these patients, as they can lead to unnecessary testing and decreased participation with rehabilitative services.
Among the potential causes of sleep deprivation in hospitalized patients are poor pain control, lights, activities of others, and increased noise levels. The effect that increased noise has on patients has been evaluated in a variety of hospital settings, most notably in pediatric and adult intensive care units and nursing homes.9, 10 Noise has been shown to increase blood pressure, heart rate, respiratory rate, and body temperature. It has also been associated with failure to thrive, impaired immune function, delayed wound healing, and increased stress levels.11
The majority of literature regarding sleep disturbance in the hospital has focused on sleep disruption in the intensive care unit, where interventions associated with sleep loss are required to deliver the appropriate standard level of care.1218 However, few evidence‐based strategies to promote sleep quality in hospitalized patients have been evaluated.16, 1823 In this study, we aimed to examine sleep among neurological and neurosurgical inpatients, identify specific sleep‐disruptive factors, and assess patient satisfaction regarding their sleep. We implemented a sleep‐promoting protocol with the hypothesis that improvement of modifiable sleep‐disruptive factors would improve sleep and patient satisfaction.
METHODS
Study Design
This prospective, observational study was designed and implemented by an interdisciplinary team of physicians, neuroscience nurses, and hospital administrators.
Patient Selection
The study was performed on a Neurology and Neurosurgery unit, with both private and semi‐private rooms, at a large, urban, tertiary teaching hospital from February 2009 through June 2010. During enrollment periods, all patients on the unit were screened daily for eligibility. Eligible patients were medically stable and capable of giving verbal consent. Patients who were less than 16 years of age, encephalopathic, aphasic, or non‐English speaking were excluded. Eligible patients were asked for consent to participate in the study. After consultation with the hospital's institutional review board (IRB) committee, written consent was waived in this observational, quality improvement study.
Study Timeline
The study comprised 4 phases (Figure 1). In Phase 1, we collected baseline data on patients in the unit. Data were collected in the form of sleep surveys, Press Ganey surveys, and noise meter recordings. The baseline phase (Phase 1) lasted 10 weeks from February to April 2009. We then implemented a novel sleep‐promoting intervention called Basic Sleep Rounds (Phase 2, May to August 2009). After discontinuing Basic Sleep Rounds, data were collected for the washout phase (Phase 3, September 2009 to February 2010). An enhanced version of the sleep‐promoting intervention called Deluxe Sleep Rounds was then instituted (Phase 4, March to June 2010). In Phases 2 and 4, sleep rounds were implemented for 2 weeks before data collection to ensure uniform application of Sleep Rounds.

Sleep Promoting Interventions
Prior to implementing Basic Sleep Rounds in Phase 2, a nursing in‐service was performed where staff were educated about sleep in the hospital and about the planned interventions, and posters promoting sleep were hung on the unit. Basic Sleep Rounds were performed during Phase 2 by the patient's bedside nurse or the unit charge nurse. This occurred for all patients on the unit at approximately 23:00 nightly using the Basic Sleep Rounds checklist, which formalized simple hospital functions, such as lights out, television off, room temperature adjustment, and a final restroom usage (Figure 2). For Phase 4, a team of undergraduate volunteers was organized to assist with the delivery of Sleep Rounds. In this phase (Deluxe Sleep Rounds), nurses performed Basic Sleep Rounds by completing the checklist, and undergraduate volunteers offered patients any of the following sleep amenities: warm blanket, warm milk, white‐noise machine, hypoallergenic lotion, or room spritzer.24, 25

Additionally, during the Basic and Deluxe intervention phases, noise‐sensitive traffic lights (Talk Light Too;
Data Collection
A survey was designed to evaluate sleep quality, estimate sleep quantity, identify sleep disruptors, and assess patient satisfaction (see Supporting Figure 1 in the online version of this article). The survey was given to all eligible participants on the morning after their second night in the unit. This time point was chosen to account for potentially confounding first night effects, and to ensure that enrolled patients spent a full night in the unit.
To better evaluate one of the sleep disruptors, a subset of the survey participants had noise meters placed in their rooms. Every morning, a member of the team would visit all eligible patients to ask if they were willing to participate in this portion of the study. Data recorded between 8:00 PM and 8:00 AM on the second night of each participant's stay were later used for analysis. Noise was recorded in decibels using a Vernier Sound Level Meter, attached to a LabQuest data collection device (
Scores from Press Ganey surveys were also analyzed. These surveys were mailed to patients shortly after hospital discharge, and subsequently processed by Press Ganey Associates, Inc (
Data Analysis
Most datasets were not described by a normal distribution, thus most data are presented as medians with interquartile ranges (IQR), and comparisons between datasets were made using the MannWhitney U test. Press Ganey data are presented as means with standard errors of the mean, as distributed by Press Ganey. P < 0.05 was considered significant for all data comparisons.
RESULTS
Basic demographic data were available on all participants from whom both noise and survey data were collected. As in Table 1, these participants were demographically similar (P < 0.05) with regards to age, sex, and ethnic background. For unknown reasons, neurosurgery patients comprised the majority of participants in Phases 1 and 3, and neurology patients comprised the majority in Phase 2. This difference was not significant.
| Demographic | Phase 1 (n = 32) | Phase 2 (n = 33) | Phase 3 (n = 30) |
|---|---|---|---|
| Average age | 49 1 | 43 3 | 46 3 |
| % Female | 71% | 71% | 57% |
| % Neurology | 42% | 65% | 37% |
| % White | 67% | 77% | 73% |
Sleep Survey
A total of 253 sleep surveys were collected in all 4 phases. Data generated from these surveys are demonstrated in Table 2. On a 7‐point scale (1 being the best score, corresponding to the answer none, and 7 the worst, corresponding to extreme), the median scores for overall difficulty sleeping were not significantly different in Phases 1, 2, and 4. In Phase 3, the median score was 4 (moderate), significantly worse than in the other 3 phases (0.002 < P < 0.01). Despite the reported difficulty sleeping during Phase 3, the median number of hours of sleep and awakenings in Phases 1, 2, 3, and 4 were not significantly different. Sleep latency was scored on a 6‐point scale (1 being the best, corresponding to 010 min, and 6 the worst, corresponding to greater than 45 minutes). Similar sleep latency was reported in Phases 1, 3, and 4. However, median sleep latency in Phase 2 was 1 (010 min), significantly shorter than in the other phases (0.001 < P < 0.02). Despite similar survey results throughout most of the phases, there was a significant improvement in sleep latency in the Basic Sleep Rounds phase (Phase 2), and a significant worsening in overall difficulty sleeping in the washout phase (Phase 3).
| Survey Question | Phase 1 | Phase 2 | Phase 3 | Phase 4 |
|---|---|---|---|---|
| ||||
| 1. How much difficulty did you have sleeping last night? | 3 | 2 | 4* | 3 |
| IQR 4 N = 100 | IQR 4 N = 78 | IQR 3 N = 75 | IQR 2 N = 22 | |
| 2. How many hours did you sleep last night? | 6 hr | 6 hr | 5 hr | 5 hr |
| IQR 4 N = 98 | IQR 3 N = 77 | IQR 3 N = 72 | IQR 2 N = 22 | |
| 3. About how many times did you wake up during the night while you were trying to sleep? | 3 | 3 | 4 | 3 |
| IQR 3 N = 101 | IQR 3 N = 77 | IQR 3 N = 73 | IQR 3 N = 22 | |
| 4. How long did it take you to go to sleep last night? | 3 (1620 min) | 1 (010 min) | 2 (1115 min) | 2 (1115 min) |
| IQR 3 N = 101 | IQR 2 N = 77 | IQR 4 N = 75 | IQR 3 N = 22 | |
Participants also ranked each of the 7 queried disruptive factors on a 7‐point scale with regards to degree of sleep interruption. Even though less than half of the participants were in shared rooms, the presence of a roommate among those with roommates was the only sleep disrupter that ranked differently among the 4 phases. In Phases 1 and 2, when asked how much their sleep was disturbed by roommates, the median response was 1 (none), IQR = 1 (N = 41 and 31, respectively). In Phase 4, the median was 2 (a little), IQR = 2 (N = 6), but not significantly different. Answers in Phase 3 were significantly different, with a median of 3 (mild), IQR = 3 (N = 30) (0.005 < P < 0.006). Because there were no other statistically significant differences among individual sleep disruptors as compared by phases, survey data from all 4 phases for these factors was also analyzed collectively. Pain and staff interruptions (IQR = 3, N = 252 and IQR = 2, N = 253, respectively) were reported as the most disturbing factors, each with a median of 2 (a little). All remaining factors had a median score of 1 (none): noise inside the room (IQR = 2, N = 253), noise outside of the room (IQR = 1, N = 253), temperature (IQR = 1, N = 253), noise outside of the building (IQR = 0, N = 252), and light (IQR = 0, N = 252).
Noise Meter Recordings
Noise data were recorded from 95 participants in Phases 1 through 3, yielding high‐quality data suitable for analysis from 63 participants (11 in Phase 1, 24 in Phase 2, and 28 in Phase 3). Recorded noise ranged from 35 to 80 dB. As shown in Supporting Figure 2 in the online version of this article, raw data were plotted as decibels as a function of time. Noise levels were then analyzed in aggregate and for each of four 3‐hour time blocks (8 PM11 PM, 11 PM 2 AM,, 2 AM 5 AM, and 5 AM8 AM). Median noise levels during the entire 12‐hour period increased significantly between the first 3 phases of the study (P < 0.001): 38.6 dB (IQR 5.4) in Phase 1; 40.6 dB (IQR 5.3) in Phase 2; and 43.5 (IQR 7) in Phase 3. As in Supporting Table 1 in the online version of this article, within each phase, the median noise levels were significantly less during the 11 PM2 AM and 2 AM5 AM periods, as compared to the 8 PM11 PM and 5 AM8 AM periods (P < 0.001). Due to equipment dysfunction, noise data were not available for Phase 4.
Press Ganey Survey
A total of 457 Press Ganey surveys were collected. According to these surveys, patients' mean raw score of noise, on a scale from 1 to 100 (100 representing the best score), ranged from a low of 59.5 7.2 (January 2010; N = 21) to a high of 82.1 5.2 (April 2009; N = 21). Figure 3 illustrates the monthly trend of the mean score for noise compared to the national average compiled from other large hospitals around the country. It demonstrates that during the phases in which Sleep Rounds were performed (Phases 2 and 4), patients' perceptions of noise were improved.

DISCUSSION
The major conclusions of this study are: 1) hospitalized patients suffer from poor sleep quality and quantity; 2) implementation of simple measures such as Sleep Rounds to change standard practice within the hospital is feasible and effective; and 3) despite an increase in measured noise, patients' perception of their sleep and of noise levels was improved by these measures. This study developed and tested a sleep promotion program that could easily be implemented on any inpatient floor. Our Sleep Rounds checklist outlines a novel, but simple approach to sleep health by hospital providers, with the immediate goal of improving sleep among inpatients and the ultimate goal of improving outcomes.
Our study confirms that sleep disruption is prevalent among patients admitted to general hospital wards. In this study, patients reported a median of 5 hours of sleep, 3 awakenings, and sleep latency of 1115 minutes. Although not alarmingly low, 5 hours is only 60% of the recommended 8 hours of sleep for healthy individuals each night and 72% of the 6.9 hours of sleep reported by the average American each night.26 Poor pain control, frequent staff interactions, and the presence of roommates were rated as most problematic by the patients we surveyed. Interestingly, patients rated noise, temperature, and light as less problematic sleep disruptors.
Although we did not detect a statistically significant improvement in total sleep time or number of awakenings, there was a significant improvement in sleep latency during Phase 2 of the study when Basic Sleep Rounds were performed. In Phase 3 (washout phase), there was less active participation by the nursing staff in sleep hygiene promotion, and patients' perception of sleep quality was significantly worse than it was in other phases. These results suggest that the perception of sleep quality and quantity could have been enhanced by both our Basic (Phase 2) and Deluxe (Phase 4) Sleep Rounds interventions.
We were able to achieve appropriate noise levels at night (40 dB) during this study, even before our intervention began.27 Noise levels increased 2 dB between Phases 1 and 2, and another 3 dB in Phase 3. Although the changes in decibel level were statistically significant, a change of 23 dB is barely perceptible.28 Interestingly, despite the increase in measured noise throughout the study, Press Ganey results showed a trend towards perceived improvement in noise levels just before implementation of the first intervention. This may be attributable to an increased awareness of noise created by consenting patients and placing noise meters in their rooms. Perception of noise worsened significantly during the washout phase, suggesting that abandonment of Sleep Rounds was associated with less concern about noise.
Prior to initiating this study, an educational in‐service was conducted for the nursing team regarding the purpose and overall aims of this project. This may have raised awareness of the importance of sleep before collection of Phase 1 data, and had the unintended effect of an increased focus on sleep even before Sleep Rounds began. Other limitations of the study include lack of objective sleep data, nonrandomized design, inability to demonstrate causality, generalizability of results, inability to control for comorbidity including baseline sleep hygiene, limited patient numbers, inability to blind patients and team members, and difficulty obtaining accurate and complete noise data on all patients enrolled.
This study suggests that although it remains difficult for patients to sleep well in the hospital, it is possible to improve sleep and patients' perception of their sleep while they are hospitalized. Further studies are warranted to systematically evaluate interventions aimed at improving and overcoming the identified sleep disruptors without compromising patient care. However, we believe that Sleep Rounds could be associated with improvements in inpatient sleep hygiene and patient satisfaction, and could ultimately benefit patient outcomes.
Acknowledgements
The authors thank JoEllen Robinson, Jane Hill, and the nursing staff of Meyer 8 for their invaluable contributions to this project.
- .Sleep in acute care settings: an integrative review.J Nurs Scholarsh.2000;32(1):31–38.
- ,.Nursing standard‐of‐practice protocol: sleep disturbances in elderly patients. The NICHE Faculty.Geriatr Nurs.1995;16(5):238–243.
- ,,, et al.Sleep patterns and mortality among elderly patients in a geriatric hospital.Gerontology.2000;46(6):318–322.
- ,,.Sleep, insomnia and falls in elderly patients.Sleep Med.2008;9(suppl 1):S18–S22.
- ,,,,,.Behavioural and physiological reactivity to noise in the newborn.J Paediatr Child Health.2004;40(5–6):275–281.
- ,,.Sleep problems as a risk factor for falls in a sample of community‐dwelling adults aged 64–99 years.J Am Geriatr Soc.2000;48(10):1234–1240.
- ,,, et al.Reducing dangerous nighttime events in persons with dementia by using a nighttime monitoring system.Alzheimers Dement.2009;5(5):419–426.
- ,.Neurocognitive consequences of sleep deprivation.Semin Neurol.2005;25(1):117–129.
- ,,,,.The nursing home at night: effects of an intervention on noise, light, and sleep.J Am Geriatr Soc.1999;47(4):430–438.
- ,,,,.Sleep in hospitalized elders: a pilot study.Geriatr Nurs.2010;31(4):263–271.
- ,.Interactive relationships between hospital patients' noise‐induced stress and other stress with sleep.Heart Lung.2001;30(4):237–243.
- ,,.The impact of noise on patients' sleep and the effectiveness of noise reduction strategies in intensive care units.Crit Care.2009;13(2):208.
- ,,,,,.Sleep in critically ill patients requiring mechanical ventilation.Chest.2000;117(3):809–818.
- ,.Adverse effects of sleep deprivation in the ICU.Crit Care Clin.2008;24(3):461–476, v–vi.
- ,,,,.Abnormal sleep/wake cycles and the effect of environmental noise on sleep disruption in the intensive care unit.Am J Respir Crit Care Med.2001;163(2):451–457.
- ,.Responses of premature infants to routine nursing interventions and noise in the NICU.Nurs Res.1995;44(3):179–185.
- ,,,,.Noise, stress, and annoyance in a pediatric intensive care unit.Crit Care Med.2003;31(1):113–119.
- ,,,,.Effects of guidelines implementation in a surgical intensive care unit to control nighttime light and noise levels.Crit Care Med.2000;28(7):2242–2247.
- ,,,,.Noise control: a nursing team's approach to sleep promotion.Am J Nurs.2004;104(2):40–48; quiz 48–49.
- ,,, et al.Environmental noise sources and interventions to minimize them: a tale of 2 hospitals.J Nurs Care Qual.2008;23(3):216–224; quiz 225–216.
- ,,, et al.Interventions to reduce decibel levels on patient care units.Am Surg.1998;64(9):894–899.
- ,,,.Examining the feasibility of implementing specific nursing interventions to promote sleep in hospitalized elderly patients.Geriatr Nurs.2008;29(3):197–206.
- ,,,.Applicability of two brief evidence‐based interventions to improve sleep quality in inpatient mental health care.Int J Ment Health Nurs.2011;20(5)319–327.
- .Sleep deprivation in critical care units.Crit Care Nurs Q.2003;26(3):179–189; quiz 190–171.
- ,,,.Sleep promotion in hospitalized elders.Medsurg Nurs.2003;12(5):279–289; quiz 290.
- 2005 NSF Sleep in America Poll.Washington, DC:National Sleep Foundation;2005.
- ,,.Guidelines for Community Noise.Geneva, Switzerland:World Health Organization;1999.
- PhysicsArchives.com.2010. Available at: http://physicsarchives.com/index.php/courses/219. Accessed May 15, 2011.
In recent years, the philosophy of major hospitals has become more patient‐centered with increased focus on outcomes, safety, and patient satisfaction. To this end, many hospitals are looking for innovative ways not only to optimize quality of care, but also to improve patient satisfaction.
Sleep is a domain in which the goals of improving patient outcomes and satisfaction can be mutually achieved. Poor sleep has become a prevalent problem, and a single night of complete sleep loss can result in the undesirable consequences of daytime sleepiness, lethargy, irritability, confusion, and poor short‐term memory.1, 2 Literature has also suggested that chronic partial sleep loss can have significant consequences for safety, mood stability, neurological and medical functioning, and quality of life.38 The importance of acknowledging the relationship between sleep and a patient's level of functioning is magnified in the context of hospitalized patients, particularly those undergoing neurological inpatient care. Changes in level of alertness due to sleep loss can have serious implications for these patients, as they can lead to unnecessary testing and decreased participation with rehabilitative services.
Among the potential causes of sleep deprivation in hospitalized patients are poor pain control, lights, activities of others, and increased noise levels. The effect that increased noise has on patients has been evaluated in a variety of hospital settings, most notably in pediatric and adult intensive care units and nursing homes.9, 10 Noise has been shown to increase blood pressure, heart rate, respiratory rate, and body temperature. It has also been associated with failure to thrive, impaired immune function, delayed wound healing, and increased stress levels.11
The majority of literature regarding sleep disturbance in the hospital has focused on sleep disruption in the intensive care unit, where interventions associated with sleep loss are required to deliver the appropriate standard level of care.1218 However, few evidence‐based strategies to promote sleep quality in hospitalized patients have been evaluated.16, 1823 In this study, we aimed to examine sleep among neurological and neurosurgical inpatients, identify specific sleep‐disruptive factors, and assess patient satisfaction regarding their sleep. We implemented a sleep‐promoting protocol with the hypothesis that improvement of modifiable sleep‐disruptive factors would improve sleep and patient satisfaction.
METHODS
Study Design
This prospective, observational study was designed and implemented by an interdisciplinary team of physicians, neuroscience nurses, and hospital administrators.
Patient Selection
The study was performed on a Neurology and Neurosurgery unit, with both private and semi‐private rooms, at a large, urban, tertiary teaching hospital from February 2009 through June 2010. During enrollment periods, all patients on the unit were screened daily for eligibility. Eligible patients were medically stable and capable of giving verbal consent. Patients who were less than 16 years of age, encephalopathic, aphasic, or non‐English speaking were excluded. Eligible patients were asked for consent to participate in the study. After consultation with the hospital's institutional review board (IRB) committee, written consent was waived in this observational, quality improvement study.
Study Timeline
The study comprised 4 phases (Figure 1). In Phase 1, we collected baseline data on patients in the unit. Data were collected in the form of sleep surveys, Press Ganey surveys, and noise meter recordings. The baseline phase (Phase 1) lasted 10 weeks from February to April 2009. We then implemented a novel sleep‐promoting intervention called Basic Sleep Rounds (Phase 2, May to August 2009). After discontinuing Basic Sleep Rounds, data were collected for the washout phase (Phase 3, September 2009 to February 2010). An enhanced version of the sleep‐promoting intervention called Deluxe Sleep Rounds was then instituted (Phase 4, March to June 2010). In Phases 2 and 4, sleep rounds were implemented for 2 weeks before data collection to ensure uniform application of Sleep Rounds.
Sleep Promoting Interventions
Prior to implementing Basic Sleep Rounds in Phase 2, a nursing in‐service was performed where staff were educated about sleep in the hospital and about the planned interventions, and posters promoting sleep were hung on the unit. Basic Sleep Rounds were performed during Phase 2 by the patient's bedside nurse or the unit charge nurse. This occurred for all patients on the unit at approximately 23:00 nightly using the Basic Sleep Rounds checklist, which formalized simple hospital functions, such as lights out, television off, room temperature adjustment, and a final restroom usage (Figure 2). For Phase 4, a team of undergraduate volunteers was organized to assist with the delivery of Sleep Rounds. In this phase (Deluxe Sleep Rounds), nurses performed Basic Sleep Rounds by completing the checklist, and undergraduate volunteers offered patients any of the following sleep amenities: warm blanket, warm milk, white‐noise machine, hypoallergenic lotion, or room spritzer.24, 25
Additionally, during the Basic and Deluxe intervention phases, noise‐sensitive traffic lights (Talk Light Too;
Data Collection
A survey was designed to evaluate sleep quality, estimate sleep quantity, identify sleep disruptors, and assess patient satisfaction (see Supporting Figure 1 in the online version of this article). The survey was given to all eligible participants on the morning after their second night in the unit. This time point was chosen to account for potentially confounding first night effects, and to ensure that enrolled patients spent a full night in the unit.
To better evaluate one of the sleep disruptors, a subset of the survey participants had noise meters placed in their rooms. Every morning, a member of the team would visit all eligible patients to ask if they were willing to participate in this portion of the study. Data recorded between 8:00 PM and 8:00 AM on the second night of each participant's stay were later used for analysis. Noise was recorded in decibels using a Vernier Sound Level Meter, attached to a LabQuest data collection device (
Scores from Press Ganey surveys were also analyzed. These surveys were mailed to patients shortly after hospital discharge, and subsequently processed by Press Ganey Associates, Inc (
Data Analysis
Most datasets were not described by a normal distribution, thus most data are presented as medians with interquartile ranges (IQR), and comparisons between datasets were made using the MannWhitney U test. Press Ganey data are presented as means with standard errors of the mean, as distributed by Press Ganey. P < 0.05 was considered significant for all data comparisons.
RESULTS
Basic demographic data were available on all participants from whom both noise and survey data were collected. As in Table 1, these participants were demographically similar (P < 0.05) with regards to age, sex, and ethnic background. For unknown reasons, neurosurgery patients comprised the majority of participants in Phases 1 and 3, and neurology patients comprised the majority in Phase 2. This difference was not significant.
| Demographic | Phase 1 (n = 32) | Phase 2 (n = 33) | Phase 3 (n = 30) |
|---|---|---|---|
| Average age | 49 1 | 43 3 | 46 3 |
| % Female | 71% | 71% | 57% |
| % Neurology | 42% | 65% | 37% |
| % White | 67% | 77% | 73% |
Sleep Survey
A total of 253 sleep surveys were collected in all 4 phases. Data generated from these surveys are demonstrated in Table 2. On a 7‐point scale (1 being the best score, corresponding to the answer none, and 7 the worst, corresponding to extreme), the median scores for overall difficulty sleeping were not significantly different in Phases 1, 2, and 4. In Phase 3, the median score was 4 (moderate), significantly worse than in the other 3 phases (0.002 < P < 0.01). Despite the reported difficulty sleeping during Phase 3, the median number of hours of sleep and awakenings in Phases 1, 2, 3, and 4 were not significantly different. Sleep latency was scored on a 6‐point scale (1 being the best, corresponding to 010 min, and 6 the worst, corresponding to greater than 45 minutes). Similar sleep latency was reported in Phases 1, 3, and 4. However, median sleep latency in Phase 2 was 1 (010 min), significantly shorter than in the other phases (0.001 < P < 0.02). Despite similar survey results throughout most of the phases, there was a significant improvement in sleep latency in the Basic Sleep Rounds phase (Phase 2), and a significant worsening in overall difficulty sleeping in the washout phase (Phase 3).
| Survey Question | Phase 1 | Phase 2 | Phase 3 | Phase 4 |
|---|---|---|---|---|
| ||||
| 1. How much difficulty did you have sleeping last night? | 3 | 2 | 4* | 3 |
| IQR 4 N = 100 | IQR 4 N = 78 | IQR 3 N = 75 | IQR 2 N = 22 | |
| 2. How many hours did you sleep last night? | 6 hr | 6 hr | 5 hr | 5 hr |
| IQR 4 N = 98 | IQR 3 N = 77 | IQR 3 N = 72 | IQR 2 N = 22 | |
| 3. About how many times did you wake up during the night while you were trying to sleep? | 3 | 3 | 4 | 3 |
| IQR 3 N = 101 | IQR 3 N = 77 | IQR 3 N = 73 | IQR 3 N = 22 | |
| 4. How long did it take you to go to sleep last night? | 3 (1620 min) | 1 (010 min) | 2 (1115 min) | 2 (1115 min) |
| IQR 3 N = 101 | IQR 2 N = 77 | IQR 4 N = 75 | IQR 3 N = 22 | |
Participants also ranked each of the 7 queried disruptive factors on a 7‐point scale with regards to degree of sleep interruption. Even though less than half of the participants were in shared rooms, the presence of a roommate among those with roommates was the only sleep disrupter that ranked differently among the 4 phases. In Phases 1 and 2, when asked how much their sleep was disturbed by roommates, the median response was 1 (none), IQR = 1 (N = 41 and 31, respectively). In Phase 4, the median was 2 (a little), IQR = 2 (N = 6), but not significantly different. Answers in Phase 3 were significantly different, with a median of 3 (mild), IQR = 3 (N = 30) (0.005 < P < 0.006). Because there were no other statistically significant differences among individual sleep disruptors as compared by phases, survey data from all 4 phases for these factors was also analyzed collectively. Pain and staff interruptions (IQR = 3, N = 252 and IQR = 2, N = 253, respectively) were reported as the most disturbing factors, each with a median of 2 (a little). All remaining factors had a median score of 1 (none): noise inside the room (IQR = 2, N = 253), noise outside of the room (IQR = 1, N = 253), temperature (IQR = 1, N = 253), noise outside of the building (IQR = 0, N = 252), and light (IQR = 0, N = 252).
Noise Meter Recordings
Noise data were recorded from 95 participants in Phases 1 through 3, yielding high‐quality data suitable for analysis from 63 participants (11 in Phase 1, 24 in Phase 2, and 28 in Phase 3). Recorded noise ranged from 35 to 80 dB. As shown in Supporting Figure 2 in the online version of this article, raw data were plotted as decibels as a function of time. Noise levels were then analyzed in aggregate and for each of four 3‐hour time blocks (8 PM11 PM, 11 PM 2 AM,, 2 AM 5 AM, and 5 AM8 AM). Median noise levels during the entire 12‐hour period increased significantly between the first 3 phases of the study (P < 0.001): 38.6 dB (IQR 5.4) in Phase 1; 40.6 dB (IQR 5.3) in Phase 2; and 43.5 (IQR 7) in Phase 3. As in Supporting Table 1 in the online version of this article, within each phase, the median noise levels were significantly less during the 11 PM2 AM and 2 AM5 AM periods, as compared to the 8 PM11 PM and 5 AM8 AM periods (P < 0.001). Due to equipment dysfunction, noise data were not available for Phase 4.
Press Ganey Survey
A total of 457 Press Ganey surveys were collected. According to these surveys, patients' mean raw score of noise, on a scale from 1 to 100 (100 representing the best score), ranged from a low of 59.5 7.2 (January 2010; N = 21) to a high of 82.1 5.2 (April 2009; N = 21). Figure 3 illustrates the monthly trend of the mean score for noise compared to the national average compiled from other large hospitals around the country. It demonstrates that during the phases in which Sleep Rounds were performed (Phases 2 and 4), patients' perceptions of noise were improved.
DISCUSSION
The major conclusions of this study are: 1) hospitalized patients suffer from poor sleep quality and quantity; 2) implementation of simple measures such as Sleep Rounds to change standard practice within the hospital is feasible and effective; and 3) despite an increase in measured noise, patients' perception of their sleep and of noise levels was improved by these measures. This study developed and tested a sleep promotion program that could easily be implemented on any inpatient floor. Our Sleep Rounds checklist outlines a novel, but simple approach to sleep health by hospital providers, with the immediate goal of improving sleep among inpatients and the ultimate goal of improving outcomes.
Our study confirms that sleep disruption is prevalent among patients admitted to general hospital wards. In this study, patients reported a median of 5 hours of sleep, 3 awakenings, and sleep latency of 1115 minutes. Although not alarmingly low, 5 hours is only 60% of the recommended 8 hours of sleep for healthy individuals each night and 72% of the 6.9 hours of sleep reported by the average American each night.26 Poor pain control, frequent staff interactions, and the presence of roommates were rated as most problematic by the patients we surveyed. Interestingly, patients rated noise, temperature, and light as less problematic sleep disruptors.
Although we did not detect a statistically significant improvement in total sleep time or number of awakenings, there was a significant improvement in sleep latency during Phase 2 of the study when Basic Sleep Rounds were performed. In Phase 3 (washout phase), there was less active participation by the nursing staff in sleep hygiene promotion, and patients' perception of sleep quality was significantly worse than it was in other phases. These results suggest that the perception of sleep quality and quantity could have been enhanced by both our Basic (Phase 2) and Deluxe (Phase 4) Sleep Rounds interventions.
We were able to achieve appropriate noise levels at night (40 dB) during this study, even before our intervention began.27 Noise levels increased 2 dB between Phases 1 and 2, and another 3 dB in Phase 3. Although the changes in decibel level were statistically significant, a change of 23 dB is barely perceptible.28 Interestingly, despite the increase in measured noise throughout the study, Press Ganey results showed a trend towards perceived improvement in noise levels just before implementation of the first intervention. This may be attributable to an increased awareness of noise created by consenting patients and placing noise meters in their rooms. Perception of noise worsened significantly during the washout phase, suggesting that abandonment of Sleep Rounds was associated with less concern about noise.
Prior to initiating this study, an educational in‐service was conducted for the nursing team regarding the purpose and overall aims of this project. This may have raised awareness of the importance of sleep before collection of Phase 1 data, and had the unintended effect of an increased focus on sleep even before Sleep Rounds began. Other limitations of the study include lack of objective sleep data, nonrandomized design, inability to demonstrate causality, generalizability of results, inability to control for comorbidity including baseline sleep hygiene, limited patient numbers, inability to blind patients and team members, and difficulty obtaining accurate and complete noise data on all patients enrolled.
This study suggests that although it remains difficult for patients to sleep well in the hospital, it is possible to improve sleep and patients' perception of their sleep while they are hospitalized. Further studies are warranted to systematically evaluate interventions aimed at improving and overcoming the identified sleep disruptors without compromising patient care. However, we believe that Sleep Rounds could be associated with improvements in inpatient sleep hygiene and patient satisfaction, and could ultimately benefit patient outcomes.
Acknowledgements
The authors thank JoEllen Robinson, Jane Hill, and the nursing staff of Meyer 8 for their invaluable contributions to this project.
- .Sleep in acute care settings: an integrative review.J Nurs Scholarsh.2000;32(1):31–38.
- ,.Nursing standard‐of‐practice protocol: sleep disturbances in elderly patients. The NICHE Faculty.Geriatr Nurs.1995;16(5):238–243.
- ,,, et al.Sleep patterns and mortality among elderly patients in a geriatric hospital.Gerontology.2000;46(6):318–322.
- ,,.Sleep, insomnia and falls in elderly patients.Sleep Med.2008;9(suppl 1):S18–S22.
- ,,,,,.Behavioural and physiological reactivity to noise in the newborn.J Paediatr Child Health.2004;40(5–6):275–281.
- ,,.Sleep problems as a risk factor for falls in a sample of community‐dwelling adults aged 64–99 years.J Am Geriatr Soc.2000;48(10):1234–1240.
- ,,, et al.Reducing dangerous nighttime events in persons with dementia by using a nighttime monitoring system.Alzheimers Dement.2009;5(5):419–426.
- ,.Neurocognitive consequences of sleep deprivation.Semin Neurol.2005;25(1):117–129.
- ,,,,.The nursing home at night: effects of an intervention on noise, light, and sleep.J Am Geriatr Soc.1999;47(4):430–438.
- ,,,,.Sleep in hospitalized elders: a pilot study.Geriatr Nurs.2010;31(4):263–271.
- ,.Interactive relationships between hospital patients' noise‐induced stress and other stress with sleep.Heart Lung.2001;30(4):237–243.
- ,,.The impact of noise on patients' sleep and the effectiveness of noise reduction strategies in intensive care units.Crit Care.2009;13(2):208.
- ,,,,,.Sleep in critically ill patients requiring mechanical ventilation.Chest.2000;117(3):809–818.
- ,.Adverse effects of sleep deprivation in the ICU.Crit Care Clin.2008;24(3):461–476, v–vi.
- ,,,,.Abnormal sleep/wake cycles and the effect of environmental noise on sleep disruption in the intensive care unit.Am J Respir Crit Care Med.2001;163(2):451–457.
- ,.Responses of premature infants to routine nursing interventions and noise in the NICU.Nurs Res.1995;44(3):179–185.
- ,,,,.Noise, stress, and annoyance in a pediatric intensive care unit.Crit Care Med.2003;31(1):113–119.
- ,,,,.Effects of guidelines implementation in a surgical intensive care unit to control nighttime light and noise levels.Crit Care Med.2000;28(7):2242–2247.
- ,,,,.Noise control: a nursing team's approach to sleep promotion.Am J Nurs.2004;104(2):40–48; quiz 48–49.
- ,,, et al.Environmental noise sources and interventions to minimize them: a tale of 2 hospitals.J Nurs Care Qual.2008;23(3):216–224; quiz 225–216.
- ,,, et al.Interventions to reduce decibel levels on patient care units.Am Surg.1998;64(9):894–899.
- ,,,.Examining the feasibility of implementing specific nursing interventions to promote sleep in hospitalized elderly patients.Geriatr Nurs.2008;29(3):197–206.
- ,,,.Applicability of two brief evidence‐based interventions to improve sleep quality in inpatient mental health care.Int J Ment Health Nurs.2011;20(5)319–327.
- .Sleep deprivation in critical care units.Crit Care Nurs Q.2003;26(3):179–189; quiz 190–171.
- ,,,.Sleep promotion in hospitalized elders.Medsurg Nurs.2003;12(5):279–289; quiz 290.
- 2005 NSF Sleep in America Poll.Washington, DC:National Sleep Foundation;2005.
- ,,.Guidelines for Community Noise.Geneva, Switzerland:World Health Organization;1999.
- PhysicsArchives.com.2010. Available at: http://physicsarchives.com/index.php/courses/219. Accessed May 15, 2011.
Contribution of Predischarge ID Consult
With dramatically increasing costs of healthcare, it has become increasingly necessary for healthcare providers to demonstrate value in the delivery of care. Porter and Teisberg have strongly advocated that healthcare reform efforts should focus on improving value rather than limiting cost, with value being defined as quality per unit cost.1 However, it has been pointed out that value means different things to different people.2 The biggest challenge in defining value stems mainly from the difficulty in defining quality, because it, too, means vastly different things to different people. Modern medicine is increasingly characterized by multidisciplinary care. With limited or shrinking resources, it will become necessary for individual specialists to describe and articulate, in quantitative terms, their specific contributions to the overall outcome of individual patients.
Previous publications have provided broad descriptions of the value provided by infectious disease (ID) specialists in the domains of sepsis, infection control, outpatient antibiotic therapy, antimicrobial stewardship, and directive care and teaching.3, 4 Studies have also shown the value of ID physicians in specific disease conditions. ID consultation is associated with lower mortality5, 6 and lower relapse rates7 in hospitalized patients with Staphylococcus aureus bacteremia. In another study evaluating the impact of ID consultants, patients seen by ID consultants had longer lengths of hospital stay, longer intensive care unit lengths of stay, and higher antibiotic costs than matched controls not seen by ID consultants.8 It can be argued that a major limitation of the study was that controls were not matched for the ID diagnosis, nor for the causative microorganisms, but it is clear that ID physicians are challenged to demonstrate their contribution to the care of patients.
A unique activity of ID physicians is the management of community‐based parenteral anti‐infective therapy (CoPAT). At Baystate Medical Center, a policy of mandatory ID consultation was instituted for patients leaving hospital on parenteral antibiotics. A study was conducted on the impact of predischarge ID consultation for 44 patients who were not already being followed by the ID service. The study documented change from intravenous (IV) to oral formulation, change of antibiotic choice, and change of dose/duration of treatment in a substantial proportion of patients.9 These are significant changes, but ID consultation contributes more than the themes explored in the study.
The purpose of this study was to evaluate the contribution of ID consultation when consulted for CoPAT, an activity specific to ID practice, in a different institution, and using an expanded definition of medical contribution.
METHODS
The Cleveland Clinic's Department of Infectious Disease has 24 staff physicians and 11 inpatient ID consultative services. These include: 2 solid organ transplant services; a bone marrow transplant and oncologic service; 2 infective endocarditis/cardiac device infection services; an intensive care unit (ICU) service; a bone and joint infection service; a neuroinfection service; and 3 general ID consult services. Consultative services are provided 7 days a week. At the Cleveland Clinic, ID consultation is required prior to discharge on parenteral antibiotic therapy.10, 11 ID consultation for CoPAT usually occurs when the primary service deems the patient is close to being discharged from hospital. This circumstance allows for assessing the specific contribution of ID physicians beyond that of the primary service and other consulting services.
Case Ascertainment
The study was approved by the institutional review board. In February 2010, an electronic form for requesting ID consultations had been introduced into the computerized provider order entry (CPOE) system at the Cleveland Clinic. One of the required questions on the form was whether the consultation was regarding CoPAT, with options of Yes, No, or Not sure. These electronic ID consultation requests were screened to identify consultation requests for this study.
Inclusion and Exclusion Criteria
All adult ID consultations between February 11, 2010 and May 15, 2010 for which the CoPAT consult? field was marked Yes were included in the study. All other consultations, including not sure for CoPAT, were excluded.
Definitions
The first ID consultation during a hospitalization was considered an initial consultation. ID consultations for patients whom an ID service had previously seen during the same hospitalization were deemed reconsultations. Value provided was defined as contribution of the ID consultation team in the following domains: 1) optimization of antimicrobial therapy, 2) significant change in patient assessment, 3) additional medical care contribution. Specific contributions included in each domain are outlined in Table 1.
|
| Domain 1: Optimization of antibiotic therapy |
| Alteration of an antibiotic (change of antibiotic or route of administration) |
| Defining duration of therapy |
| Identification of psychosocial factors (eg, injection drug use) that influence treatment |
| Domain 2: Significant change in patient assessment |
| Diagnosis of an infectious process |
| Better appreciation of extent of disease |
| Refutation of a false infectious disease diagnosis |
| Recognition of a noninfectious process needing urgent attention |
| Identification of a positive culture as contaminant/colonization |
| Recognition of a need for additional testing (testing needed to arrive at a diagnosis or clarify a treatment plan before a patient could be safely discharged from hospital) |
| Recognition of need for surgery/emnvasive intervention |
| Refutation of antibiotic allergy by history or allergy testing |
| Domain 3: Additional medical care contribution |
| Administration of vaccines |
| Identification of an unrecognized medical problem that needed to be addressed after discharge from hospital |
| Provision of effective transition of care (ensuring that the same ID physician who saw the patient in hospital followed the patient after discharge from hospital) |
Data Collected
For each ID consultation episode, clinicians' notes were reviewed from the day of the ID consultation to the day the patient was discharged from hospital or the day the ID service signed off, whichever happened sooner. Results of recommended tests were followed up to determine if results led to a change in patient assessment. Data elements collected for each consultation episode included patient age, gender, race, date of hospitalization, date of discharge, date of ID consultation or reconsultation, primary service, and documentation of ID service contributions. Data were collected and entered in a Microsoft Access relational database. To minimize bias, the data collection was performed by physicians who had not participated in the care of the patient.
Analysis
The proportion of ID consultations in which the ID team contributed in the defined domains were enumerated, and described for the group overall and also separately for initial consultations and reconsultations.
RESULTS
In the time period studied, there were 1326 CPOE requests for ID consultation. The response to the question, CoPAT consult? was Yes for 304, No for 507, and Not sure for 515 requests. Of the 304 consultation requests marked Yes, 41 were excluded. Reasons for exclusion were: no ID consultation note (21), wrong service consulted (8), consultation request placed while the ID service was already following the patient (7), and duplicate consultation request (5). The remaining 263 consultation requests corresponded to 1 or more CoPAT consultation requests for 249 patients (across different hospitalizations). Of the 263 consultation requests, 172 were initial consultations, while the remaining 91 were reconsultations (patients not actively being followed by the ID service, but previously seen during the same hospitalization).
Consultation characteristics are outlined in Table 2. The most common group of infections for which CoPAT was sought was bone and joint infections, accounting for over 20% of the consultation requests. CoPAT consultations were requested a median of 4 days after hospitalization. Patients were discharged from hospital a median of 3 days after they were seen by the ID service. ID consultation did not delay discharge. The ID service usually saw the patient the same day, and followed the patient in hospital for a median of 1 day. There was no difference in hospital days after consult for patients who did not need antibiotics versus those who did.
| Characteristic | Initial Consultation [172] n (%)* | Reconsultation [91] n (%)* | Overall [263] n (%)* |
|---|---|---|---|
| |||
| Patient age in years, mean (SD) | 58 (14) | 62 (13) | 59 (14) |
| Male gender | 98 (60) | 91 (56) | 149 (57) |
| Caucasian race | 126 (73) | 74 (81) | 200 (76) |
| Services requesting consults (5 most common overall) | |||
| Medicine | 41 (17) | 14 (15) | 55 (21) |
| Orthopedics | 34 (14) | 0 (0) | 34 (13) |
| Hematology/Oncology | 16 (7) | 10 (11) | 26 (10) |
| Cardiology | 9 (4) | 15 (16) | 24 (9) |
| Gastroenterology | 14 (6) | 5 (5) | 19 (7) |
| Consult diagnosis (5 most common overall) | |||
| Bone and joint infection | 45 (26) | 9 (10) | 54 (21) |
| Skin or soft tissue infection or rash | 21 (12) | 8 (9) | 29 (11) |
| Endocarditis or cardiac device infection | 7 (4) | 15 (16) | 22 (8) |
| IV catheter or other endovascular infection | 9 (5) | 8 (9) | 17 (6) |
| Urinary tract infection | 12 (7) | 5 (5) | 17 (6) |
| Days from admission to ID consult, median (IQR) | 4 (1‐11) | 7 (2‐19) | 4 (1‐14) |
| Days to respond to consult request, median (IQR) | 0 (0‐1) | 0 (0‐0) | 0 (0‐0) |
| Days from ID consult to discharge, median (IQR) | 3 (2‐7) | 2 (1‐4.5) | 3 (1‐6) |
ID consultation provided value in at least 1 domain in 260 of the 263 consultations. This included optimization of antimicrobial treatment in 84%, significant alteration of patient assessment in 52%, and additional medical care contribution in 71% of consultations. Substantial contributions were made in all domains in both initial consultations and in reconsultations. Specific ID contributions within each of the domains are shown in Figure 1. There was wide overlap of contributions across the 3 domains for individual consultations (Figure 2), with contributions in all domains occurring in 34% of consultations. CoPAT was deemed not to be necessary in 27% of consultations. Among patients who did not require CoPAT, 60% received oral antibiotics and 40% were deemed not to need any antibiotics at hospital discharge. Among the patients discharged on CoPAT, a follow‐up appointment with a Cleveland Clinic ID physician familiar with the patient was set up 86% of the time; the rest either followed up with another physician or it was deemed that a scheduled follow‐up ID visit was not necessary.0


DISCUSSION
Physicians practicing in the specialty of infectious diseases face challenges and opportunities, as they adapt to changing demands within hospital practice in regard to reimbursement in an Accountable Care environment. Other challenges include emerging infections, antimicrobial resistance, need for antimicrobial stewardship, and increasing numbers of immunocompromised patients.12 From a health systems perspective, the overall value of care provided by the entire organization, and overall outcomes, are ultimately what matter. However, healthcare administrators need an appreciation of contributions of individual providers and specialties to fairly allocate resources and compensation for care provided. Articulating unique contributions is particularly challenging for individuals or services that provide purely cognitive input. Shrinking healthcare resources makes it critically important for cognitive specialists to be able to define their unique role in the care of patients with complex problems.
Our study found that a major contribution of ID consultation for CoPAT is that the process identifies a large number of patients who do not need CoPAT, thus effecting a powerful antimicrobial stewardship function. In our study, CoPAT was deemed unnecessary 27% of the time. The Infectious Diseases Society of America practice guidelines on outpatient parenteral antimicrobial therapy emphasize the importance of careful evaluation of patients considered for parenteral antibiotics outside the hospital setting.13 The focus on careful selection of appropriate patients for CoPAT has been a cornerstone of the Cleveland Clinic model of care. Nearly 30 years ago, we found that outpatient parenteral antibiotic therapy was unnecessary or not feasible in 40% of the patients referred for evaluation.10 If we adjust the numbers with the assumption that reimbursement issues present at that time are now less of an issue, the proportion of patients who were referred for CoPAT but not discharged on it was 29%, a figure remarkably similar to that found in the current study.
Another major contribution of ID consultation is the provision of effective transition of care from the inpatient to the outpatient setting. Frequent occurrence of postdischarge adverse events has been recognized as a problem in clinical practice.14 Primary care physicians are rarely involved in discussions about hospital discharge.15 A consensus conference including the American College of Physicians, Society of Hospital Medicine, and Society of General Internal Medicine, convened in July 2007 to address quality gaps in transitions of care between inpatient and outpatient settings. It identified 5 principles for effective care transitions: accountability, communication, timeliness, patient and family involvement, and respect for the hub of coordination of care.16 Recognizing gaps in care transition, hospitalists in a hospital‐based infusion program developed a model of care that successfully bridged the hospital‐to‐home care transition for patients who could return to hospital for daily antimicrobial infusions.17 In our system, ID physicians take ownership for directing parenteral antibiotic therapy for the episode of illness, specifying the physician, date, and time of follow‐up before the patient is discharged from hospital, thereby essentially satisfying the principles of effective care transitions identified. The purpose of the ID follow‐up is not to replace other follow‐up care for patients but to ensure safe transition of care while treating an episode of infection.
Attribution of identified contributions to the ID consultation could be done because our study was limited to CoPAT consultations. Such consultations typically occur when patients are deemed close to hospital discharge by the primary service. There should be little controversy about attribution of cognitive input in such consultations, because from the primary service's perspective, the patient is ready or almost ready to be discharged from hospital. It would be fair to state that most of the identified contributions in the study would not have occurred had it not been for the ID consultation.
We acknowledge that the study suffers from many limitations. The biggest limitation is that the contribution elements are defined by ID physicians and sought in the medical record by physicians from the same specialty. This arrangement certainly has potential for significant bias. To limit this bias, data collection was performed by physicians who had not participated in the care of the patient. In addition, we only could assess what was documented in the electronic health record. Our study found that alteration of antibiotic therapy was a substantial contribution, however, documentation of recommendation to change antibiotics in the medical record rarely specified exactly why the change was recommended. Reasons for antibiotic change recommendations included bug‐drug mismatch, minimum inhibitory concentration (MIC) considerations, pharmacokinetic considerations, adverse effects, convenience of dosing, drug interactions, and insurance coverage. However, it is not possible to quantify the specific contribution of each of these reasons, in a retrospective study, without making assumptions about why specific ID physicians made specific antibiotic change recommendations. There may have been more contributions that might not have been apparent on a retrospective chart review. The lack of a control group also lessens the impact of our findings. We could not have a control group, because no patient is discharged from the Cleveland Clinic on CoPAT without having been seen by an ID physician. Mandatory ID consultation for CoPAT has previously been shown to reduce costs,9 however, our study was not designed to evaluate cost.
The perceived value of ID consultation in our institution can be appreciated when one considers the longstanding institutional policy of requiring ID consultation for CoPAT.10, 11 The perpetuation of this tradition in the hospital is testament to the presumption that mandatory ID consultation is seen to be of value by the institution.
In summary, ID consultation in our institution contributes to the care of inpatients being considered for CoPAT by substantially reducing unnecessary parenteral antibiotic use, optimizing antibiotic therapy, recognizing need for additional testing before discharge from hospital, and by providing effective transition of care from the inpatient to the outpatient setting.
- ,.How physicians can change the future of health care.JAMA.2007;297:1103–1111.
- .Value of the infectious diseases specialist.Clin Infect Dis.1997;24:456.
- ,,, et al.The value of an infectious diseases specialist.Clin Infect Dis.2003;36:1013–1017.
- ,,,,,.The value of infectious diseases specialists: non‐patient care activities.Clin Infect Dis.2008;47:1051–1063.
- ,,,,.The value of infectious diseases consultation in Staphylococcus aureus bacteremia.Am J Med.2010;123:631–637.
- ,,,,.Infectious diseases consultation lowers mortality from Staphylococcus aureus bacteremia.Medicine (Baltimore).2009;88:263–267.
- ,,, et al.Outcome of Staphylococcus aureus bacteremia according to compliance with recommendations of infectious diseases specialists: experience with 244 patients.Clin Infect Dis.1998;27:478–486.
- ,,.Infectious diseases consultation: impact on outcomes for hospitalized patients and results of a preliminary study.Clin Infect Dis.1997;24:468–470.
- ,,.Impact of mandatory inpatient infectious disease consultation on outpatient parenteral antibiotic therapy.Am J Med Sci.2005;330:60–64.
- ,.Home intravenous antibiotic therapy: a team approach.Ann Intern Med.1983;99:388–392.
- ,,.Transitioning antimicrobial stewardship beyond the hospital: the Cleveland Clinic's community‐based parenteral anti‐infective therapy (CoPAT) program.J Hosp Med.2011;6(suppl 1):S24–S30.
- ,,.Professional challenges and opportunities in clinical microbiology and infectious diseases in Europe.Lancet Infect Dis.2011;11:408–415.
- ,,, et al.Practice guidelines for outpatient parenteral antimicrobial therapy. IDSA guidelines.Clin Infect Dis.2004;38:1651–1672.
- ,.Addressing postdischarge adverse events: a neglected area.Jt Comm J Qual Patient Saf.2008;34:85–97.
- ,,,,,.Deficits in communication and information transfer between hospital‐based and primary care physicians: implications for patient safety and continuity of care.JAMA.2007;297:831–841.
- ,,, et al.Transitions of Care Consensus policy statement: American College of Physicians, Society of General Internal Medicine, Society of Hospital Medicine, American Geriatrics Society, American College of Emergency Physicians, and Society for Academic Emergency Medicine.J Hosp Med.2009;4:364–370.
- .Hospitalist to home: outpatient parenteral antimicrobial therapy at an academic center.Clin Infect Dis.2010;51(suppl 2):S220–S223.
With dramatically increasing costs of healthcare, it has become increasingly necessary for healthcare providers to demonstrate value in the delivery of care. Porter and Teisberg have strongly advocated that healthcare reform efforts should focus on improving value rather than limiting cost, with value being defined as quality per unit cost.1 However, it has been pointed out that value means different things to different people.2 The biggest challenge in defining value stems mainly from the difficulty in defining quality, because it, too, means vastly different things to different people. Modern medicine is increasingly characterized by multidisciplinary care. With limited or shrinking resources, it will become necessary for individual specialists to describe and articulate, in quantitative terms, their specific contributions to the overall outcome of individual patients.
Previous publications have provided broad descriptions of the value provided by infectious disease (ID) specialists in the domains of sepsis, infection control, outpatient antibiotic therapy, antimicrobial stewardship, and directive care and teaching.3, 4 Studies have also shown the value of ID physicians in specific disease conditions. ID consultation is associated with lower mortality5, 6 and lower relapse rates7 in hospitalized patients with Staphylococcus aureus bacteremia. In another study evaluating the impact of ID consultants, patients seen by ID consultants had longer lengths of hospital stay, longer intensive care unit lengths of stay, and higher antibiotic costs than matched controls not seen by ID consultants.8 It can be argued that a major limitation of the study was that controls were not matched for the ID diagnosis, nor for the causative microorganisms, but it is clear that ID physicians are challenged to demonstrate their contribution to the care of patients.
A unique activity of ID physicians is the management of community‐based parenteral anti‐infective therapy (CoPAT). At Baystate Medical Center, a policy of mandatory ID consultation was instituted for patients leaving hospital on parenteral antibiotics. A study was conducted on the impact of predischarge ID consultation for 44 patients who were not already being followed by the ID service. The study documented change from intravenous (IV) to oral formulation, change of antibiotic choice, and change of dose/duration of treatment in a substantial proportion of patients.9 These are significant changes, but ID consultation contributes more than the themes explored in the study.
The purpose of this study was to evaluate the contribution of ID consultation when consulted for CoPAT, an activity specific to ID practice, in a different institution, and using an expanded definition of medical contribution.
METHODS
The Cleveland Clinic's Department of Infectious Disease has 24 staff physicians and 11 inpatient ID consultative services. These include: 2 solid organ transplant services; a bone marrow transplant and oncologic service; 2 infective endocarditis/cardiac device infection services; an intensive care unit (ICU) service; a bone and joint infection service; a neuroinfection service; and 3 general ID consult services. Consultative services are provided 7 days a week. At the Cleveland Clinic, ID consultation is required prior to discharge on parenteral antibiotic therapy.10, 11 ID consultation for CoPAT usually occurs when the primary service deems the patient is close to being discharged from hospital. This circumstance allows for assessing the specific contribution of ID physicians beyond that of the primary service and other consulting services.
Case Ascertainment
The study was approved by the institutional review board. In February 2010, an electronic form for requesting ID consultations had been introduced into the computerized provider order entry (CPOE) system at the Cleveland Clinic. One of the required questions on the form was whether the consultation was regarding CoPAT, with options of Yes, No, or Not sure. These electronic ID consultation requests were screened to identify consultation requests for this study.
Inclusion and Exclusion Criteria
All adult ID consultations between February 11, 2010 and May 15, 2010 for which the CoPAT consult? field was marked Yes were included in the study. All other consultations, including not sure for CoPAT, were excluded.
Definitions
The first ID consultation during a hospitalization was considered an initial consultation. ID consultations for patients whom an ID service had previously seen during the same hospitalization were deemed reconsultations. Value provided was defined as contribution of the ID consultation team in the following domains: 1) optimization of antimicrobial therapy, 2) significant change in patient assessment, 3) additional medical care contribution. Specific contributions included in each domain are outlined in Table 1.
|
| Domain 1: Optimization of antibiotic therapy |
| Alteration of an antibiotic (change of antibiotic or route of administration) |
| Defining duration of therapy |
| Identification of psychosocial factors (eg, injection drug use) that influence treatment |
| Domain 2: Significant change in patient assessment |
| Diagnosis of an infectious process |
| Better appreciation of extent of disease |
| Refutation of a false infectious disease diagnosis |
| Recognition of a noninfectious process needing urgent attention |
| Identification of a positive culture as contaminant/colonization |
| Recognition of a need for additional testing (testing needed to arrive at a diagnosis or clarify a treatment plan before a patient could be safely discharged from hospital) |
| Recognition of need for surgery/emnvasive intervention |
| Refutation of antibiotic allergy by history or allergy testing |
| Domain 3: Additional medical care contribution |
| Administration of vaccines |
| Identification of an unrecognized medical problem that needed to be addressed after discharge from hospital |
| Provision of effective transition of care (ensuring that the same ID physician who saw the patient in hospital followed the patient after discharge from hospital) |
Data Collected
For each ID consultation episode, clinicians' notes were reviewed from the day of the ID consultation to the day the patient was discharged from hospital or the day the ID service signed off, whichever happened sooner. Results of recommended tests were followed up to determine if results led to a change in patient assessment. Data elements collected for each consultation episode included patient age, gender, race, date of hospitalization, date of discharge, date of ID consultation or reconsultation, primary service, and documentation of ID service contributions. Data were collected and entered in a Microsoft Access relational database. To minimize bias, the data collection was performed by physicians who had not participated in the care of the patient.
Analysis
The proportion of ID consultations in which the ID team contributed in the defined domains were enumerated, and described for the group overall and also separately for initial consultations and reconsultations.
RESULTS
In the time period studied, there were 1326 CPOE requests for ID consultation. The response to the question, CoPAT consult? was Yes for 304, No for 507, and Not sure for 515 requests. Of the 304 consultation requests marked Yes, 41 were excluded. Reasons for exclusion were: no ID consultation note (21), wrong service consulted (8), consultation request placed while the ID service was already following the patient (7), and duplicate consultation request (5). The remaining 263 consultation requests corresponded to 1 or more CoPAT consultation requests for 249 patients (across different hospitalizations). Of the 263 consultation requests, 172 were initial consultations, while the remaining 91 were reconsultations (patients not actively being followed by the ID service, but previously seen during the same hospitalization).
Consultation characteristics are outlined in Table 2. The most common group of infections for which CoPAT was sought was bone and joint infections, accounting for over 20% of the consultation requests. CoPAT consultations were requested a median of 4 days after hospitalization. Patients were discharged from hospital a median of 3 days after they were seen by the ID service. ID consultation did not delay discharge. The ID service usually saw the patient the same day, and followed the patient in hospital for a median of 1 day. There was no difference in hospital days after consult for patients who did not need antibiotics versus those who did.
| Characteristic | Initial Consultation [172] n (%)* | Reconsultation [91] n (%)* | Overall [263] n (%)* |
|---|---|---|---|
| |||
| Patient age in years, mean (SD) | 58 (14) | 62 (13) | 59 (14) |
| Male gender | 98 (60) | 91 (56) | 149 (57) |
| Caucasian race | 126 (73) | 74 (81) | 200 (76) |
| Services requesting consults (5 most common overall) | |||
| Medicine | 41 (17) | 14 (15) | 55 (21) |
| Orthopedics | 34 (14) | 0 (0) | 34 (13) |
| Hematology/Oncology | 16 (7) | 10 (11) | 26 (10) |
| Cardiology | 9 (4) | 15 (16) | 24 (9) |
| Gastroenterology | 14 (6) | 5 (5) | 19 (7) |
| Consult diagnosis (5 most common overall) | |||
| Bone and joint infection | 45 (26) | 9 (10) | 54 (21) |
| Skin or soft tissue infection or rash | 21 (12) | 8 (9) | 29 (11) |
| Endocarditis or cardiac device infection | 7 (4) | 15 (16) | 22 (8) |
| IV catheter or other endovascular infection | 9 (5) | 8 (9) | 17 (6) |
| Urinary tract infection | 12 (7) | 5 (5) | 17 (6) |
| Days from admission to ID consult, median (IQR) | 4 (1‐11) | 7 (2‐19) | 4 (1‐14) |
| Days to respond to consult request, median (IQR) | 0 (0‐1) | 0 (0‐0) | 0 (0‐0) |
| Days from ID consult to discharge, median (IQR) | 3 (2‐7) | 2 (1‐4.5) | 3 (1‐6) |
ID consultation provided value in at least 1 domain in 260 of the 263 consultations. This included optimization of antimicrobial treatment in 84%, significant alteration of patient assessment in 52%, and additional medical care contribution in 71% of consultations. Substantial contributions were made in all domains in both initial consultations and in reconsultations. Specific ID contributions within each of the domains are shown in Figure 1. There was wide overlap of contributions across the 3 domains for individual consultations (Figure 2), with contributions in all domains occurring in 34% of consultations. CoPAT was deemed not to be necessary in 27% of consultations. Among patients who did not require CoPAT, 60% received oral antibiotics and 40% were deemed not to need any antibiotics at hospital discharge. Among the patients discharged on CoPAT, a follow‐up appointment with a Cleveland Clinic ID physician familiar with the patient was set up 86% of the time; the rest either followed up with another physician or it was deemed that a scheduled follow‐up ID visit was not necessary.0
DISCUSSION
Physicians practicing in the specialty of infectious diseases face challenges and opportunities, as they adapt to changing demands within hospital practice in regard to reimbursement in an Accountable Care environment. Other challenges include emerging infections, antimicrobial resistance, need for antimicrobial stewardship, and increasing numbers of immunocompromised patients.12 From a health systems perspective, the overall value of care provided by the entire organization, and overall outcomes, are ultimately what matter. However, healthcare administrators need an appreciation of contributions of individual providers and specialties to fairly allocate resources and compensation for care provided. Articulating unique contributions is particularly challenging for individuals or services that provide purely cognitive input. Shrinking healthcare resources makes it critically important for cognitive specialists to be able to define their unique role in the care of patients with complex problems.
Our study found that a major contribution of ID consultation for CoPAT is that the process identifies a large number of patients who do not need CoPAT, thus effecting a powerful antimicrobial stewardship function. In our study, CoPAT was deemed unnecessary 27% of the time. The Infectious Diseases Society of America practice guidelines on outpatient parenteral antimicrobial therapy emphasize the importance of careful evaluation of patients considered for parenteral antibiotics outside the hospital setting.13 The focus on careful selection of appropriate patients for CoPAT has been a cornerstone of the Cleveland Clinic model of care. Nearly 30 years ago, we found that outpatient parenteral antibiotic therapy was unnecessary or not feasible in 40% of the patients referred for evaluation.10 If we adjust the numbers with the assumption that reimbursement issues present at that time are now less of an issue, the proportion of patients who were referred for CoPAT but not discharged on it was 29%, a figure remarkably similar to that found in the current study.
Another major contribution of ID consultation is the provision of effective transition of care from the inpatient to the outpatient setting. Frequent occurrence of postdischarge adverse events has been recognized as a problem in clinical practice.14 Primary care physicians are rarely involved in discussions about hospital discharge.15 A consensus conference including the American College of Physicians, Society of Hospital Medicine, and Society of General Internal Medicine, convened in July 2007 to address quality gaps in transitions of care between inpatient and outpatient settings. It identified 5 principles for effective care transitions: accountability, communication, timeliness, patient and family involvement, and respect for the hub of coordination of care.16 Recognizing gaps in care transition, hospitalists in a hospital‐based infusion program developed a model of care that successfully bridged the hospital‐to‐home care transition for patients who could return to hospital for daily antimicrobial infusions.17 In our system, ID physicians take ownership for directing parenteral antibiotic therapy for the episode of illness, specifying the physician, date, and time of follow‐up before the patient is discharged from hospital, thereby essentially satisfying the principles of effective care transitions identified. The purpose of the ID follow‐up is not to replace other follow‐up care for patients but to ensure safe transition of care while treating an episode of infection.
Attribution of identified contributions to the ID consultation could be done because our study was limited to CoPAT consultations. Such consultations typically occur when patients are deemed close to hospital discharge by the primary service. There should be little controversy about attribution of cognitive input in such consultations, because from the primary service's perspective, the patient is ready or almost ready to be discharged from hospital. It would be fair to state that most of the identified contributions in the study would not have occurred had it not been for the ID consultation.
We acknowledge that the study suffers from many limitations. The biggest limitation is that the contribution elements are defined by ID physicians and sought in the medical record by physicians from the same specialty. This arrangement certainly has potential for significant bias. To limit this bias, data collection was performed by physicians who had not participated in the care of the patient. In addition, we only could assess what was documented in the electronic health record. Our study found that alteration of antibiotic therapy was a substantial contribution, however, documentation of recommendation to change antibiotics in the medical record rarely specified exactly why the change was recommended. Reasons for antibiotic change recommendations included bug‐drug mismatch, minimum inhibitory concentration (MIC) considerations, pharmacokinetic considerations, adverse effects, convenience of dosing, drug interactions, and insurance coverage. However, it is not possible to quantify the specific contribution of each of these reasons, in a retrospective study, without making assumptions about why specific ID physicians made specific antibiotic change recommendations. There may have been more contributions that might not have been apparent on a retrospective chart review. The lack of a control group also lessens the impact of our findings. We could not have a control group, because no patient is discharged from the Cleveland Clinic on CoPAT without having been seen by an ID physician. Mandatory ID consultation for CoPAT has previously been shown to reduce costs,9 however, our study was not designed to evaluate cost.
The perceived value of ID consultation in our institution can be appreciated when one considers the longstanding institutional policy of requiring ID consultation for CoPAT.10, 11 The perpetuation of this tradition in the hospital is testament to the presumption that mandatory ID consultation is seen to be of value by the institution.
In summary, ID consultation in our institution contributes to the care of inpatients being considered for CoPAT by substantially reducing unnecessary parenteral antibiotic use, optimizing antibiotic therapy, recognizing need for additional testing before discharge from hospital, and by providing effective transition of care from the inpatient to the outpatient setting.
- ,.How physicians can change the future of health care.JAMA.2007;297:1103–1111.
- .Value of the infectious diseases specialist.Clin Infect Dis.1997;24:456.
- ,,, et al.The value of an infectious diseases specialist.Clin Infect Dis.2003;36:1013–1017.
- ,,,,,.The value of infectious diseases specialists: non‐patient care activities.Clin Infect Dis.2008;47:1051–1063.
- ,,,,.The value of infectious diseases consultation in Staphylococcus aureus bacteremia.Am J Med.2010;123:631–637.
- ,,,,.Infectious diseases consultation lowers mortality from Staphylococcus aureus bacteremia.Medicine (Baltimore).2009;88:263–267.
- ,,, et al.Outcome of Staphylococcus aureus bacteremia according to compliance with recommendations of infectious diseases specialists: experience with 244 patients.Clin Infect Dis.1998;27:478–486.
- ,,.Infectious diseases consultation: impact on outcomes for hospitalized patients and results of a preliminary study.Clin Infect Dis.1997;24:468–470.
- ,,.Impact of mandatory inpatient infectious disease consultation on outpatient parenteral antibiotic therapy.Am J Med Sci.2005;330:60–64.
- ,.Home intravenous antibiotic therapy: a team approach.Ann Intern Med.1983;99:388–392.
- ,,.Transitioning antimicrobial stewardship beyond the hospital: the Cleveland Clinic's community‐based parenteral anti‐infective therapy (CoPAT) program.J Hosp Med.2011;6(suppl 1):S24–S30.
- ,,.Professional challenges and opportunities in clinical microbiology and infectious diseases in Europe.Lancet Infect Dis.2011;11:408–415.
- ,,, et al.Practice guidelines for outpatient parenteral antimicrobial therapy. IDSA guidelines.Clin Infect Dis.2004;38:1651–1672.
- ,.Addressing postdischarge adverse events: a neglected area.Jt Comm J Qual Patient Saf.2008;34:85–97.
- ,,,,,.Deficits in communication and information transfer between hospital‐based and primary care physicians: implications for patient safety and continuity of care.JAMA.2007;297:831–841.
- ,,, et al.Transitions of Care Consensus policy statement: American College of Physicians, Society of General Internal Medicine, Society of Hospital Medicine, American Geriatrics Society, American College of Emergency Physicians, and Society for Academic Emergency Medicine.J Hosp Med.2009;4:364–370.
- .Hospitalist to home: outpatient parenteral antimicrobial therapy at an academic center.Clin Infect Dis.2010;51(suppl 2):S220–S223.
Improving Stroke Alert Response Time
In‐hospital strokes account for a significant proportion of the almost 800,000 cerebrovascular accidents that occur each year in the United States.1 Although inpatient strokes are thought to be under‐recognized and under‐reported, between 4% and 17% of all stroke patients in the hospital experienced stroke onset during hospitalization.2, 3 Estimates place the number of in‐hospital strokes at 35,000‐75,000 each year in the United States.4
As a result of the exquisite sensitivity of brain tissue to ischemic events, stroke is a medical emergency and time‐to‐treatment is of the essence. With each minute of ischemia, 1.9 million neurons are destroyed.5 Evidence suggests benefit of treatment with intravenous thrombolysis up to 4.5 hours after symptom onset, with lower disability associated with more rapid initiation of therapy.6, 7 To facilitate timely thrombolytic therapy, the American Stroke Association (ASA) recommends that imaging of the brain be initiated within 25 minutes of presentation for patients with suspected stroke.8
Studies demonstrate greater delays in the evaluation of hospitalized patients suffering from stroke compared to stroke patients presenting to the Emergency Department (ED).9, 10 Performance of timely evaluation of in‐hospital stroke rarely meets ASA goals. Analysis of a Michigan stroke registry found that only 3.1% of patients with in‐hospital strokes received computed tomography (CT) scan within 25 minutes of symptom recognition, and a Colorado stroke registry found time‐to‐evaluation to be more than twice the recommended benchmark.11, 12 Data from a multicenter stroke registry in Spain showed that half of all thrombolysis‐eligible, in‐hospital stroke patients could not be treated due to delays in evaluation.13
Our prior work demonstrated that the use of an in‐hospital stroke response team significantly reduced time to evaluation for true ischemic strokes.10 Even with this rapid response mechanism, the evaluation time for in‐hospital stroke was still more than twice that observed in the ED despite using the same team to respond to both settings. Hospital rapid response systems, specifically for patients with suspected stroke, have been described in the literature and outline in‐hospital response systems capable of meeting evaluation time goals.1415 How to optimize a stroke response system has not been previously described. The aim of this quality improvement (QI) initiative was to reduce time‐to‐evaluation for strokes occurring in patients already hospitalized using systems analysis and modification. We describe key elements and tools for implementing institutional QI for in‐hospital stroke.
METHODS
The QI initiative was implemented at the University of Colorado Hospital (UCH), a tertiary care academic medical center. The Colorado Multiple Institutional Review Board determined this project to be in the exempt category. UCH uses a protocol in which all stroke alerts undergo non‐contrast CT of the brain. If no intracranial bleeding is found, and the patient is a thrombolytic candidate, advanced CT imaging including CT perfusion and CT angiogram will also be performed during the alert. Magnetic resonance imaging (MRI) with diffusion weighted imaging is done non‐emergently for subsequent stroke evaluation, but is not part of the stroke alert protocol. The primary endpoint of time from alert to initiation of CT was chosen because it represents an unambiguous interval which is present for all stroke alerts. Pre‐intervention data was gathered for 6 months, from September 2008 to February 2009. During this period, the process through which in‐hospital strokes were identified, referred for evaluation, and treated was mapped to identify inefficient or unreliable steps, and the process was redesigned to enhance efficiency. The intervention was rolled out over a 3‐month period from March 2009 to May 2009. During the intervention roll‐out period, the refined stroke alert process and a checklist containing the optimal in‐hospital stroke alert response system was implemented. An education campaign was initiated, for acute stroke team members and nursing staff, on signs of stroke and each individual's role in response to symptoms of in‐hospital stroke based on the new process. During the roll‐out period, each unit in the hospital was provided in‐hospital stroke alert posters and a packet containing specific stroke education on the in‐hospital stroke alert process. Unit educators were empowered to determine how to best deliver the education to their staff, and many chose to invite the stroke program coordinator to give an hour‐long presentation on stroke prior to shift or during lunch. Each unit educator kept record of the stroke instruction provided and submitted staff signatures to the stroke program. Nursing staff was also provided with in‐hospital stroke protocol badge cards that outlined optimal approach to stroke identification and treatment using the revised protocol. Interventions were being implemented in a progressive fashion throughout the roll‐out period. Starting during the roll‐out and continuing into the post‐intervention period, feedback on all in‐hospital stroke alerts was provided to the stroke team and front‐line providers. The impact of the intervention was followed for 6 months post‐intervention from June 2009 to November 2009. The QI tools used in this project are well described by the Institute of Healthcare Improvement, and each step in the QI process is outlined in detail below:16
Step 1: Process Map With Identification of Unreliable and Reliably Slow Steps
A detailed process map was created to outline steps in the existing stroke alert process (see Supporting Figures, Process Maps, in the online version of this article). One investigator (R.Z.) interviewed key members of the multidisciplinary stroke team, including representatives from the departments of neurology, nursing, hospital medicine, neurosurgery, radiology, and transportation. Interviews with key stakeholders and frequent participants in stroke alerts revealed evidence of episodic unreliable steps. Stakeholders were noted to have slightly different conceptions of how the process flow was intended to occur, and where responsibility lay for certain tasks. The interviews aided in identification of pitfalls, bottlenecks, misconceptions, and areas that needed clarification or change in the alert process.
Examples of unreliable and bottleneck steps include: In the pre‐intervention process, the transportation department was responsible for moving patients to radiology; this step was identified as reliably slow. Investigation revealed that the transportation department did not have a mechanism for rapid response to emergency transport requests. Analysis also revealed that 2 key steps necessary for treating in‐hospital stroke were occasionally neglected: ensuring adequate intravenous (IV) access, and ordering of the correct panel of laboratory tests. Finally, a process communication deficit was identified, with CT technicians periodically unaware of the pending arrival of an in‐hospital stroke patient, thus preventing the scan from being cleared for the emergent stroke imaging.
Direct observation of real‐time stroke alerts in both the inpatient and ED settings was also employed to outline the process and identify areas of inefficiency. Direct observation of stroke alerts in progress verified the unified picture of process flow developed from stakeholder interviews (see Supporting Figures, Process Maps, in the online version of this article). Particular note was made of differences between the stroke alert process in the ED and the inpatient setting.
Step 2: System Redesign With Input From All Stakeholders
Proposed interventions were presented to hospital governing councils, including the interdisciplinary Stroke Council and Nurse Managers Council. After verification of the shortcomings of the existing alert process and obtaining buy‐in from key participants and governing departments, a new process was designed (see Supporting Figures, Process Maps, in the online version of this article). Specific changes include the following examples: First, electrocardiogram was moved to occur after CT scan. Second, investigation revealed that the transportation department within the hospital was designed for non‐emergent transportation and not amenable to change. The mechanism of patient transportation was changed such that, rather than using the transportation department, patients were now transported by the neurology resident responding to the stroke alert, accompanied by the patient's ward nurse. This both removed a bottleneck step and assured critical staff presence during the transportation of a potentially unstable patient. Third, to ensure effective communication, CT technicians were provided with stroke alert pagers that receive text messages regarding incoming in‐hospital stroke alert patients. Fourth, a time limit was set for IV attempts prior to transportation. The new protocol, along with explicit expectations for the role of the patient's nurse in in‐hospital stroke alerts, was described in a hospital‐wide nursing stroke education initiative.
Step 3: In‐Hospital Stroke Alert Checklist
A new standardized protocol for optimal in‐hospital stroke care was detailed on a laminated pocket card. The checklist described exactly what steps were to be performed, by whom, how to make them occur, and in what order. The checklist was designed to reduce the incidence of omitted steps, such as ordering of correct laboratory evaluations. The laminated cards highlighted the benchmark time to evaluation of 25 minutes. Process checklist cards were distributed to all members of the acute stroke alert response team, and short versions designed specifically for nursing staff were distributed as badge cards and posted on clinical care units (Supporting Information Appendix I).
Step 4: Real‐Time Feedback
During the intervention roll‐out and post‐intervention periods, feedback was provided from the stroke program to the front‐line providers following each in‐hospital stroke alert. The clinicians involved were notified of the final diagnosis and patient outcome, and were provided with feedback about how the patient's evaluation times compared with benchmark goals. Feedback may serve to motivate, based on clinician professionalism, but performance in the alert was not tied to rewards or penalties for the providers involved. The feedback process was designed to be bi‐directional, with requests for input from staff on barriers to rapid evaluation experienced and suggestions for future process improvement (Supporting Information Appendix II).
Statistical Analysis
The primary outcome was the change in time from stroke alert to CT scan (alert‐to‐CT), comparing pre‐intervention and post‐intervention periods. This time interval was chosen because its calculation involved unambiguous time points, which are available for all patients for whom an in‐hospital alert is called. It is a measure of process efficiency, with minimal expected variation based on differences in patient characteristics (ie, hemorrhagic vs ischemic stroke). Non‐overlapping Kaplan‐Meier curves confirmed the proportional hazards assumption for 2 Cox proportional hazards models: unadjusted and adjusted by group characteristics with P‐value <0.10. Relative hazards and estimates for the percent of patients with alert‐to‐CT scan 25 minutes, according to intervention groups, were obtained from these models. For analyses, admit unit was re‐categorized as intensive care unit (ICU), Med/Surg, or Other. Analyses were conducted using SAS Version 9.2 (SAS Institute, Inc, Cary, NC).
RESULTS
During the study intervals, there were 82 inpatient stroke alerts. Of these alerts, 75 were included in the analysis. Seven were excluded for the following reasons: alert canceled by the stroke team (3), time of alert was not recorded (1), patient identifiers not recorded (1), or stroke alert was preceded by CT imaging (2).
During the 6 months prior to intervention, the median inpatient stroke alert‐to‐CT time (n = 31) was 69.0 minutes (Table 1). Nineteen percent of these alerts met the goal of 25 minutes from alert‐to‐CT time. During the 6‐month post‐intervention period, the median inpatient alert‐to‐CT time (n = 44) was 29.5 minutes. Thirty‐two percent of these alerts met the 25‐minute alert‐to‐CT time benchmark. In the unadjusted model, patients during the post‐intervention period were significantly more likely to have alert‐to‐CT scan time 25 minutes compared to patients prior to the intervention (post‐intervention compared to pre‐intervention, Relative Hazard (RH): 3.03; 95% confidence interval [CI]: 1.76‐5.20; log‐rank P < 0.0001). This remained significant after adjustment for hyperlipidemia, active cancer, final diagnosis of ischemic brain injury, and final diagnosis of stroke mimic (RH: 4.96; 95% CI: 2.65‐9.32; P < 0.0001); data not shown. Admit unit was not included in the adjusted model since there was no indication of differences in the 3‐level variable according to intervention group (P = 0.27). In addition to reduction in median response times, the variability of response times was markedly reduced, and no patient in the 6‐month post‐intervention period had delay to CT sufficient to preclude use of IV thrombolysis (Figure 1).
| Pre‐Intervention (n = 31) | Post‐Intervention (n = 44) | P Value | |
|---|---|---|---|
| |||
| Stroke alert to CT time, median [95% CI] | 69 min [34, 103] | 29.5 min [26, 40] | P < 0.0001 |
| Age, median [IQR] | 61.0 [54.0, 70.0] | 60.5 [48.5, 70.5] | 0.94 |
| Female (%) | 19 (61.3) | 23 (52.3) | 0.44 |
| Race (%) | |||
| Asian | 1 (3.2) | 1 (2.3) | 0.31 |
| Black | 4 (12.9) | 6 (13.6) | |
| Caucasian | 21 (67.7) | 27 (61.4) | |
| Hispanic | 3 (9.7) | 10 (22.7) | |
| Unknown | 2 (6.5) | 0 (0) | |
| Admit unit (%) | |||
| Intensive care | 12 (38.7) | 10 (22.7) | 0.07 |
| Medicine/surgery | 15 (48.4) | 24 (54.6) | |
| Neurology | 0 (0) | 5 (11.4) | |
| Post‐acute care | 3 (9.7) | 0 (0) | |
| Rehabilitation | 1 (3.2) | 2 (4.6) | |
| Women's and maternal care | 0 (0) | 2 (4.6) | |
| Cardiology | 0 (0) | 1 (2.3) | |
| Case mix index, median [IQR] | n = 29 2.6 [1.1, 5.0] | n = 42 2.2 [1.6, 4.5] | 0.82 |
| Prior cerebrovascular accident (%) | 5 (16.1) | 8 (18.2) | 0.82 |
| Hypertension (%) | 17 (54.8) | 24 (54.6) | 0.98 |
| Diabetes mellitus (%) | 7 (22.6) | 11 (25.0) | 0.81 |
| Hyperlipidemia (%) | 15 (48.4) | 9 (20.5) | 0.01 |
| Tobacco abuse, current (%) | 4 (12.9) | 1 (2.3) | 0.15 |
| Alcohol abuse (%) | 2 (6.5) | 0 (0) | 0.17 |
| Active cancer (%) | 8 (25.8) | 5 (11.4) | 0.10 |
| Peripheral vascular disease (%) | 2 (6.5) | 3 (6.8) | 1.0 |
| Coronary artery disease (%) | 6 (19.4) | 7 (15.9) | 0.70 |
| Congestive heart failure (%) | n = 30 5 (16.7) | 4 (9.1) | 0.47 |
| Valvulopathy (%) | 0 (0) | 1 (2.3) | 1.0 |
| Atrial fibrillation (%) | 3 (9.7) | 10 (22.7) | 0.14 |
| Anticoagulation (%) | 7 (22.6) | 7 (15.9) | 0.47 |
| Final diagnosis ischemic brain injury (%) | 15 (48.4) | 11 (25.0) | 0.04 |
| Final diagnosis hemorrhagic brain injury (%) | 3 (9.7) | 4 (9.1) | 1.0 |
| Final diagnosis stroke mimic (symptoms not due to ischemic or hemorrhagic brain injury) (%) | 13 (41.9) | 29 (65.9) | 0.04 |

CONCLUSIONS
In‐hospital strokes represent an emergency for which response time is critical. Neurologic injury progresses with every minute of ischemia, and current recommendations offer a limited time window for intravenous thrombolysis. For stroke with symptom onset in the monitored setting of the hospital, there is a compelling imperative to reduce all delays from system inefficiencies. The findings of the current QI initiative suggest that dramatic improvements are possible through systematic evaluation and redesign of hospital response processes, a checklist for in‐hospital stroke carried by front‐line responders, and ongoing real‐time feedback.
Limitations of this study include a prepost design. The necessity of implementing system change hospital‐wide precluded use of a concurrent control group. The time goals for evaluation are derived from American Stroke Association targets for patients arriving in the Emergency Department. There are differences in process between the hospital ward and the Emergency Department, but the fundamental concept of minimizing time to evaluation once patient symptoms are recognized by hospital staff remains valid.
The possibility of system improvements not due to this QI initiative cannot be excluded. In 2006, this hospital expanded the responsibility of the stroke response team to include acute neurologic deficits outside of the ED without other changes to the in‐hospital stroke alert process. This reduced time to evaluation for in‐hospital ischemic strokes compared to usual care, but even with the same acute stroke response team responding to stroke alerts in both settings, in‐hospital stroke response times remained significantly longer than response times for stroke in the ED.10 The presence of an in‐hospital stroke alert response team alone was not capable of reducing evaluation times to goal. Minimal improvement in median in‐hospital stroke alert evaluation time was seen in the intervening year, following the completion of our previously published analysis, suggesting explicit system QI was necessary.
The Hawthorne effect, in which individuals who know they are being observed modify behavior while such monitoring is in effect, is a major limitation of interpreting QI initiatives. By committing to continuous and ongoing feedback to front‐line providers, this phenomenon can be harnessed to sustain improvement.17 In effect, the study of efficient response to the in‐hospital stroke never ceases. UCH has continued to employ the post‐intervention stroke alert protocol and engage in ongoing feedback after each stroke alert. In the 12 months following the conclusion of this study, the median response time to in‐hospital strokes continues to be 30 minutes, and 7 additional in‐hospital stroke patients have been treated with thrombolysis.
This inpatient stroke alert initiative decreased median inpatient alert‐to‐CT time by 57%, and demonstrates that quality of in‐hospital stroke care can be improved. Decrease in stroke alert‐to‐CT time facilitates earlier thrombolytic therapy. Analysis of treatment and patient outcomes was outside of the scope of the current study, but earlier treatment has potential to significantly improve clinical outcomes.
The Society of Hospital Medicine defines one of the goals of QI to be the change in processes with reduction in variation, thus improving the care for all patients rather than focusing exclusively on outlier events.18 This initiative markedly reduced evaluation variability, allowing a greater percentage of patients to be eligible for treatment within the critical time window. Prior to the intervention, almost a quarter of patients had delays in evaluation sufficient to preclude IV thrombolysis, whereas in the 6 months after the intervention was initiated, not a single patient had evaluation delayed to the point that IV thrombolysis would not have been an option (Figure 1). The goal of in‐hospital stroke QI must be to improve the speed of the process for all patients, and assure that no patient is denied the potential for therapy as a result of inefficiencies in hospital systems.
Acknowledgements
The authors thank Traci Yamashita, PRA, for her work in the statistical analysis for this publication, and Dr Jeffrey Glasheen for development of the University of Colorado Hospital's Hospitalist Training Track Quality Improvement Program of which this work is a product.
- ,,, et al.Heart disease and stroke statistics—2010 update: a report from the American Heart Association.Circulation.2010;121:e46–e215.
- ,,.Characteristics of in‐hospital onset ischemic stroke.Eur Neurol.2006;55:155–159.
- ,.Inpatient and community ischemic strokes in a community hospital.Neuroepidemiology.2007;28:86–92.
- .In‐hospital stroke.Lancet Neurol.2003;2:741–746.
- .Time is brain‐quantified.Stroke.2006;37:263–266.
- ,,, et al.Ultra‐early thrombolysis in acute ischemic stroke is associated with better outcomes and lower mortality.Stroke.2010;41:712–716.
- ,,,.Expansion of the time window for treatment of acute ischemic stroke with intravenous tissue plasminogen activator: a science advisory from the American Heart Association/American Stroke Association.Stroke.2009;40:2945–2948.
- ,,, et al.Guidelines for early management of adults with ischemic stroke.Stroke.2007;38;1655–1711.
- ,,, et al.In‐hospital stroke treated with intravenous tissue plasminogen activator.Stroke.2008;39:2614–2616.
- ,,,,.Stroke alert program improves recognition and evaluation time of in‐hospital ischemic stroke.J Stroke Cerebrovasc Dis.2009;19:494–496.
- ,,,,,.In‐hospital stroke in a statewide stroke registry.Cerebrovasc Dis.2008;25:12–20.
- ,,,,.Quality of care for in‐hospital stroke: analysis of a statewide registry.Stroke.2011;42:207–210.
- ,,, et al.In‐hospital stroke: a multi‐center prospective registry.Eur J Neurol.2011;18:170–176.
- ,,.Code Gray—an organized approach to inpatient stroke.Crit Care Nurs Q.2003;26:296–302.
- ,,.ID, stat‐rapid response to in‐hospital stroke patients.Nurs Manage.2009;40:34–38.
- Institute of Healthcare Improvement. Quality Improvement Tools. Available at: http://www.ihi.org/IHI/Topics/Improvement/ImprovementMethods/Tools/. Accessed December 1,2010.
- ,,,,,.Variability in the Hawthorne effect with regard to hand hygiene performance in high‐ and low‐performing inpatient care units.Infect Control Hosp Epidemiol.2009;30:222–225.
- Society of Hospital Medicine Quality Improvement Resources. Available at: http://www.hospitalmedicine.org/ResourceRoomRedesign/html/32. Accessed December 1,2010.
In‐hospital strokes account for a significant proportion of the almost 800,000 cerebrovascular accidents that occur each year in the United States.1 Although inpatient strokes are thought to be under‐recognized and under‐reported, between 4% and 17% of all stroke patients in the hospital experienced stroke onset during hospitalization.2, 3 Estimates place the number of in‐hospital strokes at 35,000‐75,000 each year in the United States.4
As a result of the exquisite sensitivity of brain tissue to ischemic events, stroke is a medical emergency and time‐to‐treatment is of the essence. With each minute of ischemia, 1.9 million neurons are destroyed.5 Evidence suggests benefit of treatment with intravenous thrombolysis up to 4.5 hours after symptom onset, with lower disability associated with more rapid initiation of therapy.6, 7 To facilitate timely thrombolytic therapy, the American Stroke Association (ASA) recommends that imaging of the brain be initiated within 25 minutes of presentation for patients with suspected stroke.8
Studies demonstrate greater delays in the evaluation of hospitalized patients suffering from stroke compared to stroke patients presenting to the Emergency Department (ED).9, 10 Performance of timely evaluation of in‐hospital stroke rarely meets ASA goals. Analysis of a Michigan stroke registry found that only 3.1% of patients with in‐hospital strokes received computed tomography (CT) scan within 25 minutes of symptom recognition, and a Colorado stroke registry found time‐to‐evaluation to be more than twice the recommended benchmark.11, 12 Data from a multicenter stroke registry in Spain showed that half of all thrombolysis‐eligible, in‐hospital stroke patients could not be treated due to delays in evaluation.13
Our prior work demonstrated that the use of an in‐hospital stroke response team significantly reduced time to evaluation for true ischemic strokes.10 Even with this rapid response mechanism, the evaluation time for in‐hospital stroke was still more than twice that observed in the ED despite using the same team to respond to both settings. Hospital rapid response systems, specifically for patients with suspected stroke, have been described in the literature and outline in‐hospital response systems capable of meeting evaluation time goals.1415 How to optimize a stroke response system has not been previously described. The aim of this quality improvement (QI) initiative was to reduce time‐to‐evaluation for strokes occurring in patients already hospitalized using systems analysis and modification. We describe key elements and tools for implementing institutional QI for in‐hospital stroke.
METHODS
The QI initiative was implemented at the University of Colorado Hospital (UCH), a tertiary care academic medical center. The Colorado Multiple Institutional Review Board determined this project to be in the exempt category. UCH uses a protocol in which all stroke alerts undergo non‐contrast CT of the brain. If no intracranial bleeding is found, and the patient is a thrombolytic candidate, advanced CT imaging including CT perfusion and CT angiogram will also be performed during the alert. Magnetic resonance imaging (MRI) with diffusion weighted imaging is done non‐emergently for subsequent stroke evaluation, but is not part of the stroke alert protocol. The primary endpoint of time from alert to initiation of CT was chosen because it represents an unambiguous interval which is present for all stroke alerts. Pre‐intervention data was gathered for 6 months, from September 2008 to February 2009. During this period, the process through which in‐hospital strokes were identified, referred for evaluation, and treated was mapped to identify inefficient or unreliable steps, and the process was redesigned to enhance efficiency. The intervention was rolled out over a 3‐month period from March 2009 to May 2009. During the intervention roll‐out period, the refined stroke alert process and a checklist containing the optimal in‐hospital stroke alert response system was implemented. An education campaign was initiated, for acute stroke team members and nursing staff, on signs of stroke and each individual's role in response to symptoms of in‐hospital stroke based on the new process. During the roll‐out period, each unit in the hospital was provided in‐hospital stroke alert posters and a packet containing specific stroke education on the in‐hospital stroke alert process. Unit educators were empowered to determine how to best deliver the education to their staff, and many chose to invite the stroke program coordinator to give an hour‐long presentation on stroke prior to shift or during lunch. Each unit educator kept record of the stroke instruction provided and submitted staff signatures to the stroke program. Nursing staff was also provided with in‐hospital stroke protocol badge cards that outlined optimal approach to stroke identification and treatment using the revised protocol. Interventions were being implemented in a progressive fashion throughout the roll‐out period. Starting during the roll‐out and continuing into the post‐intervention period, feedback on all in‐hospital stroke alerts was provided to the stroke team and front‐line providers. The impact of the intervention was followed for 6 months post‐intervention from June 2009 to November 2009. The QI tools used in this project are well described by the Institute of Healthcare Improvement, and each step in the QI process is outlined in detail below:16
Step 1: Process Map With Identification of Unreliable and Reliably Slow Steps
A detailed process map was created to outline steps in the existing stroke alert process (see Supporting Figures, Process Maps, in the online version of this article). One investigator (R.Z.) interviewed key members of the multidisciplinary stroke team, including representatives from the departments of neurology, nursing, hospital medicine, neurosurgery, radiology, and transportation. Interviews with key stakeholders and frequent participants in stroke alerts revealed evidence of episodic unreliable steps. Stakeholders were noted to have slightly different conceptions of how the process flow was intended to occur, and where responsibility lay for certain tasks. The interviews aided in identification of pitfalls, bottlenecks, misconceptions, and areas that needed clarification or change in the alert process.
Examples of unreliable and bottleneck steps include: In the pre‐intervention process, the transportation department was responsible for moving patients to radiology; this step was identified as reliably slow. Investigation revealed that the transportation department did not have a mechanism for rapid response to emergency transport requests. Analysis also revealed that 2 key steps necessary for treating in‐hospital stroke were occasionally neglected: ensuring adequate intravenous (IV) access, and ordering of the correct panel of laboratory tests. Finally, a process communication deficit was identified, with CT technicians periodically unaware of the pending arrival of an in‐hospital stroke patient, thus preventing the scan from being cleared for the emergent stroke imaging.
Direct observation of real‐time stroke alerts in both the inpatient and ED settings was also employed to outline the process and identify areas of inefficiency. Direct observation of stroke alerts in progress verified the unified picture of process flow developed from stakeholder interviews (see Supporting Figures, Process Maps, in the online version of this article). Particular note was made of differences between the stroke alert process in the ED and the inpatient setting.
Step 2: System Redesign With Input From All Stakeholders
Proposed interventions were presented to hospital governing councils, including the interdisciplinary Stroke Council and Nurse Managers Council. After verification of the shortcomings of the existing alert process and obtaining buy‐in from key participants and governing departments, a new process was designed (see Supporting Figures, Process Maps, in the online version of this article). Specific changes include the following examples: First, electrocardiogram was moved to occur after CT scan. Second, investigation revealed that the transportation department within the hospital was designed for non‐emergent transportation and not amenable to change. The mechanism of patient transportation was changed such that, rather than using the transportation department, patients were now transported by the neurology resident responding to the stroke alert, accompanied by the patient's ward nurse. This both removed a bottleneck step and assured critical staff presence during the transportation of a potentially unstable patient. Third, to ensure effective communication, CT technicians were provided with stroke alert pagers that receive text messages regarding incoming in‐hospital stroke alert patients. Fourth, a time limit was set for IV attempts prior to transportation. The new protocol, along with explicit expectations for the role of the patient's nurse in in‐hospital stroke alerts, was described in a hospital‐wide nursing stroke education initiative.
Step 3: In‐Hospital Stroke Alert Checklist
A new standardized protocol for optimal in‐hospital stroke care was detailed on a laminated pocket card. The checklist described exactly what steps were to be performed, by whom, how to make them occur, and in what order. The checklist was designed to reduce the incidence of omitted steps, such as ordering of correct laboratory evaluations. The laminated cards highlighted the benchmark time to evaluation of 25 minutes. Process checklist cards were distributed to all members of the acute stroke alert response team, and short versions designed specifically for nursing staff were distributed as badge cards and posted on clinical care units (Supporting Information Appendix I).
Step 4: Real‐Time Feedback
During the intervention roll‐out and post‐intervention periods, feedback was provided from the stroke program to the front‐line providers following each in‐hospital stroke alert. The clinicians involved were notified of the final diagnosis and patient outcome, and were provided with feedback about how the patient's evaluation times compared with benchmark goals. Feedback may serve to motivate, based on clinician professionalism, but performance in the alert was not tied to rewards or penalties for the providers involved. The feedback process was designed to be bi‐directional, with requests for input from staff on barriers to rapid evaluation experienced and suggestions for future process improvement (Supporting Information Appendix II).
Statistical Analysis
The primary outcome was the change in time from stroke alert to CT scan (alert‐to‐CT), comparing pre‐intervention and post‐intervention periods. This time interval was chosen because its calculation involved unambiguous time points, which are available for all patients for whom an in‐hospital alert is called. It is a measure of process efficiency, with minimal expected variation based on differences in patient characteristics (ie, hemorrhagic vs ischemic stroke). Non‐overlapping Kaplan‐Meier curves confirmed the proportional hazards assumption for 2 Cox proportional hazards models: unadjusted and adjusted by group characteristics with P‐value <0.10. Relative hazards and estimates for the percent of patients with alert‐to‐CT scan 25 minutes, according to intervention groups, were obtained from these models. For analyses, admit unit was re‐categorized as intensive care unit (ICU), Med/Surg, or Other. Analyses were conducted using SAS Version 9.2 (SAS Institute, Inc, Cary, NC).
RESULTS
During the study intervals, there were 82 inpatient stroke alerts. Of these alerts, 75 were included in the analysis. Seven were excluded for the following reasons: alert canceled by the stroke team (3), time of alert was not recorded (1), patient identifiers not recorded (1), or stroke alert was preceded by CT imaging (2).
During the 6 months prior to intervention, the median inpatient stroke alert‐to‐CT time (n = 31) was 69.0 minutes (Table 1). Nineteen percent of these alerts met the goal of 25 minutes from alert‐to‐CT time. During the 6‐month post‐intervention period, the median inpatient alert‐to‐CT time (n = 44) was 29.5 minutes. Thirty‐two percent of these alerts met the 25‐minute alert‐to‐CT time benchmark. In the unadjusted model, patients during the post‐intervention period were significantly more likely to have alert‐to‐CT scan time 25 minutes compared to patients prior to the intervention (post‐intervention compared to pre‐intervention, Relative Hazard (RH): 3.03; 95% confidence interval [CI]: 1.76‐5.20; log‐rank P < 0.0001). This remained significant after adjustment for hyperlipidemia, active cancer, final diagnosis of ischemic brain injury, and final diagnosis of stroke mimic (RH: 4.96; 95% CI: 2.65‐9.32; P < 0.0001); data not shown. Admit unit was not included in the adjusted model since there was no indication of differences in the 3‐level variable according to intervention group (P = 0.27). In addition to reduction in median response times, the variability of response times was markedly reduced, and no patient in the 6‐month post‐intervention period had delay to CT sufficient to preclude use of IV thrombolysis (Figure 1).
| Pre‐Intervention (n = 31) | Post‐Intervention (n = 44) | P Value | |
|---|---|---|---|
| |||
| Stroke alert to CT time, median [95% CI] | 69 min [34, 103] | 29.5 min [26, 40] | P < 0.0001 |
| Age, median [IQR] | 61.0 [54.0, 70.0] | 60.5 [48.5, 70.5] | 0.94 |
| Female (%) | 19 (61.3) | 23 (52.3) | 0.44 |
| Race (%) | |||
| Asian | 1 (3.2) | 1 (2.3) | 0.31 |
| Black | 4 (12.9) | 6 (13.6) | |
| Caucasian | 21 (67.7) | 27 (61.4) | |
| Hispanic | 3 (9.7) | 10 (22.7) | |
| Unknown | 2 (6.5) | 0 (0) | |
| Admit unit (%) | |||
| Intensive care | 12 (38.7) | 10 (22.7) | 0.07 |
| Medicine/surgery | 15 (48.4) | 24 (54.6) | |
| Neurology | 0 (0) | 5 (11.4) | |
| Post‐acute care | 3 (9.7) | 0 (0) | |
| Rehabilitation | 1 (3.2) | 2 (4.6) | |
| Women's and maternal care | 0 (0) | 2 (4.6) | |
| Cardiology | 0 (0) | 1 (2.3) | |
| Case mix index, median [IQR] | n = 29 2.6 [1.1, 5.0] | n = 42 2.2 [1.6, 4.5] | 0.82 |
| Prior cerebrovascular accident (%) | 5 (16.1) | 8 (18.2) | 0.82 |
| Hypertension (%) | 17 (54.8) | 24 (54.6) | 0.98 |
| Diabetes mellitus (%) | 7 (22.6) | 11 (25.0) | 0.81 |
| Hyperlipidemia (%) | 15 (48.4) | 9 (20.5) | 0.01 |
| Tobacco abuse, current (%) | 4 (12.9) | 1 (2.3) | 0.15 |
| Alcohol abuse (%) | 2 (6.5) | 0 (0) | 0.17 |
| Active cancer (%) | 8 (25.8) | 5 (11.4) | 0.10 |
| Peripheral vascular disease (%) | 2 (6.5) | 3 (6.8) | 1.0 |
| Coronary artery disease (%) | 6 (19.4) | 7 (15.9) | 0.70 |
| Congestive heart failure (%) | n = 30 5 (16.7) | 4 (9.1) | 0.47 |
| Valvulopathy (%) | 0 (0) | 1 (2.3) | 1.0 |
| Atrial fibrillation (%) | 3 (9.7) | 10 (22.7) | 0.14 |
| Anticoagulation (%) | 7 (22.6) | 7 (15.9) | 0.47 |
| Final diagnosis ischemic brain injury (%) | 15 (48.4) | 11 (25.0) | 0.04 |
| Final diagnosis hemorrhagic brain injury (%) | 3 (9.7) | 4 (9.1) | 1.0 |
| Final diagnosis stroke mimic (symptoms not due to ischemic or hemorrhagic brain injury) (%) | 13 (41.9) | 29 (65.9) | 0.04 |
CONCLUSIONS
In‐hospital strokes represent an emergency for which response time is critical. Neurologic injury progresses with every minute of ischemia, and current recommendations offer a limited time window for intravenous thrombolysis. For stroke with symptom onset in the monitored setting of the hospital, there is a compelling imperative to reduce all delays from system inefficiencies. The findings of the current QI initiative suggest that dramatic improvements are possible through systematic evaluation and redesign of hospital response processes, a checklist for in‐hospital stroke carried by front‐line responders, and ongoing real‐time feedback.
Limitations of this study include a prepost design. The necessity of implementing system change hospital‐wide precluded use of a concurrent control group. The time goals for evaluation are derived from American Stroke Association targets for patients arriving in the Emergency Department. There are differences in process between the hospital ward and the Emergency Department, but the fundamental concept of minimizing time to evaluation once patient symptoms are recognized by hospital staff remains valid.
The possibility of system improvements not due to this QI initiative cannot be excluded. In 2006, this hospital expanded the responsibility of the stroke response team to include acute neurologic deficits outside of the ED without other changes to the in‐hospital stroke alert process. This reduced time to evaluation for in‐hospital ischemic strokes compared to usual care, but even with the same acute stroke response team responding to stroke alerts in both settings, in‐hospital stroke response times remained significantly longer than response times for stroke in the ED.10 The presence of an in‐hospital stroke alert response team alone was not capable of reducing evaluation times to goal. Minimal improvement in median in‐hospital stroke alert evaluation time was seen in the intervening year, following the completion of our previously published analysis, suggesting explicit system QI was necessary.
The Hawthorne effect, in which individuals who know they are being observed modify behavior while such monitoring is in effect, is a major limitation of interpreting QI initiatives. By committing to continuous and ongoing feedback to front‐line providers, this phenomenon can be harnessed to sustain improvement.17 In effect, the study of efficient response to the in‐hospital stroke never ceases. UCH has continued to employ the post‐intervention stroke alert protocol and engage in ongoing feedback after each stroke alert. In the 12 months following the conclusion of this study, the median response time to in‐hospital strokes continues to be 30 minutes, and 7 additional in‐hospital stroke patients have been treated with thrombolysis.
This inpatient stroke alert initiative decreased median inpatient alert‐to‐CT time by 57%, and demonstrates that quality of in‐hospital stroke care can be improved. Decrease in stroke alert‐to‐CT time facilitates earlier thrombolytic therapy. Analysis of treatment and patient outcomes was outside of the scope of the current study, but earlier treatment has potential to significantly improve clinical outcomes.
The Society of Hospital Medicine defines one of the goals of QI to be the change in processes with reduction in variation, thus improving the care for all patients rather than focusing exclusively on outlier events.18 This initiative markedly reduced evaluation variability, allowing a greater percentage of patients to be eligible for treatment within the critical time window. Prior to the intervention, almost a quarter of patients had delays in evaluation sufficient to preclude IV thrombolysis, whereas in the 6 months after the intervention was initiated, not a single patient had evaluation delayed to the point that IV thrombolysis would not have been an option (Figure 1). The goal of in‐hospital stroke QI must be to improve the speed of the process for all patients, and assure that no patient is denied the potential for therapy as a result of inefficiencies in hospital systems.
Acknowledgements
The authors thank Traci Yamashita, PRA, for her work in the statistical analysis for this publication, and Dr Jeffrey Glasheen for development of the University of Colorado Hospital's Hospitalist Training Track Quality Improvement Program of which this work is a product.
- ,,, et al.Heart disease and stroke statistics—2010 update: a report from the American Heart Association.Circulation.2010;121:e46–e215.
- ,,.Characteristics of in‐hospital onset ischemic stroke.Eur Neurol.2006;55:155–159.
- ,.Inpatient and community ischemic strokes in a community hospital.Neuroepidemiology.2007;28:86–92.
- .In‐hospital stroke.Lancet Neurol.2003;2:741–746.
- .Time is brain‐quantified.Stroke.2006;37:263–266.
- ,,, et al.Ultra‐early thrombolysis in acute ischemic stroke is associated with better outcomes and lower mortality.Stroke.2010;41:712–716.
- ,,,.Expansion of the time window for treatment of acute ischemic stroke with intravenous tissue plasminogen activator: a science advisory from the American Heart Association/American Stroke Association.Stroke.2009;40:2945–2948.
- ,,, et al.Guidelines for early management of adults with ischemic stroke.Stroke.2007;38;1655–1711.
- ,,, et al.In‐hospital stroke treated with intravenous tissue plasminogen activator.Stroke.2008;39:2614–2616.
- ,,,,.Stroke alert program improves recognition and evaluation time of in‐hospital ischemic stroke.J Stroke Cerebrovasc Dis.2009;19:494–496.
- ,,,,,.In‐hospital stroke in a statewide stroke registry.Cerebrovasc Dis.2008;25:12–20.
- ,,,,.Quality of care for in‐hospital stroke: analysis of a statewide registry.Stroke.2011;42:207–210.
- ,,, et al.In‐hospital stroke: a multi‐center prospective registry.Eur J Neurol.2011;18:170–176.
- ,,.Code Gray—an organized approach to inpatient stroke.Crit Care Nurs Q.2003;26:296–302.
- ,,.ID, stat‐rapid response to in‐hospital stroke patients.Nurs Manage.2009;40:34–38.
- Institute of Healthcare Improvement. Quality Improvement Tools. Available at: http://www.ihi.org/IHI/Topics/Improvement/ImprovementMethods/Tools/. Accessed December 1,2010.
- ,,,,,.Variability in the Hawthorne effect with regard to hand hygiene performance in high‐ and low‐performing inpatient care units.Infect Control Hosp Epidemiol.2009;30:222–225.
- Society of Hospital Medicine Quality Improvement Resources. Available at: http://www.hospitalmedicine.org/ResourceRoomRedesign/html/32. Accessed December 1,2010.
Residents Improving Quality
To Err Is Human revealed the underappreciated tension between the enormous benefits of medical care and the potential for harm.1 Following this report, there has been an explosion of research and commentary detailing quality improvement (QI) opportunities. One area of growing emphasis has been resident physician training.2, 3 If medical care is dangerous, then a substantial contributor to the hazard must be the apprentice‐style process of physician training and the novice skill set of the trainees.4, 5 Many resident training programs have devised efforts to decrease the errors committed by physicians‐in‐training,6 change the culture of residency training,7 engage residents in quality improvement,8, 9 and improve resident training in quality improvement.10
Many of the programs devised to teach QI in the residency setting require substantial funding, a large pool of QI experts, or redesign of resident training programs.410 While effective, these programs are not feasible for many resource‐constrained residency programs. A less intense program, using resident‐led, hospitalist‐facilitated, limited root cause analysis (RCA), has been adopted at the Internal Medicine Residency Program at the Mount Sinai Hospital (MSH). We describe our 2‐year experience using this technique, including cases discussed, improvement strategies suggested, projects implemented, and resident perceptions.
METHODS
Setting
Departmental QI leaders developed this initiative in the Internal Medicine Residency Program at the MSH in New York City, New York. This residency program trains over 140 residents annually in categorical, preliminary, and research track positions, as well as an affiliated medicine/pediatrics program. The program's residents rotate at 3 clinic sites: a tertiary care hospital, a public safety‐net hospital, and a Veterans Affairs hospital. The QI program was only implemented at the MSH. Over 90% of the program's graduates go on to complete a subspecialty fellowship.
Intervention Description
The QI program was designed around a noon‐time quality improvement conference (QIC) occurring once every 4 weeks. In the weeks prior to the session, chief residents and a hospitalist mentor selected a case related to an inpatient care issue. Potential cases were solicited, and/or offered, from a range of sources including attending physicians, nurse managers, residents, and quality officers. Only cases from the teaching services were chosen. To ensure that participants on the case were able to recall relevant details, preference was given to more recent cases. A third‐year resident on an elective or outpatient block was chosen to investigate the case. To maximize the objectivity of the investigation, every effort was made to select a resident who was not involved in the care of the patient.
The resident was instructed to complete a limited RCA (fewer fact‐finding interviews and only 1 group meeting) and was directed to online resources.11 Each resident presenter worked closely with the chief residents and hospitalist mentor to identify appropriate strategies for collecting data and interviewing involved parties. If necessary, either due to volume of work or sensitivity of the case, the chief resident or hospitalist would assist with the data gathering. The resident contacted multiple parties involved in the patient care issue including, nurses, residents, attendings, pharmacists, social workers, and, if appropriate, the patient. The resident constructed a timeline for each case, and identified specific points in the patient care experience, where errors, near misses, or misunderstandings occurred. During the QIC, these findings were presented to Internal Medicine residents, chief residents, representatives from the Chief Medical Officer's office, attending physicians overseeing the residents on inpatient rotations, and representatives from any group (social work nursing, housekeeping, pharmacy, etc) that may have impacted patient care for the particular case being investigated. On average, 50 healthcare providers attended the QIC. Lunch was provided.
After the findings were presented, a chief resident and a lead hospitalist facilitated a group discussion on the circumstances surrounding the case. Discussions were focused on identifying system‐wide failures and proposing systems‐based solutions. Great efforts were made to remind all participants to refrain from individual blame. At the end of each QIC, participants summarized and prioritized suggestions to reduce the discussed error. Interested residents were invited to form improvement committees for cases with viable solutions. Each committee attempted to implement improvements discussed during the QIC. Committees, led by a representative from the Division of Hospital Medicine, included 2 to 4 residents as well as healthcare workers from other disciplines if appropriate. For all improvement efforts, the focus was on the interventions which appeared high yield with low cost.
Intervention Evaluation
The program was exempt from Institutional Review Board review as a part of the Department of Medicine's quality improvement and assurance portfolio.
The results of the QICs were tracked. After each case, a QI team consisting of chief residents and representatives from the Division of Hospital Medicine recorded the cases presented, and interventions suggested for each case, in an online database. After implementation, the success of each intervention was recorded. To evaluate the types of interventions suggested by residents, the 3 physician‐authors, who regularly attend these conferences and have a focused career interest in QI, grouped all suggestions into 4 broad categories: Educational, Reminder Systems, Design Changes (protocol‐based), and Design Changes (Information Technology [IT]‐based). Design change interventions (IT‐based) consisted of an adjustment to electronic systems, such as displaying specific lab results on a medication ordering system. Design changes (protocol‐based) consisted of changes made to standing protocols such as nursing protocols for reporting abnormal lab values. Reminder system interventions were endeavors such as a checklist for discharge planning. Educational interventions focused on providing additional training sessions or conferences.
The 3 physician‐authors independently reviewed each suggested intervention to determine its success. They first evaluated whether the change was attempted or not. For all attempted interventions, the reviewer then assessed if there was either objective permanent system‐wide change, subjective behavior change, or no change. To meet the objective change threshold, the intervention either had to have permanently changed provider workflow or have data demonstrating behavior change or improved outcome. Interventions with anecdotal evidence that behavior was improved or modified, but lacking systematic data, were qualified as subjective behavior change. For each assessment, 2 of the 3 reviewers needed to agree for an intervention to be recorded as a success.
Resident views on the monthly conferences were solicited via an anonymous and voluntary questionnaire. A first survey was designed to assess whether residents felt that the conferences provided them with the ability to recognize and improve systems errors which compromise patient care. This survey was administered at the conclusion of the first year of the program to residents who attended the final 2 QICs. A second survey assessed whether the tone of the conferences was constructive and blame‐free. This survey was administered at the conclusion of the second year of the program to residents who attended the year's final 2 QICs.
RESULTS
Over the first 22 months of the program, 20 conferences were held (Table 1). The topics covered ranged considerably and included: deficits in supervision, medication errors, patient satisfaction, staff safety, and 30‐day readmissions. Forty‐six distinct interventions were suggested during these conferences. Of those, an attempt was made to initiate 25 (54%) of these suggestions (Table 2). Of the 25 interventions that were initiated, 18 (72%) were determined to be successful. Eight resulted in objective permanent system‐wide change and 10 resulted in subjective behavior change among residents.
| QIC Topic | Interventions Suggested by Residents | Suggestion Results (Attempted/Not Attempted, Successful/Unsuccessful) |
|---|---|---|
| ||
| Central venous catheter guide wire lost during code placement | Improved supervision and training for line placement | Attempted, but unsuccessful |
| Avoid unnecessary line placement during codes | Attempted, but unsuccessful | |
| Inappropriate administration of warfarin | Decision support providing real‐time coagulation profile | Attempted and successful |
| Central line bloodstream infection | Clarified and encouraged use of line service | Attempted and successful |
| Daily documentation of catheter placement date | Not attempted | |
| Delayed administration of pain medication | Training nurses to use text paging communication system | Attempted and successful |
| Patient discharged on wrong medication dose | Do not use abbreviations | Not attempted |
| Electronic medication reconciliation | Attempted and successful | |
| Confusion over code status | Clarification of various forms used for DNR | Not attempted |
| Better communication of code status during signout | Not attempted | |
| Patient received hydromorphone IV instead of PO during verbal order at end‐of‐life | Verbal orders should have talk back verification | Attempted, but unsuccessful |
| Encourage informing patients of medical errors | Attempted, but unsuccessful | |
| Premature closure of diagnosis during transfer from MICU | Improve comfort level disagreeing with supervisors | Attempted, but unsuccessful |
| Reassessment of patient prior to late‐day MICU transfers | Not attempted | |
| Patient erroneously received clopidogrel bisulfate (Plavix) for years due to poor medication reconciliation | Improved discharge summary interface | Attempted and successful |
| Encourage physicians to call PCP on discharge | Attempted and successful | |
| Modified barium swallow ordered incorrectly, resulting in patient aspiration | Simplify electronic order entry system to clearly identify tests | Not attempted |
| Change radiology requisition form to facilitate communication | Not attempted | |
| Fingersticks leading to blood exposure | Train PGY1s on the needles used at all 3 hospitals | Not attempted |
| Improve mask with face shields and gown availability | Attempted and successful | |
| Patient discharged with central venous catheter still in place | Check list for lines and Foleys | Not attempted |
| Improved discharge documentation | Not attempted | |
| 30‐Day readmission | Mandatory discharge summary completion prior to discharge | Attempted and successful |
| Discharge summary training during intern year | Attempted and successful | |
| DKA developed in house when insulin not administered | Improve communication between floor and dialysis RNs | Not attempted |
| Better PA supervision by residents regarding order writing | Attempted and successful | |
| Compromised patient satisfaction | Patient handouts with name and role of each care team member | Attempted, but unsuccessful |
| Patient satisfaction coaching | Attempted and successful | |
| Elevated PTT and poor documentation | Improved feedback to residents regarding daily notes | Not attempted |
| Nurses must call physicians with alert values | Not attempted | |
| Hospital‐acquired MRSA | Improve availability of contact precaution gowns | Attempted, but unsuccessful |
| Direct observation of hand washing on morning rounds | Attempted and successful | |
| Staff safety with deranged family member | Education of staff regarding safety protocols | Attempted, but unsuccessful |
| Transfer of unstable patient from outside hospital ICU to general medicine floor | Standardization of OSH transfer guidelines | Not attempted |
| Improved documentation of transferring MD contract data | Attempted and successful | |
| Consult called, patient not seen by attending | Education of faculty on existing institutional consult policy | Attempted, but unsuccessful |
| Clarification of violations reporting process for hospital consults | Attempted, but unsuccessful | |
| Type of Intervention | No. of Interventions Suggested | No. of Interventions Implemented (%) | Of Implemented Interventions, No. Which Were Successful (%) | No. of Attempted Interventions With Objective Change (%) | No. of Attempted Interventions With Subjective Change (%) |
|---|---|---|---|---|---|
| Design changes: information technology‐based | 5 | 2 (40) | 2 (100%) | 2 (100) | 0 (0) |
| Design changes: protocol‐based | 17 | 10 (59) | 8 (80%) | 5 (50) | 3 (30) |
| Educational | 20 | 11 (55) | 7 (64) | 1 (9) | 6 (55) |
| Reminder systems | 4 | 2 (50) | 1 (50) | 0 (0) | 1 (50) |
| Total | 46 | 25 (54) | 18 (72) | 8 (32) | 10 (40) |
Two IT‐based system design changes were implemented; both resulted in objective system‐wide change. Eight protocol‐based design changes were implemented successfully, 5 objectively, and 3 subjectively. Seven educational interventions and 1 reminder system intervention were initiated.
The most successful intervention to come from these conferences was the implementation of an electronic medication reconciliation program. The reconciliation program was suggested following a conference on a patient who was discharged home on the wrong dose of a medication. The institution's paper‐based medication reconciliation process, particularly for heart‐failure patients, had long been known to be deficient. The QIC brought this issue to life by highlighting a cases that may have been ameliorated with a more robust medication reconciliation process. Enthusiastic residents were invited to build a case for medication reconciliation to the Chief Medical Officer, and this helped garner resources for the hospital‐wide project. Another successful IT‐based intervention was initiated after a case of inappropriate administration of warfarin to a patient with an already elevated international normalized ratio (INR). The computerized order entry system was changed so that, at the point of ordering warfarin, the most recent coagulation profile and platelet values appear before an order can be finalized.
An example of a protocol‐based intervention came from a conference that focused on poor communication at the time of discharge, which resulted in a 30‐day readmission. As a result, resident work flow was changed so that discharge summaries are expected to be completed at the time of discharge. Along with this protocol change was an educational initiative to improve the quality of discharge summaries by including essential data for the transition of care.
Overall, residents reviewed the conferences very positively (Table 3). The response rate for the first year survey was 40% (56/140) and the second year survey was 18% (26/143). The vast majority of participants felt that the conferences were of high quality (96%) and that the exercise could lead to improvement in quality (98%). Residents felt that the conference focused more on system issues than individual shortcomings (92%). A majority felt comfortable expressing their opinions during the conferences (77%).
| Overall Conference Quality | ||
|---|---|---|
| Question | Mean Score (n = 53) | Rating Question a 4 or 5 |
| Conference Tone | ||
| Question | Mean Score (n = 26) | Rating Question With a 4 or 5 |
| ||
| Please rate the overall quality of the QIC conferences. | 4.49* | 98% |
| The case highlighted an issue that is highly relevant to the quality of patient care. | 4.81 | 100% |
| Solutions discussed at this conference could lead to improved patient care and/or patient satisfaction. | 4.65 | 96% |
| My knowledge of issues related to hospital quality and patient safety has been enhanced by this conference. | 4.61 | 96% |
| The QIC focused on individuals, individual actions, or omissions, which compromised high quality care. | 3.35 | 50% |
| The QIC focused on system failures that compromised high quality care. | 4.35 | 92% |
| I felt comfortable sharing my honest opinions about the medical events presented during the conferences. | 4.15 | 77% |
| I avoided expressing my opinions about the medical events presented during the conferences because I did not want to criticize my peers. | 2.5 | 19% |
DISCUSSION
The first 20 sessions from this resident‐led, hospitalist‐facilitated QI program provided evidence that residents can contribute to patient safety within a large tertiary care center. The role of residents in actively addressing errors and unsatisfactory outcomes in the hospital has not been a traditional QI focus.12 Involvement has typically been a passive process for physician trainees, while more senior clinical staff members decide on and prioritize QI activities. We have observed that empowering residents to take a more active role in performance improvement yields significant change and does more than simply educate about basic QI methodology.
One reason for the success of these conferences was leveraging insights of residents as key front line providers. Residents spend more time than perhaps any other category of hospital employee working within clinical care systems. They are deeply aware of the quality struggles inherent to large healthcare organizations, and this insight can lead to high impact suggestions for improvement. Often, suggestions were simple proposals that were overlooked or unappreciated by other administrative leaders. An example of this type of contribution was when residents brought the lack of infection control equipment, on certain units, to the attention of the infection control staff and facility engineers. At a separate conference, residents informed the transfer office staff that valuable contact information for physicians accepting outside hospital transfers was not being collected. Both of these observations led to quick change, with better infection control gown availability and improved documentation by transfer office staff.
Our program also demonstrated that including residents in QI provides momentum for either a training program or an institution to pursue solutions that might have otherwise been resisted. The improvement suggestion to complete discharge summaries prior to the patient leaving the hospital had long been a goal for the residency program leadership, but there was hesitation to force this work flow change on the residents. After a QI conference, when a number of the residents themselves made the suggestion, implementing the change was much easier. Similarly, after several cases of clear errors relating to a suboptimal process of medication reconciliation, the institution dedicated scarce IT personnel to work with providers to develop a robust, user‐friendly medication reconciliation application to decrease transition of care errors.
Through this program, residents also demonstrated their ability to deconstruct patient care problems. For each case, resident session leaders interviewed physician providers, physician extenders, nurses, nurse managers, pharmacists, security staff, engineering staff, and administrative staff. They gathered crucial information regarding the patient care event and the gaps or errors that led to a poor outcome. After many of the conferences, the resident presenters commented on how the investigative exercise left them more appreciative of the complexity of the medical system and interested in fixing the problems uncovered.
The feedback from the resident surveys demonstrated that residents valued the QI program. The data collected also shows that such programs can be executed in a manner which highlights system flaws. Our data do, however, suggest that there is room to improve the tone of the conference to further decrease the sense from residents that quality discussions focus on individuals. Residents often struggle to master the myriad new expectations inherent in the transition from student to physician.13 A quality process which discourages already overworked and uncertain trainees, by creating a process which assigns blame for unintentional quality shortcomings, would be counterproductive.
Lessons Learned
While this QI program has had success uncovering clinical care issues, and creating a climate and process for resident participation in improvement, there has been a number of limitations and lessons learned. Most importantly, including busy residents in any process that requires regular participation and follow‐through is difficult. A number of suggested improvements which created substantial interest and early momentum were ultimately left unfinished, as residents and even faculty facilitators became overwhelmed by clinical responsibilities. In fact, the majority of suggestions have not been successfully implemented and even fewer have created lasting change. This must be carefully monitored, as experiencing multiple failures can undermine the empowerment that such QI programs are created to foster.
Regular reflection on the successful and unsuccessful projects yielded several important insights that resulted in changes over the course of the program. Suggestions were more likely to move from idea generation to execution if the QIC was attended by administrators with decision‐making authority. Several of the suggestionsimproved medication reconciliation, better transfer documentation, and improved availability of infection control productswere able to be acted upon because conference attendees were administrators with purview over these issues. Many times, these leaders were more than willing to implement helpful suggestions, but simply needed them to be brought to their attention. As a result, we have been more attentive to inviting as many stakeholders as possible to the QICs.
It was also clear that suggestions would not be realized without a physician leader and were more successful when resident interest was substantial. After each QIC, residents who had made promising suggestions were approached to continue to participate. If the residents agreed, the projects were pursued and a faculty or chief resident leader was assigned. Lastly, we have also made use of one of the department's QI data analysts to assist with project completion. This individual has been made available to provide administrative support (organizing meetings, paperwork, etc) but also to provide data for projects, should the need arise.
Another important finding is that the tone of the QI program must be constantly monitored. Despite reminding residents at each session that the exercise was for the purpose of identifying systems barriers to delivering high quality care, there were times when residents felt targeted or blamed. At one point, a number of residents voiced their concerns that the conferences had spent too much time highlighting quality failures without recognizing the many positive performances on the teaching service. As a result, subsequent conferences often began by highlighting quality improvements made. Additionally, a part of 1 session each year had been dedicated to reading letters and e‐mails sent by patients or families which highlight memorably positive performances by the residents. Finally, care was taken to make sure invited guests to the sessions were reminded of the session's blame‐free ground rules.
Care must be taken when investigating clinical cases. On several occasions, attending physicians expressed discomfort with having residents scrutinize a clinical event. Although this process was protected under the QI umbrella and faculty names were never shared at the conferences, some faculty believed that this process was the purview of departmental or hospital QI staff, not untrained residents. Given the support provided for this program by the department chair and program director, as well as the professional nature with which the residents conducted their inquiries, there was little difficulty rejecting this line of objection. This feedback did lead supervisors to be more involved with the resident presenters, coaching them regarding data gathering and interviewing. If a case appears that it will be particularly sensitive, the hospitalist mentor or chief resident will reach out to involved residents and faculty to notify them that the case will be reviewed.
A final development secured, in part, as a result of this quality program has been more protected faculty time. At the start of this program, all faculty time was donated time on top of other administrative and patient care responsibilities. After the first 18 months of the QIC program, the residency program named an assistant program director for quality. At the time of writing this manuscript, the program further invested in quality by naming both an assistant and associate program director for quality. These positions combined amount to at least 0.4 full‐time equivalents (FTE). Of that, roughly 0.1 FTE is spent working on the QICs and subsequent project implementation.
Limitations
The evaluation of the success of the interventions potentially biased our findings. The qualitative method of using multiple reviewers, all of whom were invested in the program's outcomes, to gauge the success of initiated interventions may have resulted in an overestimate of the project's effectiveness. Furthermore, the category of subjective change lacks measurable criteria, making replication of the findings difficult.
The results presented here are from a single institution, conceived of and executed by a group of dedicated faculty. Moreover, both the chair of the department and the program director were very supportive of this endeavor. Possibly, because of these aspects, the findings presented here would not be readily replicated at another institution.
The percentage of residents who completed the feedback surveys was low. This may result in an overestimate of quality, value, and tone of the conferences, as well as potentially missing an opportunity for improving the program. We will address this issue through more rigorous quantitative and qualitative feedback at the end of the third year of the program.
CONCLUSIONS
Residents are willing and effective participants in a QI program. As front line providers, their experiences are valuable and their willingness to share insights can be an impetus for change. Finally, a process which includes modest investigation by third year residents, has faculty support and oversight, and provides minimal administrative support can overcome the difficulty of involving overworked residents in quality efforts.
Acknowledgements
The authors acknowledge Michael Pourdehnad for his role in developing the quality program.
- ,,.To Err Is Human: Building a Safer Health System.Washington, DC:National Academy Press;1999.
- ,,,,.Redesigning residency education in internal medicine: a position paper from the Association of Program Directors in Internal Medicine.Ann Intern Med.2006;144:920–926.
- Accreditation Council for Graduate Medical Education. Program directors guide to the common program requirements. Available at: http://www.acgme.org/acWebsite/navPages/commonpr_documents/ CompleteGuide_v2%20.pdf. Accessed May 5,2010.
- ,,,.Medical errors involving trainees: a study of closed malpractice claims from 5 insurers.Arch Intern Med.2007;167:2030–2036.
- ,,,,,.Residents report on adverse events and their causes.Arch Intern Med.2005;165:2607–2613.
- ,.A system of analyzing medical errors to improve GMA curricula and programs.Acad Med.2001;76:125–133.
- ,,, et al.Changing conversations: teaching safety and quality in residency training.Acad Med.2008;83(11):1080–1087.
- ,,.Practice‐based learning and improvement: a curriculum in continuous quality improvement for surgery residents.Arch Surg.2007;142:479–483.
- .Involving residents in quality improvement: contrasting “top‐down” and “bottom‐up” approaches. Accreditation Council for Graduate Medical Education and Institute for Healthcare Improvement‐day project.ACGME Bulletin. August2008.
- ,,,,.Creating a quality improvement elective for medical house officers.Gen Intern Med.2004;19(8):861–867.
- National Center for Patient Safety. United States Department for Veteran Affairs. Root cause analysis tools. Available at: http://www.patientsafety.gov/CogAids/RCA/. Accessed August 17,2010.
- ,,, et al.Residents' engagement in quality improvement: a systematic review of the literature.Acad Med.2009;84:1757–1764.
- ,,.Graduates from a traditional medical curriculum evaluate the effectiveness of their medical curriculum through interviews.BMC Med Educ.2009;9:64.
To Err Is Human revealed the underappreciated tension between the enormous benefits of medical care and the potential for harm.1 Following this report, there has been an explosion of research and commentary detailing quality improvement (QI) opportunities. One area of growing emphasis has been resident physician training.2, 3 If medical care is dangerous, then a substantial contributor to the hazard must be the apprentice‐style process of physician training and the novice skill set of the trainees.4, 5 Many resident training programs have devised efforts to decrease the errors committed by physicians‐in‐training,6 change the culture of residency training,7 engage residents in quality improvement,8, 9 and improve resident training in quality improvement.10
Many of the programs devised to teach QI in the residency setting require substantial funding, a large pool of QI experts, or redesign of resident training programs.410 While effective, these programs are not feasible for many resource‐constrained residency programs. A less intense program, using resident‐led, hospitalist‐facilitated, limited root cause analysis (RCA), has been adopted at the Internal Medicine Residency Program at the Mount Sinai Hospital (MSH). We describe our 2‐year experience using this technique, including cases discussed, improvement strategies suggested, projects implemented, and resident perceptions.
METHODS
Setting
Departmental QI leaders developed this initiative in the Internal Medicine Residency Program at the MSH in New York City, New York. This residency program trains over 140 residents annually in categorical, preliminary, and research track positions, as well as an affiliated medicine/pediatrics program. The program's residents rotate at 3 clinic sites: a tertiary care hospital, a public safety‐net hospital, and a Veterans Affairs hospital. The QI program was only implemented at the MSH. Over 90% of the program's graduates go on to complete a subspecialty fellowship.
Intervention Description
The QI program was designed around a noon‐time quality improvement conference (QIC) occurring once every 4 weeks. In the weeks prior to the session, chief residents and a hospitalist mentor selected a case related to an inpatient care issue. Potential cases were solicited, and/or offered, from a range of sources including attending physicians, nurse managers, residents, and quality officers. Only cases from the teaching services were chosen. To ensure that participants on the case were able to recall relevant details, preference was given to more recent cases. A third‐year resident on an elective or outpatient block was chosen to investigate the case. To maximize the objectivity of the investigation, every effort was made to select a resident who was not involved in the care of the patient.
The resident was instructed to complete a limited RCA (fewer fact‐finding interviews and only 1 group meeting) and was directed to online resources.11 Each resident presenter worked closely with the chief residents and hospitalist mentor to identify appropriate strategies for collecting data and interviewing involved parties. If necessary, either due to volume of work or sensitivity of the case, the chief resident or hospitalist would assist with the data gathering. The resident contacted multiple parties involved in the patient care issue including, nurses, residents, attendings, pharmacists, social workers, and, if appropriate, the patient. The resident constructed a timeline for each case, and identified specific points in the patient care experience, where errors, near misses, or misunderstandings occurred. During the QIC, these findings were presented to Internal Medicine residents, chief residents, representatives from the Chief Medical Officer's office, attending physicians overseeing the residents on inpatient rotations, and representatives from any group (social work nursing, housekeeping, pharmacy, etc) that may have impacted patient care for the particular case being investigated. On average, 50 healthcare providers attended the QIC. Lunch was provided.
After the findings were presented, a chief resident and a lead hospitalist facilitated a group discussion on the circumstances surrounding the case. Discussions were focused on identifying system‐wide failures and proposing systems‐based solutions. Great efforts were made to remind all participants to refrain from individual blame. At the end of each QIC, participants summarized and prioritized suggestions to reduce the discussed error. Interested residents were invited to form improvement committees for cases with viable solutions. Each committee attempted to implement improvements discussed during the QIC. Committees, led by a representative from the Division of Hospital Medicine, included 2 to 4 residents as well as healthcare workers from other disciplines if appropriate. For all improvement efforts, the focus was on the interventions which appeared high yield with low cost.
Intervention Evaluation
The program was exempt from Institutional Review Board review as a part of the Department of Medicine's quality improvement and assurance portfolio.
The results of the QICs were tracked. After each case, a QI team consisting of chief residents and representatives from the Division of Hospital Medicine recorded the cases presented, and interventions suggested for each case, in an online database. After implementation, the success of each intervention was recorded. To evaluate the types of interventions suggested by residents, the 3 physician‐authors, who regularly attend these conferences and have a focused career interest in QI, grouped all suggestions into 4 broad categories: Educational, Reminder Systems, Design Changes (protocol‐based), and Design Changes (Information Technology [IT]‐based). Design change interventions (IT‐based) consisted of an adjustment to electronic systems, such as displaying specific lab results on a medication ordering system. Design changes (protocol‐based) consisted of changes made to standing protocols such as nursing protocols for reporting abnormal lab values. Reminder system interventions were endeavors such as a checklist for discharge planning. Educational interventions focused on providing additional training sessions or conferences.
The 3 physician‐authors independently reviewed each suggested intervention to determine its success. They first evaluated whether the change was attempted or not. For all attempted interventions, the reviewer then assessed if there was either objective permanent system‐wide change, subjective behavior change, or no change. To meet the objective change threshold, the intervention either had to have permanently changed provider workflow or have data demonstrating behavior change or improved outcome. Interventions with anecdotal evidence that behavior was improved or modified, but lacking systematic data, were qualified as subjective behavior change. For each assessment, 2 of the 3 reviewers needed to agree for an intervention to be recorded as a success.
Resident views on the monthly conferences were solicited via an anonymous and voluntary questionnaire. A first survey was designed to assess whether residents felt that the conferences provided them with the ability to recognize and improve systems errors which compromise patient care. This survey was administered at the conclusion of the first year of the program to residents who attended the final 2 QICs. A second survey assessed whether the tone of the conferences was constructive and blame‐free. This survey was administered at the conclusion of the second year of the program to residents who attended the year's final 2 QICs.
RESULTS
Over the first 22 months of the program, 20 conferences were held (Table 1). The topics covered ranged considerably and included: deficits in supervision, medication errors, patient satisfaction, staff safety, and 30‐day readmissions. Forty‐six distinct interventions were suggested during these conferences. Of those, an attempt was made to initiate 25 (54%) of these suggestions (Table 2). Of the 25 interventions that were initiated, 18 (72%) were determined to be successful. Eight resulted in objective permanent system‐wide change and 10 resulted in subjective behavior change among residents.
| QIC Topic | Interventions Suggested by Residents | Suggestion Results (Attempted/Not Attempted, Successful/Unsuccessful) |
|---|---|---|
| ||
| Central venous catheter guide wire lost during code placement | Improved supervision and training for line placement | Attempted, but unsuccessful |
| Avoid unnecessary line placement during codes | Attempted, but unsuccessful | |
| Inappropriate administration of warfarin | Decision support providing real‐time coagulation profile | Attempted and successful |
| Central line bloodstream infection | Clarified and encouraged use of line service | Attempted and successful |
| Daily documentation of catheter placement date | Not attempted | |
| Delayed administration of pain medication | Training nurses to use text paging communication system | Attempted and successful |
| Patient discharged on wrong medication dose | Do not use abbreviations | Not attempted |
| Electronic medication reconciliation | Attempted and successful | |
| Confusion over code status | Clarification of various forms used for DNR | Not attempted |
| Better communication of code status during signout | Not attempted | |
| Patient received hydromorphone IV instead of PO during verbal order at end‐of‐life | Verbal orders should have talk back verification | Attempted, but unsuccessful |
| Encourage informing patients of medical errors | Attempted, but unsuccessful | |
| Premature closure of diagnosis during transfer from MICU | Improve comfort level disagreeing with supervisors | Attempted, but unsuccessful |
| Reassessment of patient prior to late‐day MICU transfers | Not attempted | |
| Patient erroneously received clopidogrel bisulfate (Plavix) for years due to poor medication reconciliation | Improved discharge summary interface | Attempted and successful |
| Encourage physicians to call PCP on discharge | Attempted and successful | |
| Modified barium swallow ordered incorrectly, resulting in patient aspiration | Simplify electronic order entry system to clearly identify tests | Not attempted |
| Change radiology requisition form to facilitate communication | Not attempted | |
| Fingersticks leading to blood exposure | Train PGY1s on the needles used at all 3 hospitals | Not attempted |
| Improve mask with face shields and gown availability | Attempted and successful | |
| Patient discharged with central venous catheter still in place | Check list for lines and Foleys | Not attempted |
| Improved discharge documentation | Not attempted | |
| 30‐Day readmission | Mandatory discharge summary completion prior to discharge | Attempted and successful |
| Discharge summary training during intern year | Attempted and successful | |
| DKA developed in house when insulin not administered | Improve communication between floor and dialysis RNs | Not attempted |
| Better PA supervision by residents regarding order writing | Attempted and successful | |
| Compromised patient satisfaction | Patient handouts with name and role of each care team member | Attempted, but unsuccessful |
| Patient satisfaction coaching | Attempted and successful | |
| Elevated PTT and poor documentation | Improved feedback to residents regarding daily notes | Not attempted |
| Nurses must call physicians with alert values | Not attempted | |
| Hospital‐acquired MRSA | Improve availability of contact precaution gowns | Attempted, but unsuccessful |
| Direct observation of hand washing on morning rounds | Attempted and successful | |
| Staff safety with deranged family member | Education of staff regarding safety protocols | Attempted, but unsuccessful |
| Transfer of unstable patient from outside hospital ICU to general medicine floor | Standardization of OSH transfer guidelines | Not attempted |
| Improved documentation of transferring MD contract data | Attempted and successful | |
| Consult called, patient not seen by attending | Education of faculty on existing institutional consult policy | Attempted, but unsuccessful |
| Clarification of violations reporting process for hospital consults | Attempted, but unsuccessful | |
| Type of Intervention | No. of Interventions Suggested | No. of Interventions Implemented (%) | Of Implemented Interventions, No. Which Were Successful (%) | No. of Attempted Interventions With Objective Change (%) | No. of Attempted Interventions With Subjective Change (%) |
|---|---|---|---|---|---|
| Design changes: information technology‐based | 5 | 2 (40) | 2 (100%) | 2 (100) | 0 (0) |
| Design changes: protocol‐based | 17 | 10 (59) | 8 (80%) | 5 (50) | 3 (30) |
| Educational | 20 | 11 (55) | 7 (64) | 1 (9) | 6 (55) |
| Reminder systems | 4 | 2 (50) | 1 (50) | 0 (0) | 1 (50) |
| Total | 46 | 25 (54) | 18 (72) | 8 (32) | 10 (40) |
Two IT‐based system design changes were implemented; both resulted in objective system‐wide change. Eight protocol‐based design changes were implemented successfully, 5 objectively, and 3 subjectively. Seven educational interventions and 1 reminder system intervention were initiated.
The most successful intervention to come from these conferences was the implementation of an electronic medication reconciliation program. The reconciliation program was suggested following a conference on a patient who was discharged home on the wrong dose of a medication. The institution's paper‐based medication reconciliation process, particularly for heart‐failure patients, had long been known to be deficient. The QIC brought this issue to life by highlighting a cases that may have been ameliorated with a more robust medication reconciliation process. Enthusiastic residents were invited to build a case for medication reconciliation to the Chief Medical Officer, and this helped garner resources for the hospital‐wide project. Another successful IT‐based intervention was initiated after a case of inappropriate administration of warfarin to a patient with an already elevated international normalized ratio (INR). The computerized order entry system was changed so that, at the point of ordering warfarin, the most recent coagulation profile and platelet values appear before an order can be finalized.
An example of a protocol‐based intervention came from a conference that focused on poor communication at the time of discharge, which resulted in a 30‐day readmission. As a result, resident work flow was changed so that discharge summaries are expected to be completed at the time of discharge. Along with this protocol change was an educational initiative to improve the quality of discharge summaries by including essential data for the transition of care.
Overall, residents reviewed the conferences very positively (Table 3). The response rate for the first year survey was 40% (56/140) and the second year survey was 18% (26/143). The vast majority of participants felt that the conferences were of high quality (96%) and that the exercise could lead to improvement in quality (98%). Residents felt that the conference focused more on system issues than individual shortcomings (92%). A majority felt comfortable expressing their opinions during the conferences (77%).
| Overall Conference Quality | ||
|---|---|---|
| Question | Mean Score (n = 53) | Rating Question a 4 or 5 |
| Conference Tone | ||
| Question | Mean Score (n = 26) | Rating Question With a 4 or 5 |
| ||
| Please rate the overall quality of the QIC conferences. | 4.49* | 98% |
| The case highlighted an issue that is highly relevant to the quality of patient care. | 4.81 | 100% |
| Solutions discussed at this conference could lead to improved patient care and/or patient satisfaction. | 4.65 | 96% |
| My knowledge of issues related to hospital quality and patient safety has been enhanced by this conference. | 4.61 | 96% |
| The QIC focused on individuals, individual actions, or omissions, which compromised high quality care. | 3.35 | 50% |
| The QIC focused on system failures that compromised high quality care. | 4.35 | 92% |
| I felt comfortable sharing my honest opinions about the medical events presented during the conferences. | 4.15 | 77% |
| I avoided expressing my opinions about the medical events presented during the conferences because I did not want to criticize my peers. | 2.5 | 19% |
DISCUSSION
The first 20 sessions from this resident‐led, hospitalist‐facilitated QI program provided evidence that residents can contribute to patient safety within a large tertiary care center. The role of residents in actively addressing errors and unsatisfactory outcomes in the hospital has not been a traditional QI focus.12 Involvement has typically been a passive process for physician trainees, while more senior clinical staff members decide on and prioritize QI activities. We have observed that empowering residents to take a more active role in performance improvement yields significant change and does more than simply educate about basic QI methodology.
One reason for the success of these conferences was leveraging insights of residents as key front line providers. Residents spend more time than perhaps any other category of hospital employee working within clinical care systems. They are deeply aware of the quality struggles inherent to large healthcare organizations, and this insight can lead to high impact suggestions for improvement. Often, suggestions were simple proposals that were overlooked or unappreciated by other administrative leaders. An example of this type of contribution was when residents brought the lack of infection control equipment, on certain units, to the attention of the infection control staff and facility engineers. At a separate conference, residents informed the transfer office staff that valuable contact information for physicians accepting outside hospital transfers was not being collected. Both of these observations led to quick change, with better infection control gown availability and improved documentation by transfer office staff.
Our program also demonstrated that including residents in QI provides momentum for either a training program or an institution to pursue solutions that might have otherwise been resisted. The improvement suggestion to complete discharge summaries prior to the patient leaving the hospital had long been a goal for the residency program leadership, but there was hesitation to force this work flow change on the residents. After a QI conference, when a number of the residents themselves made the suggestion, implementing the change was much easier. Similarly, after several cases of clear errors relating to a suboptimal process of medication reconciliation, the institution dedicated scarce IT personnel to work with providers to develop a robust, user‐friendly medication reconciliation application to decrease transition of care errors.
Through this program, residents also demonstrated their ability to deconstruct patient care problems. For each case, resident session leaders interviewed physician providers, physician extenders, nurses, nurse managers, pharmacists, security staff, engineering staff, and administrative staff. They gathered crucial information regarding the patient care event and the gaps or errors that led to a poor outcome. After many of the conferences, the resident presenters commented on how the investigative exercise left them more appreciative of the complexity of the medical system and interested in fixing the problems uncovered.
The feedback from the resident surveys demonstrated that residents valued the QI program. The data collected also shows that such programs can be executed in a manner which highlights system flaws. Our data do, however, suggest that there is room to improve the tone of the conference to further decrease the sense from residents that quality discussions focus on individuals. Residents often struggle to master the myriad new expectations inherent in the transition from student to physician.13 A quality process which discourages already overworked and uncertain trainees, by creating a process which assigns blame for unintentional quality shortcomings, would be counterproductive.
Lessons Learned
While this QI program has had success uncovering clinical care issues, and creating a climate and process for resident participation in improvement, there has been a number of limitations and lessons learned. Most importantly, including busy residents in any process that requires regular participation and follow‐through is difficult. A number of suggested improvements which created substantial interest and early momentum were ultimately left unfinished, as residents and even faculty facilitators became overwhelmed by clinical responsibilities. In fact, the majority of suggestions have not been successfully implemented and even fewer have created lasting change. This must be carefully monitored, as experiencing multiple failures can undermine the empowerment that such QI programs are created to foster.
Regular reflection on the successful and unsuccessful projects yielded several important insights that resulted in changes over the course of the program. Suggestions were more likely to move from idea generation to execution if the QIC was attended by administrators with decision‐making authority. Several of the suggestionsimproved medication reconciliation, better transfer documentation, and improved availability of infection control productswere able to be acted upon because conference attendees were administrators with purview over these issues. Many times, these leaders were more than willing to implement helpful suggestions, but simply needed them to be brought to their attention. As a result, we have been more attentive to inviting as many stakeholders as possible to the QICs.
It was also clear that suggestions would not be realized without a physician leader and were more successful when resident interest was substantial. After each QIC, residents who had made promising suggestions were approached to continue to participate. If the residents agreed, the projects were pursued and a faculty or chief resident leader was assigned. Lastly, we have also made use of one of the department's QI data analysts to assist with project completion. This individual has been made available to provide administrative support (organizing meetings, paperwork, etc) but also to provide data for projects, should the need arise.
Another important finding is that the tone of the QI program must be constantly monitored. Despite reminding residents at each session that the exercise was for the purpose of identifying systems barriers to delivering high quality care, there were times when residents felt targeted or blamed. At one point, a number of residents voiced their concerns that the conferences had spent too much time highlighting quality failures without recognizing the many positive performances on the teaching service. As a result, subsequent conferences often began by highlighting quality improvements made. Additionally, a part of 1 session each year had been dedicated to reading letters and e‐mails sent by patients or families which highlight memorably positive performances by the residents. Finally, care was taken to make sure invited guests to the sessions were reminded of the session's blame‐free ground rules.
Care must be taken when investigating clinical cases. On several occasions, attending physicians expressed discomfort with having residents scrutinize a clinical event. Although this process was protected under the QI umbrella and faculty names were never shared at the conferences, some faculty believed that this process was the purview of departmental or hospital QI staff, not untrained residents. Given the support provided for this program by the department chair and program director, as well as the professional nature with which the residents conducted their inquiries, there was little difficulty rejecting this line of objection. This feedback did lead supervisors to be more involved with the resident presenters, coaching them regarding data gathering and interviewing. If a case appears that it will be particularly sensitive, the hospitalist mentor or chief resident will reach out to involved residents and faculty to notify them that the case will be reviewed.
A final development secured, in part, as a result of this quality program has been more protected faculty time. At the start of this program, all faculty time was donated time on top of other administrative and patient care responsibilities. After the first 18 months of the QIC program, the residency program named an assistant program director for quality. At the time of writing this manuscript, the program further invested in quality by naming both an assistant and associate program director for quality. These positions combined amount to at least 0.4 full‐time equivalents (FTE). Of that, roughly 0.1 FTE is spent working on the QICs and subsequent project implementation.
Limitations
The evaluation of the success of the interventions potentially biased our findings. The qualitative method of using multiple reviewers, all of whom were invested in the program's outcomes, to gauge the success of initiated interventions may have resulted in an overestimate of the project's effectiveness. Furthermore, the category of subjective change lacks measurable criteria, making replication of the findings difficult.
The results presented here are from a single institution, conceived of and executed by a group of dedicated faculty. Moreover, both the chair of the department and the program director were very supportive of this endeavor. Possibly, because of these aspects, the findings presented here would not be readily replicated at another institution.
The percentage of residents who completed the feedback surveys was low. This may result in an overestimate of quality, value, and tone of the conferences, as well as potentially missing an opportunity for improving the program. We will address this issue through more rigorous quantitative and qualitative feedback at the end of the third year of the program.
CONCLUSIONS
Residents are willing and effective participants in a QI program. As front line providers, their experiences are valuable and their willingness to share insights can be an impetus for change. Finally, a process which includes modest investigation by third year residents, has faculty support and oversight, and provides minimal administrative support can overcome the difficulty of involving overworked residents in quality efforts.
Acknowledgements
The authors acknowledge Michael Pourdehnad for his role in developing the quality program.
- ,,.To Err Is Human: Building a Safer Health System.Washington, DC:National Academy Press;1999.
- ,,,,.Redesigning residency education in internal medicine: a position paper from the Association of Program Directors in Internal Medicine.Ann Intern Med.2006;144:920–926.
- Accreditation Council for Graduate Medical Education. Program directors guide to the common program requirements. Available at: http://www.acgme.org/acWebsite/navPages/commonpr_documents/ CompleteGuide_v2%20.pdf. Accessed May 5,2010.
- ,,,.Medical errors involving trainees: a study of closed malpractice claims from 5 insurers.Arch Intern Med.2007;167:2030–2036.
- ,,,,,.Residents report on adverse events and their causes.Arch Intern Med.2005;165:2607–2613.
- ,.A system of analyzing medical errors to improve GMA curricula and programs.Acad Med.2001;76:125–133.
- ,,, et al.Changing conversations: teaching safety and quality in residency training.Acad Med.2008;83(11):1080–1087.
- ,,.Practice‐based learning and improvement: a curriculum in continuous quality improvement for surgery residents.Arch Surg.2007;142:479–483.
- .Involving residents in quality improvement: contrasting “top‐down” and “bottom‐up” approaches. Accreditation Council for Graduate Medical Education and Institute for Healthcare Improvement‐day project.ACGME Bulletin. August2008.
- ,,,,.Creating a quality improvement elective for medical house officers.Gen Intern Med.2004;19(8):861–867.
- National Center for Patient Safety. United States Department for Veteran Affairs. Root cause analysis tools. Available at: http://www.patientsafety.gov/CogAids/RCA/. Accessed August 17,2010.
- ,,, et al.Residents' engagement in quality improvement: a systematic review of the literature.Acad Med.2009;84:1757–1764.
- ,,.Graduates from a traditional medical curriculum evaluate the effectiveness of their medical curriculum through interviews.BMC Med Educ.2009;9:64.