User login
Patient Preferences for Physician Attire: A Multicenter Study in Japan
The patient-physician relationship is critical for ensuring the delivery of high-quality healthcare. Successful patient-physician relationships arise from shared trust, knowledge, mutual respect, and effective verbal and nonverbal communication. The ways in which patients experience healthcare and their satisfaction with physicians affect a myriad of important health outcomes, such as adherence to treatment and outcomes for conditions such as hypertension and diabetes mellitus.1-5 One method for potentially enhancing patient satisfaction is through understanding how patients wish their physicians to dress6-8 and tailoring attire to match these expectations. In addition to our systematic review,9 a recent large-scale, multicenter study in the United States revealed that most patients perceive physician attire as important, but that preferences for specific types of attire are contextual.9,10 For example, elderly patients preferred physicians in formal attire and white coat, while scrubs with white coat or scrubs alone were preferred for emergency department (ED) physicians and surgeons, respectively. Moreover, regional variation regarding attire preference was also observed in the US, with preferences for more formal attire in the South and less formal in the Midwest.
Geographic variation, regarding patient preferences for physician dress, is perhaps even more relevant internationally. In particular, Japan is considered to have a highly contextualized culture that relies on nonverbal and implicit communication. However, medical professionals have no specific dress code and, thus, don many different kinds of attire. In part, this may be because it is not clear whether or how physician attire impacts patient satisfaction and perceived healthcare quality in Japan.11-13 Although previous studies in Japan have suggested that physician attire has a considerable influence on patient satisfaction, these studies either involved a single department in one hospital or a small number of respondents.14-17 Therefore, we performed a multicenter, cross-sectional study to understand patients’ preferences for physician attire in different clinical settings and in different geographic regions in Japan.
METHODS
Study Population
We conducted a cross-sectional, questionnaire-based study from 2015 to 2017, in four geographically diverse hospitals in Japan. Two of these hospitals, Tokyo Joto Hospital and Juntendo University Hospital, are located in eastern Japan whereas the others, Kurashiki Central Hospital and Akashi Medical Center, are in western Japan.
Questionnaires were printed and randomly distributed by research staff to outpatients in waiting rooms and inpatients in medical wards who were 20 years of age or older. We placed no restriction on ward site or time of questionnaire distribution. Research staff, including physicians, nurses, and medical clerks, were instructed to avoid guiding or influencing participants’ responses. Informed consent was obtained by the staff; only those who provided informed consent participated in the study. Respondents could request assistance with form completion from persons accompanying them if they had difficulties, such as physical, visual, or hearing impairments. All responses were collected anonymously. The study was approved by the ethics committees of all four hospitals.
Questionnaire
We used a modified version of the survey instrument from a prior study.10 The first section of the survey showed photographs of either a male or female physician with 7 unique forms of attire, including casual, casual with white coat, scrubs, scrubs with white coat, formal, formal with white coat, and business suit (Figure 1). Given the Japanese context of this study, the language was translated to Japanese and photographs of physicians of Japanese descent were used. Photographs were taken with attention paid to achieving constant facial expressions on the physicians as well as in other visual cues (eg, lighting, background, pose). The physician’s gender and attire in the first photograph seen by each respondent were randomized to prevent bias in ordering, priming, and anchoring; all other sections of the survey were identical.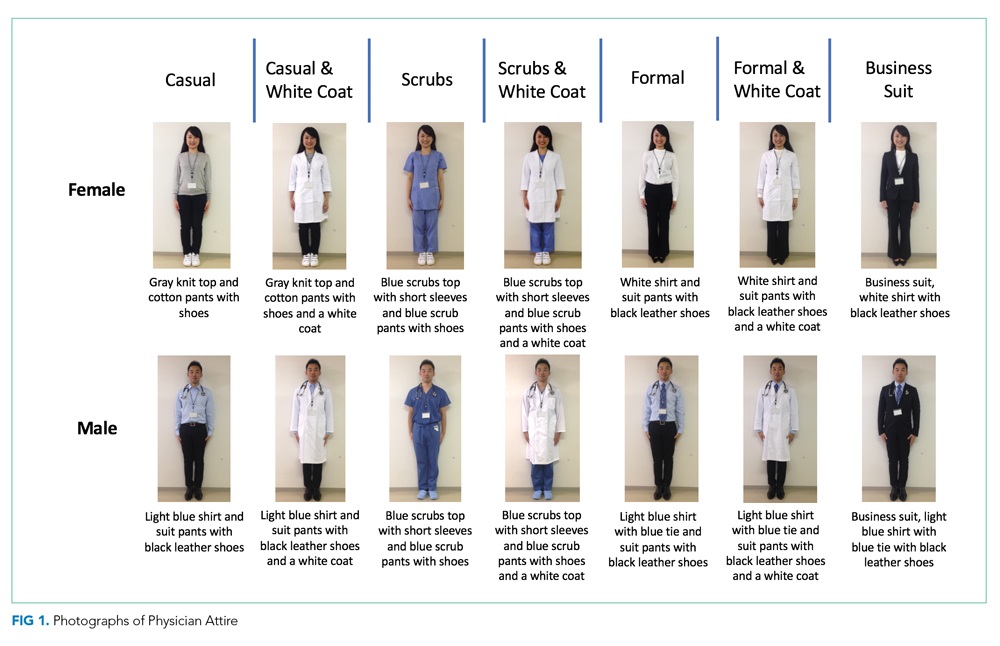
Respondents were first asked to rate the standalone, randomized physician photograph using a 1-10 scale across five domains (ie, how knowledgeable, trustworthy, caring, and approachable the physician appeared and how comfortable the physician’s appearance made the respondent feel), with a score of 10 representing the highest rating. Respondents were subsequently given 7 photographs of the same physician wearing various forms of attire. Questions were asked regarding preference of attire in varied clinical settings (ie, primary care, ED, hospital, surgery, overall preference). To identify the influence of and respondent preferences for physician dress and white coats, a Likert scale ranging from 1 (strongly disagree) to 5 (strongly agree) was employed. The scale was trichotomized into “disagree” (1, 2), “neither agree nor disagree” (3), and “agree” (4, 5) for analysis. Demographic data, including age, gender, education level, nationality (Japanese or non-Japanese), and number of physicians seen in the past year were collected.
Outcomes and Sample Size Calculation
The primary outcome of attire preference was calculated as the mean composite score of the five individual rating domains (ie, knowledgeable, trustworthy, caring, approachable, and comfortable), with the highest score representing the most preferred form of attire. We also assessed variation in preferences for physician attire by respondent characteristics, such as age and gender.
Sample size estimation was based on previous survey methodology.10 The Likert scale range for identifying influence of and respondent preferences for physician dress and white coats was 1-5 (“strongly disagree” to “strongly agree”). The scale range for measuring preferences for the randomized attire photograph was 1-10. An assumption of normality was made regarding responses on the 1-10 scale. An estimated standard deviation of 2.2 was assumed, based on prior findings.10 Based on these assumptions and the inclusion of at least 816 respondents (assuming a two-sided alpha error of 0.05), we expected to have 90% capacity to detect differences for effect sizes of 0.50 on the 1-10 scale.
Statistical Analyses
Paper-based survey data were entered independently and in duplicate by the study team. Respondents were not required to answer all questions; therefore, the denominator for each question varied. Data were reported as mean and standard deviation (SD) or percentages, where appropriate. Differences in the mean composite rating scores were assessed using one-way ANOVA with the Tukey method for pairwise comparisons. Differences in proportions for categorical data were compared using the Z-test. Chi-squared tests were used for bivariate comparisons between respondent age, gender, and level of education and corresponding respondent preferences. All analyses were performed using Stata 14 MP/SE (Stata Corp., College Station, Texas, USA).
RESULTS
Characteristics of Participants
Between December 1, 2015 and October 30, 2017, a total of 2,020 surveys were completed by patients across four academic hospitals in Japan. Of those, 1,960 patients (97.0%) completed the survey in its entirety. Approximately half of the respondents were 65 years of age or older (49%), of female gender (52%), and reported receiving care in the outpatient setting (53%). Regarding use of healthcare, 91% had seen more than one physician in the year preceding the time of survey completion (Table 1).
Ratings of Physician Attire
Compared with all forms of attire depicted in the survey’s first standalone photograph, respondents rated “casual attire with white coat” the highest (Figure 2). The mean composite score for “casual attire with white coat” was 7.1 (standard deviation [SD] = 1.8), and this attire was set as the referent group. Cronbach’s alpha, for the five items included in the composite score, was 0.95. However, “formal attire with white coat” was rated almost as highly as “casual attire with white coat” with an overall mean composite score of 7.0 (SD = 1.6).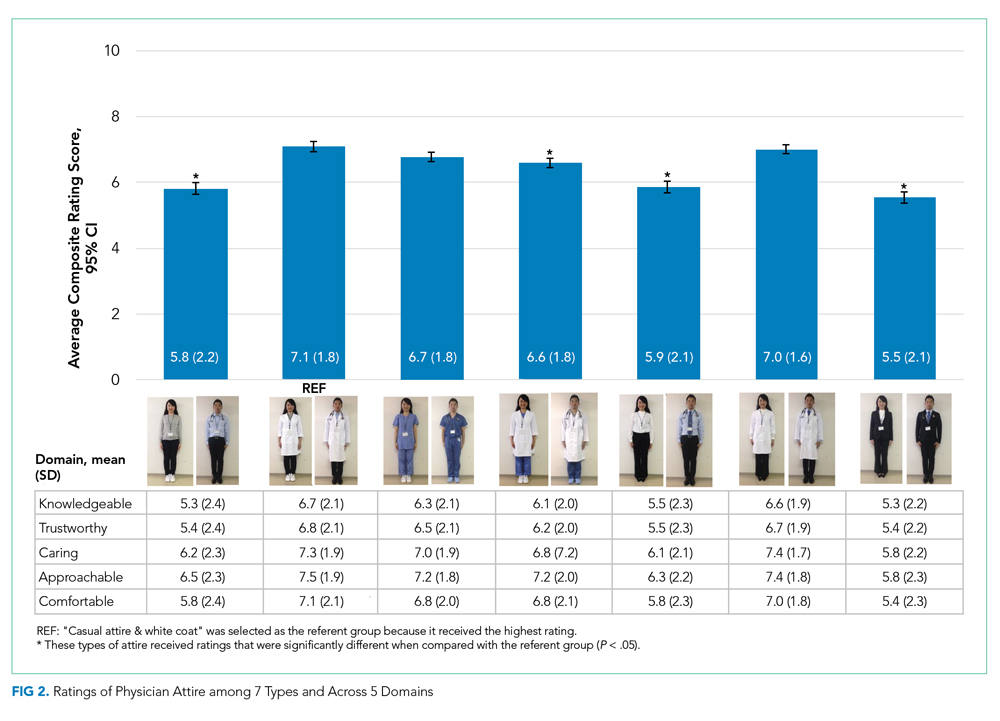
Variation in Preference for Physician Attire by Clinical Setting
Preferences for physician attire varied by clinical care setting. Most respondents preferred “casual attire with white coat” or “formal attire with white coat” in both primary care and hospital settings, with a slight preference for “casual attire with white coat.” In contrast, respondents preferred “scrubs without white coat” in the ED and surgical settings. When asked about their overall preference, respondents reported they felt their physician should wear “formal attire with white coat” (35%) or “casual attire with white coat” (30%; Table 2). When comparing the group of photographs of physicians with white coats to the group without white coats (Figure 1), respondents preferred physicians wearing white coats overall and specifically when providing care in primary care and hospital settings. However, they preferred physicians without white coats when providing care in the ED (P < .001). With respect to surgeons, there was no statistically significant difference between preference for white coats and no white coats. These results were similar for photographs of both male and female physicians.
When asked whether physician dress was important to them and if physician attire influenced their satisfaction with the care received, 61% of participants agreed that physician dress was important, and 47% agreed that physician attire influenced satisfaction (Appendix Table 1). With respect to appropriateness of physicians dressing casually over the weekend in clinical settings, 52% responded that casual wear was inappropriate, while 31% had a neutral opinion.
Participants were asked whether physicians should wear a white coat in different clinical settings. Nearly two-thirds indicated a preference for white coats in the office and hospital (65% and 64%, respectively). Responses regarding whether emergency physicians should wear white coats were nearly equally divided (Agree, 37%; Disagree, 32%; Neither Agree nor Disagree, 31%). However, “scrubs without white coat” was most preferred (56%) when patients were given photographs of various attire and asked, “Which physician would you prefer to see when visiting the ER?” Responses to the question “Physicians should always wear a white coat when seeing patients in any setting” varied equally (Agree, 32%; Disagree, 34%; Neither Agree nor Disagree, 34%).
Variation in Preference for Physician Attire by Respondent Demographics
When comparing respondents by age, those 65 years or older preferred “formal attire with white coat” more so than respondents younger than 65 years (Appendix Table 2). This finding was identified in both primary care (36% vs 31%, P < .001) and hospital settings (37% vs 30%, P < .001). Additionally, physician attire had a greater impact on older respondents’ satisfaction and experience (Appendix Table 3). For example, 67% of respondents 65 years and older agreed that physician attire was important, and 54% agreed that attire influenced satisfaction. Conversely, for respondents younger than 65 years, the proportion agreeing with these statements was lower (56% and 41%, both P < .001). When comparing older and younger respondents, those 65 years and older more often preferred physicians wearing white coats in any setting (39% vs 26%, P < .001) and specifically in their office (68% vs 61%, P = .002), the ED (40% vs 34%, P < .001), and the hospital (69% vs 60%, P < .001).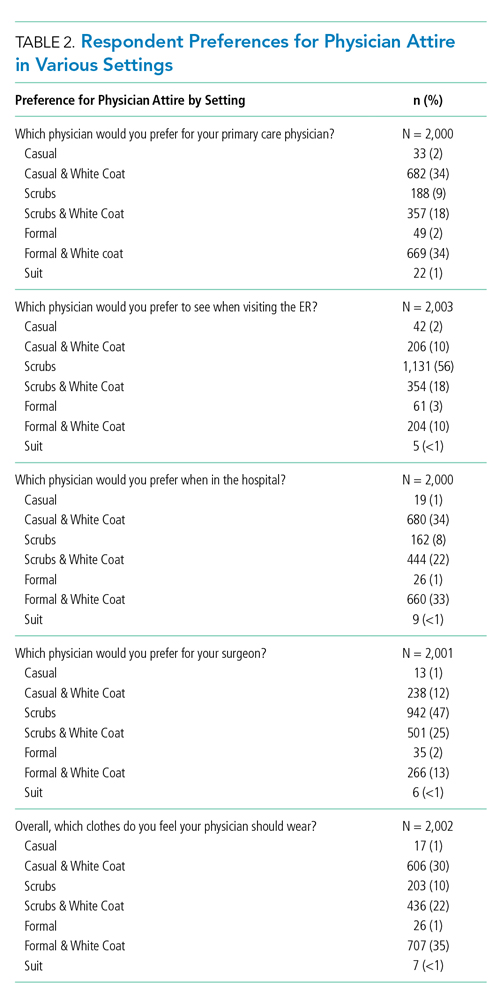
When comparing male and female respondents, male respondents more often stated that physician dress was important to them (men, 64%; women, 58%; P = .002). When comparing responses to the question “Overall, which clothes do you feel a doctor should wear?”, between the eastern and western Japanese hospitals, preferences for physician attire varied.
Variation in Expectations Between Male and Female Physicians
When comparing the ratings of male and female physicians, female physicians were rated higher in how caring (P = .005) and approachable (P < .001) they appeared. However, there were no significant differences in the ratings of the three remaining domains (ie, knowledgeable, trustworthy, and comfortable) or the composite score.
DISCUSSION
Since we employed the same methodology as previous studies conducted in the US10 and Switzerland,18 a notable strength of our approach is that comparisons among these countries can be drawn. For example, physician attire appears to hold greater importance in Japan than in the US and Switzerland. Among Japanese participants, 61% agreed that physician dress is important (US, 53%; Switzerland, 36%), and 47% agreed that physician dress influenced how satisfied they were with their care (US, 36%; Switzerland, 23%).10 This result supports the notion that nonverbal and implicit communications (such as physician dress) may carry more importance among Japanese people.11-13
Regarding preference ratings for type of dress among respondents in Japan, “casual attire with white coat” received the highest mean composite score rating, with “formal attire with white coat” rated second overall. In contrast, US respondents rated “formal attire with white coat” highest and “scrubs with white coat” second.10 Our result runs counter to our expectation in that we expected Japanese respondents to prefer formal attire, since Japan is one of the most formal cultures in the world. One potential explanation for this difference is that the casual style chosen for this study was close to the smart casual style (slightly casual). Most hospitals and clinics in Japan do not allow physicians to wear jeans or polo shirts, which were chosen as the casual attire in the previous US study.
When examining various care settings and physician types, both Japanese and US respondents were more likely to prefer physicians wearing a white coat in the office or hospital.10 However, Japanese participants preferred both “casual attire with white coat” and “formal attire with white coat” equally in primary care or hospital settings. A smaller proportion of US respondents preferred “casual attire with white coat” in primary care (11%) and hospital settings (9%), but more preferred “formal attire with white coat” for primary care (44%) and hospital physicians (39%). In the ED setting, 32% of participants in Japan and 18% in the US disagreed with the idea that physicians should wear a white coat. Among Japanese participants, “scrubs without white coat” was rated highest for emergency physicians (56%) and surgeons (47%), while US preferences were 40% and 42%, respectively.10 One potential explanation is that scrubs-based attire became popular among Japanese ED and surgical contexts as a result of cultural influence and spread from western countries.19, 20
With respect to perceptions regarding physician attire on weekends, 52% of participants considered it inappropriate for a physician to dress casually over the weekend, compared with only 30% in Switzerland and 21% in the US.11,12 Given Japan’s level of formality and the fact that most Japanese physicians continue to work over the weekend,21-23 Japanese patients tend to expect their physicians to dress in more formal attire during these times.
Previous studies in Japan have demonstrated that older patients gave low ratings to scrubs and high ratings to white coat with any attire,15,17 and this was also the case in our study. Perhaps elderly patients reflect conservative values in their preferences of physician dress. Their perceptions may be less influenced by scenes portraying physicians in popular media when compared with the perceptions of younger patients. Though a 2015 systematic review and studies in other countries revealed white coats were preferred regardless of exact dress,9,24-26 they also showed variation in preferences for physician attire. For example, patients in Saudi Arabia preferred white coat and traditional ethnic dress,25 whereas mothers of pediatric patients in Saudi Arabia preferred scrubs for their pediatricians.27 Therefore, it is recommended for internationally mobile physicians to choose their dress depending on a variety of factors including country, context, and patient age group.
Our study has limitations. First, because some physicians presented the surveys to the patients, participants may have responded differently. Second, participants may have identified photographs of the male physician model as their personal healthcare provider (one author, K.K.). To avoid this possible bias, we randomly distributed 14 different versions of physician photographs in the questionnaire. Third, although physician photographs were strictly controlled, the “formal attire and white coat” and “casual attire and white coat” photographs appeared similar, especially given that the white coats were buttoned. Also, the female physician depicted in the photographs did not have the scrub shirt tucked in, while the male physician did. These nuances may have affected participant ratings between groups. Fourth,
In conclusion, patient preferences for physician attire were examined using a multicenter survey with a large sample size and robust survey methodology, thus overcoming weaknesses of previous studies into Japanese attire. Japanese patients perceive that physician attire is important and influences satisfaction with their care, more so than patients in other countries, like the US and Switzerland. Geography, settings of care, and patient age play a role in preferences. As a result, hospitals and health systems may use these findings to inform dress code policy based on patient population and context, recognizing that the appearance of their providers affects the patient-physician relationship. Future research should focus on better understanding the various cultural and societal customs that lead to patient expectations of physician attire.
Acknowledgments
The authors thank Drs. Fumi Takemoto, Masayuki Ueno, Kazuya Sakai, Saori Kinami, and Toshio Naito for their assistance with data collection at their respective sites. Additionally, the authors thank Dr. Yoko Kanamitsu for serving as a model for photographs.
1. Manary MP, Boulding W, Staelin R, Glickman SW. The patient experience and health outcomes. N Engl J Med. 2013;368(3):201-203. https://doi.org/ 10.1056/NEJMp1211775.
2. Boulding W, Glickman SW, Manary MP, Schulman KA, Staelin R. Relationship between patient satisfaction with inpatient care and hospital readmission within 30 days. Am J Manag Care. 2011;17(1):41-48.
3. Barbosa CD, Balp MM, Kulich K, Germain N, Rofail D. A literature review to explore the link between treatment satisfaction and adherence, compliance, and persistence. Patient Prefer Adherence. 2012;6:39-48. https://doi.org/10.2147/PPA.S24752.
4. Jha AK, Orav EJ, Zheng J, Epstein AM. Patients’ perception of hospital care in the United States. N Engl J Med. 2008;359(18):1921-31. https://doi.org/10.1056/NEJMsa080411.
5. O’Malley AS, Forrest CB, Mandelblatt J. Adherence of low-income women to cancer screening recommendations. J Gen Intern Med. 2002;17(2):144-54. https://doi.org/10.1046/j.1525-1497.2002.10431.x.
6. Chung H, Lee H, Chang DS, Kim HS, Park HJ, Chae Y. Doctor’s attire influences perceived empathy in the patient-doctor relationship. Patient Educ Couns. 2012;89(3):387-391. https://doi.org/10.1016/j.pec.2012.02.017.
7. Bianchi MT. Desiderata or dogma: what the evidence reveals about physician attire. J Gen Intern Med. 2008;23(5):641-643. https://doi.org/10.1007/s11606-008-0546-8.
8. Brandt LJ. On the value of an old dress code in the new millennium. Arch Intern Med. 2003;163(11):1277-1281. https://doi.org/10.1001/archinte.163.11.1277.
9. Petrilli CM, Mack M, Petrilli JJ, Hickner A, Saint S, Chopra V. Understanding the role of physician attire on patient perceptions: a systematic review of the literature--targeting attire to improve likelihood of rapport (TAILOR) investigators. BMJ Open. 2015;5(1):e006578. https://doi.org/10.1136/bmjopen-2014-006578.
10. Petrilli CM, Saint S, Jennings JJ, et al. Understanding patient preference for physician attire: a cross-sectional observational study of 10 academic medical centres in the USA. BMJ Open. 2018;8(5):e021239. https://doi.org/10.1136/bmjopen-2017-021239.
11. Rowbury R. The need for more proactive communications. Low trust and changing values mean Japan can no longer fall back on its homogeneity. The Japan Times. 2017, Oct 15;Sect. Opinion. https://www.japantimes.co.jp/opinion/2017/10/15/commentary/japan-commentary/need-proactive-communications/#.Xej7lC3MzUI. Accessed December 5, 2019.
12. Shoji Nishimura ANaST. Communication Style and Cultural Features in High/Low Context Communication Cultures: A Case Study of Finland, Japan and India. Nov 22nd, 2009.
13. Smith RMRSW. The influence of high/low-context culture and power distance on choice of communication media: Students’ media choice to communicate with Professors in Japan and America. Int J Intercultural Relations. 2007;31(4):479-501.
14. Yamada Y, Takahashi O, Ohde S, Deshpande GA, Fukui T. Patients’ preferences for doctors’ attire in Japan. Intern Med. 2010;49(15):1521-1526. https://doi.org/10.2169/internalmedicine.49.3572.
15. Ikusaka M, Kamegai M, Sunaga T, et al. Patients’ attitude toward consultations by a physician without a white coat in Japan. Intern Med. 1999;38(7):533-536. https://doi.org/10.2169/internalmedicine.38.533.
16. Lefor AK, Ohnuma T, Nunomiya S, Yokota S, Makino J, Sanui M. Physician attire in the intensive care unit in Japan influences visitors’ perception of care. J Crit Care. 2018;43:288-293.
17. Kurihara H, Maeno T. Importance of physicians’ attire: factors influencing the impression it makes on patients, a cross-sectional study. Asia Pac Fam Med. 2014;13(1):2. https://doi.org/10.1186/1447-056X-13-2.
18. Zollinger M, Houchens N, Chopra V, et al. Understanding patient preference for physician attire in ambulatory clinics: a cross-sectional observational study. BMJ Open. 2019;9(5):e026009. https://doi.org/10.1136/bmjopen-2018-026009.
19. Chung JE. Medical Dramas and Viewer Perception of Health: Testing Cultivation Effects. Hum Commun Res. 2014;40(3):333-349.
20. Michael Pfau LJM, Kirsten Garrow. The influence of television viewing on public perceptions of physicians. J Broadcast Electron Media. 1995;39(4):441-458.
21. Suzuki S. Exhausting physicians employed in hospitals in Japan assessed by a health questionnaire [in Japanese]. Sangyo Eiseigaku Zasshi. 2017;59(4):107-118. https://doi.org/10.1539/sangyoeisei.
22. Ogawa R, Seo E, Maeno T, Ito M, Sanuki M. The relationship between long working hours and depression among first-year residents in Japan. BMC Med Educ. 2018;18(1):50. https://doi.org/10.1186/s12909-018-1171-9.
23. Saijo Y, Chiba S, Yoshioka E, et al. Effects of work burden, job strain and support on depressive symptoms and burnout among Japanese physicians. Int J Occup Med Environ Health. 2014;27(6):980-992. https://doi.org/10.2478/s13382-014-0324-2.
24. Tiang KW, Razack AH, Ng KL. The ‘auxiliary’ white coat effect in hospitals: perceptions of patients and doctors. Singapore Med J. 2017;58(10):574-575. https://doi.org/10.11622/smedj.2017023.
25. Al Amry KM, Al Farrah M, Ur Rahman S, Abdulmajeed I. Patient perceptions and preferences of physicians’ attire in Saudi primary healthcare setting. J Community Hosp Intern Med Perspect. 2018;8(6):326-330. https://doi.org/10.1080/20009666.2018.1551026.
26. Healy WL. Letter to the editor: editor’s spotlight/take 5: physicians’ attire influences patients’ perceptions in the urban outpatient orthopaedic surgery setting. Clin Orthop Relat Res. 2016;474(11):2545-2546. https://doi.org/10.1007/s11999-016-5049-z.
27. Aldrees T, Alsuhaibani R, Alqaryan S, et al. Physicians’ attire. Parents preferences in a tertiary hospital. Saudi Med J. 2017;38(4):435-439. https://doi.org/10.15537/smj.2017.4.15853.
The patient-physician relationship is critical for ensuring the delivery of high-quality healthcare. Successful patient-physician relationships arise from shared trust, knowledge, mutual respect, and effective verbal and nonverbal communication. The ways in which patients experience healthcare and their satisfaction with physicians affect a myriad of important health outcomes, such as adherence to treatment and outcomes for conditions such as hypertension and diabetes mellitus.1-5 One method for potentially enhancing patient satisfaction is through understanding how patients wish their physicians to dress6-8 and tailoring attire to match these expectations. In addition to our systematic review,9 a recent large-scale, multicenter study in the United States revealed that most patients perceive physician attire as important, but that preferences for specific types of attire are contextual.9,10 For example, elderly patients preferred physicians in formal attire and white coat, while scrubs with white coat or scrubs alone were preferred for emergency department (ED) physicians and surgeons, respectively. Moreover, regional variation regarding attire preference was also observed in the US, with preferences for more formal attire in the South and less formal in the Midwest.
Geographic variation, regarding patient preferences for physician dress, is perhaps even more relevant internationally. In particular, Japan is considered to have a highly contextualized culture that relies on nonverbal and implicit communication. However, medical professionals have no specific dress code and, thus, don many different kinds of attire. In part, this may be because it is not clear whether or how physician attire impacts patient satisfaction and perceived healthcare quality in Japan.11-13 Although previous studies in Japan have suggested that physician attire has a considerable influence on patient satisfaction, these studies either involved a single department in one hospital or a small number of respondents.14-17 Therefore, we performed a multicenter, cross-sectional study to understand patients’ preferences for physician attire in different clinical settings and in different geographic regions in Japan.
METHODS
Study Population
We conducted a cross-sectional, questionnaire-based study from 2015 to 2017, in four geographically diverse hospitals in Japan. Two of these hospitals, Tokyo Joto Hospital and Juntendo University Hospital, are located in eastern Japan whereas the others, Kurashiki Central Hospital and Akashi Medical Center, are in western Japan.
Questionnaires were printed and randomly distributed by research staff to outpatients in waiting rooms and inpatients in medical wards who were 20 years of age or older. We placed no restriction on ward site or time of questionnaire distribution. Research staff, including physicians, nurses, and medical clerks, were instructed to avoid guiding or influencing participants’ responses. Informed consent was obtained by the staff; only those who provided informed consent participated in the study. Respondents could request assistance with form completion from persons accompanying them if they had difficulties, such as physical, visual, or hearing impairments. All responses were collected anonymously. The study was approved by the ethics committees of all four hospitals.
Questionnaire
We used a modified version of the survey instrument from a prior study.10 The first section of the survey showed photographs of either a male or female physician with 7 unique forms of attire, including casual, casual with white coat, scrubs, scrubs with white coat, formal, formal with white coat, and business suit (Figure 1). Given the Japanese context of this study, the language was translated to Japanese and photographs of physicians of Japanese descent were used. Photographs were taken with attention paid to achieving constant facial expressions on the physicians as well as in other visual cues (eg, lighting, background, pose). The physician’s gender and attire in the first photograph seen by each respondent were randomized to prevent bias in ordering, priming, and anchoring; all other sections of the survey were identical.
Respondents were first asked to rate the standalone, randomized physician photograph using a 1-10 scale across five domains (ie, how knowledgeable, trustworthy, caring, and approachable the physician appeared and how comfortable the physician’s appearance made the respondent feel), with a score of 10 representing the highest rating. Respondents were subsequently given 7 photographs of the same physician wearing various forms of attire. Questions were asked regarding preference of attire in varied clinical settings (ie, primary care, ED, hospital, surgery, overall preference). To identify the influence of and respondent preferences for physician dress and white coats, a Likert scale ranging from 1 (strongly disagree) to 5 (strongly agree) was employed. The scale was trichotomized into “disagree” (1, 2), “neither agree nor disagree” (3), and “agree” (4, 5) for analysis. Demographic data, including age, gender, education level, nationality (Japanese or non-Japanese), and number of physicians seen in the past year were collected.
Outcomes and Sample Size Calculation
The primary outcome of attire preference was calculated as the mean composite score of the five individual rating domains (ie, knowledgeable, trustworthy, caring, approachable, and comfortable), with the highest score representing the most preferred form of attire. We also assessed variation in preferences for physician attire by respondent characteristics, such as age and gender.
Sample size estimation was based on previous survey methodology.10 The Likert scale range for identifying influence of and respondent preferences for physician dress and white coats was 1-5 (“strongly disagree” to “strongly agree”). The scale range for measuring preferences for the randomized attire photograph was 1-10. An assumption of normality was made regarding responses on the 1-10 scale. An estimated standard deviation of 2.2 was assumed, based on prior findings.10 Based on these assumptions and the inclusion of at least 816 respondents (assuming a two-sided alpha error of 0.05), we expected to have 90% capacity to detect differences for effect sizes of 0.50 on the 1-10 scale.
Statistical Analyses
Paper-based survey data were entered independently and in duplicate by the study team. Respondents were not required to answer all questions; therefore, the denominator for each question varied. Data were reported as mean and standard deviation (SD) or percentages, where appropriate. Differences in the mean composite rating scores were assessed using one-way ANOVA with the Tukey method for pairwise comparisons. Differences in proportions for categorical data were compared using the Z-test. Chi-squared tests were used for bivariate comparisons between respondent age, gender, and level of education and corresponding respondent preferences. All analyses were performed using Stata 14 MP/SE (Stata Corp., College Station, Texas, USA).
RESULTS
Characteristics of Participants
Between December 1, 2015 and October 30, 2017, a total of 2,020 surveys were completed by patients across four academic hospitals in Japan. Of those, 1,960 patients (97.0%) completed the survey in its entirety. Approximately half of the respondents were 65 years of age or older (49%), of female gender (52%), and reported receiving care in the outpatient setting (53%). Regarding use of healthcare, 91% had seen more than one physician in the year preceding the time of survey completion (Table 1).
Ratings of Physician Attire
Compared with all forms of attire depicted in the survey’s first standalone photograph, respondents rated “casual attire with white coat” the highest (Figure 2). The mean composite score for “casual attire with white coat” was 7.1 (standard deviation [SD] = 1.8), and this attire was set as the referent group. Cronbach’s alpha, for the five items included in the composite score, was 0.95. However, “formal attire with white coat” was rated almost as highly as “casual attire with white coat” with an overall mean composite score of 7.0 (SD = 1.6).
Variation in Preference for Physician Attire by Clinical Setting
Preferences for physician attire varied by clinical care setting. Most respondents preferred “casual attire with white coat” or “formal attire with white coat” in both primary care and hospital settings, with a slight preference for “casual attire with white coat.” In contrast, respondents preferred “scrubs without white coat” in the ED and surgical settings. When asked about their overall preference, respondents reported they felt their physician should wear “formal attire with white coat” (35%) or “casual attire with white coat” (30%; Table 2). When comparing the group of photographs of physicians with white coats to the group without white coats (Figure 1), respondents preferred physicians wearing white coats overall and specifically when providing care in primary care and hospital settings. However, they preferred physicians without white coats when providing care in the ED (P < .001). With respect to surgeons, there was no statistically significant difference between preference for white coats and no white coats. These results were similar for photographs of both male and female physicians.
When asked whether physician dress was important to them and if physician attire influenced their satisfaction with the care received, 61% of participants agreed that physician dress was important, and 47% agreed that physician attire influenced satisfaction (Appendix Table 1). With respect to appropriateness of physicians dressing casually over the weekend in clinical settings, 52% responded that casual wear was inappropriate, while 31% had a neutral opinion.
Participants were asked whether physicians should wear a white coat in different clinical settings. Nearly two-thirds indicated a preference for white coats in the office and hospital (65% and 64%, respectively). Responses regarding whether emergency physicians should wear white coats were nearly equally divided (Agree, 37%; Disagree, 32%; Neither Agree nor Disagree, 31%). However, “scrubs without white coat” was most preferred (56%) when patients were given photographs of various attire and asked, “Which physician would you prefer to see when visiting the ER?” Responses to the question “Physicians should always wear a white coat when seeing patients in any setting” varied equally (Agree, 32%; Disagree, 34%; Neither Agree nor Disagree, 34%).
Variation in Preference for Physician Attire by Respondent Demographics
When comparing respondents by age, those 65 years or older preferred “formal attire with white coat” more so than respondents younger than 65 years (Appendix Table 2). This finding was identified in both primary care (36% vs 31%, P < .001) and hospital settings (37% vs 30%, P < .001). Additionally, physician attire had a greater impact on older respondents’ satisfaction and experience (Appendix Table 3). For example, 67% of respondents 65 years and older agreed that physician attire was important, and 54% agreed that attire influenced satisfaction. Conversely, for respondents younger than 65 years, the proportion agreeing with these statements was lower (56% and 41%, both P < .001). When comparing older and younger respondents, those 65 years and older more often preferred physicians wearing white coats in any setting (39% vs 26%, P < .001) and specifically in their office (68% vs 61%, P = .002), the ED (40% vs 34%, P < .001), and the hospital (69% vs 60%, P < .001).
When comparing male and female respondents, male respondents more often stated that physician dress was important to them (men, 64%; women, 58%; P = .002). When comparing responses to the question “Overall, which clothes do you feel a doctor should wear?”, between the eastern and western Japanese hospitals, preferences for physician attire varied.
Variation in Expectations Between Male and Female Physicians
When comparing the ratings of male and female physicians, female physicians were rated higher in how caring (P = .005) and approachable (P < .001) they appeared. However, there were no significant differences in the ratings of the three remaining domains (ie, knowledgeable, trustworthy, and comfortable) or the composite score.
DISCUSSION
Since we employed the same methodology as previous studies conducted in the US10 and Switzerland,18 a notable strength of our approach is that comparisons among these countries can be drawn. For example, physician attire appears to hold greater importance in Japan than in the US and Switzerland. Among Japanese participants, 61% agreed that physician dress is important (US, 53%; Switzerland, 36%), and 47% agreed that physician dress influenced how satisfied they were with their care (US, 36%; Switzerland, 23%).10 This result supports the notion that nonverbal and implicit communications (such as physician dress) may carry more importance among Japanese people.11-13
Regarding preference ratings for type of dress among respondents in Japan, “casual attire with white coat” received the highest mean composite score rating, with “formal attire with white coat” rated second overall. In contrast, US respondents rated “formal attire with white coat” highest and “scrubs with white coat” second.10 Our result runs counter to our expectation in that we expected Japanese respondents to prefer formal attire, since Japan is one of the most formal cultures in the world. One potential explanation for this difference is that the casual style chosen for this study was close to the smart casual style (slightly casual). Most hospitals and clinics in Japan do not allow physicians to wear jeans or polo shirts, which were chosen as the casual attire in the previous US study.
When examining various care settings and physician types, both Japanese and US respondents were more likely to prefer physicians wearing a white coat in the office or hospital.10 However, Japanese participants preferred both “casual attire with white coat” and “formal attire with white coat” equally in primary care or hospital settings. A smaller proportion of US respondents preferred “casual attire with white coat” in primary care (11%) and hospital settings (9%), but more preferred “formal attire with white coat” for primary care (44%) and hospital physicians (39%). In the ED setting, 32% of participants in Japan and 18% in the US disagreed with the idea that physicians should wear a white coat. Among Japanese participants, “scrubs without white coat” was rated highest for emergency physicians (56%) and surgeons (47%), while US preferences were 40% and 42%, respectively.10 One potential explanation is that scrubs-based attire became popular among Japanese ED and surgical contexts as a result of cultural influence and spread from western countries.19, 20
With respect to perceptions regarding physician attire on weekends, 52% of participants considered it inappropriate for a physician to dress casually over the weekend, compared with only 30% in Switzerland and 21% in the US.11,12 Given Japan’s level of formality and the fact that most Japanese physicians continue to work over the weekend,21-23 Japanese patients tend to expect their physicians to dress in more formal attire during these times.
Previous studies in Japan have demonstrated that older patients gave low ratings to scrubs and high ratings to white coat with any attire,15,17 and this was also the case in our study. Perhaps elderly patients reflect conservative values in their preferences of physician dress. Their perceptions may be less influenced by scenes portraying physicians in popular media when compared with the perceptions of younger patients. Though a 2015 systematic review and studies in other countries revealed white coats were preferred regardless of exact dress,9,24-26 they also showed variation in preferences for physician attire. For example, patients in Saudi Arabia preferred white coat and traditional ethnic dress,25 whereas mothers of pediatric patients in Saudi Arabia preferred scrubs for their pediatricians.27 Therefore, it is recommended for internationally mobile physicians to choose their dress depending on a variety of factors including country, context, and patient age group.
Our study has limitations. First, because some physicians presented the surveys to the patients, participants may have responded differently. Second, participants may have identified photographs of the male physician model as their personal healthcare provider (one author, K.K.). To avoid this possible bias, we randomly distributed 14 different versions of physician photographs in the questionnaire. Third, although physician photographs were strictly controlled, the “formal attire and white coat” and “casual attire and white coat” photographs appeared similar, especially given that the white coats were buttoned. Also, the female physician depicted in the photographs did not have the scrub shirt tucked in, while the male physician did. These nuances may have affected participant ratings between groups. Fourth,
In conclusion, patient preferences for physician attire were examined using a multicenter survey with a large sample size and robust survey methodology, thus overcoming weaknesses of previous studies into Japanese attire. Japanese patients perceive that physician attire is important and influences satisfaction with their care, more so than patients in other countries, like the US and Switzerland. Geography, settings of care, and patient age play a role in preferences. As a result, hospitals and health systems may use these findings to inform dress code policy based on patient population and context, recognizing that the appearance of their providers affects the patient-physician relationship. Future research should focus on better understanding the various cultural and societal customs that lead to patient expectations of physician attire.
Acknowledgments
The authors thank Drs. Fumi Takemoto, Masayuki Ueno, Kazuya Sakai, Saori Kinami, and Toshio Naito for their assistance with data collection at their respective sites. Additionally, the authors thank Dr. Yoko Kanamitsu for serving as a model for photographs.
1. Manary MP, Boulding W, Staelin R, Glickman SW. The patient experience and health outcomes. N Engl J Med. 2013;368(3):201-203. https://doi.org/ 10.1056/NEJMp1211775.
2. Boulding W, Glickman SW, Manary MP, Schulman KA, Staelin R. Relationship between patient satisfaction with inpatient care and hospital readmission within 30 days. Am J Manag Care. 2011;17(1):41-48.
3. Barbosa CD, Balp MM, Kulich K, Germain N, Rofail D. A literature review to explore the link between treatment satisfaction and adherence, compliance, and persistence. Patient Prefer Adherence. 2012;6:39-48. https://doi.org/10.2147/PPA.S24752.
4. Jha AK, Orav EJ, Zheng J, Epstein AM. Patients’ perception of hospital care in the United States. N Engl J Med. 2008;359(18):1921-31. https://doi.org/10.1056/NEJMsa080411.
5. O’Malley AS, Forrest CB, Mandelblatt J. Adherence of low-income women to cancer screening recommendations. J Gen Intern Med. 2002;17(2):144-54. https://doi.org/10.1046/j.1525-1497.2002.10431.x.
6. Chung H, Lee H, Chang DS, Kim HS, Park HJ, Chae Y. Doctor’s attire influences perceived empathy in the patient-doctor relationship. Patient Educ Couns. 2012;89(3):387-391. https://doi.org/10.1016/j.pec.2012.02.017.
7. Bianchi MT. Desiderata or dogma: what the evidence reveals about physician attire. J Gen Intern Med. 2008;23(5):641-643. https://doi.org/10.1007/s11606-008-0546-8.
8. Brandt LJ. On the value of an old dress code in the new millennium. Arch Intern Med. 2003;163(11):1277-1281. https://doi.org/10.1001/archinte.163.11.1277.
9. Petrilli CM, Mack M, Petrilli JJ, Hickner A, Saint S, Chopra V. Understanding the role of physician attire on patient perceptions: a systematic review of the literature--targeting attire to improve likelihood of rapport (TAILOR) investigators. BMJ Open. 2015;5(1):e006578. https://doi.org/10.1136/bmjopen-2014-006578.
10. Petrilli CM, Saint S, Jennings JJ, et al. Understanding patient preference for physician attire: a cross-sectional observational study of 10 academic medical centres in the USA. BMJ Open. 2018;8(5):e021239. https://doi.org/10.1136/bmjopen-2017-021239.
11. Rowbury R. The need for more proactive communications. Low trust and changing values mean Japan can no longer fall back on its homogeneity. The Japan Times. 2017, Oct 15;Sect. Opinion. https://www.japantimes.co.jp/opinion/2017/10/15/commentary/japan-commentary/need-proactive-communications/#.Xej7lC3MzUI. Accessed December 5, 2019.
12. Shoji Nishimura ANaST. Communication Style and Cultural Features in High/Low Context Communication Cultures: A Case Study of Finland, Japan and India. Nov 22nd, 2009.
13. Smith RMRSW. The influence of high/low-context culture and power distance on choice of communication media: Students’ media choice to communicate with Professors in Japan and America. Int J Intercultural Relations. 2007;31(4):479-501.
14. Yamada Y, Takahashi O, Ohde S, Deshpande GA, Fukui T. Patients’ preferences for doctors’ attire in Japan. Intern Med. 2010;49(15):1521-1526. https://doi.org/10.2169/internalmedicine.49.3572.
15. Ikusaka M, Kamegai M, Sunaga T, et al. Patients’ attitude toward consultations by a physician without a white coat in Japan. Intern Med. 1999;38(7):533-536. https://doi.org/10.2169/internalmedicine.38.533.
16. Lefor AK, Ohnuma T, Nunomiya S, Yokota S, Makino J, Sanui M. Physician attire in the intensive care unit in Japan influences visitors’ perception of care. J Crit Care. 2018;43:288-293.
17. Kurihara H, Maeno T. Importance of physicians’ attire: factors influencing the impression it makes on patients, a cross-sectional study. Asia Pac Fam Med. 2014;13(1):2. https://doi.org/10.1186/1447-056X-13-2.
18. Zollinger M, Houchens N, Chopra V, et al. Understanding patient preference for physician attire in ambulatory clinics: a cross-sectional observational study. BMJ Open. 2019;9(5):e026009. https://doi.org/10.1136/bmjopen-2018-026009.
19. Chung JE. Medical Dramas and Viewer Perception of Health: Testing Cultivation Effects. Hum Commun Res. 2014;40(3):333-349.
20. Michael Pfau LJM, Kirsten Garrow. The influence of television viewing on public perceptions of physicians. J Broadcast Electron Media. 1995;39(4):441-458.
21. Suzuki S. Exhausting physicians employed in hospitals in Japan assessed by a health questionnaire [in Japanese]. Sangyo Eiseigaku Zasshi. 2017;59(4):107-118. https://doi.org/10.1539/sangyoeisei.
22. Ogawa R, Seo E, Maeno T, Ito M, Sanuki M. The relationship between long working hours and depression among first-year residents in Japan. BMC Med Educ. 2018;18(1):50. https://doi.org/10.1186/s12909-018-1171-9.
23. Saijo Y, Chiba S, Yoshioka E, et al. Effects of work burden, job strain and support on depressive symptoms and burnout among Japanese physicians. Int J Occup Med Environ Health. 2014;27(6):980-992. https://doi.org/10.2478/s13382-014-0324-2.
24. Tiang KW, Razack AH, Ng KL. The ‘auxiliary’ white coat effect in hospitals: perceptions of patients and doctors. Singapore Med J. 2017;58(10):574-575. https://doi.org/10.11622/smedj.2017023.
25. Al Amry KM, Al Farrah M, Ur Rahman S, Abdulmajeed I. Patient perceptions and preferences of physicians’ attire in Saudi primary healthcare setting. J Community Hosp Intern Med Perspect. 2018;8(6):326-330. https://doi.org/10.1080/20009666.2018.1551026.
26. Healy WL. Letter to the editor: editor’s spotlight/take 5: physicians’ attire influences patients’ perceptions in the urban outpatient orthopaedic surgery setting. Clin Orthop Relat Res. 2016;474(11):2545-2546. https://doi.org/10.1007/s11999-016-5049-z.
27. Aldrees T, Alsuhaibani R, Alqaryan S, et al. Physicians’ attire. Parents preferences in a tertiary hospital. Saudi Med J. 2017;38(4):435-439. https://doi.org/10.15537/smj.2017.4.15853.
© 2020 Society of Hospital Medicine
Long Peripheral Catheters: A Retrospective Review of Major Complications
Introduced in the 1950s, midline catheters have become a popular option for intravenous (IV) access.1,2 Ranging from 8 to 25 cm in length, they are inserted in the veins of the upper arm. Unlike peripherally inserted central catheters (PICCs), the tip of midline catheters terminates proximal to the axillary vein; thus, midlines are peripheral, not central venous access devices.1-3 One popular variation of a midline catheter, though nebulously defined, is the long peripheral catheter (LPC), a device ranging from 6 to 15 cm in length.4,5
Concerns regarding inappropriate use and complications such as thrombosis and central line-associated bloodstream infection (CLABSI) have spurred growth in the use of LPCs.6 However, data regarding complication rates with these devices are limited. Whether LPCs are a safe and viable option for IV access is unclear. We conducted a retrospective study to examine indications, patterns of use, and complications following LPC insertion in hospitalized patients.
METHODS
Device Selection
Our institution is a 470-bed tertiary care, safety-net hospital in Chicago, Illinois. Our vascular access team (VAT) performs a patient assessment and selects IV devices based upon published standards for device appropriateness. 7 We retrospectively collated electronic requests for LPC insertion on adult inpatients between October 2015 and June 2017. Cases where (1) duplicate orders, (2) patient refusal, (3) peripheral intravenous catheter of any length, or (4) PICCs were placed were excluded from this analysis.
VAT and Device Characteristics
We used Bard PowerGlide® (Bard Access Systems, Inc., Salt Lake City, Utah), an 18-gauge, 8-10 cm long, power-injectable, polyurethane LPC. Bundled kits (ie, device, gown, dressing, etc.) were utilized, and VAT providers underwent two weeks of training prior to the study period. All LPCs were inserted in the upper extremities under sterile technique using ultrasound guidance (accelerated Seldinger technique). Placement confirmation was verified by aspiration, flush, and ultrasound visualization of the catheter tip within the vein. An antimicrobial dressing was applied to the catheter insertion site, and daily saline flushes and weekly dressing changes by bedside nurses were used for device maintenance. LPC placement was available on all nonholiday weekdays from 8
Data Selection
For each LPC recipient, demographic and comorbidity data were collected to calculate the Charlson Comorbidity Index (Table 1). Every LPC recipient’s history of deep vein thrombosis (DVT) and catheter-related infection (CRI) was recorded. Procedural information (eg, inserter, vein, and number of attempts) was obtained from insertion notes. All data were extracted from the electronic medical record via chart review. Two reviewers verified outcomes to ensure concordance with stated definitions (ie, DVT, CRI). Device parameters, including dwell time, indication, and time to complication(s) were also collected.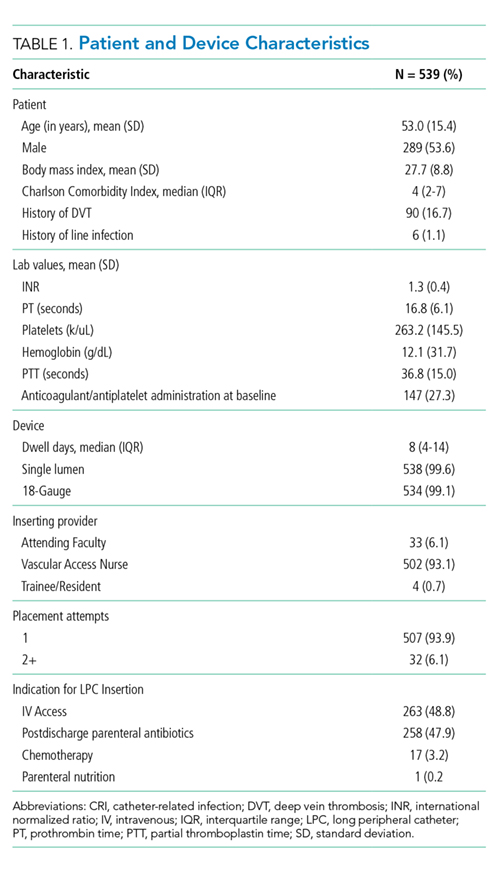
Primary Outcomes
The primary outcome was the incidence of DVT and CRI (Table 2). DVT was defined as radiographically confirmed (eg, ultrasound, computed tomography) thrombosis in the presence of patient signs or symptoms. CRI was defined in accordance with Timsit et al.8 as follows: catheter-related clinical sepsis without bloodstream infection defined as (1) combination of fever (body temperature >38.5°C) or hypothermia (body temperature <36.5°C), (2) catheter-tip culture yielding ≥103 CFUs/mL, (3) pus at the insertion site or resolution of clinical sepsis after catheter removal, and (4) absence of any other infectious focus or catheter-related bloodstream infection (CRBSI). CRBSI was defined as a combination of (1) one or more positive peripheral blood cultures sampled immediately before or within 48 hours after catheter removal, (2) a quantitative catheter-tip culture testing positive for the same microorganisms (same species and susceptibility pattern) or a differential time to positivity of blood cultures ≥2 hours, and (3) no other infectious focus explaining the positive blood culture result.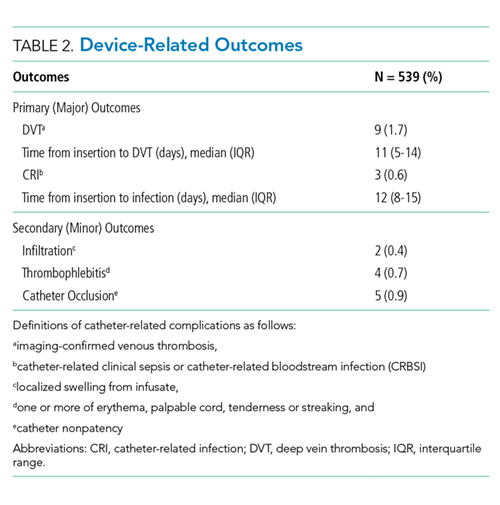
Secondary Outcomes
Secondary outcomes, defined as minor complications, included infiltration, thrombophlebitis, and catheter occlusion. Infiltration was defined as localized swelling due to infusate or site leakage. Thrombophlebitis was defined as one or more of the following: localized erythema, palpable cord, tenderness, or streaking. Occlusion was defined as nonpatency of the catheter due to the inability to flush or aspirate. Definitions for secondary outcomes are consistent with those used in prior studies.9
Statistical Analysis
Patient and LPC characteristics were analyzed using descriptive statistics. Results were reported as percentages, means, medians (interquartile range [IQR]), and rates per 1,000 catheter days. All analyses were conducted in Stata v.15 (StataCorp, College Station, Texas).
RESULTS
Within the 20-month study period, a total of 539 LPCs representing 5,543 catheter days were available for analysis. The mean patient age was 53 years. A total of 90 patients (16.7%) had a history of DVT, while 6 (1.1%) had a history of CRI. We calculated a median Charlson index of 4 (interquartile range [IQR], 2-7), suggesting an estimated one-year postdischarge survival of 53% (Table 1).
The majority of LPCs (99.6% [537/539]) were single lumen catheters. No patient had more than one concurrent LPC. The cannulation success rate on the first attempt was 93.9% (507/539). The brachial or basilic veins were primarily targeted (98.7%, [532/539]). Difficult intravenous access represented 48.8% (263/539) of indications, and postdischarge parenteral antibiotics constituted 47.9% (258/539). The median catheter dwell time was eight days (IQR, 4-14 days).
Nine DVTs (1.7% [9/539]) occurred in patients with LPCs. The incidence of DVT was higher in patients with a history of DVT (5.7%, 5/90). The median time from insertion to DVT was 11 (IQR, 5-14) days. DVTs were managed with LPC removal and systemic anticoagulation in accordance with catheter-related DVT guidelines. The rate of CRI was 0.6% (3/539), or 0.54 per 1,000 catheter days. Two CRIs had positive blood cultures, while one had negative cultures. Infections occurred after a median of 12 (IQR, 8-15) days of catheter dwell. Each was treated with LPC removal and IV antibiotics, with two patients receiving two weeks and one receiving six weeks of antibiotic therapy (Table 2).
With respect to secondary outcomes, the incidence of infiltration was 0.4% (2/539), thrombophlebitis 0.7% (4/539), and catheter occlusion 0.9% (5/539). The time to event was 8.5, 3.75, and 5.4 days, respectively. Collectively, 2.0% of devices experienced a minor complication.
DISCUSSION
In our single-center study, LPCs were primarily inserted for difficult venous access or parenteral antibiotics. Despite a clinically complex population with a high number of comorbidities, rates of major and minor complications associated with LPCs were low. These data suggest that LPCs are a safe alternative to PICCs and other central access devices for short-term use.
Our incidence of CRI of 0.6% (0.54 per 1,000 catheter days) is similar to or lower than other studies.2,10,11 An incidence of 0%-1.5% was observed in two recent publications about midline catheters, with rates across individual studies and hospital sites varying widely.12,13 A systematic review of intravascular devices reported CRI rates of 0.4% (0.2 per 1,000 catheter days) for midlines and 0.1% (0.5 per 1,000 catheter days for peripheral IVs), in contrast to PICCs at 3.1% (1.1 per 1,000 catheter days).14 However, catheters of varying lengths and diameters were used in studies within the review, potentially leading to heterogeneous outcomes. In accordance with existing data, CRI incidence in our study increased with catheter dwell time.10
The 1.7% rate of DVT observed in our study is on the lower end of existing data (1.4%-5.9%).12-15 Compared with PICCs (2%-15%), the incidence of venous thrombosis appears to be lower with midlines/LPCs—justifying their use as an alternative device for IV access.7,9,12,14 There was an overall low rate of minor complications, similar to recently published results.10 As rates were greater in patients with a history of DVT (5.7%), caution is warranted when using these devices in this population.
Our experience with LPCs suggests financial and patient benefits. The cost of LPCs is lower than central access devices.4 As rates of CRI were low, costs related to CLABSIs from PICC use may be reduced by appropriate LPC use. LPCs may allow the ability to draw blood routinely, which could improve the patient experience—albeit with its own risks. Current recommendations support the use of PICCs or LPCs, somewhat interchangeably, for patients with appropriate indications needing IV therapy for more than five to six days.2,7 However, LPCs now account for 57% of vascular access procedures in our center and have led to a decrease in reliance on PICCs and attendant complications.
Our study has several limitations. First, LPCs and midlines are often used interchangeably in the literature.4,5 Therefore, reported complication rates may not reflect those of LPCs alone and may limit comparisons. Second, ours was a single-center study with experts assessing device appropriateness and performing ultrasound-guided insertions; our findings may not be generalizable to dissimilar settings. Third, we did not track LPC complications such as nonpatency and leakage. As prior studies reported high rates of complications such as these events, caution is advised when interpreting our findings.15 Finally, we retrospectively extracted data from our medical records; limitations in documentation may influence our findings.
CONCLUSION
In patients requiring short-term IV therapy, these data suggest LPCs have low complication rates and may be safely used as an alternative option for venous access.
Acknowledgments
The authors thank Drs. Laura Hernandez, Andres Mendez Hernandez, and Victor Prado for their assistance in data collection. The authors also thank Mr. Onofre Donceras and Dr. Sharon Welbel from the John H. Stroger, Jr. Hospital of Cook County Department of Infection Control & Epidemiology for their assistance in reviewing local line infection data.
Drs. Patel and Chopra developed the study design. Drs. Patel, Araujo, Parra Rodriguez, Ramirez Sanchez, and Chopra contributed to manuscript writing. Ms. Snyder provided statistical analysis. All authors have seen and approved the final manuscript for submission.
Disclosures
The authors have nothing to disclose.
1. Anderson NR. Midline catheters: the middle ground of intravenous therapy administration. J Infus Nurs. 2004;27(5):313-321.
2. Adams DZ, Little A, Vinsant C, et al. The midline catheter: a clinical review. J Emerg Med. 2016;51(3):252-258. https://doi.org/10.1016/j.jemermed.2016.05.029.
3. Scoppettuolo G, Pittiruti M, Pitoni S, et al. Ultrasound-guided “short” midline catheters for difficult venous access in the emergency department: a retrospective analysis. Int J Emerg Med. 2016;9(1):3. https://doi.org/10.1186/s12245-016-0100-0.
4. Qin KR, Nataraja RM, Pacilli M. Long peripheral catheters: is it time to address the confusion? J Vasc Access. 2018;20(5). https://doi.org/10.1177/1129729818819730.
5. Pittiruti M, Scoppettuolo G. The GAVeCeLT Manual of PICC and Midlines. Milano: EDRA; 2016.
6. Dawson RB, Moureau NL. Midline catheters: an essential tool in CLABSI reduction. Infection Control Today. https://www.infectioncontroltoday.com/clabsi/midline-catheters-essential-tool-clabsi-reduction. Accessed February 19, 2018
7. Chopra V, Flanders SA, Saint S, et al. The Michigan Appropriateness Guide for Intravenous Catheters (MAGIC): results from a multispecialty panel using the RAND/UCLA appropriateness method. Ann Intern Med. 2015;163(6):S1-S40. https://doi.org/10.7326/M15-0744.
8. Timsit JF, Schwebel C, Bouadma L, et al. Chlorhexidine-impregnated sponges and less frequent dressing changes for prevention of catheter-related infections in critically ill adults: a randomized controlled trial. JAMA. 2009;301(12):1231-1241. https://doi.org/10.1001/jama.2009.376.
9. Bahl A, Karabon P, Chu D. Comparison of venous thrombosis complications in midlines versus peripherally inserted central catheters: are midlines the safer option? Clin Appl Thromb Hemost. 2019;25. https://doi.org/10.1177/1076029619839150.
10. Goetz AM, Miller J, Wagener MM, et al. Complications related to intravenous midline catheter usage. A 2-year study. J Intraven Nurs. 1998;21(2):76-80.
11. Xu T, Kingsley L, DiNucci S, et al. Safety and utilization of peripherally inserted central catheters versus midline catheters at a large academic medical center. Am J Infect Control. 2016;44(12):1458-1461. https://doi.org/10.1016/j.ajic.2016.09.010.
12. Chopra V, Kaatz S, Swaminathan L, et al. Variation in use and outcomes related to midline catheters: results from a multicentre pilot study. BMJ Qual Saf. 2019;28(9):714-720. https://doi.org/10.1136/bmjqs-2018-008554.
13. Badger J. Long peripheral catheters for deep arm vein venous access: A systematic review of complications. Heart Lung. 2019;48(3):222-225. https://doi.org/10.1016/j.hrtlng.2019.01.002.
14. Maki DG, Kluger DM, Crnich CJ. The risk of bloodstream infection in adults with different intravascular devices: a systematic review of 200 published prospective studies. Mayo Clin Proc. 2006;81(9):1159-1171. https://doi.org/10.4065/81.9.1159.
15. Zerla PA, Caravella G, De Luca G, et al. Open- vs closed-tip valved peripherally inserted central catheters and midlines: Findings from a vascular access database. J Assoc Vasc Access. 2015;20(3):169-176. https://doi.org/10.1016/j.java.2015.06.001.
Introduced in the 1950s, midline catheters have become a popular option for intravenous (IV) access.1,2 Ranging from 8 to 25 cm in length, they are inserted in the veins of the upper arm. Unlike peripherally inserted central catheters (PICCs), the tip of midline catheters terminates proximal to the axillary vein; thus, midlines are peripheral, not central venous access devices.1-3 One popular variation of a midline catheter, though nebulously defined, is the long peripheral catheter (LPC), a device ranging from 6 to 15 cm in length.4,5
Concerns regarding inappropriate use and complications such as thrombosis and central line-associated bloodstream infection (CLABSI) have spurred growth in the use of LPCs.6 However, data regarding complication rates with these devices are limited. Whether LPCs are a safe and viable option for IV access is unclear. We conducted a retrospective study to examine indications, patterns of use, and complications following LPC insertion in hospitalized patients.
METHODS
Device Selection
Our institution is a 470-bed tertiary care, safety-net hospital in Chicago, Illinois. Our vascular access team (VAT) performs a patient assessment and selects IV devices based upon published standards for device appropriateness. 7 We retrospectively collated electronic requests for LPC insertion on adult inpatients between October 2015 and June 2017. Cases where (1) duplicate orders, (2) patient refusal, (3) peripheral intravenous catheter of any length, or (4) PICCs were placed were excluded from this analysis.
VAT and Device Characteristics
We used Bard PowerGlide® (Bard Access Systems, Inc., Salt Lake City, Utah), an 18-gauge, 8-10 cm long, power-injectable, polyurethane LPC. Bundled kits (ie, device, gown, dressing, etc.) were utilized, and VAT providers underwent two weeks of training prior to the study period. All LPCs were inserted in the upper extremities under sterile technique using ultrasound guidance (accelerated Seldinger technique). Placement confirmation was verified by aspiration, flush, and ultrasound visualization of the catheter tip within the vein. An antimicrobial dressing was applied to the catheter insertion site, and daily saline flushes and weekly dressing changes by bedside nurses were used for device maintenance. LPC placement was available on all nonholiday weekdays from 8
Data Selection
For each LPC recipient, demographic and comorbidity data were collected to calculate the Charlson Comorbidity Index (Table 1). Every LPC recipient’s history of deep vein thrombosis (DVT) and catheter-related infection (CRI) was recorded. Procedural information (eg, inserter, vein, and number of attempts) was obtained from insertion notes. All data were extracted from the electronic medical record via chart review. Two reviewers verified outcomes to ensure concordance with stated definitions (ie, DVT, CRI). Device parameters, including dwell time, indication, and time to complication(s) were also collected.
Primary Outcomes
The primary outcome was the incidence of DVT and CRI (Table 2). DVT was defined as radiographically confirmed (eg, ultrasound, computed tomography) thrombosis in the presence of patient signs or symptoms. CRI was defined in accordance with Timsit et al.8 as follows: catheter-related clinical sepsis without bloodstream infection defined as (1) combination of fever (body temperature >38.5°C) or hypothermia (body temperature <36.5°C), (2) catheter-tip culture yielding ≥103 CFUs/mL, (3) pus at the insertion site or resolution of clinical sepsis after catheter removal, and (4) absence of any other infectious focus or catheter-related bloodstream infection (CRBSI). CRBSI was defined as a combination of (1) one or more positive peripheral blood cultures sampled immediately before or within 48 hours after catheter removal, (2) a quantitative catheter-tip culture testing positive for the same microorganisms (same species and susceptibility pattern) or a differential time to positivity of blood cultures ≥2 hours, and (3) no other infectious focus explaining the positive blood culture result.
Secondary Outcomes
Secondary outcomes, defined as minor complications, included infiltration, thrombophlebitis, and catheter occlusion. Infiltration was defined as localized swelling due to infusate or site leakage. Thrombophlebitis was defined as one or more of the following: localized erythema, palpable cord, tenderness, or streaking. Occlusion was defined as nonpatency of the catheter due to the inability to flush or aspirate. Definitions for secondary outcomes are consistent with those used in prior studies.9
Statistical Analysis
Patient and LPC characteristics were analyzed using descriptive statistics. Results were reported as percentages, means, medians (interquartile range [IQR]), and rates per 1,000 catheter days. All analyses were conducted in Stata v.15 (StataCorp, College Station, Texas).
RESULTS
Within the 20-month study period, a total of 539 LPCs representing 5,543 catheter days were available for analysis. The mean patient age was 53 years. A total of 90 patients (16.7%) had a history of DVT, while 6 (1.1%) had a history of CRI. We calculated a median Charlson index of 4 (interquartile range [IQR], 2-7), suggesting an estimated one-year postdischarge survival of 53% (Table 1).
The majority of LPCs (99.6% [537/539]) were single lumen catheters. No patient had more than one concurrent LPC. The cannulation success rate on the first attempt was 93.9% (507/539). The brachial or basilic veins were primarily targeted (98.7%, [532/539]). Difficult intravenous access represented 48.8% (263/539) of indications, and postdischarge parenteral antibiotics constituted 47.9% (258/539). The median catheter dwell time was eight days (IQR, 4-14 days).
Nine DVTs (1.7% [9/539]) occurred in patients with LPCs. The incidence of DVT was higher in patients with a history of DVT (5.7%, 5/90). The median time from insertion to DVT was 11 (IQR, 5-14) days. DVTs were managed with LPC removal and systemic anticoagulation in accordance with catheter-related DVT guidelines. The rate of CRI was 0.6% (3/539), or 0.54 per 1,000 catheter days. Two CRIs had positive blood cultures, while one had negative cultures. Infections occurred after a median of 12 (IQR, 8-15) days of catheter dwell. Each was treated with LPC removal and IV antibiotics, with two patients receiving two weeks and one receiving six weeks of antibiotic therapy (Table 2).
With respect to secondary outcomes, the incidence of infiltration was 0.4% (2/539), thrombophlebitis 0.7% (4/539), and catheter occlusion 0.9% (5/539). The time to event was 8.5, 3.75, and 5.4 days, respectively. Collectively, 2.0% of devices experienced a minor complication.
DISCUSSION
In our single-center study, LPCs were primarily inserted for difficult venous access or parenteral antibiotics. Despite a clinically complex population with a high number of comorbidities, rates of major and minor complications associated with LPCs were low. These data suggest that LPCs are a safe alternative to PICCs and other central access devices for short-term use.
Our incidence of CRI of 0.6% (0.54 per 1,000 catheter days) is similar to or lower than other studies.2,10,11 An incidence of 0%-1.5% was observed in two recent publications about midline catheters, with rates across individual studies and hospital sites varying widely.12,13 A systematic review of intravascular devices reported CRI rates of 0.4% (0.2 per 1,000 catheter days) for midlines and 0.1% (0.5 per 1,000 catheter days for peripheral IVs), in contrast to PICCs at 3.1% (1.1 per 1,000 catheter days).14 However, catheters of varying lengths and diameters were used in studies within the review, potentially leading to heterogeneous outcomes. In accordance with existing data, CRI incidence in our study increased with catheter dwell time.10
The 1.7% rate of DVT observed in our study is on the lower end of existing data (1.4%-5.9%).12-15 Compared with PICCs (2%-15%), the incidence of venous thrombosis appears to be lower with midlines/LPCs—justifying their use as an alternative device for IV access.7,9,12,14 There was an overall low rate of minor complications, similar to recently published results.10 As rates were greater in patients with a history of DVT (5.7%), caution is warranted when using these devices in this population.
Our experience with LPCs suggests financial and patient benefits. The cost of LPCs is lower than central access devices.4 As rates of CRI were low, costs related to CLABSIs from PICC use may be reduced by appropriate LPC use. LPCs may allow the ability to draw blood routinely, which could improve the patient experience—albeit with its own risks. Current recommendations support the use of PICCs or LPCs, somewhat interchangeably, for patients with appropriate indications needing IV therapy for more than five to six days.2,7 However, LPCs now account for 57% of vascular access procedures in our center and have led to a decrease in reliance on PICCs and attendant complications.
Our study has several limitations. First, LPCs and midlines are often used interchangeably in the literature.4,5 Therefore, reported complication rates may not reflect those of LPCs alone and may limit comparisons. Second, ours was a single-center study with experts assessing device appropriateness and performing ultrasound-guided insertions; our findings may not be generalizable to dissimilar settings. Third, we did not track LPC complications such as nonpatency and leakage. As prior studies reported high rates of complications such as these events, caution is advised when interpreting our findings.15 Finally, we retrospectively extracted data from our medical records; limitations in documentation may influence our findings.
CONCLUSION
In patients requiring short-term IV therapy, these data suggest LPCs have low complication rates and may be safely used as an alternative option for venous access.
Acknowledgments
The authors thank Drs. Laura Hernandez, Andres Mendez Hernandez, and Victor Prado for their assistance in data collection. The authors also thank Mr. Onofre Donceras and Dr. Sharon Welbel from the John H. Stroger, Jr. Hospital of Cook County Department of Infection Control & Epidemiology for their assistance in reviewing local line infection data.
Drs. Patel and Chopra developed the study design. Drs. Patel, Araujo, Parra Rodriguez, Ramirez Sanchez, and Chopra contributed to manuscript writing. Ms. Snyder provided statistical analysis. All authors have seen and approved the final manuscript for submission.
Disclosures
The authors have nothing to disclose.
1. Anderson NR. Midline catheters: the middle ground of intravenous therapy administration. J Infus Nurs. 2004;27(5):313-321.
2. Adams DZ, Little A, Vinsant C, et al. The midline catheter: a clinical review. J Emerg Med. 2016;51(3):252-258. https://doi.org/10.1016/j.jemermed.2016.05.029.
3. Scoppettuolo G, Pittiruti M, Pitoni S, et al. Ultrasound-guided “short” midline catheters for difficult venous access in the emergency department: a retrospective analysis. Int J Emerg Med. 2016;9(1):3. https://doi.org/10.1186/s12245-016-0100-0.
4. Qin KR, Nataraja RM, Pacilli M. Long peripheral catheters: is it time to address the confusion? J Vasc Access. 2018;20(5). https://doi.org/10.1177/1129729818819730.
5. Pittiruti M, Scoppettuolo G. The GAVeCeLT Manual of PICC and Midlines. Milano: EDRA; 2016.
6. Dawson RB, Moureau NL. Midline catheters: an essential tool in CLABSI reduction. Infection Control Today. https://www.infectioncontroltoday.com/clabsi/midline-catheters-essential-tool-clabsi-reduction. Accessed February 19, 2018
7. Chopra V, Flanders SA, Saint S, et al. The Michigan Appropriateness Guide for Intravenous Catheters (MAGIC): results from a multispecialty panel using the RAND/UCLA appropriateness method. Ann Intern Med. 2015;163(6):S1-S40. https://doi.org/10.7326/M15-0744.
8. Timsit JF, Schwebel C, Bouadma L, et al. Chlorhexidine-impregnated sponges and less frequent dressing changes for prevention of catheter-related infections in critically ill adults: a randomized controlled trial. JAMA. 2009;301(12):1231-1241. https://doi.org/10.1001/jama.2009.376.
9. Bahl A, Karabon P, Chu D. Comparison of venous thrombosis complications in midlines versus peripherally inserted central catheters: are midlines the safer option? Clin Appl Thromb Hemost. 2019;25. https://doi.org/10.1177/1076029619839150.
10. Goetz AM, Miller J, Wagener MM, et al. Complications related to intravenous midline catheter usage. A 2-year study. J Intraven Nurs. 1998;21(2):76-80.
11. Xu T, Kingsley L, DiNucci S, et al. Safety and utilization of peripherally inserted central catheters versus midline catheters at a large academic medical center. Am J Infect Control. 2016;44(12):1458-1461. https://doi.org/10.1016/j.ajic.2016.09.010.
12. Chopra V, Kaatz S, Swaminathan L, et al. Variation in use and outcomes related to midline catheters: results from a multicentre pilot study. BMJ Qual Saf. 2019;28(9):714-720. https://doi.org/10.1136/bmjqs-2018-008554.
13. Badger J. Long peripheral catheters for deep arm vein venous access: A systematic review of complications. Heart Lung. 2019;48(3):222-225. https://doi.org/10.1016/j.hrtlng.2019.01.002.
14. Maki DG, Kluger DM, Crnich CJ. The risk of bloodstream infection in adults with different intravascular devices: a systematic review of 200 published prospective studies. Mayo Clin Proc. 2006;81(9):1159-1171. https://doi.org/10.4065/81.9.1159.
15. Zerla PA, Caravella G, De Luca G, et al. Open- vs closed-tip valved peripherally inserted central catheters and midlines: Findings from a vascular access database. J Assoc Vasc Access. 2015;20(3):169-176. https://doi.org/10.1016/j.java.2015.06.001.
© 2019 Society of Hospital Medicine
Less Lumens-Less Risk: A Pilot Intervention to Increase the Use of Single-Lumen Peripherally Inserted Central Catheters
Vascular access is a cornerstone of safe and effective medical care. The use of peripherally inserted central catheters (PICCs) to meet vascular access needs has recently increased.1,2 PICCs offer several advantages over other central venous catheters. These advantages include increased reliability over intermediate to long-term use and reductions in complication rates during insertion.3,4
Multiple studies have suggested a strong association between the number of PICC lumens and risk of complications, such as central-line associated bloodstream infection (CLABSI), venous thrombosis, and catheter occlusion.5-8,9,10-12 These complications may lead to device failure, interrupt therapy, prolonged length of stay, and increased healthcare costs.13-15 Thus, available guidelines recommend using PICCs with the least clinically necessary number of lumens.1,16 Quality improvement strategies that have targeted decreasing the number of PICC lumens have reduced complications and healthcare costs.17-19 However, variability exists in the selection of the number of PICC lumens, and many providers request multilumen devices “just in case” additional lumens are needed.20,21 Such variation in device selection may stem from the paucity of information that defines the appropriate indications for the use of single- versus multi-lumen PICCs.
Therefore, to ensure appropriateness of PICC use, we designed an intervention to improve selection of the number of PICC lumens.
METHODS
We conducted this pre–post quasi-experimental study in accordance with SQUIRE guidelines.22 Details regarding clinical parameters associated with the decision to place a PICC, patient characteristics, comorbidities, complications, and laboratory values were collected from the medical records of patients. All PICCs were placed by the Vascular Access Service Team (VAST) during the study period.
Intervention
The intervention consisted of three components: first, all hospitalists, pharmacists, and VAST nurses received education in the form of a CME lecture that emphasized use of the Michigan Appropriateness Guide for Intravenous Catheters (MAGIC).1 These criteria define when use of a PICC is appropriate and emphasize how best to select the most appropriate device characteristics such as lumens and catheter gauge. Next, a multidisciplinary task force that consisted of hospitalists, VAST nurses, and pharmacists developed a list of indications specifying when use of a multilumen PICC was appropriate.1 Third, the order for a PICC in our electronic medical record (EMR) system was modified to set single-lumen PICCs as default. If a multilumen PICC was requested, text-based justification from the ordering clinician was required.
As an additional safeguard, a VAST nurse reviewed the number of lumens and clinical scenario for each PICC order prior to insertion. If the number of lumens ordered was considered inappropriate on the basis of the developed list of MAGIC recommendations, the case was referred to a pharmacist for additional review. The pharmacist then reviewed active and anticipated medications, explored options for adjusting the medication delivery plan, and discussed these options with the ordering clinician to determine the most appropriate number of lumens.
Measures and Definitions
In accordance with the criteria set by the Centers for Disease Control National Healthcare Safety Network,23 CLABSI was defined as a confirmed positive blood culture with a PICC in place for 48 hours or longer without another identified infection source or a positive PICC tip culture in the setting of clinically suspected infection. Venous thrombosis was defined as symptomatic upper extremity deep vein thromboembolism or pulmonary embolism that was radiographically confirmed after the placement of a PICC or within one week of device removal. Catheter occlusion was captured when documented or when tPA was administered for problems related to the PICC. The appropriateness of the number of PICC lumens was independently adjudicated by an attending physician and clinical pharmacist by comparing the indications of the device placed against predefined appropriateness criteria.
Outcomes
The primary outcome of interest was the change in the proportion of single-lumen PICCs placed. Secondary outcomes included (1) the placement of PICCs with an appropriate number of lumens, (2) the occurrence of PICC-related complications (CLABSI, venous thrombosis, and catheter occlusion), and (3) the need for a second procedure to place a multilumen device or additional vascular access.
Statistical Analysis
Descriptive statistics were used to tabulate and summarize patient and PICC characteristics. Differences between pre- and postintervention populations were assessed using χ2, Fishers exact, t-, and Wilcoxon rank sum tests. Differences in complications were assessed using the two-sample tests of proportions. Results were reported as medians (IQR) and percentages with corresponding 95% confidence intervals. All statistical tests were two-sided, with P < .05 considered statistically significant. Analyses were conducted with Stata v.14 (stataCorp, College Station, Texas).
Ethical and Regulatory Oversight
This study was approved by the Institutional Review Board at the University of Michigan (IRB#HUM00118168).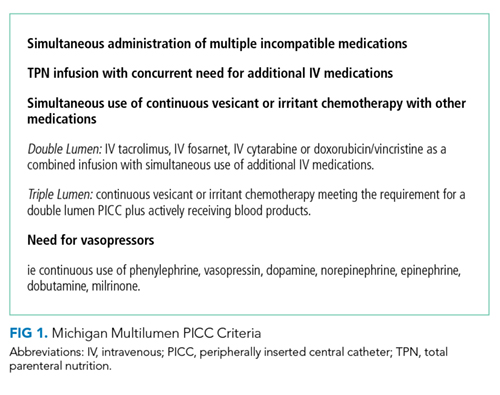
RESULTS
Of the 133 PICCs placed preintervention, 64.7% (n = 86) were single lumen, 33.1% (n = 44) were double lumen, and 2.3% (n = 3) were triple lumen. Compared with the preintervention period, the use of single-lumen PICCs significantly increased following the intervention (64.7% to 93.6%; P < .001; Figure 1). As well, the proportion of PICCs with an inappropriate number of lumens decreased from 25.6% to 2.2% (P < .001; Table 1).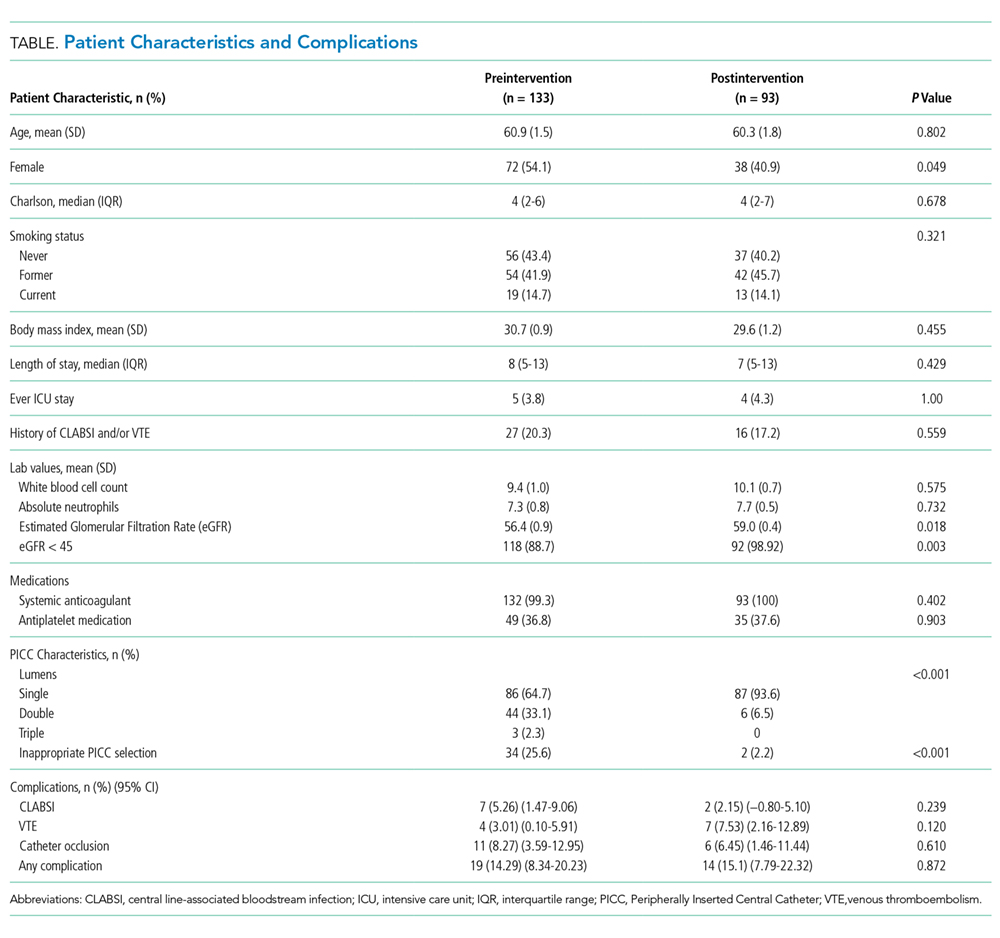
Preintervention, 14.3% (95% CI = 8.34-20.23) of the patients with PICCs experienced at least one complication (n = 19). Following the intervention, 15.1% (95% CI = 7.79-22.32) of the 93 patients with PICCs experienced at least one complication (absolute difference = 0.8%, P = .872). With respect to individual complications, CLABSI decreased from 5.3% (n = 7; 95% CI = 1.47-9.06) to 2.2% (n = 2; 95% CI = −0.80-5.10) (P = .239). Similarly, the incidence of catheter occlusion decreased from 8.3% (n = 11; 95% CI = 3.59-12.95) to 6.5% (n = 6; 95% CI = 1.46-11.44; P = .610; Table). Notably, only 12.1% (n = 21) of patients with a single-lumen PICC experienced any complication, whereas 20.0% (n = 10) of patients with a double lumen, and 66.7% (n = 2) with a triple lumen experienced a PICC-associated complication (P = .022). Patients with triple lumens had a significantly higher incidence of catheter occlusion compared with patients that received double- and single-lumen PICCs (66.7% vs. 12.0% and 5.2%, respectively; P = .003).
No patient who received a single-lumen device required a second procedure for the placement of a device with additional lumens. Similarly, no documentation suggesting an insufficient number of PICC lumens or the need for additional vascular access (eg, placement of additional PICCs) was found in medical records of patients postintervention. Pharmacists supporting the interventions and VAST team members reported no disagreements when discussing number of lumens or appropriateness of catheter choice.
DISCUSSION
In this single center, pre–post quasi-experimental study, a multimodal intervention based on the MAGIC criteria significantly reduced the use of multilumen PICCs. Additionally, a trend toward reductions in complications, including CLABSI and catheter occlusion, was also observed. Notably, these changes in ordering practices did not lead to requests for additional devices or replacement with a multilumen PICC when a single-lumen device was inserted. Collectively, our findings suggest that the use of single-lumen devices in a large direct care service can be feasibly and safely increased through this approach. Larger scale studies that implement MAGIC to inform placement of multilumen PICCs and reduce PICC-related complications now appear necessary.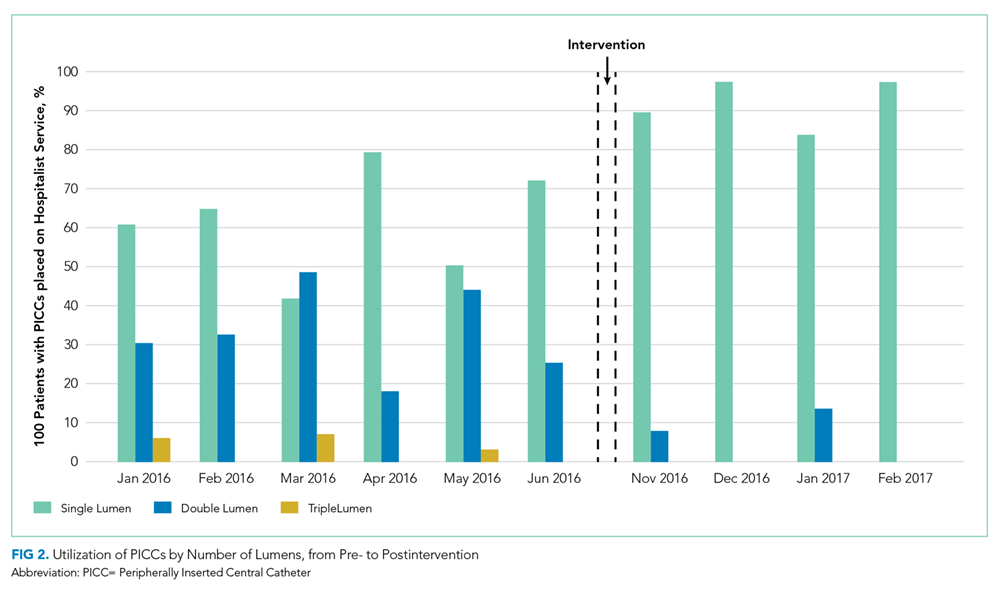
The presence of a PICC, even for short periods, significantly increases the risk of CLABSI and is one of the strongest predictors of venous thrombosis risk in the hospital setting.19,24,25 Although some factors that lead to this increased risk are patient-related and not modifiable (eg, malignancy or intensive care unit status), increased risk linked to the gauge of PICCs and the number of PICC lumens can be modified by improving device selection.9,18,26 Deliberate use of PICCs with the least numbers of clinically necessary lumens decreases risk of CLABSI, venous thrombosis and overall cost.17,19,26 Additionally, greater rates of occlusion with each additional PICC lumen may result in the interruption of intravenous therapy, the administration of costly medications (eg, tissue plasminogen activator) to salvage the PICC, and premature removal of devices should the occlusion prove irreversible.8
We observed a trend toward decreased PICC complications following implementation of our criteria, especially for the outcomes of CLABSI and catheter occlusion. Given the pilot nature of this study, we were underpowered to detect a statistically significant change in PICC adverse events. However, we did observe a statistically significant increase in the rate of single-lumen PICC use following our intervention. Notably, this increase occurred in the setting of high rates of single-lumen PICC use at baseline (64%). Therefore, an important takeaway from our findings is that room for improving PICC appropriateness exists even among high performers. This finding In turn, high baseline use of single-lumen PICCs may also explain why a robust reduction in PICC complications was not observed in our study, given that other studies showing reduction in the rates of complications began with considerably low rates of single-lumen device use.19 Outcomes may improve, however, if we expand and sustain these changes or expand to larger settings. For example, (based on assumptions from a previously published simulation study and our average hospital medicine daily census of 98 patients) the increased use of single-over multilumen PICCs is expected to decrease CLABSI events and venous thrombosis episodes by 2.4-fold in our hospital medicine service with an associated cost savings of $74,300 each year.17 Additionally, we would also expect the increase in the proportion of single-lumen PICCs to reduce rates of catheter occlusion. This reduction, in turn, would lessen interruptions in intravenous therapy, the need for medications to treat occlusion, and the need for device replacement all leading to reduced costs.27 Overall, then, our intervention (informed by appropriateness criteria) provides substantial benefits to hospital savings and patient safety.
After our intervention, 98% of all PICCs placed were found to comply with appropriate criteria for multilumen PICC use. We unexpectedly found that the most important factor driving our findings was not oversight or order modification by the pharmacy team or VAST nurses, but rather better decisions made by physicians at the outset. Specifically, we did not find a single instance wherein the original PICC order was changed to a device with a different number of lumens after review from the VAST team. We attribute this finding to receptiveness of physicians to change ordering practices following education and the redesign of the default EMR PICC order, both of which provided a scientific rationale for multilumen PICC use. Clarifying the risk and criteria of the use of multilumen devices along with providing an EMR ordering process that supports best practice helped hospitalists “do the right thing”. Additionally, setting single-lumen devices as the preselected EMR order and requiring text-based justification for placement of a multilumen PICC helped provide a nudge to physicians, much as it has done with antibiotic choices.28
Our study has limitations. First, we were only able to identify complications that were captured by our EMR. Given that over 70% of the patients in our study were discharged with a PICC in place, we do not know whether complications may have developed outside the hospital. Second, our intervention was resource intensive and required partnership with pharmacy, VAST, and hospitalists. Thus, the generalizability of our intervention to other institutions without similar support is unclear. Third, despite an increase in the use of single-lumen PICCs and a decrease in multilumen devices, we did not observe a significant reduction in all types of complications. While our high rate of single-lumen PICC use may account for these findings, larger scale studies are needed to better study the impact of MAGIC and appropriateness criteria on PICC complications. Finally, given our approach, we cannot identify the most effective modality within our bundled intervention. Stepped wedge or single-component studies are needed to further address this question.
In conclusion, we piloted a multimodal intervention to promote the use of single-lumen PICCs while lowering the use of multilumen devices. By using MAGIC to create appropriate indications, the use of multilumen PICCs declined and complications trended downwards. Larger, multicenter studies to validate our findings and examine the sustainability of this intervention would be welcomed.
Disclosures
The authors have nothing to disclose.
1. Chopra V, Flanders SA, Saint S, et al. The Michigan Appropriateness Guide for Intravenous Catheters (MAGIC): Results from a multispecialty panel using the RAND/UCLA appropriateness method. Ann Intern Med. 2015;163(6 Suppl):S1-S40. doi: 10.7326/M15-0744. PubMed
2. Taylor RW, Palagiri AV. Central venous catheterization. Crit Care Med. 2007;35(5):1390-1396. doi: 10.1097/01.CCM.0000260241.80346.1B. PubMed
3. Pikwer A, Akeson J, Lindgren S. Complications associated with peripheral or central routes for central venous cannulation. Anaesthesia. 2012;67(1):65-71. doi: 10.1111/j.1365-2044.2011.06911.x. PubMed
4. Johansson E, Hammarskjold F, Lundberg D, Arnlind MH. Advantages and disadvantages of peripherally inserted central venous catheters (PICC) compared to other central venous lines: a systematic review of the literature. Acta Onco. 2013;52(5):886-892. doi: 10.3109/0284186X.2013.773072. PubMed
5. Pan L, Zhao Q, Yang X. Risk factors for venous thrombosis associated with peripherally inserted central venous catheters. Int J Clin Exp Med. 2014;7(12):5814-5819. PubMed
6. Herc E, Patel P, Washer LL, Conlon A, Flanders SA, Chopra V. A model to predict central-line-associated bloodstream infection among patients with peripherally inserted central catheters: The MPC score. Infect Cont Hosp Ep. 2017;38(10):1155-1166. doi: 10.1017/ice.2017.167. PubMed
7. Maki DG, Kluger DM, Crnich CJ. The risk of bloodstream infection in adults with different intravascular devices: a systematic review of 200 published prospective studies. Mayo Clin Proc. 2006;81(9):1159–1171. doi: 10.4065/81.9.1159. PubMed
8. Smith SN, Moureau N, Vaughn VM, et al. Patterns and predictors of peripherally inserted central catheter occlusion: The 3P-O study. J Vasc Interv Radiol. 2017;28(5):749-756.e742. doi: 10.1016/j.jvir.2017.02.005. PubMed
9. Chopra V, Anand S, Hickner A, et al. Risk of venous thromboembolism associated with peripherally inserted central catheters: a systematic review and meta-analysis. Lancet. 2013;382(9889):311-325. doi: 10.1016/S0140-6736(13)60592-9. PubMed
10. Chopra V, Ratz D, Kuhn L, Lopus T, Lee A, Krein S. Peripherally inserted central catheter-related deep vein thrombosis: contemporary patterns and predictors. J Thromb Haemost. 2014;12(6):847-854. doi: 10.1111/jth.12549. PubMed
11. Carter JH, Langley JM, Kuhle S, Kirkland S. Risk factors for central venous catheter-associated bloodstream infection in pediatric patients: A cohort study. Infect Control Hosp Epidemiol. 2016;37(8):939-945. doi: 10.1017/ice.2016.83. PubMed
12. Chopra V, Ratz D, Kuhn L, Lopus T, Chenoweth C, Krein S. PICC-associated bloodstream infections: prevalence, patterns, and predictors. Am J Med. 2014;127(4):319-328. doi: 10.1016/j.amjmed.2014.01.001. PubMed
13. O’Grady NP, Alexander M, Burns LA, et al. Guidelines for the prevention of intravascular catheter-related infections. Clin Infect Dis. 2011;52(9):e162-e193. doi: 10.1093/cid/cir257. PubMed
14. Parkinson R, Gandhi M, Harper J, Archibald C. Establishing an ultrasound guided peripherally inserted central catheter (PICC) insertion service. Clin Radiol. 1998;53(1):33-36. doi: 10.1016/S0009-9260(98)80031-7. PubMed
15. Shannon RP, Patel B, Cummins D, Shannon AH, Ganguli G, Lu Y. Economics of central line--associated bloodstream infections. Am J Med Qual. 2006;21(6 Suppl):7s–16s. doi: 10.1177/1062860606294631. PubMed
16. Mermis JD, Strom JC, Greenwood JP, et al. Quality improvement initiative to reduce deep vein thrombosis associated with peripherally inserted central catheters in adults with cystic fibrosis. Ann Am Thorac Soc. 2014;11(9):1404-1410. doi: 10.1513/AnnalsATS.201404-175OC. PubMed
17. Ratz D, Hofer T, Flanders SA, Saint S, Chopra V. Limiting the number of lumens in peripherally inserted central catheters to improve outcomes and reduce cost: A simulation study. Infect Control Hosp Epidemiol. 2016;37(7):811-817. doi: 10.1017/ice.2016.55. PubMed
18. Chopra V, Anand S, Krein SL, Chenoweth C, Saint S. Bloodstream infection, venous thrombosis, and peripherally inserted central catheters: reappraising the evidence. Am J Med. 2012;125(8):733-741. doi: 10.1016/j.amjmed.2012.04.010. PubMed
19. O’Brien J, Paquet F, Lindsay R, Valenti D. Insertion of PICCs with minimum number of lumens reduces complications and costs. J Am Coll Radiol. 2013;10(11):864-868. doi: 10.1016/j.jacr.2013.06.003. PubMed
20. Tiwari MM, Hermsen ED, Charlton ME, Anderson JR, Rupp ME. Inappropriate intravascular device use: a prospective study. J Hosp Infect. 2011;78(2):128-132. doi: 10.1016/j.jhin.2011.03.004. PubMed
21. Chopra V, Kuhn L, Flanders SA, Saint S, Krein SL. Hospitalist experiences, practice, opinions, and knowledge regarding peripherally inserted central catheters: results of a national survey. J Hosp Med. 2013;8(11):635-638. doi: 10.1002/jhm.2095. PubMed
22. Goodman D, Ogrinc G, Davies L, et al. Explanation and elaboration of the SQUIRE (Standards for Quality Improvement Reporting Excellence) Guidelines, V.2.0: examples of SQUIRE elements in the healthcare improvement literature. BMJ Qual Saf. 2016;25(12):e7. doi: 10.1136/bmjqs-2015-004480. PubMed
23. CDC Bloodstream Infection/Device Associated Infection Module. https://wwwcdcgov/nhsn/pdfs/pscmanual/4psc_clabscurrentpdf 2017. Accessed April 11, 2017.
24. Woller SC, Stevens SM, Jones JP, et al. Derivation and validation of a simple model to identify venous thromboembolism risk in medical patients. Am J Med. 2011;124(10):947-954.e2. doi: 10.1016/j.amjmed.2011.06.004. PubMed
25. Paje D, Conlon A, Kaatz S, et al. Patterns and predictors of short-term peripherally inserted central catheter use: A multicenter prospective cohort study. J Hosp Med. 2018;13(2):76-82. doi: 10.12788/jhm.2847. PubMed
26. Evans RS, Sharp JH, Linford LH, et al. Reduction of peripherally inserted central catheter-associated DVT. Chest. 2013;143(3):627-633. doi: 10.1378/chest.12-0923. PubMed
27. Smith S, Moureau N, Vaughn VM, et al. Patterns and predictors of peripherally inserted central catheter occlusion: The 3P-O study. J Vasc Interv Radiol. 2017;28(5):749-756.e2. doi: 10.1016/j.jvir.2017.02.005. PubMed
28. Vaughn VM, Linder JA. Thoughtless design of the electronic health record drives overuse, but purposeful design can nudge improved patient care. BMJ Qual Saf. 2018;27(8):583-586. doi: 10.1136/bmjqs-2017-007578. PubMed
Vascular access is a cornerstone of safe and effective medical care. The use of peripherally inserted central catheters (PICCs) to meet vascular access needs has recently increased.1,2 PICCs offer several advantages over other central venous catheters. These advantages include increased reliability over intermediate to long-term use and reductions in complication rates during insertion.3,4
Multiple studies have suggested a strong association between the number of PICC lumens and risk of complications, such as central-line associated bloodstream infection (CLABSI), venous thrombosis, and catheter occlusion.5-8,9,10-12 These complications may lead to device failure, interrupt therapy, prolonged length of stay, and increased healthcare costs.13-15 Thus, available guidelines recommend using PICCs with the least clinically necessary number of lumens.1,16 Quality improvement strategies that have targeted decreasing the number of PICC lumens have reduced complications and healthcare costs.17-19 However, variability exists in the selection of the number of PICC lumens, and many providers request multilumen devices “just in case” additional lumens are needed.20,21 Such variation in device selection may stem from the paucity of information that defines the appropriate indications for the use of single- versus multi-lumen PICCs.
Therefore, to ensure appropriateness of PICC use, we designed an intervention to improve selection of the number of PICC lumens.
METHODS
We conducted this pre–post quasi-experimental study in accordance with SQUIRE guidelines.22 Details regarding clinical parameters associated with the decision to place a PICC, patient characteristics, comorbidities, complications, and laboratory values were collected from the medical records of patients. All PICCs were placed by the Vascular Access Service Team (VAST) during the study period.
Intervention
The intervention consisted of three components: first, all hospitalists, pharmacists, and VAST nurses received education in the form of a CME lecture that emphasized use of the Michigan Appropriateness Guide for Intravenous Catheters (MAGIC).1 These criteria define when use of a PICC is appropriate and emphasize how best to select the most appropriate device characteristics such as lumens and catheter gauge. Next, a multidisciplinary task force that consisted of hospitalists, VAST nurses, and pharmacists developed a list of indications specifying when use of a multilumen PICC was appropriate.1 Third, the order for a PICC in our electronic medical record (EMR) system was modified to set single-lumen PICCs as default. If a multilumen PICC was requested, text-based justification from the ordering clinician was required.
As an additional safeguard, a VAST nurse reviewed the number of lumens and clinical scenario for each PICC order prior to insertion. If the number of lumens ordered was considered inappropriate on the basis of the developed list of MAGIC recommendations, the case was referred to a pharmacist for additional review. The pharmacist then reviewed active and anticipated medications, explored options for adjusting the medication delivery plan, and discussed these options with the ordering clinician to determine the most appropriate number of lumens.
Measures and Definitions
In accordance with the criteria set by the Centers for Disease Control National Healthcare Safety Network,23 CLABSI was defined as a confirmed positive blood culture with a PICC in place for 48 hours or longer without another identified infection source or a positive PICC tip culture in the setting of clinically suspected infection. Venous thrombosis was defined as symptomatic upper extremity deep vein thromboembolism or pulmonary embolism that was radiographically confirmed after the placement of a PICC or within one week of device removal. Catheter occlusion was captured when documented or when tPA was administered for problems related to the PICC. The appropriateness of the number of PICC lumens was independently adjudicated by an attending physician and clinical pharmacist by comparing the indications of the device placed against predefined appropriateness criteria.
Outcomes
The primary outcome of interest was the change in the proportion of single-lumen PICCs placed. Secondary outcomes included (1) the placement of PICCs with an appropriate number of lumens, (2) the occurrence of PICC-related complications (CLABSI, venous thrombosis, and catheter occlusion), and (3) the need for a second procedure to place a multilumen device or additional vascular access.
Statistical Analysis
Descriptive statistics were used to tabulate and summarize patient and PICC characteristics. Differences between pre- and postintervention populations were assessed using χ2, Fishers exact, t-, and Wilcoxon rank sum tests. Differences in complications were assessed using the two-sample tests of proportions. Results were reported as medians (IQR) and percentages with corresponding 95% confidence intervals. All statistical tests were two-sided, with P < .05 considered statistically significant. Analyses were conducted with Stata v.14 (stataCorp, College Station, Texas).
Ethical and Regulatory Oversight
This study was approved by the Institutional Review Board at the University of Michigan (IRB#HUM00118168).
RESULTS
Of the 133 PICCs placed preintervention, 64.7% (n = 86) were single lumen, 33.1% (n = 44) were double lumen, and 2.3% (n = 3) were triple lumen. Compared with the preintervention period, the use of single-lumen PICCs significantly increased following the intervention (64.7% to 93.6%; P < .001; Figure 1). As well, the proportion of PICCs with an inappropriate number of lumens decreased from 25.6% to 2.2% (P < .001; Table 1).
Preintervention, 14.3% (95% CI = 8.34-20.23) of the patients with PICCs experienced at least one complication (n = 19). Following the intervention, 15.1% (95% CI = 7.79-22.32) of the 93 patients with PICCs experienced at least one complication (absolute difference = 0.8%, P = .872). With respect to individual complications, CLABSI decreased from 5.3% (n = 7; 95% CI = 1.47-9.06) to 2.2% (n = 2; 95% CI = −0.80-5.10) (P = .239). Similarly, the incidence of catheter occlusion decreased from 8.3% (n = 11; 95% CI = 3.59-12.95) to 6.5% (n = 6; 95% CI = 1.46-11.44; P = .610; Table). Notably, only 12.1% (n = 21) of patients with a single-lumen PICC experienced any complication, whereas 20.0% (n = 10) of patients with a double lumen, and 66.7% (n = 2) with a triple lumen experienced a PICC-associated complication (P = .022). Patients with triple lumens had a significantly higher incidence of catheter occlusion compared with patients that received double- and single-lumen PICCs (66.7% vs. 12.0% and 5.2%, respectively; P = .003).
No patient who received a single-lumen device required a second procedure for the placement of a device with additional lumens. Similarly, no documentation suggesting an insufficient number of PICC lumens or the need for additional vascular access (eg, placement of additional PICCs) was found in medical records of patients postintervention. Pharmacists supporting the interventions and VAST team members reported no disagreements when discussing number of lumens or appropriateness of catheter choice.
DISCUSSION
In this single center, pre–post quasi-experimental study, a multimodal intervention based on the MAGIC criteria significantly reduced the use of multilumen PICCs. Additionally, a trend toward reductions in complications, including CLABSI and catheter occlusion, was also observed. Notably, these changes in ordering practices did not lead to requests for additional devices or replacement with a multilumen PICC when a single-lumen device was inserted. Collectively, our findings suggest that the use of single-lumen devices in a large direct care service can be feasibly and safely increased through this approach. Larger scale studies that implement MAGIC to inform placement of multilumen PICCs and reduce PICC-related complications now appear necessary.
The presence of a PICC, even for short periods, significantly increases the risk of CLABSI and is one of the strongest predictors of venous thrombosis risk in the hospital setting.19,24,25 Although some factors that lead to this increased risk are patient-related and not modifiable (eg, malignancy or intensive care unit status), increased risk linked to the gauge of PICCs and the number of PICC lumens can be modified by improving device selection.9,18,26 Deliberate use of PICCs with the least numbers of clinically necessary lumens decreases risk of CLABSI, venous thrombosis and overall cost.17,19,26 Additionally, greater rates of occlusion with each additional PICC lumen may result in the interruption of intravenous therapy, the administration of costly medications (eg, tissue plasminogen activator) to salvage the PICC, and premature removal of devices should the occlusion prove irreversible.8
We observed a trend toward decreased PICC complications following implementation of our criteria, especially for the outcomes of CLABSI and catheter occlusion. Given the pilot nature of this study, we were underpowered to detect a statistically significant change in PICC adverse events. However, we did observe a statistically significant increase in the rate of single-lumen PICC use following our intervention. Notably, this increase occurred in the setting of high rates of single-lumen PICC use at baseline (64%). Therefore, an important takeaway from our findings is that room for improving PICC appropriateness exists even among high performers. This finding In turn, high baseline use of single-lumen PICCs may also explain why a robust reduction in PICC complications was not observed in our study, given that other studies showing reduction in the rates of complications began with considerably low rates of single-lumen device use.19 Outcomes may improve, however, if we expand and sustain these changes or expand to larger settings. For example, (based on assumptions from a previously published simulation study and our average hospital medicine daily census of 98 patients) the increased use of single-over multilumen PICCs is expected to decrease CLABSI events and venous thrombosis episodes by 2.4-fold in our hospital medicine service with an associated cost savings of $74,300 each year.17 Additionally, we would also expect the increase in the proportion of single-lumen PICCs to reduce rates of catheter occlusion. This reduction, in turn, would lessen interruptions in intravenous therapy, the need for medications to treat occlusion, and the need for device replacement all leading to reduced costs.27 Overall, then, our intervention (informed by appropriateness criteria) provides substantial benefits to hospital savings and patient safety.
After our intervention, 98% of all PICCs placed were found to comply with appropriate criteria for multilumen PICC use. We unexpectedly found that the most important factor driving our findings was not oversight or order modification by the pharmacy team or VAST nurses, but rather better decisions made by physicians at the outset. Specifically, we did not find a single instance wherein the original PICC order was changed to a device with a different number of lumens after review from the VAST team. We attribute this finding to receptiveness of physicians to change ordering practices following education and the redesign of the default EMR PICC order, both of which provided a scientific rationale for multilumen PICC use. Clarifying the risk and criteria of the use of multilumen devices along with providing an EMR ordering process that supports best practice helped hospitalists “do the right thing”. Additionally, setting single-lumen devices as the preselected EMR order and requiring text-based justification for placement of a multilumen PICC helped provide a nudge to physicians, much as it has done with antibiotic choices.28
Our study has limitations. First, we were only able to identify complications that were captured by our EMR. Given that over 70% of the patients in our study were discharged with a PICC in place, we do not know whether complications may have developed outside the hospital. Second, our intervention was resource intensive and required partnership with pharmacy, VAST, and hospitalists. Thus, the generalizability of our intervention to other institutions without similar support is unclear. Third, despite an increase in the use of single-lumen PICCs and a decrease in multilumen devices, we did not observe a significant reduction in all types of complications. While our high rate of single-lumen PICC use may account for these findings, larger scale studies are needed to better study the impact of MAGIC and appropriateness criteria on PICC complications. Finally, given our approach, we cannot identify the most effective modality within our bundled intervention. Stepped wedge or single-component studies are needed to further address this question.
In conclusion, we piloted a multimodal intervention to promote the use of single-lumen PICCs while lowering the use of multilumen devices. By using MAGIC to create appropriate indications, the use of multilumen PICCs declined and complications trended downwards. Larger, multicenter studies to validate our findings and examine the sustainability of this intervention would be welcomed.
Disclosures
The authors have nothing to disclose.
1. Chopra V, Flanders SA, Saint S, et al. The Michigan Appropriateness Guide for Intravenous Catheters (MAGIC): Results from a multispecialty panel using the RAND/UCLA appropriateness method. Ann Intern Med. 2015;163(6 Suppl):S1-S40. doi: 10.7326/M15-0744. PubMed
2. Taylor RW, Palagiri AV. Central venous catheterization. Crit Care Med. 2007;35(5):1390-1396. doi: 10.1097/01.CCM.0000260241.80346.1B. PubMed
3. Pikwer A, Akeson J, Lindgren S. Complications associated with peripheral or central routes for central venous cannulation. Anaesthesia. 2012;67(1):65-71. doi: 10.1111/j.1365-2044.2011.06911.x. PubMed
4. Johansson E, Hammarskjold F, Lundberg D, Arnlind MH. Advantages and disadvantages of peripherally inserted central venous catheters (PICC) compared to other central venous lines: a systematic review of the literature. Acta Onco. 2013;52(5):886-892. doi: 10.3109/0284186X.2013.773072. PubMed
5. Pan L, Zhao Q, Yang X. Risk factors for venous thrombosis associated with peripherally inserted central venous catheters. Int J Clin Exp Med. 2014;7(12):5814-5819. PubMed
6. Herc E, Patel P, Washer LL, Conlon A, Flanders SA, Chopra V. A model to predict central-line-associated bloodstream infection among patients with peripherally inserted central catheters: The MPC score. Infect Cont Hosp Ep. 2017;38(10):1155-1166. doi: 10.1017/ice.2017.167. PubMed
7. Maki DG, Kluger DM, Crnich CJ. The risk of bloodstream infection in adults with different intravascular devices: a systematic review of 200 published prospective studies. Mayo Clin Proc. 2006;81(9):1159–1171. doi: 10.4065/81.9.1159. PubMed
8. Smith SN, Moureau N, Vaughn VM, et al. Patterns and predictors of peripherally inserted central catheter occlusion: The 3P-O study. J Vasc Interv Radiol. 2017;28(5):749-756.e742. doi: 10.1016/j.jvir.2017.02.005. PubMed
9. Chopra V, Anand S, Hickner A, et al. Risk of venous thromboembolism associated with peripherally inserted central catheters: a systematic review and meta-analysis. Lancet. 2013;382(9889):311-325. doi: 10.1016/S0140-6736(13)60592-9. PubMed
10. Chopra V, Ratz D, Kuhn L, Lopus T, Lee A, Krein S. Peripherally inserted central catheter-related deep vein thrombosis: contemporary patterns and predictors. J Thromb Haemost. 2014;12(6):847-854. doi: 10.1111/jth.12549. PubMed
11. Carter JH, Langley JM, Kuhle S, Kirkland S. Risk factors for central venous catheter-associated bloodstream infection in pediatric patients: A cohort study. Infect Control Hosp Epidemiol. 2016;37(8):939-945. doi: 10.1017/ice.2016.83. PubMed
12. Chopra V, Ratz D, Kuhn L, Lopus T, Chenoweth C, Krein S. PICC-associated bloodstream infections: prevalence, patterns, and predictors. Am J Med. 2014;127(4):319-328. doi: 10.1016/j.amjmed.2014.01.001. PubMed
13. O’Grady NP, Alexander M, Burns LA, et al. Guidelines for the prevention of intravascular catheter-related infections. Clin Infect Dis. 2011;52(9):e162-e193. doi: 10.1093/cid/cir257. PubMed
14. Parkinson R, Gandhi M, Harper J, Archibald C. Establishing an ultrasound guided peripherally inserted central catheter (PICC) insertion service. Clin Radiol. 1998;53(1):33-36. doi: 10.1016/S0009-9260(98)80031-7. PubMed
15. Shannon RP, Patel B, Cummins D, Shannon AH, Ganguli G, Lu Y. Economics of central line--associated bloodstream infections. Am J Med Qual. 2006;21(6 Suppl):7s–16s. doi: 10.1177/1062860606294631. PubMed
16. Mermis JD, Strom JC, Greenwood JP, et al. Quality improvement initiative to reduce deep vein thrombosis associated with peripherally inserted central catheters in adults with cystic fibrosis. Ann Am Thorac Soc. 2014;11(9):1404-1410. doi: 10.1513/AnnalsATS.201404-175OC. PubMed
17. Ratz D, Hofer T, Flanders SA, Saint S, Chopra V. Limiting the number of lumens in peripherally inserted central catheters to improve outcomes and reduce cost: A simulation study. Infect Control Hosp Epidemiol. 2016;37(7):811-817. doi: 10.1017/ice.2016.55. PubMed
18. Chopra V, Anand S, Krein SL, Chenoweth C, Saint S. Bloodstream infection, venous thrombosis, and peripherally inserted central catheters: reappraising the evidence. Am J Med. 2012;125(8):733-741. doi: 10.1016/j.amjmed.2012.04.010. PubMed
19. O’Brien J, Paquet F, Lindsay R, Valenti D. Insertion of PICCs with minimum number of lumens reduces complications and costs. J Am Coll Radiol. 2013;10(11):864-868. doi: 10.1016/j.jacr.2013.06.003. PubMed
20. Tiwari MM, Hermsen ED, Charlton ME, Anderson JR, Rupp ME. Inappropriate intravascular device use: a prospective study. J Hosp Infect. 2011;78(2):128-132. doi: 10.1016/j.jhin.2011.03.004. PubMed
21. Chopra V, Kuhn L, Flanders SA, Saint S, Krein SL. Hospitalist experiences, practice, opinions, and knowledge regarding peripherally inserted central catheters: results of a national survey. J Hosp Med. 2013;8(11):635-638. doi: 10.1002/jhm.2095. PubMed
22. Goodman D, Ogrinc G, Davies L, et al. Explanation and elaboration of the SQUIRE (Standards for Quality Improvement Reporting Excellence) Guidelines, V.2.0: examples of SQUIRE elements in the healthcare improvement literature. BMJ Qual Saf. 2016;25(12):e7. doi: 10.1136/bmjqs-2015-004480. PubMed
23. CDC Bloodstream Infection/Device Associated Infection Module. https://wwwcdcgov/nhsn/pdfs/pscmanual/4psc_clabscurrentpdf 2017. Accessed April 11, 2017.
24. Woller SC, Stevens SM, Jones JP, et al. Derivation and validation of a simple model to identify venous thromboembolism risk in medical patients. Am J Med. 2011;124(10):947-954.e2. doi: 10.1016/j.amjmed.2011.06.004. PubMed
25. Paje D, Conlon A, Kaatz S, et al. Patterns and predictors of short-term peripherally inserted central catheter use: A multicenter prospective cohort study. J Hosp Med. 2018;13(2):76-82. doi: 10.12788/jhm.2847. PubMed
26. Evans RS, Sharp JH, Linford LH, et al. Reduction of peripherally inserted central catheter-associated DVT. Chest. 2013;143(3):627-633. doi: 10.1378/chest.12-0923. PubMed
27. Smith S, Moureau N, Vaughn VM, et al. Patterns and predictors of peripherally inserted central catheter occlusion: The 3P-O study. J Vasc Interv Radiol. 2017;28(5):749-756.e2. doi: 10.1016/j.jvir.2017.02.005. PubMed
28. Vaughn VM, Linder JA. Thoughtless design of the electronic health record drives overuse, but purposeful design can nudge improved patient care. BMJ Qual Saf. 2018;27(8):583-586. doi: 10.1136/bmjqs-2017-007578. PubMed
© 2019 Society of Hospital Medicine
Accuracy Comparisons between Manual and Automated Respiratory Rate for Detecting Clinical Deterioration in Ward Patients
Respiratory rate is the most accurate vital sign for predicting adverse outcomes in ward patients.1,2 Though other vital signs are typically collected by using machines, respiratory rate is collected manually by caregivers counting the breathing rate. However, studies have shown significant discrepancies between a patient’s respiratory rate documented in the medical record, which is often 18 or 20, and the value measured by counting the rate over a full minute.3 Thus, despite the high accuracy of respiratory rate, it is possible that these values do not represent true patient physiology. It is unknown whether a valid automated measurement of respiratory rate would be more predictive than a manually collected respiratory rate for identifying patients who develop deterioration. The aim of this study was to compare the distribution and predictive accuracy of manually and automatically recorded respiratory rates.
METHODS
In this prospective cohort study, adult patients admitted to one oncology ward at the University of Chicago from April 2015 to May 2016 were approached for consent (Institutional Review Board #14-0682). Enrolled patients were fit with a cableless, FDA-approved respiratory pod device (Philips IntelliVue clResp Pod; Philips Healthcare, Andover, MA) that automatically recorded respiratory rate and heart rate every 15 minutes while they remained on the ward. Pod data were paired with vital sign data documented in the electronic health record (EHR) by taking the automated value closest, but prior to, the manual value up to a maximum of 4 hours. Automated and manual respiratory rate were compared by using the area under the receiver operating characteristic curve (AUC) for whether an intensive care unit (ICU) transfer occurred within 24 hours of each paired observation without accounting for patient-level clustering.
RESULTS

DISCUSSION
In this prospective cohort study, we found that manual respiratory rates were different than those collected from an automated system and, yet, were significantly more accurate for predicting ICU transfer. These results suggest that the predictive accuracy of respiratory rates documented in the EHR is due to more than just physiology. Our findings have important implications for the risk stratification of ward patients.
Though previous literature has suggested that respiratory rate is the most accurate predictor of deterioration, this may not be true.1 Respiratory rates manually recorded by clinical staff may contain information beyond pure physiology, such as a proxy of clinician concern, which may inflate the predictive value. Nursing staff may record standard respiratory rate values for patients that appear to be well (eg, 18) but count actual rates for those patients they suspect have a more severe disease, which is one possible explanation for our findings. In addition, automated assessments are likely to be more sensitive to intermittent fluctuations in respiratory rate associated with patient movement or emotion. This might explain the improved accuracy at higher rates for manually recorded vital signs.
Although limited by its small sample size, our results have important implications for patient monitoring and early warning scores designed to identify high-risk ward patients given that both simple scores and statistically derived models include respiratory rates as a predictor.4 As hospitals move to use newer technologies to automate vital sign monitoring and decrease nursing workload, our findings suggest that accuracy for identifying high-risk patients may be lost. Additional methods for capturing subjective assessments from clinical providers may be necessary and could be incorporated into risk scores.5 For example, the 7-point subjective Patient Acuity Rating has been shown to augment the Modified Early Warning Score for predicting ICU transfer, rapid response activation, or cardiac arrest within 24 hours.6
Manually recorded respiratory rate may include information beyond pure physiology, which inflates its predictive value. This has important implications for the use of automated monitoring technology in hospitals and the integration of these measurements into early warning scores.
Acknowledgments
The authors thank Pamela McCall, BSN, OCN for her assistance with study implementation, Kevin Ig-Izevbekhai and Shivraj Grewal for assistance with data collection, UCM Clinical Engineering for technical support, and Timothy Holper, MS, Julie Johnson, MPH, RN, and Thomas Sutton for assistance with data abstraction.
Disclosure
Dr. Churpek is supported by a career development award from the National Heart, Lung, and Blood Institute (K08 HL121080) and has received honoraria from Chest for invited speaking engagements. Dr. Churpek and Dr. Edelson have a patent pending (ARCD. P0535US.P2) for risk stratification algorithms for hospitalized patients. In addition, Dr. Edelson has received research support from Philips Healthcare (Andover, MA), research support from the American Heart Association (Dallas, TX) and Laerdal Medical (Stavanger, Norway), and research support from EarlySense (Tel Aviv, Israel). She has ownership interest in Quant HC (Chicago, IL), which is developing products for risk stratification of hospitalized patients. This study was supported by a grant from Philips Healthcare in Andover, MA. The sponsor had no role in data collection, interpretation of results, or drafting of the manuscript.
1. Churpek MM, Yuen TC, Huber MT, Park SY, Hall JB, Edelson DP. Predicting cardiac arrest on the wards: a nested case-control study. Chest. 2012;141(5):1170-1176. PubMed
2. Fieselmann JF, Hendryx MS, Helms CM, Wakefield DS. Respiratory rate predicts cardiopulmonary arrest for internal medicine inpatients. J Gen Intern Med. 1993;8(7):354-360. PubMed
3. Semler MW, Stover DG, Copland AP, et al. Flash mob research: a single-day, multicenter, resident-directed study of respiratory rate. Chest. 2013;143(6):1740-1744. PubMed
4. Churpek MM, Yuen TC, Edelson DP. Risk stratification of hospitalized patients on the wards. Chest. 2013;143(6):1758-1765. PubMed
5. Edelson DP, Retzer E, Weidman EK, et al. Patient acuity rating: quantifying clinical judgment regarding inpatient stability. J Hosp Med. 2011;6(8):475-479. PubMed
6. Patel AR, Zadravecz FJ, Young RS, Williams MV, Churpek MM, Edelson DP. The value of clinical judgment in the detection of clinical deterioration. JAMA Intern Med. 2015;175(3):456-458. PubMed
Respiratory rate is the most accurate vital sign for predicting adverse outcomes in ward patients.1,2 Though other vital signs are typically collected by using machines, respiratory rate is collected manually by caregivers counting the breathing rate. However, studies have shown significant discrepancies between a patient’s respiratory rate documented in the medical record, which is often 18 or 20, and the value measured by counting the rate over a full minute.3 Thus, despite the high accuracy of respiratory rate, it is possible that these values do not represent true patient physiology. It is unknown whether a valid automated measurement of respiratory rate would be more predictive than a manually collected respiratory rate for identifying patients who develop deterioration. The aim of this study was to compare the distribution and predictive accuracy of manually and automatically recorded respiratory rates.
METHODS
In this prospective cohort study, adult patients admitted to one oncology ward at the University of Chicago from April 2015 to May 2016 were approached for consent (Institutional Review Board #14-0682). Enrolled patients were fit with a cableless, FDA-approved respiratory pod device (Philips IntelliVue clResp Pod; Philips Healthcare, Andover, MA) that automatically recorded respiratory rate and heart rate every 15 minutes while they remained on the ward. Pod data were paired with vital sign data documented in the electronic health record (EHR) by taking the automated value closest, but prior to, the manual value up to a maximum of 4 hours. Automated and manual respiratory rate were compared by using the area under the receiver operating characteristic curve (AUC) for whether an intensive care unit (ICU) transfer occurred within 24 hours of each paired observation without accounting for patient-level clustering.
RESULTS
DISCUSSION
In this prospective cohort study, we found that manual respiratory rates were different than those collected from an automated system and, yet, were significantly more accurate for predicting ICU transfer. These results suggest that the predictive accuracy of respiratory rates documented in the EHR is due to more than just physiology. Our findings have important implications for the risk stratification of ward patients.
Though previous literature has suggested that respiratory rate is the most accurate predictor of deterioration, this may not be true.1 Respiratory rates manually recorded by clinical staff may contain information beyond pure physiology, such as a proxy of clinician concern, which may inflate the predictive value. Nursing staff may record standard respiratory rate values for patients that appear to be well (eg, 18) but count actual rates for those patients they suspect have a more severe disease, which is one possible explanation for our findings. In addition, automated assessments are likely to be more sensitive to intermittent fluctuations in respiratory rate associated with patient movement or emotion. This might explain the improved accuracy at higher rates for manually recorded vital signs.
Although limited by its small sample size, our results have important implications for patient monitoring and early warning scores designed to identify high-risk ward patients given that both simple scores and statistically derived models include respiratory rates as a predictor.4 As hospitals move to use newer technologies to automate vital sign monitoring and decrease nursing workload, our findings suggest that accuracy for identifying high-risk patients may be lost. Additional methods for capturing subjective assessments from clinical providers may be necessary and could be incorporated into risk scores.5 For example, the 7-point subjective Patient Acuity Rating has been shown to augment the Modified Early Warning Score for predicting ICU transfer, rapid response activation, or cardiac arrest within 24 hours.6
Manually recorded respiratory rate may include information beyond pure physiology, which inflates its predictive value. This has important implications for the use of automated monitoring technology in hospitals and the integration of these measurements into early warning scores.
Acknowledgments
The authors thank Pamela McCall, BSN, OCN for her assistance with study implementation, Kevin Ig-Izevbekhai and Shivraj Grewal for assistance with data collection, UCM Clinical Engineering for technical support, and Timothy Holper, MS, Julie Johnson, MPH, RN, and Thomas Sutton for assistance with data abstraction.
Disclosure
Dr. Churpek is supported by a career development award from the National Heart, Lung, and Blood Institute (K08 HL121080) and has received honoraria from Chest for invited speaking engagements. Dr. Churpek and Dr. Edelson have a patent pending (ARCD. P0535US.P2) for risk stratification algorithms for hospitalized patients. In addition, Dr. Edelson has received research support from Philips Healthcare (Andover, MA), research support from the American Heart Association (Dallas, TX) and Laerdal Medical (Stavanger, Norway), and research support from EarlySense (Tel Aviv, Israel). She has ownership interest in Quant HC (Chicago, IL), which is developing products for risk stratification of hospitalized patients. This study was supported by a grant from Philips Healthcare in Andover, MA. The sponsor had no role in data collection, interpretation of results, or drafting of the manuscript.
1. Churpek MM, Yuen TC, Huber MT, Park SY, Hall JB, Edelson DP. Predicting cardiac arrest on the wards: a nested case-control study. Chest. 2012;141(5):1170-1176. PubMed
2. Fieselmann JF, Hendryx MS, Helms CM, Wakefield DS. Respiratory rate predicts cardiopulmonary arrest for internal medicine inpatients. J Gen Intern Med. 1993;8(7):354-360. PubMed
3. Semler MW, Stover DG, Copland AP, et al. Flash mob research: a single-day, multicenter, resident-directed study of respiratory rate. Chest. 2013;143(6):1740-1744. PubMed
4. Churpek MM, Yuen TC, Edelson DP. Risk stratification of hospitalized patients on the wards. Chest. 2013;143(6):1758-1765. PubMed
5. Edelson DP, Retzer E, Weidman EK, et al. Patient acuity rating: quantifying clinical judgment regarding inpatient stability. J Hosp Med. 2011;6(8):475-479. PubMed
6. Patel AR, Zadravecz FJ, Young RS, Williams MV, Churpek MM, Edelson DP. The value of clinical judgment in the detection of clinical deterioration. JAMA Intern Med. 2015;175(3):456-458. PubMed
© 2018 Society of Hospital Medicine
Association between opioid and benzodiazepine use and clinical deterioration in ward patients
Chronic opioid and benzodiazepine use is common and increasing.1-5 Outpatient use of these medications has been associated with hospital readmission and death,6-12 with concurrent use associated with particularly increased risk.13,14 Less is known about outcomes for hospitalized patients receiving these medications.
More than half of hospital inpatients in the United States receive opioids,15 many of which are new prescriptions rather than continuation of chronic therapy.16,17 Less is known about inpatient benzodiazepine administration, but the prevalence may exceed 10% among elderly populations.18 Hospitalized patients often have comorbidities or physiological disturbances that might increase their risk related to use of these medications. Opioids can cause central and obstructive sleep apneas,19-21 and benzodiazepines contribute to respiratory depression and airway relaxation.22 Benzodiazepines also impair psychomotor function and recall,23 which could mediate the recognized risk for delirium and falls in the hospital.24,25 These findings suggest pathways by which these medications might contribute to clinical deterioration.
Most studies in hospitalized patients have been limited to specific populations15,26-28 and have not explicitly controlled for severity of illness over time. It remains unclear whether associations identified within particular groups of patients hold true for the broader population of general ward inpatients. Therefore, we aimed to determine the independent association between opioid and benzodiazepine administration and clinical deterioration in ward patients.
MATERIALS AND METHODS
Setting and Study Population
We performed an observational cohort study at a 500-bed urban academic hospital. Data were obtained from all adults hospitalized on the wards between November 1, 2008, and January 21, 2016. The study protocol was approved by the University of Chicago Institutional Review Board (IRB#15-0195).
Data Collection
The study utilized de-identified data from the electronic health record (EHR; Epic Systems Corporation, Verona, Wisconsin) and administrative databases collected by the University of Chicago Clinical Research Data Warehouse. Patient age, sex, race, body mass index (BMI), and ward admission source (ie, emergency department (ED), transferred from the intensive care unit (ICU), or directly admitted to the wards) were collected. International Classification of Diseases, 9th Revision, Clinical Modification (ICD-9-CM) codes were used to identify Elixhauser Comorbidity Index categories.29,30 Because patients with similar diagnoses (eg, active cancer) are cohorted within particular areas in our hospital, we obtained the ward unit for all patients. Patients who underwent surgery were identified using the hospital’s admission-transfer-discharge database.
To determine severity of illness, routinely collected vital signs and laboratory values were utilized to calculate the electronic cardiac arrest risk triage (eCART) score, an accurate risk score we previously developed and validated for predicting adverse events among ward patients.31 If any vital sign or laboratory value was missing, the next available measurement was carried forward. If any value remained missing after this change, the median value for that location (ie, wards, ICU, or ED) was imputed.32,33 Additionally, patient-reported pain scores at the time of opioid administration were extracted from nursing flowsheets. If no pain score was present at the time of opioid administration, the patient’s previous score was carried forward.
We excluded patients with sickle-cell disease or seizure history and admissions with diagnoses of alcohol withdrawal from the analysis, because these diagnoses were expected to be associated with different medication administration practices compared to other inpatients. We also excluded patients with a tracheostomy because we expected their respiratory monitoring to differ from the other patients in our cohort. Finally, because ward deaths resulting from a comfort care scenario often involve opioids and/or benzodiazepines, ward segments involving comfort care deaths (defined as death without attempted resuscitation) were excluded from the analysis (Supplemental Figure 1). Patients with sickle-cell disease were identified using ICD-9 codes, and encounters during which a seizure may have occurred were identified using a combination of ICD-9 codes and receipt of anti-epileptic medication (Supplemental Table 1). Patients at risk for alcohol withdrawal were identified by the presence of any Clinical Institute Withdrawal Assessment for Alcohol score within nursing flowsheets, and patients with tracheostomies were identified using documentation of ventilator support within their first 12 hours on the wards. In addition to these exclusion criteria, patients with obstructive sleep apnea (OSA) were identified by the following ICD-9 codes: 278.03, 327.23, 780.51, 780.53, and 780.57.
Medications
Ward administrations of opioids and benzodiazepines—dose, route, and administration time—were collected from the EHR. We excluded all administrations in nonward locations such as the ED, ICU, operating room, or procedure suite. Additionally, because patients emergently intubated may receive sedative and analgesic medications to facilitate intubation, and because patients experiencing cardiac arrest are frequently intubated periresuscitation, we a priori excluded all administrations within 15 minutes of a ward cardiac arrest or an intubation.
For consistent comparisons, opioid doses were converted to oral morphine equivalents34 and adjusted by a factor of 15 to reflect the smallest routinely available oral morphine tablet in our hospital (Supplemental Table 2). Benzodiazepine doses were converted to oral lorazepam equivalents (Supplemental Table 2).34 Thus, the independent variables were oral morphine or lorazepam equivalents administered within each 6-hour window. We a priori presumed opioid doses greater than the 99th percentile (1200 mg) or benzodiazepine doses greater than 10 mg oral lorazepam equivalents within a 6-hour window to be erroneous entries, and replaced these outlier values with the median value for each medication category.
Outcomes
The primary outcome was the composite of ICU transfer or cardiac arrest (loss of pulse with attempted resuscitation) on the wards, with individual outcomes investigated secondarily. An ICU transfer (patient movement from a ward directly to the ICU) was identified using the hospital’s admission-transfer-discharge database. Cardiac arrests were identified using a prospectively validated quality improvement database.35
Because deaths on the wards resulted either from cardiac arrest or from a comfort care scenario, mortality was not studied as an outcome.
Statistical Analysis
Patient characteristics were compared using Student t tests, Wilcoxon rank sum tests, and chi-squared statistics, as appropriate. Unadjusted and adjusted models were created using discrete-time survival analysis,36-39 which involved dividing time into discrete 6-hour intervals and employing the predictor variables chronologically closest to the beginning of each time window to forecast whether the outcome occurred within each interval. Predictor variables in the adjusted model included patient characteristics (age, sex, BMI, and Elixhauser Agency for Healthcare Research and Quality-Web comorbidities30 [a priori excluding comorbidities recorded for fewer than 1000 admissions from the model]), ward unit, surgical status, prior ICU admission during the hospitalization, cumulative opioid or benzodiazepine dose during the previous 24 hours, and severity of illness (measured by eCART score). The adjusted model for opioids also included the patient’s pain score. Age, eCART score, and pain score were entered linearly while race, BMI (underweight, less than 18.5 kg/m2; normal, 18.5-24.9 kg/m2; overweight, 25.0-29.9 kg/m2; obese, 30-39.9 kg/m2; and severely obese, 40 mg/m2 or greater), and ward unit were modeled as categorical variables.
Since repeat hospitalization could confound the results of our study, we performed a sensitivity analysis including only 1 randomly selected hospital admission per patient. We also performed a sensitivity analysis including receipt of both opioids and benzodiazepines, and an interaction term within each ward segment, as well as an analysis in which zolpidem—the most commonly administered nonbenzodiazepine hypnotic medication in our hospital—was included along with both opioids and benzodiazepines. Finally, we performed a sensitivity analysis replacing missing pain scores with imputed values ranging from 0 to the median ward pain score.
We also performed subgroup analyses of adjusted models across age quartiles and for each BMI category, as well as for surgical status, OSA status, gender, time of medication administration, and route of administration (intravenous vs. oral). We also performed an analysis across pain score severity40 to determine whether these medications produce differential effects at various levels of pain.
All tests of significance used a 2-sided P value less than 0.05. Statistical analyses were completed using Stata version 14.1 (StataCorp, LLC, College Station, Texas).

RESULTS
Patient Characteristics
A total of 144,895 admissions, from 75,369 patients, had ward vital signs or laboratory values documented during the study period. Ward segments from 634 admissions were excluded due to comfort care status, which resulted in exclusion of 479 complete patient admissions. Additionally, 139 patients with tracheostomies were excluded. Furthermore, 2934 patient admissions with a sickle-cell diagnosis were excluded, of which 95% (n = 2791) received an opioid and 11% (n = 310) received a benzodiazepine. Another 14,029 admissions associated with seizures, 6134 admissions involving alcohol withdrawal, and 1332 with both were excluded, of which 66% (n = 14,174) received an opioid and 35% (n = 7504) received a benzodiazepine. After exclusions, 120,518 admissions were included in the final analysis, with 67% (n = 80,463) associated with at least 1 administration of an opioid and 21% (n = 25,279) associated with at least 1 benzodiazepine administration.
In total, there were 672,851 intervals when an opioid was administered during the study, with a median dose of 12 mg oral morphine equivalents (interquartile range, 8-30). Of these, 21,634 doses were replaced due to outlier status outside the 99th percentile. Patients receiving opioids were younger (median age 56 vs 61 years), less likely to be African American (48% vs 59%), more likely to have undergone surgery (18% vs 6%), and less likely to have most noncancer medical comorbidities than those who never received an opioid (all P < 0.001) (Table 1).
Additionally, there were a total of 98,286 6-hour intervals in which a benzodiazepine was administered in the study, with a median dose of 1 mg oral lorazepam (interquartile range, 0.5-1). A total of 790 doses of benzodiazepines (less than 1%) were replaced due to outlier status. Patients who received benzodiazepines were more likely to be male (49% vs. 41%), less likely to be African-American, less likely to be obese or morbidly obese (33% vs. 39%), and more likely to have medical comorbidities compared to patients who never received a benzodiazepine (all P < 0.001) (Table 1).
The eCART scores were similar between all patient groups. The frequency of missing variables differed by data type, with vital signs rarely missing (all less than 1.1% except AVPU [10%]), followed by hematology labs (8%-9%), electrolytes and renal function results (12%-15%), and hepatic function tests (40%-45%). In addition to imputed data for missing vital signs and laboratory values, our model omitted human immunodeficiency virus/acquired immune deficiency syndrome and peptic ulcer disease from the adjusted models on the basis of fewer than 1000 admissions with these diagnoses listed.

Patient Outcomes
The incidence of the composite outcome was higher in admissions with at least 1 opioid medication than those without an opioid (7% vs. 4%, P < 0.001), and in admissions with at least 1 dose of benzodiazepines compared to those without a benzodiazepine (11% vs. 4%, P < 0.001) (Table 2).
Within 6-hour segments, increasing doses of opioids were associated with an initial decrease in the frequency of the composite outcome followed by a dose-related increase in the frequency of the composite outcome with morphine equivalents greater than 45 mg. By contrast, the frequency of the composite outcome increased with additional benzodiazepine equivalents (Figure).
In the adjusted model, opioid administration was associated with increased risk for the composite outcome (Table 3) in a dose-dependent fashion, with each 15 mg oral morphine equivalent associated with a 1.9% increase in the odds of ICU transfer or cardiac arrest within the subsequent 6-hour time interval (odds ratio [OR], 1.019; 95% confidence interval [CI], 1.013-1.026; P < 0.001).

Similarly, benzodiazepine administration was also associated with increased adjusted risk for the composite outcome within 6 hours in a dose-dependent manner. Each 1 mg oral lorazepam equivalent was associated with a 29% increase in the odds of ward cardiac arrest or ICU transfer (OR, 1.29; 95% CI, 1.16-1.44; P < 0.001) (Table 3).
Sensitivity Analyses
A sensitivity analysis including 1 randomly selected hospitalization per patient involved 67,097 admissions and found results similar to the primary analysis, with each 15 mg oral morphine equivalent associated with a 1.9% increase in the odds of the composite outcome (OR, 1.019; 95% CI, 1.011-1.028; P < 0.001) and each 1 mg oral lorazepam equivalent associated with a 41% increase in the odds of the composite outcome (OR, 1.41; 95% CI, 1.21-1.65; P < 0.001). Inclusion of both opioids and benzodiazepines in the adjusted model again yielded results similar to the main analysis for both opioids (OR, 1.020; 95% CI, 1.013-1.026; P < 0.001) and benzodiazepines (OR, 1.35; 95% CI, 1.18-1.54; P < 0.001), without a significant interaction detected (P = 0.09). These results were unchanged with the addition of zolpidem to the model as an additional potential confounder, and zolpidem did not increase the risk of the study outcomes (P = 0.2).
A final sensitivity analysis for the opioid model involved replacing missing pain scores with imputed values ranging from 0 to the median ward score, which was 5. The results of these analyses did not differ from the primary model and were consistent regardless of imputation value (OR, 1.018; 95% CI, 1.012-1.023; P < 0.001).
Subgroup Analyses
Analyses of opioid administration by subgroup (sex, age quartiles, BMI categories, OSA diagnosis, surgical status, daytime/nighttime medication administration, IV/PO administration, and pain severity) yielded similar results to the overall analysis (Supplemental Figure 2). Subgroup analysis of patients receiving benzodiazepines revealed similarly increased adjusted odds of the composite outcome across strata of gender, BMI, surgical status, and medication administration time (Supplemental Figure 3). Notably, patients older than 70 years who received a benzodiazepine were at 64% increased odds of the composite outcome (OR, 1.64; 95% CI, 1.30-2.08), compared to 2% to 38% increased risk for patients under 70 years. Finally, IV doses of benzodiazepines were associated with 48% increased odds for deterioration (OR, 1.48; 95% CI, 1.18-1.84; P = 0.001), compared to a nonsignificant 14% increase in the odds for PO doses (OR, 1.14; 95% CI, 0.99-1.31; P = 0.066).
DISCUSSION
In a large, single-center, observational study of ward inpatients, we found that opioid use was associated with a small but significant increased risk for clinical deterioration on the wards, with every 15 mg oral morphine equivalent increasing the odds of ICU transfer or cardiac arrest in the next 6 hours by 1.9%. Benzodiazepines were associated with a much higher risk: each equivalent of 1 mg of oral lorazepam increased the odds of ICU transfer or cardiac arrest by almost 30%. These results have important implications for care at the bedside of hospitalized ward patients and suggest the need for closer monitoring after receipt of these medications, particularly benzodiazepines.
Previous work has described negative effects of opioid medications among select inpatient populations. In surgical patients, opioids have been associated with hospital readmission, increased length of stay, and hospital mortality.26,28 More recently, Herzig et al.15 found more adverse events in nonsurgical ward patients within the hospitals prescribing opioids the most frequently. These studies may have been limited by the populations studied and the inability to control for confounders such as severity of illness and pain score. Our study expands these findings to a more generalizable population and shows that even after adjustment for potential confounders, such as severity of illness, pain score, and medication dose, opioids are associated with increased short-term risk of clinical deterioration.
By contrast, few studies have characterized the risks associated with benzodiazepine use among ward inpatients. Recently, Overdyk et al.27 found that inpatient use of opioids and sedatives was associated with increased risk for cardiac arrest and hospital death. However, this study included ICU patients, which may confound the results, as ICU patients often receive high doses of opioids or benzodiazepines to facilitate mechanical ventilation or other invasive procedures, while also having a particularly high risk of adverse outcomes like cardiac arrest and inhospital death.
Several mechanisms may explain the magnitude of effect seen with regard to benzodiazepines. First, benzodiazepines may directly produce clinical deterioration by decreased respiratory drive, diminished airway tone, or hemodynamic decompensation. It is possible that the broad spectrum of cardiorespiratory side effects of benzodiazepines—and potential unpredictability of these effects—increases the difficulty of observation and management for patients receiving them. This difficulty may be compounded with intravenous administration of benzodiazepines, which was associated with a higher risk for deterioration than oral doses in our cohort. Alternatively, benzodiazepines may contribute to clinical decompensation by masking signs of deterioration such as encephalopathy or vital sign instability like tachycardia or tachypnea that may be mistaken as anxiety. Notably, while our hospital has a nursing-driven protocol for monitoring patients receiving opioids (in which pain is serially assessed, leading to additional bedside observation), we do not have protocols for ward patients receiving benzodiazepines. Finally, although we found that orders for opioids and benzodiazepines were more common in white patients than African American patients, this finding may be due to differences in the types or number of medical comorbidities experienced by these patients.
Our study has several strengths, including the large number of admissions we included. Additionally, we included a broad range of medical and surgical ward admissions, which should increase the generalizability of our results. Further, our rates of ICU transfer are in line with data reported from other groups,41,42 which again may add to the generalizability of our findings. We also addressed many potential confounders by including patient characteristics, individual ward units, and (for opioids) pain score in our model, and by controlling for severity of illness with the eCART score, an accurate predictor of ICU transfer and ward cardiac arrest within our population.32,37 Finally, our robust methodology allowed us to include acute and cumulative medication doses, as well as time, in the model. By performing a discrete-time survival analysis, we were able to evaluate receipt of opioids and benzodiazepines—as well as risk for clinical deterioration—longitudinally, lending strength to our results.
Limitations of our study include its single-center cohort, which may reduce generalizability to other populations. Additionally, because we could not validate the accuracy of—or adherence to—outpatient medication lists, we were unable to identify chronic opioid or benzodiazepine users by these lists. However, patients chronically taking opioids or benzodiazepines would likely receive doses each hospital day; by including 24-hour cumulative doses in our model, we attempted to adjust for some portion of their chronic use. Also, because evaluation of delirium was not objectively recorded in our dataset, we were unable to evaluate the relationship between receipt of these medications and development of delirium, which is an important outcome for hospitalized patients. Finally, neither the diagnoses for which these medications were prescribed, nor the reason for ICU transfer, were present in our dataset, which leaves open the possibility of unmeasured confounding.
CONCLUSION
After adjustment for important confounders including severity of illness, medication dose, and time, opioids were associated with a slight increase in clinical deterioration on the wards, while benzodiazepines were associated with a much larger risk for deterioration. This finding raises concern about the safety of benzodiazepine use among ward patients and suggests that increased monitoring of patients receiving these medications may be warranted.
Acknowledgment
The authors thank Nicole Twu for administrative support.
Disclosure
Drs. Churpek and Edelson have a patent pending (ARCD. P0535US.P2) for risk stratification algorithms for hospitalized patients. Dr. Churpek is supported by a career development award from the National Heart, Lung, and Blood Institute (K08 HL121080). Dr. Churpek has received honoraria from Chest for invited speaking engagements. In addition, Dr. Edelson has received research support from Philips Healthcare (Andover, Massachusetts), research support from the American Heart Association (Dallas, Texas) and Laerdal Medical (Stavanger, Norway), and research support from Early Sense (Tel Aviv, Israel). She has ownership interest in Quant HC (Chicago, Illinois), which is developing products for risk stratification of hospitalized patients. Dr. Mokhlesi is supported by National Institutes of Health grant R01HL119161. Dr. Mokhlesi has served as a consultant to Philips/Respironics and has received research support from Philips/Respironics. Preliminary versions of these data were presented as a poster presentation at the 2016 meeting of the American Thoracic Society, May 17, 2016; San Francisco, California.
1. Substance Abuse and Mental Health Services Administration. Results from the 2013 National Survey on Drug Use and Health: Summary of National Findings. Rockville, MD: Substance Abuse and Mental Health Services Administration; 2014.
2. Bachhuber MA, Hennessy S, Cunningham CO, Starrels JL. Increasing benzodiazepine prescriptions and overdose mortality in the United States, 1996–2013. Am J Public Health. 2016;106(4):686-688. PubMed
3. Parsells Kelly J, Cook SF, Kaufman DW, Anderson T, Rosenberg L, Mitchell AA. Prevalence and characteristics of opioid use in the US adult population. Pain. 2008;138(3):507-513. PubMed
4. Olfson M, King M, Schoenbaum M. Benzodiazepine use in the United States. JAMA Psychiatry. 2015;72(2):136-142. PubMed
5. Hwang CS, Kang EM, Kornegay CJ, Staffa JA, Jones CM, McAninch JK. Trends in the concomitant prescribing of opioids and benzodiazepines, 2002−2014. Am J Prev Med. 2016;51(2):151-160. PubMed
6. Bohnert AS, Valenstein M, Bair MJ, et al. Association between opioid prescribing patterns and opioid overdose-related deaths. JAMA. 2011;305(13):1315-1321. PubMed
7. Dart RC, Surratt HL, Cicero TJ, et al. Trends in opioid analgesic abuse and mortality in the United States. N Engl J Med. 2015;372(3):241-248. PubMed
8. Centers for Disease Control and Prevention (CDC). Vital signs: overdoses of prescription opioid pain relievers---United States, 1999--2008. MMWR Morb Mortal Wkly Rep. 2011;60(43):1487-1492. PubMed
9. Lan TY, Zeng YF, Tang GJ, et al. The use of hypnotics and mortality - a population-based retrospective cohort study. PLoS One. 2015;10(12):e0145271. PubMed
10. Mosher HJ, Jiang L, Vaughan Sarrazin MS, Cram P, Kaboli P, Vander Weg MW. Prevalence and characteristics of hospitalized adults on chronic opioid therapy: prior opioid use among veterans. J Hosp Med. 2014;9(2):82-87. PubMed
11. Palmaro A, Dupouy J, Lapeyre-Mestre M. Benzodiazepines and risk of death: results from two large cohort studies in France and UK. Eur Neuropsychopharmacol. 2015;25(10):1566-1577. PubMed
12. Parsaik AK, Mascarenhas SS, Khosh-Chashm D, et al. Mortality associated with anxiolytic and hypnotic drugs–a systematic review and meta-analysis. Aust N Z J Psychiatry. 2016;50(6):520-533. PubMed
13. Park TW, Saitz R, Ganoczy D, Ilgen MA, Bohnert AS. Benzodiazepine prescribing patterns and deaths from drug overdose among US veterans receiving opioid analgesics: case-cohort study. BMJ. 2015;350:h2698. PubMed
14. Jones CM, McAninch JK. Emergency department visits and overdose deaths from combined use of opioids and benzodiazepines. Am J Prev Med. 2015;49(4):493-501. PubMed
15. Herzig SJ, Rothberg MB, Cheung M, Ngo LH, Marcantonio ER. Opioid utilization and opioid-related adverse events in nonsurgical patients in US hospitals. J Hosp Med. 2014;9(2):73-81. PubMed
16. Jena AB, Goldman D, Karaca-Mandic P. Hospital prescribing of opioids to Medicare beneficiaries. JAMA Intern Med. 2016;176(7):990-997. PubMed
17. Calcaterra SL, Yamashita TE, Min SJ, Keniston A, Frank JW, Binswanger IA. Opioid prescribing at hospital discharge contributes to chronic opioid use. J Gen Intern Med. 2016;31(5):478-485. PubMed
18. Garrido MM, Prigerson HG, Penrod JD, Jones SC, Boockvar KS. Benzodiazepine and sedative-hypnotic use among older seriously ill veterans: choosing wisely? Clin Ther. 2014;36(11):1547-1554. PubMed
19. Doufas AG, Tian L, Padrez KA, et al. Experimental pain and opioid analgesia in volunteers at high risk for obstructive sleep apnea. PloS One. 2013;8(1):e54807. PubMed
20. Gislason T, Almqvist M, Boman G, Lindholm CE, Terenius L. Increased CSF opioid activity in sleep apnea syndrome. Regression after successful treatment. Chest. 1989;96(2):250-254. PubMed
21. Van Ryswyk E, Antic N. Opioids and sleep disordered breathing. Chest. 2016;150(4):934-944. PubMed
22. Koga Y, Sato S, Sodeyama N, et al. Comparison of the relaxant effects of diazepam, flunitrazepam and midazolam on airway smooth muscle. Br J Anaesth. 1992;69(1):65-69. PubMed
23. Pomara N, Lee SH, Bruno D, et al. Adverse performance effects of acute lorazepam administration in elderly long-term users: pharmacokinetic and clinical predictors. Prog Neuropsychopharmacol Biol Psychiatry. 2015;56:129-135. PubMed
24. Pandharipande P, Shintani A, Peterson J, et al. Lorazepam is an independent risk factor for transitioning to delirium in intensive care unit patients. Anesthesiology. 2006;104(1):21-26. PubMed
25. O’Neil CA, Krauss MJ, Bettale J, et al. Medications and patient characteristics associated with falling in the hospital. J Patient Saf. 2015 (epub ahead of print). PubMed
26. Kessler ER, Shah M, K Gruschkus S, Raju A. Cost and quality implications of opioid-based postsurgical pain control using administrative claims data from a large health system: opioid-related adverse events and their impact on clinical and economic outcomes. Pharmacotherapy. 2013;33(4):383-391. PubMed
27. Overdyk FJ, Dowling O, Marino J, et al. Association of opioids and sedatives with increased risk of in-hospital cardiopulmonary arrest from an administrative database. PLoS One. 2016;11(2):e0150214. PubMed
28. Minkowitz HS, Gruschkus SK, Shah M, Raju A. Adverse drug events among patients receiving postsurgical opioids in a large health system: risk factors and outcomes. Am J Health Syst Pharm. 2014;71(18):1556-1565. PubMed
29. Elixhauser A, Steiner C, Harris DR, Coffey RM. Comorbidity measures for use with administrative data. Med Care. 1998;36(1):8-27. PubMed
30. Quan H, Sundararajan V, Halfon P, et al. Coding algorithms for defining comorbidities in ICD-9-CM and ICD-10 administrative data. Med Care. 2005;43(11):1130-1139. PubMed
31. Churpek MM, Yuen TC, Winslow C, et al. Multicenter development and validation of a risk stratification tool for ward patients. Am J Respir Crit Care Med. 2014;190(6):649-655. PubMed
32. Knaus WA, Wagner DP, Draper EA, Z et al. The APACHE III prognostic system. Risk prediction of hospital mortality for critically ill hospitalized adults. Chest. 1991;100(6):1619-1636. PubMed
33. van den Boogaard M, Pickkers P, Slooter AJC, et al. Development and validation
of PRE-DELIRIC (PREdiction of DELIRium in ICu patients) delirium prediction
model for intensive care patients: observational multicentre study. BMJ.
2012;344:e420. PubMed
34. Clinical calculators. ClinCalc.com. http://www.clincalc.com. Accessed February
21, 2016.
35. Churpek MM, Yuen TC, Huber MT, Park SY, Hall JB, Edelson DP. Predicting
cardiac arrest on the wards: a nested case-control study. Chest. 2012;141(5):
1170-1176. PubMed
36. Churpek MM, Yuen TC, Park SY, Gibbons R, Edelson DP. Using electronic
health record data to develop and validate a prediction model for adverse outcomes
in the wards. Crit Care Med. 2014;42(4):841-848. PubMed
37. Efron B. Logistic regression, survival analysis, and the Kaplan-Meier curve. J Am
Stat Assoc. 1988;83(402):414-425.
38. Gibbons RD, Duan N, Meltzer D, et al; Institute of Medicine Committee. Waiting
for organ transplantation: results of an analysis by an Institute of Medicine Committee.
Biostatistics. 2003;4(2):207-222. PubMed
39. Singer JD, Willett JB. It’s about time: using discrete-time survival analysis to study
duration and the timing of events. J Educ Behav Stat. 1993;18(2):155-195.
40. World Health Organization. Cancer pain relief and palliative care. Report of a
WHO Expert Committee. World Health Organ Tech Rep Ser. 1990;804:1-75. PubMed
41. Bailey TC, Chen Y, Mao Y, et al. A trial of a real-time alert for clinical deterioration
in patients hospitalized on general medical wards. J Hosp Med. 2013;8(5):236-242. PubMed
42. Liu V, Kipnis P, Rizk NW, Escobar GJ. Adverse outcomes associated with delayed
intensive care unit transfers in an integrated healthcare system. J Hosp Med.
2012;7(3):224-230. PubMed
Chronic opioid and benzodiazepine use is common and increasing.1-5 Outpatient use of these medications has been associated with hospital readmission and death,6-12 with concurrent use associated with particularly increased risk.13,14 Less is known about outcomes for hospitalized patients receiving these medications.
More than half of hospital inpatients in the United States receive opioids,15 many of which are new prescriptions rather than continuation of chronic therapy.16,17 Less is known about inpatient benzodiazepine administration, but the prevalence may exceed 10% among elderly populations.18 Hospitalized patients often have comorbidities or physiological disturbances that might increase their risk related to use of these medications. Opioids can cause central and obstructive sleep apneas,19-21 and benzodiazepines contribute to respiratory depression and airway relaxation.22 Benzodiazepines also impair psychomotor function and recall,23 which could mediate the recognized risk for delirium and falls in the hospital.24,25 These findings suggest pathways by which these medications might contribute to clinical deterioration.
Most studies in hospitalized patients have been limited to specific populations15,26-28 and have not explicitly controlled for severity of illness over time. It remains unclear whether associations identified within particular groups of patients hold true for the broader population of general ward inpatients. Therefore, we aimed to determine the independent association between opioid and benzodiazepine administration and clinical deterioration in ward patients.
MATERIALS AND METHODS
Setting and Study Population
We performed an observational cohort study at a 500-bed urban academic hospital. Data were obtained from all adults hospitalized on the wards between November 1, 2008, and January 21, 2016. The study protocol was approved by the University of Chicago Institutional Review Board (IRB#15-0195).
Data Collection
The study utilized de-identified data from the electronic health record (EHR; Epic Systems Corporation, Verona, Wisconsin) and administrative databases collected by the University of Chicago Clinical Research Data Warehouse. Patient age, sex, race, body mass index (BMI), and ward admission source (ie, emergency department (ED), transferred from the intensive care unit (ICU), or directly admitted to the wards) were collected. International Classification of Diseases, 9th Revision, Clinical Modification (ICD-9-CM) codes were used to identify Elixhauser Comorbidity Index categories.29,30 Because patients with similar diagnoses (eg, active cancer) are cohorted within particular areas in our hospital, we obtained the ward unit for all patients. Patients who underwent surgery were identified using the hospital’s admission-transfer-discharge database.
To determine severity of illness, routinely collected vital signs and laboratory values were utilized to calculate the electronic cardiac arrest risk triage (eCART) score, an accurate risk score we previously developed and validated for predicting adverse events among ward patients.31 If any vital sign or laboratory value was missing, the next available measurement was carried forward. If any value remained missing after this change, the median value for that location (ie, wards, ICU, or ED) was imputed.32,33 Additionally, patient-reported pain scores at the time of opioid administration were extracted from nursing flowsheets. If no pain score was present at the time of opioid administration, the patient’s previous score was carried forward.
We excluded patients with sickle-cell disease or seizure history and admissions with diagnoses of alcohol withdrawal from the analysis, because these diagnoses were expected to be associated with different medication administration practices compared to other inpatients. We also excluded patients with a tracheostomy because we expected their respiratory monitoring to differ from the other patients in our cohort. Finally, because ward deaths resulting from a comfort care scenario often involve opioids and/or benzodiazepines, ward segments involving comfort care deaths (defined as death without attempted resuscitation) were excluded from the analysis (Supplemental Figure 1). Patients with sickle-cell disease were identified using ICD-9 codes, and encounters during which a seizure may have occurred were identified using a combination of ICD-9 codes and receipt of anti-epileptic medication (Supplemental Table 1). Patients at risk for alcohol withdrawal were identified by the presence of any Clinical Institute Withdrawal Assessment for Alcohol score within nursing flowsheets, and patients with tracheostomies were identified using documentation of ventilator support within their first 12 hours on the wards. In addition to these exclusion criteria, patients with obstructive sleep apnea (OSA) were identified by the following ICD-9 codes: 278.03, 327.23, 780.51, 780.53, and 780.57.
Medications
Ward administrations of opioids and benzodiazepines—dose, route, and administration time—were collected from the EHR. We excluded all administrations in nonward locations such as the ED, ICU, operating room, or procedure suite. Additionally, because patients emergently intubated may receive sedative and analgesic medications to facilitate intubation, and because patients experiencing cardiac arrest are frequently intubated periresuscitation, we a priori excluded all administrations within 15 minutes of a ward cardiac arrest or an intubation.
For consistent comparisons, opioid doses were converted to oral morphine equivalents34 and adjusted by a factor of 15 to reflect the smallest routinely available oral morphine tablet in our hospital (Supplemental Table 2). Benzodiazepine doses were converted to oral lorazepam equivalents (Supplemental Table 2).34 Thus, the independent variables were oral morphine or lorazepam equivalents administered within each 6-hour window. We a priori presumed opioid doses greater than the 99th percentile (1200 mg) or benzodiazepine doses greater than 10 mg oral lorazepam equivalents within a 6-hour window to be erroneous entries, and replaced these outlier values with the median value for each medication category.
Outcomes
The primary outcome was the composite of ICU transfer or cardiac arrest (loss of pulse with attempted resuscitation) on the wards, with individual outcomes investigated secondarily. An ICU transfer (patient movement from a ward directly to the ICU) was identified using the hospital’s admission-transfer-discharge database. Cardiac arrests were identified using a prospectively validated quality improvement database.35
Because deaths on the wards resulted either from cardiac arrest or from a comfort care scenario, mortality was not studied as an outcome.
Statistical Analysis
Patient characteristics were compared using Student t tests, Wilcoxon rank sum tests, and chi-squared statistics, as appropriate. Unadjusted and adjusted models were created using discrete-time survival analysis,36-39 which involved dividing time into discrete 6-hour intervals and employing the predictor variables chronologically closest to the beginning of each time window to forecast whether the outcome occurred within each interval. Predictor variables in the adjusted model included patient characteristics (age, sex, BMI, and Elixhauser Agency for Healthcare Research and Quality-Web comorbidities30 [a priori excluding comorbidities recorded for fewer than 1000 admissions from the model]), ward unit, surgical status, prior ICU admission during the hospitalization, cumulative opioid or benzodiazepine dose during the previous 24 hours, and severity of illness (measured by eCART score). The adjusted model for opioids also included the patient’s pain score. Age, eCART score, and pain score were entered linearly while race, BMI (underweight, less than 18.5 kg/m2; normal, 18.5-24.9 kg/m2; overweight, 25.0-29.9 kg/m2; obese, 30-39.9 kg/m2; and severely obese, 40 mg/m2 or greater), and ward unit were modeled as categorical variables.
Since repeat hospitalization could confound the results of our study, we performed a sensitivity analysis including only 1 randomly selected hospital admission per patient. We also performed a sensitivity analysis including receipt of both opioids and benzodiazepines, and an interaction term within each ward segment, as well as an analysis in which zolpidem—the most commonly administered nonbenzodiazepine hypnotic medication in our hospital—was included along with both opioids and benzodiazepines. Finally, we performed a sensitivity analysis replacing missing pain scores with imputed values ranging from 0 to the median ward pain score.
We also performed subgroup analyses of adjusted models across age quartiles and for each BMI category, as well as for surgical status, OSA status, gender, time of medication administration, and route of administration (intravenous vs. oral). We also performed an analysis across pain score severity40 to determine whether these medications produce differential effects at various levels of pain.
All tests of significance used a 2-sided P value less than 0.05. Statistical analyses were completed using Stata version 14.1 (StataCorp, LLC, College Station, Texas).
RESULTS
Patient Characteristics
A total of 144,895 admissions, from 75,369 patients, had ward vital signs or laboratory values documented during the study period. Ward segments from 634 admissions were excluded due to comfort care status, which resulted in exclusion of 479 complete patient admissions. Additionally, 139 patients with tracheostomies were excluded. Furthermore, 2934 patient admissions with a sickle-cell diagnosis were excluded, of which 95% (n = 2791) received an opioid and 11% (n = 310) received a benzodiazepine. Another 14,029 admissions associated with seizures, 6134 admissions involving alcohol withdrawal, and 1332 with both were excluded, of which 66% (n = 14,174) received an opioid and 35% (n = 7504) received a benzodiazepine. After exclusions, 120,518 admissions were included in the final analysis, with 67% (n = 80,463) associated with at least 1 administration of an opioid and 21% (n = 25,279) associated with at least 1 benzodiazepine administration.
In total, there were 672,851 intervals when an opioid was administered during the study, with a median dose of 12 mg oral morphine equivalents (interquartile range, 8-30). Of these, 21,634 doses were replaced due to outlier status outside the 99th percentile. Patients receiving opioids were younger (median age 56 vs 61 years), less likely to be African American (48% vs 59%), more likely to have undergone surgery (18% vs 6%), and less likely to have most noncancer medical comorbidities than those who never received an opioid (all P < 0.001) (Table 1).
Additionally, there were a total of 98,286 6-hour intervals in which a benzodiazepine was administered in the study, with a median dose of 1 mg oral lorazepam (interquartile range, 0.5-1). A total of 790 doses of benzodiazepines (less than 1%) were replaced due to outlier status. Patients who received benzodiazepines were more likely to be male (49% vs. 41%), less likely to be African-American, less likely to be obese or morbidly obese (33% vs. 39%), and more likely to have medical comorbidities compared to patients who never received a benzodiazepine (all P < 0.001) (Table 1).
The eCART scores were similar between all patient groups. The frequency of missing variables differed by data type, with vital signs rarely missing (all less than 1.1% except AVPU [10%]), followed by hematology labs (8%-9%), electrolytes and renal function results (12%-15%), and hepatic function tests (40%-45%). In addition to imputed data for missing vital signs and laboratory values, our model omitted human immunodeficiency virus/acquired immune deficiency syndrome and peptic ulcer disease from the adjusted models on the basis of fewer than 1000 admissions with these diagnoses listed.
Patient Outcomes
The incidence of the composite outcome was higher in admissions with at least 1 opioid medication than those without an opioid (7% vs. 4%, P < 0.001), and in admissions with at least 1 dose of benzodiazepines compared to those without a benzodiazepine (11% vs. 4%, P < 0.001) (Table 2).
Within 6-hour segments, increasing doses of opioids were associated with an initial decrease in the frequency of the composite outcome followed by a dose-related increase in the frequency of the composite outcome with morphine equivalents greater than 45 mg. By contrast, the frequency of the composite outcome increased with additional benzodiazepine equivalents (Figure).
In the adjusted model, opioid administration was associated with increased risk for the composite outcome (Table 3) in a dose-dependent fashion, with each 15 mg oral morphine equivalent associated with a 1.9% increase in the odds of ICU transfer or cardiac arrest within the subsequent 6-hour time interval (odds ratio [OR], 1.019; 95% confidence interval [CI], 1.013-1.026; P < 0.001).
Similarly, benzodiazepine administration was also associated with increased adjusted risk for the composite outcome within 6 hours in a dose-dependent manner. Each 1 mg oral lorazepam equivalent was associated with a 29% increase in the odds of ward cardiac arrest or ICU transfer (OR, 1.29; 95% CI, 1.16-1.44; P < 0.001) (Table 3).
Sensitivity Analyses
A sensitivity analysis including 1 randomly selected hospitalization per patient involved 67,097 admissions and found results similar to the primary analysis, with each 15 mg oral morphine equivalent associated with a 1.9% increase in the odds of the composite outcome (OR, 1.019; 95% CI, 1.011-1.028; P < 0.001) and each 1 mg oral lorazepam equivalent associated with a 41% increase in the odds of the composite outcome (OR, 1.41; 95% CI, 1.21-1.65; P < 0.001). Inclusion of both opioids and benzodiazepines in the adjusted model again yielded results similar to the main analysis for both opioids (OR, 1.020; 95% CI, 1.013-1.026; P < 0.001) and benzodiazepines (OR, 1.35; 95% CI, 1.18-1.54; P < 0.001), without a significant interaction detected (P = 0.09). These results were unchanged with the addition of zolpidem to the model as an additional potential confounder, and zolpidem did not increase the risk of the study outcomes (P = 0.2).
A final sensitivity analysis for the opioid model involved replacing missing pain scores with imputed values ranging from 0 to the median ward score, which was 5. The results of these analyses did not differ from the primary model and were consistent regardless of imputation value (OR, 1.018; 95% CI, 1.012-1.023; P < 0.001).
Subgroup Analyses
Analyses of opioid administration by subgroup (sex, age quartiles, BMI categories, OSA diagnosis, surgical status, daytime/nighttime medication administration, IV/PO administration, and pain severity) yielded similar results to the overall analysis (Supplemental Figure 2). Subgroup analysis of patients receiving benzodiazepines revealed similarly increased adjusted odds of the composite outcome across strata of gender, BMI, surgical status, and medication administration time (Supplemental Figure 3). Notably, patients older than 70 years who received a benzodiazepine were at 64% increased odds of the composite outcome (OR, 1.64; 95% CI, 1.30-2.08), compared to 2% to 38% increased risk for patients under 70 years. Finally, IV doses of benzodiazepines were associated with 48% increased odds for deterioration (OR, 1.48; 95% CI, 1.18-1.84; P = 0.001), compared to a nonsignificant 14% increase in the odds for PO doses (OR, 1.14; 95% CI, 0.99-1.31; P = 0.066).
DISCUSSION
In a large, single-center, observational study of ward inpatients, we found that opioid use was associated with a small but significant increased risk for clinical deterioration on the wards, with every 15 mg oral morphine equivalent increasing the odds of ICU transfer or cardiac arrest in the next 6 hours by 1.9%. Benzodiazepines were associated with a much higher risk: each equivalent of 1 mg of oral lorazepam increased the odds of ICU transfer or cardiac arrest by almost 30%. These results have important implications for care at the bedside of hospitalized ward patients and suggest the need for closer monitoring after receipt of these medications, particularly benzodiazepines.
Previous work has described negative effects of opioid medications among select inpatient populations. In surgical patients, opioids have been associated with hospital readmission, increased length of stay, and hospital mortality.26,28 More recently, Herzig et al.15 found more adverse events in nonsurgical ward patients within the hospitals prescribing opioids the most frequently. These studies may have been limited by the populations studied and the inability to control for confounders such as severity of illness and pain score. Our study expands these findings to a more generalizable population and shows that even after adjustment for potential confounders, such as severity of illness, pain score, and medication dose, opioids are associated with increased short-term risk of clinical deterioration.
By contrast, few studies have characterized the risks associated with benzodiazepine use among ward inpatients. Recently, Overdyk et al.27 found that inpatient use of opioids and sedatives was associated with increased risk for cardiac arrest and hospital death. However, this study included ICU patients, which may confound the results, as ICU patients often receive high doses of opioids or benzodiazepines to facilitate mechanical ventilation or other invasive procedures, while also having a particularly high risk of adverse outcomes like cardiac arrest and inhospital death.
Several mechanisms may explain the magnitude of effect seen with regard to benzodiazepines. First, benzodiazepines may directly produce clinical deterioration by decreased respiratory drive, diminished airway tone, or hemodynamic decompensation. It is possible that the broad spectrum of cardiorespiratory side effects of benzodiazepines—and potential unpredictability of these effects—increases the difficulty of observation and management for patients receiving them. This difficulty may be compounded with intravenous administration of benzodiazepines, which was associated with a higher risk for deterioration than oral doses in our cohort. Alternatively, benzodiazepines may contribute to clinical decompensation by masking signs of deterioration such as encephalopathy or vital sign instability like tachycardia or tachypnea that may be mistaken as anxiety. Notably, while our hospital has a nursing-driven protocol for monitoring patients receiving opioids (in which pain is serially assessed, leading to additional bedside observation), we do not have protocols for ward patients receiving benzodiazepines. Finally, although we found that orders for opioids and benzodiazepines were more common in white patients than African American patients, this finding may be due to differences in the types or number of medical comorbidities experienced by these patients.
Our study has several strengths, including the large number of admissions we included. Additionally, we included a broad range of medical and surgical ward admissions, which should increase the generalizability of our results. Further, our rates of ICU transfer are in line with data reported from other groups,41,42 which again may add to the generalizability of our findings. We also addressed many potential confounders by including patient characteristics, individual ward units, and (for opioids) pain score in our model, and by controlling for severity of illness with the eCART score, an accurate predictor of ICU transfer and ward cardiac arrest within our population.32,37 Finally, our robust methodology allowed us to include acute and cumulative medication doses, as well as time, in the model. By performing a discrete-time survival analysis, we were able to evaluate receipt of opioids and benzodiazepines—as well as risk for clinical deterioration—longitudinally, lending strength to our results.
Limitations of our study include its single-center cohort, which may reduce generalizability to other populations. Additionally, because we could not validate the accuracy of—or adherence to—outpatient medication lists, we were unable to identify chronic opioid or benzodiazepine users by these lists. However, patients chronically taking opioids or benzodiazepines would likely receive doses each hospital day; by including 24-hour cumulative doses in our model, we attempted to adjust for some portion of their chronic use. Also, because evaluation of delirium was not objectively recorded in our dataset, we were unable to evaluate the relationship between receipt of these medications and development of delirium, which is an important outcome for hospitalized patients. Finally, neither the diagnoses for which these medications were prescribed, nor the reason for ICU transfer, were present in our dataset, which leaves open the possibility of unmeasured confounding.
CONCLUSION
After adjustment for important confounders including severity of illness, medication dose, and time, opioids were associated with a slight increase in clinical deterioration on the wards, while benzodiazepines were associated with a much larger risk for deterioration. This finding raises concern about the safety of benzodiazepine use among ward patients and suggests that increased monitoring of patients receiving these medications may be warranted.
Acknowledgment
The authors thank Nicole Twu for administrative support.
Disclosure
Drs. Churpek and Edelson have a patent pending (ARCD. P0535US.P2) for risk stratification algorithms for hospitalized patients. Dr. Churpek is supported by a career development award from the National Heart, Lung, and Blood Institute (K08 HL121080). Dr. Churpek has received honoraria from Chest for invited speaking engagements. In addition, Dr. Edelson has received research support from Philips Healthcare (Andover, Massachusetts), research support from the American Heart Association (Dallas, Texas) and Laerdal Medical (Stavanger, Norway), and research support from Early Sense (Tel Aviv, Israel). She has ownership interest in Quant HC (Chicago, Illinois), which is developing products for risk stratification of hospitalized patients. Dr. Mokhlesi is supported by National Institutes of Health grant R01HL119161. Dr. Mokhlesi has served as a consultant to Philips/Respironics and has received research support from Philips/Respironics. Preliminary versions of these data were presented as a poster presentation at the 2016 meeting of the American Thoracic Society, May 17, 2016; San Francisco, California.
1. Substance Abuse and Mental Health Services Administration. Results from the 2013 National Survey on Drug Use and Health: Summary of National Findings. Rockville, MD: Substance Abuse and Mental Health Services Administration; 2014.
2. Bachhuber MA, Hennessy S, Cunningham CO, Starrels JL. Increasing benzodiazepine prescriptions and overdose mortality in the United States, 1996–2013. Am J Public Health. 2016;106(4):686-688. PubMed
3. Parsells Kelly J, Cook SF, Kaufman DW, Anderson T, Rosenberg L, Mitchell AA. Prevalence and characteristics of opioid use in the US adult population. Pain. 2008;138(3):507-513. PubMed
4. Olfson M, King M, Schoenbaum M. Benzodiazepine use in the United States. JAMA Psychiatry. 2015;72(2):136-142. PubMed
5. Hwang CS, Kang EM, Kornegay CJ, Staffa JA, Jones CM, McAninch JK. Trends in the concomitant prescribing of opioids and benzodiazepines, 2002−2014. Am J Prev Med. 2016;51(2):151-160. PubMed
6. Bohnert AS, Valenstein M, Bair MJ, et al. Association between opioid prescribing patterns and opioid overdose-related deaths. JAMA. 2011;305(13):1315-1321. PubMed
7. Dart RC, Surratt HL, Cicero TJ, et al. Trends in opioid analgesic abuse and mortality in the United States. N Engl J Med. 2015;372(3):241-248. PubMed
8. Centers for Disease Control and Prevention (CDC). Vital signs: overdoses of prescription opioid pain relievers---United States, 1999--2008. MMWR Morb Mortal Wkly Rep. 2011;60(43):1487-1492. PubMed
9. Lan TY, Zeng YF, Tang GJ, et al. The use of hypnotics and mortality - a population-based retrospective cohort study. PLoS One. 2015;10(12):e0145271. PubMed
10. Mosher HJ, Jiang L, Vaughan Sarrazin MS, Cram P, Kaboli P, Vander Weg MW. Prevalence and characteristics of hospitalized adults on chronic opioid therapy: prior opioid use among veterans. J Hosp Med. 2014;9(2):82-87. PubMed
11. Palmaro A, Dupouy J, Lapeyre-Mestre M. Benzodiazepines and risk of death: results from two large cohort studies in France and UK. Eur Neuropsychopharmacol. 2015;25(10):1566-1577. PubMed
12. Parsaik AK, Mascarenhas SS, Khosh-Chashm D, et al. Mortality associated with anxiolytic and hypnotic drugs–a systematic review and meta-analysis. Aust N Z J Psychiatry. 2016;50(6):520-533. PubMed
13. Park TW, Saitz R, Ganoczy D, Ilgen MA, Bohnert AS. Benzodiazepine prescribing patterns and deaths from drug overdose among US veterans receiving opioid analgesics: case-cohort study. BMJ. 2015;350:h2698. PubMed
14. Jones CM, McAninch JK. Emergency department visits and overdose deaths from combined use of opioids and benzodiazepines. Am J Prev Med. 2015;49(4):493-501. PubMed
15. Herzig SJ, Rothberg MB, Cheung M, Ngo LH, Marcantonio ER. Opioid utilization and opioid-related adverse events in nonsurgical patients in US hospitals. J Hosp Med. 2014;9(2):73-81. PubMed
16. Jena AB, Goldman D, Karaca-Mandic P. Hospital prescribing of opioids to Medicare beneficiaries. JAMA Intern Med. 2016;176(7):990-997. PubMed
17. Calcaterra SL, Yamashita TE, Min SJ, Keniston A, Frank JW, Binswanger IA. Opioid prescribing at hospital discharge contributes to chronic opioid use. J Gen Intern Med. 2016;31(5):478-485. PubMed
18. Garrido MM, Prigerson HG, Penrod JD, Jones SC, Boockvar KS. Benzodiazepine and sedative-hypnotic use among older seriously ill veterans: choosing wisely? Clin Ther. 2014;36(11):1547-1554. PubMed
19. Doufas AG, Tian L, Padrez KA, et al. Experimental pain and opioid analgesia in volunteers at high risk for obstructive sleep apnea. PloS One. 2013;8(1):e54807. PubMed
20. Gislason T, Almqvist M, Boman G, Lindholm CE, Terenius L. Increased CSF opioid activity in sleep apnea syndrome. Regression after successful treatment. Chest. 1989;96(2):250-254. PubMed
21. Van Ryswyk E, Antic N. Opioids and sleep disordered breathing. Chest. 2016;150(4):934-944. PubMed
22. Koga Y, Sato S, Sodeyama N, et al. Comparison of the relaxant effects of diazepam, flunitrazepam and midazolam on airway smooth muscle. Br J Anaesth. 1992;69(1):65-69. PubMed
23. Pomara N, Lee SH, Bruno D, et al. Adverse performance effects of acute lorazepam administration in elderly long-term users: pharmacokinetic and clinical predictors. Prog Neuropsychopharmacol Biol Psychiatry. 2015;56:129-135. PubMed
24. Pandharipande P, Shintani A, Peterson J, et al. Lorazepam is an independent risk factor for transitioning to delirium in intensive care unit patients. Anesthesiology. 2006;104(1):21-26. PubMed
25. O’Neil CA, Krauss MJ, Bettale J, et al. Medications and patient characteristics associated with falling in the hospital. J Patient Saf. 2015 (epub ahead of print). PubMed
26. Kessler ER, Shah M, K Gruschkus S, Raju A. Cost and quality implications of opioid-based postsurgical pain control using administrative claims data from a large health system: opioid-related adverse events and their impact on clinical and economic outcomes. Pharmacotherapy. 2013;33(4):383-391. PubMed
27. Overdyk FJ, Dowling O, Marino J, et al. Association of opioids and sedatives with increased risk of in-hospital cardiopulmonary arrest from an administrative database. PLoS One. 2016;11(2):e0150214. PubMed
28. Minkowitz HS, Gruschkus SK, Shah M, Raju A. Adverse drug events among patients receiving postsurgical opioids in a large health system: risk factors and outcomes. Am J Health Syst Pharm. 2014;71(18):1556-1565. PubMed
29. Elixhauser A, Steiner C, Harris DR, Coffey RM. Comorbidity measures for use with administrative data. Med Care. 1998;36(1):8-27. PubMed
30. Quan H, Sundararajan V, Halfon P, et al. Coding algorithms for defining comorbidities in ICD-9-CM and ICD-10 administrative data. Med Care. 2005;43(11):1130-1139. PubMed
31. Churpek MM, Yuen TC, Winslow C, et al. Multicenter development and validation of a risk stratification tool for ward patients. Am J Respir Crit Care Med. 2014;190(6):649-655. PubMed
32. Knaus WA, Wagner DP, Draper EA, Z et al. The APACHE III prognostic system. Risk prediction of hospital mortality for critically ill hospitalized adults. Chest. 1991;100(6):1619-1636. PubMed
33. van den Boogaard M, Pickkers P, Slooter AJC, et al. Development and validation
of PRE-DELIRIC (PREdiction of DELIRium in ICu patients) delirium prediction
model for intensive care patients: observational multicentre study. BMJ.
2012;344:e420. PubMed
34. Clinical calculators. ClinCalc.com. http://www.clincalc.com. Accessed February
21, 2016.
35. Churpek MM, Yuen TC, Huber MT, Park SY, Hall JB, Edelson DP. Predicting
cardiac arrest on the wards: a nested case-control study. Chest. 2012;141(5):
1170-1176. PubMed
36. Churpek MM, Yuen TC, Park SY, Gibbons R, Edelson DP. Using electronic
health record data to develop and validate a prediction model for adverse outcomes
in the wards. Crit Care Med. 2014;42(4):841-848. PubMed
37. Efron B. Logistic regression, survival analysis, and the Kaplan-Meier curve. J Am
Stat Assoc. 1988;83(402):414-425.
38. Gibbons RD, Duan N, Meltzer D, et al; Institute of Medicine Committee. Waiting
for organ transplantation: results of an analysis by an Institute of Medicine Committee.
Biostatistics. 2003;4(2):207-222. PubMed
39. Singer JD, Willett JB. It’s about time: using discrete-time survival analysis to study
duration and the timing of events. J Educ Behav Stat. 1993;18(2):155-195.
40. World Health Organization. Cancer pain relief and palliative care. Report of a
WHO Expert Committee. World Health Organ Tech Rep Ser. 1990;804:1-75. PubMed
41. Bailey TC, Chen Y, Mao Y, et al. A trial of a real-time alert for clinical deterioration
in patients hospitalized on general medical wards. J Hosp Med. 2013;8(5):236-242. PubMed
42. Liu V, Kipnis P, Rizk NW, Escobar GJ. Adverse outcomes associated with delayed
intensive care unit transfers in an integrated healthcare system. J Hosp Med.
2012;7(3):224-230. PubMed
© 2017 Society of Hospital Medicine
Detecting sepsis: Are two opinions better than one?
Sepsis is a leading cause of hospital mortality in the United States, contributing to up to half of all deaths.1 If the infection is identified and treated early, however, its associated morbidity and mortality can be significantly reduced.2 The 2001 sepsis guidelines define sepsis as the suspicion of infection plus meeting 2 or more systemic inflammatory response syndrome (SIRS) criteria.3 Although the utility of SIRS criteria has been extensively debated, providers’ accuracy and agreement regarding suspicion of infection are not yet fully characterized. This is very important, as the source of infection is often not identified in patients with severe sepsis or septic shock.4
Although much attention recently has been given to ideal objective criteria for accurately identifying sepsis, less is known about what constitutes ideal subjective criteria and who can best make that assessment.5-7 We conducted a study to measure providers’ agreement regarding this subjective assessment and the impact of that agreement on patient outcomes.
METHODS
We performed a secondary analysis of prospectively collected data on consecutive adults hospitalized on a general medicine ward at an academic medical center between April 1, 2014 and March 31, 2015. This study was approved by the University of Chicago Institutional Review Board with a waiver of consent.
A sepsis screening tool was developed locally as part of the Surviving Sepsis Campaign Quality Improvement Learning Collaborative8 (Supplemental Figure). This tool was completed by bedside nurses for each patient during each shift. Bedside registered nurse (RN) suspicion of infection was deemed positive if the nurse answered yes to question 2: “Does the patient have evidence of an active infection?” We compared RN assessment with assessment by the ordering provider, a medical doctor or advanced practice professionals (MD/APP), using an existing order for antibiotics or a new order for either blood or urine cultures placed within 12 hours before nursing screen time to indicate MD/APP suspicion of infection.
All nursing screens were transcribed into an electronic database, excluding screens not performed, or missing RN suspicion of infection. For quality purposes, screening data were merged with electronic health record data to verify SIRS criteria at the time of the screens as well as the presence of culture and/or antibiotic orders preceding the screens. Outcome data were obtained from an administrative database and confirmed by chart review using the 2001 sepsis definitions.6 Data were de-identified and time-shifted before this analysis. SIRS-positive criteria were defined as meeting 2 or more of the following: temperature higher than 38°C or lower than 36°C; heart rate higher than 90 beats per minute; respiratory rate more than 20 breaths per minute; and white blood cell count more than 2,000/mm3 or less than 4,000/mm3.The primary clinical outcome was progression to severe sepsis or septic shock. Secondary outcomes included transfer to intensive care unit (ICU) and in-hospital mortality. Given that RN and MD/APP suspicion of infection can vary over time, only the initial screen for each patient was used in assessing progression to severe sepsis or septic shock and in-hospital mortality. All available screens were used to investigate the association between each provider’s suspicion of infection over time and ICU transfer.
Demographic characteristics were compared using the χ2 test and analysis of variance, as appropriate. Provider agreement was evaluated with a weighted κ statistic. Fisher exact tests were used to compare proportions of mortality and severe sepsis/septic shock, and the McNemar test was used to compare proportions of ICU transfers. The association of outcomes based on provider agreement was evaluated with a nonparametric test for trend.
RESULTS
During the study period, 1386 distinct patients had 13,223 screening opportunities, with a 95.4% compliance rate. A total of 1127 screens were excluded for missing nursing documentation of suspicion of infection, leaving 1192 first screens and 11,489 total screens for analysis. Of the completed screens, 3744 (32.6%) met SIRS criteria; suspicion of infection was noted by both RN and MD/APP in 5.8% of cases, by RN only in 22.2%, by MD/APP only in 7.2%, and by neither provider in 64.7% (Figure 1). Overall agreement rate was 80.7% for suspicion of infection (κ = 0.11, P < 0.001). Demographics by subgroup are shown in the Supplemental Table. Progression to severe sepsis or shock was highest when both providers suspected infection in a SIRS-positive patient (17.7%), was substantially reduced with single-provider suspicion (6.0%), and was lowest when neither provider suspected infection (1.5%) (P < 0.001). A similar trend was found for in-hospital mortality (both providers, 6.3%; single provider, 2.7%; neither provider, 2.5%; P = 0.01). Compared with MD/APP-only suspicion, SIRS-positive patients in whom only RNs suspected infection had similar frequency of progression to severe sepsis or septic shock (6.5% vs 5.6%; P = 0.52) and higher mortality (5.0% vs 1.1%; P = 0.32), though these findings were not statistically significant.

For the 121 patients (10.2%) transferred to ICU, RNs were more likely than MD/APPs to suspect infection at all time points (Figure 2). The difference was small (P = 0.29) 48 hours before transfer (RN, 12.5%; MD/APP, 5.6%) but became more pronounced (P = 0.06) by 3 hours before transfer (RN, 46.3%; MD/APP, 33.1%). Nursing assessments were not available after transfer, but 3 hours after transfer the proportion of patients who met MD/APP suspicion-of-infection criteria (44.6%) was similar (P = 0.90) to that of the RNs 3 hours before transfer (46.3%).

DISCUSSION
Our findings reveal that bedside nurses and ordering providers routinely have discordant assessments regarding presence of infection. Specifically, when RNs are asked to screen patients on the wards, they are suspicious of infection more often than MD/APPs are, and they suspect infection earlier in ICU transfer patients. These findings have significant implications for patient care, compliance with the new national SEP-1 Centers for Medicare & Medicaid Services quality measure, and identification of appropriate patients for enrollment in sepsis-related clinical trials.
To our knowledge, this is the first study to explore agreement between bedside RN and MD/APP suspicion of infection in sepsis screening and its association with patient outcomes. Studies on nurse and physician concordance in other domains have had mixed findings.9-11 The high discordance rate found in our study points to the highly subjective nature of suspicion of infection.
Our finding that RNs suspect infection earlier in patients transferred to ICU suggests nursing suspicion has value above and beyond current practice. A possible explanation for the higher rate of RN suspicion, and earlier RN suspicion, is that bedside nurses spend substantially more time with their patients and are more attuned to subtle changes that often occur before any objective signs of deterioration. This phenomenon is well documented and accounts for why rapid response calling criteria often include “nurse worry or concern.”12,13 Thus, nurse intuition may be an important signal for early identification of patients at high risk for sepsis.
That about one third of all screens met SIRS criteria and that almost two thirds of those screens were not thought by RN or MD/APP to be caused by infection add to the literature demonstrating the limited value of SIRS as a screening tool for sepsis.14 To address this issue, the 2016 sepsis definitions propose using the quick Sepsis-Related Organ Failure Assessment (qSOFA) to identify patients at high risk for clinical deterioration; however, the Surviving Sepsis Campaign continues to encourage sepsis screening using the SIRS criteria.15
Limitations of this study include its lack of generalizability, as it was conducted with general medical patients at a single center. Second, we did not specifically ask the MD/APPs whether they suspected infection; instead, we relied on their ordering practices. Third, RN and MD/APP assessments were not independent, as RNs had access to MD/APP orders before making their own assessments, which could bias our results.
Discordance in provider suspicion of infection is common, with RNs documenting suspicion more often than MD/APPs, and earlier in patients transferred to ICU. Suspicion by either provider alone is associated with higher risk for sepsis progression and in-hospital mortality than is the case when neither provider suspects infection. Thus, a collaborative method that includes both RNs and MD/APPs may improve the accuracy and timing of sepsis detection on the wards.
Acknowledgments
The authors thank the members of the Surviving Sepsis Campaign (SSC) Quality Improvement Learning Collaborative at the University of Chicago for their help in data collection and review, especially Meredith Borak, Rita Lanier, Mary Ann Francisco, and Bill Marsack. The authors also thank Thomas Best and Mary-Kate Springman for their assistance in data entry and Nicole Twu for administrative support. Data from this study were provided by the Clinical Research Data Warehouse (CRDW) maintained by the Center for Research Informatics (CRI) at the University of Chicago. CRI is funded by the Biological Sciences Division of the Institute for Translational Medicine/Clinical and Translational Science Award (CTSA) (National Institutes of Health UL1 TR000430) at the University of Chicago.
Disclosures
Dr. Bhattacharjee is supported by postdoctoral training grant 4T32HS000078 from the Agency for Healthcare Research and Quality. Drs. Churpek and Edelson have a patent pending (ARCD.P0535US.P2) for risk stratification algorithms for hospitalized patients. Dr. Churpek is supported by career development award K08 HL121080 from the National Heart, Lung, and Blood Institute. Dr. Edelson has received research support from Philips Healthcare (Andover, Massachusetts), American Heart Association (Dallas, Texas), and Laerdal Medical (Stavanger, Norway) and has ownership interest in Quant HC (Chicago, Illinois), which is developing products for risk stratification of hospitalized patients. The other authors report no conflicts of interest.
1. Liu V, Escobar GJ, Greene JD, et al. Hospital deaths in patients with sepsis from 2 independent cohorts. JAMA. 2014;312(1):90-92. PubMed
2. Rivers E, Nguyen B, Havstad S, et al; Early Goal-Directed Therapy Collaborative Group. Early goal-directed therapy in the treatment of severe sepsis and septic shock. N Engl J Med. 2001;345(19):1368-1377. PubMed
3. Levy MM, Fink MP, Marshall JC, et al; SCCM/ESICM/ACCP/ATS/SIS. 2001 SCCM/ESICM/ACCP/ATS/SIS International Sepsis Definitions Conference. Crit Care Med. 2003;31(4):1250-1256. PubMed
4. Vincent JL, Sakr Y, Sprung CL, et al; Sepsis Occurrence in Acutely Ill Patients Investigators. Sepsis in European intensive care units: results of the SOAP study. Crit Care Med. 2006;34(2):344-353. PubMed
5. Kaukonen KM, Bailey M, Pilcher D, Cooper DJ, Bellomo R. Systemic inflammatory response syndrome criteria in defining severe sepsis. N Engl J Med. 2015;372(17):1629-1638. PubMed
6. Vincent JL, Opal SM, Marshall JC, Tracey KJ. Sepsis definitions: time for change. Lancet. 2013;381(9868):774-775. PubMed
7. Singer M, Deutschman CS, Seymour CW, et al. The Third International Consensus Definitions for Sepsis and Septic Shock (Sepsis-3). JAMA. 2016;315(8):801-810. PubMed
8. Surviving Sepsis Campaign (SSC) Sepsis on the Floors Quality Improvement Learning Collaborative. Frequently asked questions (FAQs). Society of Critical Care Medicine website. http://www.survivingsepsis.org/SiteCollectionDocuments/About-Collaboratives.pdf. Published October 8, 2013.
9. Fiesseler F, Szucs P, Kec R, Richman PB. Can nurses appropriately interpret the Ottawa ankle rule? Am J Emerg Med. 2004;22(3):145-148. PubMed
10. Blomberg H, Lundström E, Toss H, Gedeborg R, Johansson J. Agreement between ambulance nurses and physicians in assessing stroke patients. Acta Neurol Scand. 2014;129(1):4955. PubMed
11. Neville TH, Wiley JF, Yamamoto MC, et al. Concordance of nurses and physicians on whether critical care patients are receiving futile treatment. Am J Crit Care. 2015;24(5):403410. PubMed
12. Odell M, Victor C, Oliver D. Nurses’ role in detecting deterioration in ward patients: systematic literature review. J Adv Nurs. 2009;65(10):1992-2006. PubMed
13. Howell MD, Ngo L, Folcarelli P, et al. Sustained effectiveness of a primary-team-based rapid response system. Crit Care Med. 2012;40(9):2562-2568. PubMed
14. Churpek MM, Zadravecz FJ, Winslow C, Howell MD, Edelson DP. Incidence and prognostic value of the systemic inflammatory response syndrome and organ dysfunctions in ward patients. Am J Respir Crit Care Med. 2015;192(8):958-964. PubMed
15. Antonelli M, DeBacker D, Dorman T, Kleinpell R, Levy M, Rhodes A; Surviving Sepsis Campaign Executive Committee. Surviving Sepsis Campaign responds to Sepsis-3. Society of Critical Care Medicine website. http://www.survivingsepsis.org/SiteCollectionDocuments/SSC-Statements-Sepsis-Definitions-3-2016.pdf. Published March 1, 2016. Accessed May 11, 2016.
Sepsis is a leading cause of hospital mortality in the United States, contributing to up to half of all deaths.1 If the infection is identified and treated early, however, its associated morbidity and mortality can be significantly reduced.2 The 2001 sepsis guidelines define sepsis as the suspicion of infection plus meeting 2 or more systemic inflammatory response syndrome (SIRS) criteria.3 Although the utility of SIRS criteria has been extensively debated, providers’ accuracy and agreement regarding suspicion of infection are not yet fully characterized. This is very important, as the source of infection is often not identified in patients with severe sepsis or septic shock.4
Although much attention recently has been given to ideal objective criteria for accurately identifying sepsis, less is known about what constitutes ideal subjective criteria and who can best make that assessment.5-7 We conducted a study to measure providers’ agreement regarding this subjective assessment and the impact of that agreement on patient outcomes.
METHODS
We performed a secondary analysis of prospectively collected data on consecutive adults hospitalized on a general medicine ward at an academic medical center between April 1, 2014 and March 31, 2015. This study was approved by the University of Chicago Institutional Review Board with a waiver of consent.
A sepsis screening tool was developed locally as part of the Surviving Sepsis Campaign Quality Improvement Learning Collaborative8 (Supplemental Figure). This tool was completed by bedside nurses for each patient during each shift. Bedside registered nurse (RN) suspicion of infection was deemed positive if the nurse answered yes to question 2: “Does the patient have evidence of an active infection?” We compared RN assessment with assessment by the ordering provider, a medical doctor or advanced practice professionals (MD/APP), using an existing order for antibiotics or a new order for either blood or urine cultures placed within 12 hours before nursing screen time to indicate MD/APP suspicion of infection.
All nursing screens were transcribed into an electronic database, excluding screens not performed, or missing RN suspicion of infection. For quality purposes, screening data were merged with electronic health record data to verify SIRS criteria at the time of the screens as well as the presence of culture and/or antibiotic orders preceding the screens. Outcome data were obtained from an administrative database and confirmed by chart review using the 2001 sepsis definitions.6 Data were de-identified and time-shifted before this analysis. SIRS-positive criteria were defined as meeting 2 or more of the following: temperature higher than 38°C or lower than 36°C; heart rate higher than 90 beats per minute; respiratory rate more than 20 breaths per minute; and white blood cell count more than 2,000/mm3 or less than 4,000/mm3.The primary clinical outcome was progression to severe sepsis or septic shock. Secondary outcomes included transfer to intensive care unit (ICU) and in-hospital mortality. Given that RN and MD/APP suspicion of infection can vary over time, only the initial screen for each patient was used in assessing progression to severe sepsis or septic shock and in-hospital mortality. All available screens were used to investigate the association between each provider’s suspicion of infection over time and ICU transfer.
Demographic characteristics were compared using the χ2 test and analysis of variance, as appropriate. Provider agreement was evaluated with a weighted κ statistic. Fisher exact tests were used to compare proportions of mortality and severe sepsis/septic shock, and the McNemar test was used to compare proportions of ICU transfers. The association of outcomes based on provider agreement was evaluated with a nonparametric test for trend.
RESULTS
During the study period, 1386 distinct patients had 13,223 screening opportunities, with a 95.4% compliance rate. A total of 1127 screens were excluded for missing nursing documentation of suspicion of infection, leaving 1192 first screens and 11,489 total screens for analysis. Of the completed screens, 3744 (32.6%) met SIRS criteria; suspicion of infection was noted by both RN and MD/APP in 5.8% of cases, by RN only in 22.2%, by MD/APP only in 7.2%, and by neither provider in 64.7% (Figure 1). Overall agreement rate was 80.7% for suspicion of infection (κ = 0.11, P < 0.001). Demographics by subgroup are shown in the Supplemental Table. Progression to severe sepsis or shock was highest when both providers suspected infection in a SIRS-positive patient (17.7%), was substantially reduced with single-provider suspicion (6.0%), and was lowest when neither provider suspected infection (1.5%) (P < 0.001). A similar trend was found for in-hospital mortality (both providers, 6.3%; single provider, 2.7%; neither provider, 2.5%; P = 0.01). Compared with MD/APP-only suspicion, SIRS-positive patients in whom only RNs suspected infection had similar frequency of progression to severe sepsis or septic shock (6.5% vs 5.6%; P = 0.52) and higher mortality (5.0% vs 1.1%; P = 0.32), though these findings were not statistically significant.
For the 121 patients (10.2%) transferred to ICU, RNs were more likely than MD/APPs to suspect infection at all time points (Figure 2). The difference was small (P = 0.29) 48 hours before transfer (RN, 12.5%; MD/APP, 5.6%) but became more pronounced (P = 0.06) by 3 hours before transfer (RN, 46.3%; MD/APP, 33.1%). Nursing assessments were not available after transfer, but 3 hours after transfer the proportion of patients who met MD/APP suspicion-of-infection criteria (44.6%) was similar (P = 0.90) to that of the RNs 3 hours before transfer (46.3%).
DISCUSSION
Our findings reveal that bedside nurses and ordering providers routinely have discordant assessments regarding presence of infection. Specifically, when RNs are asked to screen patients on the wards, they are suspicious of infection more often than MD/APPs are, and they suspect infection earlier in ICU transfer patients. These findings have significant implications for patient care, compliance with the new national SEP-1 Centers for Medicare & Medicaid Services quality measure, and identification of appropriate patients for enrollment in sepsis-related clinical trials.
To our knowledge, this is the first study to explore agreement between bedside RN and MD/APP suspicion of infection in sepsis screening and its association with patient outcomes. Studies on nurse and physician concordance in other domains have had mixed findings.9-11 The high discordance rate found in our study points to the highly subjective nature of suspicion of infection.
Our finding that RNs suspect infection earlier in patients transferred to ICU suggests nursing suspicion has value above and beyond current practice. A possible explanation for the higher rate of RN suspicion, and earlier RN suspicion, is that bedside nurses spend substantially more time with their patients and are more attuned to subtle changes that often occur before any objective signs of deterioration. This phenomenon is well documented and accounts for why rapid response calling criteria often include “nurse worry or concern.”12,13 Thus, nurse intuition may be an important signal for early identification of patients at high risk for sepsis.
That about one third of all screens met SIRS criteria and that almost two thirds of those screens were not thought by RN or MD/APP to be caused by infection add to the literature demonstrating the limited value of SIRS as a screening tool for sepsis.14 To address this issue, the 2016 sepsis definitions propose using the quick Sepsis-Related Organ Failure Assessment (qSOFA) to identify patients at high risk for clinical deterioration; however, the Surviving Sepsis Campaign continues to encourage sepsis screening using the SIRS criteria.15
Limitations of this study include its lack of generalizability, as it was conducted with general medical patients at a single center. Second, we did not specifically ask the MD/APPs whether they suspected infection; instead, we relied on their ordering practices. Third, RN and MD/APP assessments were not independent, as RNs had access to MD/APP orders before making their own assessments, which could bias our results.
Discordance in provider suspicion of infection is common, with RNs documenting suspicion more often than MD/APPs, and earlier in patients transferred to ICU. Suspicion by either provider alone is associated with higher risk for sepsis progression and in-hospital mortality than is the case when neither provider suspects infection. Thus, a collaborative method that includes both RNs and MD/APPs may improve the accuracy and timing of sepsis detection on the wards.
Acknowledgments
The authors thank the members of the Surviving Sepsis Campaign (SSC) Quality Improvement Learning Collaborative at the University of Chicago for their help in data collection and review, especially Meredith Borak, Rita Lanier, Mary Ann Francisco, and Bill Marsack. The authors also thank Thomas Best and Mary-Kate Springman for their assistance in data entry and Nicole Twu for administrative support. Data from this study were provided by the Clinical Research Data Warehouse (CRDW) maintained by the Center for Research Informatics (CRI) at the University of Chicago. CRI is funded by the Biological Sciences Division of the Institute for Translational Medicine/Clinical and Translational Science Award (CTSA) (National Institutes of Health UL1 TR000430) at the University of Chicago.
Disclosures
Dr. Bhattacharjee is supported by postdoctoral training grant 4T32HS000078 from the Agency for Healthcare Research and Quality. Drs. Churpek and Edelson have a patent pending (ARCD.P0535US.P2) for risk stratification algorithms for hospitalized patients. Dr. Churpek is supported by career development award K08 HL121080 from the National Heart, Lung, and Blood Institute. Dr. Edelson has received research support from Philips Healthcare (Andover, Massachusetts), American Heart Association (Dallas, Texas), and Laerdal Medical (Stavanger, Norway) and has ownership interest in Quant HC (Chicago, Illinois), which is developing products for risk stratification of hospitalized patients. The other authors report no conflicts of interest.
1. Liu V, Escobar GJ, Greene JD, et al. Hospital deaths in patients with sepsis from 2 independent cohorts. JAMA. 2014;312(1):90-92. PubMed
2. Rivers E, Nguyen B, Havstad S, et al; Early Goal-Directed Therapy Collaborative Group. Early goal-directed therapy in the treatment of severe sepsis and septic shock. N Engl J Med. 2001;345(19):1368-1377. PubMed
3. Levy MM, Fink MP, Marshall JC, et al; SCCM/ESICM/ACCP/ATS/SIS. 2001 SCCM/ESICM/ACCP/ATS/SIS International Sepsis Definitions Conference. Crit Care Med. 2003;31(4):1250-1256. PubMed
4. Vincent JL, Sakr Y, Sprung CL, et al; Sepsis Occurrence in Acutely Ill Patients Investigators. Sepsis in European intensive care units: results of the SOAP study. Crit Care Med. 2006;34(2):344-353. PubMed
5. Kaukonen KM, Bailey M, Pilcher D, Cooper DJ, Bellomo R. Systemic inflammatory response syndrome criteria in defining severe sepsis. N Engl J Med. 2015;372(17):1629-1638. PubMed
6. Vincent JL, Opal SM, Marshall JC, Tracey KJ. Sepsis definitions: time for change. Lancet. 2013;381(9868):774-775. PubMed
7. Singer M, Deutschman CS, Seymour CW, et al. The Third International Consensus Definitions for Sepsis and Septic Shock (Sepsis-3). JAMA. 2016;315(8):801-810. PubMed
8. Surviving Sepsis Campaign (SSC) Sepsis on the Floors Quality Improvement Learning Collaborative. Frequently asked questions (FAQs). Society of Critical Care Medicine website. http://www.survivingsepsis.org/SiteCollectionDocuments/About-Collaboratives.pdf. Published October 8, 2013.
9. Fiesseler F, Szucs P, Kec R, Richman PB. Can nurses appropriately interpret the Ottawa ankle rule? Am J Emerg Med. 2004;22(3):145-148. PubMed
10. Blomberg H, Lundström E, Toss H, Gedeborg R, Johansson J. Agreement between ambulance nurses and physicians in assessing stroke patients. Acta Neurol Scand. 2014;129(1):4955. PubMed
11. Neville TH, Wiley JF, Yamamoto MC, et al. Concordance of nurses and physicians on whether critical care patients are receiving futile treatment. Am J Crit Care. 2015;24(5):403410. PubMed
12. Odell M, Victor C, Oliver D. Nurses’ role in detecting deterioration in ward patients: systematic literature review. J Adv Nurs. 2009;65(10):1992-2006. PubMed
13. Howell MD, Ngo L, Folcarelli P, et al. Sustained effectiveness of a primary-team-based rapid response system. Crit Care Med. 2012;40(9):2562-2568. PubMed
14. Churpek MM, Zadravecz FJ, Winslow C, Howell MD, Edelson DP. Incidence and prognostic value of the systemic inflammatory response syndrome and organ dysfunctions in ward patients. Am J Respir Crit Care Med. 2015;192(8):958-964. PubMed
15. Antonelli M, DeBacker D, Dorman T, Kleinpell R, Levy M, Rhodes A; Surviving Sepsis Campaign Executive Committee. Surviving Sepsis Campaign responds to Sepsis-3. Society of Critical Care Medicine website. http://www.survivingsepsis.org/SiteCollectionDocuments/SSC-Statements-Sepsis-Definitions-3-2016.pdf. Published March 1, 2016. Accessed May 11, 2016.
© 2017 Society of Hospital Medicine