User login
State of Research in Adult Hospital Medicine: Results of a National Survey
Almost all specialties in internal medicine have a sound scientific research base through which clinical practice is informed.1 For the field of Hospital Medicine (HM), this evidence has largely comprised research generated from fields outside of the specialty. The need to develop, invest, and grow investigators in hospital-based medicine remains unmet as HM and its footprint in hospital systems continue to grow.2,3
Despite this fact, little is known about the current state of research in HM. A 2014 survey of the members of the Society of Hospital Medicine (SHM) found that research output across the field of HM, as measured on the basis of peer-reviewed publications, was growing.4 Since then, however, the numbers of individuals engaged in research activities, their background and training, publication output, or funding sources have not been quantified. Similarly, little is known about which institutions support the development of junior investigators (ie, HM research fellowships), how these programs are funded, and whether or not matriculants enter the field as investigators. These gaps must be measured, evaluated, and ideally addressed through strategic policy and funding initiatives to advance the state of science within HM.
Members of the SHM Research Committee developed, designed, and deployed a survey to improve the understanding of the state of research in HM. In this study, we aimed to establish the baseline of research in HM to enable the measurement of progress through periodic waves of data collection. Specifically, we sought to quantify and describe the characteristics of existing research programs, the sources and types of funding, the number and background of faculty, and the availability of resources for training researchers in HM.
METHODS
Study Setting and Participants
Given that no defined list, database, or external resource that identifies research programs and contacts in HM exists, we began by creating a strategy to identify and sample adult
Survey Development
A workgroup within the SHM Research Committee was tasked to create a survey that would achieve four distinct goals: (1) identify institutions currently engaging in hospital-based research; (2) define the characteristics, including sources of research funding, training opportunities, criteria for promotion, and grant support, of research programs within institutions; (3) understand the prevalence of research fellowship programs, including size, training curricula, and funding sources; and (4) evaluate the productivity and funding sources of HM investigators at each site.
Survey questions that target each of these domains were drafted by the workgroup. Questions were pretested with colleagues outside the workgroup focused on this project (ie, from the main research committee). The instrument was refined and edited to improve the readability and clarity of questions on the basis of the feedback obtained through the iterative process. The revised instrument was then programmed into an online survey administration tool (SurveyMonkey®) to facilitate electronic dissemination. Finally, the members of the workgroup tested the online survey to ensure functionality. No identifiable information was collected from respondents, and no monetary incentive was offered for the completion of the survey. An invitation to participate in the survey was sent via e-mail to each of the program contacts identified.
Statistical Analysis
Descriptive statistics, including proportions, means, and percentages, were used to tabulate results. All analyses were conducted using Stata 13 MP/SE (StataCorp, College Station, Texas).
Ethical and Regulatory Considerations
The study was reviewed and deemed exempt from regulation by the University of Michigan Institutional Review Board (HUM000138628).
RESULTS
General Characteristics of Research Programs and Faculty
Out of 100 program contacts, 28 (representing 1,586 faculty members) responded and were included in the survey (program response rate = 28%). When comparing programs that did respond with those that did not, a greater proportion of programs in university settings were noted among respondents (79% vs 21%). Respondents represented programs from all regions of the United States, with most representing university-based (79%), university-affiliated (14%) or Veterans Health Administration (VHA; 11%) programs. Most respondents were in leadership roles, including division chiefs (32%), research directors/leads (21%), section chiefs (18%), and related titles, such as program director. Respondents indicated that the total number of faculty members in their programs (including nonclinicians and advance practice providers) varied from eight to 152 (mean [SD] = 57 [36]) members, with physicians representing the majority of faculty members (Table 1).
Among the 1,586 faculty members within the 28 programs, respondents identified 192 faculty members (12%) as currently receiving extra- or intramural support for research activities. Of these faculty, over half (58%) received <25% of effort from intra or extramural sources, and 28 (15%) and 52 (27%) faculty members received 25%-50% or >50% of support for their effort, respectively. The number of investigators who received funding across programs ranged from 0 to 28 faculty members. Compared with the 192 funded investigators, respondents indicated that a larger number of faculty in their programs (n = 656 or 41%) were involved in local quality improvement (QI) efforts. Of the 656 faculty members involved in QI efforts, 241 individuals (37%) were internally funded and received protected time/effort for their work.
Key Attributes of Research Programs
In the evaluation of the amount of total grant funding, respondents from 17 programs indicated that they received $500,000 in annual extra and intramural funding, and those from three programs stated that they received $500,000 to $999,999 in funding. Five respondents indicated that their programs currently received $1 million to $5 million in grant funding, and three reported >$5 million in research support. The sources of research funding included several divisions within the National Institute of Health (NIH, 12 programs), Agency for Healthcare Research and Quality (AHRQ, four programs), foundations (four programs), and internal grants (six programs). Additionally, six programs indicated “other” sources of funding that included the VHA, Patient-Centered Outcomes Research Institute (PCORI), Centers for Medicare and Medicaid Services, Centers for Disease Control (CDC), and industry sources.
A range of grants, including career development awards (11 programs); small grants, such as R21 and R03s (eight programs); R-level grants, including VA merit awards (five programs); program series grants, such as P and U grants (five programs), and foundation grants (eight programs), were reported as types of awards. Respondents from 16 programs indicated that they provided internal pilot grants. Amounts for such grants ranged from <$50,000 (14 programs) to $50,000-$100,000 (two programs).
Research Fellowship Programs/Training Programs
Only five of the 28 surveyed programs indicated that they currently had a research training or fellowship program for developing hospitalist investigators. The age of these programs varied from <1 year to 10 years. Three of the five programs stated that they had two fellows per year, and two stated they had spots for one trainee annually. All respondents indicated that fellows received training on study design, research methods, quantitative (eg, large database and secondary analyses) and qualitative data analysis. In addition, two programs included training in systematic review and meta-analyses, and three included focused courses on healthcare policy. Four of the five programs included training in QI tools, such as LEAN and Six Sigma. Funding for four of the five fellowship programs came from internal sources (eg, department and CTSA). However, two programs added they received some support from extramural funding and philanthropy. Following training, respondents from programs indicated that the majority of their graduates (60%) went on to hybrid research/QI roles (50/50 research/clinical effort), whereas 40% obtained dedicated research investigator (80/20) positions (Table 2).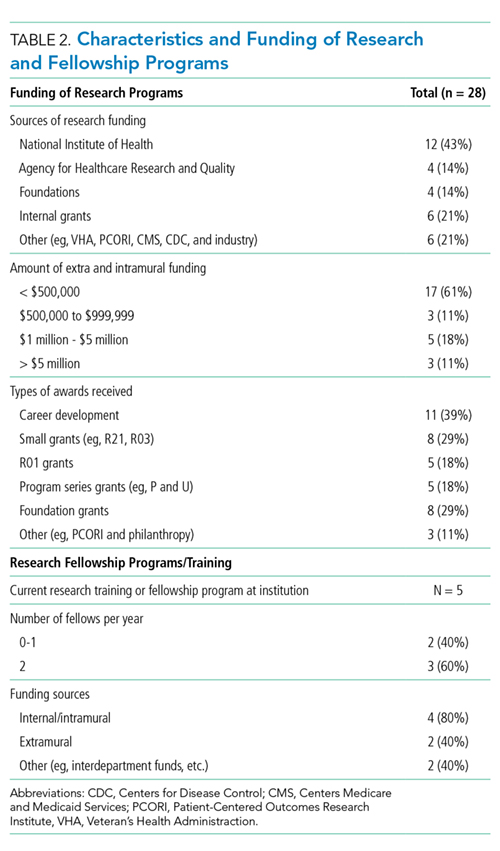
The 23 institutions without research training programs cited that the most important barrier for establishing such programs was lack of funding (12 programs) and the lack of a pipeline of hospitalists seeking such training (six programs). However, 15 programs indicated that opportunities for hospitalists to gain research training in the form of courses were available internally (eg, courses in the department or medical school) or externally (eg, School of Public Health). Seven programs indicated that they were planning to start a HM research fellowship within the next five years.
Research Faculty
Among the 28 respondents, 15 stated that they have faculty members who conduct research as their main professional activity (ie, >50% effort). The number of faculty members in each program in such roles varied from one to 10. Respondents indicated that faculty members in this category were most often midcareer assistant or associate professors with few full professors. All programs indicated that scholarship in the form of peer-reviewed publications was required for the promotion of faculty. Faculty members who performed research as their main activity had all received formal fellowship training and consequently had dual degrees (MD with MPH or MD, with MSc being the two most common combinations). With respect to clinical activities, most respondents indicated that research faculty spent 10% to 49% of their effort on clinical work. However, five respondents indicated that research faculty had <10% effort on clinical duties (Table 3).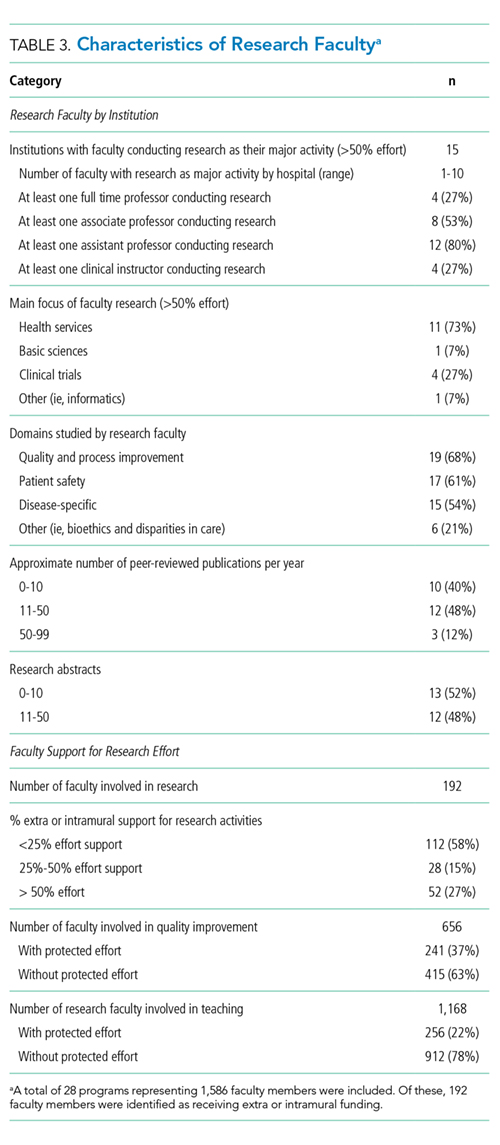
Eleven respondents (39%) identified the main focus of faculty as health service research, where four (14%) identified their main focus as clinical trials. Regardless of funding status, all respondents stated that their faculty were interested in studying quality and process improvement efforts (eg, transitions or readmissions, n = 19), patient safety initiatives (eg, hospital-acquired complications, n = 17), and disease-specific areas (eg, thrombosis, n = 15).
In terms of research output, 12 respondents stated that their research/QI faculty collectively published 11-50 peer-reviewed papers during the academic year, and 10 programs indicated that their faculty published 0-10 papers per year. Only three programs reported that their faculty collectively published 50-99 peer-reviewed papers per year. With respect to abstract presentations at national conferences, 13 programs indicated that they presented 0-10 abstracts, and 12 indicated that they presented 11-50.
DISCUSSION
In this first survey quantifying research activities in HM, respondents from 28 programs shared important insights into research activities at their institutions. Although our sample size was small, substantial variation in the size, composition, and structure of research programs in HM among respondents was observed. For example, few respondents indicated the availability of training programs for research in HM at their institutions. Similarly, among faculty who focused mainly on research, variation in funding streams and effort protection was observed. A preponderance of midcareer faculty with a range of funding sources, including NIH, AHRQ, VHA, CMS, and CDC was reported. Collectively, these data not only provide a unique glimpse into the state of research in HM but also help establish a baseline of the status of the field at large.
Some findings of our study are intuitive given our sampling strategy and the types of programs that responded. For example, the fact that most respondents for research programs represented university-based or affiliated institutions is expected given the tripartite academic mission. However, even within our sample of highly motivated programs, some findings are surprising and merit further exploration. For example, the observation that some respondents identified HM investigators within their program with <25% in intra- or extramural funding was unexpected. On the other extreme, we were surprised to find that three programs reported >$5 million in research funding. Understanding whether specific factors, such as the availability of experienced mentors within and outside departments or assistance from support staff (eg, statisticians and project managers), are associated with success and funding within these programs are important questions to answer. By focusing on these issues, we will be well poised as a field to understand what works, what does not work, and why.
Likewise, the finding that few programs within our sample offer formal training in the form of fellowships to research investigators represents an improvement opportunity. A pipeline for growing investigators is critical for the specialty that is HM. Notably, this call is not new; rather, previous investigators have highlighted the importance of developing academically oriented hospitalists for the future of the field.5 The implementation of faculty scholarship development programs has improved the scholarly output, mentoring activities, and succession planning of academics within HM.6,7 Conversely, lack of adequate mentorship and support for academic activities remains a challenge and as a factor associated with the failure to produce academic work.8 Without a cadre of investigators asking critical questions related to care delivery, the legitimacy of our field may be threatened.
While extrapolating to the field is difficult given the small number of our respondents, highlighting the progress that has been made is important. For example, while misalignment between funding and clinical and research mission persists, our survey found that several programs have been successful in securing extramural funding for their investigators. Additionally, internal funding for QI work appears to be increasing, with hospitalists receiving dedicated effort for much of this work. Innovation in how best to support and develop these types of efforts have also emerged. For example, the University of Michigan Specialist Hospitalist Allied Research Program offers dedicated effort and funding for hospitalists tackling projects germane to HM (eg, ordering of blood cultures for febrile inpatients) that overlap with subspecialists (eg, infectious diseases).9 Thus, hospitalists are linked with other specialties in the development of research agendas and academic products. Similarly, the launch of the HOMERUN network, a coalition of investigators who bridge health systems to study problems central to HM, has helped usher in a new era of research opportunities in the specialty.10 Fundamentally, the culture of HM has begun to place an emphasis on academic and scholarly productivity in addition to clinical prowess.11-13 Increased support and funding for training programs geared toward innovation and research in HM is needed to continue this mission. The Society for General Internal Medicine, American College of Physicians, and SHM have important roles to play as the largest professional organizations for generalists in this respect. Support for research, QI, and investigators in HM remains an urgent and largely unmet need.
Our study has limitations. First, our response rate was low at 28% but is consistent with the response rates of other surveys of physician groups.14 Caution in making inferences to the field at large is necessary given the potential for selection and nonresponse bias. However, we expect that respondents are likely biased toward programs actively conducting research and engaged in QI, thus better reflecting the state of these activities in HM. Second, given that we did not ask for any identifying information, we have no way of establishing the accuracy of the data provided by respondents. However, we have no reason to believe that responses would be altered in a systematic fashion. Future studies that link our findings to publicly available data (eg, databases of active grants and funding) might be useful. Third, while our survey instrument was created and internally validated by hospitalist researchers, its lack of external validation could limit findings. Finally, our results vary on the basis of how respondents answered questions related to effort and time allocation given that these measures differ across programs.
In summary, the findings from this study highlight substantial variations in the number, training, and funding of research faculty across HM programs. Understanding the factors behind the success of some programs and the failures of others appears important in informing and growing the research in the field. Future studies that aim to expand survey participation, raise the awareness of the state of research in HM, and identify barriers and facilitators to academic success in HM are needed.
Disclosures
Dr. Chopra discloses grant funding from the Agency for Healthcare Research and Quality (AHRQ), VA Health Services and Research Department, and Centers for Disease Control. Dr. Jones discloses grant funding from AHRQ. All other authors disclose no conflicts of interest.
1. International Working Party to Promote and Revitalise Academic Medicine. Academic medicine: the evidence base. BMJ. 2004;329(7469):789-792. PubMed
2. Flanders SA, Saint S, McMahon LF, Howell JD. Where should hospitalists sit within the academic medical center? J Gen Intern Med. 2008;23(8):1269-1272. PubMed
3. Flanders SA, Centor B, Weber V, McGinn T, Desalvo K, Auerbach A. Challenges and opportunities in academic hospital medicine: report from the academic hospital medicine summit. J Gen Intern Med. 2009;24(5):636-641. PubMed
4. Dang Do AN, Munchhof AM, Terry C, Emmett T, Kara A. Research and publication trends in hospital medicine. J Hosp Med. 2014;9(3):148-154. PubMed
5. Harrison R, Hunter AJ, Sharpe B, Auerbach AD. Survey of US academic hospitalist leaders about mentorship and academic activities in hospitalist groups. J Hosp Med. 2011;6(1):5-9. PubMed
6. Sehgal NL, Sharpe BA, Auerbach AA, Wachter RM. Investing in the future: building an academic hospitalist faculty development program. J Hosp Med. 2011;6(3):161-166. PubMed
7. Nagarur A, O’Neill RM, Lawton D, Greenwald JL. Supporting faculty development in hospital medicine: design and implementation of a personalized structured mentoring program. J Hosp Med. 2018;13(2):96-99. PubMed
8. Reid MB, Misky GJ, Harrison RA, Sharpe B, Auerbach A, Glasheen JJ. Mentorship, productivity, and promotion among academic hospitalists. J Gen Intern Med. 2012;27(1):23-27. PubMed
9. Flanders SA, Kaufman SR, Nallamothu BK, Saint S. The University of Michigan Specialist-Hospitalist Allied Research Program: jumpstarting hospital medicine research. J Hosp Med. 2008;3(4):308-313. PubMed
10. Auerbach AD, Patel MS, Metlay JP, et al. The Hospital Medicine Reengineering Network (HOMERuN): a learning organization focused on improving hospital care. Acad Med. 2014;89(3):415-420. PubMed
11. Souba WW. Academic medicine’s core values: what do they mean? J Surg Res. 2003;115(2):171-173. PubMed
12. Bonsall J, Chopra V. Building an academic pipeline: a combined society of hospital medicine committee initiative. J Hosp Med. 2016;11(10):735-736. PubMed
13. Sweigart JR, Tad YD, Kneeland P, Williams MV, Glasheen JJ. Hospital medicine resident training tracks: developing the hospital medicine pipeline. J Hosp Med. 2017;12(3):173-176. PubMed
14. Cunningham CT, Quan H, Hemmelgarn B, et al. Exploring physician specialist response rates to web-based surveys. BMC Med Res Methodol. 2015;15(1):32. PubMed
Almost all specialties in internal medicine have a sound scientific research base through which clinical practice is informed.1 For the field of Hospital Medicine (HM), this evidence has largely comprised research generated from fields outside of the specialty. The need to develop, invest, and grow investigators in hospital-based medicine remains unmet as HM and its footprint in hospital systems continue to grow.2,3
Despite this fact, little is known about the current state of research in HM. A 2014 survey of the members of the Society of Hospital Medicine (SHM) found that research output across the field of HM, as measured on the basis of peer-reviewed publications, was growing.4 Since then, however, the numbers of individuals engaged in research activities, their background and training, publication output, or funding sources have not been quantified. Similarly, little is known about which institutions support the development of junior investigators (ie, HM research fellowships), how these programs are funded, and whether or not matriculants enter the field as investigators. These gaps must be measured, evaluated, and ideally addressed through strategic policy and funding initiatives to advance the state of science within HM.
Members of the SHM Research Committee developed, designed, and deployed a survey to improve the understanding of the state of research in HM. In this study, we aimed to establish the baseline of research in HM to enable the measurement of progress through periodic waves of data collection. Specifically, we sought to quantify and describe the characteristics of existing research programs, the sources and types of funding, the number and background of faculty, and the availability of resources for training researchers in HM.
METHODS
Study Setting and Participants
Given that no defined list, database, or external resource that identifies research programs and contacts in HM exists, we began by creating a strategy to identify and sample adult
Survey Development
A workgroup within the SHM Research Committee was tasked to create a survey that would achieve four distinct goals: (1) identify institutions currently engaging in hospital-based research; (2) define the characteristics, including sources of research funding, training opportunities, criteria for promotion, and grant support, of research programs within institutions; (3) understand the prevalence of research fellowship programs, including size, training curricula, and funding sources; and (4) evaluate the productivity and funding sources of HM investigators at each site.
Survey questions that target each of these domains were drafted by the workgroup. Questions were pretested with colleagues outside the workgroup focused on this project (ie, from the main research committee). The instrument was refined and edited to improve the readability and clarity of questions on the basis of the feedback obtained through the iterative process. The revised instrument was then programmed into an online survey administration tool (SurveyMonkey®) to facilitate electronic dissemination. Finally, the members of the workgroup tested the online survey to ensure functionality. No identifiable information was collected from respondents, and no monetary incentive was offered for the completion of the survey. An invitation to participate in the survey was sent via e-mail to each of the program contacts identified.
Statistical Analysis
Descriptive statistics, including proportions, means, and percentages, were used to tabulate results. All analyses were conducted using Stata 13 MP/SE (StataCorp, College Station, Texas).
Ethical and Regulatory Considerations
The study was reviewed and deemed exempt from regulation by the University of Michigan Institutional Review Board (HUM000138628).
RESULTS
General Characteristics of Research Programs and Faculty
Out of 100 program contacts, 28 (representing 1,586 faculty members) responded and were included in the survey (program response rate = 28%). When comparing programs that did respond with those that did not, a greater proportion of programs in university settings were noted among respondents (79% vs 21%). Respondents represented programs from all regions of the United States, with most representing university-based (79%), university-affiliated (14%) or Veterans Health Administration (VHA; 11%) programs. Most respondents were in leadership roles, including division chiefs (32%), research directors/leads (21%), section chiefs (18%), and related titles, such as program director. Respondents indicated that the total number of faculty members in their programs (including nonclinicians and advance practice providers) varied from eight to 152 (mean [SD] = 57 [36]) members, with physicians representing the majority of faculty members (Table 1).
Among the 1,586 faculty members within the 28 programs, respondents identified 192 faculty members (12%) as currently receiving extra- or intramural support for research activities. Of these faculty, over half (58%) received <25% of effort from intra or extramural sources, and 28 (15%) and 52 (27%) faculty members received 25%-50% or >50% of support for their effort, respectively. The number of investigators who received funding across programs ranged from 0 to 28 faculty members. Compared with the 192 funded investigators, respondents indicated that a larger number of faculty in their programs (n = 656 or 41%) were involved in local quality improvement (QI) efforts. Of the 656 faculty members involved in QI efforts, 241 individuals (37%) were internally funded and received protected time/effort for their work.
Key Attributes of Research Programs
In the evaluation of the amount of total grant funding, respondents from 17 programs indicated that they received $500,000 in annual extra and intramural funding, and those from three programs stated that they received $500,000 to $999,999 in funding. Five respondents indicated that their programs currently received $1 million to $5 million in grant funding, and three reported >$5 million in research support. The sources of research funding included several divisions within the National Institute of Health (NIH, 12 programs), Agency for Healthcare Research and Quality (AHRQ, four programs), foundations (four programs), and internal grants (six programs). Additionally, six programs indicated “other” sources of funding that included the VHA, Patient-Centered Outcomes Research Institute (PCORI), Centers for Medicare and Medicaid Services, Centers for Disease Control (CDC), and industry sources.
A range of grants, including career development awards (11 programs); small grants, such as R21 and R03s (eight programs); R-level grants, including VA merit awards (five programs); program series grants, such as P and U grants (five programs), and foundation grants (eight programs), were reported as types of awards. Respondents from 16 programs indicated that they provided internal pilot grants. Amounts for such grants ranged from <$50,000 (14 programs) to $50,000-$100,000 (two programs).
Research Fellowship Programs/Training Programs
Only five of the 28 surveyed programs indicated that they currently had a research training or fellowship program for developing hospitalist investigators. The age of these programs varied from <1 year to 10 years. Three of the five programs stated that they had two fellows per year, and two stated they had spots for one trainee annually. All respondents indicated that fellows received training on study design, research methods, quantitative (eg, large database and secondary analyses) and qualitative data analysis. In addition, two programs included training in systematic review and meta-analyses, and three included focused courses on healthcare policy. Four of the five programs included training in QI tools, such as LEAN and Six Sigma. Funding for four of the five fellowship programs came from internal sources (eg, department and CTSA). However, two programs added they received some support from extramural funding and philanthropy. Following training, respondents from programs indicated that the majority of their graduates (60%) went on to hybrid research/QI roles (50/50 research/clinical effort), whereas 40% obtained dedicated research investigator (80/20) positions (Table 2).
The 23 institutions without research training programs cited that the most important barrier for establishing such programs was lack of funding (12 programs) and the lack of a pipeline of hospitalists seeking such training (six programs). However, 15 programs indicated that opportunities for hospitalists to gain research training in the form of courses were available internally (eg, courses in the department or medical school) or externally (eg, School of Public Health). Seven programs indicated that they were planning to start a HM research fellowship within the next five years.
Research Faculty
Among the 28 respondents, 15 stated that they have faculty members who conduct research as their main professional activity (ie, >50% effort). The number of faculty members in each program in such roles varied from one to 10. Respondents indicated that faculty members in this category were most often midcareer assistant or associate professors with few full professors. All programs indicated that scholarship in the form of peer-reviewed publications was required for the promotion of faculty. Faculty members who performed research as their main activity had all received formal fellowship training and consequently had dual degrees (MD with MPH or MD, with MSc being the two most common combinations). With respect to clinical activities, most respondents indicated that research faculty spent 10% to 49% of their effort on clinical work. However, five respondents indicated that research faculty had <10% effort on clinical duties (Table 3).
Eleven respondents (39%) identified the main focus of faculty as health service research, where four (14%) identified their main focus as clinical trials. Regardless of funding status, all respondents stated that their faculty were interested in studying quality and process improvement efforts (eg, transitions or readmissions, n = 19), patient safety initiatives (eg, hospital-acquired complications, n = 17), and disease-specific areas (eg, thrombosis, n = 15).
In terms of research output, 12 respondents stated that their research/QI faculty collectively published 11-50 peer-reviewed papers during the academic year, and 10 programs indicated that their faculty published 0-10 papers per year. Only three programs reported that their faculty collectively published 50-99 peer-reviewed papers per year. With respect to abstract presentations at national conferences, 13 programs indicated that they presented 0-10 abstracts, and 12 indicated that they presented 11-50.
DISCUSSION
In this first survey quantifying research activities in HM, respondents from 28 programs shared important insights into research activities at their institutions. Although our sample size was small, substantial variation in the size, composition, and structure of research programs in HM among respondents was observed. For example, few respondents indicated the availability of training programs for research in HM at their institutions. Similarly, among faculty who focused mainly on research, variation in funding streams and effort protection was observed. A preponderance of midcareer faculty with a range of funding sources, including NIH, AHRQ, VHA, CMS, and CDC was reported. Collectively, these data not only provide a unique glimpse into the state of research in HM but also help establish a baseline of the status of the field at large.
Some findings of our study are intuitive given our sampling strategy and the types of programs that responded. For example, the fact that most respondents for research programs represented university-based or affiliated institutions is expected given the tripartite academic mission. However, even within our sample of highly motivated programs, some findings are surprising and merit further exploration. For example, the observation that some respondents identified HM investigators within their program with <25% in intra- or extramural funding was unexpected. On the other extreme, we were surprised to find that three programs reported >$5 million in research funding. Understanding whether specific factors, such as the availability of experienced mentors within and outside departments or assistance from support staff (eg, statisticians and project managers), are associated with success and funding within these programs are important questions to answer. By focusing on these issues, we will be well poised as a field to understand what works, what does not work, and why.
Likewise, the finding that few programs within our sample offer formal training in the form of fellowships to research investigators represents an improvement opportunity. A pipeline for growing investigators is critical for the specialty that is HM. Notably, this call is not new; rather, previous investigators have highlighted the importance of developing academically oriented hospitalists for the future of the field.5 The implementation of faculty scholarship development programs has improved the scholarly output, mentoring activities, and succession planning of academics within HM.6,7 Conversely, lack of adequate mentorship and support for academic activities remains a challenge and as a factor associated with the failure to produce academic work.8 Without a cadre of investigators asking critical questions related to care delivery, the legitimacy of our field may be threatened.
While extrapolating to the field is difficult given the small number of our respondents, highlighting the progress that has been made is important. For example, while misalignment between funding and clinical and research mission persists, our survey found that several programs have been successful in securing extramural funding for their investigators. Additionally, internal funding for QI work appears to be increasing, with hospitalists receiving dedicated effort for much of this work. Innovation in how best to support and develop these types of efforts have also emerged. For example, the University of Michigan Specialist Hospitalist Allied Research Program offers dedicated effort and funding for hospitalists tackling projects germane to HM (eg, ordering of blood cultures for febrile inpatients) that overlap with subspecialists (eg, infectious diseases).9 Thus, hospitalists are linked with other specialties in the development of research agendas and academic products. Similarly, the launch of the HOMERUN network, a coalition of investigators who bridge health systems to study problems central to HM, has helped usher in a new era of research opportunities in the specialty.10 Fundamentally, the culture of HM has begun to place an emphasis on academic and scholarly productivity in addition to clinical prowess.11-13 Increased support and funding for training programs geared toward innovation and research in HM is needed to continue this mission. The Society for General Internal Medicine, American College of Physicians, and SHM have important roles to play as the largest professional organizations for generalists in this respect. Support for research, QI, and investigators in HM remains an urgent and largely unmet need.
Our study has limitations. First, our response rate was low at 28% but is consistent with the response rates of other surveys of physician groups.14 Caution in making inferences to the field at large is necessary given the potential for selection and nonresponse bias. However, we expect that respondents are likely biased toward programs actively conducting research and engaged in QI, thus better reflecting the state of these activities in HM. Second, given that we did not ask for any identifying information, we have no way of establishing the accuracy of the data provided by respondents. However, we have no reason to believe that responses would be altered in a systematic fashion. Future studies that link our findings to publicly available data (eg, databases of active grants and funding) might be useful. Third, while our survey instrument was created and internally validated by hospitalist researchers, its lack of external validation could limit findings. Finally, our results vary on the basis of how respondents answered questions related to effort and time allocation given that these measures differ across programs.
In summary, the findings from this study highlight substantial variations in the number, training, and funding of research faculty across HM programs. Understanding the factors behind the success of some programs and the failures of others appears important in informing and growing the research in the field. Future studies that aim to expand survey participation, raise the awareness of the state of research in HM, and identify barriers and facilitators to academic success in HM are needed.
Disclosures
Dr. Chopra discloses grant funding from the Agency for Healthcare Research and Quality (AHRQ), VA Health Services and Research Department, and Centers for Disease Control. Dr. Jones discloses grant funding from AHRQ. All other authors disclose no conflicts of interest.
1. International Working Party to Promote and Revitalise Academic Medicine. Academic medicine: the evidence base. BMJ. 2004;329(7469):789-792. PubMed
2. Flanders SA, Saint S, McMahon LF, Howell JD. Where should hospitalists sit within the academic medical center? J Gen Intern Med. 2008;23(8):1269-1272. PubMed
3. Flanders SA, Centor B, Weber V, McGinn T, Desalvo K, Auerbach A. Challenges and opportunities in academic hospital medicine: report from the academic hospital medicine summit. J Gen Intern Med. 2009;24(5):636-641. PubMed
4. Dang Do AN, Munchhof AM, Terry C, Emmett T, Kara A. Research and publication trends in hospital medicine. J Hosp Med. 2014;9(3):148-154. PubMed
5. Harrison R, Hunter AJ, Sharpe B, Auerbach AD. Survey of US academic hospitalist leaders about mentorship and academic activities in hospitalist groups. J Hosp Med. 2011;6(1):5-9. PubMed
6. Sehgal NL, Sharpe BA, Auerbach AA, Wachter RM. Investing in the future: building an academic hospitalist faculty development program. J Hosp Med. 2011;6(3):161-166. PubMed
7. Nagarur A, O’Neill RM, Lawton D, Greenwald JL. Supporting faculty development in hospital medicine: design and implementation of a personalized structured mentoring program. J Hosp Med. 2018;13(2):96-99. PubMed
8. Reid MB, Misky GJ, Harrison RA, Sharpe B, Auerbach A, Glasheen JJ. Mentorship, productivity, and promotion among academic hospitalists. J Gen Intern Med. 2012;27(1):23-27. PubMed
9. Flanders SA, Kaufman SR, Nallamothu BK, Saint S. The University of Michigan Specialist-Hospitalist Allied Research Program: jumpstarting hospital medicine research. J Hosp Med. 2008;3(4):308-313. PubMed
10. Auerbach AD, Patel MS, Metlay JP, et al. The Hospital Medicine Reengineering Network (HOMERuN): a learning organization focused on improving hospital care. Acad Med. 2014;89(3):415-420. PubMed
11. Souba WW. Academic medicine’s core values: what do they mean? J Surg Res. 2003;115(2):171-173. PubMed
12. Bonsall J, Chopra V. Building an academic pipeline: a combined society of hospital medicine committee initiative. J Hosp Med. 2016;11(10):735-736. PubMed
13. Sweigart JR, Tad YD, Kneeland P, Williams MV, Glasheen JJ. Hospital medicine resident training tracks: developing the hospital medicine pipeline. J Hosp Med. 2017;12(3):173-176. PubMed
14. Cunningham CT, Quan H, Hemmelgarn B, et al. Exploring physician specialist response rates to web-based surveys. BMC Med Res Methodol. 2015;15(1):32. PubMed
© 2019 Society of Hospital Medicine
Leadership & Professional Development: Know Your TLR
“Better to remain silent and be thought a fool than to speak and remove all doubt..”
—Abraham Lincoln
Have you ever been in a meeting with a supervisor wondering when you will get a chance to speak? Or have you walked away from an interview not knowing much about the candidate because you were talking all the time? If so, it might be time to consider your TLR: Talking to Listening Ratio. The TLR is a leadership pearl of great value. By keeping track of how much you talk versus how much you listen, you learn how and when to keep quiet.
As Mark Goulston wrote, “There are three stages of speaking to other people. In the first stage, you are on task, relevant and concise . . . the second stage (is) when it feels so good to talk, you don’t even notice the other person is not listening. The third stage occurs after you have lost track of what you were saying and begin to realize you might need to reel the other person back in.” Rather than finding a way to re-engage the other person by giving them a chance to talk while you listen, “. . . the usual impulse is to talk even more in an effort to regain their interest.”1
When you are talking, you are not listening—and when you are not listening, you are not learning. Executives who do all the talking at meetings do not have the opportunity to hear the ideas of others. Poor listening can make it appear as if you don’t care what others think. Worse, being a hypocompetent listener can turn you into an ineffective leader—one who does not have the trust or respect of others.
The TLR is highly relevant for hospitalists: physicians and nurses who do all the talking are not noticing what patients or families want to say or what potentially mistaken conclusions they are drawing. Similarly, quality improvement and patient safety champions who do all the talking are not discovering what frontline clinicians think about an initiative or what barriers need to be overcome for success. They are also not hearing novel approaches to the problem or different priorities that should be addressed instead.
Your goal: ensure that your TLR is less than 1. How? Make it a habit to reflect on your TLR after an encounter with a patient, colleague, or supervisor and ask yourself, “Did I listen well?” In addition to its value in monitoring your own talkativeness, use the TLR to measure others. For example, when interviewing a new hire, apply TLR to discover how much patience would be required to work with a candidate. We once interviewed a physician whose TLR was north of 20 . . . we passed on hiring them. The TLR is also helpful for managing meetings. If you find yourself in one with an over-talker (TLR >5), point to the agenda and redirect the discussion. If it’s a direct report or colleague that’s doing all the talking, remind them that you have another meeting in 30 minutes, so they will need to move things along. Better yet: share the TLR pearl with them so that they can reflect on their performance. If you’re dealing with an under-talker (eg, TLR<0.5), encourage them to voice their opinion. Who knows—you might learn a thing or two.
The most surprising aspect to us about TLR is how oblivious people tend to be about it. High TLR’ers have little idea about the effect they have on people while those with an extremely low TLR (less than 0.2) wonder why they didn’t get picked for a project or promotion. Aim for a TLR between 0.5 and 0.7. Doing so will make you a better leader and follower.
Disclosures
Drs. Saint and Chopra are co-authors of the upcoming book, “Thirty Rules for Healthcare Leaders,” from which this article is adapted. Both authors have no other relevant conflicts of interest.
1. Goulston M. How to Know If You Talk Too Much. Harvard Business Review. https://hbr.org/2015/06/how-to-know-if-you-talk-too-much. Accessed January 30, 2019.
“Better to remain silent and be thought a fool than to speak and remove all doubt..”
—Abraham Lincoln
Have you ever been in a meeting with a supervisor wondering when you will get a chance to speak? Or have you walked away from an interview not knowing much about the candidate because you were talking all the time? If so, it might be time to consider your TLR: Talking to Listening Ratio. The TLR is a leadership pearl of great value. By keeping track of how much you talk versus how much you listen, you learn how and when to keep quiet.
As Mark Goulston wrote, “There are three stages of speaking to other people. In the first stage, you are on task, relevant and concise . . . the second stage (is) when it feels so good to talk, you don’t even notice the other person is not listening. The third stage occurs after you have lost track of what you were saying and begin to realize you might need to reel the other person back in.” Rather than finding a way to re-engage the other person by giving them a chance to talk while you listen, “. . . the usual impulse is to talk even more in an effort to regain their interest.”1
When you are talking, you are not listening—and when you are not listening, you are not learning. Executives who do all the talking at meetings do not have the opportunity to hear the ideas of others. Poor listening can make it appear as if you don’t care what others think. Worse, being a hypocompetent listener can turn you into an ineffective leader—one who does not have the trust or respect of others.
The TLR is highly relevant for hospitalists: physicians and nurses who do all the talking are not noticing what patients or families want to say or what potentially mistaken conclusions they are drawing. Similarly, quality improvement and patient safety champions who do all the talking are not discovering what frontline clinicians think about an initiative or what barriers need to be overcome for success. They are also not hearing novel approaches to the problem or different priorities that should be addressed instead.
Your goal: ensure that your TLR is less than 1. How? Make it a habit to reflect on your TLR after an encounter with a patient, colleague, or supervisor and ask yourself, “Did I listen well?” In addition to its value in monitoring your own talkativeness, use the TLR to measure others. For example, when interviewing a new hire, apply TLR to discover how much patience would be required to work with a candidate. We once interviewed a physician whose TLR was north of 20 . . . we passed on hiring them. The TLR is also helpful for managing meetings. If you find yourself in one with an over-talker (TLR >5), point to the agenda and redirect the discussion. If it’s a direct report or colleague that’s doing all the talking, remind them that you have another meeting in 30 minutes, so they will need to move things along. Better yet: share the TLR pearl with them so that they can reflect on their performance. If you’re dealing with an under-talker (eg, TLR<0.5), encourage them to voice their opinion. Who knows—you might learn a thing or two.
The most surprising aspect to us about TLR is how oblivious people tend to be about it. High TLR’ers have little idea about the effect they have on people while those with an extremely low TLR (less than 0.2) wonder why they didn’t get picked for a project or promotion. Aim for a TLR between 0.5 and 0.7. Doing so will make you a better leader and follower.
Disclosures
Drs. Saint and Chopra are co-authors of the upcoming book, “Thirty Rules for Healthcare Leaders,” from which this article is adapted. Both authors have no other relevant conflicts of interest.
1. Goulston M. How to Know If You Talk Too Much. Harvard Business Review. https://hbr.org/2015/06/how-to-know-if-you-talk-too-much. Accessed January 30, 2019.
1. Goulston M. How to Know If You Talk Too Much. Harvard Business Review. https://hbr.org/2015/06/how-to-know-if-you-talk-too-much. Accessed January 30, 2019.
Introducing Leadership & Professional Development: A New Series in JHM
“I cannot say whether things will get better if we change; what I can say is they must change if they are to get better.”
—Georg C. Lichtenburg
Leading change is never easy. Many a physician has joined a committee, hired a promising project manager, assumed responsibility for an operational or clinical task—only to have it painfully falter or agonizingly fail. Unfortunately, some of us become disillusioned with the process, donning our white coats to return to the safe ensconce of clinical work rather than take on another perilous change or leadership task. But ask those that have tried and failed and those that have succeeded and they will tell you this: the lessons learned in the journey were invaluable.
Academic medical centers and healthcare organizations are increasingly turning to hospitalists to assume a myriad of leadership roles. With very little formal training, many of us jump in to improve organizational culture, financial accountability, and patient safety, literally building the bridge as we walk on it. The practical knowledge and know-how gleaned in efforts during these endeavors are perhaps just as important as evidence-based medicine. And yet, few venues to share and disseminate these insights currently exist.
This void represents the motivation behind the new Journal series entitled, “Leadership & Professional Development” or “LPD.” In these brief excerpts, lessons on leadership/followership, mentorship/menteeship, leading change and professional development will be shared using a conversational and pragmatic tone. Like a clinical case, pearls to help you navigate development and organizational challenges will be shared. The goal is simple: read an LPD and walk away with an “a-ha,” a new tool, or a strategy that you can use ASAP. For example, in the debut LPD—Hire Hard1—we emphasize a cardinal rule for hiring: wait for the right person. Waiting is not easy, but it is well worth it in the long run—the right person will make your job that much better. Remember the aphorism: A’s hire A’s while B’s hire C’s.
Many other nuggets of wisdom can fit an LPD model. For example, when it comes to stress, a technique that brings mindfulness to your day—one you can practice with every patient encounter—might be the ticket.2 Interested in mentoring? You’ll need to know the Six Golden Rules.3 And don’t forget about emotional intelligence, tight-loose-tight management or the tree-climbing monkey! Don’t know what these are? Time to read an LPD or two to find out!
As you might have guessed—some of these pieces are already written. They come from a book that my colleague, Sanjay Saint and I have been busy writing for over a year. The book distills much of what we have learned as clinicians, researchers and administrators into a collection we call, “Thirty Leadership Rules for Healthcare Providers.” But LPD is not an advert for the book; rather, our contributions will only account for some of the series. We hope this venue will become a platform in where readers like you can offer “pearls” to the broader community. The rules are simple: coin a rule/pearl, open with an illustrative quote, frame it in 650 words with no more than five references, and write it so that a reader can apply it to their work tomorrow. And don’t worry—we on the editorial team will help you craft th
Disclosures
Dr. Chopra has nothing to disclose.
1. Chopra V, Saint S. Hire Hard. Manage Easy. J Hosp Med. 2019;14(2):74. doi: 10.12788/jhm.3158.
2. Gilmartin H, Saint S, Rogers M, et al. Pilot randomised controlled trial to improve hand hygiene through mindful moments. BMJ Qual Saf. 2018;27(10):799-806. PubMed
3. Chopra V, Saint S. What Mentors Wish Their Mentees Knew. Harvard Business Review. 2017. https://hbr.org/2017/11/what-mentors-wish-their-mentees-knew. Accessed December 17, 2018. PubMed
“I cannot say whether things will get better if we change; what I can say is they must change if they are to get better.”
—Georg C. Lichtenburg
Leading change is never easy. Many a physician has joined a committee, hired a promising project manager, assumed responsibility for an operational or clinical task—only to have it painfully falter or agonizingly fail. Unfortunately, some of us become disillusioned with the process, donning our white coats to return to the safe ensconce of clinical work rather than take on another perilous change or leadership task. But ask those that have tried and failed and those that have succeeded and they will tell you this: the lessons learned in the journey were invaluable.
Academic medical centers and healthcare organizations are increasingly turning to hospitalists to assume a myriad of leadership roles. With very little formal training, many of us jump in to improve organizational culture, financial accountability, and patient safety, literally building the bridge as we walk on it. The practical knowledge and know-how gleaned in efforts during these endeavors are perhaps just as important as evidence-based medicine. And yet, few venues to share and disseminate these insights currently exist.
This void represents the motivation behind the new Journal series entitled, “Leadership & Professional Development” or “LPD.” In these brief excerpts, lessons on leadership/followership, mentorship/menteeship, leading change and professional development will be shared using a conversational and pragmatic tone. Like a clinical case, pearls to help you navigate development and organizational challenges will be shared. The goal is simple: read an LPD and walk away with an “a-ha,” a new tool, or a strategy that you can use ASAP. For example, in the debut LPD—Hire Hard1—we emphasize a cardinal rule for hiring: wait for the right person. Waiting is not easy, but it is well worth it in the long run—the right person will make your job that much better. Remember the aphorism: A’s hire A’s while B’s hire C’s.
Many other nuggets of wisdom can fit an LPD model. For example, when it comes to stress, a technique that brings mindfulness to your day—one you can practice with every patient encounter—might be the ticket.2 Interested in mentoring? You’ll need to know the Six Golden Rules.3 And don’t forget about emotional intelligence, tight-loose-tight management or the tree-climbing monkey! Don’t know what these are? Time to read an LPD or two to find out!
As you might have guessed—some of these pieces are already written. They come from a book that my colleague, Sanjay Saint and I have been busy writing for over a year. The book distills much of what we have learned as clinicians, researchers and administrators into a collection we call, “Thirty Leadership Rules for Healthcare Providers.” But LPD is not an advert for the book; rather, our contributions will only account for some of the series. We hope this venue will become a platform in where readers like you can offer “pearls” to the broader community. The rules are simple: coin a rule/pearl, open with an illustrative quote, frame it in 650 words with no more than five references, and write it so that a reader can apply it to their work tomorrow. And don’t worry—we on the editorial team will help you craft th
Disclosures
Dr. Chopra has nothing to disclose.
1. Chopra V, Saint S. Hire Hard. Manage Easy. J Hosp Med. 2019;14(2):74. doi: 10.12788/jhm.3158.
2. Gilmartin H, Saint S, Rogers M, et al. Pilot randomised controlled trial to improve hand hygiene through mindful moments. BMJ Qual Saf. 2018;27(10):799-806. PubMed
3. Chopra V, Saint S. What Mentors Wish Their Mentees Knew. Harvard Business Review. 2017. https://hbr.org/2017/11/what-mentors-wish-their-mentees-knew. Accessed December 17, 2018. PubMed
© 2019 Society of Hospital Medicine
In Reply to “Diving Into Diagnostic Uncertainty: Strategies to Mitigate Cognitive Load. In Reference to: ‘Focused Ethnography of Diagnosis in Academic Medical Centers’”
We thank Dr. Santhosh and colleagues for their letter concerning our article.1 We agree that the diagnostic journey includes interactions both between and across teams, not just those within the patient’s team. In an article currently in press in Diagnosis, we examine how systems and cognitive factors interact during the process of diagnosis. Specifically, we reported on how communication between consultants can be both a barrier and facilitator to the diagnostic process.2 We found that the frequency, quality, and pace of communication between and across inpatient teams and specialists are essential to timely diagnoses. As diagnostic errors remain a costly and morbid issue in the hospital setting, efforts to improve communication are clearly needed.3
Santhosh et al. raise an interesting point regarding cognitive load in evaluating diagnosis. Cognitive load is a multidimensional construct that represents the load that performing a specific task poses on a learner’s cognitive system.4 Components often used for measuring load include (a) task characteristics such as format, complexity, and time pressure; (b) subject characteristics such as expertise level, age, and spatial abilities; and (c) mental load and effort that originate from the interaction between task and subject characteristics.5 While there is little doubt that measuring these constructs has face value in diagnosis, we know of no instruments that are nimble
Disclosures
The authors have nothing to disclose.
Funding
This project was supported by grant number P30HS024385 from the Agency for Healthcare Research and Quality. The funding source played no role in study design, data acquisition, analysis or decision to report these data.
1. Chopra V, Harrod M, Winter S, et al. Focused ethnography of diagnosis in academic medical centers. J Hosp Med. 2018;13(10):668-672. doi: 10.12788/jhm.2966 PubMed
2. Gupta A, Harrod M, Quinn M, et al. Mind the overlap: how system problems contribute to cognitive failure and diagnostic errors. Diagnosis. 2018; In Press PubMed
3. Gupta A, Snyder A, Kachalia A, et al. Malpractice claims related to diagnostic errors in the hospital [published online ahead of print August 11, 2017]. BMJ Qual Saf. 2017. doi: 10.1136/bmjqs-2017-006774 PubMed
4. Paas FG, Van Merrienboer JJ, Adam JJ. Measurement of cognitive load in instructional research. Percept Mot Skills. 1994;79(1 Pt 2):419-30. doi: 10.2466/pms.1994.79.1.419 PubMed
5. Paas FG, Tuovinen JE, Tabbers H, et al. Cognitive load measurement as a means to advance cognitive load theory. Educational Psychologist. 2003;38(1):63-71. doi: 10.1207/S15326985EP3801_8
We thank Dr. Santhosh and colleagues for their letter concerning our article.1 We agree that the diagnostic journey includes interactions both between and across teams, not just those within the patient’s team. In an article currently in press in Diagnosis, we examine how systems and cognitive factors interact during the process of diagnosis. Specifically, we reported on how communication between consultants can be both a barrier and facilitator to the diagnostic process.2 We found that the frequency, quality, and pace of communication between and across inpatient teams and specialists are essential to timely diagnoses. As diagnostic errors remain a costly and morbid issue in the hospital setting, efforts to improve communication are clearly needed.3
Santhosh et al. raise an interesting point regarding cognitive load in evaluating diagnosis. Cognitive load is a multidimensional construct that represents the load that performing a specific task poses on a learner’s cognitive system.4 Components often used for measuring load include (a) task characteristics such as format, complexity, and time pressure; (b) subject characteristics such as expertise level, age, and spatial abilities; and (c) mental load and effort that originate from the interaction between task and subject characteristics.5 While there is little doubt that measuring these constructs has face value in diagnosis, we know of no instruments that are nimble
Disclosures
The authors have nothing to disclose.
Funding
This project was supported by grant number P30HS024385 from the Agency for Healthcare Research and Quality. The funding source played no role in study design, data acquisition, analysis or decision to report these data.
1. Chopra V, Harrod M, Winter S, et al. Focused ethnography of diagnosis in academic medical centers. J Hosp Med. 2018;13(10):668-672. doi: 10.12788/jhm.2966 PubMed
2. Gupta A, Harrod M, Quinn M, et al. Mind the overlap: how system problems contribute to cognitive failure and diagnostic errors. Diagnosis. 2018; In Press PubMed
3. Gupta A, Snyder A, Kachalia A, et al. Malpractice claims related to diagnostic errors in the hospital [published online ahead of print August 11, 2017]. BMJ Qual Saf. 2017. doi: 10.1136/bmjqs-2017-006774 PubMed
4. Paas FG, Van Merrienboer JJ, Adam JJ. Measurement of cognitive load in instructional research. Percept Mot Skills. 1994;79(1 Pt 2):419-30. doi: 10.2466/pms.1994.79.1.419 PubMed
5. Paas FG, Tuovinen JE, Tabbers H, et al. Cognitive load measurement as a means to advance cognitive load theory. Educational Psychologist. 2003;38(1):63-71. doi: 10.1207/S15326985EP3801_8
© 2018 Society of Hospital Medicine
Utilization of Primary Care Physicians by Medical Residents: A Survey-Based Study
From the University of Michigan Medical School, Ann Arbor, MI.
Abstract
- Objective: Existing research has demonstrated overall low rates of residents establishing care with a primary care physician (PCP). We conducted a survey-based study to better understand chronic illness, PCP utilization, and prescription medication use patterns in resident physician populations.
- Methods: In 2017, we invited internal and family medicine trainees from a convenience sample of U.S. residency programs to participate in a survey. We compared the characteristics of residents who had established care with a PCP to those who had not.
- Results: The response rate was 45% (348/766 residents). The majority (n = 205, 59%) of respondents stated they had established care with a PCP primarily for routine preventative care (n = 159, 79%) and access in the event of an emergency (n = 132, 66%). However, 31% (n = 103) denied having had a wellness visit in over 3 years. Nearly a quarter of residents (n = 77, 23%) reported a chronic medical illness and 14% (n = 45) reported a preexisting mental health condition prior to residency. One-third (n = 111, 33%) reported taking a long-term prescription medication. Compared to residents who had not established care, those with a PCP (n = 205) more often reported a chronic condition (P < 0.001), seeing a subspecialist (P = 0.01), or taking long-term prescription medications (P < 0.001). One in 5 (n = 62,19%) respondents reported receiving prescriptions for an acute illness from an individual with whom they did not have a doctor-patient relationship.
- Conclusion: Medical residents have a substantial burden of chronic illness that may not be met through interactions with PCPs. Further understanding their medical needs and barriers to accessing care is necessary to ensure trainee well-being.
Keywords: Medical education-graduate, physician behavior, survey research, access to care.
Although internal medicine (IM) and family medicine (FM) residents must learn to provide high-quality primary care to their patients, little is known about whether they appropriately access such care themselves. Resident burnout and resilience has received attention [1,2], but there has been limited focus on understanding the burden of chronic medical and mental illness among residents. In particular, little is known about whether residents access primary care physicians (PCPs)—for either acute or chronic medical needs—and about resident self-medication practices.
Residency is often characterized by a life-changing geographic relocation. Even residents who do not relocate may still need to establish care with a new PCP due to health insurance or loss of access to a student clinic [3]. Establishing primary care with a new doctor typically requires scheduling a new patient visit, often with a wait time of several days to weeks [4,5]. Furthermore, lack of time, erratic schedules, and concerns about privacy and the stigma of being ill as a physician are barriers to establishing care [6-8]. Individuals who have not established primary care may experience delays in routine preventative health services, screening for chronic medical and mental health conditions, as well as access to care during acute illnesses [9,10]. Worse, they may engage in potentially unsafe practices, such as having colleagues write prescriptions for them, or even self-prescribing [8,11,12].
Existing research has demonstrated overall low rates of residents establishing care with a PCP [6–8,13]. However, these studies have either been limited to large academic centers or conducted outside the United States. Improving resident well-being may prove challenging without a clear understanding of current primary care utilization practices, the burden of chronic illness among residents, and patterns of prescription medication use and needs. Therefore, we conducted a survey-based study to understand primary care utilization and the burden of chronic illness among residents. We also assessed whether lack of primary care is associated with potentially risky behaviors, such as self-prescribing of medications.
Methods
Study Setting and Participants
The survey was distributed to current residents at IM and FM programs within the United States in 2017. Individual programs were recruited by directly contacting program directors or chief medical residents via email. Rather than contacting sites directly through standard templated emails, we identified programs both through personal contacts as well as the Electronic Residency Application Service list of accredited IM training programs. We elected to use this approach in order to increase response rates and to ensure that a sample representative of the trainee population was constructed. Programs were located in the Northeast, Midwest, South, and Pacific regions, and included small community-based programs and large academic centers.
Development of the Survey
The survey instrument was developed by the authors and reviewed by residents and PCPs at the University of Michigan to ensure relevance and comprehension of questions (The survey is available in the Appendix.). Once finalized, the survey was programmed into an online survey tool (Qualtrics, Provo, UT) and pilot-tested before being disseminated to the sampling frame. Data collected in the survey included: respondent’s utilization of a PCP, burden of chronic illness, long-term prescription medications, prescribing source, and demographic characteristics.

Each participating program distributed the survey to their residents through an email containing an anonymous hyperlink. The survey was available for completion for 4 weeks. We asked participating programs to send email reminders to encourage participation. Participants were given the option of receiving a $10 Amazon gift card after completion. All responses were recorded anonymously. The study received a “not regulated” status by the University of Michigan Institutional Review Board (HUM 00123888).
")
Statistical Analysis
Descriptive statistics were used to tabulate results. Respondents were encouraged, but not required, to answer all questions. Therefore, the response rate for each question was calculated using the total number of responses for that question as the denominator. Bivariable comparisons were made using Chi-squared or Fisher’s exact tests, as appropriate, for categorical data. A P value < 0.05, with 2-sided alpha, was considered statistically significant. All statistical analyses were conducted using Stata 13 SE (StataCorp, College Station, TX).

Results
Respondent Characteristics
Of the 29 programs contacted, 10 agreed to participate within the study timeframe. Of 766 potential respondents, 348 (45%) residents answered the survey (Table 1). The majority of respondents (n = 276, 82%) were from IM programs. Respondents were from all training years as follows: postgraduate year 1 residents (PGY-1, or interns; n = 130, 39%), PGY-2 residents (n = 98, 29%), PGY-3 residents (n = 93, 28%), and PGY-4 residents (n = 12, 4%). Most respondents were from the South (n = 130, 39%) and Midwest (n = 123, 37%) regions, and over half (n = 179, 54%) were female. Most respondents (n = 285, 86%) stated that they did not have children. The majority (n = 236, 71%) were completing residency in an area where they had not previously lived for more than 1 year.
Primary Care Utilization
Among the 348 respondents, 59% (n = 205) reported having established care with a PCP. An additional 6% (n = 21) had established care with an obstetrician/gynecologist for routine needs (Table 2). The 2 most common reasons for establishing care with a PCP were routine primary care needs, including contraception (n = 159, 79%), and access to a physician in the event of an acute medical need (n = 132, 66%).

Among respondents who had established care with a PCP, most (n = 188, 94%) had completed at least 1 appointment. However, among these 188 respondents, 68% (n = 127) stated that they had not made an acute visit in more than 12 months. When asked about wellness visits, almost one third of respondents (n = 103, 31%) stated that they had not been seen for a wellness visit in the past 3 years.

Burden of Chronic Illness
Most respondents (n = 223, 67%) stated that they did not have a chronic medical or mental health condition prior to residency (Table 3). However, 23% (n = 77) of respondents stated that they had been diagnosed with a chronic medical illness prior to residency, and 14% (n = 45) indicated they had been diagnosed with a mental health condition prior to residency. Almost one fifth of respondents (n = 60, 18%) reported seeing a subspecialist for a medical illness, and 33% (n = 111) reported taking a long-term prescription medication. With respect to major medical issues, the majority of residents (n = 239, 72%) denied experiencing events such as pregnancy, hospitalization, surgery, or an emergency department (ED) visit during training.
[polldaddy:10116940]
Inappropriate Prescriptions

While the majority of respondents denied writing a prescription for themselves for an acute or chronic medical condition, almost one fifth (n = 62, 19%) had received a prescription for an acute medical need from a provider outside of a clinical relationship (ie, from someone other than their PCP or specialty provider). Notably, 5% (n = 15) reported that this had occurred at least 2 or 3 times in the past 12 months (Table 4). Compared to respondents not taking long-term prescription medications, respondents who were already taking long-term prescription medications more frequently reported inappropriately receiving chronic prescriptions outside of an established clinical relationship (n = 14, 13% vs. n = 14, 6%; P = 0.05) and more often self-prescribed medications for acute needs (n = 12, 11% vs. n = 7, 3%; P = 0.005).
Comparison of Residents With and Without a PCP
Important differences were noted between residents who had a PCP versus those who did not (Table 5). For example, a higher percentage of residents with a PCP indicated they had been diagnosed with a chronic medical illness (n = 55, 28% vs. n = 22, 16%; P = 0.01) or a chronic mental health condition (n = 34, 17% vs. n = 11, 8%; P = 0.02) before residency. Additionally, a higher percentage of residents with a PCP (n = 70, 35% vs. n = 25, 18%; P = 0.001) reported experiencing medical events such as pregnancy, hospitalization, surgery, ED visit, or new diagnosis of a chronic medical illness during residency. Finally, a higher percentage of respondents with a PCP stated that they had visited a subspecialist for a medical illness (n = 44, 22% vs. n = 16,12%; P = 0.01) or were taking long-term prescription medications (n = 86, 43% vs. n = 25; 18%; P < 0.001). When comparing PGY-1 to PGY-2–PGY-4 residents, the former reported having established a medical relationship with a PCP significantly less frequently (n = 56, 43% vs. n = 142, 70%; P < 0.001).
")
Discussion
This survey-based study of medical residents across the United States suggests that a substantial proportion do not establish relationships with PCPs. Additionally, our data suggest that despite establishing care, few residents subsequently visited their PCP during training for wellness visits or routine care. Self-reported rates of chronic medical and mental health conditions were substantial in our sample. Furthermore, inappropriate self-prescription and the receipt of prescriptions outside of a medical relationship were also reported. These findings suggest that future studies that focus on the unique medical and mental health needs of physicians in training, as well as interventions to encourage care in this vulnerable period, are necessary.
 continued")
We observed that most respondents that established primary care were female trainees. Although it is impossible to know with certainty, one hypothesis behind this discrepancy is that women routinely need to access preventative care for gynecologic needs such as pap smears, contraception, and potentially pregnancy and preconception counseling [14,15]. Similarly, residents with a chronic medical or mental health condition prior to residency established care with a local PCP at a significantly greater frequency than those without such diagnoses. While selection bias cannot be excluded, this finding suggests that illness is a driving factor in establishing care. There also appears to be an association between accessing the medical system (either for prescription medications or subspecialist care) and having established care with a PCP. Collectively, these data suggest that individuals without a compelling reason to access medical services might have barriers to accessing care in the event of medical needs or may not receive routine preventative care [9,10].
In general, we found that rates of reported inappropriate prescriptions were lower than those reported in prior studies where a comparable resident population was surveyed [8,12,16]. Inclusion of multiple institutions, differences in temporality, social desirability bias, and reporting bias might have influenced our findings in this regard. Surprisingly, we found that having a PCP did not influence likelihood of inappropriate prescription receipt, perhaps suggesting that this behavior reflects some degree of universal difficulty in accessing care. Alternatively, this finding might relate to a cultural tendency to self-prescribe among resident physicians. The fact that individuals on chronic medications more often both received and wrote inappropriate prescriptions suggests this problem might be more pronounced in individuals who take medications more often, as these residents have specific needs [12]. Future studies targeting these individuals thus appear warranted.
Our study has several limitations. First, our sample size was modest and the response rate of 45% was low. However, to our knowledge, this remains among the largest survey on this topic, and our response rate is comparable to similar trainee studies [8,11,13]. Second, we designed and created a novel survey for this study. While the questions were pilot-tested with users prior to dissemination, validation of the instrument was not performed. Third, since the study population was restricted to residents in fields that participate in primary care, our findings may not be generalizable to patterns of PCP use in other specialties [6].
These limitations aside, our study has important strengths. This is the first national study of its kind with specific questions addressing primary care access and utilization, prescription medication use and related practices, and the prevalence of medical conditions among trainees. Important differences in the rates of establishing primary care between male and female respondents, first- year and senior residents, and those with and without chronic disease suggest a need to target specific resident groups (males, interns, those without pre-existing conditions) for wellness-related interventions. Such interventions could include distribution of a list of local providers to first year residents, advanced protected time for doctor’s appointments, and safeguards to ensure health information is protected from potential supervisors. Future studies should also include residents from non-primary care oriented specialties such as surgery, emergency medicine, and anesthesiology to obtain results that are more generalizable to the resident population as a whole. Additionally, the rates of inappropriate prescriptions were not insignificant and warrant further evaluation of the driving forces behind these behaviors.
Conclusion
Medical residents have a substantial burden of chronic illness that may not be met through interactions with PCPs. More research into barriers that residents face while accessing care and an assessment of interventions to facilitate their access to care is important to promote trainee well-being. Without such direction and initiative, it may prove harder for physicians to heal themselves or those for whom they provide care.
Acknowledgments: We thank Suzanne Winter, the study coordinator, for her support with editing and formatting the manuscript, Latoya Kuhn for performing the statistical analysis and creating data tables, and Dr. Namita Sachdev and Dr. Renuka Tipirneni for providing feedback on the survey instrument. We also thank the involved programs for their participation.
Corresponding author: Vineet Chopra, NCRC 2800 Plymouth Rd., Bldg 16, 432, Ann Arbor, MI 48109, vineetc@med.umich.edu.
Financial disclosures: None.
Previous presentations: Results were presented at the Annual Michigan Medicine 2017 Internal Medicine Research Symposium.
1. Kassam A, Horton J, Shoimer I, Patten S. Predictors of well-being in resident physicians: a descriptive and psychometric study. J Grad Med Educ 2015;7:70–4.
2. Shanafelt TD, Bradley KA, Wipf JE, Back AL. Burnout and self-reported patient care in an internal medicine residency program. Ann Intern Med 2002;136:358–67.
3. Burstin HR, Swartz K, O’Neil AC, et al. The effect of change of health insurance on access to care. Inquiry 1998;35:389–97.
4. Rhodes KV, Basseyn S, Friedman AB, et al. Access to primary care appointments following 2014 insurance expansions. Ann Fam Med 2017;15:107–12.
5. Polsky D, Richards M, Basseyn S, et al. Appointment availability after increases in Medicaid payments for primary care. N Engl J Med 2015;372:537–45.
6. Gupta G, Schleinitz MD, Reinert SE, McGarry KA. Resident physician preventive health behaviors and perspectives on primary care. R I Med J (2013) 2013;96:43–7.
7. Rosen IM, Christine JD, Bellini LM, Asch DA. Health and health care among housestaff in four U.S. internal medicine residency programs. J Gen Intern Med 2000;15:116-21.
8. Campbell S, Delva D. Physician do not heal thyself. Survey of personal health practices among medical residents. Can Fam Physician 2003;49:1121–7.
9. Starfield B, Shi L, Macinko J. Contribution of primary care to health systems and health. Milbank Q 2005;83(3):457-502.
10. Weissman JS, Stern R, Fielding SL, et al. Delayed access to health care: risk factors, reasons, and consequences. Ann Intern Med 1991;114:325–31.
11. Guille C, Sen S. Prescription drug use and self-prescription among training physicians. Arch Intern Med 2012;172:371–2.
12. Roberts LW, Kim JP. Informal health care practices of residents: “curbside” consultation and self-diagnosis and treatment. Acad Psychiatry 2015;39:22-30.
13. Cohen JS, Patten S. Well-being in residency training: a survey examining resident physician satisfaction both within and outside of residency training and mental health in Alberta. BMC Med Educ 2005;5:21.
14. U.S. Preventive Services Task Force. Cervical cancer: screening. https://www.uspreventiveservicestaskforce.org/Page/Document/UpdateSummaryFinal/cervical-cancer-screening. Published March 2012. Accessed August 21, 2018.
15. Health Resources and Services Administration. Women’s preventative services guidelines. https://www.hrsa.gov/womensguidelines2016/index.html. Updated October 2017. Accessed August 21, 2018.
16. Christie JD, Rosen IM, Bellini LM, et al. Prescription drug use and self-prescription among resident physicians. JAMA 1998;280(14):1253–5.
From the University of Michigan Medical School, Ann Arbor, MI.
Abstract
- Objective: Existing research has demonstrated overall low rates of residents establishing care with a primary care physician (PCP). We conducted a survey-based study to better understand chronic illness, PCP utilization, and prescription medication use patterns in resident physician populations.
- Methods: In 2017, we invited internal and family medicine trainees from a convenience sample of U.S. residency programs to participate in a survey. We compared the characteristics of residents who had established care with a PCP to those who had not.
- Results: The response rate was 45% (348/766 residents). The majority (n = 205, 59%) of respondents stated they had established care with a PCP primarily for routine preventative care (n = 159, 79%) and access in the event of an emergency (n = 132, 66%). However, 31% (n = 103) denied having had a wellness visit in over 3 years. Nearly a quarter of residents (n = 77, 23%) reported a chronic medical illness and 14% (n = 45) reported a preexisting mental health condition prior to residency. One-third (n = 111, 33%) reported taking a long-term prescription medication. Compared to residents who had not established care, those with a PCP (n = 205) more often reported a chronic condition (P < 0.001), seeing a subspecialist (P = 0.01), or taking long-term prescription medications (P < 0.001). One in 5 (n = 62,19%) respondents reported receiving prescriptions for an acute illness from an individual with whom they did not have a doctor-patient relationship.
- Conclusion: Medical residents have a substantial burden of chronic illness that may not be met through interactions with PCPs. Further understanding their medical needs and barriers to accessing care is necessary to ensure trainee well-being.
Keywords: Medical education-graduate, physician behavior, survey research, access to care.
Although internal medicine (IM) and family medicine (FM) residents must learn to provide high-quality primary care to their patients, little is known about whether they appropriately access such care themselves. Resident burnout and resilience has received attention [1,2], but there has been limited focus on understanding the burden of chronic medical and mental illness among residents. In particular, little is known about whether residents access primary care physicians (PCPs)—for either acute or chronic medical needs—and about resident self-medication practices.
Residency is often characterized by a life-changing geographic relocation. Even residents who do not relocate may still need to establish care with a new PCP due to health insurance or loss of access to a student clinic [3]. Establishing primary care with a new doctor typically requires scheduling a new patient visit, often with a wait time of several days to weeks [4,5]. Furthermore, lack of time, erratic schedules, and concerns about privacy and the stigma of being ill as a physician are barriers to establishing care [6-8]. Individuals who have not established primary care may experience delays in routine preventative health services, screening for chronic medical and mental health conditions, as well as access to care during acute illnesses [9,10]. Worse, they may engage in potentially unsafe practices, such as having colleagues write prescriptions for them, or even self-prescribing [8,11,12].
Existing research has demonstrated overall low rates of residents establishing care with a PCP [6–8,13]. However, these studies have either been limited to large academic centers or conducted outside the United States. Improving resident well-being may prove challenging without a clear understanding of current primary care utilization practices, the burden of chronic illness among residents, and patterns of prescription medication use and needs. Therefore, we conducted a survey-based study to understand primary care utilization and the burden of chronic illness among residents. We also assessed whether lack of primary care is associated with potentially risky behaviors, such as self-prescribing of medications.
Methods
Study Setting and Participants
The survey was distributed to current residents at IM and FM programs within the United States in 2017. Individual programs were recruited by directly contacting program directors or chief medical residents via email. Rather than contacting sites directly through standard templated emails, we identified programs both through personal contacts as well as the Electronic Residency Application Service list of accredited IM training programs. We elected to use this approach in order to increase response rates and to ensure that a sample representative of the trainee population was constructed. Programs were located in the Northeast, Midwest, South, and Pacific regions, and included small community-based programs and large academic centers.
Development of the Survey
The survey instrument was developed by the authors and reviewed by residents and PCPs at the University of Michigan to ensure relevance and comprehension of questions (The survey is available in the Appendix.). Once finalized, the survey was programmed into an online survey tool (Qualtrics, Provo, UT) and pilot-tested before being disseminated to the sampling frame. Data collected in the survey included: respondent’s utilization of a PCP, burden of chronic illness, long-term prescription medications, prescribing source, and demographic characteristics.
Each participating program distributed the survey to their residents through an email containing an anonymous hyperlink. The survey was available for completion for 4 weeks. We asked participating programs to send email reminders to encourage participation. Participants were given the option of receiving a $10 Amazon gift card after completion. All responses were recorded anonymously. The study received a “not regulated” status by the University of Michigan Institutional Review Board (HUM 00123888).
Statistical Analysis
Descriptive statistics were used to tabulate results. Respondents were encouraged, but not required, to answer all questions. Therefore, the response rate for each question was calculated using the total number of responses for that question as the denominator. Bivariable comparisons were made using Chi-squared or Fisher’s exact tests, as appropriate, for categorical data. A P value < 0.05, with 2-sided alpha, was considered statistically significant. All statistical analyses were conducted using Stata 13 SE (StataCorp, College Station, TX).
Results
Respondent Characteristics
Of the 29 programs contacted, 10 agreed to participate within the study timeframe. Of 766 potential respondents, 348 (45%) residents answered the survey (Table 1). The majority of respondents (n = 276, 82%) were from IM programs. Respondents were from all training years as follows: postgraduate year 1 residents (PGY-1, or interns; n = 130, 39%), PGY-2 residents (n = 98, 29%), PGY-3 residents (n = 93, 28%), and PGY-4 residents (n = 12, 4%). Most respondents were from the South (n = 130, 39%) and Midwest (n = 123, 37%) regions, and over half (n = 179, 54%) were female. Most respondents (n = 285, 86%) stated that they did not have children. The majority (n = 236, 71%) were completing residency in an area where they had not previously lived for more than 1 year.
Primary Care Utilization
Among the 348 respondents, 59% (n = 205) reported having established care with a PCP. An additional 6% (n = 21) had established care with an obstetrician/gynecologist for routine needs (Table 2). The 2 most common reasons for establishing care with a PCP were routine primary care needs, including contraception (n = 159, 79%), and access to a physician in the event of an acute medical need (n = 132, 66%).
Among respondents who had established care with a PCP, most (n = 188, 94%) had completed at least 1 appointment. However, among these 188 respondents, 68% (n = 127) stated that they had not made an acute visit in more than 12 months. When asked about wellness visits, almost one third of respondents (n = 103, 31%) stated that they had not been seen for a wellness visit in the past 3 years.
Burden of Chronic Illness
Most respondents (n = 223, 67%) stated that they did not have a chronic medical or mental health condition prior to residency (Table 3). However, 23% (n = 77) of respondents stated that they had been diagnosed with a chronic medical illness prior to residency, and 14% (n = 45) indicated they had been diagnosed with a mental health condition prior to residency. Almost one fifth of respondents (n = 60, 18%) reported seeing a subspecialist for a medical illness, and 33% (n = 111) reported taking a long-term prescription medication. With respect to major medical issues, the majority of residents (n = 239, 72%) denied experiencing events such as pregnancy, hospitalization, surgery, or an emergency department (ED) visit during training.
[polldaddy:10116940]
Inappropriate Prescriptions
While the majority of respondents denied writing a prescription for themselves for an acute or chronic medical condition, almost one fifth (n = 62, 19%) had received a prescription for an acute medical need from a provider outside of a clinical relationship (ie, from someone other than their PCP or specialty provider). Notably, 5% (n = 15) reported that this had occurred at least 2 or 3 times in the past 12 months (Table 4). Compared to respondents not taking long-term prescription medications, respondents who were already taking long-term prescription medications more frequently reported inappropriately receiving chronic prescriptions outside of an established clinical relationship (n = 14, 13% vs. n = 14, 6%; P = 0.05) and more often self-prescribed medications for acute needs (n = 12, 11% vs. n = 7, 3%; P = 0.005).
Comparison of Residents With and Without a PCP
Important differences were noted between residents who had a PCP versus those who did not (Table 5). For example, a higher percentage of residents with a PCP indicated they had been diagnosed with a chronic medical illness (n = 55, 28% vs. n = 22, 16%; P = 0.01) or a chronic mental health condition (n = 34, 17% vs. n = 11, 8%; P = 0.02) before residency. Additionally, a higher percentage of residents with a PCP (n = 70, 35% vs. n = 25, 18%; P = 0.001) reported experiencing medical events such as pregnancy, hospitalization, surgery, ED visit, or new diagnosis of a chronic medical illness during residency. Finally, a higher percentage of respondents with a PCP stated that they had visited a subspecialist for a medical illness (n = 44, 22% vs. n = 16,12%; P = 0.01) or were taking long-term prescription medications (n = 86, 43% vs. n = 25; 18%; P < 0.001). When comparing PGY-1 to PGY-2–PGY-4 residents, the former reported having established a medical relationship with a PCP significantly less frequently (n = 56, 43% vs. n = 142, 70%; P < 0.001).
Discussion
This survey-based study of medical residents across the United States suggests that a substantial proportion do not establish relationships with PCPs. Additionally, our data suggest that despite establishing care, few residents subsequently visited their PCP during training for wellness visits or routine care. Self-reported rates of chronic medical and mental health conditions were substantial in our sample. Furthermore, inappropriate self-prescription and the receipt of prescriptions outside of a medical relationship were also reported. These findings suggest that future studies that focus on the unique medical and mental health needs of physicians in training, as well as interventions to encourage care in this vulnerable period, are necessary.
We observed that most respondents that established primary care were female trainees. Although it is impossible to know with certainty, one hypothesis behind this discrepancy is that women routinely need to access preventative care for gynecologic needs such as pap smears, contraception, and potentially pregnancy and preconception counseling [14,15]. Similarly, residents with a chronic medical or mental health condition prior to residency established care with a local PCP at a significantly greater frequency than those without such diagnoses. While selection bias cannot be excluded, this finding suggests that illness is a driving factor in establishing care. There also appears to be an association between accessing the medical system (either for prescription medications or subspecialist care) and having established care with a PCP. Collectively, these data suggest that individuals without a compelling reason to access medical services might have barriers to accessing care in the event of medical needs or may not receive routine preventative care [9,10].
In general, we found that rates of reported inappropriate prescriptions were lower than those reported in prior studies where a comparable resident population was surveyed [8,12,16]. Inclusion of multiple institutions, differences in temporality, social desirability bias, and reporting bias might have influenced our findings in this regard. Surprisingly, we found that having a PCP did not influence likelihood of inappropriate prescription receipt, perhaps suggesting that this behavior reflects some degree of universal difficulty in accessing care. Alternatively, this finding might relate to a cultural tendency to self-prescribe among resident physicians. The fact that individuals on chronic medications more often both received and wrote inappropriate prescriptions suggests this problem might be more pronounced in individuals who take medications more often, as these residents have specific needs [12]. Future studies targeting these individuals thus appear warranted.
Our study has several limitations. First, our sample size was modest and the response rate of 45% was low. However, to our knowledge, this remains among the largest survey on this topic, and our response rate is comparable to similar trainee studies [8,11,13]. Second, we designed and created a novel survey for this study. While the questions were pilot-tested with users prior to dissemination, validation of the instrument was not performed. Third, since the study population was restricted to residents in fields that participate in primary care, our findings may not be generalizable to patterns of PCP use in other specialties [6].
These limitations aside, our study has important strengths. This is the first national study of its kind with specific questions addressing primary care access and utilization, prescription medication use and related practices, and the prevalence of medical conditions among trainees. Important differences in the rates of establishing primary care between male and female respondents, first- year and senior residents, and those with and without chronic disease suggest a need to target specific resident groups (males, interns, those without pre-existing conditions) for wellness-related interventions. Such interventions could include distribution of a list of local providers to first year residents, advanced protected time for doctor’s appointments, and safeguards to ensure health information is protected from potential supervisors. Future studies should also include residents from non-primary care oriented specialties such as surgery, emergency medicine, and anesthesiology to obtain results that are more generalizable to the resident population as a whole. Additionally, the rates of inappropriate prescriptions were not insignificant and warrant further evaluation of the driving forces behind these behaviors.
Conclusion
Medical residents have a substantial burden of chronic illness that may not be met through interactions with PCPs. More research into barriers that residents face while accessing care and an assessment of interventions to facilitate their access to care is important to promote trainee well-being. Without such direction and initiative, it may prove harder for physicians to heal themselves or those for whom they provide care.
Acknowledgments: We thank Suzanne Winter, the study coordinator, for her support with editing and formatting the manuscript, Latoya Kuhn for performing the statistical analysis and creating data tables, and Dr. Namita Sachdev and Dr. Renuka Tipirneni for providing feedback on the survey instrument. We also thank the involved programs for their participation.
Corresponding author: Vineet Chopra, NCRC 2800 Plymouth Rd., Bldg 16, 432, Ann Arbor, MI 48109, vineetc@med.umich.edu.
Financial disclosures: None.
Previous presentations: Results were presented at the Annual Michigan Medicine 2017 Internal Medicine Research Symposium.
1. Kassam A, Horton J, Shoimer I, Patten S. Predictors of well-being in resident physicians: a descriptive and psychometric study. J Grad Med Educ 2015;7:70–4.
2. Shanafelt TD, Bradley KA, Wipf JE, Back AL. Burnout and self-reported patient care in an internal medicine residency program. Ann Intern Med 2002;136:358–67.
3. Burstin HR, Swartz K, O’Neil AC, et al. The effect of change of health insurance on access to care. Inquiry 1998;35:389–97.
4. Rhodes KV, Basseyn S, Friedman AB, et al. Access to primary care appointments following 2014 insurance expansions. Ann Fam Med 2017;15:107–12.
5. Polsky D, Richards M, Basseyn S, et al. Appointment availability after increases in Medicaid payments for primary care. N Engl J Med 2015;372:537–45.
6. Gupta G, Schleinitz MD, Reinert SE, McGarry KA. Resident physician preventive health behaviors and perspectives on primary care. R I Med J (2013) 2013;96:43–7.
7. Rosen IM, Christine JD, Bellini LM, Asch DA. Health and health care among housestaff in four U.S. internal medicine residency programs. J Gen Intern Med 2000;15:116-21.
8. Campbell S, Delva D. Physician do not heal thyself. Survey of personal health practices among medical residents. Can Fam Physician 2003;49:1121–7.
9. Starfield B, Shi L, Macinko J. Contribution of primary care to health systems and health. Milbank Q 2005;83(3):457-502.
10. Weissman JS, Stern R, Fielding SL, et al. Delayed access to health care: risk factors, reasons, and consequences. Ann Intern Med 1991;114:325–31.
11. Guille C, Sen S. Prescription drug use and self-prescription among training physicians. Arch Intern Med 2012;172:371–2.
12. Roberts LW, Kim JP. Informal health care practices of residents: “curbside” consultation and self-diagnosis and treatment. Acad Psychiatry 2015;39:22-30.
13. Cohen JS, Patten S. Well-being in residency training: a survey examining resident physician satisfaction both within and outside of residency training and mental health in Alberta. BMC Med Educ 2005;5:21.
14. U.S. Preventive Services Task Force. Cervical cancer: screening. https://www.uspreventiveservicestaskforce.org/Page/Document/UpdateSummaryFinal/cervical-cancer-screening. Published March 2012. Accessed August 21, 2018.
15. Health Resources and Services Administration. Women’s preventative services guidelines. https://www.hrsa.gov/womensguidelines2016/index.html. Updated October 2017. Accessed August 21, 2018.
16. Christie JD, Rosen IM, Bellini LM, et al. Prescription drug use and self-prescription among resident physicians. JAMA 1998;280(14):1253–5.