User login
Trends in Risk-Adjusted 28-Day Mortality Rates for Patients Hospitalized with COVID-19 in England
The early phase of the coronavirus disease 2019 (COVID-19) pandemic in the United Kingdom (UK) was characterized by uncertainty as clinicians grappled to understand and manage an unfamiliar disease that affected very high numbers of patients amid radically evolving working environments, with little evidence to support their efforts. Early reports indicated high mortality in patients hospitalized with COVID-19.
As the disease became better understood, treatment evolved and the mortality appears to have decreased. For example, two recent papers, a national study of critical care patients in the UK and a single-site study from New York, have demonstrated a significant reduction in adjusted mortality between the pre- and post-peak periods.1,2 However, the UK study was restricted to patients receiving critical care, potentially introducing bias due to varying critical care admission thresholds over time, while the single-site US study may not be generalizable. Moreover, both studies measured only in-hospital mortality. It remains uncertain therefore whether overall mortality has decreased on a broad scale after accounting for changes in patient characteristics.
The aim of this study was to use a national dataset to assess the
METHODS
We conducted a retrospective, secondary analysis of English National Health Services (NHS) hospitals’ admissions of patients at least 18 years of age between March 1 and July 31, 2020. Data were obtained from the Hospital Episode Statistics (HES) admitted patient care dataset.3 This is an administrative dataset that contains data on diagnoses and procedures as well as organizational characteristics and patient demographics for all NHS activity in England. We included all patients with an International Statistical Classification of Diseases, Tenth Revision (ICD-10) diagnosis of U07.1 (COVID-19, virus identified) and U07.2 (COVID-19, virus not identified).
The primary outcome of death within 28 days of admission was obtained by linking to the Civil Registrations (Deaths) - Secondary Care Cut - Information dataset, which includes the date, place, and cause of death from the Office for National Statistics4 and which was complete through September 31, 2020. The time horizon of 28 days from admission was chosen to approximate the Public Health England definition of a death from COVID-19 as being within 28 days of testing positive.5 We restricted our analysis to emergency admissions of persons age >18 years. If a patient had multiple emergency admissions, we restricted our analysis to the first admission to ensure comparability across hospitalizations and to best represent outcomes from the earliest onset of COVID-19.
We estimated a modified Poisson regression6 to predict death at 28 days, with month of admission, region, source of admission, age, deprivation, gender, ethnic group, and the 29 comorbidities in the Elixhauser comorbidity measure as variables in the regression.7 The derivation of each of these variables from the HES dataset is shown in Appendix Table 1.
Deprivation was measured by the Index of Multiple Deprivation, a methodology used widely within the UK to classify relative deprivation.8 To control for clustering, hospital system (known as Trust) was added as a random effect. Robust errors were estimated using the sandwich package.9 Modified Poisson regression was chosen in preference to the more common logistic regression because the coefficients can be interpreted as relative risks and not odds ratios. The model was fitted using R, version 4.0.3, geepack library.10 We carried out three sensitivity analyses, restricting to laboratory-confirmed COVID-19, length of stay ≥3 days, and primary respiratory disease.
For each month, we obtained a standardized mortality ratio (SMR) by fixing the month to the reference month of March 2020 and repredicting the outcome using the existing model. We calculated the ratio of the sum of observed and expected deaths (obtained from the model) in each month, comparing observed deaths to the number we would have expected had those patients been hospitalized in March. We then multiplied each period’s SMR by the March crude mortality to generate monthly adjusted mortality rates. We calculated Poisson confidence intervals around the SMR and used these to obtain confidence intervals for the adjusted rate. The binomial exact method was used to obtain confidence intervals for the crude rate. Multicollinearity was assessed using both the variance inflation factor (VIF) and the condition number test.7 All analyses used two-sided statistical tests, and we considered a P value < .05 to be statistically significant without adjustment for multiple testing. The study was exempt from UK National Research Ethics Committee approval because it involved secondary analysis of anonymized data.
RESULTS
The dataset included 115,643 emergency admissions from 179 healthcare systems, of which 103,202 were first admissions eligible for inclusion. A total of 592 patients were excluded due to missing demographic data (0.5%), resulting in 102,610 admissions included in the analysis. Peak hospitalizations occurred in late March to mid April, accounting for 44% of the hospitalizations (Table). Median length of stay for patients who died was 7 days (interquartile range, 3-12). The median age and number of Elixhauser comorbidities decreased in July. The proportion of men decreased between May and July. 
The modified Poisson regression had a C statistic of 0.743 (95% CI, 0.740-0.746) (Appendix Table 4). The VIF and condition number test found no evidence of multicollinearity.11
Adjusted mortality decreased each month, from 33.4% in March to 17.4% in July (Figure). The relative risk of death declined progressively to a minimum of 0.52 (95% CI, 0.34-0.80) in July, compared to March.
Admission from another hospital and being female were associated with reduced risk of death. Admission from a skilled nursing facility and being >75 years were associated with increased risk of death. Ten of the 29 Elixhauser comorbidities were associated with increased risk of mortality (cardiac arrhythmia, peripheral vascular disease, other neurologic disorders, renal failure, lymphoma, metastatic cancer, solid tumor without metastasis, coagulopathy, fluid and electrolyte disorders, and anemia). Deprivation and ethnic group were not associated with death among hospitalized patients.
DISCUSSION
Our study of all emergency hospital admissions in England during the first wave of the COVID-19 pandemic demonstrated that, even after adjusting for patient comorbidity and risk factors, the mortality rate decreased by approximately half over the first 5 months. Although the demographics of hospitalized patients changed over that period (with both the median age and the number of comorbidities decreasing), this does not fully explain the decrease in mortality. It is therefore likely that the decrease is due, at least in part, to an improvement in treatment and/or a reduction in hospital strain.
For example, initially the use of corticosteroids was controversial, in part due to previous experience with severe acute respiratory syndrome and Middle East respiratory syndrome (in which a Cochrane review demonstrated no benefit but potential harm). However, this changed as a result of the Randomized Evaluation of Covid-19 Therapy (RECOVERY) trial,12 which showed a significant survival benefit.One of the positive defining characteristics of the COVID-19 pandemic has been the intensive collaborative research effort combined with the rapid dissemination and discussion of new management protocols. The RECOVERY trial randomly assigned >11,000 participants in just 3 months, amounting to approximately 15% of all patients hospitalized with COVID-19 in the UK. Its results were widely publicized via professional networks and rapidly adopted into widespread clinical practice.
Examples of other changes include a higher threshold for mechanical ventilation (and a lower threshold for noninvasive ventilation), increased clinician experience, and, potentially, a reduced viral load arising from increased social distancing and mask wearing. Finally, the hospitals and staff themselves were under enormous physical and mental strain in the early months from multiple factors, including unfamiliar working environments, the large-scale redeployment of inexperienced staff, and very high numbers of patients with an unfamiliar disease. These factors all lessened as the initial peak passed. It is therefore likely that the reduction in adjusted mortality we observed arises from a combination of all these factors, as well as other incremental benefits.
The factors associated with increased mortality risk in our study (increasing age, male gender, certain comorbidities, and frailty [with care home residency acting as a proxy in our study]) are consistent with multiple previous reports. Although not the focus of our analysis, we found no effect of ethnicity or deprivation on mortality. This is consistent with many US studies that demonstrate that the widely reported effect of these factors is likely due to differences in exposure to the disease. Once patients are hospitalized, adjusted mortality risks are similar across ethnic groups and deprivation levels.
The strengths of this study include complete capture of hospitalizations across all hospitals and areas in England. Likewise, linking the hospital data to death data from the Office for National Statistics allows complete capture of outcomes, irrespective of where the patient died. This is a significant strength compared to prior studies, which only included in-hospital mortality. Our results are therefore likely robust and a true observation of the mortality trend.
Limitations include the lack of physiologic and laboratory data; having these would have allowed us to adjust for disease severity on admission and strengthened the risk stratification. Likewise, although the complete national coverage is overall a significant strength, aggregating data from numerous areas that might be at different stages of local outbreaks, have different management strategies, and have differing data quality introduces its own biases.
Furthermore, these results predate the second wave in the UK, so we cannot distinguish whether the reduced mortality is due to improved treatment, a seasonal effect, evolution of the virus itself, or a reduction in the strain on hospitals.
CONCLUSION
This nationwide study indicates that, even after accounting for changing patient characteristics, the mortality of patients hospitalized with COVID-19 in England decreased significantly as the outbreak progressed. This is likely due to a combination of incremental treatment improvements.
1. Horwitz LI, Jones SA, Cerfolio RJ, et al. Trends in COVID-19 risk-adjusted mortality rates. J Hosp Med. 2020;16(2):90-92. https://doi.org/10.12788/jhm.3552
2. Dennis JM, McGovern AP, Vollmer SJ, Mateen BA. Improving survival of critical care patients with coronavirus disease 2019 in England: a national cohort study, March to June 2020. Crit Care Med. 2021;49(2):209-214. https://doi.org/10.1097/CCM.0000000000004747
3. NHS Digital. Hospital Episode Statistics Data Dictionary. Published March 2018. Accessed October 15, 2020. https://digital.nhs.uk/data-and-information/data-tools-and-services/data-services/hospital-episode-statistics/hospital-episode-statistics-data-dictionary
4. NHS Digital. HES-ONS Linked Mortality Data Dictionary. Accessed October 15, 2020. https://digital.nhs.uk/binaries/content/assets/legacy/word/i/p/hes-ons_linked_mortality_data_dictionary_-_mar_20181.docx
5. Public Health England. Technical summary: Public Health England data series on deaths in people with COVID-19. Accessed November 11, 2020. https://assets.publishing.service.gov.uk/government/uploads/system/uploads/attachment_data/file/916035/RA_Technical_Summary_-_PHE_Data_Series_COVID_19_Deaths_20200812.pdf
6. Zou G. A modified Poisson regression approach to prospective studies with binary data. Am J Epidemiol. 2004;159(7):702-706. https://doi.org/10.1093/aje/kwh090
7. van Walraven C, Austin PC, Jennings A, et al. A modification of the Elixhauser comorbidity measures into a point system for hospital death using administrative data. Med Care. 2009;47(6):626-633. https://doi.org /10.1097/MLR.0b013e31819432e5
8. Ministry of Housing Communities & Local Government. The English Indices of Deprivation 2019 (IoD2019). Published September 26, 2020. Accessed January 15, 2021. https://assets.publishing.service.gov.uk/government/uploads/system/uploads/attachment_data/file/835115/IoD2019_Statistical_Release.pdf
9. Zeileis A. Object-oriented computation of sandwich estimators. J Stat Software. 2006;16:1-16. https://doi.org/10.18637/jss.v016.i09
10. Højsgaard S, Halekoh U, Yan J. The R package geepack for generalized estimating equations. J Stat Software. 2006;15:1-11. https://doi.org/10.18637/jss.v015.i02
11. Belsley DA, Kuh E, Welsch RE. Diagnostics: Identifying Influential Data and Sources of Collinearity. John Wiley & Sons; 1980.
12. RECOVERY Collaborative Group, Horby P, Lim WS, Emberson JR, et al. Dexamethasone in hospitalized patients with covid-19 - preliminary report. N Engl J Med. 2020:NEJMoa2021436. https://doi.org/10.1056/NEJMoa2021436
The early phase of the coronavirus disease 2019 (COVID-19) pandemic in the United Kingdom (UK) was characterized by uncertainty as clinicians grappled to understand and manage an unfamiliar disease that affected very high numbers of patients amid radically evolving working environments, with little evidence to support their efforts. Early reports indicated high mortality in patients hospitalized with COVID-19.
As the disease became better understood, treatment evolved and the mortality appears to have decreased. For example, two recent papers, a national study of critical care patients in the UK and a single-site study from New York, have demonstrated a significant reduction in adjusted mortality between the pre- and post-peak periods.1,2 However, the UK study was restricted to patients receiving critical care, potentially introducing bias due to varying critical care admission thresholds over time, while the single-site US study may not be generalizable. Moreover, both studies measured only in-hospital mortality. It remains uncertain therefore whether overall mortality has decreased on a broad scale after accounting for changes in patient characteristics.
The aim of this study was to use a national dataset to assess the
METHODS
We conducted a retrospective, secondary analysis of English National Health Services (NHS) hospitals’ admissions of patients at least 18 years of age between March 1 and July 31, 2020. Data were obtained from the Hospital Episode Statistics (HES) admitted patient care dataset.3 This is an administrative dataset that contains data on diagnoses and procedures as well as organizational characteristics and patient demographics for all NHS activity in England. We included all patients with an International Statistical Classification of Diseases, Tenth Revision (ICD-10) diagnosis of U07.1 (COVID-19, virus identified) and U07.2 (COVID-19, virus not identified).
The primary outcome of death within 28 days of admission was obtained by linking to the Civil Registrations (Deaths) - Secondary Care Cut - Information dataset, which includes the date, place, and cause of death from the Office for National Statistics4 and which was complete through September 31, 2020. The time horizon of 28 days from admission was chosen to approximate the Public Health England definition of a death from COVID-19 as being within 28 days of testing positive.5 We restricted our analysis to emergency admissions of persons age >18 years. If a patient had multiple emergency admissions, we restricted our analysis to the first admission to ensure comparability across hospitalizations and to best represent outcomes from the earliest onset of COVID-19.
We estimated a modified Poisson regression6 to predict death at 28 days, with month of admission, region, source of admission, age, deprivation, gender, ethnic group, and the 29 comorbidities in the Elixhauser comorbidity measure as variables in the regression.7 The derivation of each of these variables from the HES dataset is shown in Appendix Table 1.
Deprivation was measured by the Index of Multiple Deprivation, a methodology used widely within the UK to classify relative deprivation.8 To control for clustering, hospital system (known as Trust) was added as a random effect. Robust errors were estimated using the sandwich package.9 Modified Poisson regression was chosen in preference to the more common logistic regression because the coefficients can be interpreted as relative risks and not odds ratios. The model was fitted using R, version 4.0.3, geepack library.10 We carried out three sensitivity analyses, restricting to laboratory-confirmed COVID-19, length of stay ≥3 days, and primary respiratory disease.
For each month, we obtained a standardized mortality ratio (SMR) by fixing the month to the reference month of March 2020 and repredicting the outcome using the existing model. We calculated the ratio of the sum of observed and expected deaths (obtained from the model) in each month, comparing observed deaths to the number we would have expected had those patients been hospitalized in March. We then multiplied each period’s SMR by the March crude mortality to generate monthly adjusted mortality rates. We calculated Poisson confidence intervals around the SMR and used these to obtain confidence intervals for the adjusted rate. The binomial exact method was used to obtain confidence intervals for the crude rate. Multicollinearity was assessed using both the variance inflation factor (VIF) and the condition number test.7 All analyses used two-sided statistical tests, and we considered a P value < .05 to be statistically significant without adjustment for multiple testing. The study was exempt from UK National Research Ethics Committee approval because it involved secondary analysis of anonymized data.
RESULTS
The dataset included 115,643 emergency admissions from 179 healthcare systems, of which 103,202 were first admissions eligible for inclusion. A total of 592 patients were excluded due to missing demographic data (0.5%), resulting in 102,610 admissions included in the analysis. Peak hospitalizations occurred in late March to mid April, accounting for 44% of the hospitalizations (Table). Median length of stay for patients who died was 7 days (interquartile range, 3-12). The median age and number of Elixhauser comorbidities decreased in July. The proportion of men decreased between May and July.
The modified Poisson regression had a C statistic of 0.743 (95% CI, 0.740-0.746) (Appendix Table 4). The VIF and condition number test found no evidence of multicollinearity.11
Adjusted mortality decreased each month, from 33.4% in March to 17.4% in July (Figure). The relative risk of death declined progressively to a minimum of 0.52 (95% CI, 0.34-0.80) in July, compared to March.
Admission from another hospital and being female were associated with reduced risk of death. Admission from a skilled nursing facility and being >75 years were associated with increased risk of death. Ten of the 29 Elixhauser comorbidities were associated with increased risk of mortality (cardiac arrhythmia, peripheral vascular disease, other neurologic disorders, renal failure, lymphoma, metastatic cancer, solid tumor without metastasis, coagulopathy, fluid and electrolyte disorders, and anemia). Deprivation and ethnic group were not associated with death among hospitalized patients.
DISCUSSION
Our study of all emergency hospital admissions in England during the first wave of the COVID-19 pandemic demonstrated that, even after adjusting for patient comorbidity and risk factors, the mortality rate decreased by approximately half over the first 5 months. Although the demographics of hospitalized patients changed over that period (with both the median age and the number of comorbidities decreasing), this does not fully explain the decrease in mortality. It is therefore likely that the decrease is due, at least in part, to an improvement in treatment and/or a reduction in hospital strain.
For example, initially the use of corticosteroids was controversial, in part due to previous experience with severe acute respiratory syndrome and Middle East respiratory syndrome (in which a Cochrane review demonstrated no benefit but potential harm). However, this changed as a result of the Randomized Evaluation of Covid-19 Therapy (RECOVERY) trial,12 which showed a significant survival benefit.One of the positive defining characteristics of the COVID-19 pandemic has been the intensive collaborative research effort combined with the rapid dissemination and discussion of new management protocols. The RECOVERY trial randomly assigned >11,000 participants in just 3 months, amounting to approximately 15% of all patients hospitalized with COVID-19 in the UK. Its results were widely publicized via professional networks and rapidly adopted into widespread clinical practice.
Examples of other changes include a higher threshold for mechanical ventilation (and a lower threshold for noninvasive ventilation), increased clinician experience, and, potentially, a reduced viral load arising from increased social distancing and mask wearing. Finally, the hospitals and staff themselves were under enormous physical and mental strain in the early months from multiple factors, including unfamiliar working environments, the large-scale redeployment of inexperienced staff, and very high numbers of patients with an unfamiliar disease. These factors all lessened as the initial peak passed. It is therefore likely that the reduction in adjusted mortality we observed arises from a combination of all these factors, as well as other incremental benefits.
The factors associated with increased mortality risk in our study (increasing age, male gender, certain comorbidities, and frailty [with care home residency acting as a proxy in our study]) are consistent with multiple previous reports. Although not the focus of our analysis, we found no effect of ethnicity or deprivation on mortality. This is consistent with many US studies that demonstrate that the widely reported effect of these factors is likely due to differences in exposure to the disease. Once patients are hospitalized, adjusted mortality risks are similar across ethnic groups and deprivation levels.
The strengths of this study include complete capture of hospitalizations across all hospitals and areas in England. Likewise, linking the hospital data to death data from the Office for National Statistics allows complete capture of outcomes, irrespective of where the patient died. This is a significant strength compared to prior studies, which only included in-hospital mortality. Our results are therefore likely robust and a true observation of the mortality trend.
Limitations include the lack of physiologic and laboratory data; having these would have allowed us to adjust for disease severity on admission and strengthened the risk stratification. Likewise, although the complete national coverage is overall a significant strength, aggregating data from numerous areas that might be at different stages of local outbreaks, have different management strategies, and have differing data quality introduces its own biases.
Furthermore, these results predate the second wave in the UK, so we cannot distinguish whether the reduced mortality is due to improved treatment, a seasonal effect, evolution of the virus itself, or a reduction in the strain on hospitals.
CONCLUSION
This nationwide study indicates that, even after accounting for changing patient characteristics, the mortality of patients hospitalized with COVID-19 in England decreased significantly as the outbreak progressed. This is likely due to a combination of incremental treatment improvements.
1. Horwitz LI, Jones SA, Cerfolio RJ, et al. Trends in COVID-19 risk-adjusted mortality rates. J Hosp Med. 2020;16(2):90-92. https://doi.org/10.12788/jhm.3552
2. Dennis JM, McGovern AP, Vollmer SJ, Mateen BA. Improving survival of critical care patients with coronavirus disease 2019 in England: a national cohort study, March to June 2020. Crit Care Med. 2021;49(2):209-214. https://doi.org/10.1097/CCM.0000000000004747
3. NHS Digital. Hospital Episode Statistics Data Dictionary. Published March 2018. Accessed October 15, 2020. https://digital.nhs.uk/data-and-information/data-tools-and-services/data-services/hospital-episode-statistics/hospital-episode-statistics-data-dictionary
4. NHS Digital. HES-ONS Linked Mortality Data Dictionary. Accessed October 15, 2020. https://digital.nhs.uk/binaries/content/assets/legacy/word/i/p/hes-ons_linked_mortality_data_dictionary_-_mar_20181.docx
5. Public Health England. Technical summary: Public Health England data series on deaths in people with COVID-19. Accessed November 11, 2020. https://assets.publishing.service.gov.uk/government/uploads/system/uploads/attachment_data/file/916035/RA_Technical_Summary_-_PHE_Data_Series_COVID_19_Deaths_20200812.pdf
6. Zou G. A modified Poisson regression approach to prospective studies with binary data. Am J Epidemiol. 2004;159(7):702-706. https://doi.org/10.1093/aje/kwh090
7. van Walraven C, Austin PC, Jennings A, et al. A modification of the Elixhauser comorbidity measures into a point system for hospital death using administrative data. Med Care. 2009;47(6):626-633. https://doi.org /10.1097/MLR.0b013e31819432e5
8. Ministry of Housing Communities & Local Government. The English Indices of Deprivation 2019 (IoD2019). Published September 26, 2020. Accessed January 15, 2021. https://assets.publishing.service.gov.uk/government/uploads/system/uploads/attachment_data/file/835115/IoD2019_Statistical_Release.pdf
9. Zeileis A. Object-oriented computation of sandwich estimators. J Stat Software. 2006;16:1-16. https://doi.org/10.18637/jss.v016.i09
10. Højsgaard S, Halekoh U, Yan J. The R package geepack for generalized estimating equations. J Stat Software. 2006;15:1-11. https://doi.org/10.18637/jss.v015.i02
11. Belsley DA, Kuh E, Welsch RE. Diagnostics: Identifying Influential Data and Sources of Collinearity. John Wiley & Sons; 1980.
12. RECOVERY Collaborative Group, Horby P, Lim WS, Emberson JR, et al. Dexamethasone in hospitalized patients with covid-19 - preliminary report. N Engl J Med. 2020:NEJMoa2021436. https://doi.org/10.1056/NEJMoa2021436
© 2021 Society of Hospital Medicine
Trends in COVID-19 Risk-Adjusted Mortality Rates
Early reports showed high mortality from coronavirus disease 2019 (COVID-19), while current United States data mortality rates are lower, raising hope that new treatments and management strategies have improved outcomes. For instance, Centers for Disease Control and Prevention data show that 6.7% of cases resulted in death in April, compared with 1.9% in September.1 However, the demographics of those infected have also changed, and more available testing may mean more comprehensive identification and earlier treatment. Nationally, for instance, the median age of confirmed cases was 38 years at the end of August, down from 46 years at the start of May.2 Therefore, whether decreasing COVID-19 mortality rates simply reflect changing demographics or represent actual improvements in clinical care is unknown. The objective of this analysis was to assess outcomes over time in a single health system, accounting for changes in demographics, clinical factors, and severity of disease at presentation.
METHODS
We analyzed monthly mortality rates for admissions between March 1 and August 31, 2020, in a single health system in New York City. Outcomes were obtained as of October 8, 2020. We included all hospitalizations of people 18 years and older with laboratory-confirmed severe acute respiratory syndrome coronavirus 2 (SARS-CoV-2) infection identified during the hospitalization or in the prior 2 weeks, excluding those admitted to hospice care. Patients with multiple hospitalizations (N=208 patients, 229 hospitalizations, 4.4%) were included repeatedly if they continued to have laboratory-confirmed disease. Patients without admission vital signs (N=28) were excluded. Mortality was defined as in-hospital death or discharge to hospice care. In-house laboratory testing began March 16 and all inpatients were tested for SARS-CoV-2 by April 1; elective surgeries resumed May 4-11 and were only conducted on confirmed SARS-CoV-2–negative patients.
All data were obtained from the electronic health record (Epic Systems, Verona, Wisconsin). Diagnosis codes were obtained from the problem list, past medical history, and billing codes. In addition, we used objective data such as hemoglobin A1c, ejection fraction, outpatient creatinine, and outpatient blood pressure to augment problem list diagnoses where relevant.
Based on prior literature, we constructed multivariable logistic regression models for mortality adjusting for age; sex; self-reported race and ethnicity; body mass index; smoking history; presence of hypertension, heart failure, hyperlipidemia, coronary artery disease, diabetes, cancer, chronic kidney disease, dementia, or pulmonary disease individually as dummy variables; and admission oxygen saturation, D-dimer, ferritin, and C-reactive protein.3-6 In the first model (C statistic 0.82), we did not include month of admission as a covariate and calculated the ratio of the sum of observed and expected deaths (obtained from the model) in each month to obtain the standardized mortality ratio (SMR) for each month. We then multiplied each period’s SMR by the overall average crude mortality to generate monthly adjusted mortality rates. We calculated Poisson control limits and indicated points outside the control limits as significantly different.
In a second model (C statistic 0.84), we included month as a covariate and calculated average marginal effects (AME) for each time period by using the margins library in R,7 which uses a discrete first-difference in predicted outcomes to obtain the AME. The average marginal effect represents the percentage point difference between the reference period (March) and a subsequent time period in probability of death or discharge to hospice, for equivalent patients. We obtained lower and upper confidence intervals for the AME using a bootstrapping approach described in Green.8 Finally, we conducted two sensitivity analyses: one, restricting the analysis to only those patients with principal diagnosis of COVID-19, sepsis, or respiratory disease (see Appendix A for complete list of codes) and one restricting the analysis to only those with length of stay of at least 3 days.
All statistical analyses were conducted with R, version 4.0.2. All analyses used 2-sided statistical tests, and we considered a P value < .05 to be statistically significant without adjustment for multiple testing. The NYU institutional review board approved the study and granted a waiver of consent and a waiver of the Health Information Portability and Accountability Act.
RESULTS
We included 5,121 hospitalizations, of which 5,118 (99.94%) had known outcomes (death or hospital discharge). Peak hospitalizations occurred in late March to mid-April, which accounted for 53% of the hospitalizations. Median length of stay for patients who died or were discharged to hospice was 8 days (interquartile range, 4-15; max 140 days). The median age and the proportion male or with any comorbidity decreased over time (Table). For instance, the proportion with any chronic condition decreased from 81% in March to 72% in August.

Adjusted mortality dropped each month, from 25.6% in March to 7.6% in August (Table and Figure). The SMR declined progressively over time, from 1.26 (95% CI, 1.15-1.39) in March to 0.38 (95% CI, 0.12-0.88) in August (Table). The adjusted average marginal effect was also significantly lower than in March in every subsequent month, reaching a maximum of an average 18.2 (95% CI, 12.0-24.4) percentage point decrease in probability of death in August, accounting for changes in demographics and clinical severity (Table and Appendix B). The decrease in unadjusted mortality over time was observed across age groups (Appendix C).

Results of the two sensitivity analyses were similar (Appendices D and E), though attenuated in the case of the sepsis/respiratory cohort, with adjusted mortality falling from 31.4% to 14.4%, SMR decreasing from 1.28 (95% CI, 1.16-1.41) to 0.59 (95% CI, 0.16-1.50), and AME in August 17.0 percentage points (95% CI, 6.0-28.1).
DISCUSSION
In this study of COVID-19 mortality over 6 months at a single health system, we found that changes in demographics and severity of illness at presentation did not fully explain decreases in mortality seen over time. Even after risk adjustment for a variety of clinical and demographic factors, including severity of illness at presentation, mortality was significantly and progressively lower over the course of the study period.
Similar risk-adjusted results have been preliminarily reported among intensive care unit patients in a preprint from the United Kingdom.9 Incremental improvements in outcomes are likely a combination of increasing clinical experience, decreasing hospital volume, growing use of new pharmacologic treatments (such as systemic corticosteroids,10 remdesivir,11 and anticytokine treatments), nonpharmacologic treatments (such as placing the patient in the prone position, or proning, rather than on their back), earlier intervention, community awareness, and, potentially, lower viral load exposure from increased mask wearing and social distancing.12
Strengths of this study include highly detailed electronic health record data on hospitalizations at three different hospitals, a diverse patient population,6 near-complete study outcomes, and a lengthy period of investigation of 6 months. However, this study does have limitations. All patients were from a single geographic region and treated within a single health system, though restricting data to one system reduces institution-level variability and allows us to assess how care may have evolved with growing experience. Aggregating data from numerous health systems that might be at different stages of local outbreaks, provide different quality of care, and contribute different numbers of patients in each period introduces its own biases. We were also unable to disentangle different potential explanatory factors given the observational nature of the study. Residual confounding, such as a higher proportion of particularly frail patients admitted in earlier periods, is also a possibility, though the fact that we observed declines across all age groups mitigates this concern. Thresholds for hospital admission may also have changed over time with less severely ill patients being admitted in the later time periods. While changing admission thresholds could have contributed to higher survival rates in the latter portions of the study, our inclusion of several highly predictive clinical and laboratory results likely captured many aspects of disease severity.
CONCLUSION
In summary, data from one health system suggest that COVID-19 remains a serious disease for high-risk patients, but that mortality rates are improving over time.
1. CDC COVID Data Tracker. 2020. Centers for Disease Control and Prevention. Accessed October 14, 2020. https://covid.cdc.gov/covid-data-tracker/#trends_dailytrendscases
2. Boehmer TK, DeVies J, Caruso E, et al. Changing age distribution of the COVID-19 pandemic - United States, May-August 2020. MMWR Morb Mortal Wkly Rep. 2020;69(39):1404-1409 http://dx.doi.org/0.15585/mmwr.mm6939e1
3. Lu L, Zhong W, Bian Z, et al. A comparison of mortality-related risk factors of COVID-19, SARS, and MERS: A systematic review and meta-analysis. J Infect. 2020;81(4):318-e25. https://doi.org/10.1016/j.jinf.2020.07.002
4. Parohan M, Yaghoubi S, Seraji A, Javanbakht MH, Sarraf P, Djalali M. Risk factors for mortality in patients with coronavirus disease 2019 (COVID-19) infection: a systematic review and meta-analysis of observational studies. Aging Male. 2020;Jun8:1-9. https://doi.org/10.1080/13685538.2020.1774748
5. Zheng Z, Peng F, Xu B, et al. Risk factors of critical & mortal COVID-19 cases: a systematic literature review and meta-analysis. J Infect. 2020;81(2):e16-e25. https://doi.org/10.1016/j.jinf.2020.04.021
6. Petrilli CM, Jones SA, Yang J, et al. Factors associated with hospital admission and critical illness among 5279 people with coronavirus disease 2019 in New York City: prospective cohort study. BMJ. 2020;369:m1966. https://doi.org/10.1136/bmj.m1966
7. margins: Marginal Effects for Model Objects [computer program]. Version R package version 0.3.232018. Accessed October 1, 2020. https://rdrr.io/cran/margins/
8. Greene WH. Econometric Analysis. 7th ed. Pearson; 2012.
9. Doidge JC, Mouncey PR, Thomas K, et al. Trends in intensive care for patients with COVID-19 in England, Wales and Northern Ireland. Preprints 2020. Preprint posted online August 11, 2020. https://doi.org/10.20944/preprints202008.0267.v1
10. Recovery Collaborative Group, Horby P, Lim WS, et al. Dexamethasone in hospitalized patients with Covid-19 - preliminary report. N Engl J Med. 2020. Online first July 17, 2020. https://doi.org/10.1056/NEJMoa2021436
11. Beigel JH, Tomashek KM, Dodd LE, et al. Remdesivir for the treatment of Covid-19 – final report. N Enl J Med. 2020. Online first October 8, 2020. https://doi.org/10.1056/NEJMoa2007764
12. Gandhi M, Rutherford GW. Facial masking for Covid-19 - potential for “variolation” as we await a vaccine. N Engl J Med. 2020. Online first September 8, 2020. https://doi.org/10.1056/NEJMp2026913
Early reports showed high mortality from coronavirus disease 2019 (COVID-19), while current United States data mortality rates are lower, raising hope that new treatments and management strategies have improved outcomes. For instance, Centers for Disease Control and Prevention data show that 6.7% of cases resulted in death in April, compared with 1.9% in September.1 However, the demographics of those infected have also changed, and more available testing may mean more comprehensive identification and earlier treatment. Nationally, for instance, the median age of confirmed cases was 38 years at the end of August, down from 46 years at the start of May.2 Therefore, whether decreasing COVID-19 mortality rates simply reflect changing demographics or represent actual improvements in clinical care is unknown. The objective of this analysis was to assess outcomes over time in a single health system, accounting for changes in demographics, clinical factors, and severity of disease at presentation.
METHODS
We analyzed monthly mortality rates for admissions between March 1 and August 31, 2020, in a single health system in New York City. Outcomes were obtained as of October 8, 2020. We included all hospitalizations of people 18 years and older with laboratory-confirmed severe acute respiratory syndrome coronavirus 2 (SARS-CoV-2) infection identified during the hospitalization or in the prior 2 weeks, excluding those admitted to hospice care. Patients with multiple hospitalizations (N=208 patients, 229 hospitalizations, 4.4%) were included repeatedly if they continued to have laboratory-confirmed disease. Patients without admission vital signs (N=28) were excluded. Mortality was defined as in-hospital death or discharge to hospice care. In-house laboratory testing began March 16 and all inpatients were tested for SARS-CoV-2 by April 1; elective surgeries resumed May 4-11 and were only conducted on confirmed SARS-CoV-2–negative patients.
All data were obtained from the electronic health record (Epic Systems, Verona, Wisconsin). Diagnosis codes were obtained from the problem list, past medical history, and billing codes. In addition, we used objective data such as hemoglobin A1c, ejection fraction, outpatient creatinine, and outpatient blood pressure to augment problem list diagnoses where relevant.
Based on prior literature, we constructed multivariable logistic regression models for mortality adjusting for age; sex; self-reported race and ethnicity; body mass index; smoking history; presence of hypertension, heart failure, hyperlipidemia, coronary artery disease, diabetes, cancer, chronic kidney disease, dementia, or pulmonary disease individually as dummy variables; and admission oxygen saturation, D-dimer, ferritin, and C-reactive protein.3-6 In the first model (C statistic 0.82), we did not include month of admission as a covariate and calculated the ratio of the sum of observed and expected deaths (obtained from the model) in each month to obtain the standardized mortality ratio (SMR) for each month. We then multiplied each period’s SMR by the overall average crude mortality to generate monthly adjusted mortality rates. We calculated Poisson control limits and indicated points outside the control limits as significantly different.
In a second model (C statistic 0.84), we included month as a covariate and calculated average marginal effects (AME) for each time period by using the margins library in R,7 which uses a discrete first-difference in predicted outcomes to obtain the AME. The average marginal effect represents the percentage point difference between the reference period (March) and a subsequent time period in probability of death or discharge to hospice, for equivalent patients. We obtained lower and upper confidence intervals for the AME using a bootstrapping approach described in Green.8 Finally, we conducted two sensitivity analyses: one, restricting the analysis to only those patients with principal diagnosis of COVID-19, sepsis, or respiratory disease (see Appendix A for complete list of codes) and one restricting the analysis to only those with length of stay of at least 3 days.
All statistical analyses were conducted with R, version 4.0.2. All analyses used 2-sided statistical tests, and we considered a P value < .05 to be statistically significant without adjustment for multiple testing. The NYU institutional review board approved the study and granted a waiver of consent and a waiver of the Health Information Portability and Accountability Act.
RESULTS
We included 5,121 hospitalizations, of which 5,118 (99.94%) had known outcomes (death or hospital discharge). Peak hospitalizations occurred in late March to mid-April, which accounted for 53% of the hospitalizations. Median length of stay for patients who died or were discharged to hospice was 8 days (interquartile range, 4-15; max 140 days). The median age and the proportion male or with any comorbidity decreased over time (Table). For instance, the proportion with any chronic condition decreased from 81% in March to 72% in August.
Adjusted mortality dropped each month, from 25.6% in March to 7.6% in August (Table and Figure). The SMR declined progressively over time, from 1.26 (95% CI, 1.15-1.39) in March to 0.38 (95% CI, 0.12-0.88) in August (Table). The adjusted average marginal effect was also significantly lower than in March in every subsequent month, reaching a maximum of an average 18.2 (95% CI, 12.0-24.4) percentage point decrease in probability of death in August, accounting for changes in demographics and clinical severity (Table and Appendix B). The decrease in unadjusted mortality over time was observed across age groups (Appendix C).
Results of the two sensitivity analyses were similar (Appendices D and E), though attenuated in the case of the sepsis/respiratory cohort, with adjusted mortality falling from 31.4% to 14.4%, SMR decreasing from 1.28 (95% CI, 1.16-1.41) to 0.59 (95% CI, 0.16-1.50), and AME in August 17.0 percentage points (95% CI, 6.0-28.1).
DISCUSSION
In this study of COVID-19 mortality over 6 months at a single health system, we found that changes in demographics and severity of illness at presentation did not fully explain decreases in mortality seen over time. Even after risk adjustment for a variety of clinical and demographic factors, including severity of illness at presentation, mortality was significantly and progressively lower over the course of the study period.
Similar risk-adjusted results have been preliminarily reported among intensive care unit patients in a preprint from the United Kingdom.9 Incremental improvements in outcomes are likely a combination of increasing clinical experience, decreasing hospital volume, growing use of new pharmacologic treatments (such as systemic corticosteroids,10 remdesivir,11 and anticytokine treatments), nonpharmacologic treatments (such as placing the patient in the prone position, or proning, rather than on their back), earlier intervention, community awareness, and, potentially, lower viral load exposure from increased mask wearing and social distancing.12
Strengths of this study include highly detailed electronic health record data on hospitalizations at three different hospitals, a diverse patient population,6 near-complete study outcomes, and a lengthy period of investigation of 6 months. However, this study does have limitations. All patients were from a single geographic region and treated within a single health system, though restricting data to one system reduces institution-level variability and allows us to assess how care may have evolved with growing experience. Aggregating data from numerous health systems that might be at different stages of local outbreaks, provide different quality of care, and contribute different numbers of patients in each period introduces its own biases. We were also unable to disentangle different potential explanatory factors given the observational nature of the study. Residual confounding, such as a higher proportion of particularly frail patients admitted in earlier periods, is also a possibility, though the fact that we observed declines across all age groups mitigates this concern. Thresholds for hospital admission may also have changed over time with less severely ill patients being admitted in the later time periods. While changing admission thresholds could have contributed to higher survival rates in the latter portions of the study, our inclusion of several highly predictive clinical and laboratory results likely captured many aspects of disease severity.
CONCLUSION
In summary, data from one health system suggest that COVID-19 remains a serious disease for high-risk patients, but that mortality rates are improving over time.
1. CDC COVID Data Tracker. 2020. Centers for Disease Control and Prevention. Accessed October 14, 2020. https://covid.cdc.gov/covid-data-tracker/#trends_dailytrendscases
2. Boehmer TK, DeVies J, Caruso E, et al. Changing age distribution of the COVID-19 pandemic - United States, May-August 2020. MMWR Morb Mortal Wkly Rep. 2020;69(39):1404-1409 http://dx.doi.org/0.15585/mmwr.mm6939e1
3. Lu L, Zhong W, Bian Z, et al. A comparison of mortality-related risk factors of COVID-19, SARS, and MERS: A systematic review and meta-analysis. J Infect. 2020;81(4):318-e25. https://doi.org/10.1016/j.jinf.2020.07.002
4. Parohan M, Yaghoubi S, Seraji A, Javanbakht MH, Sarraf P, Djalali M. Risk factors for mortality in patients with coronavirus disease 2019 (COVID-19) infection: a systematic review and meta-analysis of observational studies. Aging Male. 2020;Jun8:1-9. https://doi.org/10.1080/13685538.2020.1774748
5. Zheng Z, Peng F, Xu B, et al. Risk factors of critical & mortal COVID-19 cases: a systematic literature review and meta-analysis. J Infect. 2020;81(2):e16-e25. https://doi.org/10.1016/j.jinf.2020.04.021
6. Petrilli CM, Jones SA, Yang J, et al. Factors associated with hospital admission and critical illness among 5279 people with coronavirus disease 2019 in New York City: prospective cohort study. BMJ. 2020;369:m1966. https://doi.org/10.1136/bmj.m1966
7. margins: Marginal Effects for Model Objects [computer program]. Version R package version 0.3.232018. Accessed October 1, 2020. https://rdrr.io/cran/margins/
8. Greene WH. Econometric Analysis. 7th ed. Pearson; 2012.
9. Doidge JC, Mouncey PR, Thomas K, et al. Trends in intensive care for patients with COVID-19 in England, Wales and Northern Ireland. Preprints 2020. Preprint posted online August 11, 2020. https://doi.org/10.20944/preprints202008.0267.v1
10. Recovery Collaborative Group, Horby P, Lim WS, et al. Dexamethasone in hospitalized patients with Covid-19 - preliminary report. N Engl J Med. 2020. Online first July 17, 2020. https://doi.org/10.1056/NEJMoa2021436
11. Beigel JH, Tomashek KM, Dodd LE, et al. Remdesivir for the treatment of Covid-19 – final report. N Enl J Med. 2020. Online first October 8, 2020. https://doi.org/10.1056/NEJMoa2007764
12. Gandhi M, Rutherford GW. Facial masking for Covid-19 - potential for “variolation” as we await a vaccine. N Engl J Med. 2020. Online first September 8, 2020. https://doi.org/10.1056/NEJMp2026913
© 2020 Society of Hospital Medicine
Patient Preferences for Physician Attire: A Multicenter Study in Japan
The patient-physician relationship is critical for ensuring the delivery of high-quality healthcare. Successful patient-physician relationships arise from shared trust, knowledge, mutual respect, and effective verbal and nonverbal communication. The ways in which patients experience healthcare and their satisfaction with physicians affect a myriad of important health outcomes, such as adherence to treatment and outcomes for conditions such as hypertension and diabetes mellitus.1-5 One method for potentially enhancing patient satisfaction is through understanding how patients wish their physicians to dress6-8 and tailoring attire to match these expectations. In addition to our systematic review,9 a recent large-scale, multicenter study in the United States revealed that most patients perceive physician attire as important, but that preferences for specific types of attire are contextual.9,10 For example, elderly patients preferred physicians in formal attire and white coat, while scrubs with white coat or scrubs alone were preferred for emergency department (ED) physicians and surgeons, respectively. Moreover, regional variation regarding attire preference was also observed in the US, with preferences for more formal attire in the South and less formal in the Midwest.
Geographic variation, regarding patient preferences for physician dress, is perhaps even more relevant internationally. In particular, Japan is considered to have a highly contextualized culture that relies on nonverbal and implicit communication. However, medical professionals have no specific dress code and, thus, don many different kinds of attire. In part, this may be because it is not clear whether or how physician attire impacts patient satisfaction and perceived healthcare quality in Japan.11-13 Although previous studies in Japan have suggested that physician attire has a considerable influence on patient satisfaction, these studies either involved a single department in one hospital or a small number of respondents.14-17 Therefore, we performed a multicenter, cross-sectional study to understand patients’ preferences for physician attire in different clinical settings and in different geographic regions in Japan.
METHODS
Study Population
We conducted a cross-sectional, questionnaire-based study from 2015 to 2017, in four geographically diverse hospitals in Japan. Two of these hospitals, Tokyo Joto Hospital and Juntendo University Hospital, are located in eastern Japan whereas the others, Kurashiki Central Hospital and Akashi Medical Center, are in western Japan.
Questionnaires were printed and randomly distributed by research staff to outpatients in waiting rooms and inpatients in medical wards who were 20 years of age or older. We placed no restriction on ward site or time of questionnaire distribution. Research staff, including physicians, nurses, and medical clerks, were instructed to avoid guiding or influencing participants’ responses. Informed consent was obtained by the staff; only those who provided informed consent participated in the study. Respondents could request assistance with form completion from persons accompanying them if they had difficulties, such as physical, visual, or hearing impairments. All responses were collected anonymously. The study was approved by the ethics committees of all four hospitals.
Questionnaire
We used a modified version of the survey instrument from a prior study.10 The first section of the survey showed photographs of either a male or female physician with 7 unique forms of attire, including casual, casual with white coat, scrubs, scrubs with white coat, formal, formal with white coat, and business suit (Figure 1). Given the Japanese context of this study, the language was translated to Japanese and photographs of physicians of Japanese descent were used. Photographs were taken with attention paid to achieving constant facial expressions on the physicians as well as in other visual cues (eg, lighting, background, pose). The physician’s gender and attire in the first photograph seen by each respondent were randomized to prevent bias in ordering, priming, and anchoring; all other sections of the survey were identical.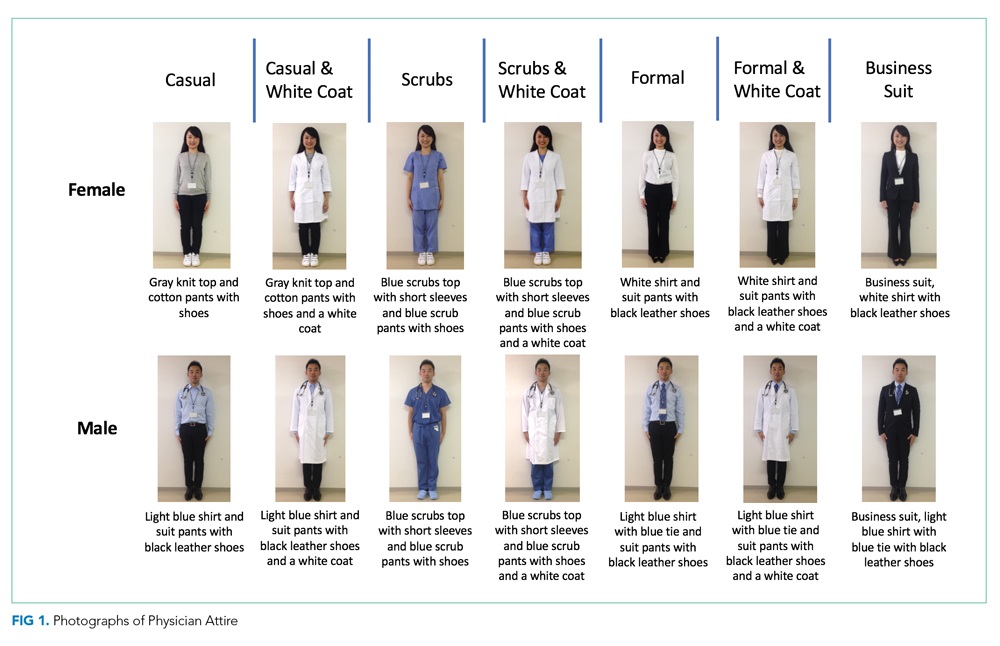
Respondents were first asked to rate the standalone, randomized physician photograph using a 1-10 scale across five domains (ie, how knowledgeable, trustworthy, caring, and approachable the physician appeared and how comfortable the physician’s appearance made the respondent feel), with a score of 10 representing the highest rating. Respondents were subsequently given 7 photographs of the same physician wearing various forms of attire. Questions were asked regarding preference of attire in varied clinical settings (ie, primary care, ED, hospital, surgery, overall preference). To identify the influence of and respondent preferences for physician dress and white coats, a Likert scale ranging from 1 (strongly disagree) to 5 (strongly agree) was employed. The scale was trichotomized into “disagree” (1, 2), “neither agree nor disagree” (3), and “agree” (4, 5) for analysis. Demographic data, including age, gender, education level, nationality (Japanese or non-Japanese), and number of physicians seen in the past year were collected.
Outcomes and Sample Size Calculation
The primary outcome of attire preference was calculated as the mean composite score of the five individual rating domains (ie, knowledgeable, trustworthy, caring, approachable, and comfortable), with the highest score representing the most preferred form of attire. We also assessed variation in preferences for physician attire by respondent characteristics, such as age and gender.
Sample size estimation was based on previous survey methodology.10 The Likert scale range for identifying influence of and respondent preferences for physician dress and white coats was 1-5 (“strongly disagree” to “strongly agree”). The scale range for measuring preferences for the randomized attire photograph was 1-10. An assumption of normality was made regarding responses on the 1-10 scale. An estimated standard deviation of 2.2 was assumed, based on prior findings.10 Based on these assumptions and the inclusion of at least 816 respondents (assuming a two-sided alpha error of 0.05), we expected to have 90% capacity to detect differences for effect sizes of 0.50 on the 1-10 scale.
Statistical Analyses
Paper-based survey data were entered independently and in duplicate by the study team. Respondents were not required to answer all questions; therefore, the denominator for each question varied. Data were reported as mean and standard deviation (SD) or percentages, where appropriate. Differences in the mean composite rating scores were assessed using one-way ANOVA with the Tukey method for pairwise comparisons. Differences in proportions for categorical data were compared using the Z-test. Chi-squared tests were used for bivariate comparisons between respondent age, gender, and level of education and corresponding respondent preferences. All analyses were performed using Stata 14 MP/SE (Stata Corp., College Station, Texas, USA).
RESULTS
Characteristics of Participants
Between December 1, 2015 and October 30, 2017, a total of 2,020 surveys were completed by patients across four academic hospitals in Japan. Of those, 1,960 patients (97.0%) completed the survey in its entirety. Approximately half of the respondents were 65 years of age or older (49%), of female gender (52%), and reported receiving care in the outpatient setting (53%). Regarding use of healthcare, 91% had seen more than one physician in the year preceding the time of survey completion (Table 1).
Ratings of Physician Attire
Compared with all forms of attire depicted in the survey’s first standalone photograph, respondents rated “casual attire with white coat” the highest (Figure 2). The mean composite score for “casual attire with white coat” was 7.1 (standard deviation [SD] = 1.8), and this attire was set as the referent group. Cronbach’s alpha, for the five items included in the composite score, was 0.95. However, “formal attire with white coat” was rated almost as highly as “casual attire with white coat” with an overall mean composite score of 7.0 (SD = 1.6).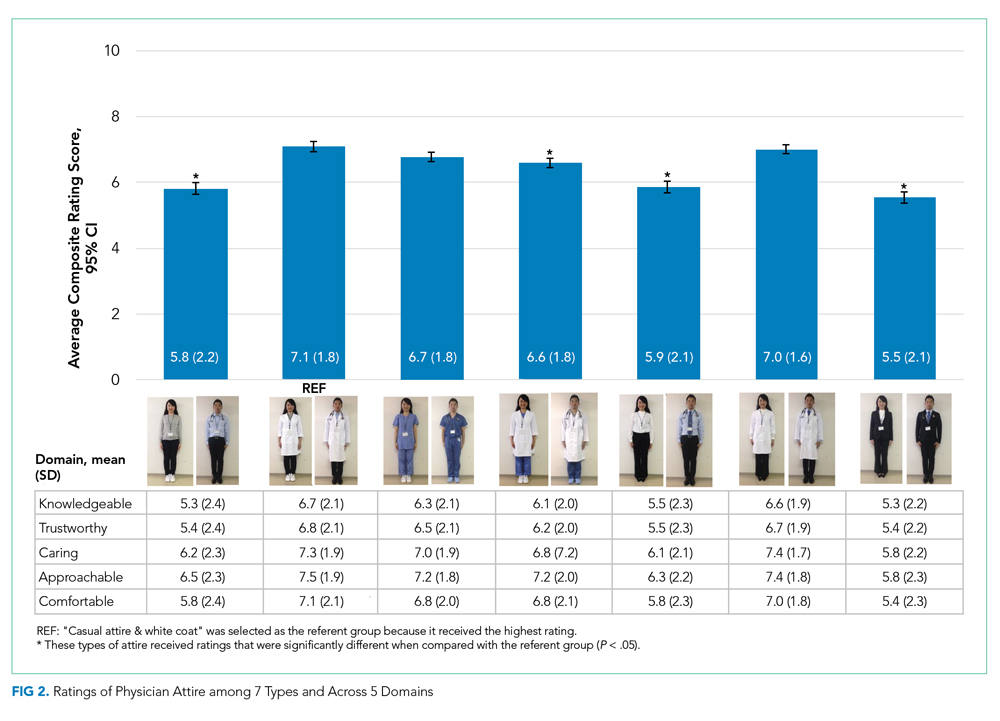
Variation in Preference for Physician Attire by Clinical Setting
Preferences for physician attire varied by clinical care setting. Most respondents preferred “casual attire with white coat” or “formal attire with white coat” in both primary care and hospital settings, with a slight preference for “casual attire with white coat.” In contrast, respondents preferred “scrubs without white coat” in the ED and surgical settings. When asked about their overall preference, respondents reported they felt their physician should wear “formal attire with white coat” (35%) or “casual attire with white coat” (30%; Table 2). When comparing the group of photographs of physicians with white coats to the group without white coats (Figure 1), respondents preferred physicians wearing white coats overall and specifically when providing care in primary care and hospital settings. However, they preferred physicians without white coats when providing care in the ED (P < .001). With respect to surgeons, there was no statistically significant difference between preference for white coats and no white coats. These results were similar for photographs of both male and female physicians.
When asked whether physician dress was important to them and if physician attire influenced their satisfaction with the care received, 61% of participants agreed that physician dress was important, and 47% agreed that physician attire influenced satisfaction (Appendix Table 1). With respect to appropriateness of physicians dressing casually over the weekend in clinical settings, 52% responded that casual wear was inappropriate, while 31% had a neutral opinion.
Participants were asked whether physicians should wear a white coat in different clinical settings. Nearly two-thirds indicated a preference for white coats in the office and hospital (65% and 64%, respectively). Responses regarding whether emergency physicians should wear white coats were nearly equally divided (Agree, 37%; Disagree, 32%; Neither Agree nor Disagree, 31%). However, “scrubs without white coat” was most preferred (56%) when patients were given photographs of various attire and asked, “Which physician would you prefer to see when visiting the ER?” Responses to the question “Physicians should always wear a white coat when seeing patients in any setting” varied equally (Agree, 32%; Disagree, 34%; Neither Agree nor Disagree, 34%).
Variation in Preference for Physician Attire by Respondent Demographics
When comparing respondents by age, those 65 years or older preferred “formal attire with white coat” more so than respondents younger than 65 years (Appendix Table 2). This finding was identified in both primary care (36% vs 31%, P < .001) and hospital settings (37% vs 30%, P < .001). Additionally, physician attire had a greater impact on older respondents’ satisfaction and experience (Appendix Table 3). For example, 67% of respondents 65 years and older agreed that physician attire was important, and 54% agreed that attire influenced satisfaction. Conversely, for respondents younger than 65 years, the proportion agreeing with these statements was lower (56% and 41%, both P < .001). When comparing older and younger respondents, those 65 years and older more often preferred physicians wearing white coats in any setting (39% vs 26%, P < .001) and specifically in their office (68% vs 61%, P = .002), the ED (40% vs 34%, P < .001), and the hospital (69% vs 60%, P < .001).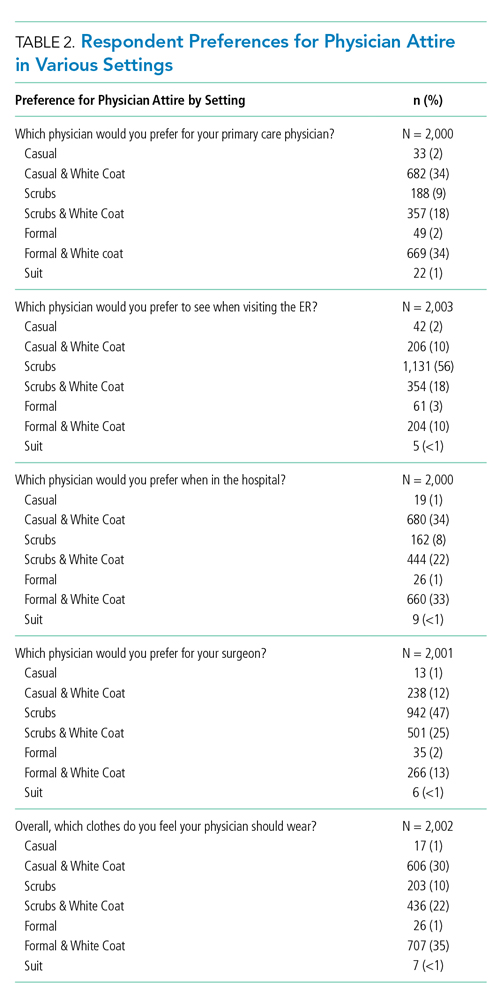
When comparing male and female respondents, male respondents more often stated that physician dress was important to them (men, 64%; women, 58%; P = .002). When comparing responses to the question “Overall, which clothes do you feel a doctor should wear?”, between the eastern and western Japanese hospitals, preferences for physician attire varied.
Variation in Expectations Between Male and Female Physicians
When comparing the ratings of male and female physicians, female physicians were rated higher in how caring (P = .005) and approachable (P < .001) they appeared. However, there were no significant differences in the ratings of the three remaining domains (ie, knowledgeable, trustworthy, and comfortable) or the composite score.
DISCUSSION
Since we employed the same methodology as previous studies conducted in the US10 and Switzerland,18 a notable strength of our approach is that comparisons among these countries can be drawn. For example, physician attire appears to hold greater importance in Japan than in the US and Switzerland. Among Japanese participants, 61% agreed that physician dress is important (US, 53%; Switzerland, 36%), and 47% agreed that physician dress influenced how satisfied they were with their care (US, 36%; Switzerland, 23%).10 This result supports the notion that nonverbal and implicit communications (such as physician dress) may carry more importance among Japanese people.11-13
Regarding preference ratings for type of dress among respondents in Japan, “casual attire with white coat” received the highest mean composite score rating, with “formal attire with white coat” rated second overall. In contrast, US respondents rated “formal attire with white coat” highest and “scrubs with white coat” second.10 Our result runs counter to our expectation in that we expected Japanese respondents to prefer formal attire, since Japan is one of the most formal cultures in the world. One potential explanation for this difference is that the casual style chosen for this study was close to the smart casual style (slightly casual). Most hospitals and clinics in Japan do not allow physicians to wear jeans or polo shirts, which were chosen as the casual attire in the previous US study.
When examining various care settings and physician types, both Japanese and US respondents were more likely to prefer physicians wearing a white coat in the office or hospital.10 However, Japanese participants preferred both “casual attire with white coat” and “formal attire with white coat” equally in primary care or hospital settings. A smaller proportion of US respondents preferred “casual attire with white coat” in primary care (11%) and hospital settings (9%), but more preferred “formal attire with white coat” for primary care (44%) and hospital physicians (39%). In the ED setting, 32% of participants in Japan and 18% in the US disagreed with the idea that physicians should wear a white coat. Among Japanese participants, “scrubs without white coat” was rated highest for emergency physicians (56%) and surgeons (47%), while US preferences were 40% and 42%, respectively.10 One potential explanation is that scrubs-based attire became popular among Japanese ED and surgical contexts as a result of cultural influence and spread from western countries.19, 20
With respect to perceptions regarding physician attire on weekends, 52% of participants considered it inappropriate for a physician to dress casually over the weekend, compared with only 30% in Switzerland and 21% in the US.11,12 Given Japan’s level of formality and the fact that most Japanese physicians continue to work over the weekend,21-23 Japanese patients tend to expect their physicians to dress in more formal attire during these times.
Previous studies in Japan have demonstrated that older patients gave low ratings to scrubs and high ratings to white coat with any attire,15,17 and this was also the case in our study. Perhaps elderly patients reflect conservative values in their preferences of physician dress. Their perceptions may be less influenced by scenes portraying physicians in popular media when compared with the perceptions of younger patients. Though a 2015 systematic review and studies in other countries revealed white coats were preferred regardless of exact dress,9,24-26 they also showed variation in preferences for physician attire. For example, patients in Saudi Arabia preferred white coat and traditional ethnic dress,25 whereas mothers of pediatric patients in Saudi Arabia preferred scrubs for their pediatricians.27 Therefore, it is recommended for internationally mobile physicians to choose their dress depending on a variety of factors including country, context, and patient age group.
Our study has limitations. First, because some physicians presented the surveys to the patients, participants may have responded differently. Second, participants may have identified photographs of the male physician model as their personal healthcare provider (one author, K.K.). To avoid this possible bias, we randomly distributed 14 different versions of physician photographs in the questionnaire. Third, although physician photographs were strictly controlled, the “formal attire and white coat” and “casual attire and white coat” photographs appeared similar, especially given that the white coats were buttoned. Also, the female physician depicted in the photographs did not have the scrub shirt tucked in, while the male physician did. These nuances may have affected participant ratings between groups. Fourth,
In conclusion, patient preferences for physician attire were examined using a multicenter survey with a large sample size and robust survey methodology, thus overcoming weaknesses of previous studies into Japanese attire. Japanese patients perceive that physician attire is important and influences satisfaction with their care, more so than patients in other countries, like the US and Switzerland. Geography, settings of care, and patient age play a role in preferences. As a result, hospitals and health systems may use these findings to inform dress code policy based on patient population and context, recognizing that the appearance of their providers affects the patient-physician relationship. Future research should focus on better understanding the various cultural and societal customs that lead to patient expectations of physician attire.
Acknowledgments
The authors thank Drs. Fumi Takemoto, Masayuki Ueno, Kazuya Sakai, Saori Kinami, and Toshio Naito for their assistance with data collection at their respective sites. Additionally, the authors thank Dr. Yoko Kanamitsu for serving as a model for photographs.
1. Manary MP, Boulding W, Staelin R, Glickman SW. The patient experience and health outcomes. N Engl J Med. 2013;368(3):201-203. https://doi.org/ 10.1056/NEJMp1211775.
2. Boulding W, Glickman SW, Manary MP, Schulman KA, Staelin R. Relationship between patient satisfaction with inpatient care and hospital readmission within 30 days. Am J Manag Care. 2011;17(1):41-48.
3. Barbosa CD, Balp MM, Kulich K, Germain N, Rofail D. A literature review to explore the link between treatment satisfaction and adherence, compliance, and persistence. Patient Prefer Adherence. 2012;6:39-48. https://doi.org/10.2147/PPA.S24752.
4. Jha AK, Orav EJ, Zheng J, Epstein AM. Patients’ perception of hospital care in the United States. N Engl J Med. 2008;359(18):1921-31. https://doi.org/10.1056/NEJMsa080411.
5. O’Malley AS, Forrest CB, Mandelblatt J. Adherence of low-income women to cancer screening recommendations. J Gen Intern Med. 2002;17(2):144-54. https://doi.org/10.1046/j.1525-1497.2002.10431.x.
6. Chung H, Lee H, Chang DS, Kim HS, Park HJ, Chae Y. Doctor’s attire influences perceived empathy in the patient-doctor relationship. Patient Educ Couns. 2012;89(3):387-391. https://doi.org/10.1016/j.pec.2012.02.017.
7. Bianchi MT. Desiderata or dogma: what the evidence reveals about physician attire. J Gen Intern Med. 2008;23(5):641-643. https://doi.org/10.1007/s11606-008-0546-8.
8. Brandt LJ. On the value of an old dress code in the new millennium. Arch Intern Med. 2003;163(11):1277-1281. https://doi.org/10.1001/archinte.163.11.1277.
9. Petrilli CM, Mack M, Petrilli JJ, Hickner A, Saint S, Chopra V. Understanding the role of physician attire on patient perceptions: a systematic review of the literature--targeting attire to improve likelihood of rapport (TAILOR) investigators. BMJ Open. 2015;5(1):e006578. https://doi.org/10.1136/bmjopen-2014-006578.
10. Petrilli CM, Saint S, Jennings JJ, et al. Understanding patient preference for physician attire: a cross-sectional observational study of 10 academic medical centres in the USA. BMJ Open. 2018;8(5):e021239. https://doi.org/10.1136/bmjopen-2017-021239.
11. Rowbury R. The need for more proactive communications. Low trust and changing values mean Japan can no longer fall back on its homogeneity. The Japan Times. 2017, Oct 15;Sect. Opinion. https://www.japantimes.co.jp/opinion/2017/10/15/commentary/japan-commentary/need-proactive-communications/#.Xej7lC3MzUI. Accessed December 5, 2019.
12. Shoji Nishimura ANaST. Communication Style and Cultural Features in High/Low Context Communication Cultures: A Case Study of Finland, Japan and India. Nov 22nd, 2009.
13. Smith RMRSW. The influence of high/low-context culture and power distance on choice of communication media: Students’ media choice to communicate with Professors in Japan and America. Int J Intercultural Relations. 2007;31(4):479-501.
14. Yamada Y, Takahashi O, Ohde S, Deshpande GA, Fukui T. Patients’ preferences for doctors’ attire in Japan. Intern Med. 2010;49(15):1521-1526. https://doi.org/10.2169/internalmedicine.49.3572.
15. Ikusaka M, Kamegai M, Sunaga T, et al. Patients’ attitude toward consultations by a physician without a white coat in Japan. Intern Med. 1999;38(7):533-536. https://doi.org/10.2169/internalmedicine.38.533.
16. Lefor AK, Ohnuma T, Nunomiya S, Yokota S, Makino J, Sanui M. Physician attire in the intensive care unit in Japan influences visitors’ perception of care. J Crit Care. 2018;43:288-293.
17. Kurihara H, Maeno T. Importance of physicians’ attire: factors influencing the impression it makes on patients, a cross-sectional study. Asia Pac Fam Med. 2014;13(1):2. https://doi.org/10.1186/1447-056X-13-2.
18. Zollinger M, Houchens N, Chopra V, et al. Understanding patient preference for physician attire in ambulatory clinics: a cross-sectional observational study. BMJ Open. 2019;9(5):e026009. https://doi.org/10.1136/bmjopen-2018-026009.
19. Chung JE. Medical Dramas and Viewer Perception of Health: Testing Cultivation Effects. Hum Commun Res. 2014;40(3):333-349.
20. Michael Pfau LJM, Kirsten Garrow. The influence of television viewing on public perceptions of physicians. J Broadcast Electron Media. 1995;39(4):441-458.
21. Suzuki S. Exhausting physicians employed in hospitals in Japan assessed by a health questionnaire [in Japanese]. Sangyo Eiseigaku Zasshi. 2017;59(4):107-118. https://doi.org/10.1539/sangyoeisei.
22. Ogawa R, Seo E, Maeno T, Ito M, Sanuki M. The relationship between long working hours and depression among first-year residents in Japan. BMC Med Educ. 2018;18(1):50. https://doi.org/10.1186/s12909-018-1171-9.
23. Saijo Y, Chiba S, Yoshioka E, et al. Effects of work burden, job strain and support on depressive symptoms and burnout among Japanese physicians. Int J Occup Med Environ Health. 2014;27(6):980-992. https://doi.org/10.2478/s13382-014-0324-2.
24. Tiang KW, Razack AH, Ng KL. The ‘auxiliary’ white coat effect in hospitals: perceptions of patients and doctors. Singapore Med J. 2017;58(10):574-575. https://doi.org/10.11622/smedj.2017023.
25. Al Amry KM, Al Farrah M, Ur Rahman S, Abdulmajeed I. Patient perceptions and preferences of physicians’ attire in Saudi primary healthcare setting. J Community Hosp Intern Med Perspect. 2018;8(6):326-330. https://doi.org/10.1080/20009666.2018.1551026.
26. Healy WL. Letter to the editor: editor’s spotlight/take 5: physicians’ attire influences patients’ perceptions in the urban outpatient orthopaedic surgery setting. Clin Orthop Relat Res. 2016;474(11):2545-2546. https://doi.org/10.1007/s11999-016-5049-z.
27. Aldrees T, Alsuhaibani R, Alqaryan S, et al. Physicians’ attire. Parents preferences in a tertiary hospital. Saudi Med J. 2017;38(4):435-439. https://doi.org/10.15537/smj.2017.4.15853.
The patient-physician relationship is critical for ensuring the delivery of high-quality healthcare. Successful patient-physician relationships arise from shared trust, knowledge, mutual respect, and effective verbal and nonverbal communication. The ways in which patients experience healthcare and their satisfaction with physicians affect a myriad of important health outcomes, such as adherence to treatment and outcomes for conditions such as hypertension and diabetes mellitus.1-5 One method for potentially enhancing patient satisfaction is through understanding how patients wish their physicians to dress6-8 and tailoring attire to match these expectations. In addition to our systematic review,9 a recent large-scale, multicenter study in the United States revealed that most patients perceive physician attire as important, but that preferences for specific types of attire are contextual.9,10 For example, elderly patients preferred physicians in formal attire and white coat, while scrubs with white coat or scrubs alone were preferred for emergency department (ED) physicians and surgeons, respectively. Moreover, regional variation regarding attire preference was also observed in the US, with preferences for more formal attire in the South and less formal in the Midwest.
Geographic variation, regarding patient preferences for physician dress, is perhaps even more relevant internationally. In particular, Japan is considered to have a highly contextualized culture that relies on nonverbal and implicit communication. However, medical professionals have no specific dress code and, thus, don many different kinds of attire. In part, this may be because it is not clear whether or how physician attire impacts patient satisfaction and perceived healthcare quality in Japan.11-13 Although previous studies in Japan have suggested that physician attire has a considerable influence on patient satisfaction, these studies either involved a single department in one hospital or a small number of respondents.14-17 Therefore, we performed a multicenter, cross-sectional study to understand patients’ preferences for physician attire in different clinical settings and in different geographic regions in Japan.
METHODS
Study Population
We conducted a cross-sectional, questionnaire-based study from 2015 to 2017, in four geographically diverse hospitals in Japan. Two of these hospitals, Tokyo Joto Hospital and Juntendo University Hospital, are located in eastern Japan whereas the others, Kurashiki Central Hospital and Akashi Medical Center, are in western Japan.
Questionnaires were printed and randomly distributed by research staff to outpatients in waiting rooms and inpatients in medical wards who were 20 years of age or older. We placed no restriction on ward site or time of questionnaire distribution. Research staff, including physicians, nurses, and medical clerks, were instructed to avoid guiding or influencing participants’ responses. Informed consent was obtained by the staff; only those who provided informed consent participated in the study. Respondents could request assistance with form completion from persons accompanying them if they had difficulties, such as physical, visual, or hearing impairments. All responses were collected anonymously. The study was approved by the ethics committees of all four hospitals.
Questionnaire
We used a modified version of the survey instrument from a prior study.10 The first section of the survey showed photographs of either a male or female physician with 7 unique forms of attire, including casual, casual with white coat, scrubs, scrubs with white coat, formal, formal with white coat, and business suit (Figure 1). Given the Japanese context of this study, the language was translated to Japanese and photographs of physicians of Japanese descent were used. Photographs were taken with attention paid to achieving constant facial expressions on the physicians as well as in other visual cues (eg, lighting, background, pose). The physician’s gender and attire in the first photograph seen by each respondent were randomized to prevent bias in ordering, priming, and anchoring; all other sections of the survey were identical.
Respondents were first asked to rate the standalone, randomized physician photograph using a 1-10 scale across five domains (ie, how knowledgeable, trustworthy, caring, and approachable the physician appeared and how comfortable the physician’s appearance made the respondent feel), with a score of 10 representing the highest rating. Respondents were subsequently given 7 photographs of the same physician wearing various forms of attire. Questions were asked regarding preference of attire in varied clinical settings (ie, primary care, ED, hospital, surgery, overall preference). To identify the influence of and respondent preferences for physician dress and white coats, a Likert scale ranging from 1 (strongly disagree) to 5 (strongly agree) was employed. The scale was trichotomized into “disagree” (1, 2), “neither agree nor disagree” (3), and “agree” (4, 5) for analysis. Demographic data, including age, gender, education level, nationality (Japanese or non-Japanese), and number of physicians seen in the past year were collected.
Outcomes and Sample Size Calculation
The primary outcome of attire preference was calculated as the mean composite score of the five individual rating domains (ie, knowledgeable, trustworthy, caring, approachable, and comfortable), with the highest score representing the most preferred form of attire. We also assessed variation in preferences for physician attire by respondent characteristics, such as age and gender.
Sample size estimation was based on previous survey methodology.10 The Likert scale range for identifying influence of and respondent preferences for physician dress and white coats was 1-5 (“strongly disagree” to “strongly agree”). The scale range for measuring preferences for the randomized attire photograph was 1-10. An assumption of normality was made regarding responses on the 1-10 scale. An estimated standard deviation of 2.2 was assumed, based on prior findings.10 Based on these assumptions and the inclusion of at least 816 respondents (assuming a two-sided alpha error of 0.05), we expected to have 90% capacity to detect differences for effect sizes of 0.50 on the 1-10 scale.
Statistical Analyses
Paper-based survey data were entered independently and in duplicate by the study team. Respondents were not required to answer all questions; therefore, the denominator for each question varied. Data were reported as mean and standard deviation (SD) or percentages, where appropriate. Differences in the mean composite rating scores were assessed using one-way ANOVA with the Tukey method for pairwise comparisons. Differences in proportions for categorical data were compared using the Z-test. Chi-squared tests were used for bivariate comparisons between respondent age, gender, and level of education and corresponding respondent preferences. All analyses were performed using Stata 14 MP/SE (Stata Corp., College Station, Texas, USA).
RESULTS
Characteristics of Participants
Between December 1, 2015 and October 30, 2017, a total of 2,020 surveys were completed by patients across four academic hospitals in Japan. Of those, 1,960 patients (97.0%) completed the survey in its entirety. Approximately half of the respondents were 65 years of age or older (49%), of female gender (52%), and reported receiving care in the outpatient setting (53%). Regarding use of healthcare, 91% had seen more than one physician in the year preceding the time of survey completion (Table 1).
Ratings of Physician Attire
Compared with all forms of attire depicted in the survey’s first standalone photograph, respondents rated “casual attire with white coat” the highest (Figure 2). The mean composite score for “casual attire with white coat” was 7.1 (standard deviation [SD] = 1.8), and this attire was set as the referent group. Cronbach’s alpha, for the five items included in the composite score, was 0.95. However, “formal attire with white coat” was rated almost as highly as “casual attire with white coat” with an overall mean composite score of 7.0 (SD = 1.6).
Variation in Preference for Physician Attire by Clinical Setting
Preferences for physician attire varied by clinical care setting. Most respondents preferred “casual attire with white coat” or “formal attire with white coat” in both primary care and hospital settings, with a slight preference for “casual attire with white coat.” In contrast, respondents preferred “scrubs without white coat” in the ED and surgical settings. When asked about their overall preference, respondents reported they felt their physician should wear “formal attire with white coat” (35%) or “casual attire with white coat” (30%; Table 2). When comparing the group of photographs of physicians with white coats to the group without white coats (Figure 1), respondents preferred physicians wearing white coats overall and specifically when providing care in primary care and hospital settings. However, they preferred physicians without white coats when providing care in the ED (P < .001). With respect to surgeons, there was no statistically significant difference between preference for white coats and no white coats. These results were similar for photographs of both male and female physicians.
When asked whether physician dress was important to them and if physician attire influenced their satisfaction with the care received, 61% of participants agreed that physician dress was important, and 47% agreed that physician attire influenced satisfaction (Appendix Table 1). With respect to appropriateness of physicians dressing casually over the weekend in clinical settings, 52% responded that casual wear was inappropriate, while 31% had a neutral opinion.
Participants were asked whether physicians should wear a white coat in different clinical settings. Nearly two-thirds indicated a preference for white coats in the office and hospital (65% and 64%, respectively). Responses regarding whether emergency physicians should wear white coats were nearly equally divided (Agree, 37%; Disagree, 32%; Neither Agree nor Disagree, 31%). However, “scrubs without white coat” was most preferred (56%) when patients were given photographs of various attire and asked, “Which physician would you prefer to see when visiting the ER?” Responses to the question “Physicians should always wear a white coat when seeing patients in any setting” varied equally (Agree, 32%; Disagree, 34%; Neither Agree nor Disagree, 34%).
Variation in Preference for Physician Attire by Respondent Demographics
When comparing respondents by age, those 65 years or older preferred “formal attire with white coat” more so than respondents younger than 65 years (Appendix Table 2). This finding was identified in both primary care (36% vs 31%, P < .001) and hospital settings (37% vs 30%, P < .001). Additionally, physician attire had a greater impact on older respondents’ satisfaction and experience (Appendix Table 3). For example, 67% of respondents 65 years and older agreed that physician attire was important, and 54% agreed that attire influenced satisfaction. Conversely, for respondents younger than 65 years, the proportion agreeing with these statements was lower (56% and 41%, both P < .001). When comparing older and younger respondents, those 65 years and older more often preferred physicians wearing white coats in any setting (39% vs 26%, P < .001) and specifically in their office (68% vs 61%, P = .002), the ED (40% vs 34%, P < .001), and the hospital (69% vs 60%, P < .001).
When comparing male and female respondents, male respondents more often stated that physician dress was important to them (men, 64%; women, 58%; P = .002). When comparing responses to the question “Overall, which clothes do you feel a doctor should wear?”, between the eastern and western Japanese hospitals, preferences for physician attire varied.
Variation in Expectations Between Male and Female Physicians
When comparing the ratings of male and female physicians, female physicians were rated higher in how caring (P = .005) and approachable (P < .001) they appeared. However, there were no significant differences in the ratings of the three remaining domains (ie, knowledgeable, trustworthy, and comfortable) or the composite score.
DISCUSSION
Since we employed the same methodology as previous studies conducted in the US10 and Switzerland,18 a notable strength of our approach is that comparisons among these countries can be drawn. For example, physician attire appears to hold greater importance in Japan than in the US and Switzerland. Among Japanese participants, 61% agreed that physician dress is important (US, 53%; Switzerland, 36%), and 47% agreed that physician dress influenced how satisfied they were with their care (US, 36%; Switzerland, 23%).10 This result supports the notion that nonverbal and implicit communications (such as physician dress) may carry more importance among Japanese people.11-13
Regarding preference ratings for type of dress among respondents in Japan, “casual attire with white coat” received the highest mean composite score rating, with “formal attire with white coat” rated second overall. In contrast, US respondents rated “formal attire with white coat” highest and “scrubs with white coat” second.10 Our result runs counter to our expectation in that we expected Japanese respondents to prefer formal attire, since Japan is one of the most formal cultures in the world. One potential explanation for this difference is that the casual style chosen for this study was close to the smart casual style (slightly casual). Most hospitals and clinics in Japan do not allow physicians to wear jeans or polo shirts, which were chosen as the casual attire in the previous US study.
When examining various care settings and physician types, both Japanese and US respondents were more likely to prefer physicians wearing a white coat in the office or hospital.10 However, Japanese participants preferred both “casual attire with white coat” and “formal attire with white coat” equally in primary care or hospital settings. A smaller proportion of US respondents preferred “casual attire with white coat” in primary care (11%) and hospital settings (9%), but more preferred “formal attire with white coat” for primary care (44%) and hospital physicians (39%). In the ED setting, 32% of participants in Japan and 18% in the US disagreed with the idea that physicians should wear a white coat. Among Japanese participants, “scrubs without white coat” was rated highest for emergency physicians (56%) and surgeons (47%), while US preferences were 40% and 42%, respectively.10 One potential explanation is that scrubs-based attire became popular among Japanese ED and surgical contexts as a result of cultural influence and spread from western countries.19, 20
With respect to perceptions regarding physician attire on weekends, 52% of participants considered it inappropriate for a physician to dress casually over the weekend, compared with only 30% in Switzerland and 21% in the US.11,12 Given Japan’s level of formality and the fact that most Japanese physicians continue to work over the weekend,21-23 Japanese patients tend to expect their physicians to dress in more formal attire during these times.
Previous studies in Japan have demonstrated that older patients gave low ratings to scrubs and high ratings to white coat with any attire,15,17 and this was also the case in our study. Perhaps elderly patients reflect conservative values in their preferences of physician dress. Their perceptions may be less influenced by scenes portraying physicians in popular media when compared with the perceptions of younger patients. Though a 2015 systematic review and studies in other countries revealed white coats were preferred regardless of exact dress,9,24-26 they also showed variation in preferences for physician attire. For example, patients in Saudi Arabia preferred white coat and traditional ethnic dress,25 whereas mothers of pediatric patients in Saudi Arabia preferred scrubs for their pediatricians.27 Therefore, it is recommended for internationally mobile physicians to choose their dress depending on a variety of factors including country, context, and patient age group.
Our study has limitations. First, because some physicians presented the surveys to the patients, participants may have responded differently. Second, participants may have identified photographs of the male physician model as their personal healthcare provider (one author, K.K.). To avoid this possible bias, we randomly distributed 14 different versions of physician photographs in the questionnaire. Third, although physician photographs were strictly controlled, the “formal attire and white coat” and “casual attire and white coat” photographs appeared similar, especially given that the white coats were buttoned. Also, the female physician depicted in the photographs did not have the scrub shirt tucked in, while the male physician did. These nuances may have affected participant ratings between groups. Fourth,
In conclusion, patient preferences for physician attire were examined using a multicenter survey with a large sample size and robust survey methodology, thus overcoming weaknesses of previous studies into Japanese attire. Japanese patients perceive that physician attire is important and influences satisfaction with their care, more so than patients in other countries, like the US and Switzerland. Geography, settings of care, and patient age play a role in preferences. As a result, hospitals and health systems may use these findings to inform dress code policy based on patient population and context, recognizing that the appearance of their providers affects the patient-physician relationship. Future research should focus on better understanding the various cultural and societal customs that lead to patient expectations of physician attire.
Acknowledgments
The authors thank Drs. Fumi Takemoto, Masayuki Ueno, Kazuya Sakai, Saori Kinami, and Toshio Naito for their assistance with data collection at their respective sites. Additionally, the authors thank Dr. Yoko Kanamitsu for serving as a model for photographs.
1. Manary MP, Boulding W, Staelin R, Glickman SW. The patient experience and health outcomes. N Engl J Med. 2013;368(3):201-203. https://doi.org/ 10.1056/NEJMp1211775.
2. Boulding W, Glickman SW, Manary MP, Schulman KA, Staelin R. Relationship between patient satisfaction with inpatient care and hospital readmission within 30 days. Am J Manag Care. 2011;17(1):41-48.
3. Barbosa CD, Balp MM, Kulich K, Germain N, Rofail D. A literature review to explore the link between treatment satisfaction and adherence, compliance, and persistence. Patient Prefer Adherence. 2012;6:39-48. https://doi.org/10.2147/PPA.S24752.
4. Jha AK, Orav EJ, Zheng J, Epstein AM. Patients’ perception of hospital care in the United States. N Engl J Med. 2008;359(18):1921-31. https://doi.org/10.1056/NEJMsa080411.
5. O’Malley AS, Forrest CB, Mandelblatt J. Adherence of low-income women to cancer screening recommendations. J Gen Intern Med. 2002;17(2):144-54. https://doi.org/10.1046/j.1525-1497.2002.10431.x.
6. Chung H, Lee H, Chang DS, Kim HS, Park HJ, Chae Y. Doctor’s attire influences perceived empathy in the patient-doctor relationship. Patient Educ Couns. 2012;89(3):387-391. https://doi.org/10.1016/j.pec.2012.02.017.
7. Bianchi MT. Desiderata or dogma: what the evidence reveals about physician attire. J Gen Intern Med. 2008;23(5):641-643. https://doi.org/10.1007/s11606-008-0546-8.
8. Brandt LJ. On the value of an old dress code in the new millennium. Arch Intern Med. 2003;163(11):1277-1281. https://doi.org/10.1001/archinte.163.11.1277.
9. Petrilli CM, Mack M, Petrilli JJ, Hickner A, Saint S, Chopra V. Understanding the role of physician attire on patient perceptions: a systematic review of the literature--targeting attire to improve likelihood of rapport (TAILOR) investigators. BMJ Open. 2015;5(1):e006578. https://doi.org/10.1136/bmjopen-2014-006578.
10. Petrilli CM, Saint S, Jennings JJ, et al. Understanding patient preference for physician attire: a cross-sectional observational study of 10 academic medical centres in the USA. BMJ Open. 2018;8(5):e021239. https://doi.org/10.1136/bmjopen-2017-021239.
11. Rowbury R. The need for more proactive communications. Low trust and changing values mean Japan can no longer fall back on its homogeneity. The Japan Times. 2017, Oct 15;Sect. Opinion. https://www.japantimes.co.jp/opinion/2017/10/15/commentary/japan-commentary/need-proactive-communications/#.Xej7lC3MzUI. Accessed December 5, 2019.
12. Shoji Nishimura ANaST. Communication Style and Cultural Features in High/Low Context Communication Cultures: A Case Study of Finland, Japan and India. Nov 22nd, 2009.
13. Smith RMRSW. The influence of high/low-context culture and power distance on choice of communication media: Students’ media choice to communicate with Professors in Japan and America. Int J Intercultural Relations. 2007;31(4):479-501.
14. Yamada Y, Takahashi O, Ohde S, Deshpande GA, Fukui T. Patients’ preferences for doctors’ attire in Japan. Intern Med. 2010;49(15):1521-1526. https://doi.org/10.2169/internalmedicine.49.3572.
15. Ikusaka M, Kamegai M, Sunaga T, et al. Patients’ attitude toward consultations by a physician without a white coat in Japan. Intern Med. 1999;38(7):533-536. https://doi.org/10.2169/internalmedicine.38.533.
16. Lefor AK, Ohnuma T, Nunomiya S, Yokota S, Makino J, Sanui M. Physician attire in the intensive care unit in Japan influences visitors’ perception of care. J Crit Care. 2018;43:288-293.
17. Kurihara H, Maeno T. Importance of physicians’ attire: factors influencing the impression it makes on patients, a cross-sectional study. Asia Pac Fam Med. 2014;13(1):2. https://doi.org/10.1186/1447-056X-13-2.
18. Zollinger M, Houchens N, Chopra V, et al. Understanding patient preference for physician attire in ambulatory clinics: a cross-sectional observational study. BMJ Open. 2019;9(5):e026009. https://doi.org/10.1136/bmjopen-2018-026009.
19. Chung JE. Medical Dramas and Viewer Perception of Health: Testing Cultivation Effects. Hum Commun Res. 2014;40(3):333-349.
20. Michael Pfau LJM, Kirsten Garrow. The influence of television viewing on public perceptions of physicians. J Broadcast Electron Media. 1995;39(4):441-458.
21. Suzuki S. Exhausting physicians employed in hospitals in Japan assessed by a health questionnaire [in Japanese]. Sangyo Eiseigaku Zasshi. 2017;59(4):107-118. https://doi.org/10.1539/sangyoeisei.
22. Ogawa R, Seo E, Maeno T, Ito M, Sanuki M. The relationship between long working hours and depression among first-year residents in Japan. BMC Med Educ. 2018;18(1):50. https://doi.org/10.1186/s12909-018-1171-9.
23. Saijo Y, Chiba S, Yoshioka E, et al. Effects of work burden, job strain and support on depressive symptoms and burnout among Japanese physicians. Int J Occup Med Environ Health. 2014;27(6):980-992. https://doi.org/10.2478/s13382-014-0324-2.
24. Tiang KW, Razack AH, Ng KL. The ‘auxiliary’ white coat effect in hospitals: perceptions of patients and doctors. Singapore Med J. 2017;58(10):574-575. https://doi.org/10.11622/smedj.2017023.
25. Al Amry KM, Al Farrah M, Ur Rahman S, Abdulmajeed I. Patient perceptions and preferences of physicians’ attire in Saudi primary healthcare setting. J Community Hosp Intern Med Perspect. 2018;8(6):326-330. https://doi.org/10.1080/20009666.2018.1551026.
26. Healy WL. Letter to the editor: editor’s spotlight/take 5: physicians’ attire influences patients’ perceptions in the urban outpatient orthopaedic surgery setting. Clin Orthop Relat Res. 2016;474(11):2545-2546. https://doi.org/10.1007/s11999-016-5049-z.
27. Aldrees T, Alsuhaibani R, Alqaryan S, et al. Physicians’ attire. Parents preferences in a tertiary hospital. Saudi Med J. 2017;38(4):435-439. https://doi.org/10.15537/smj.2017.4.15853.
© 2020 Society of Hospital Medicine