User login
Data‐Driven Pediatric Alarm Limits
The management of alarms in the hospital setting is a significant patient safety issue. In 2013, the Joint Commission issued Sentinel Event Alert #50 to draw attention to the fact that tens of thousands of alarms occur daily throughout individual hospitals, and 85% to 99% are false or not clinically actionable.[1] These alarms, designed to be a safety net in patient care, have the unintended consequence of causing provider desensitization, also known as alarm fatigue, which contributes to adverse events as severe as patient mortality.[1, 2] For this reason, a 2014 Joint Commission National Patient Safety Goal urged hospitals to prioritize alarm system safety and to develop policies and procedures to manage alarms and alarm fatigue.[3]
Multiple efforts have been made to address alarm fatigue in hospitalized adults. Studies have quantified the frequency and types of medical device alarms,[4, 5, 6, 7, 8, 9] and some proposed solutions to decrease excess alarms.[10, 11, 12, 13, 14, 15] One such solution is to change alarm limit settings, an intervention shown to be efficacious in the literature.[5, 6, 16, 17] Although no adverse patient outcomes are reported in these studies, none of them included a formal safety evaluation to evaluate whether alarm rate reduction occurred at the expense of clinically significant alarms.
Specific to pediatrics, frameworks to address alarm fatigue have been proposed,[18] and the relationship between nurse response time and frequency of exposure to nonactionable alarms has been reported.[19] However, efforts to address alarm fatigue in the pediatric setting are less well studied overall, and there is little guidance regarding optimization of pediatric alarm parameters. Although multiple established reference ranges exist for pediatric vital signs,[20, 21, 22] a systematic review in 2011 found that only 2 of 5 published heart rate (HR) and 6 respiratory rate (RR) guidelines cited any references, and even these had weak underpinning evidence.[23] Consequently, ranges defining normal pediatric vital signs are derived either from small sample observational data in healthy outpatient children or consensus opinion. In a 2013 study by Bonafide et al.,[24] charted vital sign data from hospitalized children were used to develop percentile curves for HR and RR, and from these it was estimated that 54% of vital sign measurements in hospitalized children are out of range using currently accepted normal vital sign parameters.[24] Although these calculated vital sign parameters were not implemented clinically, they called into question reference ranges that are currently widely accepted and used as parameters for electronic health record (EHR) alerts, early warning scoring systems, and physiologic monitor alarms.
With the goal of safely decreasing the number of out‐of‐range vital sign measurements that result from current, often nonevidence‐based pediatric vital sign reference ranges, we used data from noncritically ill pediatric inpatients to derive HR and RR percentile charts for hospitalized children. In anticipation of local implementation of these data‐driven vital sign ranges as physiologic monitor parameters, we performed a retrospective safety analysis by evaluating the effect of data‐driven alarm limit modification on identification of cardiorespiratory arrests (CRA) and rapid response team (RRT) activations.
METHODS
We performed a cross‐sectional study of children less than 18 years of age hospitalized on general medical and surgical units at Lucile Packard Children's Hospital Stanford, a 311‐bed quaternary‐care academic hospital with a full complement of pediatric medical and surgical subspecialties and transplant programs. During the study period, the hospital used the Cerner EHR (Millennium; Cerner, Kansas City, MO) and Philips IntelliVue bedside monitors (Koninklijke Philips N.V., Amsterdam, the Netherlands). The Stanford University Institutional Review Board approved this study.
Establishing Data‐Driven HR and RR Parameters
Vital sign documentation in the EHR at our institution is performed primarily by nurses and facilitated by bedside monitor biomedical device integration. We extracted vital signs data from the institution's EHR for all general medical and surgical patients discharged between January 1, 2013 and May 3, 2014. To be most conservative in the definition of normal vital sign ranges for pediatric inpatients, we excluded critically ill children (those who spent any part of their hospitalization in an intensive care unit [ICU]). Physiologically implausible vital sign values were excluded as per the methods of Bonafide et al.[24] The data were separated into 2 different sets: a training set (patients discharged between January 1, 2013 and December 31, 2013) and a test set for validation (patients discharged between January 1, 2014 and May 3, 2014). To avoid oversampling from both particular time periods and individual patients in the training set, we randomly selected 1 HR and RR pair from each 4‐hour interval during a hospitalization, and then randomly sampled a maximum of 10 HR and RR pairs per patient. Using these vital sign measurements, we calculated age‐stratified 1st, 5th, 10th, 50th, 90th, 95th, and 99th percentiles for both HR and RR.
Based on a combination of expert opinion and local consensus from our Medical Executive and Patient Safety Committees, we selected the 5th and 95th percentile values as proposed data‐driven parameter limits and compared them to the 5th and 95th percentile values generated in the 2013 study[24] and to the 2004 National Institutes of Health (NIH)adapted vital sign reference ranges currently used at our hospital.[25] Using 1 randomly selected HR and RR pair from every 4‐hour interval in the validation set, we compared the proportion of out‐of‐range HR and RR observations with the proposed 5th and 95th percentile data‐driven parameters versus the current NIH reference ranges. We also calculated average differences between our data‐driven 5th and 95th percentile values and the calculated HR and RR values in the 2013 study.[24]
Safety Analysis
To assess the safety of the newly created 5th and 95th percentile HR and RR parameters prior to clinical adoption, we retrospectively reviewed data associated with all RRT and CRA events on the hospital's medical/surgical units from March 4, 2013 until March 3, 2014. The RRT/CRA event data were obtained from logs kept by the hospital's code committee. We excluded events that lacked a documented patient identifier, occurred in locations other than the acute medical/surgical units, or occurred in patients >18 years old. The resulting charts were manually reviewed to determine the date and time of RRT or CRA event activation. Because evidence exists that hospitalized pediatric patients with CRA show signs of vital sign decompensation as early as 12 hours prior to the event,[26, 27, 28, 29] we extracted all EHR‐charted HR and RR data in the 12 hours preceding RRT and CRA events from the institution's clinical data warehouse for analysis, excluding patients without charted vital sign data in this time period. The sets of patients with any out‐of‐range HR or RR measurements in the 12‐hours prior to an event were compared according to the current NIH reference ranges[25] versus data‐driven parameters. Additionally, manual chart review was performed to assess the reason for code or RRT activation, and to determine the role that out‐of‐range vital signs played in alerting clinical staff of patient decompensation.
Statistical Analysis
All analysis was performed using R statistical package software (version 0.98.1062 for Mac OS X 10_9_5; The R Foundation for Statistical Computing, Vienna, Austria) with an SQL database (MySQL 2015; Oracle Corp., Redwood City, CA).
RESULTS
Data‐Driven HR and RR Parameters
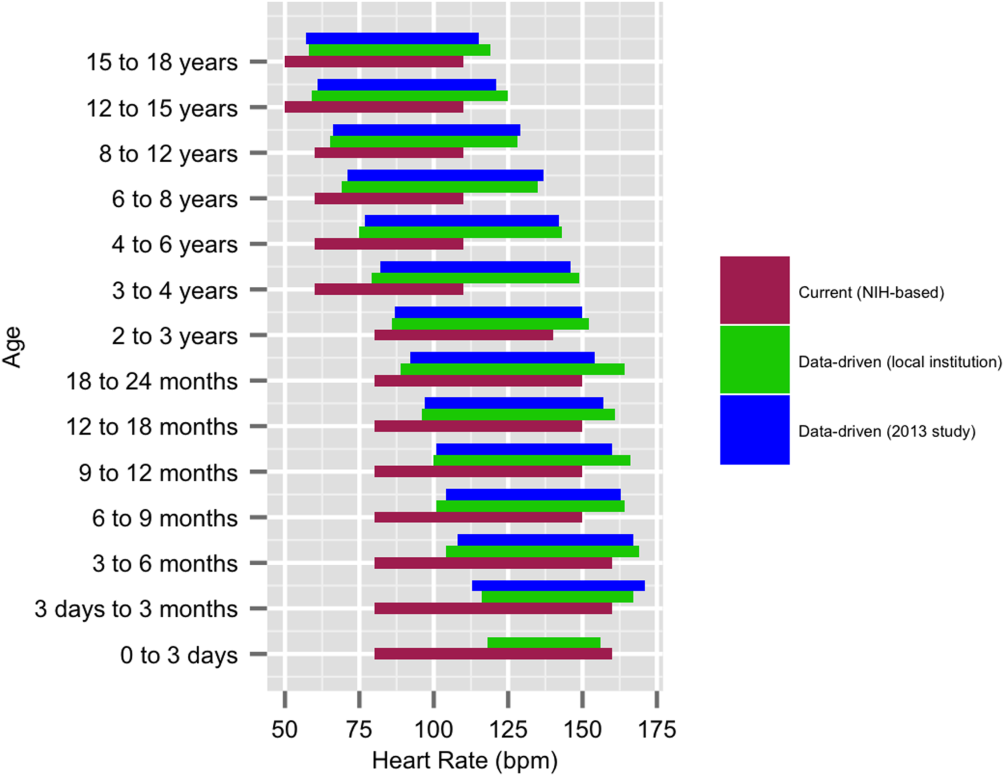
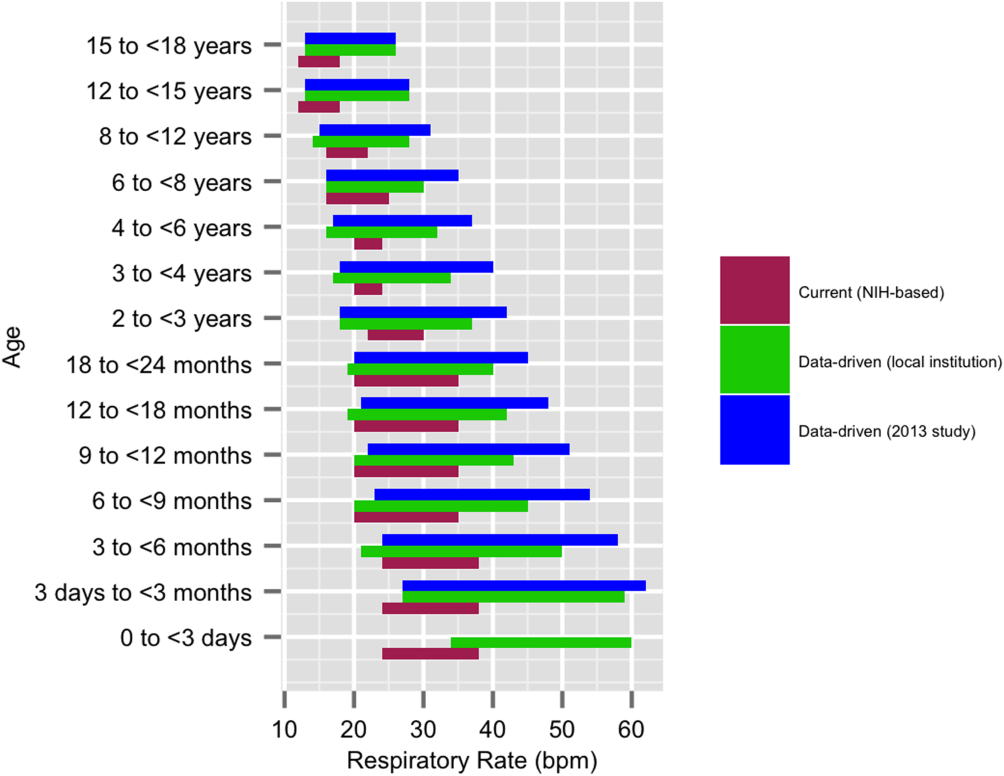
We established a training set of 62,508 vital sign measurements for 7202 unique patients to calculate 1st, 5th, 10th, 50th, 90th, 95th, and 99th percentiles for HR and RR among the 14 age groups (see Supporting Information, Appendix 1, in the online version of this article). Figures 1 and 2 compare the proposed data‐driven vital sign ranges with (1) our current HR and RR reference ranges and (2) the 5th and 95th percentile values created in the similar 2013 study.[24] The greatest difference between our study and the 2013 study was across data‐driven 95th percentile RR parameters, which were an average of 4.8 points lower in our study.

Our validation set consisted of 82,993 vital sign measurements for 2287 unique patients. Application of data‐driven HR and RR 5th and 95th percentile limits resulted in 24,045 (55.6%) fewer out‐of‐range measurements compared to current NIH reference ranges (19,240 vs 43,285). Forty‐five percent fewer HR values and 61% fewer RR values were considered out of range using the proposed data‐driven parameters (see Supporting Information, Appendix 2, in the online version of this article).
Safety
Of the 218 unique out‐of‐ICU RRT and CRA events logged from March 4, 2013 to March 3, 2014, 63 patients were excluded from analysis: 10 lacked identifying information, 33 occurred outside of medical/surgical units, and 20 occurred in patients >18 years of age. The remaining 155 patient charts were reviewed. Seven patients were subsequently excluded because they lacked EHR‐documented vital signs data in the 12 hours prior to RRT or CRA team activation, yielding a cohort of 148 patients (128 RRT events, 20 CRA events).
Table 1 describes the analysis of vital signs in the 12 hours leading up to the 148 RRT and CRA events. All 121 patients with out‐of‐range HR values using NIH reference ranges also had out‐of‐range HR values with the proposed data‐driven parameters; an additional 8 patients had low HR values using the data‐driven parameters. Of the 137 patients with an out‐of‐range RR value using NIH reference ranges, 33 (24.1%) were not considered out of range by the data‐driven parameters. Of these, 28 had high RR and 5 had low RR according to NIH reference ranges.
| No. Patients With HR Out of Range* | No. Patients With RR Out of Range* | No. Patients With HR or RR Out of Range* | |
|---|---|---|---|
| |||
| NIH ranges | 121 | 137 | 144 |
| Data‐driven ranges | 129 | 104 | 138 |
| Difference (causal threshold) | +8 (low HR) | 28 (high RR), 5 (low RR) | +2 (low HR), 8 (high RR) |
After evaluating out‐of‐range HR and RR individually, the 148 RRT and CRA events were analyzed for either out‐of‐range HR values or RR values. In doing so, 144 (97.3%) patients had either HR or RR measurements that were considered out of range using our current NIH reference ranges. One hundred thirty‐eight (93.2%) had either HR or RR measurements that were considered out of range with the proposed parameters. One hundred thirty‐six (94.4%) of the 144 patients with out‐of‐range HR or RR measurements according to NIH reference ranges were also considered out of range using proposed parameters. The data‐driven parameters identified 2 additional patients with low HR who did not have out‐of‐range HR or RR values using the current NIH reference ranges. Manual chart review of the RRT/CRA events in the 8 patients who had normal HR or RR using the data‐driven parameters revealed that RRT or CRA team interventions occurred for clinical indications that did not rely upon HR or RR measurement (eg, laboratory testing abnormalities, desaturation events) (Table 2).
| Indication for event | Patient Age |
|---|---|
| |
| 1. Desaturation and apnea | 10 months |
| 2. Hyperammonemia (abnormal lab result) | 5 years |
| 3. Acute hematemesis | 16 years |
| 4. Lightheadedness, feeling faint | 17 years |
| 5. Desaturation with significant oxygen requirement | 17 years |
| 6. Desaturation with significant oxygen requirement | 17 years |
| 7. Patient stated difficulty breathing | 18 years |
| 8. Difficulty breathing (anaphylactic shock)* | 18 years |
DISCUSSION
This is the first published study to analyze the safety of implementing data‐driven HR and RR parameters in hospitalized children. Based on retrospective analysis of a 12‐month cohort of patients requiring RRT or CRA team activation, our data‐driven HR and RR parameters were at least as safe as the NIH‐published reference ranges employed at our children's hospital. In addition to maintaining sensitivity to RRT and CRA events, the data‐driven parameters resulted in an estimated 55.6% fewer out‐of‐range measurements among medical/surgical pediatric inpatients.
Improper alarm settings are 1 of 4 major contributing factors to reported alarm‐related events,[1] and data‐driven HR and RR parameters provide a means by which to address the Joint Commission Sentinel Event Alert[1] and National Patient Safety Goal[3] regarding alarm management safety for hospitalized pediatric patients. Our results suggest that this evidence‐based approach may reduce the frequency of false alarms (thereby mitigating alarm fatigue), and should be studied prospectively for implementation in the clinical setting.
The selection of percentile values to define the new data‐driven parameter ranges involved various considerations. In an effort to minimize alarm fatigue, we considered using the 1st and 99th percentile values. However, our Medical Executive and Patient Safety Committees determined that the 99th percentile values for HR and RR for many of the age groups exceeded those that would raise clinical concern. A more conservative approach, applying the 5th and 95th percentile values, was deemed clinically appropriate and consistent with recommendations from the only other study to calculate data‐driven HR and RR parameters for hospitalized children.[24]
When taken in total, Bonafide et al.'s 2013 study demonstrated that up to 54% of vital sign values were abnormal according to textbook reference ranges.[24] Similarly, we estimated 55.6% fewer out‐of‐range HR and RR measurements with our data‐driven parameters. Although our 5th and 95th HR percentile and 5th percentile RR values are strikingly similar to those developed in the 2013 study,[24] the difference in 95th percentile RR values between the studies was potentially clinically significant, with our data‐driven upper RR values being 4.8 breaths per minute lower (more conservative) on average. Bonafide et al. transformed the RR values to fit a normal distribution, which might account for this difference. Ultimately, our safety analysis demonstrated that 24% fewer patients were considered out of range for high RR prior to RRT/CRA events with the data‐driven parameters compared to NIH norms. Even fewer RRT/CRA patients would have been considered out of range per Bonafide's less conservative 95% RR limits.
Importantly, all 8 patients in our safety analysis without abnormal vital sign measurements in the 12 hours preceding their clinical events according to the proposed data‐driven parameters (but identified as having high RR per current reference ranges) had RRT or CRA events triggered due to other significant clinical manifestations or vital sign abnormalities (eg, hypoxia). This finding is supported by the literature, which suggests that RRTs are rarely activated due to single vital sign abnormality alone. Prior analysis of RRT activations in our pediatric hospital demonstrated that only approximately 10% of RRTs were activated primarily on the basis of HR or RR vital sign abnormalities (5.6% tachycardia, 2.8% tachypnea, 1.4% bradycardia), whereas 36% were activated due to respiratory distress.[30] The clinical relevance of high RR in isolation is questionable given a recent pediatric study that raised all RR limits and decreased alarm frequency without adverse patient safety consequences.[31] Our results suggest that modifying HR and RR alarm parameters using data‐driven 5th and 95th percentile limits to decrease alarm frequency does not pose additional safety risk related to identification of RRT and CRA events. We encourage continued work toward development of multivariate or smart alarms that analyze multiple simultaneous vital sign measurements and trends to determine whether an alarm should be triggered.[32, 33]
The ability to demonstrate the safety of data‐driven HR and RR parameters is a precursor to hospital‐wide implementation. We believe it is crucial to perform a safety analysis prior to implementation due to the role vital signs play in clinical assessment and detection of patient deterioration.[30, 34, 35, 36, 37] Though a few studies have shown that modification of alarm parameters decreases alarm frequency,[5, 6, 10, 16, 17] to our knowledge no formal safety evaluations have ever been published. This study provides the first published safety evaluation of data‐driven HR and RR parameters.
By decreasing the quantity of out‐of‐range vital sign values while preserving the ability to detect patient deterioration, data‐driven vital sign alarm limits have the potential to decrease false monitor alarms, alarm‐generated noise, and alarm fatigue. Future work includes prospectively studying the impact of adoption of data‐driven vital sign parameters on monitor alarm burden and monitoring the safety of the changes. Additional safety analysis could include comparing the sensitivity and specificity of early warning score systems when data‐driven vital sign ranges are substituted for traditional physiologic parameters. Further personalization of vital sign parameters will involve incorporating patient‐specific characteristics (eg, demographics, diagnoses) into the data‐driven analysis to further decrease alarm burden while enhancing patient safety. Ultimately, using a patient's own physiologic data to define highly personalized vital sign parameter limits represents a truly precision approach, and could revolutionize the way hospitalized patients are monitored.
Numerous relevant issues are not yet addressed in this initial, single‐institution study. First, although the biomedical device integration facilitated the direct import of monitor data into the EHR (decreasing transcription errors), our analysis was performed using EHR‐charted data. As such, the effect on bedside monitor alarms was not directly evaluated in our study, including those due to technical alarms or patient artifact. Second, our overall sample size for the training set was quite large; however, in some cases the number of patients per age category was limited. Third, although we evaluated the identification of severe deterioration leading to RRT or CRA events, the sensitivity of the new limits to the need for other interventions (eg, fluid bolus for dehydration or escalation of respiratory support for asthma exacerbation) or unplanned transfers to the ICU was not assessed. Fourth, the analysis was retrospective, and so the impact of data‐driven alarm limits on length of stay and readmission could not be defined. Fifth, excluding all vital sign measurements from patients who spent any time in the ICU setting decreased the amount of data available for analysis. However, excluding sicker patients probably resulted in narrower data‐driven HR and RR ranges, leading to more conservative proposed parameters that are more likely to identify patient decompensation in our safety analysis. Finally, this was a single‐site study. We believe our data‐driven limits are applicable to other tertiary or quaternary care facilities given the similarity to those generated in a study performed in a comparable setting,[24] but generalizability to other settings may be limited if the local population is sufficiently different. Furthermore, because institutional policies (eg, indications for care escalation) differ, individual institutions should determine whether our analysis is applicable to their setting or if local safety evaluation is necessary.
CONCLUSION
A large proportion of HR and RR values for hospitalized children at our institution are out of range according to current vital sign reference ranges. Our new data‐driven alarm parameters for hospitalized children provide a potentially safe means by which to modify physiologic bedside monitor alarm limits, a first step toward customization of alarm limit settings in an effort to mitigate alarm fatigue.
Acknowledgements
The authors thank Debby Huang and Joshua Glandorf in the Information Services Department at Stanford Children's Health for assistance with data acquisition. No compensation was received for their contributions.
Disclosures: All authors gave approval of the final manuscript version submitted for publication and agreed to be accountable for all aspects of the work. Dr. Veena V. Goel conceptualized and designed the study; collected, managed, analyzed and interpreted the data; prepared and reviewed the initial manuscript; and approved the final manuscript as submitted. Ms. Sarah F. Poole contributed to the design of the study and performed the primary data analysis for the study. Ms. Poole critically revised the manuscript for important intellectual content and approved the final manuscript as submitted. Dr. Goel and Ms. Poole had full access to all of the data in the study and take responsibility for the integrity of the data and the accuracy of the data analysis. Dr. Paul J. Sharek and Dr. Jonathan P. Palma contributed to the study design and data interpretation. Drs. Sharek and Palma critically revised the manuscript for important intellectual content and approved the final manuscript as submitted. Dr. Terry S. Platchek, Dr. Natalie M. Pageler, and Dr. Christopher A. Longhurst contributed to the study design. Drs. Platchek, Pageler, and Longhurst critically revised the manuscript for important intellectual content and approved the final manuscript as submitted. Ms. Poole is supported by the Stanford Biosciences Graduate Program through a Fulbright New Zealand Science and Innovation Graduate Award and through the J.R. Templin Trust Scholarship. The authors report no conflicts of interest.
- The Joint Commission. Medical device alarm safety in hospitals. Sentinel Event Alert. 2013;(50):1–3. Available at: https://www.jointcommission.org/sea_issue_50/. Accessed October 12, 2013.
- . “Alarm fatigue” a factor in 2d death: UMass hospital cited for violations. The Boston Globe. September 21, 2011. Available at: https://www.bostonglobe.com/2011/09/20/umass/qSOhm8dYmmaq4uTHZb7FNM/story.html. Accessed December 19, 2014
- The Joint Commission. Alarm system safety. Available at: https://www.jointcommission.org/assets/1/18/R3_Report_Issue_5_12_2_13_Final.pdf. Published December 11, 2013. Accessed October 12, 2013.
- , , , , . ALARMED: adverse events in low‐risk patients with chest pain receiving continuous electrocardiographic monitoring in the emergency department. A pilot study. Am J Emerg Med. 2006;24(1):62–67.
- , . Monitor alarm fatigue: standardizing use of physiological monitors and decreasing nuisance alarms. Am J Crit Care. 2010;19(1):28–34; quiz 35.
- , , . Physiologic monitoring alarm load on medical/surgical floors of a community hospital. Biomed Instrum Technol. 2011;(suppl):29–36.
- , , , , , . Multicentric study of monitoring alarms in the adult intensive care unit (ICU): a descriptive analysis. Intensive Care Med. 1999;25(12):1360–1366.
- . Crying wolf: false alarms in a pediatric intensive care unit. Crit Care Med. 1994;22(6):981–985.
- , , , et al. Cardiopulmonary monitors and clinically significant events in critically ill children. Biomed Instrum Technol. 2011;(suppl):38–45.
- , , , et al. Systematic review of physiologic monitor alarm characteristics and pragmatic interventions to reduce alarm frequency. J Hosp Med. 2016;11(2):136–144.
- . Alarm fatigue. Nurs Clin North Am. 2012;47(3):375–382.
- . Monitor alarm fatigue: an integrative review. Biomed Instrum Technol. 2012;46(4):268–277.
- , , , . Use of pagers with an alarm escalation system to reduce cardiac monitor alarm signals. J Nurs Care Qual. 2014;29(1):9–18.
- . An evidence‐based approach to reduce nuisance alarms and alarm fatigue. Biomed Instrum Technol. 2011;(suppl):46–52.
- , , , et al. Insights into the problem of alarm fatigue with physiologic monitor devices: a comprehensive observational study of consecutive intensive care unit patients. PLoS One. 2014;9(10):e110274.
- , , , , , . Effect of altering alarm settings: a randomized controlled study. Biomed Instrum Technol. 2015;49(3):214–222.
- , , , , . Alarm limit settings for early warning systems to identify at‐risk patients. J Adv Nurs. 2009;65(9):1844–1852.
- , . A framework for reducing alarm fatigue on pediatric inpatient units. Hosp Pediatr. 2015;5(3):160–163.
- , , , et al. Association between exposure to nonactionable physiologic monitor alarms and response time in a children's hospital. J Hosp Med. 2015;10(6):345–351.
- The Johns Hopkins Hospital, , . The Harriet Lane Handbook. 20th ed. Philadelphia, PA: Elsevier Saunders; 2014.
- , . Nelson Textbook of Pediatrics. 19th ed. Philadelphia, PA.: Elsevier Saunders; 2011.
- , , , . Pediatric assessment. In: Pediatric Advanced Life Support: Provider Manual. Dallas, TX: American Heart Association; 2006:9–16.
- , , , et al. Normal ranges of heart rate and respiratory rate in children from birth to 18 years of age: a systematic review of observational studies. Lancet. 2011;377(9770):1011–1018.
- , , , , , . Development of heart and respiratory rate percentile curves for hospitalized children. Pediatrics. 2013;131(4):e1150–e1157.
- National Institutes of Health. Age‐appropriate vital signs. Available at: https://web.archive.org/web/20041101222327/http://www.cc.nih.gov/ccc/pedweb/pedsstaff/age.html. Accessed July 26, 2015.
- Guidelines 2000 for cardiopulmonary resuscitation and emergency cardiovascular care. Part 9: pediatric basic life support. The American Heart Association in collaboration with the International Liaison Committee on Resuscitation. Circulation. 2000;102(8 suppl):I253–I290.
- , , , , , . Recognising clinical instability in hospital patients before cardiac arrest or unplanned admission to intensive care. A pilot study in a tertiary‐care hospital. Med J Aust. 1999;171(1):22–25.
- , , , et al. Duration of life‐threatening antecedents prior to intensive care admission. Intensive Care Med. 2002;28(11):1629–1634.
- , . Pediatric cardiopulmonary resuscitation: a collective review. Ann Emerg Med. 1999;33(2):195–205.
- , , , et al. Effect of a rapid response team on hospital‐wide mortality and code rates outside the ICU in a Children's Hospital. JAMA. 2007;298(19):2267–2274.
- , , , et al. A team‐based approach to reducing cardiac monitor alarms. Pediatrics. 2014;134(6):e1686–e1694.
- , , , et al. Collection of annotated data in a clinical validation study for alarm algorithms in intensive care—a methodologic framework. J Crit Care. 2010;25(1):128–135.
- , , . Making ICU alarms meaningful: a comparison of traditional vs. trend‐based algorithms. Proc AMIA Symp. 1999:379–383.
- , , , et al. Implementation of a medical emergency team in a large pediatric teaching hospital prevents respiratory and cardiopulmonary arrests outside the intensive care unit. Pediatr Crit Care Med. 2007;8(3):236–246; quiz 247.
- . Centile‐based Early Warning Scores derived from statistical distributions of vital signs. Resuscitation. 2011;82(8):969–970.
- , , , , , . Centile‐based early warning scores derived from statistical distributions of vital signs. Resuscitation. 2011;82(8):1013–1018.
- , , , , . Reduction of paediatric in‐patient cardiac arrest and death with a medical emergency team: preliminary results. Arch Dis Child. 2005;90(11):1148–1152.
The management of alarms in the hospital setting is a significant patient safety issue. In 2013, the Joint Commission issued Sentinel Event Alert #50 to draw attention to the fact that tens of thousands of alarms occur daily throughout individual hospitals, and 85% to 99% are false or not clinically actionable.[1] These alarms, designed to be a safety net in patient care, have the unintended consequence of causing provider desensitization, also known as alarm fatigue, which contributes to adverse events as severe as patient mortality.[1, 2] For this reason, a 2014 Joint Commission National Patient Safety Goal urged hospitals to prioritize alarm system safety and to develop policies and procedures to manage alarms and alarm fatigue.[3]
Multiple efforts have been made to address alarm fatigue in hospitalized adults. Studies have quantified the frequency and types of medical device alarms,[4, 5, 6, 7, 8, 9] and some proposed solutions to decrease excess alarms.[10, 11, 12, 13, 14, 15] One such solution is to change alarm limit settings, an intervention shown to be efficacious in the literature.[5, 6, 16, 17] Although no adverse patient outcomes are reported in these studies, none of them included a formal safety evaluation to evaluate whether alarm rate reduction occurred at the expense of clinically significant alarms.
Specific to pediatrics, frameworks to address alarm fatigue have been proposed,[18] and the relationship between nurse response time and frequency of exposure to nonactionable alarms has been reported.[19] However, efforts to address alarm fatigue in the pediatric setting are less well studied overall, and there is little guidance regarding optimization of pediatric alarm parameters. Although multiple established reference ranges exist for pediatric vital signs,[20, 21, 22] a systematic review in 2011 found that only 2 of 5 published heart rate (HR) and 6 respiratory rate (RR) guidelines cited any references, and even these had weak underpinning evidence.[23] Consequently, ranges defining normal pediatric vital signs are derived either from small sample observational data in healthy outpatient children or consensus opinion. In a 2013 study by Bonafide et al.,[24] charted vital sign data from hospitalized children were used to develop percentile curves for HR and RR, and from these it was estimated that 54% of vital sign measurements in hospitalized children are out of range using currently accepted normal vital sign parameters.[24] Although these calculated vital sign parameters were not implemented clinically, they called into question reference ranges that are currently widely accepted and used as parameters for electronic health record (EHR) alerts, early warning scoring systems, and physiologic monitor alarms.
With the goal of safely decreasing the number of out‐of‐range vital sign measurements that result from current, often nonevidence‐based pediatric vital sign reference ranges, we used data from noncritically ill pediatric inpatients to derive HR and RR percentile charts for hospitalized children. In anticipation of local implementation of these data‐driven vital sign ranges as physiologic monitor parameters, we performed a retrospective safety analysis by evaluating the effect of data‐driven alarm limit modification on identification of cardiorespiratory arrests (CRA) and rapid response team (RRT) activations.
METHODS
We performed a cross‐sectional study of children less than 18 years of age hospitalized on general medical and surgical units at Lucile Packard Children's Hospital Stanford, a 311‐bed quaternary‐care academic hospital with a full complement of pediatric medical and surgical subspecialties and transplant programs. During the study period, the hospital used the Cerner EHR (Millennium; Cerner, Kansas City, MO) and Philips IntelliVue bedside monitors (Koninklijke Philips N.V., Amsterdam, the Netherlands). The Stanford University Institutional Review Board approved this study.
Establishing Data‐Driven HR and RR Parameters
Vital sign documentation in the EHR at our institution is performed primarily by nurses and facilitated by bedside monitor biomedical device integration. We extracted vital signs data from the institution's EHR for all general medical and surgical patients discharged between January 1, 2013 and May 3, 2014. To be most conservative in the definition of normal vital sign ranges for pediatric inpatients, we excluded critically ill children (those who spent any part of their hospitalization in an intensive care unit [ICU]). Physiologically implausible vital sign values were excluded as per the methods of Bonafide et al.[24] The data were separated into 2 different sets: a training set (patients discharged between January 1, 2013 and December 31, 2013) and a test set for validation (patients discharged between January 1, 2014 and May 3, 2014). To avoid oversampling from both particular time periods and individual patients in the training set, we randomly selected 1 HR and RR pair from each 4‐hour interval during a hospitalization, and then randomly sampled a maximum of 10 HR and RR pairs per patient. Using these vital sign measurements, we calculated age‐stratified 1st, 5th, 10th, 50th, 90th, 95th, and 99th percentiles for both HR and RR.
Based on a combination of expert opinion and local consensus from our Medical Executive and Patient Safety Committees, we selected the 5th and 95th percentile values as proposed data‐driven parameter limits and compared them to the 5th and 95th percentile values generated in the 2013 study[24] and to the 2004 National Institutes of Health (NIH)adapted vital sign reference ranges currently used at our hospital.[25] Using 1 randomly selected HR and RR pair from every 4‐hour interval in the validation set, we compared the proportion of out‐of‐range HR and RR observations with the proposed 5th and 95th percentile data‐driven parameters versus the current NIH reference ranges. We also calculated average differences between our data‐driven 5th and 95th percentile values and the calculated HR and RR values in the 2013 study.[24]
Safety Analysis
To assess the safety of the newly created 5th and 95th percentile HR and RR parameters prior to clinical adoption, we retrospectively reviewed data associated with all RRT and CRA events on the hospital's medical/surgical units from March 4, 2013 until March 3, 2014. The RRT/CRA event data were obtained from logs kept by the hospital's code committee. We excluded events that lacked a documented patient identifier, occurred in locations other than the acute medical/surgical units, or occurred in patients >18 years old. The resulting charts were manually reviewed to determine the date and time of RRT or CRA event activation. Because evidence exists that hospitalized pediatric patients with CRA show signs of vital sign decompensation as early as 12 hours prior to the event,[26, 27, 28, 29] we extracted all EHR‐charted HR and RR data in the 12 hours preceding RRT and CRA events from the institution's clinical data warehouse for analysis, excluding patients without charted vital sign data in this time period. The sets of patients with any out‐of‐range HR or RR measurements in the 12‐hours prior to an event were compared according to the current NIH reference ranges[25] versus data‐driven parameters. Additionally, manual chart review was performed to assess the reason for code or RRT activation, and to determine the role that out‐of‐range vital signs played in alerting clinical staff of patient decompensation.
Statistical Analysis
All analysis was performed using R statistical package software (version 0.98.1062 for Mac OS X 10_9_5; The R Foundation for Statistical Computing, Vienna, Austria) with an SQL database (MySQL 2015; Oracle Corp., Redwood City, CA).
RESULTS
Data‐Driven HR and RR Parameters
We established a training set of 62,508 vital sign measurements for 7202 unique patients to calculate 1st, 5th, 10th, 50th, 90th, 95th, and 99th percentiles for HR and RR among the 14 age groups (see Supporting Information, Appendix 1, in the online version of this article). Figures 1 and 2 compare the proposed data‐driven vital sign ranges with (1) our current HR and RR reference ranges and (2) the 5th and 95th percentile values created in the similar 2013 study.[24] The greatest difference between our study and the 2013 study was across data‐driven 95th percentile RR parameters, which were an average of 4.8 points lower in our study.
Our validation set consisted of 82,993 vital sign measurements for 2287 unique patients. Application of data‐driven HR and RR 5th and 95th percentile limits resulted in 24,045 (55.6%) fewer out‐of‐range measurements compared to current NIH reference ranges (19,240 vs 43,285). Forty‐five percent fewer HR values and 61% fewer RR values were considered out of range using the proposed data‐driven parameters (see Supporting Information, Appendix 2, in the online version of this article).
Safety
Of the 218 unique out‐of‐ICU RRT and CRA events logged from March 4, 2013 to March 3, 2014, 63 patients were excluded from analysis: 10 lacked identifying information, 33 occurred outside of medical/surgical units, and 20 occurred in patients >18 years of age. The remaining 155 patient charts were reviewed. Seven patients were subsequently excluded because they lacked EHR‐documented vital signs data in the 12 hours prior to RRT or CRA team activation, yielding a cohort of 148 patients (128 RRT events, 20 CRA events).
Table 1 describes the analysis of vital signs in the 12 hours leading up to the 148 RRT and CRA events. All 121 patients with out‐of‐range HR values using NIH reference ranges also had out‐of‐range HR values with the proposed data‐driven parameters; an additional 8 patients had low HR values using the data‐driven parameters. Of the 137 patients with an out‐of‐range RR value using NIH reference ranges, 33 (24.1%) were not considered out of range by the data‐driven parameters. Of these, 28 had high RR and 5 had low RR according to NIH reference ranges.
| No. Patients With HR Out of Range* | No. Patients With RR Out of Range* | No. Patients With HR or RR Out of Range* | |
|---|---|---|---|
| |||
| NIH ranges | 121 | 137 | 144 |
| Data‐driven ranges | 129 | 104 | 138 |
| Difference (causal threshold) | +8 (low HR) | 28 (high RR), 5 (low RR) | +2 (low HR), 8 (high RR) |
After evaluating out‐of‐range HR and RR individually, the 148 RRT and CRA events were analyzed for either out‐of‐range HR values or RR values. In doing so, 144 (97.3%) patients had either HR or RR measurements that were considered out of range using our current NIH reference ranges. One hundred thirty‐eight (93.2%) had either HR or RR measurements that were considered out of range with the proposed parameters. One hundred thirty‐six (94.4%) of the 144 patients with out‐of‐range HR or RR measurements according to NIH reference ranges were also considered out of range using proposed parameters. The data‐driven parameters identified 2 additional patients with low HR who did not have out‐of‐range HR or RR values using the current NIH reference ranges. Manual chart review of the RRT/CRA events in the 8 patients who had normal HR or RR using the data‐driven parameters revealed that RRT or CRA team interventions occurred for clinical indications that did not rely upon HR or RR measurement (eg, laboratory testing abnormalities, desaturation events) (Table 2).
| Indication for event | Patient Age |
|---|---|
| |
| 1. Desaturation and apnea | 10 months |
| 2. Hyperammonemia (abnormal lab result) | 5 years |
| 3. Acute hematemesis | 16 years |
| 4. Lightheadedness, feeling faint | 17 years |
| 5. Desaturation with significant oxygen requirement | 17 years |
| 6. Desaturation with significant oxygen requirement | 17 years |
| 7. Patient stated difficulty breathing | 18 years |
| 8. Difficulty breathing (anaphylactic shock)* | 18 years |
DISCUSSION
This is the first published study to analyze the safety of implementing data‐driven HR and RR parameters in hospitalized children. Based on retrospective analysis of a 12‐month cohort of patients requiring RRT or CRA team activation, our data‐driven HR and RR parameters were at least as safe as the NIH‐published reference ranges employed at our children's hospital. In addition to maintaining sensitivity to RRT and CRA events, the data‐driven parameters resulted in an estimated 55.6% fewer out‐of‐range measurements among medical/surgical pediatric inpatients.
Improper alarm settings are 1 of 4 major contributing factors to reported alarm‐related events,[1] and data‐driven HR and RR parameters provide a means by which to address the Joint Commission Sentinel Event Alert[1] and National Patient Safety Goal[3] regarding alarm management safety for hospitalized pediatric patients. Our results suggest that this evidence‐based approach may reduce the frequency of false alarms (thereby mitigating alarm fatigue), and should be studied prospectively for implementation in the clinical setting.
The selection of percentile values to define the new data‐driven parameter ranges involved various considerations. In an effort to minimize alarm fatigue, we considered using the 1st and 99th percentile values. However, our Medical Executive and Patient Safety Committees determined that the 99th percentile values for HR and RR for many of the age groups exceeded those that would raise clinical concern. A more conservative approach, applying the 5th and 95th percentile values, was deemed clinically appropriate and consistent with recommendations from the only other study to calculate data‐driven HR and RR parameters for hospitalized children.[24]
When taken in total, Bonafide et al.'s 2013 study demonstrated that up to 54% of vital sign values were abnormal according to textbook reference ranges.[24] Similarly, we estimated 55.6% fewer out‐of‐range HR and RR measurements with our data‐driven parameters. Although our 5th and 95th HR percentile and 5th percentile RR values are strikingly similar to those developed in the 2013 study,[24] the difference in 95th percentile RR values between the studies was potentially clinically significant, with our data‐driven upper RR values being 4.8 breaths per minute lower (more conservative) on average. Bonafide et al. transformed the RR values to fit a normal distribution, which might account for this difference. Ultimately, our safety analysis demonstrated that 24% fewer patients were considered out of range for high RR prior to RRT/CRA events with the data‐driven parameters compared to NIH norms. Even fewer RRT/CRA patients would have been considered out of range per Bonafide's less conservative 95% RR limits.
Importantly, all 8 patients in our safety analysis without abnormal vital sign measurements in the 12 hours preceding their clinical events according to the proposed data‐driven parameters (but identified as having high RR per current reference ranges) had RRT or CRA events triggered due to other significant clinical manifestations or vital sign abnormalities (eg, hypoxia). This finding is supported by the literature, which suggests that RRTs are rarely activated due to single vital sign abnormality alone. Prior analysis of RRT activations in our pediatric hospital demonstrated that only approximately 10% of RRTs were activated primarily on the basis of HR or RR vital sign abnormalities (5.6% tachycardia, 2.8% tachypnea, 1.4% bradycardia), whereas 36% were activated due to respiratory distress.[30] The clinical relevance of high RR in isolation is questionable given a recent pediatric study that raised all RR limits and decreased alarm frequency without adverse patient safety consequences.[31] Our results suggest that modifying HR and RR alarm parameters using data‐driven 5th and 95th percentile limits to decrease alarm frequency does not pose additional safety risk related to identification of RRT and CRA events. We encourage continued work toward development of multivariate or smart alarms that analyze multiple simultaneous vital sign measurements and trends to determine whether an alarm should be triggered.[32, 33]
The ability to demonstrate the safety of data‐driven HR and RR parameters is a precursor to hospital‐wide implementation. We believe it is crucial to perform a safety analysis prior to implementation due to the role vital signs play in clinical assessment and detection of patient deterioration.[30, 34, 35, 36, 37] Though a few studies have shown that modification of alarm parameters decreases alarm frequency,[5, 6, 10, 16, 17] to our knowledge no formal safety evaluations have ever been published. This study provides the first published safety evaluation of data‐driven HR and RR parameters.
By decreasing the quantity of out‐of‐range vital sign values while preserving the ability to detect patient deterioration, data‐driven vital sign alarm limits have the potential to decrease false monitor alarms, alarm‐generated noise, and alarm fatigue. Future work includes prospectively studying the impact of adoption of data‐driven vital sign parameters on monitor alarm burden and monitoring the safety of the changes. Additional safety analysis could include comparing the sensitivity and specificity of early warning score systems when data‐driven vital sign ranges are substituted for traditional physiologic parameters. Further personalization of vital sign parameters will involve incorporating patient‐specific characteristics (eg, demographics, diagnoses) into the data‐driven analysis to further decrease alarm burden while enhancing patient safety. Ultimately, using a patient's own physiologic data to define highly personalized vital sign parameter limits represents a truly precision approach, and could revolutionize the way hospitalized patients are monitored.
Numerous relevant issues are not yet addressed in this initial, single‐institution study. First, although the biomedical device integration facilitated the direct import of monitor data into the EHR (decreasing transcription errors), our analysis was performed using EHR‐charted data. As such, the effect on bedside monitor alarms was not directly evaluated in our study, including those due to technical alarms or patient artifact. Second, our overall sample size for the training set was quite large; however, in some cases the number of patients per age category was limited. Third, although we evaluated the identification of severe deterioration leading to RRT or CRA events, the sensitivity of the new limits to the need for other interventions (eg, fluid bolus for dehydration or escalation of respiratory support for asthma exacerbation) or unplanned transfers to the ICU was not assessed. Fourth, the analysis was retrospective, and so the impact of data‐driven alarm limits on length of stay and readmission could not be defined. Fifth, excluding all vital sign measurements from patients who spent any time in the ICU setting decreased the amount of data available for analysis. However, excluding sicker patients probably resulted in narrower data‐driven HR and RR ranges, leading to more conservative proposed parameters that are more likely to identify patient decompensation in our safety analysis. Finally, this was a single‐site study. We believe our data‐driven limits are applicable to other tertiary or quaternary care facilities given the similarity to those generated in a study performed in a comparable setting,[24] but generalizability to other settings may be limited if the local population is sufficiently different. Furthermore, because institutional policies (eg, indications for care escalation) differ, individual institutions should determine whether our analysis is applicable to their setting or if local safety evaluation is necessary.
CONCLUSION
A large proportion of HR and RR values for hospitalized children at our institution are out of range according to current vital sign reference ranges. Our new data‐driven alarm parameters for hospitalized children provide a potentially safe means by which to modify physiologic bedside monitor alarm limits, a first step toward customization of alarm limit settings in an effort to mitigate alarm fatigue.
Acknowledgements
The authors thank Debby Huang and Joshua Glandorf in the Information Services Department at Stanford Children's Health for assistance with data acquisition. No compensation was received for their contributions.
Disclosures: All authors gave approval of the final manuscript version submitted for publication and agreed to be accountable for all aspects of the work. Dr. Veena V. Goel conceptualized and designed the study; collected, managed, analyzed and interpreted the data; prepared and reviewed the initial manuscript; and approved the final manuscript as submitted. Ms. Sarah F. Poole contributed to the design of the study and performed the primary data analysis for the study. Ms. Poole critically revised the manuscript for important intellectual content and approved the final manuscript as submitted. Dr. Goel and Ms. Poole had full access to all of the data in the study and take responsibility for the integrity of the data and the accuracy of the data analysis. Dr. Paul J. Sharek and Dr. Jonathan P. Palma contributed to the study design and data interpretation. Drs. Sharek and Palma critically revised the manuscript for important intellectual content and approved the final manuscript as submitted. Dr. Terry S. Platchek, Dr. Natalie M. Pageler, and Dr. Christopher A. Longhurst contributed to the study design. Drs. Platchek, Pageler, and Longhurst critically revised the manuscript for important intellectual content and approved the final manuscript as submitted. Ms. Poole is supported by the Stanford Biosciences Graduate Program through a Fulbright New Zealand Science and Innovation Graduate Award and through the J.R. Templin Trust Scholarship. The authors report no conflicts of interest.
- The Joint Commission. Medical device alarm safety in hospitals. Sentinel Event Alert. 2013;(50):1–3. Available at: https://www.jointcommission.org/sea_issue_50/. Accessed October 12, 2013.
- . “Alarm fatigue” a factor in 2d death: UMass hospital cited for violations. The Boston Globe. September 21, 2011. Available at: https://www.bostonglobe.com/2011/09/20/umass/qSOhm8dYmmaq4uTHZb7FNM/story.html. Accessed December 19, 2014
- The Joint Commission. Alarm system safety. Available at: https://www.jointcommission.org/assets/1/18/R3_Report_Issue_5_12_2_13_Final.pdf. Published December 11, 2013. Accessed October 12, 2013.
- , , , , . ALARMED: adverse events in low‐risk patients with chest pain receiving continuous electrocardiographic monitoring in the emergency department. A pilot study. Am J Emerg Med. 2006;24(1):62–67.
- , . Monitor alarm fatigue: standardizing use of physiological monitors and decreasing nuisance alarms. Am J Crit Care. 2010;19(1):28–34; quiz 35.
- , , . Physiologic monitoring alarm load on medical/surgical floors of a community hospital. Biomed Instrum Technol. 2011;(suppl):29–36.
- , , , , , . Multicentric study of monitoring alarms in the adult intensive care unit (ICU): a descriptive analysis. Intensive Care Med. 1999;25(12):1360–1366.
- . Crying wolf: false alarms in a pediatric intensive care unit. Crit Care Med. 1994;22(6):981–985.
- , , , et al. Cardiopulmonary monitors and clinically significant events in critically ill children. Biomed Instrum Technol. 2011;(suppl):38–45.
- , , , et al. Systematic review of physiologic monitor alarm characteristics and pragmatic interventions to reduce alarm frequency. J Hosp Med. 2016;11(2):136–144.
- . Alarm fatigue. Nurs Clin North Am. 2012;47(3):375–382.
- . Monitor alarm fatigue: an integrative review. Biomed Instrum Technol. 2012;46(4):268–277.
- , , , . Use of pagers with an alarm escalation system to reduce cardiac monitor alarm signals. J Nurs Care Qual. 2014;29(1):9–18.
- . An evidence‐based approach to reduce nuisance alarms and alarm fatigue. Biomed Instrum Technol. 2011;(suppl):46–52.
- , , , et al. Insights into the problem of alarm fatigue with physiologic monitor devices: a comprehensive observational study of consecutive intensive care unit patients. PLoS One. 2014;9(10):e110274.
- , , , , , . Effect of altering alarm settings: a randomized controlled study. Biomed Instrum Technol. 2015;49(3):214–222.
- , , , , . Alarm limit settings for early warning systems to identify at‐risk patients. J Adv Nurs. 2009;65(9):1844–1852.
- , . A framework for reducing alarm fatigue on pediatric inpatient units. Hosp Pediatr. 2015;5(3):160–163.
- , , , et al. Association between exposure to nonactionable physiologic monitor alarms and response time in a children's hospital. J Hosp Med. 2015;10(6):345–351.
- The Johns Hopkins Hospital, , . The Harriet Lane Handbook. 20th ed. Philadelphia, PA: Elsevier Saunders; 2014.
- , . Nelson Textbook of Pediatrics. 19th ed. Philadelphia, PA.: Elsevier Saunders; 2011.
- , , , . Pediatric assessment. In: Pediatric Advanced Life Support: Provider Manual. Dallas, TX: American Heart Association; 2006:9–16.
- , , , et al. Normal ranges of heart rate and respiratory rate in children from birth to 18 years of age: a systematic review of observational studies. Lancet. 2011;377(9770):1011–1018.
- , , , , , . Development of heart and respiratory rate percentile curves for hospitalized children. Pediatrics. 2013;131(4):e1150–e1157.
- National Institutes of Health. Age‐appropriate vital signs. Available at: https://web.archive.org/web/20041101222327/http://www.cc.nih.gov/ccc/pedweb/pedsstaff/age.html. Accessed July 26, 2015.
- Guidelines 2000 for cardiopulmonary resuscitation and emergency cardiovascular care. Part 9: pediatric basic life support. The American Heart Association in collaboration with the International Liaison Committee on Resuscitation. Circulation. 2000;102(8 suppl):I253–I290.
- , , , , , . Recognising clinical instability in hospital patients before cardiac arrest or unplanned admission to intensive care. A pilot study in a tertiary‐care hospital. Med J Aust. 1999;171(1):22–25.
- , , , et al. Duration of life‐threatening antecedents prior to intensive care admission. Intensive Care Med. 2002;28(11):1629–1634.
- , . Pediatric cardiopulmonary resuscitation: a collective review. Ann Emerg Med. 1999;33(2):195–205.
- , , , et al. Effect of a rapid response team on hospital‐wide mortality and code rates outside the ICU in a Children's Hospital. JAMA. 2007;298(19):2267–2274.
- , , , et al. A team‐based approach to reducing cardiac monitor alarms. Pediatrics. 2014;134(6):e1686–e1694.
- , , , et al. Collection of annotated data in a clinical validation study for alarm algorithms in intensive care—a methodologic framework. J Crit Care. 2010;25(1):128–135.
- , , . Making ICU alarms meaningful: a comparison of traditional vs. trend‐based algorithms. Proc AMIA Symp. 1999:379–383.
- , , , et al. Implementation of a medical emergency team in a large pediatric teaching hospital prevents respiratory and cardiopulmonary arrests outside the intensive care unit. Pediatr Crit Care Med. 2007;8(3):236–246; quiz 247.
- . Centile‐based Early Warning Scores derived from statistical distributions of vital signs. Resuscitation. 2011;82(8):969–970.
- , , , , , . Centile‐based early warning scores derived from statistical distributions of vital signs. Resuscitation. 2011;82(8):1013–1018.
- , , , , . Reduction of paediatric in‐patient cardiac arrest and death with a medical emergency team: preliminary results. Arch Dis Child. 2005;90(11):1148–1152.