User login
Bed Utilization in the PICU
Patient flow refers to the management and movement of patients in health care settings and is linked to quality, safety, and cost.16 The intensive care unit (ICU) is crucial in patient flow.7, 8 The limited number of beds and the resource‐intensive services and staffing associated with them require that hospitals optimize their utilization, as is increasingly true of all hospital resources. To maximize delivery of services to patients who need them and minimize real and opportunity losses (eg, postponed surgery, diverted transports, or inability to accept patients), patients in ICU beds should receive critical care medicine/nursing services while there and be transferred or discharged when appropriate.
The time between arrival and departure from any area of the hospital, including the ICU, is considered the time when a patient is receiving needed clinical carethe value‐added portion of health care operationsand time waiting to move on to the next step.911 This period includes both necessary logistics (eg, signing out a patient or waiting a reasonable amount of time for room cleaning) and nonvalue‐added time (eg, an excessively long amount of time for room cleaning). Operations management labels nonvalue‐added time as waste, and its reduction is vital for high‐quality health care.9, 12, 13 As in other industries, one important way to understand value versus waste is through direct observation.11, 14 Although operating rooms have been the subject of several published process improvement projects to improve efficiency,1518 inpatient beds have not been the subject of such scrutiny. The objectives of this study were to generate a direct observation method and use it to describe pediatric ICU (PICU) bed utilization from a value‐added perspective.
METHODS
An interdisciplinary work group of physicians, nurses, quality improvement specialists, and 1 operations management expert developed an Excel spreadsheet to categorize hour‐by‐hour status of PICU beds. The clinicians generated a list of 27 activities. A critical care nurse trained in quality improvement piloted the list for 3 separate 4‐hour blocks over 2 weeks adding 18 activities; 2 additional activities were added during the 5 weeks of observation (Table 1). (The recording tool is provided in the Supporting Information Appendix.) Three observers with knowledge of medical terminology (2 third‐year medical students and 1 premedical student with years of experience as an emergency medical technician) were trained over 12 hours to conduct the observations. Prior to the observations, the 3 observers also spent time in the PICU, and terminology used for recordings was reviewed. Interobserver reliability was checked during 3 sets of observation circuits by all 3 observers and the principal investigator, as well as by spot checks during the study.
| Activity Description | Activity Code | Total Hours Over 5 Weeks | % Total Hours Over 5 Weeks* | Mean Hours per Week* |
|---|---|---|---|---|
| ||||
| Ventilated patient | Vent | 8996 | 45 | 1799 |
| CCSs not otherwise specified | NOS | 2982 | 15 | 596 |
| Neurosurgery patient with ICU needs | NeurosurgICU | 1534 | 8 | 307 |
| Room empty and unassigned | Empty‐unassigned | 1511 | 8 | 302 |
| Patient on continuous infusion | ContinInfus | 958 | 5 | 192 |
| Awaiting floor bed assignment | Floorbedassign | 919 | 5 | 184 |
| Patient with arterial line | ArtLine | 508 | 3 | 102 |
| Patient on high‐flow nasal cannula | HFNC | 475 | 2 | 95 |
| Room cleaning | EVS | 318 | 2 | 64 |
| Patient <12 hours after extubation | PostVent | 226 | 1 | 45 |
| Patient in OR, bed being held | OR | 210 | 1 | 42 |
| Neurosurgery patient, post‐ICU needs | NeurosurgPostICU | 164 | 0.8 | 33 |
| No clear ICU need, but no other accepting floor or service | Unclear | 163 | 0.8 | 33 |
| Patient at procedure, bed being held | Proced | 133 | 0.7 | 27 |
| Patient awaiting a rehabilitation bed | Rehab | 99 | 0.5 | 20 |
| Patient with ventriculostomy | Ventriculostomy | 82 | 0.4 | 16 |
| Patient eligible to be in NICU | NICU | 76 | 0.4 | 15 |
| Patient awaiting social work, case management, prescriptions before discharge | AwaitingOtherServ | 66 | 0.3 | 13 |
| Empty bed, assigned to ED patient | Empty‐ED | 40 | 0.2 | 8 |
| Empty bed, assigned to incoming transport patient | Empty‐Transport | 37 | 0.2 | 7 |
| Patient awaiting transport to another facility | Transport | 37 | 0.2 | 7 |
| Patient awaiting consult to determine transfer | Consult | 33 | 0.2 | 7 |
| Patient awaiting physician or NP sign‐out to floor before transfer | CallMDNP | 30 | 0.2 | 6 |
| PICU room needs a bed for next patient | Bed | 26 | 0.1 | 5 |
| Patient eligible to be in CCU | CCU | 24 | 0.1 | 5 |
| Patient eligible to be in CICU | CICU | 24 | 0.1 | 5 |
| Patient awaiting laboratory result to determine transfer or discharge | LabResult | 21 | 0.1 | 4 |
| Patient awaiting a ride home | Ride | 21 | 0.1 | 4 |
| Empty bed, assigned to floor patient | Empty‐floor | 19 | 0.1 | 4 |
| Patient awaiting nursing report to floor for transfer | Callnurse | 18 | 0.1 | 4 |
| Patient eligible to be in PCU | PCU | 18 | 0.1 | 4 |
| Patient on cardiac pressor | Pressor | 16 | 0.1 | 3 |
| Patient actively coding | Code | 15 | 0.1 | 3 |
| Patient on continuous veno‐venous hemofiltration | CVVH | 15 | 0.1 | 3 |
| Nursing work needed to enable transfer out | Nursing | 11 | 0.1 | 2 |
| Patient awaiting order for transfer to floor | Order | 11 | 0.1 | 2 |
| Patient in interventional radiology, bed being held | IR | 10 | 0.1 | 2 |
| Patient deceased in PICU room | Deceased | 9 | 0.1 | 2 |
| Awaiting radiology result to clear transfer or discharge | RadResult | 9 | 0.1 | 2 |
| Patient awaiting a floor bed to be cleaned for transfer out | Floorbedclean | 7 | <0.1 | 1 |
| Other logistical need for an empty room | Logistics | 7 | <0.1 | 1 |
| Disagreement among services for disposition | Disagreement | 4 | <0.1 | 1 |
| Family request to stay in PICU | Family | 3 | <0.1 | 1 |
| Awaiting accepting attending/fellow for transfer out | Accept | 1 | <0.1 | <1 |
| PICU room needs a crib for next patient | Crib | 1 | <0.1 | <1 |
| Patient with preventable reason for being in PICU | Prev | 0 | 0 | 0 |
| PICU room needs specialty bed for next patient | SpecialBed | 0 | 0 | 0 |
| Total | 19,887 | 100 | ||
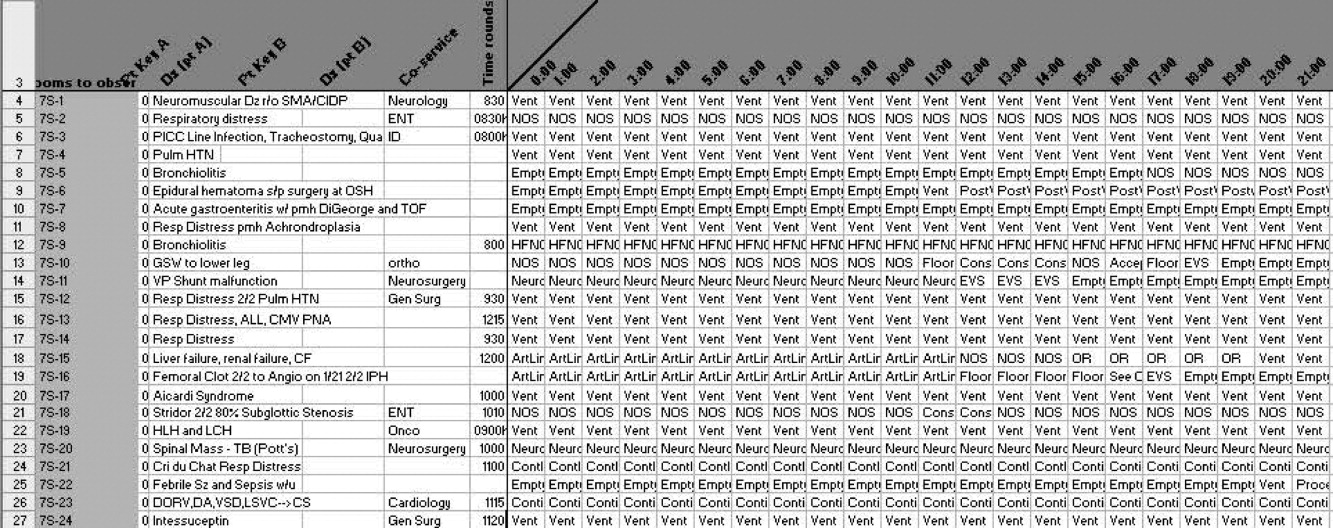
The targeted area included 24 single‐patient rooms. The activity of each bed was recorded hourly. Real‐time recording in to the Excel spreadsheet on a dedicated laptop occurred from 8:00 AM until 11:00 PM. The most visible or critical event was recorded. Although some activities were not mutually exclusive (eg, a patient could be ventilated and on a continuous infusion simultaneously), the objective was to identify when a room was being used for any critical care service, not enumerate all of them. The observers noted overnight events that occurred from 11:00 PM to 8:00 AM in the morning by reviewing the bedside record and talking to the staff to complete each day's 24‐hour recording. The observers also recorded the hospital‐wide census and the census for the other half of the PICU every 4 hours. The observations occurred over 5 noncontiguous weeks between January 2009 and April 2009.
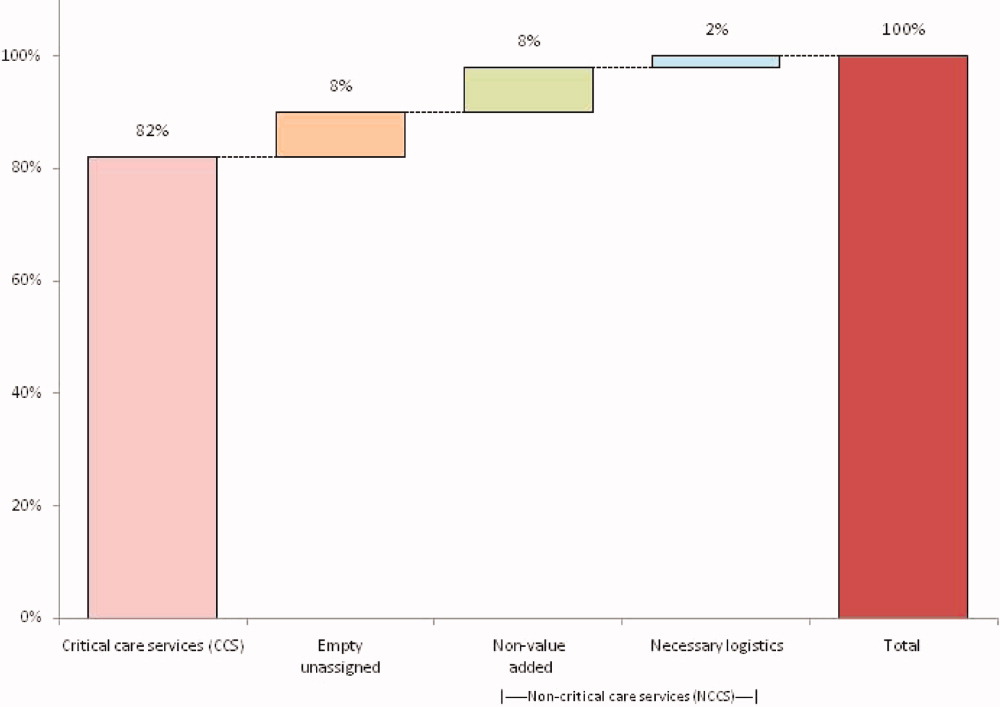
After all observations were complete, activities were classified as critical care services (CCS) or noncritical‐care services (NCCS). NCCSs were further divided into necessary logistics (defined for analysis purposes as the first hour of any NCCS activity) or nonvalue‐added (the second or greater hour of NCCS). A time limit of 1 hour was chosen to define necessary logistics based on a consensus that nonclinical activities optimally would not take more than 1 hour each. We also analyzed results with 2 hours as the cutoff for necessary logistics. Admission, discharge, and transfer records were reviewed to check for returns to the PICU or hospital within 48 hours of transfer or discharge from the PICU.
Analyses were conducted using Microsoft Excel (Microsoft, Redmond, WA) and Stata 10.0 (StataCorp, College Station, TX). The study was approved by the Children's Hospital of Philadelphia Institutional Review Board with waiver of consent.
RESULTS
A total of 824 hours of recordings included 19,887 bed‐hours with 219 unique patients; among them, 2 remained from the first day of recording in January to the last day in April (sample recording in Figure 1). A total of 50 patients (range, 812 per week) stayed for the entirety of each 1‐week observation period. Of the 47 possible activities, 45 of them were recorded for at least 1 hour in the 5 weeks. Overall, 14 activities accounted for 95% of the observed bed‐hours and 31 activities accounted for the remaining 5%. CCS accounted for 82% of observed bed‐hours, NCCS accounted for 10.4%, and empty unassigned accounted for 8% (Figure 2). Using the 1‐hour cutoff for necessary services, 77% of NCCS time was nonvalue‐added, whereas 23% of it was necessary logistics; using the 2‐hour cutoff, 54% was nonvalue‐added, and 46% was necessary logistics.
During the observation period, <1% of bed‐hours were used for CCS for overflow patients from the neonatal ICU (NICU), cardiac care unit (CCU), cardiac ICU (CICU), or progressive care unit (PCU; tracheostomy/ventilator unit). Although only 4 patients required transport to a rehabilitation facility, their wait time comprised 99 hours (<1%) of total recordings. Eight patients waited a mean of 2.6 hours for transportation home (maximum, 10 hours).
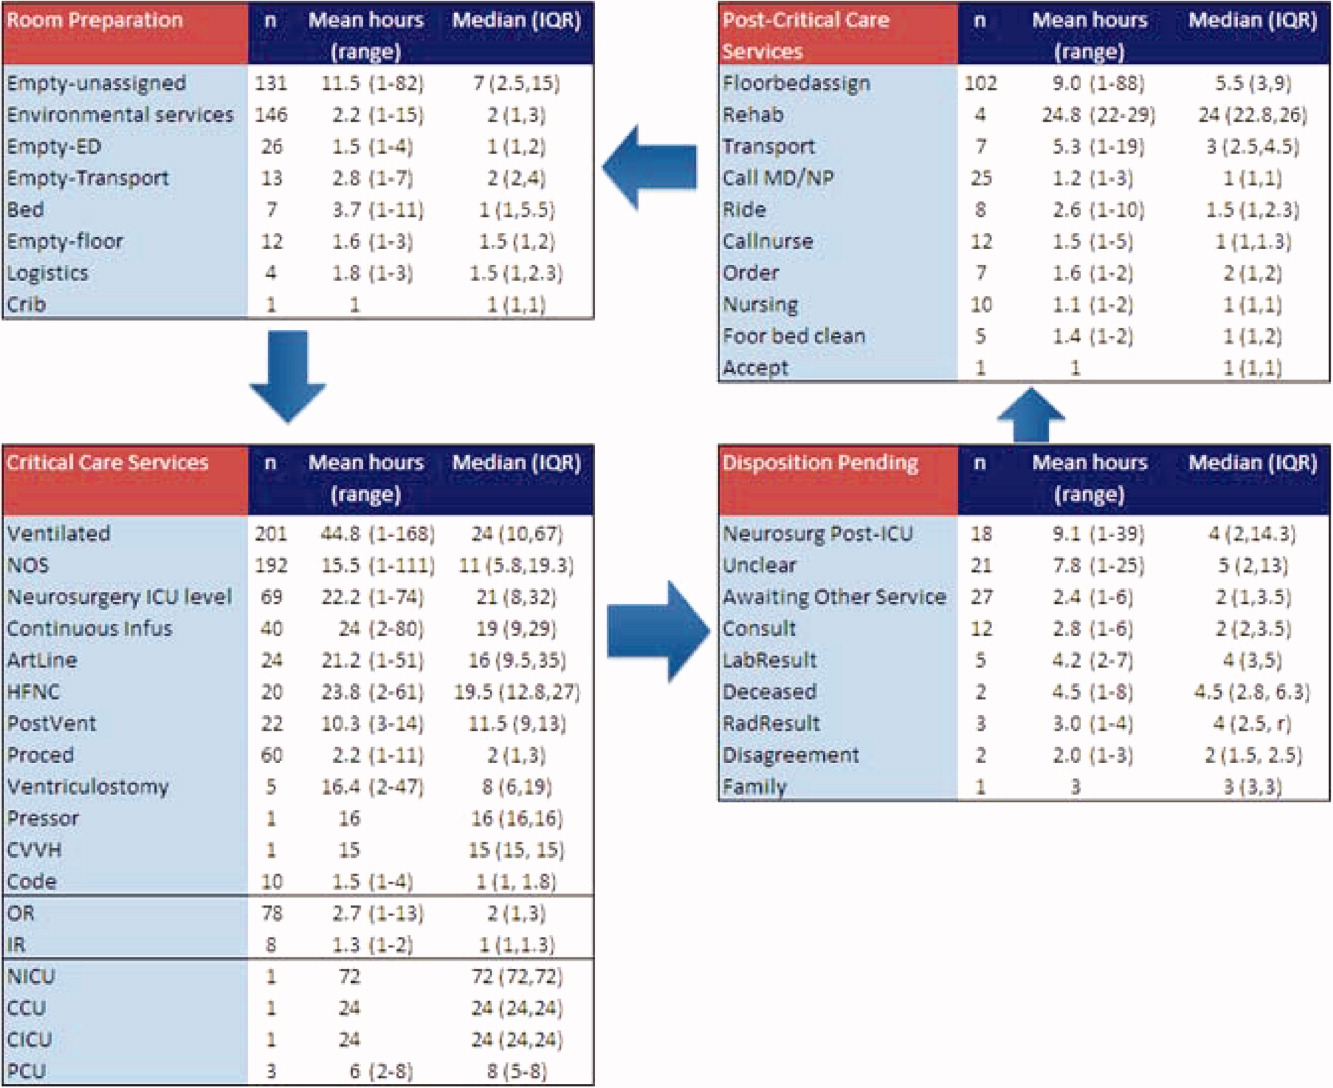
To demonstrate the cycle of room use, activities were divided into 4 categories: room preparation, critical care services, disposition pending, and postcritical care services (Figure 3). As an example of detailed data revealed by direct observation, we identified 102 instances totaling 919 hours when a patient was waiting for a bed assignment on another floor (5% of all bed‐hours). The mean wait time was 9 hours (range, 188 hours) and the median time was 5.5 hours. There were only 15 instances when floor bed assignment took 1 hour or less, and only 9 instances when it took 12 hours. Similarly, considerable time was spent on cleaning rooms between patients: only 66 of 146 instances of cleaning took 1 hour or less. The mean time for cleaning was 2.2 hours (range, 115), and the median was 2 hours. (There were 136 recorded instances of room cleaning and 10 additional episodes that were not recorded but had to be completed for the room to turnover from one patient to the next, yielding a total of 146 instances of cleaning.)
From the 824 hours of recording, we identified 200 hours (25% of time) when there were zero empty unassigned beds available in the section of the PICU being observed. Episodes of full occupancy occurred mostly on weekdays, with 23% of hours of full capacity on Thursdays, 21% on Mondays, and 21% on Wednesdays; only 8% were on Saturdays and <1% on Sundays. These 200 hours fell into 36 separate episodes of complete occupancy, each lasting 122 hours. Each patient, on average, received 3.1 hours of NCCS during each episode of full occupancy (range, 111 hours). Within these 200 hours at capacity, we identified only 15 hours (8%) when all 24 beds were used for CCS. For 72% of the time, there was at least 1 bed with NCCS, and for 37% at least 2 beds. A small portion of the time (7%), the lack of beds was affected by occupancy by patients who should have been in the NICU, CICU, CCU, or PCU.
Data collected through direct observation can be used to understand aggregated and averaged experiences, but also more specific time periods. For example, we identified 1 week with the highest consistent level of occupancy and turnover: March 915 had empty unassigned beds for only 4% of the week. Of the 168 hours in the week, 68 (40%) had full capacity. However, for 90% of the time, at least 1 bed was used for a NCCS. Other analytic options included varying the assumptions around time needed for logistics. Overall, NCCS time on necessary logistics changes from 23% to 46% using 1 hour versus 2 hours as the cutoff. For floor bed assignments, assuming that the first hour of this activity is necessary logistics and any hour thereafter is not, 817 hours were wasted. Even after assuming 2 hours of necessary logistical time (which may also include steps such as nursing and physician sign‐out to the receiving team, often not recorded in the observations), this left 715 hours of NCCS time in which patients waited to be placed elsewhere in the hospital. For room cleaning, because recordings were hourly, but room cleaning could take less time, we performed a sensitivity analysis, converting all 1‐hour recordings to half‐hour recordings to half‐hour recordings (an exaggerated shortening since industry‐standard cleaning may take longer).
Of the 219 patients directly observed, 15 were noted to be waiting for a transfer out of the PICU but experienced a change in disposition before the transfer. On average, these patients waited 8 hours for a floor bed assignment (range, 221) before reverting to a CCS, which then lasted an average of 16.5 hours (range, 149). (Included in this group are 2 patients who experienced this change in disposition twice.) In post hoc review across the 5 weeks, no patients were transferred back to the PICU within 48 hours after being transferred out. During the study period, 19 patients were discharged directly from the PICU (8 to home, 7 by transport to another facility, and 4 to rehabilitation). One patient returned to the hospital (but not the PICU) within 48 hours of being discharged home from the PICU.
During the study period, using the highest census value for recorded for each 24‐hour period and the number of beds available that day, median hospital‐wide occupancy was 93% (interquartile range, 90%96%). During the 35 days of observation, 71% of the days had occupancy >90%, 29% of days had occupancy >95%, and 3% of days had occupancy >100%.
DISCUSSION
In this direct observation of a PICU, we found high usage of beds for delivery of CCS. We identified many episodes in which the half of the PICU we observed was fully occupied (200 of 824 hours), but not necessarily delivering PICU‐level care to all patients. In fact, 75% of the full‐capacity hours had at least 1 patient receiving NCCS and 37% had at least 2. Patients waiting for a floor bed assignment represented nearly 5% of bed‐hours observed (mean 9 hours per patient). That full occupancy was not random, but rather clustered on weekdays, is consistent with other work showing that hospitals are at greater risk for midweek crowding due to the way in which scheduled admissions enter and leave.1925
Our methods provide the basis for operational analysis and improvement to patient flow, such as value stream mapping.9, 26 Process improvement work could be directed to areas of delay uncovered through this analysis and inform clinical and nonclinical management. For example, one of the key problems faced by the PICU was finding floor bed assignments for patients leaving the unit. Simply building more beds in the PICU will not solve this problemand at an estimated cost of $2 million to add a bed, it is likely not an efficient means of responding to poor flow. In these cases, the problem seems to lie downstream, and could suggest shortage of regular floor beds or inefficient bed assignment procedures within the hospital. The output also suggests that variation in nonclinical processes should be a target for improvement, such as time to clean rooms, because variation is known to be a source of nonvalue‐added time in many operations.9, 26 High occupancy on weekdays but low occupancy on weekends also emphasizes the potential for smoothing occupancy to reduce the risk of midweek crowding and to better manage bed utilization and staffing.24, 25
When seeking to reduce nonvalue‐added time, one must weigh the risks of increased efficiency against clinical outcomes. For example, if patients could be transferred out of the PICU faster, would the risk of returns to the PICU be higher? In this study, 15 patients (7%) had a change in disposition from awaiting transfer back to a CCS. The fact that transfers did not happen instantaneously may serve as a safety check to reduce rapid returns, but it is not possible for us to evaluate the reasons why patients did not actually complete the pending transfers. Specifically, we cannot determine whether the patient's clinical status objectively deteriorated, the ICU team made a judgment call to hold the patient, or the floor team refused to accept the transfer. Given this fact, although it appears in this study (and in the health care system more broadly) that there are opportunities to increase efficiency and reduce nonvalue‐added time, it is not realistic (nor advisable) that such time be reduced to zero. Along this line, one must consider separately purely nonclinical functions such as room cleaning and those that include some clinical element, such as time waiting for a patient to be transferred.
Beyond the direct findings of this study, the method should be replicable in other settings and can reveal important information about health care efficiency, capacity, and flexibility. The bottlenecks identified would have been difficult to identify through administrative record review. The exact amount of time to spend on observation may vary from place to place and would depend on the expected variation over time and the level of detail sought. In general, the more common the event and the less variation, the less time needed to observe it.
This study has several limitations that should be considered in terms of interpreting the results and in seeking to reproduce the approach. First, hourly recordings may not be discrete enough for events that took less than 1 hour. To assess the degree to which this would affect our results, we reanalyzed all NCCS by subtracting 30 minutes (0.5 hour) from all recordings, which increased total CCS from 82% to 87% and decreased NCCS by the same 5 percentage points. In a related fashion, our recordings were truncated at the start and end of each 1‐week period, so we could only observe a maximum of 168 hours for any given activity and did not record how long an activity was happening before or after the recordings started or stopped, respectively. Second, each recording could only be for 1 activity per hour. Separate from the level of granularity already noted, this also limits interpretation of critical care activities that may have been simultaneous. However, because the goal of the study was not to describe the provision of critical care services, but rather the times when they were not being delivered, this does not influence our conclusions. For movement of patients, however, we missed instances of physician and nursing calling sign‐out on patients to receiving units, as these events last less than 1 hour (and in the case of surgical patients, generally do not occur as the team provides continuous coverage). The time for such events is then included in other activities. To the extent that this may influence the results, it would increase the perceived time for nonvalue‐added services, but to a limited degree, and never by more than 59 minutes. Third, the overnight hours (11:00 PM to 8:00 AM) were not directly observed, but retrospectively recorded each morning by reviewing the records and discussing the overnight events with the clinical staff. For example, if a patient was intubated at 11:00 PM and at 8:00 AM, the observer would confirm this and record that status for the intervening hours. This is unlikely to result in a substantial impact on the findings, because the overnight hours have a relative degree of stability even for unstable patients in terms of their status of needing or not needing a CCS. Fourth, we did not evaluate the appropriateness of CCS delivered (eg, how long a patient was ventilated). Our definitions for CCS and NCSS were based on Children's Hospital of Philadelphia practices, which may not be the same as those of other facilities. The categorization of CCS was objective for activities such as ventilation or continuous infusion, but was less clear for the not otherwise specified recordings, which represented patients with a complex illness or projected organ, respiratory, cardiac, or neurological failure. These patients were not receiving a specific critical care intervention, but were deemed to need to be in the PICU as opposed to a regular floor (eg, for frequent monitoring of potential respiratory failure). It would also include patients receiving combinations of therapies more efficiently delivered in the PICU. For that, the observers relied on the judgment of clinicians (primarily nurses) to determine whether the patient needed to be in the PICU or not; if no specific reason could be provided, not otherwise specified was applied. These 192 instances accounted for 2982 aggregate bed‐hours (15% of total). It is difficult to judge the direction of bias, because overestimation of need to be in the PICU may be as likely to occur as underestimation. Fifth, the very presence of the observers may have changed behavior. Knowing that they were being observed staff may have acted with greater efficiency than otherwise. We expect that such a finding would lead to less time appearing as necessary logistics or NCCS. Finally, results may not be generalizable to other hospitals or hospital settings. There are clearly important contextual factors, not only for the location but also for the duration. For example, staffing was never an issue during the 5 weeks of observation, but there are locations where an empty bed is not necessarily usable due to lack of staffing. Nonetheless, we believe the results provide a generalizable approach and methodology for other settings (and staffing could be a reason for an empty bed).
In terms of the setting, as noted, we observed one discrete 24‐bed unit, which comprises half of the total PICU. Thus, statements that the PICU was at full capacity must be interpreted in the context that additional rooms may have been available on the other side. Patients are generally admitted alternately to each unit, so the occupancies should parallel each other. We recorded the census every 4 hours for both sides from the electronic system (Sunrise Clinical Manager [SCM]). However, this only accounts for patients physically in beds, not beds held for patients in other locations. Thus, we would expect a discrepancy between direct observation and the SCM value. Through analysis of the entire pediatric intensive care unit,* that part which observed directly, and that which we did not observe directly using census data, we think it reasonable to assert that both units of the total PICU had constrained capacity during the times we directly observed and recorded such constraint on one side.
This study demonstrates the use of direct observation for inpatient settings to learn about resource utilization and identification of value‐added services. PubMed searches for the terms efficiency, flow, process redesign, and time management bring up many more references for operating rooms than for ICUs or inpatient beds. Some examples of ICU‐directed work include videography of an ICU in Australia27 and human factor analysis in ICU nursing.5 Time‐motion studies have also been conducted on clinical staff, such as physicians.28, 29
In conclusion, we found that direct observation provided important insights into the utilization of patient rooms in an important inpatient setting. Data such as these are valuable for clinical and process improvement work, as well as understanding how best to match capacity to patient need. Finally, the methodology is reproducible for other settings and would be an additional tool to measuring and improving the efficiency and value of the health system. When appropriate, this approach can also evaluate the effectiveness of process improvement, help identify and reduce waste,13 and contribute to the growing field that merges operations management with hospital administration and clinical care: in other words, evidence‐based management.30
Acknowledgements
The authors thank Paula Agosto, Patricia Hubbs, Heidi Martin, and Annette Bollig for contributions to the study design.
In comparing direct observation to the SCM count, we found perfect concordance for 110 hours (55%) during which 0 beds were available. For the other 90 hours, SCM reported 1 bed being available in 46 hours (23%), 2 beds being available in 24 hours (12%), 3 beds being available in 17 hours (9%), and 4 beds being available in 3 hours (2%)all while we directly observed 0 beds being available. Thus, cumulatively, 90% of the hours observed with no beds had an SCM report availability of 02 beds; 99% of the time that was 03 beds. Applying this rate of mismatch to the unit that we did not observe directly, SCM reported 0 beds for 46 (23%) of the 200 hours the observation unit was full; SCM reported 1 bed available in 70 hours (35%), 2 beds open in 42 hours (21%), 3 beds open in 26 hours (13%), and 4 beds open in 16 hours (8%). Cumulatively, that is 79% of the time with 02 beds and 92% at 03 beds. From this, we conclude that the combined PICU for both sides was likely functionally full at least 158 of the 200 hours that the side we observed was full (79% 200 hours) and likely had very constrained capacity during the other 42 hours.
- ,,,,.The effect of hospital occupancy on emergency department length of stay and patient disposition.Acad Emerg Med.2003;10:127–133.
- ,,,.The effect of hospital bed occupancy on throughput in the pediatric emergency department.Ann Emerg Med.2009;53:767–776.
- ,,,.A Comparison of in‐hospital mortality risk conferred by high hospital occupancy, differences in nurse staffing levels, weekend admission, and seasonal influenza.Medical Care.2010;48:224–232.
- .Intensive care unit occupancy: making room for more patients.Crit Care Med.2009;37:1794–1795.
- ,.A human factors engineering conceptual framework of nursing workload and patient safety in intensive care units.Intensive Crit Care Nurs.2005;21:284–301.
- ,,, et al.High level of burnout in intensivists: prevalence and associated factors.Am J Respir Crit Care Med.2007;175:686–692.
- ,,.Length of stay and efficiency in pediatric intensive care units.J Pediatr.1998;133:79–85.
- ,.Variability in duration of stay in pediatric intensive care units: a multiinstitutional study.J Pediatr.1996;128:35–44.
- ,.Matching Supply with Demand: An Introduction to Operations Management.New York, NY:McGraw‐Hill;2006.
- ,.Impact of workload on service time and patient safety: an econometric analysis of hospital operations.Management Science.2009;55:1486–1498.
- .OPIM 631: Operations Management.Philadelphia, PA:Wharton School, University of Pennsylvania;2008.
- ,,.From waste to value in health care.JAMA.2008;299:568–571.
- .Eliminating “waste” in health care.JAMA.2009;302:2481–2482.
- .Toyota Production System: Beyond Large‐scale Production.London, UK:Productivity Press;1995.
- ,.Interdisciplinary work flow assessment and redesign decreases operating room turnover time and allows for additional caseload.Arch Surg.2006;141:65–69.
- ,,,.Improving operating room efficiency through process redesign.Surgery.2006;140:509–514.
- ,,,.Successful strategies for improving operating room efficiency at academic institutions.Anesth Analg.1998year="1998"1998;86:896–906.
- ,,.Efficiency of the operating room suite.Am J Surg.2003;185:244–250.
- ,,, et al.Children's hospitals do not acutely respond to high occupancy.Pediatrics.2010;125:974–981.
- Institute for Healthcare Improvement. Smoothing elective surgical admissions. Available at: http://www.ihi.org/IHI/Topics/Flow/Patient Flow/EmergingContent/SmoothingElectiveSurgicalAdmissions.htm. Accessed October 24,2008.
- Boston Hospital Sees Big Impact from Smoothing Elective Schedule.OR Manager. Volume 20, no. 12,2004.
- ,.Rethinking rapid response teams.JAMA.2010;304:1375–1376.
- Litvak E, ed.Managing Patient Flow in Hospitals: Strategies and Solutions.2nd ed.Oak Brook, IL:Joint Commission Resources;2009.
- ,,,,,.Scheduled admissions and high occupancy at a children's hospital.J Hosp Med.2011;6:81–87.
- ,,, et al.Addressing inpatient crowding by smoothing occupancy at children's hospitals.J Hosp Med.2011;6:466–473.
- ,.Learning to See: Value Stream Mapping to Add Value and Eliminate MUDA.Cambridge, MA:Lean Enterprise Institute;1999.
- ,,.Reshaping ICU ward round practices using video‐reflexive ethnography.Qual Health Res.2008;18:380–390.
- ,,.How hospitalists spend their time: insights on efficiency and safety.J Hosp Med.2006;1:88–93.
- ,,, et al.Where did the day go? A time‐motion study of hospitalists.J Hosp Med2010;5:323–238.
- ,,.Improving patient care by linking evidence‐based medicine and evidence‐based management.JAMA.2007;298:673–676.
Patient flow refers to the management and movement of patients in health care settings and is linked to quality, safety, and cost.16 The intensive care unit (ICU) is crucial in patient flow.7, 8 The limited number of beds and the resource‐intensive services and staffing associated with them require that hospitals optimize their utilization, as is increasingly true of all hospital resources. To maximize delivery of services to patients who need them and minimize real and opportunity losses (eg, postponed surgery, diverted transports, or inability to accept patients), patients in ICU beds should receive critical care medicine/nursing services while there and be transferred or discharged when appropriate.
The time between arrival and departure from any area of the hospital, including the ICU, is considered the time when a patient is receiving needed clinical carethe value‐added portion of health care operationsand time waiting to move on to the next step.911 This period includes both necessary logistics (eg, signing out a patient or waiting a reasonable amount of time for room cleaning) and nonvalue‐added time (eg, an excessively long amount of time for room cleaning). Operations management labels nonvalue‐added time as waste, and its reduction is vital for high‐quality health care.9, 12, 13 As in other industries, one important way to understand value versus waste is through direct observation.11, 14 Although operating rooms have been the subject of several published process improvement projects to improve efficiency,1518 inpatient beds have not been the subject of such scrutiny. The objectives of this study were to generate a direct observation method and use it to describe pediatric ICU (PICU) bed utilization from a value‐added perspective.
METHODS
An interdisciplinary work group of physicians, nurses, quality improvement specialists, and 1 operations management expert developed an Excel spreadsheet to categorize hour‐by‐hour status of PICU beds. The clinicians generated a list of 27 activities. A critical care nurse trained in quality improvement piloted the list for 3 separate 4‐hour blocks over 2 weeks adding 18 activities; 2 additional activities were added during the 5 weeks of observation (Table 1). (The recording tool is provided in the Supporting Information Appendix.) Three observers with knowledge of medical terminology (2 third‐year medical students and 1 premedical student with years of experience as an emergency medical technician) were trained over 12 hours to conduct the observations. Prior to the observations, the 3 observers also spent time in the PICU, and terminology used for recordings was reviewed. Interobserver reliability was checked during 3 sets of observation circuits by all 3 observers and the principal investigator, as well as by spot checks during the study.
| Activity Description | Activity Code | Total Hours Over 5 Weeks | % Total Hours Over 5 Weeks* | Mean Hours per Week* |
|---|---|---|---|---|
| ||||
| Ventilated patient | Vent | 8996 | 45 | 1799 |
| CCSs not otherwise specified | NOS | 2982 | 15 | 596 |
| Neurosurgery patient with ICU needs | NeurosurgICU | 1534 | 8 | 307 |
| Room empty and unassigned | Empty‐unassigned | 1511 | 8 | 302 |
| Patient on continuous infusion | ContinInfus | 958 | 5 | 192 |
| Awaiting floor bed assignment | Floorbedassign | 919 | 5 | 184 |
| Patient with arterial line | ArtLine | 508 | 3 | 102 |
| Patient on high‐flow nasal cannula | HFNC | 475 | 2 | 95 |
| Room cleaning | EVS | 318 | 2 | 64 |
| Patient <12 hours after extubation | PostVent | 226 | 1 | 45 |
| Patient in OR, bed being held | OR | 210 | 1 | 42 |
| Neurosurgery patient, post‐ICU needs | NeurosurgPostICU | 164 | 0.8 | 33 |
| No clear ICU need, but no other accepting floor or service | Unclear | 163 | 0.8 | 33 |
| Patient at procedure, bed being held | Proced | 133 | 0.7 | 27 |
| Patient awaiting a rehabilitation bed | Rehab | 99 | 0.5 | 20 |
| Patient with ventriculostomy | Ventriculostomy | 82 | 0.4 | 16 |
| Patient eligible to be in NICU | NICU | 76 | 0.4 | 15 |
| Patient awaiting social work, case management, prescriptions before discharge | AwaitingOtherServ | 66 | 0.3 | 13 |
| Empty bed, assigned to ED patient | Empty‐ED | 40 | 0.2 | 8 |
| Empty bed, assigned to incoming transport patient | Empty‐Transport | 37 | 0.2 | 7 |
| Patient awaiting transport to another facility | Transport | 37 | 0.2 | 7 |
| Patient awaiting consult to determine transfer | Consult | 33 | 0.2 | 7 |
| Patient awaiting physician or NP sign‐out to floor before transfer | CallMDNP | 30 | 0.2 | 6 |
| PICU room needs a bed for next patient | Bed | 26 | 0.1 | 5 |
| Patient eligible to be in CCU | CCU | 24 | 0.1 | 5 |
| Patient eligible to be in CICU | CICU | 24 | 0.1 | 5 |
| Patient awaiting laboratory result to determine transfer or discharge | LabResult | 21 | 0.1 | 4 |
| Patient awaiting a ride home | Ride | 21 | 0.1 | 4 |
| Empty bed, assigned to floor patient | Empty‐floor | 19 | 0.1 | 4 |
| Patient awaiting nursing report to floor for transfer | Callnurse | 18 | 0.1 | 4 |
| Patient eligible to be in PCU | PCU | 18 | 0.1 | 4 |
| Patient on cardiac pressor | Pressor | 16 | 0.1 | 3 |
| Patient actively coding | Code | 15 | 0.1 | 3 |
| Patient on continuous veno‐venous hemofiltration | CVVH | 15 | 0.1 | 3 |
| Nursing work needed to enable transfer out | Nursing | 11 | 0.1 | 2 |
| Patient awaiting order for transfer to floor | Order | 11 | 0.1 | 2 |
| Patient in interventional radiology, bed being held | IR | 10 | 0.1 | 2 |
| Patient deceased in PICU room | Deceased | 9 | 0.1 | 2 |
| Awaiting radiology result to clear transfer or discharge | RadResult | 9 | 0.1 | 2 |
| Patient awaiting a floor bed to be cleaned for transfer out | Floorbedclean | 7 | <0.1 | 1 |
| Other logistical need for an empty room | Logistics | 7 | <0.1 | 1 |
| Disagreement among services for disposition | Disagreement | 4 | <0.1 | 1 |
| Family request to stay in PICU | Family | 3 | <0.1 | 1 |
| Awaiting accepting attending/fellow for transfer out | Accept | 1 | <0.1 | <1 |
| PICU room needs a crib for next patient | Crib | 1 | <0.1 | <1 |
| Patient with preventable reason for being in PICU | Prev | 0 | 0 | 0 |
| PICU room needs specialty bed for next patient | SpecialBed | 0 | 0 | 0 |
| Total | 19,887 | 100 | ||
The targeted area included 24 single‐patient rooms. The activity of each bed was recorded hourly. Real‐time recording in to the Excel spreadsheet on a dedicated laptop occurred from 8:00 AM until 11:00 PM. The most visible or critical event was recorded. Although some activities were not mutually exclusive (eg, a patient could be ventilated and on a continuous infusion simultaneously), the objective was to identify when a room was being used for any critical care service, not enumerate all of them. The observers noted overnight events that occurred from 11:00 PM to 8:00 AM in the morning by reviewing the bedside record and talking to the staff to complete each day's 24‐hour recording. The observers also recorded the hospital‐wide census and the census for the other half of the PICU every 4 hours. The observations occurred over 5 noncontiguous weeks between January 2009 and April 2009.
After all observations were complete, activities were classified as critical care services (CCS) or noncritical‐care services (NCCS). NCCSs were further divided into necessary logistics (defined for analysis purposes as the first hour of any NCCS activity) or nonvalue‐added (the second or greater hour of NCCS). A time limit of 1 hour was chosen to define necessary logistics based on a consensus that nonclinical activities optimally would not take more than 1 hour each. We also analyzed results with 2 hours as the cutoff for necessary logistics. Admission, discharge, and transfer records were reviewed to check for returns to the PICU or hospital within 48 hours of transfer or discharge from the PICU.
Analyses were conducted using Microsoft Excel (Microsoft, Redmond, WA) and Stata 10.0 (StataCorp, College Station, TX). The study was approved by the Children's Hospital of Philadelphia Institutional Review Board with waiver of consent.
RESULTS
A total of 824 hours of recordings included 19,887 bed‐hours with 219 unique patients; among them, 2 remained from the first day of recording in January to the last day in April (sample recording in Figure 1). A total of 50 patients (range, 812 per week) stayed for the entirety of each 1‐week observation period. Of the 47 possible activities, 45 of them were recorded for at least 1 hour in the 5 weeks. Overall, 14 activities accounted for 95% of the observed bed‐hours and 31 activities accounted for the remaining 5%. CCS accounted for 82% of observed bed‐hours, NCCS accounted for 10.4%, and empty unassigned accounted for 8% (Figure 2). Using the 1‐hour cutoff for necessary services, 77% of NCCS time was nonvalue‐added, whereas 23% of it was necessary logistics; using the 2‐hour cutoff, 54% was nonvalue‐added, and 46% was necessary logistics.
During the observation period, <1% of bed‐hours were used for CCS for overflow patients from the neonatal ICU (NICU), cardiac care unit (CCU), cardiac ICU (CICU), or progressive care unit (PCU; tracheostomy/ventilator unit). Although only 4 patients required transport to a rehabilitation facility, their wait time comprised 99 hours (<1%) of total recordings. Eight patients waited a mean of 2.6 hours for transportation home (maximum, 10 hours).
To demonstrate the cycle of room use, activities were divided into 4 categories: room preparation, critical care services, disposition pending, and postcritical care services (Figure 3). As an example of detailed data revealed by direct observation, we identified 102 instances totaling 919 hours when a patient was waiting for a bed assignment on another floor (5% of all bed‐hours). The mean wait time was 9 hours (range, 188 hours) and the median time was 5.5 hours. There were only 15 instances when floor bed assignment took 1 hour or less, and only 9 instances when it took 12 hours. Similarly, considerable time was spent on cleaning rooms between patients: only 66 of 146 instances of cleaning took 1 hour or less. The mean time for cleaning was 2.2 hours (range, 115), and the median was 2 hours. (There were 136 recorded instances of room cleaning and 10 additional episodes that were not recorded but had to be completed for the room to turnover from one patient to the next, yielding a total of 146 instances of cleaning.)
From the 824 hours of recording, we identified 200 hours (25% of time) when there were zero empty unassigned beds available in the section of the PICU being observed. Episodes of full occupancy occurred mostly on weekdays, with 23% of hours of full capacity on Thursdays, 21% on Mondays, and 21% on Wednesdays; only 8% were on Saturdays and <1% on Sundays. These 200 hours fell into 36 separate episodes of complete occupancy, each lasting 122 hours. Each patient, on average, received 3.1 hours of NCCS during each episode of full occupancy (range, 111 hours). Within these 200 hours at capacity, we identified only 15 hours (8%) when all 24 beds were used for CCS. For 72% of the time, there was at least 1 bed with NCCS, and for 37% at least 2 beds. A small portion of the time (7%), the lack of beds was affected by occupancy by patients who should have been in the NICU, CICU, CCU, or PCU.
Data collected through direct observation can be used to understand aggregated and averaged experiences, but also more specific time periods. For example, we identified 1 week with the highest consistent level of occupancy and turnover: March 915 had empty unassigned beds for only 4% of the week. Of the 168 hours in the week, 68 (40%) had full capacity. However, for 90% of the time, at least 1 bed was used for a NCCS. Other analytic options included varying the assumptions around time needed for logistics. Overall, NCCS time on necessary logistics changes from 23% to 46% using 1 hour versus 2 hours as the cutoff. For floor bed assignments, assuming that the first hour of this activity is necessary logistics and any hour thereafter is not, 817 hours were wasted. Even after assuming 2 hours of necessary logistical time (which may also include steps such as nursing and physician sign‐out to the receiving team, often not recorded in the observations), this left 715 hours of NCCS time in which patients waited to be placed elsewhere in the hospital. For room cleaning, because recordings were hourly, but room cleaning could take less time, we performed a sensitivity analysis, converting all 1‐hour recordings to half‐hour recordings to half‐hour recordings (an exaggerated shortening since industry‐standard cleaning may take longer).
Of the 219 patients directly observed, 15 were noted to be waiting for a transfer out of the PICU but experienced a change in disposition before the transfer. On average, these patients waited 8 hours for a floor bed assignment (range, 221) before reverting to a CCS, which then lasted an average of 16.5 hours (range, 149). (Included in this group are 2 patients who experienced this change in disposition twice.) In post hoc review across the 5 weeks, no patients were transferred back to the PICU within 48 hours after being transferred out. During the study period, 19 patients were discharged directly from the PICU (8 to home, 7 by transport to another facility, and 4 to rehabilitation). One patient returned to the hospital (but not the PICU) within 48 hours of being discharged home from the PICU.
During the study period, using the highest census value for recorded for each 24‐hour period and the number of beds available that day, median hospital‐wide occupancy was 93% (interquartile range, 90%96%). During the 35 days of observation, 71% of the days had occupancy >90%, 29% of days had occupancy >95%, and 3% of days had occupancy >100%.
DISCUSSION
In this direct observation of a PICU, we found high usage of beds for delivery of CCS. We identified many episodes in which the half of the PICU we observed was fully occupied (200 of 824 hours), but not necessarily delivering PICU‐level care to all patients. In fact, 75% of the full‐capacity hours had at least 1 patient receiving NCCS and 37% had at least 2. Patients waiting for a floor bed assignment represented nearly 5% of bed‐hours observed (mean 9 hours per patient). That full occupancy was not random, but rather clustered on weekdays, is consistent with other work showing that hospitals are at greater risk for midweek crowding due to the way in which scheduled admissions enter and leave.1925
Our methods provide the basis for operational analysis and improvement to patient flow, such as value stream mapping.9, 26 Process improvement work could be directed to areas of delay uncovered through this analysis and inform clinical and nonclinical management. For example, one of the key problems faced by the PICU was finding floor bed assignments for patients leaving the unit. Simply building more beds in the PICU will not solve this problemand at an estimated cost of $2 million to add a bed, it is likely not an efficient means of responding to poor flow. In these cases, the problem seems to lie downstream, and could suggest shortage of regular floor beds or inefficient bed assignment procedures within the hospital. The output also suggests that variation in nonclinical processes should be a target for improvement, such as time to clean rooms, because variation is known to be a source of nonvalue‐added time in many operations.9, 26 High occupancy on weekdays but low occupancy on weekends also emphasizes the potential for smoothing occupancy to reduce the risk of midweek crowding and to better manage bed utilization and staffing.24, 25
When seeking to reduce nonvalue‐added time, one must weigh the risks of increased efficiency against clinical outcomes. For example, if patients could be transferred out of the PICU faster, would the risk of returns to the PICU be higher? In this study, 15 patients (7%) had a change in disposition from awaiting transfer back to a CCS. The fact that transfers did not happen instantaneously may serve as a safety check to reduce rapid returns, but it is not possible for us to evaluate the reasons why patients did not actually complete the pending transfers. Specifically, we cannot determine whether the patient's clinical status objectively deteriorated, the ICU team made a judgment call to hold the patient, or the floor team refused to accept the transfer. Given this fact, although it appears in this study (and in the health care system more broadly) that there are opportunities to increase efficiency and reduce nonvalue‐added time, it is not realistic (nor advisable) that such time be reduced to zero. Along this line, one must consider separately purely nonclinical functions such as room cleaning and those that include some clinical element, such as time waiting for a patient to be transferred.
Beyond the direct findings of this study, the method should be replicable in other settings and can reveal important information about health care efficiency, capacity, and flexibility. The bottlenecks identified would have been difficult to identify through administrative record review. The exact amount of time to spend on observation may vary from place to place and would depend on the expected variation over time and the level of detail sought. In general, the more common the event and the less variation, the less time needed to observe it.
This study has several limitations that should be considered in terms of interpreting the results and in seeking to reproduce the approach. First, hourly recordings may not be discrete enough for events that took less than 1 hour. To assess the degree to which this would affect our results, we reanalyzed all NCCS by subtracting 30 minutes (0.5 hour) from all recordings, which increased total CCS from 82% to 87% and decreased NCCS by the same 5 percentage points. In a related fashion, our recordings were truncated at the start and end of each 1‐week period, so we could only observe a maximum of 168 hours for any given activity and did not record how long an activity was happening before or after the recordings started or stopped, respectively. Second, each recording could only be for 1 activity per hour. Separate from the level of granularity already noted, this also limits interpretation of critical care activities that may have been simultaneous. However, because the goal of the study was not to describe the provision of critical care services, but rather the times when they were not being delivered, this does not influence our conclusions. For movement of patients, however, we missed instances of physician and nursing calling sign‐out on patients to receiving units, as these events last less than 1 hour (and in the case of surgical patients, generally do not occur as the team provides continuous coverage). The time for such events is then included in other activities. To the extent that this may influence the results, it would increase the perceived time for nonvalue‐added services, but to a limited degree, and never by more than 59 minutes. Third, the overnight hours (11:00 PM to 8:00 AM) were not directly observed, but retrospectively recorded each morning by reviewing the records and discussing the overnight events with the clinical staff. For example, if a patient was intubated at 11:00 PM and at 8:00 AM, the observer would confirm this and record that status for the intervening hours. This is unlikely to result in a substantial impact on the findings, because the overnight hours have a relative degree of stability even for unstable patients in terms of their status of needing or not needing a CCS. Fourth, we did not evaluate the appropriateness of CCS delivered (eg, how long a patient was ventilated). Our definitions for CCS and NCSS were based on Children's Hospital of Philadelphia practices, which may not be the same as those of other facilities. The categorization of CCS was objective for activities such as ventilation or continuous infusion, but was less clear for the not otherwise specified recordings, which represented patients with a complex illness or projected organ, respiratory, cardiac, or neurological failure. These patients were not receiving a specific critical care intervention, but were deemed to need to be in the PICU as opposed to a regular floor (eg, for frequent monitoring of potential respiratory failure). It would also include patients receiving combinations of therapies more efficiently delivered in the PICU. For that, the observers relied on the judgment of clinicians (primarily nurses) to determine whether the patient needed to be in the PICU or not; if no specific reason could be provided, not otherwise specified was applied. These 192 instances accounted for 2982 aggregate bed‐hours (15% of total). It is difficult to judge the direction of bias, because overestimation of need to be in the PICU may be as likely to occur as underestimation. Fifth, the very presence of the observers may have changed behavior. Knowing that they were being observed staff may have acted with greater efficiency than otherwise. We expect that such a finding would lead to less time appearing as necessary logistics or NCCS. Finally, results may not be generalizable to other hospitals or hospital settings. There are clearly important contextual factors, not only for the location but also for the duration. For example, staffing was never an issue during the 5 weeks of observation, but there are locations where an empty bed is not necessarily usable due to lack of staffing. Nonetheless, we believe the results provide a generalizable approach and methodology for other settings (and staffing could be a reason for an empty bed).
In terms of the setting, as noted, we observed one discrete 24‐bed unit, which comprises half of the total PICU. Thus, statements that the PICU was at full capacity must be interpreted in the context that additional rooms may have been available on the other side. Patients are generally admitted alternately to each unit, so the occupancies should parallel each other. We recorded the census every 4 hours for both sides from the electronic system (Sunrise Clinical Manager [SCM]). However, this only accounts for patients physically in beds, not beds held for patients in other locations. Thus, we would expect a discrepancy between direct observation and the SCM value. Through analysis of the entire pediatric intensive care unit,* that part which observed directly, and that which we did not observe directly using census data, we think it reasonable to assert that both units of the total PICU had constrained capacity during the times we directly observed and recorded such constraint on one side.
This study demonstrates the use of direct observation for inpatient settings to learn about resource utilization and identification of value‐added services. PubMed searches for the terms efficiency, flow, process redesign, and time management bring up many more references for operating rooms than for ICUs or inpatient beds. Some examples of ICU‐directed work include videography of an ICU in Australia27 and human factor analysis in ICU nursing.5 Time‐motion studies have also been conducted on clinical staff, such as physicians.28, 29
In conclusion, we found that direct observation provided important insights into the utilization of patient rooms in an important inpatient setting. Data such as these are valuable for clinical and process improvement work, as well as understanding how best to match capacity to patient need. Finally, the methodology is reproducible for other settings and would be an additional tool to measuring and improving the efficiency and value of the health system. When appropriate, this approach can also evaluate the effectiveness of process improvement, help identify and reduce waste,13 and contribute to the growing field that merges operations management with hospital administration and clinical care: in other words, evidence‐based management.30
Acknowledgements
The authors thank Paula Agosto, Patricia Hubbs, Heidi Martin, and Annette Bollig for contributions to the study design.
In comparing direct observation to the SCM count, we found perfect concordance for 110 hours (55%) during which 0 beds were available. For the other 90 hours, SCM reported 1 bed being available in 46 hours (23%), 2 beds being available in 24 hours (12%), 3 beds being available in 17 hours (9%), and 4 beds being available in 3 hours (2%)all while we directly observed 0 beds being available. Thus, cumulatively, 90% of the hours observed with no beds had an SCM report availability of 02 beds; 99% of the time that was 03 beds. Applying this rate of mismatch to the unit that we did not observe directly, SCM reported 0 beds for 46 (23%) of the 200 hours the observation unit was full; SCM reported 1 bed available in 70 hours (35%), 2 beds open in 42 hours (21%), 3 beds open in 26 hours (13%), and 4 beds open in 16 hours (8%). Cumulatively, that is 79% of the time with 02 beds and 92% at 03 beds. From this, we conclude that the combined PICU for both sides was likely functionally full at least 158 of the 200 hours that the side we observed was full (79% 200 hours) and likely had very constrained capacity during the other 42 hours.
- ,,,,.The effect of hospital occupancy on emergency department length of stay and patient disposition.Acad Emerg Med.2003;10:127–133.
- ,,,.The effect of hospital bed occupancy on throughput in the pediatric emergency department.Ann Emerg Med.2009;53:767–776.
- ,,,.A Comparison of in‐hospital mortality risk conferred by high hospital occupancy, differences in nurse staffing levels, weekend admission, and seasonal influenza.Medical Care.2010;48:224–232.
- .Intensive care unit occupancy: making room for more patients.Crit Care Med.2009;37:1794–1795.
- ,.A human factors engineering conceptual framework of nursing workload and patient safety in intensive care units.Intensive Crit Care Nurs.2005;21:284–301.
- ,,, et al.High level of burnout in intensivists: prevalence and associated factors.Am J Respir Crit Care Med.2007;175:686–692.
- ,,.Length of stay and efficiency in pediatric intensive care units.J Pediatr.1998;133:79–85.
- ,.Variability in duration of stay in pediatric intensive care units: a multiinstitutional study.J Pediatr.1996;128:35–44.
- ,.Matching Supply with Demand: An Introduction to Operations Management.New York, NY:McGraw‐Hill;2006.
- ,.Impact of workload on service time and patient safety: an econometric analysis of hospital operations.Management Science.2009;55:1486–1498.
- .OPIM 631: Operations Management.Philadelphia, PA:Wharton School, University of Pennsylvania;2008.
- ,,.From waste to value in health care.JAMA.2008;299:568–571.
- .Eliminating “waste” in health care.JAMA.2009;302:2481–2482.
- .Toyota Production System: Beyond Large‐scale Production.London, UK:Productivity Press;1995.
- ,.Interdisciplinary work flow assessment and redesign decreases operating room turnover time and allows for additional caseload.Arch Surg.2006;141:65–69.
- ,,,.Improving operating room efficiency through process redesign.Surgery.2006;140:509–514.
- ,,,.Successful strategies for improving operating room efficiency at academic institutions.Anesth Analg.1998year="1998"1998;86:896–906.
- ,,.Efficiency of the operating room suite.Am J Surg.2003;185:244–250.
- ,,, et al.Children's hospitals do not acutely respond to high occupancy.Pediatrics.2010;125:974–981.
- Institute for Healthcare Improvement. Smoothing elective surgical admissions. Available at: http://www.ihi.org/IHI/Topics/Flow/Patient Flow/EmergingContent/SmoothingElectiveSurgicalAdmissions.htm. Accessed October 24,2008.
- Boston Hospital Sees Big Impact from Smoothing Elective Schedule.OR Manager. Volume 20, no. 12,2004.
- ,.Rethinking rapid response teams.JAMA.2010;304:1375–1376.
- Litvak E, ed.Managing Patient Flow in Hospitals: Strategies and Solutions.2nd ed.Oak Brook, IL:Joint Commission Resources;2009.
- ,,,,,.Scheduled admissions and high occupancy at a children's hospital.J Hosp Med.2011;6:81–87.
- ,,, et al.Addressing inpatient crowding by smoothing occupancy at children's hospitals.J Hosp Med.2011;6:466–473.
- ,.Learning to See: Value Stream Mapping to Add Value and Eliminate MUDA.Cambridge, MA:Lean Enterprise Institute;1999.
- ,,.Reshaping ICU ward round practices using video‐reflexive ethnography.Qual Health Res.2008;18:380–390.
- ,,.How hospitalists spend their time: insights on efficiency and safety.J Hosp Med.2006;1:88–93.
- ,,, et al.Where did the day go? A time‐motion study of hospitalists.J Hosp Med2010;5:323–238.
- ,,.Improving patient care by linking evidence‐based medicine and evidence‐based management.JAMA.2007;298:673–676.
Copyright © 2011 Society of Hospital Medicine

Insurance and LOS for Children With CAP
Disparities in patterns of care and outcomes for ambulatory‐care sensitive conditions remain a persistent problem for children.19 Many studies have focused on disparities in hospitalization rates and length of stay (LOS) related to asthma, however, few studies have focused on community‐acquired pneumonia (CAP) despite the fact that pneumonia is the most common, preventable, and potentially serious infection in childhood.10 Providers, payers, and families have a common interest in minimizing hospital LOS for different reasons (eg, minimizing costs, lost wages, exposure to antibiotic‐resistant bacteria), however, this interest is balanced against the potentially greater risk of readmission and adverse outcomes if LOS is inappropriately short. To date, the relationship between insurance status and LOS for CAP remains unexplored.
As in other conditions, substantial variation exists with respect to patterns of care and outcomes for children hospitalized with CAP.11 For example, children hospitalized in rural settings have a shorter LOS for pneumonia than those hospitalized in large urban settings.12 Children from racial/ethnic minorities tend to have higher rates of CAP‐associated complications, including death.11 Decades of prior studies have documented that uninsured children are less likely than insured children to make preventive care visits and obtain prescription medications, but differences in LOS or hospitalization rates between insured and uninsured children with CAP have not been studied.6, 8, 13, 14 Though imperfect, insurance status is 1 proxy for healthcare access, and current healthcare reform efforts aim to improve healthcare access and decrease socioeconomic gradients in health by increasing the number of insured American children. Nonetheless, quantifying the relationship between insurance status on LOS for children hospitalized with CAP is a first step towards understanding the influence of ambulatory care access on hospitalization for ambulatory‐care sensitive conditions.
The purpose of this study was to investigate the influence of insurance status and type on LOS for children hospitalized with CAP. In addition, we sought to determine if there were consistent trends over time in the association between insurance status and type with LOS for children hospitalized with CAP.
METHODS
Study Design and Data Source
This retrospective cross‐sectional study used data from the 1997, 2000, 2003, and 2006 Kids' Inpatient Database (KID). The KID is part of the Healthcare Cost and Utilization Project sponsored by the Agency for Healthcare Research and Quality (AHRQ). It is the only dataset on hospital use and outcomes specifically designed to study children's use of hospital services in the United States. The KID samples pediatric discharges from all community non‐rehabilitation hospitals in states participating in the Healthcare Cost and Utilization Project, using a complex stratification system, across pediatric discharge type and hospital characteristics. Community hospitals in the KID are defined as all non‐federal, short‐term, general and other specialty hospitals, including academic medical centers, obstetrics‐gynecology, otolaryngology, orthopedic, and children's hospitals. Federal hospitals, long‐term hospitals, psychiatric hospitals, alcohol/chemical dependency treatment facilities and hospitals units within institutions are excluded. Discharge‐level weights assigned to discharges within the stratum permit calculation of national estimates. Datasets, which each contain approximately 3 million discharges (unweighted), are released every 3 years beginning with 1997. The 2006 KID is the most recently available dataset and contains hospital administrative data from 38 states, representing 88.8% of the estimated US population.15 This study was considered exempt from review by the Committees for the Protection of Human Subjects at The Children's Hospital of Philadelphia.
Study Participants
Patients 18 years of age and younger were eligible for inclusion if they required hospitalization for CAP in 1997, 2000, 2003, or 2006. Using a previously validated algorithm, patients were considered as having CAP if they met 1 of 2 criteria: 1) International Classification of Diseases, 9th Revision, Clinical Modification (ICD‐9 CM) primary diagnosis code indicating pneumonia (480‐483, 485‐486), empyema (510), or pleurisy (511.0‐1, 511.9); or 2) primary diagnosis of pneumonia‐related symptom (eg, cough, fever, tachypnea) and secondary diagnosis of pneumonia, empyema or pleurisy. Pneumonia‐related symptoms included fever, respiratory abnormality unspecified, shortness of breath, tachypnea, wheezing, cough, hemoptysis, abnormal sputum, chest pain, and abnormal chest sounds.16 Because there is no specific ICD‐9 code for nosocomial pneumonia, this previously validated approach minimized such misclassification16 (eg, a child hospitalized following traumatic injury who then develops ventilator‐associated pneumonia is likely to have trauma, rather than pneumonia or a pneumonia‐related symptom, listed as the primary diagnosis). Patients with the following comorbid conditions (identified by KID data elements and ICD‐9 CM codes) were excluded as these comorbidities are characterized by risk factors not reflective of the general pediatric population: acquired and congenital immunologic disorders, malignancy, collagen vascular disease, sickle cell disease, cystic fibrosis, organ transplant, congenital heart defects, and heart failure. Patients identified as in‐hospital births were excluded to minimize the inclusion of perinatally acquired and nosocomial infections occurring in neonates. Patients with a secondary diagnosis code indicating trauma were also excluded, as a diagnosis of pneumonia in this population likely reflects nosocomial etiology. CAP‐related complications (eg, effusion, abscess; for complete list, see Supporting Appendix A in the online version of this article) were identified using ICD‐9 CM diagnosis and procedure codes. Asthma‐related hospitalizations were identified using ICD‐9 CM diagnosis code 493 in any secondary diagnosis field.
Primary Exposure
The primary exposure was insurance type, categorized as private, public, uninsured, or other (eg, Civilian Health and Medical Program Uniform Service (CHAMPUS), worker's compensation, union‐based insurance, but definition varies by state precluding categorization as purely public or private).
Primary Outcome
The primary outcome was the hospital LOS calculated in days.
Statistical Analysis
Consistent with prior work,12 subjects were characterized by age, race, sex, the presence or absence of a pneumonia‐associated complication, discharge status (discharge from hospital vs in‐hospital death), hospital type (rural, urban non‐teaching, urban teaching non‐children's, urban teaching children's), and hospital region (Northeast, Midwest, South, West). Age groups for analysis were defined as <1 year (infant), 1 to 5 years (preschool age), 6 to 11 years (school‐age), and 12 to 18 years old (adolescent). Race was recorded as a single variable (white, black, other, and missing). Patient information for race was missing from 32% of discharges in 1997, 18% in 2000, 29% in 2003, and 26% in 2006. Patients with missing race data were included to preserve the integrity of our estimates. Categorical variables were summarized by frequencies and percents. Continuous variables were summarized by mean and standard deviation values.
All analyses accounted for the complex sampling design with the survey commands included in STATA, version 10 (College Station, TX) to produce weighted estimates. To determine the adjusted impact of patient and hospital‐level characteristics in our cohort, we constructed multivariable negative binomial regression models using all available covariates for LOS because of its rightward‐skewed distribution. The negative binomial model produced an incident rate ratio (IRR) for LOS (IRR >1 indicates that the risk factor is associated with a longer length of stay). As recommended in the AHRQ technical documentation, variance estimates for each model accounted for the clustering of data at the hospital level. To address the impact of missing race data on outcome, we constructed additional multivariable negative binomial regression models while varying the underlying assumptions about race classification. In these secondary analyses, children with race coded as missing were sequentially excluded, assumed to be white, and assumed to be black. These analyses were repeated after excluding insurance from the multivariable model.
RESULTS
The more than 10.5 million children sampled (unweighted) in KID during these 4 time periods (1997, 2000, 2003, and 2006) are representative of the more than 28.9 million children hospitalized in the United States. In each of these sample years, there were approximately 150,000 children hospitalized with pneumonia across the United States (Table 1). Of those hospitalized, 23% to 28% had a concomitant diagnosis of asthma; 6% to 8% had a pneumonia‐associated complication; and mortality was <0.01% in each sample year for patients hospitalized with pneumonia. In all years, among those with racial/ethnic data, the sample population was predominantly white boys less than 6 years old. The greatest proportion of children were hospitalized in urban non‐teaching settings, and also those children living in the southern regions of the United States.
| 1997 | 2000 | 2003 | 2006 | |
|---|---|---|---|---|
| N = 148,702 | N = 157,847 | N = 157,743 | N = 156,810 | |
| ||||
| Race | ||||
| White | 56,348 (38) | 68,643 (44) | 54,903 (35) | 56,108 (36) |
| Black | 22,864 (15) | 22,580 (14) | 17,960 (11) | 18,800 (12) |
| Other | 22,203 (15) | 38,448 (24) | 39,138 (25) | 40,803 (26) |
| Missing | 47,287 (32) | 28,175 (18) | 45,588 (29) | 41,099 (26) |
| Age category | ||||
| <1 year | 43,851 (29) | 44,470 (28) | 37,798 (24) | 37,705 (24) |
| 1 through 5 years | 75,033 (50) | 76,385 (48) | 77,530 (49) | 79,519 (51) |
| 6 through 11 years | 19,372 (13) | 21,403 (14) | 23,126 (15) | 23,494 (15) |
| >12 years | 10,446 (7) | 15,589 (9) | 19,289 (12) | 16,092 (10) |
| Hospital type | ||||
| Urban non‐teaching | 52,756 (35) | 50,718 (32) | 52,552 (34) | 50,718 (32) |
| Rural | 47,910 (32) | 41,715 (27) | 39,605 (26) | 31,947 (21) |
| Urban teaching non‐children's | 20,378 (14) | 30,981 (20) | 28,432 (18) | 30,194 (20) |
| Urban teaching children's | 27,658 (19) | 34,021 (22) | 34,454 (22) | 41,035 (27) |
| Male sex | 83,291 (56) | 8,783 (56) | 86,034 (55) | 85,508 (55) |
| Region* | ||||
| Northeast | 19,750 (13) | 26,092 (17) | 23,867 (15) | 23,832 (15) |
| Midwest | 33,053 (22) | 30,706 (19) | 35,714 (23) | 35,900 (23) |
| South | 68,958 (46) | 68,663 (44) | 65,994 (42) | 65,460 (42) |
| West | 26,741 (18) | 32,385 (21) | 32,169 (20) | 31,618 (20) |
| Asthma | 26,971 (24) | 31,746 (28) | 27,729 (24) | 26,822 (23) |
| Pneumonia‐associated complication | 8,831 (6) | 11,084 (7) | 12,005 (8) | 11,724 (7) |
| Died | 334 (0.002) | 394 (0.002) | 270 (0.002) | 193 (0.001) |
| Insurance | ||||
| Private | 65,428 (44) | 73,528 (47) | 68,720 (44) | 63,997 (41) |
| Public | 68,024 (46) | 71,698 (45) | 76,779 (49) | 80,226 (51) |
| Uninsured | 9,922 (7) | 8,336 (5) | 6,381 (4) | 6,912 (4) |
| Other | 4,964 (3) | 4,285 (3) | 5,391 (3) | 5,283 (3) |
There was little variation in the insurance status of children hospitalized with CAP between 1997 and 2006. In each of the sampled years, at least 40% of sampled children were privately insured, at least 40% were publicly insured, and approximately 5% were uninsured (Table 1). In all years, there were significant racial/ethnic disparities in insurance coverage such that whites were 4 to 6 times more likely to have private insurance than blacks, however, the large amount of missing race/ethnicity data warrant caution in interpreting this finding (Table 2; also see Supporting Information Appendix B in the online version of this article). We also found that children less than 1 year old were the most likely to be publicly insured in all years (see Supporting Appendix C in the online version of this article). There were also regional differences related to insurance coverage such that a greater proportion of children hospitalized in facilities located in the southern part of the United States were publicly insured. Notably, there were no significant differences in CAP‐associated mortality or asthma related to insurance coverage (Table 2). In 2006, CAP‐associated complications occurred in 8.5% of children with private insurance, 6.5% of children with public insurance, and 7.7% of uninsured children; the relative distribution of complications by insurance type were similar in previous years of the KID survey.
| Private | Public | Uninsured | Other Insurance | P | |
|---|---|---|---|---|---|
| |||||
| No. of children (%) | 63,997 (41) | 80,226 (51) | 6,912 (4) | 5,283 (3) | |
| Male sex | 34,639 (41) | 44,140 (52) | 3,727 (4) | 2,808 (3) | 0.092 |
| Race | |||||
| White | 30,707 (55) | 21,282 (38) | 2,241 (4) | 1,774 (3) | <0.001 |
| Black* | 5,112 (27) | 12,239 (65) | 988 (5) | 426 (3) | |
| Other | 11,033 (27) | 26,489 (65) | 2,112 (5) | 1,076 (3) | |
| Missing | 17,145 (42) | 20,216 (49) | 1,572 (4) | 2,007 (4) | |
| Age category | |||||
| <1 year | 10,788 (29) | 24,762 (65) | 1,164 (3) | 880 (3) | <0.001 |
| 1 through 5 years | 33,664 (42) | 39,531 (50) | 3,442 (4) | 2,673 (3) | |
| 6 through 11 years | 11,660 (50) | 9,684 (41) | 1,085 (5) | 1,015 (4) | |
| >12 years | 7,885 (49) | 6,249 (39) | 1,221 (8) | 714 (4) | |
| Hospital type | |||||
| Urban non‐teaching | 22,429 (44) | 24,241 (49) | 2,440 (5) | 1,555 (2) | <0.001 |
| Rural | 10,880 (34) | 18,396 (58) | 1,290 (4) | 1,109 (3) | |
| Urban teaching non‐children's | 13,130 (44) | 14,542 (48) | 1,721 (6) | 750 (2) | |
| Urban teaching children's | 16,591 (40) | 21,544 (53) | 1,417 (3) | 1,465 (4) | |
| Region | |||||
| Northeast | 12,364 (52) | 9,620 (40) | 1,466 (6) | 377 (2) | <0.001 |
| Midwest∥ | 17,891 (50) | 15,573 (43) | 1,160 (3) | 1,215 (3) | |
| South∥ | 21,479 (33) | 38,112 (58) | 3,108 (5) | 2,495 (4) | |
| West∥ | 12,263 (39) | 16,921 (44) | 1,178 (5) | 1,195 (5) | |
| Asthma | 10,829 (41) | 13,923 (52) | 1,119 (4) | 866 (3) | 0.193 |
| Pneumonia‐associated complication | 5,416 (46) | 5,206 (45) | 532 (4) | 556 (5) | <0.001 |
| Died | 66 (34) | 115 (60) | 3 (1) | 8 (5) | 0.131 |
After examining the general and demographic characteristics, we then examined mean LOS for all children with CAP in each sample year (Table 3). The mean LOS for children with CAP was 3.44 days in 1997, with marginal decreases in subsequent years to a mean LOS of 3.18 days in 2006. The distribution of LOS for children with CAP revealed that nearly 70% of children were hospitalized for fewer than 3 days, another 22% to 28% were hospitalized for less than 1 week, and only 3% were hospitalized for more than 1 week. This distribution did not change substantially between 1997 and 2006. Next, we compared mean LOS by insurance type and race/ethnicity in unadjusted analyses. In each sample year, publicly insured children hospitalized with CAP had significantly longer LOS than privately insured children (P < 0.001). Similarly, in all years excepting 1997, uninsured children hospitalized with CAP had significantly shorter LOS than privately insured children. There were also significant racial differences in LOS for children with CAP, such that black children had longer LOS than white children with CAP. However, the large amount of missing data for race/ethnicity limited the robustness of this finding, and subsequent sensitivity analyses demonstrated that there were no consistent racial/ethnic disparities in LOS (see Supporting Appendix B in the online version of this article). These sensitivity analyses for missing race data did not alter our primary finding of shorter LOS for uninsured versus publicly or privately insured children.
| 1997 | P | 2000 | P | 2003 | P | 2006 | P | |
|---|---|---|---|---|---|---|---|---|
| ||||||||
| Overall | 3.44 (0.04) | 3.35 (0.05) | 3.27 (0.05) | 3.18 (0.04) | ||||
| Insurance type | ||||||||
| Private | 3.21 (0.04) | 3.19 (0.04) | 3.09 (0.04) | 3.00 (0.03) | ||||
| Public | 3.71 (0.06) | <0.001 | 3.57 (0.06) | <0.001 | 3.44 (0.06) | <0.001 | 3.34 (0.05) | <0.001 |
| Uninsured | 3.18 (0.14) | 0.792 | 2.92 (0.07) | <0.001 | 2.80 (0.05) | <0.001 | 2.82 (0.05) | <0.001 |
| Other | 3.32 (0.11) | 0.319 | 3.55 (0.14) | 0.0134 | 3.54 (0.21) | 0.037 | 3.42 (0.13) | 0.001 |
| Race | ||||||||
| White | 3.31 (0.05) | 3.18 (0.04) | 3.19 (0.05) | 3.10 (0.04) | ||||
| Black | 3.61 (0.08) | <0.001 | 3.32 (0.07) | <0.001 | 3.36 (0.08) | <0.001 | 3.31 (0.07) | <0.001 |
| Other | 3.96 (0.11) | <0.001 | 3.81 (0.09) | <0.001 | 3.67 (0.10) | <0.001 | 3.56 (0.08) | <0.001 |
| Missing | 3.27 (0.08) | 0.645 | 3.18 (0.08) | 0.926 | 2.99 (0.06) | 0.0134 | 2.86 (0.04) | <0.001 |
After controlling for child age, race/ethnicity, gender, hospital type, transfer status, and presence of asthma or pneumonia‐associated complications, our multivariable analyses examining the relationship between insurance coverage and hospital LOS yielded the following results (Table 4). First, publicly insured children had significantly longer hospital stays than privately insured children, and uninsured children had significantly shorter hospital stays than privately insured children in all years except 1997. Second, children admitted with CAP at urban teaching children's hospitals had significantly longer LOS than those admitted to urban non‐teaching hospitals, and, in 2003, children admitted with CAP to rural hospitals had significantly shorter LOS than those admitted to urban non‐teaching hospitals. Third, children older than 1 year consistently had shorter hospital stays than infants less than 1 year old. Finally, though concomitant diagnosis of asthma did not consistently influence LOS, children who developed any complications had significantly longer LOS than those who did not. The cumulative impact of seemingly small differences in LOS is great. For example, in 2006, our model suggests that, for every 1000 children hospitalized with CAP in a given year, after adjusting for differences in sex, age, race, hospital‐type, region, transfer status, and diagnosis of asthma or complications, publicly insured children spend 90 to 130 more days in the hospital than privately insured children, whereas uninsured children spend between 40 to 90 fewer days in the hospital than privately insured children.
| 1997 | 2000 | 2003 | 2006 | |
|---|---|---|---|---|
| Variable | IRR (95% CI) | IRR (95% CI) | IRR (95% CI) | IRR (95% CI) |
| ||||
| Age category | ||||
| <1 year | ||||
| 15 years | 0.82 (0.81, 0.84) | 0.83 (0.88, 0.95) | 0.86 (0.85, 0.88) | 0.87 (0.86, 0.89) |
| 611 years | 0.91 (0.87, 0.95) | 0.91 (0.88, 0.94) | 0.93 (0.91, 0.95) | 0.93 (0.90, 0.95) |
| >12 years | 1.03 (0.99, 1.07) | 1.17 (1.11, 1.22) | 1.09 (1.06, 1.13) | 1.13 (1.09, 1.16) |
| Race | ||||
| White | ||||
| Black | 1.04 (0.99, 1.08) | 1.00 (0.95, 1.03) | 1.00 (0.98, 1.03) | 1.02 (0.98, 1.06) |
| Other | 1.09 (1.05, 1.13) | 1.11 (1.08, 1.15) | 1.09 (1.06, 1.12) | 1.08 (1.05, 1.11) |
| Missing | 1.00 (0.94, 1.06) | 1.01 (0.96, 1.06) | 0.95 (0.92, 0.99)* | 0.96 (0.93, 0.99) |
| Sex | ||||
| Female | 1.02 (0.94, 1.06) | 1.01 (0.99, 1.02) | 1.01(0.93, 100) | 1.01 (1.00, 1.02) |
| Insurance type | ||||
| Private | ||||
| Public | 1.13 (1.11, 1.16) | 1.11 (1.09, 1.14) | 1.11 (1.09, 1.13) | 1.11 (1.09, 1.13) |
| Uninsured | 1.01 (0.91, 1.11) | 0.93 (0.89, 0.96) | 0.92 (0.90, 0.96) | 0.94 (0.91, 0.96) |
| Other | 1.01 (0.96, 1.06) | 1.10 (1.03, 1.18) | 1.10 (1.02, 1.19)* | 1.07 (1.02, 1.13) |
| Hospital type | ||||
| Urban non‐teaching | ||||
| Rural | 0.98 (0.92, 1.04) | 0.96 (0.92, 1.00) | 0.97 (0.94, 1.00) | 0.97 (0.93, 1.00) |
| Urban teaching (non‐children's) | 0.99 (0.95, 1.04) | 1.06 (1.02, 1.10) | 1.06 (1.02, 1.10) | 1.03 (0.99, 1.07) |
| Urban teaching children's | 1.2 (1.14, 1.26) | 1.23 (1.16, 1.30) | 1.28 (1.21, 1.37) | 1.25 (1.19, 1.31) |
| Region | ||||
| Northeast | ||||
| Midwest | 0.93 (0.88, 0.98)* | 0.96 (0.92, 1.00) | 0.95 (0.91, 0.99)* | 0.95 (0.91, 0.99)* |
| South | 0.98 (0.94, 1.02) | 1.06 (1.02, 1.10)* | 1.04 (1.00, 1.09) | 1.03 (0.98, 1.08) |
| West | 0.97 (0.92, 1.01) | 1.22 (1.16, 1.30)* | 1.02 (0.97, 1.08) | 1.06 (1.00, 1.12)* |
| Transfer status | ||||
| Transfer | 1.35 (1.25, 1.46) | 1.39 (1.27, 1.52) | 1.31 (1.23, 1.37 ) | 1.16 (1.10, 1.23) |
| Asthma | 0.99 (0.96, 1.03) | 0.97 (0.95, 0.99) | 0.98 (0.96, 1.00) | 0.98 (0.97, 1.00)* |
| Pneumonia Complications | 0.99 (0.96, 1.03) | 0.97 (0.95, 0.99)* | 0.98 (0.96, 1.0) | 0.98 (0.97, 1.00)* |
| Any complication | 2.20 (2.07, 2.34) | 2.23 (2.07, 2.40) | 2.22 (2.22, 2.44) | 2.37 (2.27, 2.47) |
DISCUSSION
In this nationally representative sample selected over the past 10 years, we found that publicly insured children hospitalized with CAP have significantly longer LOS than those who are privately insured, and that, since 2000, uninsured children hospitalized with CAP have significantly shorter LOS than those who are privately insured. Though these observed differences are small, they are consistent across all 4 sampled years and, because CAP is one of the most common pediatric inpatient diagnoses, the cumulative impact of the observed differences on hospital LOS is great. Insurance status is often considered a proxy for access to preventive and ambulatory healthcare services or socioeconomic status. However, the underlying mechanisms relating insurance status to healthcare access, utilization, and ultimately, health outcomes are highly complex and difficult to elucidate.17 The observed variation in this study raises questions about the potential influence of insurance status on hospital discharge practices. Additional research is necessary to understand whether there are differences in processes of care (eg, performance of blood cultures or chest radiographs), quality of care, or other outcomes, such as readmissions, related to CAP inpatient management for children with different insurance coverage.
Apart from differences in hospital discharge practices, another possible explanation for uninsured children with CAP having shorter LOS is that these children have less severe disease than privately insured. This may occur if uninsured children with CAP are evaluated in the emergency department rather than the office setting, because emergency department providers may be more likely to admit children with CAP who lack a consistent access to ambulatory primary care services. Countering this alternative, prior studies have shown that uninsured groups are more likely to have greater disease severity than privately insured groups at the time of hospital admission.18, 19 In this study, we attempted to identify children with greater severity of disease using ICD‐9 codes for CAP‐associated complications. Though this is a relatively crude method that might lead to an underestimate of the total number of children with complications, we found that there were no significant differences in the prevalence of CAP‐associated complications between uninsured and insured groups in all sampled years.
On the other hand, uninsured patients may be released earlier by providers in order to reduce the amount of uncompensated care provided, or possibly because parents may urge providers to discharge their children, given their inability to pay forthcoming hospital bills and/or avoid further lost wages due to work absence.20, 21 In California, Bindman et al. demonstrated that decreasing the frequency of Medicaid recertification, and consequently increasing the likelihood of continuous insurance coverage, was associated with a decreased risk of hospitalization for ambulatory‐care sensitive conditions.5
We also found that children admitted to urban teaching children's hospitals with CAP had significantly longer LOS than those admitted to urban non‐teaching hospitals, whereas children in rural hospitals had significantly shorter LOS than those in urban non‐teaching hospitals in 2003. These findings are consistent with prior data from 1996 to1998 demonstrating that children admitted to rural hospitals in New York and Pennsylvania had significantly shorter LOS than large urban hospitals for 19 medical and 9 surgical conditions, including pneumonia.12 These findings may reflect underlying differences in between rural and urban hospital transfer practices, whereby rural hospitals may be more likely than urban hospitals to transfer children with relatively more severe illness to urban referral centers and retain children with less severe illness, leading to shorter LOS.12 Though our empiric understanding of differences in LOS between teaching and non‐teaching hospitals is currently limited, clinical experience supports the notion that there may be decreases in efficiency that occur in teaching hospitals, and are a result of the supervision required for care provided by trainees. It is also possible that, despite our exclusion of comorbid conditions, some children with complex or chronic medical conditions were included in this study. These children are often cared for at teaching hospitals, regardless of the primary cause for admission, and are more likely to have public insurance than other children, thus confounding the relationship between hospital type, insurance type and status, and LOS for children with CAP. The limitations of this dataset preclude further examination of this issue.
There are some limitations to this study. First, the KID data are cross‐sectional and causal inferences are limited. However, our results demonstrating that uninsured children hospitalized with CAP had shorter LOS than privately insured children were quite consistent in each sample year, suggesting that our results are a true association. Additionally, insurance status in KID is typically collected at admission, however, it is not possible to determine whether specific changes to insurance status that occurred during the hospitalization were applied to the data. The impact of this limitation would depend on the type of insurance obtained by the patient. If uninsured patients obtained public insurance, our study would underestimate the increased LOS for publicly insured patients, compared with privately insured patients, but have no effect on the difference in LOS between uninsured and privately insured patients. In the unlikely event that uninsured patients obtained private insurance, then our study would underestimate the difference for uninsured patients, compared with privately insured patients, biasing our current study results towards the null. Second, a substantial proportion of sampled children had missing data for race/ethnicity. To assess the impact of the missing race/ethnicity data on our results, we conducted sensitivity analyses and found that, though difficult to make any definitive conclusions about the relationship between race/ethnicity and LOS for children with CAP, there were no changes to our primary findings regarding differences in LOS between children with different insurance status and type. Third, KID does not include data about other unmeasured confounders (eg, parent income, parent education, regular source of care) that might be related to LOS, as well as a broad spectrum of pediatric outcomes. Serious consideration of expanding KID to include these variables is warranted. Fourth, the other category of insurance is not uniformly coded across states in the KID database. While some states use this category to classify public insurance options other than Medicare and Medicaid, other states include private insurance options in this group. Thus, it is possible that some patients with public insurance are misclassified as having other insurance. We would expect such misclassification to bias our findings towards the null hypothesis. Finally, we focused on the relationship between child health insurance status and CAP, only 1 ambulatory care‐sensitive condition. Additional research examining the relationship between insurance type and other ambulatory care‐sensitive conditions is warranted.
In summary, we found that, after multivariable adjustment, uninsured children hospitalized with community‐acquired pneumonia had significantly shorter LOS than privately insured children, and publicly insured children had a significantly longer hospital stay than privately insured children in these 4 nationally representative samples from 1997 to 2006. Current federal and state efforts to increase enrollment of children into insurance programs are a first step in reducing healthcare disparities. However, insurance coverage alone does not guarantee access to healthcare, thus, these efforts in isolation will likely be insufficient to achieve optimal health for the children of our country. As healthcare reform legislation is implemented, these findings provide hospitals and policy makers additional impetus to develop ways to achieve the ideal length of stay for every child; this ideal state will be achieved when clinical status and course, rather than nonclinical factors such as insurance type or provider's unease with ambulatory follow‐up, determine the duration of hospitalization for every child.
- ,,,,,.Recurrent urinary tract infections in children: risk factors and association with prophylactic antimicrobials.JAMA.2007;298:179–186.
- ,.Factors associated with variability in outcomes for children hospitalized with urinary tract infection.J Pediatr.2009;154:789–796.
- ,,,,.Intravenous immunoglobulin in children with streptococcal toxic shock syndrome.Clin Infect Dis.2009;49:1369–1376.
- ,,.Pediatric hospital adherence to the standard of care for acute gastroenteritis.Pediatrics.2009;124:e1081–e1087.
- ,,.Medicaid re‐enrollment policies and children's risk of hospitalizations for ambulatory care sensitive conditions.Med Care.2008;46:1049–1054.
- ,.Differences associated with age, transfer status, and insurance coverage in end‐of‐life hospital care for children.J Hosp Med.2008;3:376–383.
- ,,,,,.Health care for children and youth in the United States: annual report on patterns of coverage, utilization, quality, and expenditures by a county level of urban influence.Ambul Pediatr.2006;6:241–264.
- ,,.Lengths of stay and costs associated with children's hospitals.Pediatrics.2005;115:839–844.
- ,.Variation in hospital discharges for ambulatory care‐sensitive conditions among children.Pediatrics.2000;106:942–948.
- ,,,,,.Ambulatory visit rates and antibiotic prescribing for children with pneumonia, 1994–2007.Pediatrics.2011;127:411–418.
- ,,,,.Patterns of hospital‐based pediatric care across diverse ethnicities: the case of pneumonia.J Health Care Poor Underserved.2004;15:462–473.
- ,,,,.Equivalent lengths of stay of pediatric patients hospitalized in rural and nonrural hospitals.Pediatrics.2004;114:e400–e408.
- ,.Effect of Child Health Insurance Plan enrollment on the utilization of health care services by children using a public safety net system.Pediatrics.2002;110:940–945.
- ,,,,,.Relationships between welfare status, health insurance status, and health and medical care among children with asthma.Am J Public Health.2002;92:1446–1452.
- HCUP Kids' Inpatient Database (KID). Healthcare Cost and Utilization Project (HCUP), 1997, 2000, 2003, 2006. Agency for Healthcare Research and Quality. Available at: http://www.hcup‐us.ahrq.gov/kidoverview.jsp. Accessed May 17,2010.
- ,,, et al.Community‐acquired pneumonia: can it be defined with claims data?Am J Med Qual.1997;12:187–193.
- .Sicker and poorer—the consequences of being uninsured: a review of the research on the relationship between health insurance, medical care use, health, work, and income.Med Care Res Rev.2003;60:3S–75S; discussion76S–112S.
- ,,,,,.Socioeconomic variation in asthma hospitalization: excess utilization or greater need?Pediatrics.1999;103:e75.
- ,,, et al.Analysis of 23 million US hospitalizations: uninsured children have higher all‐cause in‐hospital mortality.J Public Health (Oxf).2010;32(2)236–244.
- ,.The impact of welfare reform on parents' ability to care for their children's health.Am J Public Health.1999;89:502–505.
- ,,.Knowledge of welfare reform program provisions among families of children with chronic conditions.Am J Public Health.2002;92:228–230.
Disparities in patterns of care and outcomes for ambulatory‐care sensitive conditions remain a persistent problem for children.19 Many studies have focused on disparities in hospitalization rates and length of stay (LOS) related to asthma, however, few studies have focused on community‐acquired pneumonia (CAP) despite the fact that pneumonia is the most common, preventable, and potentially serious infection in childhood.10 Providers, payers, and families have a common interest in minimizing hospital LOS for different reasons (eg, minimizing costs, lost wages, exposure to antibiotic‐resistant bacteria), however, this interest is balanced against the potentially greater risk of readmission and adverse outcomes if LOS is inappropriately short. To date, the relationship between insurance status and LOS for CAP remains unexplored.
As in other conditions, substantial variation exists with respect to patterns of care and outcomes for children hospitalized with CAP.11 For example, children hospitalized in rural settings have a shorter LOS for pneumonia than those hospitalized in large urban settings.12 Children from racial/ethnic minorities tend to have higher rates of CAP‐associated complications, including death.11 Decades of prior studies have documented that uninsured children are less likely than insured children to make preventive care visits and obtain prescription medications, but differences in LOS or hospitalization rates between insured and uninsured children with CAP have not been studied.6, 8, 13, 14 Though imperfect, insurance status is 1 proxy for healthcare access, and current healthcare reform efforts aim to improve healthcare access and decrease socioeconomic gradients in health by increasing the number of insured American children. Nonetheless, quantifying the relationship between insurance status on LOS for children hospitalized with CAP is a first step towards understanding the influence of ambulatory care access on hospitalization for ambulatory‐care sensitive conditions.
The purpose of this study was to investigate the influence of insurance status and type on LOS for children hospitalized with CAP. In addition, we sought to determine if there were consistent trends over time in the association between insurance status and type with LOS for children hospitalized with CAP.
METHODS
Study Design and Data Source
This retrospective cross‐sectional study used data from the 1997, 2000, 2003, and 2006 Kids' Inpatient Database (KID). The KID is part of the Healthcare Cost and Utilization Project sponsored by the Agency for Healthcare Research and Quality (AHRQ). It is the only dataset on hospital use and outcomes specifically designed to study children's use of hospital services in the United States. The KID samples pediatric discharges from all community non‐rehabilitation hospitals in states participating in the Healthcare Cost and Utilization Project, using a complex stratification system, across pediatric discharge type and hospital characteristics. Community hospitals in the KID are defined as all non‐federal, short‐term, general and other specialty hospitals, including academic medical centers, obstetrics‐gynecology, otolaryngology, orthopedic, and children's hospitals. Federal hospitals, long‐term hospitals, psychiatric hospitals, alcohol/chemical dependency treatment facilities and hospitals units within institutions are excluded. Discharge‐level weights assigned to discharges within the stratum permit calculation of national estimates. Datasets, which each contain approximately 3 million discharges (unweighted), are released every 3 years beginning with 1997. The 2006 KID is the most recently available dataset and contains hospital administrative data from 38 states, representing 88.8% of the estimated US population.15 This study was considered exempt from review by the Committees for the Protection of Human Subjects at The Children's Hospital of Philadelphia.
Study Participants
Patients 18 years of age and younger were eligible for inclusion if they required hospitalization for CAP in 1997, 2000, 2003, or 2006. Using a previously validated algorithm, patients were considered as having CAP if they met 1 of 2 criteria: 1) International Classification of Diseases, 9th Revision, Clinical Modification (ICD‐9 CM) primary diagnosis code indicating pneumonia (480‐483, 485‐486), empyema (510), or pleurisy (511.0‐1, 511.9); or 2) primary diagnosis of pneumonia‐related symptom (eg, cough, fever, tachypnea) and secondary diagnosis of pneumonia, empyema or pleurisy. Pneumonia‐related symptoms included fever, respiratory abnormality unspecified, shortness of breath, tachypnea, wheezing, cough, hemoptysis, abnormal sputum, chest pain, and abnormal chest sounds.16 Because there is no specific ICD‐9 code for nosocomial pneumonia, this previously validated approach minimized such misclassification16 (eg, a child hospitalized following traumatic injury who then develops ventilator‐associated pneumonia is likely to have trauma, rather than pneumonia or a pneumonia‐related symptom, listed as the primary diagnosis). Patients with the following comorbid conditions (identified by KID data elements and ICD‐9 CM codes) were excluded as these comorbidities are characterized by risk factors not reflective of the general pediatric population: acquired and congenital immunologic disorders, malignancy, collagen vascular disease, sickle cell disease, cystic fibrosis, organ transplant, congenital heart defects, and heart failure. Patients identified as in‐hospital births were excluded to minimize the inclusion of perinatally acquired and nosocomial infections occurring in neonates. Patients with a secondary diagnosis code indicating trauma were also excluded, as a diagnosis of pneumonia in this population likely reflects nosocomial etiology. CAP‐related complications (eg, effusion, abscess; for complete list, see Supporting Appendix A in the online version of this article) were identified using ICD‐9 CM diagnosis and procedure codes. Asthma‐related hospitalizations were identified using ICD‐9 CM diagnosis code 493 in any secondary diagnosis field.
Primary Exposure
The primary exposure was insurance type, categorized as private, public, uninsured, or other (eg, Civilian Health and Medical Program Uniform Service (CHAMPUS), worker's compensation, union‐based insurance, but definition varies by state precluding categorization as purely public or private).
Primary Outcome
The primary outcome was the hospital LOS calculated in days.
Statistical Analysis
Consistent with prior work,12 subjects were characterized by age, race, sex, the presence or absence of a pneumonia‐associated complication, discharge status (discharge from hospital vs in‐hospital death), hospital type (rural, urban non‐teaching, urban teaching non‐children's, urban teaching children's), and hospital region (Northeast, Midwest, South, West). Age groups for analysis were defined as <1 year (infant), 1 to 5 years (preschool age), 6 to 11 years (school‐age), and 12 to 18 years old (adolescent). Race was recorded as a single variable (white, black, other, and missing). Patient information for race was missing from 32% of discharges in 1997, 18% in 2000, 29% in 2003, and 26% in 2006. Patients with missing race data were included to preserve the integrity of our estimates. Categorical variables were summarized by frequencies and percents. Continuous variables were summarized by mean and standard deviation values.
All analyses accounted for the complex sampling design with the survey commands included in STATA, version 10 (College Station, TX) to produce weighted estimates. To determine the adjusted impact of patient and hospital‐level characteristics in our cohort, we constructed multivariable negative binomial regression models using all available covariates for LOS because of its rightward‐skewed distribution. The negative binomial model produced an incident rate ratio (IRR) for LOS (IRR >1 indicates that the risk factor is associated with a longer length of stay). As recommended in the AHRQ technical documentation, variance estimates for each model accounted for the clustering of data at the hospital level. To address the impact of missing race data on outcome, we constructed additional multivariable negative binomial regression models while varying the underlying assumptions about race classification. In these secondary analyses, children with race coded as missing were sequentially excluded, assumed to be white, and assumed to be black. These analyses were repeated after excluding insurance from the multivariable model.
RESULTS
The more than 10.5 million children sampled (unweighted) in KID during these 4 time periods (1997, 2000, 2003, and 2006) are representative of the more than 28.9 million children hospitalized in the United States. In each of these sample years, there were approximately 150,000 children hospitalized with pneumonia across the United States (Table 1). Of those hospitalized, 23% to 28% had a concomitant diagnosis of asthma; 6% to 8% had a pneumonia‐associated complication; and mortality was <0.01% in each sample year for patients hospitalized with pneumonia. In all years, among those with racial/ethnic data, the sample population was predominantly white boys less than 6 years old. The greatest proportion of children were hospitalized in urban non‐teaching settings, and also those children living in the southern regions of the United States.
| 1997 | 2000 | 2003 | 2006 | |
|---|---|---|---|---|
| N = 148,702 | N = 157,847 | N = 157,743 | N = 156,810 | |
| ||||
| Race | ||||
| White | 56,348 (38) | 68,643 (44) | 54,903 (35) | 56,108 (36) |
| Black | 22,864 (15) | 22,580 (14) | 17,960 (11) | 18,800 (12) |
| Other | 22,203 (15) | 38,448 (24) | 39,138 (25) | 40,803 (26) |
| Missing | 47,287 (32) | 28,175 (18) | 45,588 (29) | 41,099 (26) |
| Age category | ||||
| <1 year | 43,851 (29) | 44,470 (28) | 37,798 (24) | 37,705 (24) |
| 1 through 5 years | 75,033 (50) | 76,385 (48) | 77,530 (49) | 79,519 (51) |
| 6 through 11 years | 19,372 (13) | 21,403 (14) | 23,126 (15) | 23,494 (15) |
| >12 years | 10,446 (7) | 15,589 (9) | 19,289 (12) | 16,092 (10) |
| Hospital type | ||||
| Urban non‐teaching | 52,756 (35) | 50,718 (32) | 52,552 (34) | 50,718 (32) |
| Rural | 47,910 (32) | 41,715 (27) | 39,605 (26) | 31,947 (21) |
| Urban teaching non‐children's | 20,378 (14) | 30,981 (20) | 28,432 (18) | 30,194 (20) |
| Urban teaching children's | 27,658 (19) | 34,021 (22) | 34,454 (22) | 41,035 (27) |
| Male sex | 83,291 (56) | 8,783 (56) | 86,034 (55) | 85,508 (55) |
| Region* | ||||
| Northeast | 19,750 (13) | 26,092 (17) | 23,867 (15) | 23,832 (15) |
| Midwest | 33,053 (22) | 30,706 (19) | 35,714 (23) | 35,900 (23) |
| South | 68,958 (46) | 68,663 (44) | 65,994 (42) | 65,460 (42) |
| West | 26,741 (18) | 32,385 (21) | 32,169 (20) | 31,618 (20) |
| Asthma | 26,971 (24) | 31,746 (28) | 27,729 (24) | 26,822 (23) |
| Pneumonia‐associated complication | 8,831 (6) | 11,084 (7) | 12,005 (8) | 11,724 (7) |
| Died | 334 (0.002) | 394 (0.002) | 270 (0.002) | 193 (0.001) |
| Insurance | ||||
| Private | 65,428 (44) | 73,528 (47) | 68,720 (44) | 63,997 (41) |
| Public | 68,024 (46) | 71,698 (45) | 76,779 (49) | 80,226 (51) |
| Uninsured | 9,922 (7) | 8,336 (5) | 6,381 (4) | 6,912 (4) |
| Other | 4,964 (3) | 4,285 (3) | 5,391 (3) | 5,283 (3) |
There was little variation in the insurance status of children hospitalized with CAP between 1997 and 2006. In each of the sampled years, at least 40% of sampled children were privately insured, at least 40% were publicly insured, and approximately 5% were uninsured (Table 1). In all years, there were significant racial/ethnic disparities in insurance coverage such that whites were 4 to 6 times more likely to have private insurance than blacks, however, the large amount of missing race/ethnicity data warrant caution in interpreting this finding (Table 2; also see Supporting Information Appendix B in the online version of this article). We also found that children less than 1 year old were the most likely to be publicly insured in all years (see Supporting Appendix C in the online version of this article). There were also regional differences related to insurance coverage such that a greater proportion of children hospitalized in facilities located in the southern part of the United States were publicly insured. Notably, there were no significant differences in CAP‐associated mortality or asthma related to insurance coverage (Table 2). In 2006, CAP‐associated complications occurred in 8.5% of children with private insurance, 6.5% of children with public insurance, and 7.7% of uninsured children; the relative distribution of complications by insurance type were similar in previous years of the KID survey.
| Private | Public | Uninsured | Other Insurance | P | |
|---|---|---|---|---|---|
| |||||
| No. of children (%) | 63,997 (41) | 80,226 (51) | 6,912 (4) | 5,283 (3) | |
| Male sex | 34,639 (41) | 44,140 (52) | 3,727 (4) | 2,808 (3) | 0.092 |
| Race | |||||
| White | 30,707 (55) | 21,282 (38) | 2,241 (4) | 1,774 (3) | <0.001 |
| Black* | 5,112 (27) | 12,239 (65) | 988 (5) | 426 (3) | |
| Other | 11,033 (27) | 26,489 (65) | 2,112 (5) | 1,076 (3) | |
| Missing | 17,145 (42) | 20,216 (49) | 1,572 (4) | 2,007 (4) | |
| Age category | |||||
| <1 year | 10,788 (29) | 24,762 (65) | 1,164 (3) | 880 (3) | <0.001 |
| 1 through 5 years | 33,664 (42) | 39,531 (50) | 3,442 (4) | 2,673 (3) | |
| 6 through 11 years | 11,660 (50) | 9,684 (41) | 1,085 (5) | 1,015 (4) | |
| >12 years | 7,885 (49) | 6,249 (39) | 1,221 (8) | 714 (4) | |
| Hospital type | |||||
| Urban non‐teaching | 22,429 (44) | 24,241 (49) | 2,440 (5) | 1,555 (2) | <0.001 |
| Rural | 10,880 (34) | 18,396 (58) | 1,290 (4) | 1,109 (3) | |
| Urban teaching non‐children's | 13,130 (44) | 14,542 (48) | 1,721 (6) | 750 (2) | |
| Urban teaching children's | 16,591 (40) | 21,544 (53) | 1,417 (3) | 1,465 (4) | |
| Region | |||||
| Northeast | 12,364 (52) | 9,620 (40) | 1,466 (6) | 377 (2) | <0.001 |
| Midwest∥ | 17,891 (50) | 15,573 (43) | 1,160 (3) | 1,215 (3) | |
| South∥ | 21,479 (33) | 38,112 (58) | 3,108 (5) | 2,495 (4) | |
| West∥ | 12,263 (39) | 16,921 (44) | 1,178 (5) | 1,195 (5) | |
| Asthma | 10,829 (41) | 13,923 (52) | 1,119 (4) | 866 (3) | 0.193 |
| Pneumonia‐associated complication | 5,416 (46) | 5,206 (45) | 532 (4) | 556 (5) | <0.001 |
| Died | 66 (34) | 115 (60) | 3 (1) | 8 (5) | 0.131 |
After examining the general and demographic characteristics, we then examined mean LOS for all children with CAP in each sample year (Table 3). The mean LOS for children with CAP was 3.44 days in 1997, with marginal decreases in subsequent years to a mean LOS of 3.18 days in 2006. The distribution of LOS for children with CAP revealed that nearly 70% of children were hospitalized for fewer than 3 days, another 22% to 28% were hospitalized for less than 1 week, and only 3% were hospitalized for more than 1 week. This distribution did not change substantially between 1997 and 2006. Next, we compared mean LOS by insurance type and race/ethnicity in unadjusted analyses. In each sample year, publicly insured children hospitalized with CAP had significantly longer LOS than privately insured children (P < 0.001). Similarly, in all years excepting 1997, uninsured children hospitalized with CAP had significantly shorter LOS than privately insured children. There were also significant racial differences in LOS for children with CAP, such that black children had longer LOS than white children with CAP. However, the large amount of missing data for race/ethnicity limited the robustness of this finding, and subsequent sensitivity analyses demonstrated that there were no consistent racial/ethnic disparities in LOS (see Supporting Appendix B in the online version of this article). These sensitivity analyses for missing race data did not alter our primary finding of shorter LOS for uninsured versus publicly or privately insured children.
| 1997 | P | 2000 | P | 2003 | P | 2006 | P | |
|---|---|---|---|---|---|---|---|---|
| ||||||||
| Overall | 3.44 (0.04) | 3.35 (0.05) | 3.27 (0.05) | 3.18 (0.04) | ||||
| Insurance type | ||||||||
| Private | 3.21 (0.04) | 3.19 (0.04) | 3.09 (0.04) | 3.00 (0.03) | ||||
| Public | 3.71 (0.06) | <0.001 | 3.57 (0.06) | <0.001 | 3.44 (0.06) | <0.001 | 3.34 (0.05) | <0.001 |
| Uninsured | 3.18 (0.14) | 0.792 | 2.92 (0.07) | <0.001 | 2.80 (0.05) | <0.001 | 2.82 (0.05) | <0.001 |
| Other | 3.32 (0.11) | 0.319 | 3.55 (0.14) | 0.0134 | 3.54 (0.21) | 0.037 | 3.42 (0.13) | 0.001 |
| Race | ||||||||
| White | 3.31 (0.05) | 3.18 (0.04) | 3.19 (0.05) | 3.10 (0.04) | ||||
| Black | 3.61 (0.08) | <0.001 | 3.32 (0.07) | <0.001 | 3.36 (0.08) | <0.001 | 3.31 (0.07) | <0.001 |
| Other | 3.96 (0.11) | <0.001 | 3.81 (0.09) | <0.001 | 3.67 (0.10) | <0.001 | 3.56 (0.08) | <0.001 |
| Missing | 3.27 (0.08) | 0.645 | 3.18 (0.08) | 0.926 | 2.99 (0.06) | 0.0134 | 2.86 (0.04) | <0.001 |
After controlling for child age, race/ethnicity, gender, hospital type, transfer status, and presence of asthma or pneumonia‐associated complications, our multivariable analyses examining the relationship between insurance coverage and hospital LOS yielded the following results (Table 4). First, publicly insured children had significantly longer hospital stays than privately insured children, and uninsured children had significantly shorter hospital stays than privately insured children in all years except 1997. Second, children admitted with CAP at urban teaching children's hospitals had significantly longer LOS than those admitted to urban non‐teaching hospitals, and, in 2003, children admitted with CAP to rural hospitals had significantly shorter LOS than those admitted to urban non‐teaching hospitals. Third, children older than 1 year consistently had shorter hospital stays than infants less than 1 year old. Finally, though concomitant diagnosis of asthma did not consistently influence LOS, children who developed any complications had significantly longer LOS than those who did not. The cumulative impact of seemingly small differences in LOS is great. For example, in 2006, our model suggests that, for every 1000 children hospitalized with CAP in a given year, after adjusting for differences in sex, age, race, hospital‐type, region, transfer status, and diagnosis of asthma or complications, publicly insured children spend 90 to 130 more days in the hospital than privately insured children, whereas uninsured children spend between 40 to 90 fewer days in the hospital than privately insured children.
| 1997 | 2000 | 2003 | 2006 | |
|---|---|---|---|---|
| Variable | IRR (95% CI) | IRR (95% CI) | IRR (95% CI) | IRR (95% CI) |
| ||||
| Age category | ||||
| <1 year | ||||
| 15 years | 0.82 (0.81, 0.84) | 0.83 (0.88, 0.95) | 0.86 (0.85, 0.88) | 0.87 (0.86, 0.89) |
| 611 years | 0.91 (0.87, 0.95) | 0.91 (0.88, 0.94) | 0.93 (0.91, 0.95) | 0.93 (0.90, 0.95) |
| >12 years | 1.03 (0.99, 1.07) | 1.17 (1.11, 1.22) | 1.09 (1.06, 1.13) | 1.13 (1.09, 1.16) |
| Race | ||||
| White | ||||
| Black | 1.04 (0.99, 1.08) | 1.00 (0.95, 1.03) | 1.00 (0.98, 1.03) | 1.02 (0.98, 1.06) |
| Other | 1.09 (1.05, 1.13) | 1.11 (1.08, 1.15) | 1.09 (1.06, 1.12) | 1.08 (1.05, 1.11) |
| Missing | 1.00 (0.94, 1.06) | 1.01 (0.96, 1.06) | 0.95 (0.92, 0.99)* | 0.96 (0.93, 0.99) |
| Sex | ||||
| Female | 1.02 (0.94, 1.06) | 1.01 (0.99, 1.02) | 1.01(0.93, 100) | 1.01 (1.00, 1.02) |
| Insurance type | ||||
| Private | ||||
| Public | 1.13 (1.11, 1.16) | 1.11 (1.09, 1.14) | 1.11 (1.09, 1.13) | 1.11 (1.09, 1.13) |
| Uninsured | 1.01 (0.91, 1.11) | 0.93 (0.89, 0.96) | 0.92 (0.90, 0.96) | 0.94 (0.91, 0.96) |
| Other | 1.01 (0.96, 1.06) | 1.10 (1.03, 1.18) | 1.10 (1.02, 1.19)* | 1.07 (1.02, 1.13) |
| Hospital type | ||||
| Urban non‐teaching | ||||
| Rural | 0.98 (0.92, 1.04) | 0.96 (0.92, 1.00) | 0.97 (0.94, 1.00) | 0.97 (0.93, 1.00) |
| Urban teaching (non‐children's) | 0.99 (0.95, 1.04) | 1.06 (1.02, 1.10) | 1.06 (1.02, 1.10) | 1.03 (0.99, 1.07) |
| Urban teaching children's | 1.2 (1.14, 1.26) | 1.23 (1.16, 1.30) | 1.28 (1.21, 1.37) | 1.25 (1.19, 1.31) |
| Region | ||||
| Northeast | ||||
| Midwest | 0.93 (0.88, 0.98)* | 0.96 (0.92, 1.00) | 0.95 (0.91, 0.99)* | 0.95 (0.91, 0.99)* |
| South | 0.98 (0.94, 1.02) | 1.06 (1.02, 1.10)* | 1.04 (1.00, 1.09) | 1.03 (0.98, 1.08) |
| West | 0.97 (0.92, 1.01) | 1.22 (1.16, 1.30)* | 1.02 (0.97, 1.08) | 1.06 (1.00, 1.12)* |
| Transfer status | ||||
| Transfer | 1.35 (1.25, 1.46) | 1.39 (1.27, 1.52) | 1.31 (1.23, 1.37 ) | 1.16 (1.10, 1.23) |
| Asthma | 0.99 (0.96, 1.03) | 0.97 (0.95, 0.99) | 0.98 (0.96, 1.00) | 0.98 (0.97, 1.00)* |
| Pneumonia Complications | 0.99 (0.96, 1.03) | 0.97 (0.95, 0.99)* | 0.98 (0.96, 1.0) | 0.98 (0.97, 1.00)* |
| Any complication | 2.20 (2.07, 2.34) | 2.23 (2.07, 2.40) | 2.22 (2.22, 2.44) | 2.37 (2.27, 2.47) |
DISCUSSION
In this nationally representative sample selected over the past 10 years, we found that publicly insured children hospitalized with CAP have significantly longer LOS than those who are privately insured, and that, since 2000, uninsured children hospitalized with CAP have significantly shorter LOS than those who are privately insured. Though these observed differences are small, they are consistent across all 4 sampled years and, because CAP is one of the most common pediatric inpatient diagnoses, the cumulative impact of the observed differences on hospital LOS is great. Insurance status is often considered a proxy for access to preventive and ambulatory healthcare services or socioeconomic status. However, the underlying mechanisms relating insurance status to healthcare access, utilization, and ultimately, health outcomes are highly complex and difficult to elucidate.17 The observed variation in this study raises questions about the potential influence of insurance status on hospital discharge practices. Additional research is necessary to understand whether there are differences in processes of care (eg, performance of blood cultures or chest radiographs), quality of care, or other outcomes, such as readmissions, related to CAP inpatient management for children with different insurance coverage.
Apart from differences in hospital discharge practices, another possible explanation for uninsured children with CAP having shorter LOS is that these children have less severe disease than privately insured. This may occur if uninsured children with CAP are evaluated in the emergency department rather than the office setting, because emergency department providers may be more likely to admit children with CAP who lack a consistent access to ambulatory primary care services. Countering this alternative, prior studies have shown that uninsured groups are more likely to have greater disease severity than privately insured groups at the time of hospital admission.18, 19 In this study, we attempted to identify children with greater severity of disease using ICD‐9 codes for CAP‐associated complications. Though this is a relatively crude method that might lead to an underestimate of the total number of children with complications, we found that there were no significant differences in the prevalence of CAP‐associated complications between uninsured and insured groups in all sampled years.
On the other hand, uninsured patients may be released earlier by providers in order to reduce the amount of uncompensated care provided, or possibly because parents may urge providers to discharge their children, given their inability to pay forthcoming hospital bills and/or avoid further lost wages due to work absence.20, 21 In California, Bindman et al. demonstrated that decreasing the frequency of Medicaid recertification, and consequently increasing the likelihood of continuous insurance coverage, was associated with a decreased risk of hospitalization for ambulatory‐care sensitive conditions.5
We also found that children admitted to urban teaching children's hospitals with CAP had significantly longer LOS than those admitted to urban non‐teaching hospitals, whereas children in rural hospitals had significantly shorter LOS than those in urban non‐teaching hospitals in 2003. These findings are consistent with prior data from 1996 to1998 demonstrating that children admitted to rural hospitals in New York and Pennsylvania had significantly shorter LOS than large urban hospitals for 19 medical and 9 surgical conditions, including pneumonia.12 These findings may reflect underlying differences in between rural and urban hospital transfer practices, whereby rural hospitals may be more likely than urban hospitals to transfer children with relatively more severe illness to urban referral centers and retain children with less severe illness, leading to shorter LOS.12 Though our empiric understanding of differences in LOS between teaching and non‐teaching hospitals is currently limited, clinical experience supports the notion that there may be decreases in efficiency that occur in teaching hospitals, and are a result of the supervision required for care provided by trainees. It is also possible that, despite our exclusion of comorbid conditions, some children with complex or chronic medical conditions were included in this study. These children are often cared for at teaching hospitals, regardless of the primary cause for admission, and are more likely to have public insurance than other children, thus confounding the relationship between hospital type, insurance type and status, and LOS for children with CAP. The limitations of this dataset preclude further examination of this issue.
There are some limitations to this study. First, the KID data are cross‐sectional and causal inferences are limited. However, our results demonstrating that uninsured children hospitalized with CAP had shorter LOS than privately insured children were quite consistent in each sample year, suggesting that our results are a true association. Additionally, insurance status in KID is typically collected at admission, however, it is not possible to determine whether specific changes to insurance status that occurred during the hospitalization were applied to the data. The impact of this limitation would depend on the type of insurance obtained by the patient. If uninsured patients obtained public insurance, our study would underestimate the increased LOS for publicly insured patients, compared with privately insured patients, but have no effect on the difference in LOS between uninsured and privately insured patients. In the unlikely event that uninsured patients obtained private insurance, then our study would underestimate the difference for uninsured patients, compared with privately insured patients, biasing our current study results towards the null. Second, a substantial proportion of sampled children had missing data for race/ethnicity. To assess the impact of the missing race/ethnicity data on our results, we conducted sensitivity analyses and found that, though difficult to make any definitive conclusions about the relationship between race/ethnicity and LOS for children with CAP, there were no changes to our primary findings regarding differences in LOS between children with different insurance status and type. Third, KID does not include data about other unmeasured confounders (eg, parent income, parent education, regular source of care) that might be related to LOS, as well as a broad spectrum of pediatric outcomes. Serious consideration of expanding KID to include these variables is warranted. Fourth, the other category of insurance is not uniformly coded across states in the KID database. While some states use this category to classify public insurance options other than Medicare and Medicaid, other states include private insurance options in this group. Thus, it is possible that some patients with public insurance are misclassified as having other insurance. We would expect such misclassification to bias our findings towards the null hypothesis. Finally, we focused on the relationship between child health insurance status and CAP, only 1 ambulatory care‐sensitive condition. Additional research examining the relationship between insurance type and other ambulatory care‐sensitive conditions is warranted.
In summary, we found that, after multivariable adjustment, uninsured children hospitalized with community‐acquired pneumonia had significantly shorter LOS than privately insured children, and publicly insured children had a significantly longer hospital stay than privately insured children in these 4 nationally representative samples from 1997 to 2006. Current federal and state efforts to increase enrollment of children into insurance programs are a first step in reducing healthcare disparities. However, insurance coverage alone does not guarantee access to healthcare, thus, these efforts in isolation will likely be insufficient to achieve optimal health for the children of our country. As healthcare reform legislation is implemented, these findings provide hospitals and policy makers additional impetus to develop ways to achieve the ideal length of stay for every child; this ideal state will be achieved when clinical status and course, rather than nonclinical factors such as insurance type or provider's unease with ambulatory follow‐up, determine the duration of hospitalization for every child.
- ,,,,,.Recurrent urinary tract infections in children: risk factors and association with prophylactic antimicrobials.JAMA.2007;298:179–186.
- ,.Factors associated with variability in outcomes for children hospitalized with urinary tract infection.J Pediatr.2009;154:789–796.
- ,,,,.Intravenous immunoglobulin in children with streptococcal toxic shock syndrome.Clin Infect Dis.2009;49:1369–1376.
- ,,.Pediatric hospital adherence to the standard of care for acute gastroenteritis.Pediatrics.2009;124:e1081–e1087.
- ,,.Medicaid re‐enrollment policies and children's risk of hospitalizations for ambulatory care sensitive conditions.Med Care.2008;46:1049–1054.
- ,.Differences associated with age, transfer status, and insurance coverage in end‐of‐life hospital care for children.J Hosp Med.2008;3:376–383.
- ,,,,,.Health care for children and youth in the United States: annual report on patterns of coverage, utilization, quality, and expenditures by a county level of urban influence.Ambul Pediatr.2006;6:241–264.
- ,,.Lengths of stay and costs associated with children's hospitals.Pediatrics.2005;115:839–844.
- ,.Variation in hospital discharges for ambulatory care‐sensitive conditions among children.Pediatrics.2000;106:942–948.
- ,,,,,.Ambulatory visit rates and antibiotic prescribing for children with pneumonia, 1994–2007.Pediatrics.2011;127:411–418.
- ,,,,.Patterns of hospital‐based pediatric care across diverse ethnicities: the case of pneumonia.J Health Care Poor Underserved.2004;15:462–473.
- ,,,,.Equivalent lengths of stay of pediatric patients hospitalized in rural and nonrural hospitals.Pediatrics.2004;114:e400–e408.
- ,.Effect of Child Health Insurance Plan enrollment on the utilization of health care services by children using a public safety net system.Pediatrics.2002;110:940–945.
- ,,,,,.Relationships between welfare status, health insurance status, and health and medical care among children with asthma.Am J Public Health.2002;92:1446–1452.
- HCUP Kids' Inpatient Database (KID). Healthcare Cost and Utilization Project (HCUP), 1997, 2000, 2003, 2006. Agency for Healthcare Research and Quality. Available at: http://www.hcup‐us.ahrq.gov/kidoverview.jsp. Accessed May 17,2010.
- ,,, et al.Community‐acquired pneumonia: can it be defined with claims data?Am J Med Qual.1997;12:187–193.
- .Sicker and poorer—the consequences of being uninsured: a review of the research on the relationship between health insurance, medical care use, health, work, and income.Med Care Res Rev.2003;60:3S–75S; discussion76S–112S.
- ,,,,,.Socioeconomic variation in asthma hospitalization: excess utilization or greater need?Pediatrics.1999;103:e75.
- ,,, et al.Analysis of 23 million US hospitalizations: uninsured children have higher all‐cause in‐hospital mortality.J Public Health (Oxf).2010;32(2)236–244.
- ,.The impact of welfare reform on parents' ability to care for their children's health.Am J Public Health.1999;89:502–505.
- ,,.Knowledge of welfare reform program provisions among families of children with chronic conditions.Am J Public Health.2002;92:228–230.
Copyright © 2011 Society of Hospital Medicine
Addressing Inpatient Crowding
High levels of hospital occupancy are associated with compromises to quality of care and access (often referred to as crowding), 18 while low occupancy may be inefficient and also impact quality. 9, 10 Despite this, hospitals typically have uneven occupancy. Although some demand for services is driven by factors beyond the control of a hospital (eg, seasonal variation in viral illness), approximately 15%30% of admissions to children's hospitals are scheduled from days to months in advance, with usual arrivals on weekdays. 1114 For example, of the 3.4 million elective admissions in the 2006 Healthcare Cost and Utilization Project Kids Inpatient Database (HCUP KID), only 13% were admitted on weekends. 14 Combined with short length of stay (LOS) for such patients, this leads to higher midweek and lower weekend occupancy. 12
Hospitals respond to crowding in a number of ways, but often focus on reducing LOS to make room for new patients. 11, 15, 16 For hospitals that are relatively efficient in terms of LOS, efforts to reduce it may not increase functional capacity adequately. In children's hospitals, median lengths of stay are 2 to 3 days, and one‐third of hospitalizations are 1 day or less. 17 Thus, even 10%20% reductions in LOS trims hours, not days, from typical stays. Practical barriers (eg, reluctance to discharge in the middle of the night, or family preferences and work schedules) and undesired outcomes (eg, increased hospital re‐visits) are additional pitfalls encountered by relying on throughput enhancement alone.
Managing scheduled admissions through smoothing is an alternative strategy to reduce variability and high occupancy. 6, 12, 1820 The concept is to proactively control the entry of patients, when possible, to achieve more even levels of occupancy, instead of the peaks and troughs commonly encountered. Nonetheless, it is not a widely used approach. 18, 20, 21 We hypothesized that children's hospitals had substantial unused capacity that could be used to smooth occupancy, which would reduce weekday crowding. While it is obvious that smoothing will reduce peaks to average levels (and also raise troughs), we sought to quantify just how large this difference wasand thereby quantify the potential of smoothing to reduce inpatient crowding (or, conversely, expose more patients to high levels of occupancy). Is there enough variation to justify smoothing, and, if a hospital does smooth, what is the expected result? If the number of patients removed from exposure to high occupancy is not substantial, other means to address inpatient crowding might be of more value. Our aims were to quantify the difference in weekday versus weekend occupancy, report on mathematical feasibility of such an approach, and determine the difference in number of patients exposed to various levels of high occupancy.
Methods
Data Source
This retrospective study was conducted with resource‐utilization data from 39 freestanding, tertiary‐care children's hospitals in the Pediatric Health Information System (PHIS). Participating hospitals are located in noncompeting markets of 23 states, plus the District of Columbia, and affiliated with the Child Health Corporation of America (CHCA, Shawnee Mission, KS). They account for 80% of freestanding, and 20% of all general, tertiary‐care children's hospitals. Data quality and reliability are assured through joint ongoing, systematic monitoring. The Children's Hospital of Philadelphia Committees for the Protection of Human Subjects approved the protocol with a waiver of informed consent.
Patients
Patients admitted January 1December 31, 2007 were eligible for inclusion. Due to variation in the presence of birthing, neonatal intensive care, and behavioral health units across hospitals, these beds and associated patients were excluded. Inpatients enter hospitals either as scheduled (often referred to as elective) or unscheduled (emergent or urgent) admissions. Because PHIS does not include these data, KID was used to standardize the PHIS data for proportion of scheduled admissions. 22 (KID is a healthcare database of 23 million pediatric inpatient discharges developed through federalstateindustry partnership, and sponsored by the Agency for Healthcare Research and Quality [AHRQ].) Each encounter in KID includes a principal International Classification of Diseases, 9th revision (ICD‐9) discharge diagnosis code, and is designated by the hospital as elective (ranging from chemotherapy to tonsillectomy) or not elective. Because admissions, rather than diagnoses, are scheduled, a proportion of patients with each primary diagnosis in KID are scheduled (eg, 28% of patients with a primary diagnosis of esophageal reflux). Proportions in KID were matched to principal diagnoses in PHIS.
Definitions
The census was the number of patients registered as inpatients (including those physically in the emergency department [ED] from time of ED arrival)whether observation or inpatient statusat midnight, the conclusion of the day. Hospital capacity was set using CHCA data (and confirmed by each hospital's administrative personnel) as the number of licensed in‐service beds available for patients in 2007; we assumed beds were staffed and capacity fixed for the year. Occupancy was calculated by dividing census by capacity. Maximum occupancy in a week referred to the highest occupancy level achieved in a seven‐day period (MondaySunday). We analyzed a set of thresholds for high‐occupancy (85%, 90%, 95%, and 100%), because there is no consistent definition for when hospitals are at high occupancy or when crowding occurs, though crowding has been described as starting at 85% occupancy. 2325
Analysis
The hospital was the unit of analysis. We report hospital characteristics, including capacity, number of discharges, and census region, and annual standardized length of stay ratio (SLOSR) as observed‐to‐expected LOS.
Smoothing Technique
A retrospective smoothing algorithm set each hospital's daily occupancy during a week to that hospital's mean occupancy for the week; effectively spreading the week's volume of patients evenly across the days of the week. While inter‐week and inter‐month smoothing were considered, intra‐week smoothing was deemed more practical for the largest number of patients, as it would not mean delaying care by more than one week. In the case of a planned treatment course (eg, chemotherapy), only intra‐week smoothing would maintain the necessary scheduled intervals of treatment.
Mathematical Feasibility
To approximate the number of patient admissions that would require different scheduling during a particular week to achieve smoothed weekly occupancy, we determined the total number of patient‐days in the week that required different scheduling and divided by the average LOS for the week. We then divided the number of admissions‐to‐move by total weekly admissions to compute the percentage at each hospital across 52 weeks of the year.
Measuring the Impact of Smoothing
We focused on the frequency and severity of high occupancy and the number of patients exposed to it. This framework led to 4 measures that assess the opportunity and effect of smoothing:
Difference in hospital weekdayweekend occupancy: Equal to 12‐month median of difference between mean weekday occupancy and mean weekend occupancy for each hospital‐week.
Difference in hospital maximummean occupancy: Equal to median of difference between maximum one‐day occupancy and weekly mean (smoothed) occupancy for each hospital‐week. A regression line was derived from the data for the 39 hospitals to report expected reduction in peak occupancy based on the magnitude of the difference between weekday and weekend occupancy.
Difference in number of hospitals exposed to above‐threshold occupancy: Equal to difference, pre‐ and post‐smoothing, in number of hospitals facing high‐occupancy conditions on an average of at least one weekday midnight per week during the year at different occupancy thresholds.
Difference in number of patients exposed to above‐threshold occupancy: Equal to difference, pre‐ and post‐smoothing, in number of patients exposed to hospital midnight occupancy at the thresholds. We utilized patient‐days for the calculation to avoid double‐counting, and divided this by average LOS, in order to determine the number of patients who would no longer be exposed to over‐threshold occupancy after smoothing, while also adjusting for patients newly exposed to over‐threshold occupancy levels.
All analyses were performed separately for each hospital for the entire year and then for winter (DecemberMarch), the period during which most crowding occurred. Analyses were performed using SAS (version 9.2, SAS Institute, Inc, Cary, NC); P values <0.05 were considered statistically significant.
Results
The characteristics of the 39 hospitals are provided in Table 1. Based on standardization with KID, 23.6% of PHIS admissions were scheduled (range: 18.1%35.8%) or a median of 81.5 scheduled admissions per week per hospital; 26.6% of weekday admissions were scheduled versus 16.1% for weekends. Overall, 12.4% of scheduled admissions entered on weekends. For all patients, median LOS was three days (interquartile range [IQR]: twofive days), but median LOS for scheduled admissions was two days (IQR: onefour days). The median LOS and IQR were the same by day of admission for all days of the week. Most hospitals had an overall SLOSR close to one (median: 0.9, IQR: 0.91.1). Overall, hospital mean midnight occupancy ranged from 70.9% to 108.1% on weekdays and 65.7% to 94.9% on weekends. Uniformly, weekday occupancy exceeded weekend occupancy, with a median difference of 8.2% points (IQR: 7.2%9.5% points). There was a wide range of median hospital weekdayweekend occupancy differences across hospitals (Figure 1). The overall difference was less in winter (median difference: 7.7% points; IQR: 6.3%8.8% points) than in summer (median difference: 8.6% points; IQR: 7.4%9.8% points (Wilcoxon Sign Rank test, P < 0.001). Thirty‐five hospitals (89.7%) exceeded the 85% occupancy threshold and 29 (74.4%) exceeded the 95% occupancy threshold on at least 20% of weekdays (Table 2). Across all the hospitals, the median difference in weekly maximum and weekly mean occupancy was 6.6% points (IQR: 6.2%7.4% points) (Figure 2).
| Characteristics | No. (%) |
|---|---|
| |
| Licensed in‐service beds | n = 39 hospitals |
| <200 beds | 6 (15.4) |
| 200249 beds | 10 (25.6) |
| 250300 beds | 14 (35.9) |
| >300 beds | 9 (23.1) |
| No. of discharges | |
| <10,000 | 5 (12.8) |
| 10,00013,999 | 14 (35.9) |
| 14,00017,999 | 11 (28.2) |
| >18,000 | 9 (23.1) |
| Census region | |
| West | 9 (23.1) |
| Midwest | 11 (28.2) |
| Northeast | 6 (15.4) |
| South | 13 (33.3) |
| Admissions | n = 590,352 admissions |
| Medical scheduled admissions* | 79,683 |
| Surgical scheduled admissions* | 59,640 |
| Total scheduled admissions* (% of all admissions) | 139,323 (23.6) |
| Weekend medical scheduled admissions* (% of all medical scheduled admissions) | 13,546 (17.0) |
| Weekend surgical scheduled admissions* (% of all surgical scheduled admissions) | 3,757 (6.3) |
| Weekend total scheduled admissions* (% of total scheduled admissions) | 17,276 (12.4) |

| Entire Year | >85% | Occupancy Threshold | >95% | >100% |
|---|---|---|---|---|
| >90% | ||||
| ||||
| No. of hospitals (n = 39) with mean weekday occupancy above threshold | ||||
| Before smoothing (current state) | 33 | 25 | 14 | 6 |
| After smoothing | 32 | 22 | 10 | 1 |
| No. of hospitals (n = 39) above threshold 20% of weekdays | ||||
| Before smoothing (current state) | 35 | 34 | 29 | 14 |
| After smoothing | 35 | 32 | 21 | 9 |
| Median (IQR) no. of patient‐days per hospital not exposed to occupancy above threshold by smoothing | 3,071 | 281 | 3236 | 3281 |
| (5,552, 919) | (5,288, 3,103) | (0, 7,083) | (962, 8,517) | |
| Median (IQR) no. of patients per hospital not exposed to occupancy above threshold by smoothing | 596 | 50 | 630 | 804 |
| (1,190, 226) | (916, 752) | (0, 1,492) | (231, 2,195) | |
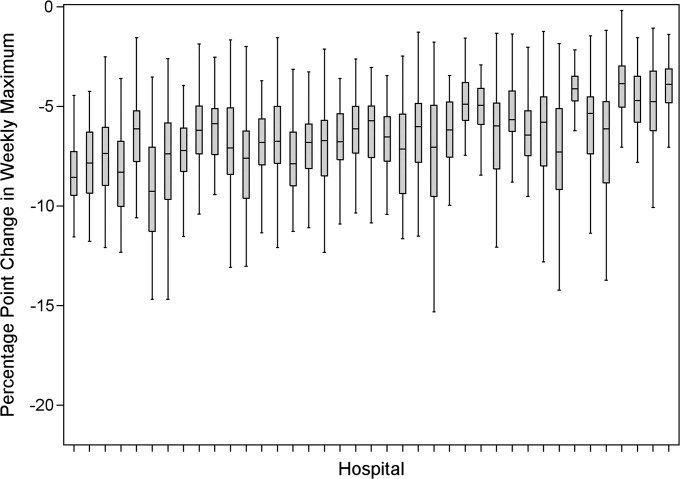
Smoothing reduced the number of hospitals at each occupancy threshold, except 85% (Table 2). As a linear relationship, the reduction in weekday peak occupancy (y) based on a hospital's median difference in weekly maximum and weekly mean occupancy (x) was y = 2.69 + 0.48x. Thus, a hospital with a 10% point difference between weekday and weekend occupancy could reduce weekday peak by 7.5% points.
Smoothing increased the number of patients exposed to the lower thresholds (85% and 90%), but decreased the number of patients exposed to >95% occupancy (Table 2). For example, smoothing at the 95% threshold resulted in 630 fewer patients per hospital exposed to that threshold. If all 39 hospitals had within‐week smoothing, a net of 39,607 patients would have been protected from exposure to >95% occupancy and a net of 50,079 patients from 100% occupancy.
To demonstrate the varied effects of smoothing, Table 3 and Figure 3 present representative categories of response to smoothing depending on pre‐smoothing patterns. While not all hospitals decreased occupancy to below thresholds after smoothing (Types B and D), the overall occupancy was reduced and fewer patients were exposed to extreme levels of high occupancy (eg, >100%).
| Category | Before Smoothing Hospital Description | After Smoothing Hospital Description | No. of Hospitals at 85% Threshold (n = 39) | No. of Hospitals at 95% Threshold (n = 39) |
|---|---|---|---|---|
| ||||
| Type A | Weekdays above threshold | All days below threshold, resulting in net decrease in patients exposed to occupancies above threshold | 3 | 1 |
| Weekends below threshold | ||||
| Type B | Weekdays above threshold | All days above threshold, resulting in net increase in patients exposed to occupancies above threshold | 12 | 18 |
| Weekends below threshold | ||||
| Type C | All days of week below threshold | All days of week below threshold | 6 | 19 |
| Type D | All days of week above threshold | All days of week above threshold, resulting in net decrease in patients exposed to extreme high occupancy | 18 | 1 |
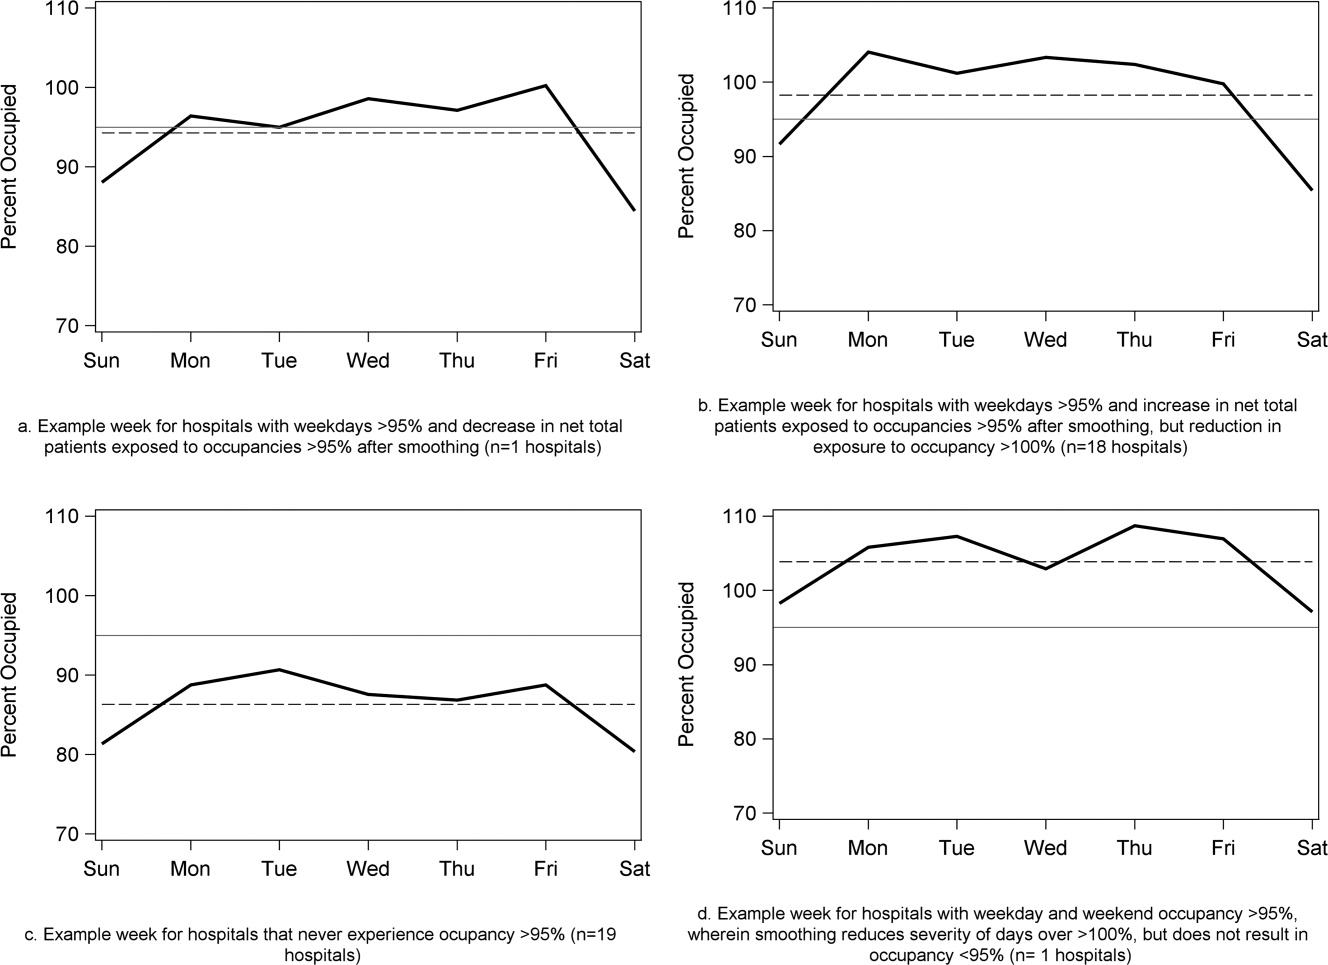
To achieve within‐week smoothing, a median of 7.4 patient‐admissions per week (range: 2.314.4) would have to be scheduled on a different day of the week. This equates to a median of 2.6% (IQR: 2.25%, 2.99%; range: 0.02%9.2%) of all admissionsor 9% of a typical hospital‐week's scheduled admissions.
Discussion
This analysis of 39 children's hospitals found high levels of occupancy and weekend occupancy lower than weekday occupancy (median difference: 8.2% points). Only 12.4% of scheduled admissions entered on weekends. Thus, weekend capacity is available to offset high weekday occupancy. Hospitals at the higher end of the occupancy thresholds (95%, 100%) would reduce the number of days operating at very high occupancy and the number of patients exposed to such levels by smoothing. This change is mathematically feasible, as a median of 7.4 patients would have to be proactively scheduled differently each week, just under one‐tenth of scheduled admissions. Since LOS by day of admission was the same (median: two days), the opportunity to affect occupancy by shifting patients should be relatively similar for all days of the week. In addition, these admissions were short, conferring greater flexibility. Implementing smoothing over the course of the week does not necessarily require admitting patients on weekends. For example, Monday admissions with an anticipated three‐day LOS could enter on Friday with anticipated discharge on Monday to alleviate midweek crowding and take advantage of unoccupied weekend beds. 26
At the highest levels of occupancy, smoothing reduces the frequency of reaching these maximum levels, but can have the effect of actually exposing more patient‐days to a higher occupancy. For example, for nine hospitals in our analysis with >20% of days over 100%, smoothing decreased days over 100%, but exposed weekend patients to higher levels of occupancy (Figure 3). Since most admissions are short and most scheduled admissions currently occur on weekdays, the number of individual patients (not patient‐days) newly exposed to such high occupancy may not increase much after smoothing at these facilities. Regardless, hospitals with such a pattern may not be able to rely solely on smoothing to avoid weekday crowding, and, if they are operating efficiently in terms of SLOSR, might be justified in building more capacity.
Consistent with our findings, the Institute for Healthcare Improvement, the Institute for Healthcare Optimization, and the American Hospital Association Quality Center stress that addressing artificial variability of scheduled admissions is a critical first step to improving patient flow and quality of care while reducing costs. 18, 21, 27 Our study suggests that small numbers of patients need to be proactively scheduled differently to decrease midweek peak occupancy, so only a small proportion of families would need to find this desirable to make it attractive for hospitals and patients. This type of proactive smoothing decreases peak occupancy on weekdays, reducing the safety risks associated with high occupancy, improving acute access for emergent patients, shortening wait‐times and loss of scheduled patients to another facility, and increasing procedure volume (3%74% in one study). 28 Smoothing may also increase quality and safety on weekends, as emergent patients admitted on weekends experience more delays in necessary treatment and have worse outcomes. 2932 In addition, increasing scheduled admissions to span weekends may appeal to some families wishing to avoid absence from work to be with their hospitalized child, to parents concerned about school performanceand may also appeal to staff members seeking flexible schedules. Increasing weekend hospital capacity is safe, feasible, and economical, even when considering the increased wages for weekend work. 33, 34 Finally, smoothing over the whole week allows fixed costs (eg, surgical suites, imaging equipment) to be allocated over 7 days rather than 5, and allows for better matching of revenue to the fixed expenses.
Rather than a prescriptive approach, our work suggests hospitals need to identify only a small number of patients to proactively shift, providing them opportunities to adapt the approach to local circumstances. The particular patients to move around may also depend on the costs and benefits of services (eg, radiologic, laboratory, operative) and the hospital's existing patterns of staffing. A number of hospitals that have engaged in similar work have achieved sustainable results, such as Seattle Children's Hospital, Boston Medical Center, St. John's Regional Health Center, and New York University Langone Medical Center. 19, 26, 3537 In these cases, proactive smoothing took advantage of unused capacity and decreased crowding on days that had been traditionally very full. Hospitals that rarely or never have high‐occupancy days, and that do not expect growth in volume, may not need to employ smoothing, whereas others that have crowding issues primarily in the winter may wish to implement smoothing techniques seasonally.
Aside from attempting to reduce high‐occupancy through modification of admission patterns, other proactive approaches include optimizing staffing and processes around care, improving efficiency of care, and building additional beds. 16, 25, 38, 39 However, the expense of construction and the scarcity of capital often preclude this last option. Among children's hospitals, with SLOSR close to one, implementing strategies to reduce the LOS during periods of high occupancy may not result in meaningful reductions in LOS, as such approaches would only decrease the typical child's hospitalization by hours, not days. In addition to proactive strategies, hospitals also rely on reactive approaches, such as ED boarding, placing patients in hallways on units, diverting ambulances or transfers, or canceling scheduled admissions at the last moment, to decrease crowding. 16, 39, 40
This study has several limitations. First, use of administrative data precluded modeling all responses. For example, some hospitals may be better able to accommodate fluctuations in census or high occupancy without compromising quality or access. Second, we only considered intra‐week smoothing, but hospitals may benefit from smoothing over longer periods of time, especially since children's hospitals are busier in winter months, but incoming scheduled volume is often not reduced. 11 Hospitals with large occupancy variations across months may want to consider broadening the time horizon for smoothing, and weigh the costs and benefits over that period of time, including parental and clinician concerns and preferences for not delaying treatment. At the individual hospital level, discrete‐event simulation would likely be useful to consider the trade‐offs of smoothing to different levels and over different periods of time. Third, we assumed a fixed number of beds for the year, an approach that may not accurately reflect actual available beds on specific days. This limitation was minimized by counting all beds for each hospital as available for all the days of the year, so that hospitals with a high census when all available beds are included would have an even higher percent occupancy if some of those beds were not actually open. In a related way, then, we also do not consider how staffing may need to be altered or augmented to care for additional patients on certain days. Fourth, midnight census, the only universally available measure, was used to determine occupancy rather than peak census. Midnight census provides a standard snapshot, but is lower than mid‐day peak census. 41 In order to account for these limitations, we considered several different thresholds of high occupancy. Fifth, we smoothed at the hospital level, but differential effects may exist at the unit level. Sixth, to determine proportion of scheduled admissions, we used HCUP KID proportions on PHIS admissions. Overall, this approach likely overestimated scheduled medical admissions on weekends, thus biasing our result towards the null hypothesis. Finally, only freestanding children's hospitals were included in this study. While this may limit generalizability, the general concept of smoothing occupancy should apply in any setting with substantial and consistent variation.
In summary, our study revealed that children's hospitals often face high midweek occupancy, but also have substantial unused weekend capacity. Hospitals facing challenges with high weekday occupancy could proactively use a smoothing approach to decrease the frequency and severity of high occupancy. Further qualitative evaluation is also warranted around child, family, and staff preferences concerning scheduled admissions, school, and work.
- , , , . A comparison of in‐hospital mortality risk conferred by high hospital occupancy, differences in nurse staffing levels, weekend admission, and seasonal influenza. Medical Care. 2010;48(3):224–232.
- , , , et al. Hospital workload and adverse events. Med Care. 2007;45(5):448–455.
- , , , , . Impact of admission‐day crowding on the length of stay of pediatric hospitalizations. Pediatrics. 2008;121(4):e718–e730.
- , , , . The effect of hospital bed occupancy on throughput in the pediatric emergency department. Ann Emerg Med. 2009;53(6):767–776.
- . The tipping point: the relationship between volume and patient harm. Am J Med Qual. 2008;23(5):336–341.
- , , , , , . Managing unnecessary variability in patient demand to reduce nursing stress and improve patient safety. Jt Comm J Qual Patient Saf. 2005;31(6):330–338.
- Hospital‐Based Emergency Care: At the Breaking Point. Washington, DC: Institute of Medicine Committee on the Future of Emergency Care in the United States Health System; 2006.
- , , , , . The effect of hospital occupancy on emergency department length of stay and patient disposition. Acad Emerg Med. 2003;10(2):127–133.
- . Interpreting the Volume‐Outcome Relationship in the Context of Health Care Quality: Workshop Summary. Washington, DC: National Academies Press; 2000.
- , , , , . Has recognition of the relationship between mortality rates and hospital volume for major cancer surgery in California made a difference? A follow‐up analysis of another decade. Ann Surg. 2009;250(3):472–483.
- , , , et al. Children's hospitals do not acutely respond to high occupancy. Pediatrics. 2010;125:974–981.
- , , , , , . Scheduled admissions and high occupancy at a children's hospital. J Hosp Med. 2011;6(2):81–87.
- , , . Characteristics of weekday and weekend hospital admissions. HCUP Statistical Brief. 2010;87.
- Agency for Healthcare Research and Quality. HCUP databases, Healthcare Cost and Utilization Project (HCUP); 2008. Available at: http://www.hcup‐us.ahrq.gov/kidoverview.jsp. Accessed July 15, 2009.
- , et al. Managing capacity to reduce emergency department overcrowding and ambulance diversions. J Qual Patient Saf. 2006;32(5):239–245.
- Institute for Healthcare Improvement. Flow initiatives; 2008. Available at: http://www.ihi.org/IHI/Topics/Flow. Accessed February 20, 2008.
- , , , , , . Trends in high‐turnover stays among children hospitalized in the United States, 1993–2003. Pediatrics. 2009;123(3):996–1002.
- Institute for Healthcare Improvement. Smoothing elective surgical admissions. Available at: http://www.ihi.org/IHI/Topics/Flow/PatientFlow/EmergingContent/SmoothingElectiveSurgicalAdmissions.htm. Accessed October 24, 2008.
- Boston hospital sees big impact from smoothing elective schedule. OR Manager. 2004;20:12.
- . Managing Variability in Patient Flow Is the Key to Improving Access to Care, Nursing Staffing, Quality of Care, and Reducing Its Cost. Paper presented at Institute of Medicine, Washington, DC; June 24, 2004.
- American Hospital Association Quality Center. Available at: http://www.ahaqualitycenter.org/ahaqualitycenter/. Accessed October 14, 2008.
- Healthcare Cost and Utilization Project (HCUP). Kids' Inpatient Database (KID); July 2008. Available at: http://www.hcup‐us.ahrq.gov/kidoverview.jsp. Accessed September 10, 2008.
- , , . Using a queuing model to help plan bed allocation in a department of geriatric medicine. Health Care Manag Sci. 2002;5(4):307–313.
- . How many hospital beds? Inquiry. 2002;39(4):400–412.
- . Institute for Healthcare Improvement. Patient flow comments. Available at: http://www.ihi.org/IHI/Topics/Flow. Accessed September 10, 2008.
- . Factory efficiency comes to the hospital. New York Times. July 9, 2010.
- Institute for Healthcare Improvement. Re‐engineering the operating room. Available at: http://www.ihi.org/IHI/Programs/ConferencesAndSeminars/ReengineeringtheOperatingRoomSept08.htm. Accessed November 8, 2008.
- , . Enhanced weekend service: an affordable means to increased hospital procedure volume. CMAJ. 2005;172(4):503–504.
- , . Mortality among patients admitted to hospitals on weekends as compared with weekdays. N Engl J Med. 2001;345:663–668.
- , , , , , . Weekend versus weekday admission and mortality from myocardial infarction. N Engl J Med. 2007;356:1099–1109.
- , . Waiting for urgent procedures on the weekend among emergently hospitalized patients. Am J Med. 2004;117:175–181.
- . Do hospitals provide lower quality care on weekends? Health Serv Res. 2007;42:1589–1612.
- . Hospital saves by working weekends. Mod Healthc. 1996;26:82–99.
- , , , , . Weekend and holiday exercise testing in patients with chest pain. J Gen Intern Med. 1999;14:10–14.
- . Boston Medical Center Case Study: Institute of Healthcare Optimization; 2006. Available at: http://www.ihoptimize.org/8f16e142‐eeaa‐4898–9e62–660218f19ffb/download.htm. Accessed October 3, 2010.
- , , , . The impact of IMPACT on St John's Regional Health Center. Mo Med. 2003;100:590–592.
- NYU Langone Medical Center Extends Access to Non‐Emergent Care as Part of Commitment to Patient‐Centered Care (June 23, 2010). Available at: http://communications.med.nyu.edu/news/2010/nyu‐langone‐medical‐center‐extends‐access‐non‐emergent‐care‐part‐commitment‐patient‐center. Accessed October 3, 2010.
- Carondelet St. Mary's Hospital. A pragmatic approach to improving patient efficiency throughput. Improvement Report 2005. Available at: http://www.ihi.org/IHI/Topics/Flow/PatientFlow/ImprovementStories/APragmaticApproachtoImprovingPatientEfficiencyThroughput.htm. Accessed October 3, 2010.
- AHA Solutions. Patient Flow Challenges Assessment 2009. Chicago, IL; 2009.
- , , , , , . A conceptual model of emergency department crowding. Ann Emerg Med. 2003;42(2):173–180.
- . Annual bed statistics give a misleading picture of hospital surge capacity. Ann Emerg Med. 2006;48(4):384–388.
High levels of hospital occupancy are associated with compromises to quality of care and access (often referred to as crowding), 18 while low occupancy may be inefficient and also impact quality. 9, 10 Despite this, hospitals typically have uneven occupancy. Although some demand for services is driven by factors beyond the control of a hospital (eg, seasonal variation in viral illness), approximately 15%30% of admissions to children's hospitals are scheduled from days to months in advance, with usual arrivals on weekdays. 1114 For example, of the 3.4 million elective admissions in the 2006 Healthcare Cost and Utilization Project Kids Inpatient Database (HCUP KID), only 13% were admitted on weekends. 14 Combined with short length of stay (LOS) for such patients, this leads to higher midweek and lower weekend occupancy. 12
Hospitals respond to crowding in a number of ways, but often focus on reducing LOS to make room for new patients. 11, 15, 16 For hospitals that are relatively efficient in terms of LOS, efforts to reduce it may not increase functional capacity adequately. In children's hospitals, median lengths of stay are 2 to 3 days, and one‐third of hospitalizations are 1 day or less. 17 Thus, even 10%20% reductions in LOS trims hours, not days, from typical stays. Practical barriers (eg, reluctance to discharge in the middle of the night, or family preferences and work schedules) and undesired outcomes (eg, increased hospital re‐visits) are additional pitfalls encountered by relying on throughput enhancement alone.
Managing scheduled admissions through smoothing is an alternative strategy to reduce variability and high occupancy. 6, 12, 1820 The concept is to proactively control the entry of patients, when possible, to achieve more even levels of occupancy, instead of the peaks and troughs commonly encountered. Nonetheless, it is not a widely used approach. 18, 20, 21 We hypothesized that children's hospitals had substantial unused capacity that could be used to smooth occupancy, which would reduce weekday crowding. While it is obvious that smoothing will reduce peaks to average levels (and also raise troughs), we sought to quantify just how large this difference wasand thereby quantify the potential of smoothing to reduce inpatient crowding (or, conversely, expose more patients to high levels of occupancy). Is there enough variation to justify smoothing, and, if a hospital does smooth, what is the expected result? If the number of patients removed from exposure to high occupancy is not substantial, other means to address inpatient crowding might be of more value. Our aims were to quantify the difference in weekday versus weekend occupancy, report on mathematical feasibility of such an approach, and determine the difference in number of patients exposed to various levels of high occupancy.
Methods
Data Source
This retrospective study was conducted with resource‐utilization data from 39 freestanding, tertiary‐care children's hospitals in the Pediatric Health Information System (PHIS). Participating hospitals are located in noncompeting markets of 23 states, plus the District of Columbia, and affiliated with the Child Health Corporation of America (CHCA, Shawnee Mission, KS). They account for 80% of freestanding, and 20% of all general, tertiary‐care children's hospitals. Data quality and reliability are assured through joint ongoing, systematic monitoring. The Children's Hospital of Philadelphia Committees for the Protection of Human Subjects approved the protocol with a waiver of informed consent.
Patients
Patients admitted January 1December 31, 2007 were eligible for inclusion. Due to variation in the presence of birthing, neonatal intensive care, and behavioral health units across hospitals, these beds and associated patients were excluded. Inpatients enter hospitals either as scheduled (often referred to as elective) or unscheduled (emergent or urgent) admissions. Because PHIS does not include these data, KID was used to standardize the PHIS data for proportion of scheduled admissions. 22 (KID is a healthcare database of 23 million pediatric inpatient discharges developed through federalstateindustry partnership, and sponsored by the Agency for Healthcare Research and Quality [AHRQ].) Each encounter in KID includes a principal International Classification of Diseases, 9th revision (ICD‐9) discharge diagnosis code, and is designated by the hospital as elective (ranging from chemotherapy to tonsillectomy) or not elective. Because admissions, rather than diagnoses, are scheduled, a proportion of patients with each primary diagnosis in KID are scheduled (eg, 28% of patients with a primary diagnosis of esophageal reflux). Proportions in KID were matched to principal diagnoses in PHIS.
Definitions
The census was the number of patients registered as inpatients (including those physically in the emergency department [ED] from time of ED arrival)whether observation or inpatient statusat midnight, the conclusion of the day. Hospital capacity was set using CHCA data (and confirmed by each hospital's administrative personnel) as the number of licensed in‐service beds available for patients in 2007; we assumed beds were staffed and capacity fixed for the year. Occupancy was calculated by dividing census by capacity. Maximum occupancy in a week referred to the highest occupancy level achieved in a seven‐day period (MondaySunday). We analyzed a set of thresholds for high‐occupancy (85%, 90%, 95%, and 100%), because there is no consistent definition for when hospitals are at high occupancy or when crowding occurs, though crowding has been described as starting at 85% occupancy. 2325
Analysis
The hospital was the unit of analysis. We report hospital characteristics, including capacity, number of discharges, and census region, and annual standardized length of stay ratio (SLOSR) as observed‐to‐expected LOS.
Smoothing Technique
A retrospective smoothing algorithm set each hospital's daily occupancy during a week to that hospital's mean occupancy for the week; effectively spreading the week's volume of patients evenly across the days of the week. While inter‐week and inter‐month smoothing were considered, intra‐week smoothing was deemed more practical for the largest number of patients, as it would not mean delaying care by more than one week. In the case of a planned treatment course (eg, chemotherapy), only intra‐week smoothing would maintain the necessary scheduled intervals of treatment.
Mathematical Feasibility
To approximate the number of patient admissions that would require different scheduling during a particular week to achieve smoothed weekly occupancy, we determined the total number of patient‐days in the week that required different scheduling and divided by the average LOS for the week. We then divided the number of admissions‐to‐move by total weekly admissions to compute the percentage at each hospital across 52 weeks of the year.
Measuring the Impact of Smoothing
We focused on the frequency and severity of high occupancy and the number of patients exposed to it. This framework led to 4 measures that assess the opportunity and effect of smoothing:
Difference in hospital weekdayweekend occupancy: Equal to 12‐month median of difference between mean weekday occupancy and mean weekend occupancy for each hospital‐week.
Difference in hospital maximummean occupancy: Equal to median of difference between maximum one‐day occupancy and weekly mean (smoothed) occupancy for each hospital‐week. A regression line was derived from the data for the 39 hospitals to report expected reduction in peak occupancy based on the magnitude of the difference between weekday and weekend occupancy.
Difference in number of hospitals exposed to above‐threshold occupancy: Equal to difference, pre‐ and post‐smoothing, in number of hospitals facing high‐occupancy conditions on an average of at least one weekday midnight per week during the year at different occupancy thresholds.
Difference in number of patients exposed to above‐threshold occupancy: Equal to difference, pre‐ and post‐smoothing, in number of patients exposed to hospital midnight occupancy at the thresholds. We utilized patient‐days for the calculation to avoid double‐counting, and divided this by average LOS, in order to determine the number of patients who would no longer be exposed to over‐threshold occupancy after smoothing, while also adjusting for patients newly exposed to over‐threshold occupancy levels.
All analyses were performed separately for each hospital for the entire year and then for winter (DecemberMarch), the period during which most crowding occurred. Analyses were performed using SAS (version 9.2, SAS Institute, Inc, Cary, NC); P values <0.05 were considered statistically significant.
Results
The characteristics of the 39 hospitals are provided in Table 1. Based on standardization with KID, 23.6% of PHIS admissions were scheduled (range: 18.1%35.8%) or a median of 81.5 scheduled admissions per week per hospital; 26.6% of weekday admissions were scheduled versus 16.1% for weekends. Overall, 12.4% of scheduled admissions entered on weekends. For all patients, median LOS was three days (interquartile range [IQR]: twofive days), but median LOS for scheduled admissions was two days (IQR: onefour days). The median LOS and IQR were the same by day of admission for all days of the week. Most hospitals had an overall SLOSR close to one (median: 0.9, IQR: 0.91.1). Overall, hospital mean midnight occupancy ranged from 70.9% to 108.1% on weekdays and 65.7% to 94.9% on weekends. Uniformly, weekday occupancy exceeded weekend occupancy, with a median difference of 8.2% points (IQR: 7.2%9.5% points). There was a wide range of median hospital weekdayweekend occupancy differences across hospitals (Figure 1). The overall difference was less in winter (median difference: 7.7% points; IQR: 6.3%8.8% points) than in summer (median difference: 8.6% points; IQR: 7.4%9.8% points (Wilcoxon Sign Rank test, P < 0.001). Thirty‐five hospitals (89.7%) exceeded the 85% occupancy threshold and 29 (74.4%) exceeded the 95% occupancy threshold on at least 20% of weekdays (Table 2). Across all the hospitals, the median difference in weekly maximum and weekly mean occupancy was 6.6% points (IQR: 6.2%7.4% points) (Figure 2).
| Characteristics | No. (%) |
|---|---|
| |
| Licensed in‐service beds | n = 39 hospitals |
| <200 beds | 6 (15.4) |
| 200249 beds | 10 (25.6) |
| 250300 beds | 14 (35.9) |
| >300 beds | 9 (23.1) |
| No. of discharges | |
| <10,000 | 5 (12.8) |
| 10,00013,999 | 14 (35.9) |
| 14,00017,999 | 11 (28.2) |
| >18,000 | 9 (23.1) |
| Census region | |
| West | 9 (23.1) |
| Midwest | 11 (28.2) |
| Northeast | 6 (15.4) |
| South | 13 (33.3) |
| Admissions | n = 590,352 admissions |
| Medical scheduled admissions* | 79,683 |
| Surgical scheduled admissions* | 59,640 |
| Total scheduled admissions* (% of all admissions) | 139,323 (23.6) |
| Weekend medical scheduled admissions* (% of all medical scheduled admissions) | 13,546 (17.0) |
| Weekend surgical scheduled admissions* (% of all surgical scheduled admissions) | 3,757 (6.3) |
| Weekend total scheduled admissions* (% of total scheduled admissions) | 17,276 (12.4) |
| Entire Year | >85% | Occupancy Threshold | >95% | >100% |
|---|---|---|---|---|
| >90% | ||||
| ||||
| No. of hospitals (n = 39) with mean weekday occupancy above threshold | ||||
| Before smoothing (current state) | 33 | 25 | 14 | 6 |
| After smoothing | 32 | 22 | 10 | 1 |
| No. of hospitals (n = 39) above threshold 20% of weekdays | ||||
| Before smoothing (current state) | 35 | 34 | 29 | 14 |
| After smoothing | 35 | 32 | 21 | 9 |
| Median (IQR) no. of patient‐days per hospital not exposed to occupancy above threshold by smoothing | 3,071 | 281 | 3236 | 3281 |
| (5,552, 919) | (5,288, 3,103) | (0, 7,083) | (962, 8,517) | |
| Median (IQR) no. of patients per hospital not exposed to occupancy above threshold by smoothing | 596 | 50 | 630 | 804 |
| (1,190, 226) | (916, 752) | (0, 1,492) | (231, 2,195) | |
Smoothing reduced the number of hospitals at each occupancy threshold, except 85% (Table 2). As a linear relationship, the reduction in weekday peak occupancy (y) based on a hospital's median difference in weekly maximum and weekly mean occupancy (x) was y = 2.69 + 0.48x. Thus, a hospital with a 10% point difference between weekday and weekend occupancy could reduce weekday peak by 7.5% points.
Smoothing increased the number of patients exposed to the lower thresholds (85% and 90%), but decreased the number of patients exposed to >95% occupancy (Table 2). For example, smoothing at the 95% threshold resulted in 630 fewer patients per hospital exposed to that threshold. If all 39 hospitals had within‐week smoothing, a net of 39,607 patients would have been protected from exposure to >95% occupancy and a net of 50,079 patients from 100% occupancy.
To demonstrate the varied effects of smoothing, Table 3 and Figure 3 present representative categories of response to smoothing depending on pre‐smoothing patterns. While not all hospitals decreased occupancy to below thresholds after smoothing (Types B and D), the overall occupancy was reduced and fewer patients were exposed to extreme levels of high occupancy (eg, >100%).
| Category | Before Smoothing Hospital Description | After Smoothing Hospital Description | No. of Hospitals at 85% Threshold (n = 39) | No. of Hospitals at 95% Threshold (n = 39) |
|---|---|---|---|---|
| ||||
| Type A | Weekdays above threshold | All days below threshold, resulting in net decrease in patients exposed to occupancies above threshold | 3 | 1 |
| Weekends below threshold | ||||
| Type B | Weekdays above threshold | All days above threshold, resulting in net increase in patients exposed to occupancies above threshold | 12 | 18 |
| Weekends below threshold | ||||
| Type C | All days of week below threshold | All days of week below threshold | 6 | 19 |
| Type D | All days of week above threshold | All days of week above threshold, resulting in net decrease in patients exposed to extreme high occupancy | 18 | 1 |
To achieve within‐week smoothing, a median of 7.4 patient‐admissions per week (range: 2.314.4) would have to be scheduled on a different day of the week. This equates to a median of 2.6% (IQR: 2.25%, 2.99%; range: 0.02%9.2%) of all admissionsor 9% of a typical hospital‐week's scheduled admissions.
Discussion
This analysis of 39 children's hospitals found high levels of occupancy and weekend occupancy lower than weekday occupancy (median difference: 8.2% points). Only 12.4% of scheduled admissions entered on weekends. Thus, weekend capacity is available to offset high weekday occupancy. Hospitals at the higher end of the occupancy thresholds (95%, 100%) would reduce the number of days operating at very high occupancy and the number of patients exposed to such levels by smoothing. This change is mathematically feasible, as a median of 7.4 patients would have to be proactively scheduled differently each week, just under one‐tenth of scheduled admissions. Since LOS by day of admission was the same (median: two days), the opportunity to affect occupancy by shifting patients should be relatively similar for all days of the week. In addition, these admissions were short, conferring greater flexibility. Implementing smoothing over the course of the week does not necessarily require admitting patients on weekends. For example, Monday admissions with an anticipated three‐day LOS could enter on Friday with anticipated discharge on Monday to alleviate midweek crowding and take advantage of unoccupied weekend beds. 26
At the highest levels of occupancy, smoothing reduces the frequency of reaching these maximum levels, but can have the effect of actually exposing more patient‐days to a higher occupancy. For example, for nine hospitals in our analysis with >20% of days over 100%, smoothing decreased days over 100%, but exposed weekend patients to higher levels of occupancy (Figure 3). Since most admissions are short and most scheduled admissions currently occur on weekdays, the number of individual patients (not patient‐days) newly exposed to such high occupancy may not increase much after smoothing at these facilities. Regardless, hospitals with such a pattern may not be able to rely solely on smoothing to avoid weekday crowding, and, if they are operating efficiently in terms of SLOSR, might be justified in building more capacity.
Consistent with our findings, the Institute for Healthcare Improvement, the Institute for Healthcare Optimization, and the American Hospital Association Quality Center stress that addressing artificial variability of scheduled admissions is a critical first step to improving patient flow and quality of care while reducing costs. 18, 21, 27 Our study suggests that small numbers of patients need to be proactively scheduled differently to decrease midweek peak occupancy, so only a small proportion of families would need to find this desirable to make it attractive for hospitals and patients. This type of proactive smoothing decreases peak occupancy on weekdays, reducing the safety risks associated with high occupancy, improving acute access for emergent patients, shortening wait‐times and loss of scheduled patients to another facility, and increasing procedure volume (3%74% in one study). 28 Smoothing may also increase quality and safety on weekends, as emergent patients admitted on weekends experience more delays in necessary treatment and have worse outcomes. 2932 In addition, increasing scheduled admissions to span weekends may appeal to some families wishing to avoid absence from work to be with their hospitalized child, to parents concerned about school performanceand may also appeal to staff members seeking flexible schedules. Increasing weekend hospital capacity is safe, feasible, and economical, even when considering the increased wages for weekend work. 33, 34 Finally, smoothing over the whole week allows fixed costs (eg, surgical suites, imaging equipment) to be allocated over 7 days rather than 5, and allows for better matching of revenue to the fixed expenses.
Rather than a prescriptive approach, our work suggests hospitals need to identify only a small number of patients to proactively shift, providing them opportunities to adapt the approach to local circumstances. The particular patients to move around may also depend on the costs and benefits of services (eg, radiologic, laboratory, operative) and the hospital's existing patterns of staffing. A number of hospitals that have engaged in similar work have achieved sustainable results, such as Seattle Children's Hospital, Boston Medical Center, St. John's Regional Health Center, and New York University Langone Medical Center. 19, 26, 3537 In these cases, proactive smoothing took advantage of unused capacity and decreased crowding on days that had been traditionally very full. Hospitals that rarely or never have high‐occupancy days, and that do not expect growth in volume, may not need to employ smoothing, whereas others that have crowding issues primarily in the winter may wish to implement smoothing techniques seasonally.
Aside from attempting to reduce high‐occupancy through modification of admission patterns, other proactive approaches include optimizing staffing and processes around care, improving efficiency of care, and building additional beds. 16, 25, 38, 39 However, the expense of construction and the scarcity of capital often preclude this last option. Among children's hospitals, with SLOSR close to one, implementing strategies to reduce the LOS during periods of high occupancy may not result in meaningful reductions in LOS, as such approaches would only decrease the typical child's hospitalization by hours, not days. In addition to proactive strategies, hospitals also rely on reactive approaches, such as ED boarding, placing patients in hallways on units, diverting ambulances or transfers, or canceling scheduled admissions at the last moment, to decrease crowding. 16, 39, 40
This study has several limitations. First, use of administrative data precluded modeling all responses. For example, some hospitals may be better able to accommodate fluctuations in census or high occupancy without compromising quality or access. Second, we only considered intra‐week smoothing, but hospitals may benefit from smoothing over longer periods of time, especially since children's hospitals are busier in winter months, but incoming scheduled volume is often not reduced. 11 Hospitals with large occupancy variations across months may want to consider broadening the time horizon for smoothing, and weigh the costs and benefits over that period of time, including parental and clinician concerns and preferences for not delaying treatment. At the individual hospital level, discrete‐event simulation would likely be useful to consider the trade‐offs of smoothing to different levels and over different periods of time. Third, we assumed a fixed number of beds for the year, an approach that may not accurately reflect actual available beds on specific days. This limitation was minimized by counting all beds for each hospital as available for all the days of the year, so that hospitals with a high census when all available beds are included would have an even higher percent occupancy if some of those beds were not actually open. In a related way, then, we also do not consider how staffing may need to be altered or augmented to care for additional patients on certain days. Fourth, midnight census, the only universally available measure, was used to determine occupancy rather than peak census. Midnight census provides a standard snapshot, but is lower than mid‐day peak census. 41 In order to account for these limitations, we considered several different thresholds of high occupancy. Fifth, we smoothed at the hospital level, but differential effects may exist at the unit level. Sixth, to determine proportion of scheduled admissions, we used HCUP KID proportions on PHIS admissions. Overall, this approach likely overestimated scheduled medical admissions on weekends, thus biasing our result towards the null hypothesis. Finally, only freestanding children's hospitals were included in this study. While this may limit generalizability, the general concept of smoothing occupancy should apply in any setting with substantial and consistent variation.
In summary, our study revealed that children's hospitals often face high midweek occupancy, but also have substantial unused weekend capacity. Hospitals facing challenges with high weekday occupancy could proactively use a smoothing approach to decrease the frequency and severity of high occupancy. Further qualitative evaluation is also warranted around child, family, and staff preferences concerning scheduled admissions, school, and work.
- , , , . A comparison of in‐hospital mortality risk conferred by high hospital occupancy, differences in nurse staffing levels, weekend admission, and seasonal influenza. Medical Care. 2010;48(3):224–232.
- , , , et al. Hospital workload and adverse events. Med Care. 2007;45(5):448–455.
- , , , , . Impact of admission‐day crowding on the length of stay of pediatric hospitalizations. Pediatrics. 2008;121(4):e718–e730.
- , , , . The effect of hospital bed occupancy on throughput in the pediatric emergency department. Ann Emerg Med. 2009;53(6):767–776.
- . The tipping point: the relationship between volume and patient harm. Am J Med Qual. 2008;23(5):336–341.
- , , , , , . Managing unnecessary variability in patient demand to reduce nursing stress and improve patient safety. Jt Comm J Qual Patient Saf. 2005;31(6):330–338.
- Hospital‐Based Emergency Care: At the Breaking Point. Washington, DC: Institute of Medicine Committee on the Future of Emergency Care in the United States Health System; 2006.
- , , , , . The effect of hospital occupancy on emergency department length of stay and patient disposition. Acad Emerg Med. 2003;10(2):127–133.
- . Interpreting the Volume‐Outcome Relationship in the Context of Health Care Quality: Workshop Summary. Washington, DC: National Academies Press; 2000.
- , , , , . Has recognition of the relationship between mortality rates and hospital volume for major cancer surgery in California made a difference? A follow‐up analysis of another decade. Ann Surg. 2009;250(3):472–483.
- , , , et al. Children's hospitals do not acutely respond to high occupancy. Pediatrics. 2010;125:974–981.
- , , , , , . Scheduled admissions and high occupancy at a children's hospital. J Hosp Med. 2011;6(2):81–87.
- , , . Characteristics of weekday and weekend hospital admissions. HCUP Statistical Brief. 2010;87.
- Agency for Healthcare Research and Quality. HCUP databases, Healthcare Cost and Utilization Project (HCUP); 2008. Available at: http://www.hcup‐us.ahrq.gov/kidoverview.jsp. Accessed July 15, 2009.
- , et al. Managing capacity to reduce emergency department overcrowding and ambulance diversions. J Qual Patient Saf. 2006;32(5):239–245.
- Institute for Healthcare Improvement. Flow initiatives; 2008. Available at: http://www.ihi.org/IHI/Topics/Flow. Accessed February 20, 2008.
- , , , , , . Trends in high‐turnover stays among children hospitalized in the United States, 1993–2003. Pediatrics. 2009;123(3):996–1002.
- Institute for Healthcare Improvement. Smoothing elective surgical admissions. Available at: http://www.ihi.org/IHI/Topics/Flow/PatientFlow/EmergingContent/SmoothingElectiveSurgicalAdmissions.htm. Accessed October 24, 2008.
- Boston hospital sees big impact from smoothing elective schedule. OR Manager. 2004;20:12.
- . Managing Variability in Patient Flow Is the Key to Improving Access to Care, Nursing Staffing, Quality of Care, and Reducing Its Cost. Paper presented at Institute of Medicine, Washington, DC; June 24, 2004.
- American Hospital Association Quality Center. Available at: http://www.ahaqualitycenter.org/ahaqualitycenter/. Accessed October 14, 2008.
- Healthcare Cost and Utilization Project (HCUP). Kids' Inpatient Database (KID); July 2008. Available at: http://www.hcup‐us.ahrq.gov/kidoverview.jsp. Accessed September 10, 2008.
- , , . Using a queuing model to help plan bed allocation in a department of geriatric medicine. Health Care Manag Sci. 2002;5(4):307–313.
- . How many hospital beds? Inquiry. 2002;39(4):400–412.
- . Institute for Healthcare Improvement. Patient flow comments. Available at: http://www.ihi.org/IHI/Topics/Flow. Accessed September 10, 2008.
- . Factory efficiency comes to the hospital. New York Times. July 9, 2010.
- Institute for Healthcare Improvement. Re‐engineering the operating room. Available at: http://www.ihi.org/IHI/Programs/ConferencesAndSeminars/ReengineeringtheOperatingRoomSept08.htm. Accessed November 8, 2008.
- , . Enhanced weekend service: an affordable means to increased hospital procedure volume. CMAJ. 2005;172(4):503–504.
- , . Mortality among patients admitted to hospitals on weekends as compared with weekdays. N Engl J Med. 2001;345:663–668.
- , , , , , . Weekend versus weekday admission and mortality from myocardial infarction. N Engl J Med. 2007;356:1099–1109.
- , . Waiting for urgent procedures on the weekend among emergently hospitalized patients. Am J Med. 2004;117:175–181.
- . Do hospitals provide lower quality care on weekends? Health Serv Res. 2007;42:1589–1612.
- . Hospital saves by working weekends. Mod Healthc. 1996;26:82–99.
- , , , , . Weekend and holiday exercise testing in patients with chest pain. J Gen Intern Med. 1999;14:10–14.
- . Boston Medical Center Case Study: Institute of Healthcare Optimization; 2006. Available at: http://www.ihoptimize.org/8f16e142‐eeaa‐4898–9e62–660218f19ffb/download.htm. Accessed October 3, 2010.
- , , , . The impact of IMPACT on St John's Regional Health Center. Mo Med. 2003;100:590–592.
- NYU Langone Medical Center Extends Access to Non‐Emergent Care as Part of Commitment to Patient‐Centered Care (June 23, 2010). Available at: http://communications.med.nyu.edu/news/2010/nyu‐langone‐medical‐center‐extends‐access‐non‐emergent‐care‐part‐commitment‐patient‐center. Accessed October 3, 2010.
- Carondelet St. Mary's Hospital. A pragmatic approach to improving patient efficiency throughput. Improvement Report 2005. Available at: http://www.ihi.org/IHI/Topics/Flow/PatientFlow/ImprovementStories/APragmaticApproachtoImprovingPatientEfficiencyThroughput.htm. Accessed October 3, 2010.
- AHA Solutions. Patient Flow Challenges Assessment 2009. Chicago, IL; 2009.
- , , , , , . A conceptual model of emergency department crowding. Ann Emerg Med. 2003;42(2):173–180.
- . Annual bed statistics give a misleading picture of hospital surge capacity. Ann Emerg Med. 2006;48(4):384–388.
Copyright © 2011 Society of Hospital Medicine
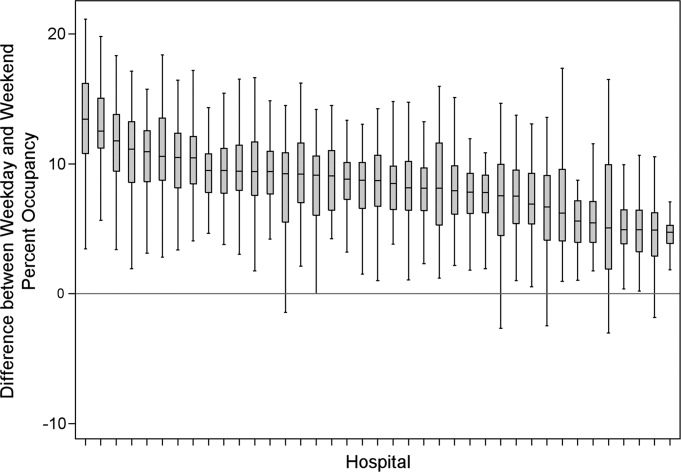
Scheduled Admissions and Occupancy
Patient flow in a hospital refers to the management and movement of patients through the facility. Optimizing patient flow is considered of great importance to improvement of quality (including safety, efficiency, timeliness, equity, effectiveness, and patient‐centeredness), as well as finance, staff satisfaction, education and overall healthcare value.18 Central to concerns about patient flow at hospitals is occupancy, which is the census (number of patients at a point in time) divided by the bed capacity. Occupancy that is too high is associated with challenges to quality and access,913 while occupancy that is too low may underutilize resources and be costly.14, 15 Occupancy is determined by the pattern of admission and discharge, thus including length of stay (LOS) as a factor. While all related, admissions, census, occupancy, and LOS convey different aspects of hospital operations and may point to different opportunities to improve patient flow.
Variability in patient flow over time has been noted as a common occurrence in adult hospitals, due to uneven patterns of scheduled (elective) admissions, as well as uncontrollable variability of emergent admissions.2, 45, 16 Typically very few patients are scheduled to enter hospitals over weekends. In addition, when the admission is expected to be 5 days or less, clinical and operational staff may schedule those admissions early in the week to avoid patients staying the weekend. This artificial variability has been shown to lead to uneven levels of occupancy, with crowding on some days of the week more than others.2, 45, 16 As hospital crowding adversely affects access to emergent and elective care, quality and safety of care, and patient and staff satisfaction, many groups are focusing attention on patient flow and strategies to avoid high occupancy.19, 17 This is true for children's hospitals, as well, particularly as these scarce resources have ever increasing demand placed on them.1820
Patient flow improvements can be made by increasing efficiency of throughput, primarily measured by decreased LOS, or by addressing artificial variability in how hospital beds are used. As children's hospitals have short LOSs and are relatively efficient (as measured by standardized LOS ratios), we sought to evaluate how much artificial variability was active at 1 large children's hospital. We did this to both evaluate flow at 1 institution and to create methodology for other hospitals to use in order to better understand and improve their flow.
Our specific aims were to describe daily and monthly variability in admission, discharge, LOS, and occupancy patterns at a large children's hospital and assess the relationship between scheduled admissions and occupancy.
Methods
This retrospective administrative data analysis was performed with admission‐discharge‐transfer (ADT) data for inpatient admissions from one urban, tertiary‐care children's hospital for the period July 1, 2007 to June 30, 2008. The dataset included the date and time of all arrivals and departures from all inpatient units (including observation‐status patients), as entered by the unit clerks into the electronic ADT system. The dataset also included categorization of the admission as emergent, urgent, or elective (hereafter referred to as scheduled.) Registration staff entered these codes at or prior to admission. Using the timestamps, LOS was calculated by subtracting admission date and time from discharge date and time. An SAS macro was applied to the timestamps to calculate a hospital census for every hour of each calendar day. Peak census figures were extracted for each day. Occupancy was calculated as census over number of beds in use (monthly average). Data for the hospital's peak daily census and occupancy were utilized to analyze patterns of occupancy by day of week and month of year. To express variability, coefficient of variation (CV) (standard deviation [SD] divided by its mean) was used, as it is helpful when samples sizes are different.21
Analysis of number of admissions per day of week and month by type was performed with descriptive statistics and t‐tests for significant differences across seasons. We calculated a measure of patient hours generated by day of admission based on the LOS generated by each admission, in which the average number of admissions for each day of the week was multiplied by the average LOS (in hours) for those admissions. In order to remove outliers and focus on patients whose occupancy would affect weekly variation, we analyzed in detail the admissions with LOS 30 days and 7 days, respectively.
Statistical analyses were performed with SAS 9.2 (SAS Institute, Cary, NC), Stata 10.0 (StataCorp, College Station, TX) and Microsoft Excel (Microsoft, Redmond, WA). The study was approved by the Human Subjects Committee of the hospital's Institutional Review Board.
Results
A total of 22,310 patients were admitted over the period July 1, 2007 to June 30, 2008, including 4957 (22%) coded as scheduled and 17,353 (78%) coded as emergent. (Only 200 patients were registered as urgent and these were recoded as emergent for this analysis). Details on admission types and discharging departments are provided in Table 1. Overall, mean LOS was 5.6 days (median 2.29 days). For patients with LOS 30 days, mean LOS was 3.88 days (median 2.22 days). For patients staying 7 days, mean LOS was 2.4 days (median 1.98 days). Among patients with LOS 7 days, mean LOS for scheduled patients was longer for those admitted on Monday than on any other weekday (2.49 vs. 2.08 days, P < 0.0001). In contrast, mean LOS for emergent patients was longer for patients admitted on Friday and Saturday than the rest of the week (2.57 vs. 2.44 days, P < 0.0001).
| All | Scheduled | Emergent | |
|---|---|---|---|
| |||
| Total Admissions, n (%)* | 22,310 | 4957 (22) | 17,353 (78) |
| Median LOS (days) | 2.29 | 1.93 | 2.50 |
| Mean LOS (days) (95% CI) | 5.60 (5.41, 5.79) | 4.20 (3.95, 4.45) | 5.78 (5.596.0) |
| % Patients with LOS 30 days (%) | 97 | 98 | 96 |
| % Patients with LOS 7 days (%) | 84 | 89 | 83 |
| Medical patients at discharge, n (%) | 16,586 (74) | 2363 (48) | 14,403 (83) |
| Surgical patients at discharge, n (%) | 4276 (19) | 2450 (49) | 1826 (10.5) |
| Critical care patients at discharge (NICU, PICU, CICU), n (%) | 1433 (6) | 140 (3) | 1293 (7.5) |
Total admissions per month (Figure 1) averaged 1937 in October through April and 1751 in May through September (P = 0.03). Variation in the number of emergent and scheduled patients over months of the year were similar (CV 10% for each), but emergent admissions did decrease in summer (mean 1299 for June‐September vs. 1520 for the rest of the year, P = 0.003). Conversely, scheduled admissions remained relatively stable all year‐long: mean 423 per month for May through September vs. mean 413 per month for October through April (P = 0.48). Even just the summer months of June‐August, when school‐age children are on vacation, were not significantly different from other months (440 vs. 404, P = 0.2).
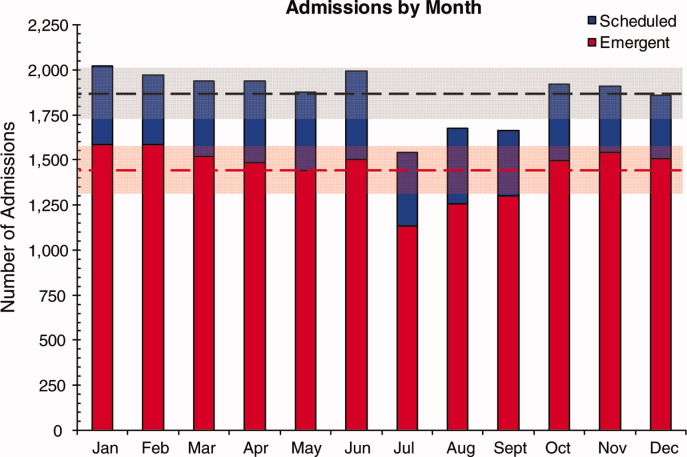
Variation in volume of admissions was large over days of the week, driven primarily by the pattern of scheduled admissions (CV 65.3%), which dropped off completely on weekends (Table 2, Figure 2). In contrast, there was much less variation in the number of emergent admissions across days of the week (CV 12%). For both emergent and scheduled admissions, more patients came in on Mondays than any other day of the week, but even more so for scheduled patients. While emergent admissions did decline on weekends, it was driven primarily by a decrease in physician referrals (ie, direct admission) from clinics (mean 7.48 per weekday vs. 0.73 per weekend day for the entire year, P < 0.001), while emergency department (ED) admissions remained relatively stable (mean 35.8 per weekday vs. 32.7 per weekend day, P = 0.08). Emergency transports were also stable (mean 7.15 per weekday vs. 6.49 per weekend day, P = 0.10).
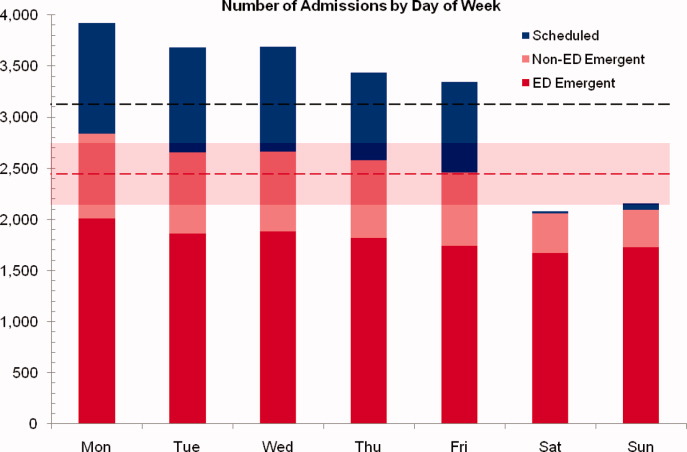
| All (%) | Scheduled (%) | Emergent (%) | |
|---|---|---|---|
| |||
| CV on admissions by month | 8 | 10 | 10 |
| CV on admissions over days of week (including weekends) | 24 | 65 | 12 |
| CV on admissions over days of week (excluding weekends) | 6 | 10 | 5 |
| CV on monthly occupancy over 12 months | 4 | 14 | 2 |
Although scheduled patients contributed less to the hospital's overall occupancy, they conferred most of the variability by day of week. Over the days of the week, variation for scheduled occupancy was nearly twice that for emergent occupancy (CV 19% vs. 10%). Within the higher‐volume period of October to April, the differential was even more evident (CV 19% for scheduled occupancy versus 6% for emergent).
For scheduled patients with LOS 30 days (98% of scheduled patients), Mondays and Tuesdays together accounted for 42.5% of admission volume and 44.7% of the patient‐hours generated. For scheduled patients with LOS 7 days (89% of scheduled patients), Mondays and Tuesdays together accounted for 42% of admission volume and 45.2% of the patient‐hours generated. This combined impact of volume and LOS from admissions earlier in the week (restricted to patients with LOS 7days) is displayed graphically in Figure 3, which depicts the unevenness of scheduled admissions and their time in the hospital, with many patients overlapping in the middle of the week. Together with the more steady flow of emergent patients, this variability in scheduled occupancy contributed to mid‐week crowding, with higher risk of the hospital being >90% and >95% occupied on Wednesday through Friday (Figure 4). Detailed hourly analysis (not displayed) showed this risk to be highest from Wednesday afternoon to Friday afternoon. Due to higher emergent census, certain months also had a higher risk of high occupancy at daily peak. For example, while the entire year had 50% to 60% of Wednesdays and Thursdays with occupancy >90%, during the months of November through February, 70% to 85% of those days had occupancy at that level or higher (all these patterns were seen for both stays with LOS 30 days and 7days).
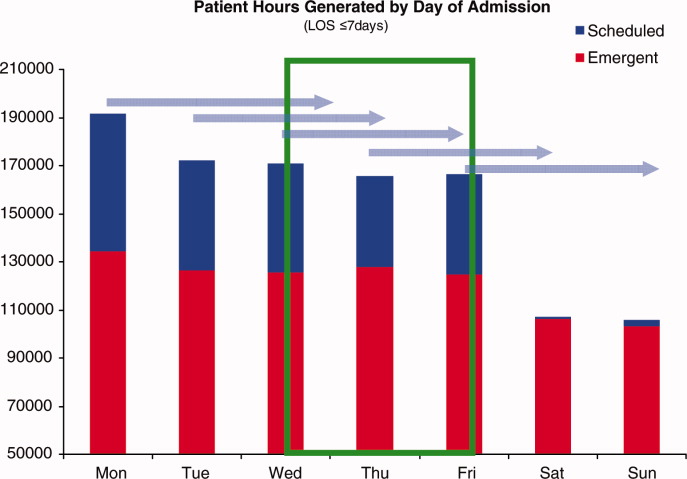
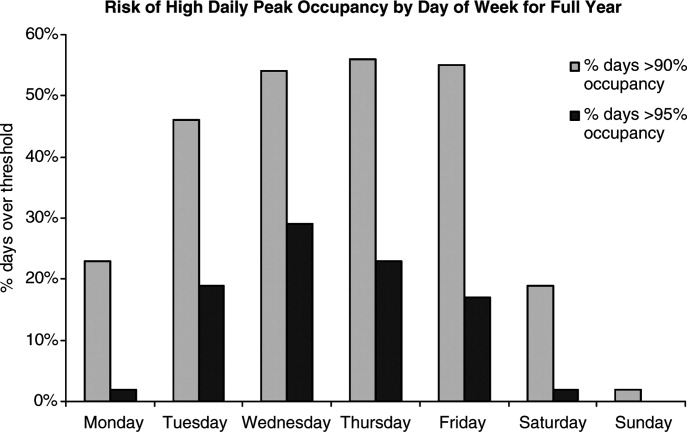
Discussion
In this study, we found that a large children's hospital was frequently at high occupancy in certain months and on certain days more than others, driven largely by predictable seasonal increases in emergent admissions and variability in scheduled admissions by day of week, respectively. Patient‐hours generated by day of admission varied as a result of both volume and LOS, both of which were larger in the early part of the week and diminished as the week progressed for scheduled admissions. But, the cumulative effect of many admissions with relatively‐longer LOS on Monday through Wednesday contributed to high occupancy on Wednesday afternoon to Friday morning, underscoring the importance of admission patterns on census later in the week. Our finding that the occupancy of scheduled patientsthe result of both the admission pattern and their LOSis also highly variable suggests that managing the inflow of scheduled patients could decrease crowding on weekdays, assure a consistent supply of capacity for regular admissions and surges, and improve the value of the delivery system.18 This inflow management would ideally consider both admissions and associated LOS, since rescheduling patients with a longer LOS (eg, 34 days) would have a greater impact on occupancy than rescheduling patients with a shorter LOS (eg, 12 days).
Not surprisingly, total admissions decreased in summer months, especially in July and August, due primarily to fewer emergent admissions. In fact, scheduled admissions per month remained relatively stable over the entire year. The decrease in summer emergent admissions may present an opportunity to stepwise shift a proportion of scheduled admissions from the spring and fall into the summer months, and winter into spring and fall, to alleviate crowding in the winter (Figure 1). Assuming clinical conditions, families and staff members were amenable to this change, hospitals with similar patterns could use this method to reduce the crowding (eg, days over 90% or 95% occupancy) that occurs in the winter.
Using patient‐hours (or days) generated by day of admission, it is evident that admission of more and longer‐stay patients at the start of the week contributes to higher occupancy later in the week (Figure 4). Mid‐week crowding could potentially contribute to a number of operational issues, including delays of new admissions, decreases in physician referrals and patient satisfaction, and an increased use of nontraditional beds (eg, treatment rooms, playrooms, doubling up single rooms) that lead to excessive patient to staff ratios and burnout for clinical staff.
The reasons for these patterns of admissions may include clinician or patient preference to avoid weekend admissions, lack of availability of particular services or resources on weekends, or concerns about safety and efficiency (due to relatively lower staffing on weekends in many hospitals).2230 While clinicians may prefer to avoid additional work on weekends, there are benefits to smoothing occupancy, including less risk of excessive work mid‐week and potential revenue opportunities. In addition, when contrasted with the estimated $1 million to $2 million cost per bed of construction, the marginal cost of staffing to provide safe, high‐quality care on weekends is dramatically lower than that of adding more beds (when faced with mid‐week crowding and unused weekend capacity). In addition, empty beds also do not generate revenue to cover fixed or variable costs, meaning that hospitals are not matching revenue to cost when there is unused capacity due to artificial variability.15, 31 Hospitals looking to make greater use of weekends, however, must be sensitive to staff concerns and the organizational dynamics of 7‐day operations, including the risk for burn‐out and attrition. Such factors should not be perceived as insurmountable barriers, particularly in light of opportunities for flexible scheduling and gain‐sharing.
Patients' and parents' preferences may partially drive admitting patterns, but a reasonable proportion of them may prefer to minimize the number of work and school days missed by being admitted near or on weekends. For example, an expected 3‐day admission could start on Friday and end on Sunday or Monday, rather than the current practice which appears to be to admit on Monday and discharge before the weekend. This may not only meet preferences among some parents to avoid missing work or school, but also by consideration of educational outcomes for hospitalized children.32
In addition, higher mean LOS for emergent patients on the weekends suggests that some services are currently unavailable on weekends to treat patients who are admitted on Fridays through Sundays.2, 25, 29, 33 More even staffing and provision of diagnostic and therapeutic services on weekends (eg, advanced radiology, consult, and laboratory services) would not only remove the barrier to weekend occupancy, it would also improve efficiency, timeliness, patient‐centeredness, and potentially effectiveness and safety for emergent patients. Running hospitals at full functionality on only 5 days of the week means that 2 out of 7 days puts patients at risk for disparate care, which may be appearing in this analysis as prolonged LOS due to lack of services over the weekenda pattern reported in the literature for adult hospitals.
Operations management and queuing theory suggest that systems function well up to 85% to 90% of capacity.34 Hospitals that plan ahead and ensure a buffer for unscheduled admissions during months or days when that demand is known to rise are less likely to cross into high occupancy. On the other hand, hospitals that do not anticipate increases in unscheduled admissions are more likely to encounter excess capacity problems.35 Aligning incentives with all staff can assist in this planning and maximize control of capacity.
Adopting the use of CV in health care operations would also be of value as a way to better express and track variation in admissions, occupancy, and discharges. Since different patient populations, different units, different hospitals, and different months have different scales, SD is not easily comparable across these settings. CV allows for comparison of variation by normalizing on the mean. In this study, it clearly differentiated the variation in elective admissions (CV 65%) over days of the week from the relative stability of emergent admissions (CV 12%). As variability and its management are important to operations, quality control, and quality improvement, use of CV can play an important role in hospital management and health services research. As days with high levels of activity may put more stress on the system, tracking this variation could lead to improvements in quality and value.
This study has several limitations. Data were analyzed for 1 children's hospital, so the analysis may or may not generally apply to other hospitals. However, in a separate study, we analyzed data from the Pediatric Health Information System database, and observed similar patterns.18 In addition, the proportion of elective patients shown in this study was similar to the national data in Kids Inpatient Database (KID, about 15% of all admissions elective).36 Moreover, the methods are reproducible for other settings, which would be useful to clinical and hospital leadership. Second, the trends depicted in the data only reflected data for one year. Third, coding of the admission as emergent or elective was done by registrars at or before arrival and may not reflect actual clinical need. In addition, those admissions coded as elective included a heterogeneous population (eg, chemotherapy to research studies).
Further studies should analyze trends for other hospitals and evaluate the effect of high peak census and high levels of variation with quality, safety, efficiency, patient satisfaction, financial, and educational outcomes for those receiving care, working, or learning at hospitals. In addition, a qualitative study that develops insights into clinician and patient/parent preferences would help answer questions in regard to usage of weekends for scheduled patients.
Conclusions
Scheduled admissions drive most variability in day‐to‐day occupancy despite the fact that they are a smaller proportion of the inpatient population. Variation in scheduled admissions by day of week provides hospitals with an opportunity to address crowding without adding beds or delaying admissions. Rather, fully utilizing capacity by smoothing occupancy over all days of the week can reduce the risk of high occupancy and thereby improve accessibility and patient/parent satisfaction. While family and staff preferences need to be considered, some combination of within‐week smoothing and shifting admissions towards summer are likely to achieve dramatic improvements in patient flow without large expenditures of capital. The key, then, is to ensure that organizational dynamic factors support these changes, so that staff members do not become stressed working at a 7‐day facility. Taken together, these strategies would better match revenue to capacity, and ultimately increase the quality and value of healthcare operations.
Acknowledgements
Authors' contributions: Study concept and design: Fieldston, Ragavan. Analysis and interpretation of data: Ragavan, Fieldston, Jayaraman, Pati. Drafting of the manuscript: Ragavan, Fieldston. Critical Revision of the manuscript for important intellectual content: Fieldston, Ragavan, Pati, Metlay. Statistical analysis: Fieldston, Jayaraman, Ragavan, Allebach. Study supervision: Fieldston, Pati, Metlay.
Additional contributions: The authors the fellows and faculty of the Robert Wood Johnson Foundation Clinical Scholars Program at the University of Pennsylvania and members of its Community Advisory Board for their suggestions to this work. They also wish to thank Tracy Kish, Jennifer Massenburg, and Brian Smith for assistance with access to and interpretation of hospital census and bed capacity data.
- ,,,,,.Relationship between resident workload and self‐perceived learning on inpatient medicine wards: a longitudinal study.BMC Med Educ.2006;6(1):35.
- AHA Solutions, Patient Flow Challenges Assessment 2009. Chicago, IL.2009.
- ,.Patient flow in hospitals: understanding and controlling it better.Front Health Serv Manage.2004;20:3–15.
- . Managing Variability in Patient Flow is the Key to Improving Access to Care, Nursing Staffing, Quality of Care, and Reducing Its Cost. Paper presented at: Institute of Medicine; June 24,2004.
- ,,,,,.Managing unnecessary variability in patient demand to reduce nursing stress and improve patient safety.Jt Comm J Qual Patient Saf.2005;31(6):330–338.
- ,,.Developing models for patient flow and daily surge capacity research.Acad Emerg Med.2006;13(11):1109–1113.
- Institute for Healthcare Improvement, Flow initiatives. 2008. Available at: http://www.ihi.org/IHI/Topics/Flow. Accessed June2010.
- ,,, et al.Hospital workload and adverse events.Med Care.2007;45(5):448–455.
- ,,,,.Impact of admission‐day crowding on the length of stay of pediatric hospitalizations.Pediatrics.2008;121(4):e718–730.
- ,,,,.Emergency department crowding, Part 1: concept, causes, and moral consequences.Ann Emerg Med.2009;53(5):605–611.
- ,.Emergency department overcrowding and ambulance diversion: the impact and potential solutions of extended boarding of admitted patients in the emergency department.J Emerg Med.2006;30(3):351–356.
- ,,,.A comparison of in‐hospital mortality risk conferred by high hospital occupancy, differences in nurse staffing levels, weekend admission, and seasonal influenza.Medical Care.2010;48(3):224–232.
- .,,.The effect of hospital bed occupancy on throughput in the pediatric emergency department.Ann Emerg Med.2009;53(6):767–776.e763.
- .Interpreting the Volume‐Outcome Relationship in the Context of Health Care Quality: Workshop Summary.Washington, DC:National Academies Press;2000.
- ,.Uncertain demand, the structure of hospital costs, and the cost of empty hospital beds.J Health Econ.1995;14(3):291–317.
- ,,, et al.Variability in surgical caseload and access to intensive care services.Anesthesiology.2003;98(6):1491–1496.
- ,,,,.Effects of hospital care environment on patient mortality and nurse outcomes.J Nurs Adm.2009;39(7/8):S45–S51.
- ,,, et al.Children's hospitals do not acutely respond to high occupancy.Pediatrics.2010;125:974–981.
- ,.Easing the strain on a pediatric tertiary care center: use of a redistribution system.Arch Pediatr Adolesc Med.2007;161(9):870–876.
- ,,.Lengths of stay and costs associated with Children's Hospitals.Pediatrics.2005;115:839–844.
- ,.Matching Supply with Demand: An introduction to operations management.New York:McGraw‐Hill;2006.
- .Do hospitals provide lower quality care on weekends?Health Serv Res.2007;42:1589–1612.
- ,.Waiting for urgent procedures on the weekend among emergently hospitalized patients.Am J Med.2004;117:175–181.
- ,.Mortality among patients admitted to hospitals on weekends as compared with weekdays.N Engl J Med.2001;345:663–668.
- ,.Enhanced weekend service: an affordable means to increased hospital procedure volume.CMAJ.2005;172(4):503–504.
- .Hospital deaths and weekend admissions‐how do we leap across a chasm?Clin Nurse Spec.2002;16:91–92.
- ,.Weekend birth and higher neonatal mortality: a problem of patient acuity or quality of care?J Obstet Gynecol Neonatal Nurs.2003;32(6):724–733.
- ,,, et al.Weekend versus weekday admission and mortality from myocardial infarction.N Engl J Med.2007;356:1099–1109.
- .Weekend admission and treatment of patients with renal colic: a case of avoidable variation?Urology.2009;73(4):720–724.
- ,,.Characteristics of weekday and weekend hospital admissions.HCUP Statistical Brief.2010;87. http://www.hcup‐us.ahrq.gov/reports/statbriefs/sb87.pdf.
- ,. Hospital Costs and the Cost of Empty Hospital Beds (NBER Working Paper No. W3872).1991.
- ,,.The effects of timing of pediatric knee ligament surgery on short‐term academic performance in school‐aged athletes.Am J Sports Med.2009;37(9):1684–1691.
- Institute for Healthcare Improvement, Smoothing Elective Surgical Admissions. Available at: http://www.ihi.org/IHI/Topics/Flow/PatientFlow/EmergingContent/SmoothingElectiveSurgicalAdmissions.htm. Accessed June2010.
- . Institute for Healthcare Improvement, Patient Flow Comments. Available at: http://www.ihi.org/IHI/Topics/Flow. Accessed June2010.
- .OPIM 631: Operations Management.Wharton School, University of Pennsylvania.Philadelphia, PA.2008.
- Agency for Healthcare Research and Quality. HCUP Databases, Healthcare Cost and Utilization Project (HCUP). 2008. Available at: www.hcup‐us.ahrq.gov/kidoverview.jsp. Accessed June2010.
Patient flow in a hospital refers to the management and movement of patients through the facility. Optimizing patient flow is considered of great importance to improvement of quality (including safety, efficiency, timeliness, equity, effectiveness, and patient‐centeredness), as well as finance, staff satisfaction, education and overall healthcare value.18 Central to concerns about patient flow at hospitals is occupancy, which is the census (number of patients at a point in time) divided by the bed capacity. Occupancy that is too high is associated with challenges to quality and access,913 while occupancy that is too low may underutilize resources and be costly.14, 15 Occupancy is determined by the pattern of admission and discharge, thus including length of stay (LOS) as a factor. While all related, admissions, census, occupancy, and LOS convey different aspects of hospital operations and may point to different opportunities to improve patient flow.
Variability in patient flow over time has been noted as a common occurrence in adult hospitals, due to uneven patterns of scheduled (elective) admissions, as well as uncontrollable variability of emergent admissions.2, 45, 16 Typically very few patients are scheduled to enter hospitals over weekends. In addition, when the admission is expected to be 5 days or less, clinical and operational staff may schedule those admissions early in the week to avoid patients staying the weekend. This artificial variability has been shown to lead to uneven levels of occupancy, with crowding on some days of the week more than others.2, 45, 16 As hospital crowding adversely affects access to emergent and elective care, quality and safety of care, and patient and staff satisfaction, many groups are focusing attention on patient flow and strategies to avoid high occupancy.19, 17 This is true for children's hospitals, as well, particularly as these scarce resources have ever increasing demand placed on them.1820
Patient flow improvements can be made by increasing efficiency of throughput, primarily measured by decreased LOS, or by addressing artificial variability in how hospital beds are used. As children's hospitals have short LOSs and are relatively efficient (as measured by standardized LOS ratios), we sought to evaluate how much artificial variability was active at 1 large children's hospital. We did this to both evaluate flow at 1 institution and to create methodology for other hospitals to use in order to better understand and improve their flow.
Our specific aims were to describe daily and monthly variability in admission, discharge, LOS, and occupancy patterns at a large children's hospital and assess the relationship between scheduled admissions and occupancy.
Methods
This retrospective administrative data analysis was performed with admission‐discharge‐transfer (ADT) data for inpatient admissions from one urban, tertiary‐care children's hospital for the period July 1, 2007 to June 30, 2008. The dataset included the date and time of all arrivals and departures from all inpatient units (including observation‐status patients), as entered by the unit clerks into the electronic ADT system. The dataset also included categorization of the admission as emergent, urgent, or elective (hereafter referred to as scheduled.) Registration staff entered these codes at or prior to admission. Using the timestamps, LOS was calculated by subtracting admission date and time from discharge date and time. An SAS macro was applied to the timestamps to calculate a hospital census for every hour of each calendar day. Peak census figures were extracted for each day. Occupancy was calculated as census over number of beds in use (monthly average). Data for the hospital's peak daily census and occupancy were utilized to analyze patterns of occupancy by day of week and month of year. To express variability, coefficient of variation (CV) (standard deviation [SD] divided by its mean) was used, as it is helpful when samples sizes are different.21
Analysis of number of admissions per day of week and month by type was performed with descriptive statistics and t‐tests for significant differences across seasons. We calculated a measure of patient hours generated by day of admission based on the LOS generated by each admission, in which the average number of admissions for each day of the week was multiplied by the average LOS (in hours) for those admissions. In order to remove outliers and focus on patients whose occupancy would affect weekly variation, we analyzed in detail the admissions with LOS 30 days and 7 days, respectively.
Statistical analyses were performed with SAS 9.2 (SAS Institute, Cary, NC), Stata 10.0 (StataCorp, College Station, TX) and Microsoft Excel (Microsoft, Redmond, WA). The study was approved by the Human Subjects Committee of the hospital's Institutional Review Board.
Results
A total of 22,310 patients were admitted over the period July 1, 2007 to June 30, 2008, including 4957 (22%) coded as scheduled and 17,353 (78%) coded as emergent. (Only 200 patients were registered as urgent and these were recoded as emergent for this analysis). Details on admission types and discharging departments are provided in Table 1. Overall, mean LOS was 5.6 days (median 2.29 days). For patients with LOS 30 days, mean LOS was 3.88 days (median 2.22 days). For patients staying 7 days, mean LOS was 2.4 days (median 1.98 days). Among patients with LOS 7 days, mean LOS for scheduled patients was longer for those admitted on Monday than on any other weekday (2.49 vs. 2.08 days, P < 0.0001). In contrast, mean LOS for emergent patients was longer for patients admitted on Friday and Saturday than the rest of the week (2.57 vs. 2.44 days, P < 0.0001).
| All | Scheduled | Emergent | |
|---|---|---|---|
| |||
| Total Admissions, n (%)* | 22,310 | 4957 (22) | 17,353 (78) |
| Median LOS (days) | 2.29 | 1.93 | 2.50 |
| Mean LOS (days) (95% CI) | 5.60 (5.41, 5.79) | 4.20 (3.95, 4.45) | 5.78 (5.596.0) |
| % Patients with LOS 30 days (%) | 97 | 98 | 96 |
| % Patients with LOS 7 days (%) | 84 | 89 | 83 |
| Medical patients at discharge, n (%) | 16,586 (74) | 2363 (48) | 14,403 (83) |
| Surgical patients at discharge, n (%) | 4276 (19) | 2450 (49) | 1826 (10.5) |
| Critical care patients at discharge (NICU, PICU, CICU), n (%) | 1433 (6) | 140 (3) | 1293 (7.5) |
Total admissions per month (Figure 1) averaged 1937 in October through April and 1751 in May through September (P = 0.03). Variation in the number of emergent and scheduled patients over months of the year were similar (CV 10% for each), but emergent admissions did decrease in summer (mean 1299 for June‐September vs. 1520 for the rest of the year, P = 0.003). Conversely, scheduled admissions remained relatively stable all year‐long: mean 423 per month for May through September vs. mean 413 per month for October through April (P = 0.48). Even just the summer months of June‐August, when school‐age children are on vacation, were not significantly different from other months (440 vs. 404, P = 0.2).
Variation in volume of admissions was large over days of the week, driven primarily by the pattern of scheduled admissions (CV 65.3%), which dropped off completely on weekends (Table 2, Figure 2). In contrast, there was much less variation in the number of emergent admissions across days of the week (CV 12%). For both emergent and scheduled admissions, more patients came in on Mondays than any other day of the week, but even more so for scheduled patients. While emergent admissions did decline on weekends, it was driven primarily by a decrease in physician referrals (ie, direct admission) from clinics (mean 7.48 per weekday vs. 0.73 per weekend day for the entire year, P < 0.001), while emergency department (ED) admissions remained relatively stable (mean 35.8 per weekday vs. 32.7 per weekend day, P = 0.08). Emergency transports were also stable (mean 7.15 per weekday vs. 6.49 per weekend day, P = 0.10).
| All (%) | Scheduled (%) | Emergent (%) | |
|---|---|---|---|
| |||
| CV on admissions by month | 8 | 10 | 10 |
| CV on admissions over days of week (including weekends) | 24 | 65 | 12 |
| CV on admissions over days of week (excluding weekends) | 6 | 10 | 5 |
| CV on monthly occupancy over 12 months | 4 | 14 | 2 |
Although scheduled patients contributed less to the hospital's overall occupancy, they conferred most of the variability by day of week. Over the days of the week, variation for scheduled occupancy was nearly twice that for emergent occupancy (CV 19% vs. 10%). Within the higher‐volume period of October to April, the differential was even more evident (CV 19% for scheduled occupancy versus 6% for emergent).
For scheduled patients with LOS 30 days (98% of scheduled patients), Mondays and Tuesdays together accounted for 42.5% of admission volume and 44.7% of the patient‐hours generated. For scheduled patients with LOS 7 days (89% of scheduled patients), Mondays and Tuesdays together accounted for 42% of admission volume and 45.2% of the patient‐hours generated. This combined impact of volume and LOS from admissions earlier in the week (restricted to patients with LOS 7days) is displayed graphically in Figure 3, which depicts the unevenness of scheduled admissions and their time in the hospital, with many patients overlapping in the middle of the week. Together with the more steady flow of emergent patients, this variability in scheduled occupancy contributed to mid‐week crowding, with higher risk of the hospital being >90% and >95% occupied on Wednesday through Friday (Figure 4). Detailed hourly analysis (not displayed) showed this risk to be highest from Wednesday afternoon to Friday afternoon. Due to higher emergent census, certain months also had a higher risk of high occupancy at daily peak. For example, while the entire year had 50% to 60% of Wednesdays and Thursdays with occupancy >90%, during the months of November through February, 70% to 85% of those days had occupancy at that level or higher (all these patterns were seen for both stays with LOS 30 days and 7days).
Discussion
In this study, we found that a large children's hospital was frequently at high occupancy in certain months and on certain days more than others, driven largely by predictable seasonal increases in emergent admissions and variability in scheduled admissions by day of week, respectively. Patient‐hours generated by day of admission varied as a result of both volume and LOS, both of which were larger in the early part of the week and diminished as the week progressed for scheduled admissions. But, the cumulative effect of many admissions with relatively‐longer LOS on Monday through Wednesday contributed to high occupancy on Wednesday afternoon to Friday morning, underscoring the importance of admission patterns on census later in the week. Our finding that the occupancy of scheduled patientsthe result of both the admission pattern and their LOSis also highly variable suggests that managing the inflow of scheduled patients could decrease crowding on weekdays, assure a consistent supply of capacity for regular admissions and surges, and improve the value of the delivery system.18 This inflow management would ideally consider both admissions and associated LOS, since rescheduling patients with a longer LOS (eg, 34 days) would have a greater impact on occupancy than rescheduling patients with a shorter LOS (eg, 12 days).
Not surprisingly, total admissions decreased in summer months, especially in July and August, due primarily to fewer emergent admissions. In fact, scheduled admissions per month remained relatively stable over the entire year. The decrease in summer emergent admissions may present an opportunity to stepwise shift a proportion of scheduled admissions from the spring and fall into the summer months, and winter into spring and fall, to alleviate crowding in the winter (Figure 1). Assuming clinical conditions, families and staff members were amenable to this change, hospitals with similar patterns could use this method to reduce the crowding (eg, days over 90% or 95% occupancy) that occurs in the winter.
Using patient‐hours (or days) generated by day of admission, it is evident that admission of more and longer‐stay patients at the start of the week contributes to higher occupancy later in the week (Figure 4). Mid‐week crowding could potentially contribute to a number of operational issues, including delays of new admissions, decreases in physician referrals and patient satisfaction, and an increased use of nontraditional beds (eg, treatment rooms, playrooms, doubling up single rooms) that lead to excessive patient to staff ratios and burnout for clinical staff.
The reasons for these patterns of admissions may include clinician or patient preference to avoid weekend admissions, lack of availability of particular services or resources on weekends, or concerns about safety and efficiency (due to relatively lower staffing on weekends in many hospitals).2230 While clinicians may prefer to avoid additional work on weekends, there are benefits to smoothing occupancy, including less risk of excessive work mid‐week and potential revenue opportunities. In addition, when contrasted with the estimated $1 million to $2 million cost per bed of construction, the marginal cost of staffing to provide safe, high‐quality care on weekends is dramatically lower than that of adding more beds (when faced with mid‐week crowding and unused weekend capacity). In addition, empty beds also do not generate revenue to cover fixed or variable costs, meaning that hospitals are not matching revenue to cost when there is unused capacity due to artificial variability.15, 31 Hospitals looking to make greater use of weekends, however, must be sensitive to staff concerns and the organizational dynamics of 7‐day operations, including the risk for burn‐out and attrition. Such factors should not be perceived as insurmountable barriers, particularly in light of opportunities for flexible scheduling and gain‐sharing.
Patients' and parents' preferences may partially drive admitting patterns, but a reasonable proportion of them may prefer to minimize the number of work and school days missed by being admitted near or on weekends. For example, an expected 3‐day admission could start on Friday and end on Sunday or Monday, rather than the current practice which appears to be to admit on Monday and discharge before the weekend. This may not only meet preferences among some parents to avoid missing work or school, but also by consideration of educational outcomes for hospitalized children.32
In addition, higher mean LOS for emergent patients on the weekends suggests that some services are currently unavailable on weekends to treat patients who are admitted on Fridays through Sundays.2, 25, 29, 33 More even staffing and provision of diagnostic and therapeutic services on weekends (eg, advanced radiology, consult, and laboratory services) would not only remove the barrier to weekend occupancy, it would also improve efficiency, timeliness, patient‐centeredness, and potentially effectiveness and safety for emergent patients. Running hospitals at full functionality on only 5 days of the week means that 2 out of 7 days puts patients at risk for disparate care, which may be appearing in this analysis as prolonged LOS due to lack of services over the weekenda pattern reported in the literature for adult hospitals.
Operations management and queuing theory suggest that systems function well up to 85% to 90% of capacity.34 Hospitals that plan ahead and ensure a buffer for unscheduled admissions during months or days when that demand is known to rise are less likely to cross into high occupancy. On the other hand, hospitals that do not anticipate increases in unscheduled admissions are more likely to encounter excess capacity problems.35 Aligning incentives with all staff can assist in this planning and maximize control of capacity.
Adopting the use of CV in health care operations would also be of value as a way to better express and track variation in admissions, occupancy, and discharges. Since different patient populations, different units, different hospitals, and different months have different scales, SD is not easily comparable across these settings. CV allows for comparison of variation by normalizing on the mean. In this study, it clearly differentiated the variation in elective admissions (CV 65%) over days of the week from the relative stability of emergent admissions (CV 12%). As variability and its management are important to operations, quality control, and quality improvement, use of CV can play an important role in hospital management and health services research. As days with high levels of activity may put more stress on the system, tracking this variation could lead to improvements in quality and value.
This study has several limitations. Data were analyzed for 1 children's hospital, so the analysis may or may not generally apply to other hospitals. However, in a separate study, we analyzed data from the Pediatric Health Information System database, and observed similar patterns.18 In addition, the proportion of elective patients shown in this study was similar to the national data in Kids Inpatient Database (KID, about 15% of all admissions elective).36 Moreover, the methods are reproducible for other settings, which would be useful to clinical and hospital leadership. Second, the trends depicted in the data only reflected data for one year. Third, coding of the admission as emergent or elective was done by registrars at or before arrival and may not reflect actual clinical need. In addition, those admissions coded as elective included a heterogeneous population (eg, chemotherapy to research studies).
Further studies should analyze trends for other hospitals and evaluate the effect of high peak census and high levels of variation with quality, safety, efficiency, patient satisfaction, financial, and educational outcomes for those receiving care, working, or learning at hospitals. In addition, a qualitative study that develops insights into clinician and patient/parent preferences would help answer questions in regard to usage of weekends for scheduled patients.
Conclusions
Scheduled admissions drive most variability in day‐to‐day occupancy despite the fact that they are a smaller proportion of the inpatient population. Variation in scheduled admissions by day of week provides hospitals with an opportunity to address crowding without adding beds or delaying admissions. Rather, fully utilizing capacity by smoothing occupancy over all days of the week can reduce the risk of high occupancy and thereby improve accessibility and patient/parent satisfaction. While family and staff preferences need to be considered, some combination of within‐week smoothing and shifting admissions towards summer are likely to achieve dramatic improvements in patient flow without large expenditures of capital. The key, then, is to ensure that organizational dynamic factors support these changes, so that staff members do not become stressed working at a 7‐day facility. Taken together, these strategies would better match revenue to capacity, and ultimately increase the quality and value of healthcare operations.
Acknowledgements
Authors' contributions: Study concept and design: Fieldston, Ragavan. Analysis and interpretation of data: Ragavan, Fieldston, Jayaraman, Pati. Drafting of the manuscript: Ragavan, Fieldston. Critical Revision of the manuscript for important intellectual content: Fieldston, Ragavan, Pati, Metlay. Statistical analysis: Fieldston, Jayaraman, Ragavan, Allebach. Study supervision: Fieldston, Pati, Metlay.
Additional contributions: The authors the fellows and faculty of the Robert Wood Johnson Foundation Clinical Scholars Program at the University of Pennsylvania and members of its Community Advisory Board for their suggestions to this work. They also wish to thank Tracy Kish, Jennifer Massenburg, and Brian Smith for assistance with access to and interpretation of hospital census and bed capacity data.
- ,,,,,.Relationship between resident workload and self‐perceived learning on inpatient medicine wards: a longitudinal study.BMC Med Educ.2006;6(1):35.
- AHA Solutions, Patient Flow Challenges Assessment 2009. Chicago, IL.2009.
- ,.Patient flow in hospitals: understanding and controlling it better.Front Health Serv Manage.2004;20:3–15.
- . Managing Variability in Patient Flow is the Key to Improving Access to Care, Nursing Staffing, Quality of Care, and Reducing Its Cost. Paper presented at: Institute of Medicine; June 24,2004.
- ,,,,,.Managing unnecessary variability in patient demand to reduce nursing stress and improve patient safety.Jt Comm J Qual Patient Saf.2005;31(6):330–338.
- ,,.Developing models for patient flow and daily surge capacity research.Acad Emerg Med.2006;13(11):1109–1113.
- Institute for Healthcare Improvement, Flow initiatives. 2008. Available at: http://www.ihi.org/IHI/Topics/Flow. Accessed June2010.
- ,,, et al.Hospital workload and adverse events.Med Care.2007;45(5):448–455.
- ,,,,.Impact of admission‐day crowding on the length of stay of pediatric hospitalizations.Pediatrics.2008;121(4):e718–730.
- ,,,,.Emergency department crowding, Part 1: concept, causes, and moral consequences.Ann Emerg Med.2009;53(5):605–611.
- ,.Emergency department overcrowding and ambulance diversion: the impact and potential solutions of extended boarding of admitted patients in the emergency department.J Emerg Med.2006;30(3):351–356.
- ,,,.A comparison of in‐hospital mortality risk conferred by high hospital occupancy, differences in nurse staffing levels, weekend admission, and seasonal influenza.Medical Care.2010;48(3):224–232.
- .,,.The effect of hospital bed occupancy on throughput in the pediatric emergency department.Ann Emerg Med.2009;53(6):767–776.e763.
- .Interpreting the Volume‐Outcome Relationship in the Context of Health Care Quality: Workshop Summary.Washington, DC:National Academies Press;2000.
- ,.Uncertain demand, the structure of hospital costs, and the cost of empty hospital beds.J Health Econ.1995;14(3):291–317.
- ,,, et al.Variability in surgical caseload and access to intensive care services.Anesthesiology.2003;98(6):1491–1496.
- ,,,,.Effects of hospital care environment on patient mortality and nurse outcomes.J Nurs Adm.2009;39(7/8):S45–S51.
- ,,, et al.Children's hospitals do not acutely respond to high occupancy.Pediatrics.2010;125:974–981.
- ,.Easing the strain on a pediatric tertiary care center: use of a redistribution system.Arch Pediatr Adolesc Med.2007;161(9):870–876.
- ,,.Lengths of stay and costs associated with Children's Hospitals.Pediatrics.2005;115:839–844.
- ,.Matching Supply with Demand: An introduction to operations management.New York:McGraw‐Hill;2006.
- .Do hospitals provide lower quality care on weekends?Health Serv Res.2007;42:1589–1612.
- ,.Waiting for urgent procedures on the weekend among emergently hospitalized patients.Am J Med.2004;117:175–181.
- ,.Mortality among patients admitted to hospitals on weekends as compared with weekdays.N Engl J Med.2001;345:663–668.
- ,.Enhanced weekend service: an affordable means to increased hospital procedure volume.CMAJ.2005;172(4):503–504.
- .Hospital deaths and weekend admissions‐how do we leap across a chasm?Clin Nurse Spec.2002;16:91–92.
- ,.Weekend birth and higher neonatal mortality: a problem of patient acuity or quality of care?J Obstet Gynecol Neonatal Nurs.2003;32(6):724–733.
- ,,, et al.Weekend versus weekday admission and mortality from myocardial infarction.N Engl J Med.2007;356:1099–1109.
- .Weekend admission and treatment of patients with renal colic: a case of avoidable variation?Urology.2009;73(4):720–724.
- ,,.Characteristics of weekday and weekend hospital admissions.HCUP Statistical Brief.2010;87. http://www.hcup‐us.ahrq.gov/reports/statbriefs/sb87.pdf.
- ,. Hospital Costs and the Cost of Empty Hospital Beds (NBER Working Paper No. W3872).1991.
- ,,.The effects of timing of pediatric knee ligament surgery on short‐term academic performance in school‐aged athletes.Am J Sports Med.2009;37(9):1684–1691.
- Institute for Healthcare Improvement, Smoothing Elective Surgical Admissions. Available at: http://www.ihi.org/IHI/Topics/Flow/PatientFlow/EmergingContent/SmoothingElectiveSurgicalAdmissions.htm. Accessed June2010.
- . Institute for Healthcare Improvement, Patient Flow Comments. Available at: http://www.ihi.org/IHI/Topics/Flow. Accessed June2010.
- .OPIM 631: Operations Management.Wharton School, University of Pennsylvania.Philadelphia, PA.2008.
- Agency for Healthcare Research and Quality. HCUP Databases, Healthcare Cost and Utilization Project (HCUP). 2008. Available at: www.hcup‐us.ahrq.gov/kidoverview.jsp. Accessed June2010.
Copyright © 2010 Society of Hospital Medicine
