User login
Impact of Pneumonia Guidelines
Overutilization of resources is a significant, yet underappreciated, problem in medicine. Many interventions target underutilization (eg, immunizations) or misuse (eg, antibiotic prescribing for viral pharyngitis), yet overutilization remains as a significant contributor to healthcare waste.[1] In an effort to reduce waste, the Choosing Wisely campaign created a work group to highlight areas of overutilization, specifically noting both diagnostic tests and therapies for common pediatric conditions with no proven benefit and possible harm to the patient.[2] Respiratory illnesses have been a target of many quality‐improvement efforts, and pneumonia represents a common diagnosis in pediatrics.[3] The use of diagnostic testing for pneumonia is an area where care can be optimized and aligned with evidence.
Laboratory testing and diagnostic imaging are routinely used for the management of children with community‐acquired pneumonia (CAP). Several studies have documented substantial variability in the use of these resources for pneumonia management, with higher resource use associated with a higher chance of hospitalization after emergency department (ED) evaluation and a longer length of stay among those requiring hospitalization.[4, 5] This variation in diagnostic resource utilization has been attributed, at least in part, to a lack of consensus on the management of pneumonia. There is wide variability in diagnostic testing, and due to potential consequences for patients presenting with pneumonia, efforts to standardize care offer an opportunity to improve healthcare value.
In August 2011, the first national, evidence‐based consensus guidelines for the management of childhood CAP were published jointly by the Pediatric Infectious Diseases Society (PIDS) and the Infectious Diseases Society of America (IDSA).[6] A primary focus of these guidelines was the recommendation for the use of narrow spectrum antibiotics for the management of uncomplicated pneumonia. Previous studies have assessed the impact of the publication of the PIDS/IDSA guidelines on empiric antibiotic selection for the management of pneumonia.[7, 8] In addition, the guidelines provided recommendations regarding diagnostic test utilization, in particular discouraging blood tests (eg, complete blood counts) and radiologic studies for nontoxic, fully immunized children treated as outpatients, as well as repeat testing for children hospitalized with CAP who are improving.
Although single centers have demonstrated changes in utilization patterns based on clinical practice guidelines,[9, 10, 11, 12] whether these guidelines have impacted diagnostic test utilization among US children with CAP in a larger scale remains unknown. Therefore, we sought to determine the impact of the PIDS/IDSA guidelines on the use of diagnostic testing among children with CAP using a national sample of US children's hospitals. Because the guidelines discourage repeat diagnostic testing in patients who are improving, we also evaluated the association between repeat diagnostic studies and severity of illness.
METHODS
This retrospective cohort study used data from the Pediatric Health Information System (PHIS) (Children's Hospital Association, Overland Park, KS). The PHIS database contains deidentified administrative data, detailing demographic, diagnostic, procedure, and billing data from 47 freestanding, tertiary care children's hospitals. This database accounts for approximately 20% of all annual pediatric hospitalizations in the United States. Data quality is ensured through a joint effort between the Children's Hospital Association and participating hospitals.
Patient Population
Data from 32 (of the 47) hospitals included in PHIS with complete inpatient and ED data were used to evaluate hospital‐level resource utilization for children 1 to 18 years of age discharged January 1, 2008 to June 30, 2014 with a diagnosis of pneumonia (International Classification of Diseases, 9th Revision [ICD‐9] codes 480.x‐486.x, 487.0).[13] Our goal was to identify previously healthy children with uncomplicated pneumonia, so we excluded patients with complex chronic conditions,[14] billing charges for intensive care management and/or pleural drainage procedure (IDC‐9 codes 510.0, 510.9, 511.0, 511.1, 511.8, 511.9, 513.x) on day of admission or the next day, or prior pneumonia admission in the last 30 days. We studied 2 mutually exclusive populations: children with pneumonia treated in the ED (ie, patients who were evaluated in the ED and discharged to home), and children hospitalized with pneumonia, including those admitted through the ED.
Guideline Publication and Study Periods
For an exploratory before and after comparison, patients were grouped into 2 cohorts based on a guideline online publication date of August 1, 2011: preguideline (January 1, 2008 to July 31, 2011) and postguideline (August 1, 2011 to June 30, 2014).
Study Outcomes
The measured outcomes were the monthly proportion of pneumonia patients for whom specific diagnostic tests were performed, as determined from billing data. The diagnostic tests evaluated were complete blood count (CBC), blood culture, C‐reactive protein (CRP), and chest radiograph (CXR). Standardized costs were also calculated from PHIS charges as previously described to standardize the cost of the individual tests and remove interhospital cost variation.[3]
Relationship of Repeat Testing and Severity of Illness
Because higher illness severity and clinical deterioration may warrant repeat testing, we also explored the association of repeat diagnostic testing for inpatients with severity of illness by using the following variables as measures of severity: length of stay (LOS), transfer to intensive care unit (ICU), or pleural drainage procedure after admission (>2 calendar days after admission). Repeat diagnostic testing was stratified by number of tests.
Statistical Analysis
The categorical demographic characteristics of the pre‐ and postguideline populations were summarized using frequencies and percentages, and compared using 2 tests. Continuous demographics were summarized with medians and interquartile ranges (IQRs) and compared with the Wilcoxon rank sum test. Segmented regression, clustered by hospital, was used to assess trends in monthly resource utilization as well as associated standardized costs before and after guidelines publication. To estimate the impact of the guidelines overall, we compared the observed diagnostic resource use at the end of the study period with expected use projected from trends in the preguidelines period (ie, if there were no new guidelines). Individual interrupted time series were also built for each hospital. From these models, we assessed which hospitals had a significant difference between the rate observed at the end of the study and that estimated from their preguideline trajectory. To assess the relationship between the number of positive improvements at a hospital and hospital characteristics, we used Spearman's correlation and Kruskal‐Wallis tests. All analyses were performed with SAS version 9.3 (SAS Institute, Inc., Cary, NC), and P values <0.05 were considered statistically significant. In accordance with the policies of the Cincinnati Children's Hospital Medical Center Institutional Review Board, this research, using a deidentified dataset, was not considered human subjects research.
RESULTS
There were 275,288 hospital admissions meeting study inclusion criteria of 1 to 18 years of age with a diagnosis of pneumonia from 2008 to 2014. Of these, 54,749 met exclusion criteria (1874 had pleural drainage procedure on day 0 or 1, 51,306 had complex chronic conditions, 1569 were hospitalized with pneumonia in the last 30 days). Characteristics of the remaining 220,539 patients in the final sample are shown in Table 1. The median age was 4 years (IQR, 27 years); a majority of the children were male (53%) and had public insurance (58%). There were 128,855 patients in the preguideline period (January 1, 2008 to July 31, 2011) and 91,684 in the post guideline period (August 1, 2011June 30, 2014).
| Overall | Preguideline | Postguideline | P | |
|---|---|---|---|---|
| ||||
| No. of discharges | 220,539 | 128,855 | 91,684 | |
| Type of encounter | ||||
| ED only | 150,215 (68.1) | 88,790 (68.9) | 61,425 (67) | <0.001 |
| Inpatient | 70,324 (31.9) | 40,065 (31.1) | 30,259 (33) | |
| Age | ||||
| 14 years | 129,360 (58.7) | 77,802 (60.4) | 51,558 (56.2) | <0.001 |
| 59 years | 58,609 (26.6) | 32,708 (25.4) | 25,901 (28.3) | |
| 1018 years | 32,570 (14.8) | 18,345 (14.2) | 14,225 (15.5) | |
| Median [IQR] | 4 [27] | 3 [27] | 4 [27] | <0.001 |
| Gender | ||||
| Male | 116,718 (52.9) | 68,319 (53) | 48,399 (52.8) | 00.285 |
| Female | 103,813 (47.1) | 60,532 (47) | 43,281 (47.2) | |
| Race | ||||
| Non‐Hispanic white | 84,423 (38.3) | 47,327 (36.7) | 37,096 (40.5) | <0.001 |
| Non‐Hispanic black | 60,062 (27.2) | 35,870 (27.8) | 24,192 (26.4) | |
| Hispanic | 51,184 (23.2) | 31,167 (24.2) | 20,017 (21.8) | |
| Asian | 6,444 (2.9) | 3,691 (2.9) | 2,753 (3) | |
| Other | 18,426 (8.4) | 10,800 (8.4) | 7,626 (8.3) | |
| Payer | ||||
| Government | 128,047 (58.1) | 70,742 (54.9) | 57,305 (62.5) | <0.001 |
| Private | 73,338 (33.3) | 44,410 (34.5) | 28,928 (31.6) | |
| Other | 19,154 (8.7) | 13,703 (10.6) | 5,451 (5.9) | |
| Disposition | ||||
| HHS | 684 (0.3) | 411 (0.3) | 273 (0.3) | <0.001 |
| Home | 209,710 (95.1) | 123,236 (95.6) | 86,474 (94.3) | |
| Other | 9,749 (4.4) | 4,962 (3.9) | 4,787 (5.2) | |
| SNF | 396 (0.2) | 246 (0.2) | 150 (0.2) | |
| Season | ||||
| Spring | 60,171 (27.3) | 36,709 (28.5) | 23,462 (25.6) | <0.001 |
| Summer | 29,891 (13.6) | 17,748 (13.8) | 12,143 (13.2) | |
| Fall | 52,161 (23.7) | 28,332 (22) | 23,829 (26) | |
| Winter | 78,316 (35.5) | 46,066 (35.8) | 32,250 (35.2) | |
| LOS | ||||
| 13 days | 204,812 (92.9) | 119,497 (92.7) | 85,315 (93.1) | <0.001 |
| 46 days | 10,454 (4.7) | 6,148 (4.8) | 4,306 (4.7) | |
| 7+ days | 5,273 (2.4) | 3,210 (2.5) | 2,063 (2.3) | |
| Median [IQR] | 1 [11] | 1 [11] | 1 [11] | 0.144 |
| Admitted patients, median [IQR] | 2 [13] | 2 [13] | 2 [13] | <0.001 |
Discharged From the ED
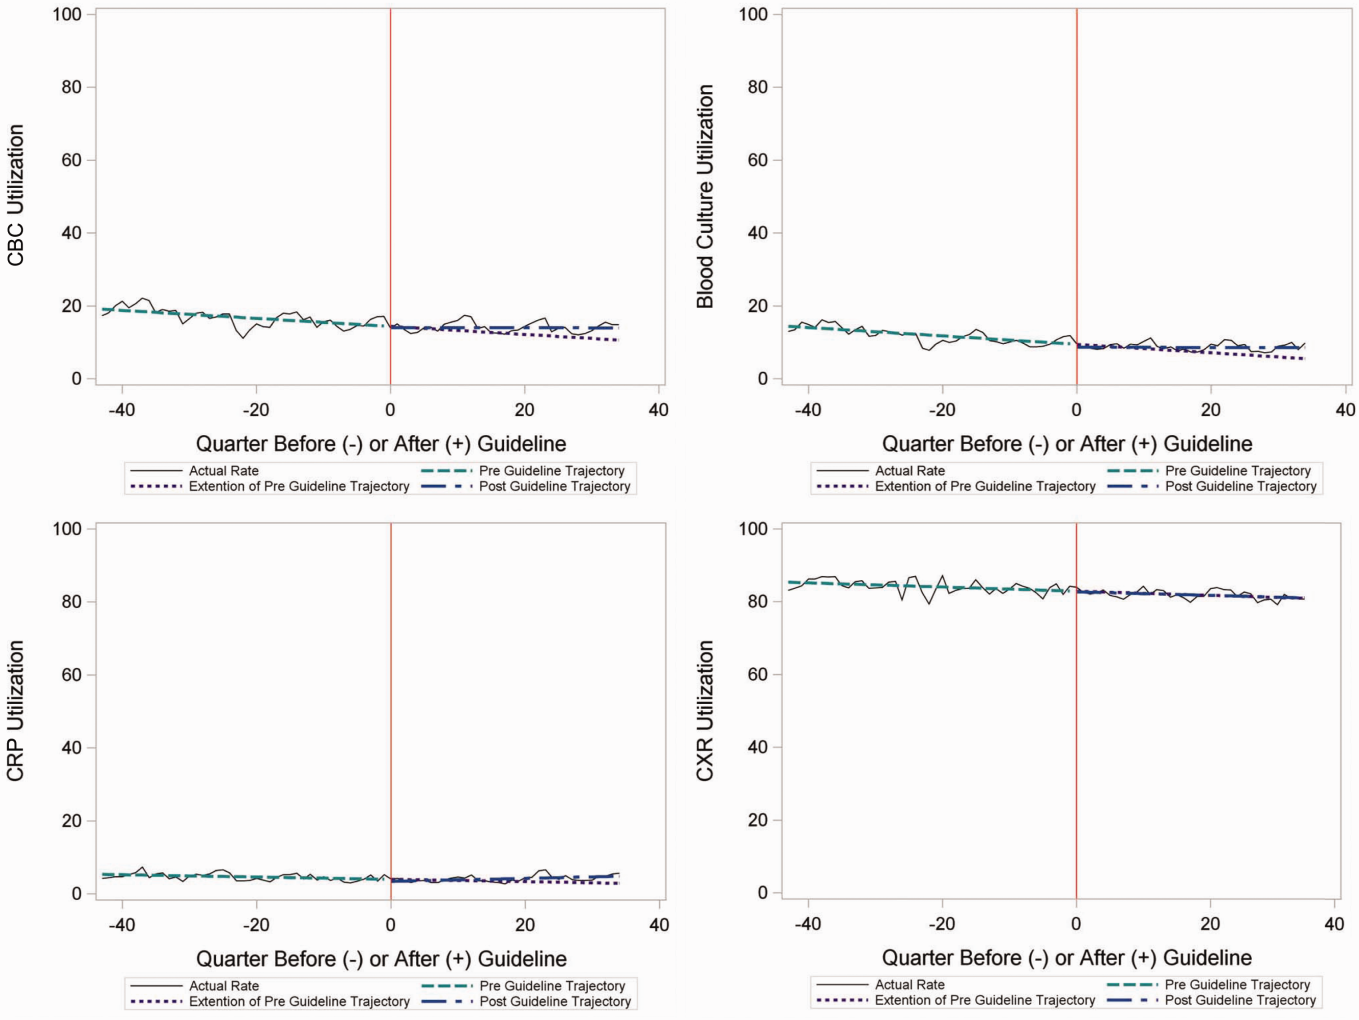
Throughout the study, utilization of CBC, blood cultures, and CRP was <20%, whereas CXR use was >75%. In segmented regression analysis, CRP utilization was relatively stable before the guidelines publication. However, by the end of the study period, the projected estimate of CRP utilization without guidelines (expected) was 2.9% compared with 4.8% with the guidelines (observed) (P < 0.05) (Figure 1). A similar pattern of higher rates of diagnostic utilization after the guidelines compared with projected estimates without the guidelines was also seen in the ED utilization of CBC, blood cultures, and CXR (Figure 1); however, these trends did not achieve statistical significance. Table 2 provides specific values. Using a standard cost of $19.52 for CRP testing, annual costs across all hospitals increased $11,783 for ED evaluation of CAP.
Baseline (%) | Preguideline Trend | Level Change at Guideline | Change in Trend After Guideline | Estimates at End of Study* | |||
|---|---|---|---|---|---|---|---|
Without Guideline (%) | With Guideline (%) | P | |||||
| |||||||
| ED‐only encounters | |||||||
| Blood culture | 14.6 | 0.1 | 0.8 | 0.1 | 5.5 | 8.6 | NS |
| CBC | 19.2 | 0.1 | 0.4 | 0.1 | 10.7 | 14.0 | NS |
| CRP | 5.4 | 0.0 | 0.6 | 0.1 | 2.9 | 4.8 | <0.05 |
| Chest x‐ray | 85.4 | 0.1 | 0.1 | 0.0 | 80.9 | 81.1 | NS |
| Inpatient encounters | |||||||
| Blood culture | 50.6 | 0.0 | 1.7 | 0.2 | 49.2 | 41.4 | <0.05 |
| Repeat blood culture | 6.5 | 0.0 | 1.0 | 0.1 | 8.9 | 5.8 | NS |
| CBC | 65.2 | 0.0 | 3.1 | 0.0 | 65.0 | 62.2 | NS |
| Repeat CBC | 23.4 | 0.0 | 4.2 | 0.0 | 20.8 | 16.0 | NS |
| CRP | 25.7 | 0.0 | 1.1 | 0.0 | 23.8 | 23.5 | NS |
| Repeat CRP | 12.5 | 0.1 | 2.2 | 0.1 | 7.1 | 7.3 | NS |
| Chest x‐ray | 89.4 | 0.1 | 0.7 | 0.0 | 85.4 | 83.9 | NS |
| Repeat chest x‐ray | 25.5 | 0.0 | 2.0 | 0.1 | 24.1 | 17.7 | <0.05 |
Inpatient Encounters
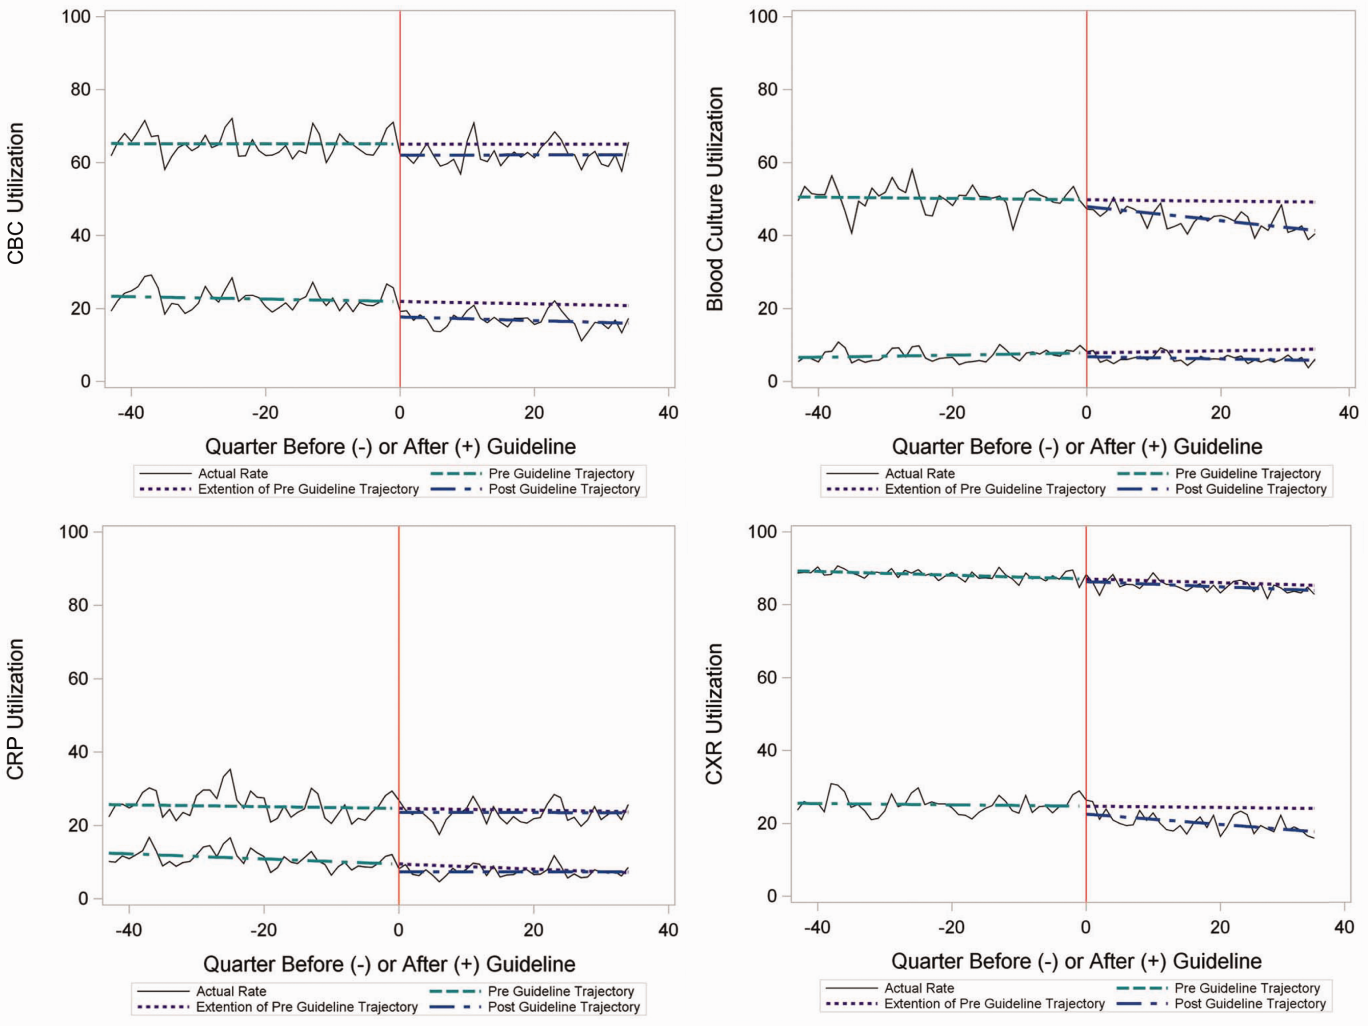
In the segmented regression analysis of children hospitalized with CAP, guideline publication was associated with changes in the monthly use of some diagnostic tests. For example, by the end of the study period, the use of blood culture was 41.4% (observed), whereas the projected estimated use in the absence of the guidelines was 49.2% (expected) (P < 0.05) (Figure 2). Table 2 includes the data for the other tests, CBC, CRP, and CXR, in which similar patterns are noted with lower utilization rates after the guidelines, compared with expected utilization rates without the guidelines; however, these trends did not achieve statistical significance. Evaluating the utilization of repeat testing for inpatients, only repeat CXR achieved statistical significance (P < 0.05), with utilization rates of 17.7% with the guidelines (actual) compared with 24.1% without the guidelines (predicted).
To better understand the use of repeat testing, a comparison of severity outcomesLOS, ICU transfer, and pleural drainage procedureswas performed between patients with no repeat testing (70%) and patients with 1 or more repeat tests (30%). Patients with repeat testing had longer LOS (no repeat testing LOS 1 [IQR, 12]) versus 1 repeat test LOS 3 ([IQR, 24] vs 2+ repeat tests LOS 5 [IQR, 38]), higher rate of ICU transfer (no repeat testing 4.6% vs 1 repeat test 14.6% vs 2+ repeat test 35.6%), and higher rate of pleural drainage (no repeat testing 0% vs 1 repeat test 0.1% vs 2+ repeat test 5.9%] (all P < 0.001).
Using standard costs of $37.57 for blood cultures and $73.28 for CXR, annual costs for children with CAP across all hospitals decreased by $91,512 due to decreased utilization of blood cultures, and by $146,840 due to decreased utilization of CXR.
Hospital‐Level Variation in the Impact of the National Guideline
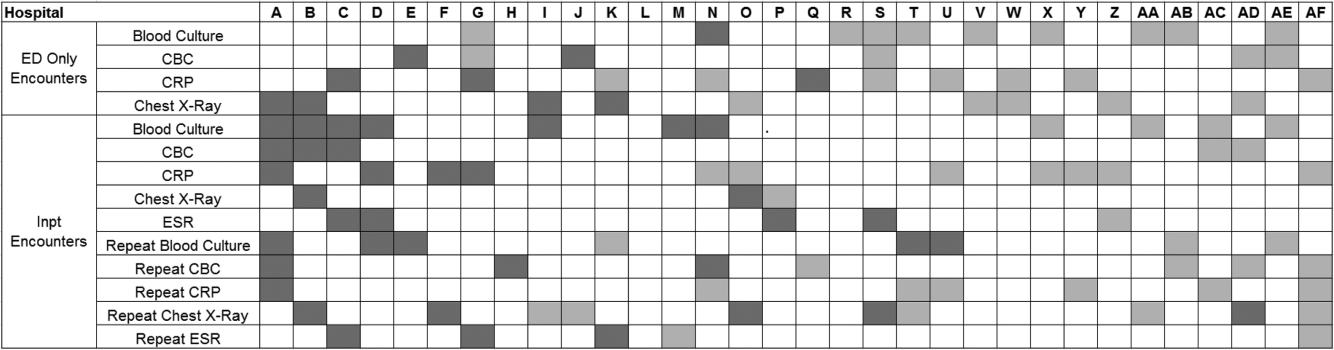
Figure 3 is a visual representation (heat map) of the impact of the guidelines at the hospital level at the end of the study from the individual interrupted time series. Based on this heat map (Figure 3), there was wide variability between hospitals in the impact of the guideline on each test in different settings (ED or inpatient). By diagnostic testing, 7 hospitals significantly decreased utilization of blood cultures for inpatients, and 5 hospitals significantly decreased utilization for repeat blood cultures and repeat CXR. Correlation between the number of positive improvements at a hospital and region (P = 0.974), number of CAP cases (P = 0.731), or percentage of public insurance (P = 0.241) were all nonsignificant.
DISCUSSION
This study complements previous assessments by evaluating the impact of the 2011 IDSA/PIDS consensus guidelines on the management of children with CAP cared for at US children's hospitals. Prior studies have shown increased use of narrow‐spectrum antibiotics for children with CAP after the publication of these guidelines.[7] The current study focused on diagnostic testing for CAP before and after the publication of the 2011 guidelines. In the ED setting, use of some diagnostic tests (blood culture, CBC, CXR, CRP) was declining prior to guideline publication, but appeared to plateau and/or increase after 2011. Among children admitted with CAP, use of diagnostic testing was relatively stable prior to 2011, and use of these tests (blood culture, CBC, CXR, CRP) declined after guideline publication. Overall, changes in diagnostic resource utilization 3 years after publication were modest, with few changes achieving statistical significance. There was a large variability in the impact of guidelines on test use between hospitals.
For outpatients, including those managed in the ED, the PIDS/IDSA guidelines recommend limited laboratory testing in nontoxic, fully immunized patients. The guidelines discourage the use of diagnostic testing among outpatients because of their low yield (eg, blood culture), and because test results may not impact management (eg, CBC).[6] In the years prior to guideline publication, there was already a declining trend in testing rates, including blood cultures, CBC, and CRP, for patients in the ED. After guideline publication, the rate of blood cultures, CBC, and CRP increased, but only the increase in CRP utilization achieved statistical significance. We would not expect utilization for common diagnostic tests (eg, CBC for outpatients with CAP) to be at or close to 0% because of the complexity of clinical decision making regarding admission that factors in aspects of patient history, exam findings, and underlying risk.[15] ED utilization of blood cultures was <10%, CBC <15%, and CRP <5% after guideline publication, which may represent the lowest testing limit that could be achieved.
CXRs obtained in the ED did not decrease over the entire study period. The rates of CXR use (close to 80%) seen in our study are similar to prior ED studies.[5, 16] Management of children with CAP in the ED might be different than outpatient primary care management because (1) unlike primary care providers, ED providers do not have an established relationship with their patients and do not have the opportunity for follow‐up and serial exams, making them less likely to tolerate diagnostic uncertainty; and (2) ED providers may see sicker patients. However, use of CXR in the ED does represent an opportunity for further study to understand if decreased utilization is feasible without adversely impacting clinical outcomes.
The CAP guidelines provide a strong recommendation to obtain blood culture in moderate to severe pneumonia. Despite this, blood culture utilization declined after guideline publication. Less than 10% of children hospitalized with uncomplicated CAP have positive blood cultures, which calls into question the utility of blood cultures for all admitted patients.[17, 18, 19] The recent EPIC (Epidemiology of Pneumonia in the Community) study showed that a majority of children hospitalized with pneumonia do not have growth of bacteria in culture, but there may be a role for blood cultures in patients with a strong suspicion of complicated CAP or in the patient with moderate to severe disease.[20] In addition to blood cultures, the guidelines also recommend CBC and CXR in moderate to severely ill children. This observed decline in testing in CBC and CXR may be related to individual physician assessments of which patients are moderately to severely ill, as the guidelines do not recommend testing for children with less severe disease. Our exclusion of patients requiring intensive care management or pleural drainage on admission might have selected children with a milder course of illness, although still requiring admission.
The guidelines discourage repeat diagnostic testing among children hospitalized with CAP who are improving. In this study, repeat CXR and CBC occurred in approximately 20% of patients, but repeat blood culture and CRP was much lower. As with initial diagnostic testing for inpatients with CAP, the rates of some repeat testing decreased with the guidelines. However, those with repeat testing had longer LOS and were more likely to require ICU transfer or a pleural drainage procedure compared to children without repeat testing. This suggests that repeat testing is used more often in children with a severe presentation or a worsening clinical course, and not done routinely on hospitalized patients.
The financial impact of decreased testing is modest, because the tests themselves are relatively inexpensive. However, the lack of substantial cost savings should not preclude efforts to continue to improve adherence to the guidelines. Not only is increased testing associated with higher hospitalization rates,[5] potentially yielding higher costs and family stress, increased testing may also lead to patient discomfort and possibly increased radiation exposure through chest radiography.
Many of the diagnostic testing recommendations in the CAP guidelines are based on weak evidence, which may contribute to the lack of substantial adoption. Nevertheless, adherence to guideline recommendations requires sustained effort on the part of individual physicians that should be encouraged through institutional support.[21] Continuous education and clinical decision support, as well as reminders in the electronic medical record, would make guideline recommendations more visible and may help overcome the inertia of previous practice.[15] The hospital‐level heat map (Figure 3) included in this study demonstrates that the impact of the guidelines was variable across sites. Although a few sites had decreased diagnostic testing in many areas with no increased testing in any category, there were several sites that had no improvement in any diagnostic testing category. In addition, hospital‐level factors like size, geography, and insurance status were not associated with number of improvements. To better understand drivers of change at individual hospitals, future studies should evaluate specific strategies utilized by the rapid guideline adopters.
This study is subject to several limitations. The use of ICD‐9 codes to identify patients with CAP may not capture all patients with this diagnosis; however, these codes have been previously validated.[13] Additionally, because patients were identified using ICD‐9 coding assigned at the time of discharge, testing performed in the ED setting may not reflect care for a child with known pneumonia, but rather may reflect testing for a child with fever or other signs of infection. PHIS collects data from freestanding children's hospitals, which care for a majority of children with CAP in the US, but our findings may not be generalizable to other hospitals. In addition, we did not examine drivers of trends within individual institutions. We did not have detailed information to examine whether the PHIS hospitals in our study had actively worked to adopt the CAP guidelines. We were also unable to assess physician's familiarity with guidelines or the level of disagreement with the recommendations. Furthermore, the PHIS database does not permit detailed correlation of diagnostic testing with clinical parameters. In contrast to the diagnostic testing evaluated in this study, which is primarily discouraged by the IDSA/PIDS guidelines, respiratory viral testing for children with CAP is recommended but could not be evaluated, as data on such testing are not readily available in PHIS.
CONCLUSION
Publication of the IDSA/PIDS evidence‐based guidelines for the management of CAP was associated with modest, variable changes in use of diagnostic testing. Further adoption of the CAP guidelines should reduce variation in care and decrease unnecessary resource utilization in the management of CAP. Our study demonstrates that efforts to promote decreased resource utilization should target specific situations (eg, repeat testing for inpatients who are improving). Adherence to guidelines may be improved by the adoption of local practices that integrate and improve daily workflow, like order sets and clinical decision support tools.
Disclosure: Nothing to report.
- , . Eliminating waste in US health care. JAMA. 2012;307(14):1513–1516.
- , , , et al. Choosing wisely in pediatric hospital medicine: five opportunities for improved healthcare value. J Hosp Med. 2013;8(9):479–485.
- , , , et al.; Pediatric Research in Inpatient Settings (PRIS) Network. Prioritization of comparative effectiveness research topics in hospital pediatrics. Arch Pediatr Adolesc Med. 2012;166(12):1155–1164.
- , , , et al. Variability in processes of care and outcomes among children hospitalized with community‐acquired pneumonia. Pediatr Infect Dis J. 2012;31(10):1036–1041.
- , , , , . Variation in emergency department diagnostic testing and disposition outcomes in pneumonia. Pediatrics. 2013;132(2):237–244.
- , , , et al.; Pediatric Infectious Diseases Society and the Infectious Diseases Society of America. The management of community‐acquired pneumonia in infants and children older than 3 months of age: clinical practice guidelines by the Pediatric Infectious Diseases Society and the Infectious Diseases Society of America. Clin Infect Dis. 2011;53(7):e25–e76.
- , , , et al., Impact of Infectious Diseases Society of America/Pediatric Infectious Diseases Society guidelines on treatment of community‐acquired pneumonia in hospitalized children. Clin Infect Dis. 2014;58(6):834–838.
- , , , et al. Antibiotic choice for children hospitalized with pneumonia and adherence to national guidelines. Pediatrics. 2015;136(1):44–52.
- , , , et al. Quality improvement methods increase appropriate antibiotic prescribing for childhood pneumonia. Pediatrics. 2013;131(5):e1623–e1631.
- , , , et al. Improvement methodology increases guideline recommended blood cultures in children with pneumonia. Pediatrics. 2015;135(4):e1052–e1059.
- , , , , , . Impact of a guideline on management of children hospitalized with community‐acquired pneumonia. Pediatrics. 2012;129(3):e597–e604.
- , , , . Effectiveness of antimicrobial guidelines for community‐acquired pneumonia in children. Pediatrics. 2012;129(5):e1326–e1333.
- , , , et al. Identifying pediatric community‐acquired pneumonia hospitalizations: accuracy of administrative billing codes. JAMA Pediatr. 2013;167(9):851–858.
- , , , , . Pediatric complex chronic conditions classification system version 2: updated for ICD‐10 and complex medical technology dependence and transplantation. BMC Pediatr. 2014;14:199.
- , . Establishing superior benchmarks of care in clinical practice: a proposal to drive achievable health care value. JAMA Pediatr. 2015;169(4):301–302.
- , , , . Emergency department management of childhood pneumonia in the United States prior to publication of national guidelines. Acad Emerg Med. 2013;20(3):240–246.
- , , , et al. Prevalence of bacteremia in hospitalized pediatric patients with community‐acquired pneumonia. Pediatr Infect Dis J. 2013;32(7):736–740.
- , , , , . The prevalence of bacteremia in pediatric patients with community‐acquired pneumonia: guidelines to reduce the frequency of obtaining blood cultures. Hosp Pediatr. 2013;3(2):92–96.
- . Do all children hospitalized with community‐acquired pneumonia require blood cultures? Hosp Pediatr. 2013;3(2):177–179.
- , , , et al.; CDC EPIC Study Team. Community‐acquired pneumonia requiring hospitalization among U.S. children. N Engl J Med. 2015;372(9):835–845.
- , , , et al. Influence of hospital guidelines on management of children hospitalized with pneumonia. Pediatrics. 2012;130(5):e823–e830.
Overutilization of resources is a significant, yet underappreciated, problem in medicine. Many interventions target underutilization (eg, immunizations) or misuse (eg, antibiotic prescribing for viral pharyngitis), yet overutilization remains as a significant contributor to healthcare waste.[1] In an effort to reduce waste, the Choosing Wisely campaign created a work group to highlight areas of overutilization, specifically noting both diagnostic tests and therapies for common pediatric conditions with no proven benefit and possible harm to the patient.[2] Respiratory illnesses have been a target of many quality‐improvement efforts, and pneumonia represents a common diagnosis in pediatrics.[3] The use of diagnostic testing for pneumonia is an area where care can be optimized and aligned with evidence.
Laboratory testing and diagnostic imaging are routinely used for the management of children with community‐acquired pneumonia (CAP). Several studies have documented substantial variability in the use of these resources for pneumonia management, with higher resource use associated with a higher chance of hospitalization after emergency department (ED) evaluation and a longer length of stay among those requiring hospitalization.[4, 5] This variation in diagnostic resource utilization has been attributed, at least in part, to a lack of consensus on the management of pneumonia. There is wide variability in diagnostic testing, and due to potential consequences for patients presenting with pneumonia, efforts to standardize care offer an opportunity to improve healthcare value.
In August 2011, the first national, evidence‐based consensus guidelines for the management of childhood CAP were published jointly by the Pediatric Infectious Diseases Society (PIDS) and the Infectious Diseases Society of America (IDSA).[6] A primary focus of these guidelines was the recommendation for the use of narrow spectrum antibiotics for the management of uncomplicated pneumonia. Previous studies have assessed the impact of the publication of the PIDS/IDSA guidelines on empiric antibiotic selection for the management of pneumonia.[7, 8] In addition, the guidelines provided recommendations regarding diagnostic test utilization, in particular discouraging blood tests (eg, complete blood counts) and radiologic studies for nontoxic, fully immunized children treated as outpatients, as well as repeat testing for children hospitalized with CAP who are improving.
Although single centers have demonstrated changes in utilization patterns based on clinical practice guidelines,[9, 10, 11, 12] whether these guidelines have impacted diagnostic test utilization among US children with CAP in a larger scale remains unknown. Therefore, we sought to determine the impact of the PIDS/IDSA guidelines on the use of diagnostic testing among children with CAP using a national sample of US children's hospitals. Because the guidelines discourage repeat diagnostic testing in patients who are improving, we also evaluated the association between repeat diagnostic studies and severity of illness.
METHODS
This retrospective cohort study used data from the Pediatric Health Information System (PHIS) (Children's Hospital Association, Overland Park, KS). The PHIS database contains deidentified administrative data, detailing demographic, diagnostic, procedure, and billing data from 47 freestanding, tertiary care children's hospitals. This database accounts for approximately 20% of all annual pediatric hospitalizations in the United States. Data quality is ensured through a joint effort between the Children's Hospital Association and participating hospitals.
Patient Population
Data from 32 (of the 47) hospitals included in PHIS with complete inpatient and ED data were used to evaluate hospital‐level resource utilization for children 1 to 18 years of age discharged January 1, 2008 to June 30, 2014 with a diagnosis of pneumonia (International Classification of Diseases, 9th Revision [ICD‐9] codes 480.x‐486.x, 487.0).[13] Our goal was to identify previously healthy children with uncomplicated pneumonia, so we excluded patients with complex chronic conditions,[14] billing charges for intensive care management and/or pleural drainage procedure (IDC‐9 codes 510.0, 510.9, 511.0, 511.1, 511.8, 511.9, 513.x) on day of admission or the next day, or prior pneumonia admission in the last 30 days. We studied 2 mutually exclusive populations: children with pneumonia treated in the ED (ie, patients who were evaluated in the ED and discharged to home), and children hospitalized with pneumonia, including those admitted through the ED.
Guideline Publication and Study Periods
For an exploratory before and after comparison, patients were grouped into 2 cohorts based on a guideline online publication date of August 1, 2011: preguideline (January 1, 2008 to July 31, 2011) and postguideline (August 1, 2011 to June 30, 2014).
Study Outcomes
The measured outcomes were the monthly proportion of pneumonia patients for whom specific diagnostic tests were performed, as determined from billing data. The diagnostic tests evaluated were complete blood count (CBC), blood culture, C‐reactive protein (CRP), and chest radiograph (CXR). Standardized costs were also calculated from PHIS charges as previously described to standardize the cost of the individual tests and remove interhospital cost variation.[3]
Relationship of Repeat Testing and Severity of Illness
Because higher illness severity and clinical deterioration may warrant repeat testing, we also explored the association of repeat diagnostic testing for inpatients with severity of illness by using the following variables as measures of severity: length of stay (LOS), transfer to intensive care unit (ICU), or pleural drainage procedure after admission (>2 calendar days after admission). Repeat diagnostic testing was stratified by number of tests.
Statistical Analysis
The categorical demographic characteristics of the pre‐ and postguideline populations were summarized using frequencies and percentages, and compared using 2 tests. Continuous demographics were summarized with medians and interquartile ranges (IQRs) and compared with the Wilcoxon rank sum test. Segmented regression, clustered by hospital, was used to assess trends in monthly resource utilization as well as associated standardized costs before and after guidelines publication. To estimate the impact of the guidelines overall, we compared the observed diagnostic resource use at the end of the study period with expected use projected from trends in the preguidelines period (ie, if there were no new guidelines). Individual interrupted time series were also built for each hospital. From these models, we assessed which hospitals had a significant difference between the rate observed at the end of the study and that estimated from their preguideline trajectory. To assess the relationship between the number of positive improvements at a hospital and hospital characteristics, we used Spearman's correlation and Kruskal‐Wallis tests. All analyses were performed with SAS version 9.3 (SAS Institute, Inc., Cary, NC), and P values <0.05 were considered statistically significant. In accordance with the policies of the Cincinnati Children's Hospital Medical Center Institutional Review Board, this research, using a deidentified dataset, was not considered human subjects research.
RESULTS
There were 275,288 hospital admissions meeting study inclusion criteria of 1 to 18 years of age with a diagnosis of pneumonia from 2008 to 2014. Of these, 54,749 met exclusion criteria (1874 had pleural drainage procedure on day 0 or 1, 51,306 had complex chronic conditions, 1569 were hospitalized with pneumonia in the last 30 days). Characteristics of the remaining 220,539 patients in the final sample are shown in Table 1. The median age was 4 years (IQR, 27 years); a majority of the children were male (53%) and had public insurance (58%). There were 128,855 patients in the preguideline period (January 1, 2008 to July 31, 2011) and 91,684 in the post guideline period (August 1, 2011June 30, 2014).
| Overall | Preguideline | Postguideline | P | |
|---|---|---|---|---|
| ||||
| No. of discharges | 220,539 | 128,855 | 91,684 | |
| Type of encounter | ||||
| ED only | 150,215 (68.1) | 88,790 (68.9) | 61,425 (67) | <0.001 |
| Inpatient | 70,324 (31.9) | 40,065 (31.1) | 30,259 (33) | |
| Age | ||||
| 14 years | 129,360 (58.7) | 77,802 (60.4) | 51,558 (56.2) | <0.001 |
| 59 years | 58,609 (26.6) | 32,708 (25.4) | 25,901 (28.3) | |
| 1018 years | 32,570 (14.8) | 18,345 (14.2) | 14,225 (15.5) | |
| Median [IQR] | 4 [27] | 3 [27] | 4 [27] | <0.001 |
| Gender | ||||
| Male | 116,718 (52.9) | 68,319 (53) | 48,399 (52.8) | 00.285 |
| Female | 103,813 (47.1) | 60,532 (47) | 43,281 (47.2) | |
| Race | ||||
| Non‐Hispanic white | 84,423 (38.3) | 47,327 (36.7) | 37,096 (40.5) | <0.001 |
| Non‐Hispanic black | 60,062 (27.2) | 35,870 (27.8) | 24,192 (26.4) | |
| Hispanic | 51,184 (23.2) | 31,167 (24.2) | 20,017 (21.8) | |
| Asian | 6,444 (2.9) | 3,691 (2.9) | 2,753 (3) | |
| Other | 18,426 (8.4) | 10,800 (8.4) | 7,626 (8.3) | |
| Payer | ||||
| Government | 128,047 (58.1) | 70,742 (54.9) | 57,305 (62.5) | <0.001 |
| Private | 73,338 (33.3) | 44,410 (34.5) | 28,928 (31.6) | |
| Other | 19,154 (8.7) | 13,703 (10.6) | 5,451 (5.9) | |
| Disposition | ||||
| HHS | 684 (0.3) | 411 (0.3) | 273 (0.3) | <0.001 |
| Home | 209,710 (95.1) | 123,236 (95.6) | 86,474 (94.3) | |
| Other | 9,749 (4.4) | 4,962 (3.9) | 4,787 (5.2) | |
| SNF | 396 (0.2) | 246 (0.2) | 150 (0.2) | |
| Season | ||||
| Spring | 60,171 (27.3) | 36,709 (28.5) | 23,462 (25.6) | <0.001 |
| Summer | 29,891 (13.6) | 17,748 (13.8) | 12,143 (13.2) | |
| Fall | 52,161 (23.7) | 28,332 (22) | 23,829 (26) | |
| Winter | 78,316 (35.5) | 46,066 (35.8) | 32,250 (35.2) | |
| LOS | ||||
| 13 days | 204,812 (92.9) | 119,497 (92.7) | 85,315 (93.1) | <0.001 |
| 46 days | 10,454 (4.7) | 6,148 (4.8) | 4,306 (4.7) | |
| 7+ days | 5,273 (2.4) | 3,210 (2.5) | 2,063 (2.3) | |
| Median [IQR] | 1 [11] | 1 [11] | 1 [11] | 0.144 |
| Admitted patients, median [IQR] | 2 [13] | 2 [13] | 2 [13] | <0.001 |
Discharged From the ED
Throughout the study, utilization of CBC, blood cultures, and CRP was <20%, whereas CXR use was >75%. In segmented regression analysis, CRP utilization was relatively stable before the guidelines publication. However, by the end of the study period, the projected estimate of CRP utilization without guidelines (expected) was 2.9% compared with 4.8% with the guidelines (observed) (P < 0.05) (Figure 1). A similar pattern of higher rates of diagnostic utilization after the guidelines compared with projected estimates without the guidelines was also seen in the ED utilization of CBC, blood cultures, and CXR (Figure 1); however, these trends did not achieve statistical significance. Table 2 provides specific values. Using a standard cost of $19.52 for CRP testing, annual costs across all hospitals increased $11,783 for ED evaluation of CAP.
Baseline (%) | Preguideline Trend | Level Change at Guideline | Change in Trend After Guideline | Estimates at End of Study* | |||
|---|---|---|---|---|---|---|---|
Without Guideline (%) | With Guideline (%) | P | |||||
| |||||||
| ED‐only encounters | |||||||
| Blood culture | 14.6 | 0.1 | 0.8 | 0.1 | 5.5 | 8.6 | NS |
| CBC | 19.2 | 0.1 | 0.4 | 0.1 | 10.7 | 14.0 | NS |
| CRP | 5.4 | 0.0 | 0.6 | 0.1 | 2.9 | 4.8 | <0.05 |
| Chest x‐ray | 85.4 | 0.1 | 0.1 | 0.0 | 80.9 | 81.1 | NS |
| Inpatient encounters | |||||||
| Blood culture | 50.6 | 0.0 | 1.7 | 0.2 | 49.2 | 41.4 | <0.05 |
| Repeat blood culture | 6.5 | 0.0 | 1.0 | 0.1 | 8.9 | 5.8 | NS |
| CBC | 65.2 | 0.0 | 3.1 | 0.0 | 65.0 | 62.2 | NS |
| Repeat CBC | 23.4 | 0.0 | 4.2 | 0.0 | 20.8 | 16.0 | NS |
| CRP | 25.7 | 0.0 | 1.1 | 0.0 | 23.8 | 23.5 | NS |
| Repeat CRP | 12.5 | 0.1 | 2.2 | 0.1 | 7.1 | 7.3 | NS |
| Chest x‐ray | 89.4 | 0.1 | 0.7 | 0.0 | 85.4 | 83.9 | NS |
| Repeat chest x‐ray | 25.5 | 0.0 | 2.0 | 0.1 | 24.1 | 17.7 | <0.05 |
Inpatient Encounters
In the segmented regression analysis of children hospitalized with CAP, guideline publication was associated with changes in the monthly use of some diagnostic tests. For example, by the end of the study period, the use of blood culture was 41.4% (observed), whereas the projected estimated use in the absence of the guidelines was 49.2% (expected) (P < 0.05) (Figure 2). Table 2 includes the data for the other tests, CBC, CRP, and CXR, in which similar patterns are noted with lower utilization rates after the guidelines, compared with expected utilization rates without the guidelines; however, these trends did not achieve statistical significance. Evaluating the utilization of repeat testing for inpatients, only repeat CXR achieved statistical significance (P < 0.05), with utilization rates of 17.7% with the guidelines (actual) compared with 24.1% without the guidelines (predicted).
To better understand the use of repeat testing, a comparison of severity outcomesLOS, ICU transfer, and pleural drainage procedureswas performed between patients with no repeat testing (70%) and patients with 1 or more repeat tests (30%). Patients with repeat testing had longer LOS (no repeat testing LOS 1 [IQR, 12]) versus 1 repeat test LOS 3 ([IQR, 24] vs 2+ repeat tests LOS 5 [IQR, 38]), higher rate of ICU transfer (no repeat testing 4.6% vs 1 repeat test 14.6% vs 2+ repeat test 35.6%), and higher rate of pleural drainage (no repeat testing 0% vs 1 repeat test 0.1% vs 2+ repeat test 5.9%] (all P < 0.001).
Using standard costs of $37.57 for blood cultures and $73.28 for CXR, annual costs for children with CAP across all hospitals decreased by $91,512 due to decreased utilization of blood cultures, and by $146,840 due to decreased utilization of CXR.
Hospital‐Level Variation in the Impact of the National Guideline
Figure 3 is a visual representation (heat map) of the impact of the guidelines at the hospital level at the end of the study from the individual interrupted time series. Based on this heat map (Figure 3), there was wide variability between hospitals in the impact of the guideline on each test in different settings (ED or inpatient). By diagnostic testing, 7 hospitals significantly decreased utilization of blood cultures for inpatients, and 5 hospitals significantly decreased utilization for repeat blood cultures and repeat CXR. Correlation between the number of positive improvements at a hospital and region (P = 0.974), number of CAP cases (P = 0.731), or percentage of public insurance (P = 0.241) were all nonsignificant.
DISCUSSION
This study complements previous assessments by evaluating the impact of the 2011 IDSA/PIDS consensus guidelines on the management of children with CAP cared for at US children's hospitals. Prior studies have shown increased use of narrow‐spectrum antibiotics for children with CAP after the publication of these guidelines.[7] The current study focused on diagnostic testing for CAP before and after the publication of the 2011 guidelines. In the ED setting, use of some diagnostic tests (blood culture, CBC, CXR, CRP) was declining prior to guideline publication, but appeared to plateau and/or increase after 2011. Among children admitted with CAP, use of diagnostic testing was relatively stable prior to 2011, and use of these tests (blood culture, CBC, CXR, CRP) declined after guideline publication. Overall, changes in diagnostic resource utilization 3 years after publication were modest, with few changes achieving statistical significance. There was a large variability in the impact of guidelines on test use between hospitals.
For outpatients, including those managed in the ED, the PIDS/IDSA guidelines recommend limited laboratory testing in nontoxic, fully immunized patients. The guidelines discourage the use of diagnostic testing among outpatients because of their low yield (eg, blood culture), and because test results may not impact management (eg, CBC).[6] In the years prior to guideline publication, there was already a declining trend in testing rates, including blood cultures, CBC, and CRP, for patients in the ED. After guideline publication, the rate of blood cultures, CBC, and CRP increased, but only the increase in CRP utilization achieved statistical significance. We would not expect utilization for common diagnostic tests (eg, CBC for outpatients with CAP) to be at or close to 0% because of the complexity of clinical decision making regarding admission that factors in aspects of patient history, exam findings, and underlying risk.[15] ED utilization of blood cultures was <10%, CBC <15%, and CRP <5% after guideline publication, which may represent the lowest testing limit that could be achieved.
CXRs obtained in the ED did not decrease over the entire study period. The rates of CXR use (close to 80%) seen in our study are similar to prior ED studies.[5, 16] Management of children with CAP in the ED might be different than outpatient primary care management because (1) unlike primary care providers, ED providers do not have an established relationship with their patients and do not have the opportunity for follow‐up and serial exams, making them less likely to tolerate diagnostic uncertainty; and (2) ED providers may see sicker patients. However, use of CXR in the ED does represent an opportunity for further study to understand if decreased utilization is feasible without adversely impacting clinical outcomes.
The CAP guidelines provide a strong recommendation to obtain blood culture in moderate to severe pneumonia. Despite this, blood culture utilization declined after guideline publication. Less than 10% of children hospitalized with uncomplicated CAP have positive blood cultures, which calls into question the utility of blood cultures for all admitted patients.[17, 18, 19] The recent EPIC (Epidemiology of Pneumonia in the Community) study showed that a majority of children hospitalized with pneumonia do not have growth of bacteria in culture, but there may be a role for blood cultures in patients with a strong suspicion of complicated CAP or in the patient with moderate to severe disease.[20] In addition to blood cultures, the guidelines also recommend CBC and CXR in moderate to severely ill children. This observed decline in testing in CBC and CXR may be related to individual physician assessments of which patients are moderately to severely ill, as the guidelines do not recommend testing for children with less severe disease. Our exclusion of patients requiring intensive care management or pleural drainage on admission might have selected children with a milder course of illness, although still requiring admission.
The guidelines discourage repeat diagnostic testing among children hospitalized with CAP who are improving. In this study, repeat CXR and CBC occurred in approximately 20% of patients, but repeat blood culture and CRP was much lower. As with initial diagnostic testing for inpatients with CAP, the rates of some repeat testing decreased with the guidelines. However, those with repeat testing had longer LOS and were more likely to require ICU transfer or a pleural drainage procedure compared to children without repeat testing. This suggests that repeat testing is used more often in children with a severe presentation or a worsening clinical course, and not done routinely on hospitalized patients.
The financial impact of decreased testing is modest, because the tests themselves are relatively inexpensive. However, the lack of substantial cost savings should not preclude efforts to continue to improve adherence to the guidelines. Not only is increased testing associated with higher hospitalization rates,[5] potentially yielding higher costs and family stress, increased testing may also lead to patient discomfort and possibly increased radiation exposure through chest radiography.
Many of the diagnostic testing recommendations in the CAP guidelines are based on weak evidence, which may contribute to the lack of substantial adoption. Nevertheless, adherence to guideline recommendations requires sustained effort on the part of individual physicians that should be encouraged through institutional support.[21] Continuous education and clinical decision support, as well as reminders in the electronic medical record, would make guideline recommendations more visible and may help overcome the inertia of previous practice.[15] The hospital‐level heat map (Figure 3) included in this study demonstrates that the impact of the guidelines was variable across sites. Although a few sites had decreased diagnostic testing in many areas with no increased testing in any category, there were several sites that had no improvement in any diagnostic testing category. In addition, hospital‐level factors like size, geography, and insurance status were not associated with number of improvements. To better understand drivers of change at individual hospitals, future studies should evaluate specific strategies utilized by the rapid guideline adopters.
This study is subject to several limitations. The use of ICD‐9 codes to identify patients with CAP may not capture all patients with this diagnosis; however, these codes have been previously validated.[13] Additionally, because patients were identified using ICD‐9 coding assigned at the time of discharge, testing performed in the ED setting may not reflect care for a child with known pneumonia, but rather may reflect testing for a child with fever or other signs of infection. PHIS collects data from freestanding children's hospitals, which care for a majority of children with CAP in the US, but our findings may not be generalizable to other hospitals. In addition, we did not examine drivers of trends within individual institutions. We did not have detailed information to examine whether the PHIS hospitals in our study had actively worked to adopt the CAP guidelines. We were also unable to assess physician's familiarity with guidelines or the level of disagreement with the recommendations. Furthermore, the PHIS database does not permit detailed correlation of diagnostic testing with clinical parameters. In contrast to the diagnostic testing evaluated in this study, which is primarily discouraged by the IDSA/PIDS guidelines, respiratory viral testing for children with CAP is recommended but could not be evaluated, as data on such testing are not readily available in PHIS.
CONCLUSION
Publication of the IDSA/PIDS evidence‐based guidelines for the management of CAP was associated with modest, variable changes in use of diagnostic testing. Further adoption of the CAP guidelines should reduce variation in care and decrease unnecessary resource utilization in the management of CAP. Our study demonstrates that efforts to promote decreased resource utilization should target specific situations (eg, repeat testing for inpatients who are improving). Adherence to guidelines may be improved by the adoption of local practices that integrate and improve daily workflow, like order sets and clinical decision support tools.
Disclosure: Nothing to report.
- , . Eliminating waste in US health care. JAMA. 2012;307(14):1513–1516.
- , , , et al. Choosing wisely in pediatric hospital medicine: five opportunities for improved healthcare value. J Hosp Med. 2013;8(9):479–485.
- , , , et al.; Pediatric Research in Inpatient Settings (PRIS) Network. Prioritization of comparative effectiveness research topics in hospital pediatrics. Arch Pediatr Adolesc Med. 2012;166(12):1155–1164.
- , , , et al. Variability in processes of care and outcomes among children hospitalized with community‐acquired pneumonia. Pediatr Infect Dis J. 2012;31(10):1036–1041.
- , , , , . Variation in emergency department diagnostic testing and disposition outcomes in pneumonia. Pediatrics. 2013;132(2):237–244.
- , , , et al.; Pediatric Infectious Diseases Society and the Infectious Diseases Society of America. The management of community‐acquired pneumonia in infants and children older than 3 months of age: clinical practice guidelines by the Pediatric Infectious Diseases Society and the Infectious Diseases Society of America. Clin Infect Dis. 2011;53(7):e25–e76.
- , , , et al., Impact of Infectious Diseases Society of America/Pediatric Infectious Diseases Society guidelines on treatment of community‐acquired pneumonia in hospitalized children. Clin Infect Dis. 2014;58(6):834–838.
- , , , et al. Antibiotic choice for children hospitalized with pneumonia and adherence to national guidelines. Pediatrics. 2015;136(1):44–52.
- , , , et al. Quality improvement methods increase appropriate antibiotic prescribing for childhood pneumonia. Pediatrics. 2013;131(5):e1623–e1631.
- , , , et al. Improvement methodology increases guideline recommended blood cultures in children with pneumonia. Pediatrics. 2015;135(4):e1052–e1059.
- , , , , , . Impact of a guideline on management of children hospitalized with community‐acquired pneumonia. Pediatrics. 2012;129(3):e597–e604.
- , , , . Effectiveness of antimicrobial guidelines for community‐acquired pneumonia in children. Pediatrics. 2012;129(5):e1326–e1333.
- , , , et al. Identifying pediatric community‐acquired pneumonia hospitalizations: accuracy of administrative billing codes. JAMA Pediatr. 2013;167(9):851–858.
- , , , , . Pediatric complex chronic conditions classification system version 2: updated for ICD‐10 and complex medical technology dependence and transplantation. BMC Pediatr. 2014;14:199.
- , . Establishing superior benchmarks of care in clinical practice: a proposal to drive achievable health care value. JAMA Pediatr. 2015;169(4):301–302.
- , , , . Emergency department management of childhood pneumonia in the United States prior to publication of national guidelines. Acad Emerg Med. 2013;20(3):240–246.
- , , , et al. Prevalence of bacteremia in hospitalized pediatric patients with community‐acquired pneumonia. Pediatr Infect Dis J. 2013;32(7):736–740.
- , , , , . The prevalence of bacteremia in pediatric patients with community‐acquired pneumonia: guidelines to reduce the frequency of obtaining blood cultures. Hosp Pediatr. 2013;3(2):92–96.
- . Do all children hospitalized with community‐acquired pneumonia require blood cultures? Hosp Pediatr. 2013;3(2):177–179.
- , , , et al.; CDC EPIC Study Team. Community‐acquired pneumonia requiring hospitalization among U.S. children. N Engl J Med. 2015;372(9):835–845.
- , , , et al. Influence of hospital guidelines on management of children hospitalized with pneumonia. Pediatrics. 2012;130(5):e823–e830.
© 2015 Society of Hospital Medicine

Treatment of Complicated Pneumonia
Community‐acquired pneumonia, the most common serious bacterial infection in childhood, may be complicated by parapneumonic effusion (ie, complicated pneumonia).1 Children with complicated pneumonia require prolonged hospitalization and frequently undergo multiple pleural fluid drainage procedures.2 Additionally, the incidence of complicated pneumonia has increased,37 making the need to define appropriate therapy even more pressing. Defining appropriate therapy is challenging for the individual physician as a result of inconsistent and insufficient evidence, and wide variation in treatment practices.2, 8
Historically, thoracotomy was performed only if initial chest tube placement did not lead to clinical improvement.9, 10 Several authors, noting the rapid resolution of symptoms in children undergoing earlier thoracotomy, advocated for the use of thoracotomy as initial therapy rather than as a procedure of last resort.114 The advent of less invasive techniques such as video‐assisted thoracoscopic surgery (VATS) has served as an additional impetus to consider surgical drainage as the initial treatment strategy.1518 Few well‐designed studies have examined the relative efficacy of these interventions.2, 1922 Published randomized trials were single center, enrolled few patients, and arrived at different conclusions.19, 21, 22 In addition, these trials did not examine other important outcomes such as requirement for additional pleural fluid drainage procedures and hospital readmission. Two large retrospective multicenter studies found modest reductions in length of stay (LOS) and substantial decreases in the requirement for additional pleural fluid drainage procedures in children undergoing initial VATS compared with initial chest tube placement.2, 20 However, Shah et al2 included relatively few patients undergoing VATS. Li et al20 combined patients undergoing initial thoracentesis, initial chest tube placement, late pleural fluid drainage (by any method), and no pleural fluid drainage into a single non‐operative management category, precluding conclusions about the relative benefits of chest tube placement compared with VATS. Neither study2, 20 examined the role of chemical fibrinolysis, a therapy which has been associated with outcomes comparable to VATS in two small randomized trials.21, 22
The objectives of this multicenter study were to describe the variation in the initial management strategy along with associated outcomes of complicated pneumonia in childhood and to determine the comparative effectiveness of different pleural fluid drainage procedures.
Methods
Data Source
The Pediatric Health Information System (PHIS), which contains resource utilization data from 40 freestanding children's hospitals, provided data for this multicenter retrospective cohort study. Participating hospitals are located in noncompeting markets of 27 states plus the District of Columbia. The PHIS database includes patient demographics, diagnoses, and procedures as well as data for all drugs, radiologic studies, laboratory tests, and supplies charged to each patient. Data are de‐identified, however encrypted medical record numbers allow for tracking individual patients across admissions. The Child Health Corporation of America (Shawnee Mission, KS) and participating hospitals jointly assure data quality and reliability as described previously.23, 24 The Children's Hospital of Philadelphia Institutional Review Board reviewed and approved this study.
Patients
Children 18 years of age receiving a pleural drainage procedure for complicated pneumonia were eligible if they were discharged from participating hospitals between January 1, 2004 and June 30, 2009. Study participants met the following criteria: 1) discharge diagnosis of pneumonia (International Classification of Diseases, 9th revision [ICD‐9] discharge diagnosis codes 480.x‐483.x, 485.x‐487.x), 2) discharge diagnosis of pleural effusion (ICD‐9 codes 510.0, 510.9, 511.0, 511.1, or 511.9), and 3) billing charge for antibiotics on the first day of hospitalization. Additionally, the primary discharge diagnosis had to be either pneumonia or pleural effusion. Patients were excluded if they did not undergo pleural fluid drainage or if their initial pleural fluid drainage procedure was thoracentesis.
Study Definitions
Pleural drainage procedures were identified using ICD‐9 procedure codes for thoracentesis (34.91), chest tube placement (34.04), VATS (34.21), and thoracotomy (34.02 or 34.09). Fibrinolysis was defined as receipt of urokinase, streptokinase, or alteplase within two days of initial chest tube placement.
Acute conditions or complications included influenza (487, 487.0, 487.1, 487.8, 488, or V04.81) and hemolytic‐uremic syndrome (283.11). Chronic comorbid conditions (CCCs) (eg, malignancy) were identified using a previously reported classification scheme.25 Billing data were used to classify receipt of mechanical ventilation and medications on the first day of hospitalization.
Measured Outcomes
The primary outcomes were hospital LOS (both overall and post‐initial procedure), requirement for additional pleural drainage procedures, total cost for index hospitalization, all‐cause readmission within 14 days after index hospital discharge, and total cost of the episode (accounting for the cost of readmissions).
Measured Exposures
The primary exposure of interest was the initial pleural fluid drainage procedure, classified as chest tube placement without fibrinolysis, chest tube placement with fibrinolysis, VATS, or thoracotomy.
Statistical Analysis
Variables were summarized using frequencies and percentages for categorical variables, and median, interquartile range (IQR), and range for continuous variables. Outcomes by initial pleural drainage procedure were compared using chi‐squared tests for categorical variables and Kruskal‐Wallis tests for continuous variables.
Multivariable analysis was performed to account for potential confounding by observed baseline variables. For dichotomous outcome variables, modeling consisted of logistic regression using generalized estimating equations to account for hospital clustering. For continuous variables, a mixed model approach was used, treating hospital as a random effect. Log transformation was applied to the right‐skewed outcome variables (LOS and cost). Cost outcomes remained skewed following log transformation, thus gamma mixed models were applied.2629 Odds ratios and 95% confidence intervals (CIs) were reported for comparison of dichotomous outcomes and the adjusted means and 95% CIs were reported for continuous outcomes after appropriate back transformation.
Additional analyses addressed the potential impact of confounding by indication inherent in any observational study. First, patients with an underlying CCC were excluded to ensure that our results would be generalizable to otherwise healthy children with community‐acquired pneumonia. Second, patients undergoing pleural drainage >2 days after hospitalization were excluded to minimize the effect of residual confounding related to differences in timing of the initial drainage procedure. Third, the analysis was repeated using a generalized propensity score as an additional method to account for confounding by indication for the initial drainage procedure.30 Propensity scores, constructed using a multivariable generalized logit model, included all variables listed in Table 1. The inverse of the propensity score was included as a weight in each multivariable model described previously. Only the primary multivariable analyses are presented as the results of the propensity score analysis were nearly identical to the primary analyses.
| Overall | Chest Tube Without Fibrinolysis | Chest Tube With Fibrinolysis | Thoracotomy | VATS | P Value | |
|---|---|---|---|---|---|---|
| ||||||
| N | 3500 | 1672 (47.8) | 623 (17.8) | 797 (22.8) | 408 (11.7) | |
| Age | ||||||
| <1 year | 335 (9.6) | 176 (10.5) | 56 (9.0) | 78 (9.8) | 25 (6.1) | |
| 1 year | 475 (13.6) | 238 (14.2) | 98 (15.7) | 92 (11.5) | 47 (11.5) | 0.003 |
| 24 years | 1230 (35.1) | 548 (32.8) | 203 (32.6) | 310 (38.9) | 169 (41.4) | |
| 59 years | 897 (25.6) | 412 (24.6) | 170 (27.3) | 199 (25.0) | 116 (28.4) | |
| 1014 years | 324 (9.3) | 167 (10.0) | 61 (9.8) | 65 (8.2) | 31 (7.6) | |
| 1518 years | 193 (5.5) | 106 (6.3) | 29 (4.6) | 40 (5.0) | 18 (4.4) | |
| >18 years | 46 (1.3) | 25 (1.5) | 6 (0.96) | 13 (1.6) | 2 (0.5) | |
| Comorbid Conditions | ||||||
| Cardiac | 69 (2.0) | 43 (2.6) | 14 (2.3) | 12 (1.5) | 0 (0.0) | 0.006 |
| Malignancy | 81 (2.3) | 31 (1.9) | 18 (2.9) | 21 (2.6) | 11 (2.7) | 0.375 |
| Neurological | 138 (3.9) | 73 (4.4) | 20 (3.2) | 34 (4.3) | 11 (2.7) | 0.313 |
| Any Other Condition | 202 (5.8) | 96 (5.7) | 40 (6.4) | 47 (5.9) | 19 (4.7) | 0.696 |
| Payer | ||||||
| Government | 1240 (35.6) | 630 (37.8) | 224 (36.0) | 259 (32.7) | 127 (31.3) | <0.001 |
| Private | 1383 (39.7) | 607 (36.4) | 283 (45.4) | 310 (39.2) | 183 (45.07) | |
| Other | 864 (24.8) | 430 (25.8) | 116 (18.6) | 222 (28.1) | 96 (23.65) | |
| Race | ||||||
| Non‐Hispanic White | 1746 (51.9) | 838 (51.6) | 358 (59.7) | 361 (47.8) | 189 (48.7) | <0.001 |
| Non‐Hispanic Black | 601 (17.9) | 318 (19.6) | 90 (15.0) | 128 (17.0) | 65 (16.8) | |
| Hispanic | 588 (17.5) | 280 (17.3) | 73 (12.2) | 155 (20.5) | 80 (20.6) | |
| Asian | 117 (3.5) | 47 (2.9) | 20 (3.3) | 37 (4.9) | 13 (3.4) | |
| Other | 314 (9.3) | 140 (8.6) | 59 (9.8) | 74 (9.8) | 41 (10.6) | |
| Male Sex | 1912 (54.6) | 923 (55.2) | 336 (53.9) | 439 (55.1) | 214 (52.5) | 0.755 |
| Radiology | ||||||
| CT, no US | 1200 (34.3) | 600 (35.9) | 184 (29.5) | 280 (35.1) | 136 (33.3) | <0.001 |
| CT and US | 221 (6.3) | 84 (5.0) | 53 (8.5) | 61 (7.7) | 23 (5.6) | |
| US, no CT | 799 (22.8) | 324 (19.4) | 178 (28.6) | 200 (25.1) | 97 (23.8) | |
| No US, no CT | 1280 (36.6) | 664 (39.7) | 208 (33.4) | 256 (32.1) | 152 (37.3) | |
| Empiric Antibiotic Regimen | ||||||
| Cephalosporins alone | 448 (12.8) | 181 (10.83) | 126 (20.2) | 73 (9.2) | 68 (16.7) | <0.001 |
| Cephalosporin and clindamycin | 797 (22.8) | 359 (21.5) | 145 (23.3) | 184 (23.1) | 109 (26.7) | |
| Other antibiotic combination | 167 (4.8) | 82 (4.9) | 30 (4.8) | 38 (4.8) | 17 (4.2) | |
| Cephalosporin and vancomycin | 2088 (59.7) | 1050 (62.8) | 322 (51.7) | 502 (63.0) | 214 (52.5) | |
| Mechanical ventilation | 494 (14.1) | 251 (15.0) | 75 (12.0) | 114 (14.3) | 54 (13.2) | 0.307 |
| Corticosteroids | 520 (14.9) | 291 (17.4) | 72 (11.6) | 114 (14.3) | 43 (10.5) | <0.001 |
| Blood product transfusionsb | 761 (21.7) | 387 (23.2) | 145 (23.3) | 161 (20.2) | 68 (16.7) | 0.018 |
| Vasoactive infusionsc | 381 (10.9) | 223 (13.3) | 63 (10.1) | 72 (9.0) | 23 (5.6) | <0.001 |
| Admission to intensive care | 1397 (39.9) | 731 (43.7) | 234 (37.6) | 296 (37.1) | 136 (33.3) | <0.001 |
| Extracorporeal membranous oxygenation | 18 (0.5) | 13 (0.8) | 2 (0.3) | 3 (0.4) | 0 (0.0) | 0.163 |
| Hemolytic‐uremic syndrome | 31 (0.9) | 15 (0.9) | 6 (1.0) | 7 (0.9) | 3 (0.7) | 0.985 |
| Influenza | 108 (3.1) | 53 (3.2) | 27 (4.3) | 23 (2.9) | 5 (1.2) | 0.044 |
| Arterial blood gas measurements | 0 (0,1) | 0 (0, 2) | 0 (0,1) | 0 (0, 1) | 0 (0, 1) | <0.001 |
| Days to first procedure | 1 (0, 3) | 1 (0, 2) | 1 (1, 3) | 1 (1, 3) | 1 (1, 3) | <0.001 |
Medical records of a randomly selected subset of subjects from 6 hospitals were reviewed to determine the accuracy of our algorithm in identifying patients with complicated pneumonia; these subjects represented 1% of the study population. For the purposes of medical record review, complicated pneumonia was defined by the following: 1) radiologically‐confirmed lung infiltrate; 2) moderate or large pleural effusion; and 3) signs and symptoms of lower respiratory tract infection. Complicated pneumonia was identified in 118 of 120 reviewed subjects for a positive predictive value of 98.3%.
All analyses were clustered by hospital. Analyses were performed using SAS version 9.2 (SAS Institute, Cary, NC). A two‐tailed P < 0.05 was considered statistically significant.
Results
Patient Characteristics
During the study period, 9,680 subjects had complicated pneumonia. Subjects were excluded if they did not have a pleural drainage procedure (n = 5798), or if thoracentesis was the first pleural fluid drainage procedure performed (n = 382). The remaining 3500 patients were included. Demographic characteristics are summarized in Table 1. The median patient age was 4.1 years (IQR: 2.17.2 years). An underlying CCC was present in 424 (12.1%) patients. There was no association between type of drainage procedure and mechanical ventilation. However, factors associated with more severe systemic illness, such as blood product transfusion, were more common among those undergoing initial chest tube placement with or without fibrinolysis (Table 1).
Initial Pleural Fluid Drainage Procedures
The primary procedures included chest tube without fibrinolysis (47.8%); chest tube with fibrinolysis (17.8%); thoracotomy (22.8%); and VATS (11.7%) (Table 1). The proportion of patients undergoing primary chest tube placement with fibrinolysis increased over time from 14.2% in 2004 to 30.0% in 2009 (P < 0.001; chi‐squared test for trend). The initial procedure varied by hospital with the greatest proportion of patients undergoing primary chest tube placement without fibrinolysis at 28 (70.0%) hospitals, chest tube placement with fibrinolysis at 5 (12.5%) hospitals, thoracotomy at 5 (12.5%) hospitals, and VATS at 2 (5.0%) hospitals (Figure 1). The median proportion of patients undergoing primary VATS across all hospitals was 11.5% (IQR: 3.9%‐26.5%) (Figure 1). The median time to first procedure was 1 day (IQR: 03 days).
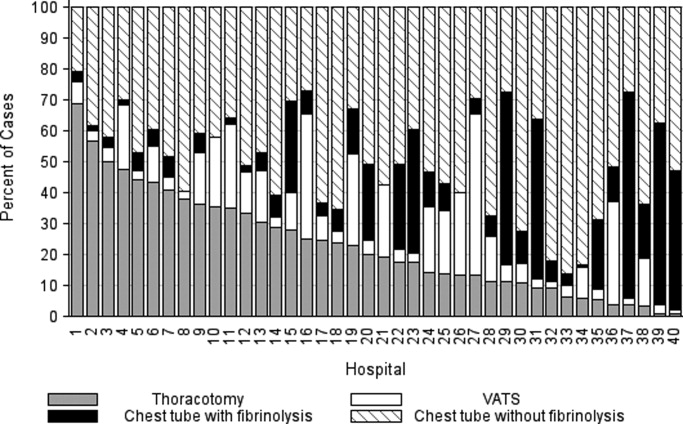
Outcome Measures
Variation in outcomes occurred across hospitals. Additional pleural drainage procedures were performed in a median of 20.9% of patients with a range of 6.8% to 44.8% (IQR: 14.5%‐25.3%) of patients across all hospitals. Median LOS was 10 days with a range of 714 days (IQR: 8.511 days) and the median LOS following the initial pleural fluid drainage procedure was 8 days with a range of 6 to 13 days (IQR: 78 days). Variation in timing of the initial pleural fluid drainage procedure explained 9.6% of the variability in LOS (Spearman rho, 0.31; P < 0.001).
Overall, 118 (3.4%) patients were readmitted within 14 days of index discharge; the median readmission rate was 3.8% with a range of 0.8% to 33.3% (IQR: 2.1%‐5.8%) across hospitals. The median total cost of the index hospitalization was $19,574 (IQR: $13,791‐$31,063). The total cost for the index hospitalization exceeded $54,215 for 10% of patients and the total cost of the episode exceeded $55,208 for 10% of patients. Unadjusted outcomes, stratified by primary pleural fluid drainage procedure, are summarized in Table 2.
| Overall | Chest Tube Without Fibrinolysis | Chest Tube With Fibrinolysis | Thoracotomy | VATS | P Valueb | |
|---|---|---|---|---|---|---|
| ||||||
| Additional Procedure | 716 (20.5) | 331 (19.8) | 144 (23.1) | 197 (24.7) | 44 (10.8) | <0.001 |
| Readmission within 14 days | 118 (3.4) | 54 (3.3) | 13 (2.1) | 32 (4.0) | 19 (4.7) | 0.096 |
| Total LOS (days) | 10 (7, 14) | 10 (7, 14) | 9 (7, 13) | 10 (7, 14) | 9 (7, 12) | <.001 |
| Post‐initial Procedure LOS (days) | 8 (5, 12) | 8 (6, 12) | 7 (5, 10) | 8 (5, 12) | 7 (5, 10) | <0.001 |
| Total Cost, Index Hospitalization ($)e | 19319 (13358, 30955) | 19951 (13576, 32018)c | 19565 (13209, 32778)d | 20352 (14351, 31343) | 17918 (13531, 25166) | 0.016 |
| Total Cost, Episode of Illness ($)e | 19831 (13927, 31749) | 20151 (13764, 32653) | 19593 (13210, 32861) | 20573 (14419, 31753) | 18344 (13835, 25462) | 0.029 |
In multivariable analysis, differences in total LOS and post‐procedure LOS were not significant (Table 3). The odds of additional drainage procedures were higher for all drainage procedures compared with initial VATS (Table 3). Patients undergoing initial chest tube placement with fibrinolysis were less likely to require readmission compared with patients undergoing initial VATS (Table 3). The total cost for the episode of illness (including the cost of readmission) was significantly less for those undergoing primary chest tube placement without fibrinolysis compared with primary VATS. The results of subanalyses excluding patients with an underlying CCC (Supporting Appendix online, Table 4) and restricting the cohort to patients undergoing pleural drainage within two days of admission (Supporting Appendix online, Table 5) were similar to the results of our primary analysis with one exception; in the latter subanalysis, children undergoing initial chest tube placement without fibrinolysis were also less likely to require readmission compared with patients undergoing initial VATS.
| Adjusted OR (95% CI)a | P Value | |
|---|---|---|
| ||
| Additional pleural drainage procedure | ||
| Chest tube without fibrinolysis | 1.82 (1.103.00) | .019 |
| Chest tube with fibrinolysis | 2.31 (1.443.72) | <0.001 |
| Thoracotomy | 2.59 (1.624.14) | <0.001 |
| VATS | Reference | |
| Readmission within 14 days | ||
| Chest tube without fibrinolysis | 0.61 (0.361.05) | .077 |
| Chest tube with fibrinolysis | 0.45 (0.230.86) | .015 |
| Thoracotomy | 0.85 (0.521.39) | .521 |
| VATS | Reference | |
| Adjusted Mean (95% CI)a | P Value | |
| Total LOS (days) | ||
| Chest tube without fibrinolysis | 8.0 (7.88.2) | .339 |
| Chest tube with fibrinolysis | 8.1 (7.98.3) | .812 |
| Thoracotomy | 8.1 (7.98.3) | .632 |
| VATS | 8.1 (7.98.3) | Ref |
| Post‐initial procedure LOS (days) | ||
| Chest tube without fibrinolysis | 7.3 (7.07.5) | .512 |
| Chest tube with fibrinolysis | 7.5 (7.27.8) | .239 |
| Thoracotomy | 7.3 (7.07.6) | .841 |
| VATS | 7.3 (7.17.6) | Reference |
| Total cost, index hospitalization ($) | ||
| Chest tube without fibrinolysis | 22928 (2200023895 | .012 |
| Chest tube with fibrinolysis | 23621 (2263124655) | .657 |
| Thoracotomy | 23386 (2241924395 | .262 |
| VATS | 23820 (2280824878) | Reference |
| Total cost, episode of illness ($) | ||
| Chest tube without fibrinolysis | 23218 (2227824199) | .004 |
| Chest tube with fibrinolysis | 23749 (2275224790) | .253 |
| Thoracotomy | 23673 (2269324696) | .131 |
| VATS | 24280 (2324425362) | Reference |
Discussion
This multicenter study is the largest to evaluate the management of children hospitalized with complicated pneumonia. We found considerable variation in initial management and outcomes across hospitals. Differences in timing of the initial drainage procedure explained only a small amount of the variability in outcomes. Children undergoing initial VATS less commonly required additional drainage procedures while children undergoing initial chest tube placement with fibrinolysis less commonly required readmission. Differences in total and post‐procedure LOS were not statistically significant. Differences in cost, while statistically significant, were of marginal relevance.
Previous studies have also shown significant variation in treatment and outcomes of children with complicated pneumonia across hospitals.2, 8 Our study provides data from additional hospitals, includes a substantially larger number of patients undergoing initial VATS, distinguishes between fibrinolysis recipients and nonrecipients, and is the first to compare outcomes between four different initial drainage strategies. The creation of national consensus guidelines might reduce variability in initial management strategies, although the variability in outcomes across hospitals in the current study could not be explained simply by differences in the type or timing of the initial drainage procedure. Thus, future studies examining hospital‐level factors may play an important role in improving quality of care for children with complicated pneumonia.
Patients with initial thoracotomy or chest tube placement with or without fibrinolysis more commonly received additional drainage procedures than patients with initial VATS. This difference remained when patients with CCCs were excluded from the analysis and when the analysis was limited to patients undergoing pleural fluid drainage within 2 days of hospitalization. Several small, randomized trials demonstrated conflicting results when comparing initial chest tube placement with fibrinolysis and VATS. St. Peter et al22 reported that 3 (17%) of 18 patients undergoing initial chest tube placement with fibrinolysis and none of the 18 patients undergoing initial VATS received additional pleural drainage procedures. Sonnappa et al21 found no differences between the two groups. Kurt et al19 did not state the proportion of patients receiving additional procedures. However, the mean number of drainage procedures was 2.25 among the 8 patients undergoing initial chest tube placement while none of the 10 patients with VATS received additional drainage.19
Thoracotomy is often perceived as a definitive procedure for treatment of complicated pneumonia. However, several possibilities exist to explain why additional procedures were performed less frequently in patients undergoing initial VATS compared with initial thoracotomy. The limited visual field in thoracotomy may lead to greater residual disease post‐operatively in those receiving thoracotomy compared with VATS.31 Additionally, thoracotomy substantially disrupts the integrity of the chest wall and is consequently associated with complications such as bleeding and air leak into the pleural cavity more often than VATS.31, 32 It is thus possible that some of the additional procedures in patients receiving initial thoracotomy were necessary for management of thoracotomy‐associated complications rather than for failure of the initial drainage procedure.
Similar to the randomized trials by Sonnappa et al21 and St. Peter et al,22 differences in the overall and post‐procedure LOS were not significant among patients undergoing initial VATS compared with initial chest tube placement with fibrinolysis. However, chest tube placement without fibrinolysis did not result in significant differences in LOS compared with initial VATS. In the only pediatric randomized trial, the 29 intrapleural urokinase recipients had a 2 day shorter LOS compared with the 29 intrapleural saline recipients.33 Several small, randomized controlled trials of adults with complicated pneumonia reported improved pleural fluid drainage among intrapleural fibrinolysis recipients compared with non‐recipients.3436 However, a large multicenter randomized trial in adults found no differences in mortality, requirement for surgical drainage, or LOS between intrapleural streptokinase and placebo recipients.37 Subsequent meta‐analyses of randomized trials in adults also demonstrated no benefit to fibrinolysis.38, 39 In the context of the increasing use of intrapleural fibrinolysis in children with complicated pneumonia, our results highlight the need for a large, multicenter randomized controlled trial to determine whether chest tube with fibrinolysis is superior to chest tube alone.
Two small randomized trials21, 22 and a decision analysis40 identified chest tube with fibrinolysis as the most economical approach to children with complicated pneumonia. However, the costs did not differ significantly between patients undergoing initial VATS or initial chest tube placement with fibrinolysis in our study. The least costly approach was initial chest tube placement without fibrinolysis. Unlike the randomized controlled trials, we considered costs associated with readmissions in determining the total costs. Shah et al41 found no difference in total charges for patients undergoing initial VATS compared with initial chest tube placement; however, patients undergoing initial VATS were concentrated in a few centers, making it difficult to determine the relative importance of procedural and hospital factors.
This multicenter observational study has several limitations. First, discharge diagnosis coding may be unreliable for specific diseases. However, our rigorous definition of complicated pneumonia, supported by the high positive predictive value as verified by medical record review, minimizes the likelihood of misclassification.
Second, unmeasured confounding or residual confounding by indication for the method of pleural drainage may occur, potentially influencing our results in two disparate ways. If patients with more severe systemic illness were too unstable for operative interventions, then our results would be biased towards worse outcomes for children undergoing initial chest tube placement. We adjusted for several variables associated with a greater systemic severity of illness, including intensive care unit admission, making this possibility less likely. We also could not account for some factors associated with more severe local disease such as the size and character of the effusion. We suspect that patients with more extensive local disease (ie, loculated effusions) would have worse outcomes than other patients, regardless of initial procedure, and that these patients would also be more likely to undergo primary surgical drainage. Thus, this study may have underestimated the benefit of initial surgical drainage (eg, VATS) compared with nonsurgical drainage (ie, chest tube placement).
Third, misclassification of the method of initial pleural drainage may have occurred. Patients transferred from another institution following chest tube placement could either be classified as not receiving pleural drainage and thus excluded from the study or classified as having initial VATS or thoracotomy if the reason for transfer was chest tube treatment failure. Additionally, we could not distinguish routine use of fibrinolysis from fibrinolysis to maintain chest tube patency. Whether such misclassification would falsely minimize or maximize differences in outcomes between the various groups remains uncertain. Fourth, because this study only included tertiary care children's hospitals, these data are not generalizable to community settings. VATS requires specialized surgical training that may be unavailable in some areas. Finally, this study demonstrates the relative efficacy of various pleural fluid drainage procedures on short‐term clinical outcomes and resource utilization. However, long‐term functional outcomes should be measured in future prospective studies.
Conclusions
In conclusion, emphasis on evidence driven treatment to optimize care has led to an increasing examination of unwarranted practice variation.42 The lack of evidence for best practice makes it difficult to define unwarranted variation in the treatment of complicated pneumonia. Our study demonstrates the large variability in practice and raises additional questions regarding the optimal drainage strategies. Published randomized trials have focused on comparisons between chest tube placement with fibrinolysis and VATS. However, our data suggest that future randomized trials should include chest tube placement without fibrinolysis as a treatment strategy. In determining the current best treatment for patients with complicated pneumonia, a clinician must weigh the impact of needing an additional procedure in approximately one‐quarter of patients undergoing initial chest tube placement (with or without fibrinolysis) with the risks of general anesthesia and readmission in patients undergoing initial VATS.
Acknowledgements
Dr. Hall had full access to all the data in the study and takes responsibility for the integrity of the data and accuracy of the analysis.
- ,.Parapneumonic pleural effusion and empyema in children. Review of a 19‐year experience, 1962–1980.Clin Pediatr (Phila).1983;22:414–419.
- ,,,,.Primary early thoracoscopy and reduction in length of hospital stay and additional procedures among children with complicated pneumonia: Results of a multicenter retrospective cohort study.Arch Pediatr Adolesc Med.2008;162:675–681.
- ,.Empyema hospitalizations increased in US children despite pneumococcal conjugate vaccine.Pediatrics.2010;125:26–33.
- ,,, et al.Impact of the pneumococcal conjugate vaccine on pneumococcal parapneumonic empyema.Pediatr Infect Dis J.2006;25:250–254.
- ,,,,.Five‐fold increase in pediatric parapneumonic empyema since introduction of pneumococcal conjugate vaccine.Pediatric Infect Dis J.2008;27:1030–1032.
- ,,,.Increasing incidence of empyema complicating childhood community‐acquired pneumonia in the United States.Clin Infect Dis.2010;50:805–813.
- ,,,,.National hospitalization trends for pediatric pneumonia and associated complications.Pediatrics.2010;126:204–213.
- ,,, et al.Empyema associated with community‐acquired pneumonia: A Pediatric Investigator's Collaborative Network on Infections in Canada (PICNIC) study.BMC Infect Dis.2008;8:129.
- ,,,,.Pleural empyema in children.Ann Thorac Surg.1970;10:37–44.
- ,,.Management of streptococcal empyema.Ann Thorac Surg.1966;2:658–664.
- ,.Thoracoscopy in the management of empyema in children.J Pediatr Surg.1993;28:1128–1132.
- ,,,.Surgical treatment of parapneumonic empyema.Pediatr Pulmonol.1996;22:348–356.
- ,.The controversial role of decortication in the management of pediatric empyema.J Thorac Cardiovasc Surg.1988;96:166–170.
- ,,,,,.Postpneumonic empyema in children treated by early decortication.Eur J Pediatr Surg.1997;7:135–137.
- ,.Video‐assisted thoracoscopic surgery in the management of pediatric empyema.JSLS.1997;1:251–3.
- ,,,.Early video‐assisted thoracic surgery in the management of empyema.Pediatrics.1999;103:e63.
- ,,,,.Early definitive intervention by thoracoscopy in pediatric empyema.J Pediatr Surg.1999;34:178–180; discussion80–81.
- ,,,,.Thoracoscopy in the management of pediatric empyema.J Pediatr Surg.1995;30:1211–1215.
- ,,,,.Therapy of parapneumonic effusions in children: Video‐assisted thoracoscopic surgery versus conventional thoracostomy drainage.Pediatrics.2006;118:e547–e553.
- ,.Primary operative management for pediatric empyema: Decreases in hospital length of stay and charges in a national sample.Arch Pediatr Adolesc Med.2008;162:44–48.
- ,,, et al.Comparison of urokinase and video‐assisted thoracoscopic surgery for treatment of childhood empyema.Am J Respir Crit Care Med.2006;174:221–227.
- ,,, et al.Thoracoscopic decortication vs tube thoracostomy with fibrinolysis for empyema in children: A prospective, randomized trial.J Pediatr Surg.2009;44:106–111; discussion11.
- ,,,.Corticosteroids and mortality in children with bacterial meningitis.JAMA.2008;299:2048–2055.
- ,,,,.Intravenous immunoglobulin in children with streptococcal toxic shock syndrome.Clin Infect Dis.2009;49:1369–1376.
- ,,, et al.Deaths attributed to pediatric complex chronic conditions: National trends and implications for supportive care services.Pediatrics.2001;107:e99.
- ,.Multiple regression of cost data: Use of generalised linear models.J Health Serv Res Policy.2004;9:197–204.
- ,,,.A robustified modeling approach to analyze pediatric length of stay.Ann Epidemiol.2005;15:673–677.
- ,,.Correlates of length of stay, cost of care, and mortality among patients hospitalized for necrotizing fasciitis.Epidemiol Infect.2007;135:868–876.
- ,,,,,.Health care costs of adults treated for attention‐deficit/hyperactivity disorder who received alternative drug therapies.J Manag Care Pharm.2007;13:561–569.
- .The role of the propensity score in estimating dose‐response functions.Biometrika.2000;87:706–710.
- ,,,,.Experience with video‐assisted thoracoscopic surgery in the management of complicated pneumonia in children.J Pediatr Surg.2001;36:316–319.
- ,,, et al.VATS debridement versus thoracotomy in the treatment of loculated postpneumonia empyema.Ann Thorac Surg.1996;61:1626–1630.
- ,,,,.Randomised trial of intrapleural urokinase in the treatment of childhood empyema.Thorax.2002;57:343–347.
- ,,,,,.Intrapleural urokinase versus normal saline in the treatment of complicated parapneumonic effusions and empyema. A randomized, double‐blind study.Am J Respir Crit Care Med.1999;159:37–42.
- ,,.Randomised controlled trial of intrapleural streptokinase in community acquired pleural infection.Thorax.1997;52:416–421.
- ,,,,.Intrapleural streptokinase for empyema and complicated parapneumonic effusions.Am J Respir Crit Care Med.2004;170:49–53.
- ,,, et al.U.K. Controlled trial of intrapleural streptokinase for pleural infection.N Engl J Med.2005;352:865–874.
- ,.Intra‐pleural fibrinolytic therapy versus conservative management in the treatment of adult parapneumonic effusions and empyema.Cochrane Database Syst Rev.2008:CD002312.
- ,,,.Intrapleural fibrinolytic agents for empyema and complicated parapneumonic effusions: A meta‐analysis.Chest.2006;129:783–790.
- ,,.Cost‐effectiveness of competing strategies for the treatment of pediatric empyema.Pediatrics.2008;121:e1250–e1257.
- ,,.Costs of treating children with complicated pneumonia: A comparison of primary video‐assisted thoracoscopic surgery and chest tube placement.Pediatr Pulmonol.2010;45:71–77.
- .Unwarranted variation in pediatric medical care.Pediatr Clin North Am.2009;56:745–755.
Community‐acquired pneumonia, the most common serious bacterial infection in childhood, may be complicated by parapneumonic effusion (ie, complicated pneumonia).1 Children with complicated pneumonia require prolonged hospitalization and frequently undergo multiple pleural fluid drainage procedures.2 Additionally, the incidence of complicated pneumonia has increased,37 making the need to define appropriate therapy even more pressing. Defining appropriate therapy is challenging for the individual physician as a result of inconsistent and insufficient evidence, and wide variation in treatment practices.2, 8
Historically, thoracotomy was performed only if initial chest tube placement did not lead to clinical improvement.9, 10 Several authors, noting the rapid resolution of symptoms in children undergoing earlier thoracotomy, advocated for the use of thoracotomy as initial therapy rather than as a procedure of last resort.114 The advent of less invasive techniques such as video‐assisted thoracoscopic surgery (VATS) has served as an additional impetus to consider surgical drainage as the initial treatment strategy.1518 Few well‐designed studies have examined the relative efficacy of these interventions.2, 1922 Published randomized trials were single center, enrolled few patients, and arrived at different conclusions.19, 21, 22 In addition, these trials did not examine other important outcomes such as requirement for additional pleural fluid drainage procedures and hospital readmission. Two large retrospective multicenter studies found modest reductions in length of stay (LOS) and substantial decreases in the requirement for additional pleural fluid drainage procedures in children undergoing initial VATS compared with initial chest tube placement.2, 20 However, Shah et al2 included relatively few patients undergoing VATS. Li et al20 combined patients undergoing initial thoracentesis, initial chest tube placement, late pleural fluid drainage (by any method), and no pleural fluid drainage into a single non‐operative management category, precluding conclusions about the relative benefits of chest tube placement compared with VATS. Neither study2, 20 examined the role of chemical fibrinolysis, a therapy which has been associated with outcomes comparable to VATS in two small randomized trials.21, 22
The objectives of this multicenter study were to describe the variation in the initial management strategy along with associated outcomes of complicated pneumonia in childhood and to determine the comparative effectiveness of different pleural fluid drainage procedures.
Methods
Data Source
The Pediatric Health Information System (PHIS), which contains resource utilization data from 40 freestanding children's hospitals, provided data for this multicenter retrospective cohort study. Participating hospitals are located in noncompeting markets of 27 states plus the District of Columbia. The PHIS database includes patient demographics, diagnoses, and procedures as well as data for all drugs, radiologic studies, laboratory tests, and supplies charged to each patient. Data are de‐identified, however encrypted medical record numbers allow for tracking individual patients across admissions. The Child Health Corporation of America (Shawnee Mission, KS) and participating hospitals jointly assure data quality and reliability as described previously.23, 24 The Children's Hospital of Philadelphia Institutional Review Board reviewed and approved this study.
Patients
Children 18 years of age receiving a pleural drainage procedure for complicated pneumonia were eligible if they were discharged from participating hospitals between January 1, 2004 and June 30, 2009. Study participants met the following criteria: 1) discharge diagnosis of pneumonia (International Classification of Diseases, 9th revision [ICD‐9] discharge diagnosis codes 480.x‐483.x, 485.x‐487.x), 2) discharge diagnosis of pleural effusion (ICD‐9 codes 510.0, 510.9, 511.0, 511.1, or 511.9), and 3) billing charge for antibiotics on the first day of hospitalization. Additionally, the primary discharge diagnosis had to be either pneumonia or pleural effusion. Patients were excluded if they did not undergo pleural fluid drainage or if their initial pleural fluid drainage procedure was thoracentesis.
Study Definitions
Pleural drainage procedures were identified using ICD‐9 procedure codes for thoracentesis (34.91), chest tube placement (34.04), VATS (34.21), and thoracotomy (34.02 or 34.09). Fibrinolysis was defined as receipt of urokinase, streptokinase, or alteplase within two days of initial chest tube placement.
Acute conditions or complications included influenza (487, 487.0, 487.1, 487.8, 488, or V04.81) and hemolytic‐uremic syndrome (283.11). Chronic comorbid conditions (CCCs) (eg, malignancy) were identified using a previously reported classification scheme.25 Billing data were used to classify receipt of mechanical ventilation and medications on the first day of hospitalization.
Measured Outcomes
The primary outcomes were hospital LOS (both overall and post‐initial procedure), requirement for additional pleural drainage procedures, total cost for index hospitalization, all‐cause readmission within 14 days after index hospital discharge, and total cost of the episode (accounting for the cost of readmissions).
Measured Exposures
The primary exposure of interest was the initial pleural fluid drainage procedure, classified as chest tube placement without fibrinolysis, chest tube placement with fibrinolysis, VATS, or thoracotomy.
Statistical Analysis
Variables were summarized using frequencies and percentages for categorical variables, and median, interquartile range (IQR), and range for continuous variables. Outcomes by initial pleural drainage procedure were compared using chi‐squared tests for categorical variables and Kruskal‐Wallis tests for continuous variables.
Multivariable analysis was performed to account for potential confounding by observed baseline variables. For dichotomous outcome variables, modeling consisted of logistic regression using generalized estimating equations to account for hospital clustering. For continuous variables, a mixed model approach was used, treating hospital as a random effect. Log transformation was applied to the right‐skewed outcome variables (LOS and cost). Cost outcomes remained skewed following log transformation, thus gamma mixed models were applied.2629 Odds ratios and 95% confidence intervals (CIs) were reported for comparison of dichotomous outcomes and the adjusted means and 95% CIs were reported for continuous outcomes after appropriate back transformation.
Additional analyses addressed the potential impact of confounding by indication inherent in any observational study. First, patients with an underlying CCC were excluded to ensure that our results would be generalizable to otherwise healthy children with community‐acquired pneumonia. Second, patients undergoing pleural drainage >2 days after hospitalization were excluded to minimize the effect of residual confounding related to differences in timing of the initial drainage procedure. Third, the analysis was repeated using a generalized propensity score as an additional method to account for confounding by indication for the initial drainage procedure.30 Propensity scores, constructed using a multivariable generalized logit model, included all variables listed in Table 1. The inverse of the propensity score was included as a weight in each multivariable model described previously. Only the primary multivariable analyses are presented as the results of the propensity score analysis were nearly identical to the primary analyses.
| Overall | Chest Tube Without Fibrinolysis | Chest Tube With Fibrinolysis | Thoracotomy | VATS | P Value | |
|---|---|---|---|---|---|---|
| ||||||
| N | 3500 | 1672 (47.8) | 623 (17.8) | 797 (22.8) | 408 (11.7) | |
| Age | ||||||
| <1 year | 335 (9.6) | 176 (10.5) | 56 (9.0) | 78 (9.8) | 25 (6.1) | |
| 1 year | 475 (13.6) | 238 (14.2) | 98 (15.7) | 92 (11.5) | 47 (11.5) | 0.003 |
| 24 years | 1230 (35.1) | 548 (32.8) | 203 (32.6) | 310 (38.9) | 169 (41.4) | |
| 59 years | 897 (25.6) | 412 (24.6) | 170 (27.3) | 199 (25.0) | 116 (28.4) | |
| 1014 years | 324 (9.3) | 167 (10.0) | 61 (9.8) | 65 (8.2) | 31 (7.6) | |
| 1518 years | 193 (5.5) | 106 (6.3) | 29 (4.6) | 40 (5.0) | 18 (4.4) | |
| >18 years | 46 (1.3) | 25 (1.5) | 6 (0.96) | 13 (1.6) | 2 (0.5) | |
| Comorbid Conditions | ||||||
| Cardiac | 69 (2.0) | 43 (2.6) | 14 (2.3) | 12 (1.5) | 0 (0.0) | 0.006 |
| Malignancy | 81 (2.3) | 31 (1.9) | 18 (2.9) | 21 (2.6) | 11 (2.7) | 0.375 |
| Neurological | 138 (3.9) | 73 (4.4) | 20 (3.2) | 34 (4.3) | 11 (2.7) | 0.313 |
| Any Other Condition | 202 (5.8) | 96 (5.7) | 40 (6.4) | 47 (5.9) | 19 (4.7) | 0.696 |
| Payer | ||||||
| Government | 1240 (35.6) | 630 (37.8) | 224 (36.0) | 259 (32.7) | 127 (31.3) | <0.001 |
| Private | 1383 (39.7) | 607 (36.4) | 283 (45.4) | 310 (39.2) | 183 (45.07) | |
| Other | 864 (24.8) | 430 (25.8) | 116 (18.6) | 222 (28.1) | 96 (23.65) | |
| Race | ||||||
| Non‐Hispanic White | 1746 (51.9) | 838 (51.6) | 358 (59.7) | 361 (47.8) | 189 (48.7) | <0.001 |
| Non‐Hispanic Black | 601 (17.9) | 318 (19.6) | 90 (15.0) | 128 (17.0) | 65 (16.8) | |
| Hispanic | 588 (17.5) | 280 (17.3) | 73 (12.2) | 155 (20.5) | 80 (20.6) | |
| Asian | 117 (3.5) | 47 (2.9) | 20 (3.3) | 37 (4.9) | 13 (3.4) | |
| Other | 314 (9.3) | 140 (8.6) | 59 (9.8) | 74 (9.8) | 41 (10.6) | |
| Male Sex | 1912 (54.6) | 923 (55.2) | 336 (53.9) | 439 (55.1) | 214 (52.5) | 0.755 |
| Radiology | ||||||
| CT, no US | 1200 (34.3) | 600 (35.9) | 184 (29.5) | 280 (35.1) | 136 (33.3) | <0.001 |
| CT and US | 221 (6.3) | 84 (5.0) | 53 (8.5) | 61 (7.7) | 23 (5.6) | |
| US, no CT | 799 (22.8) | 324 (19.4) | 178 (28.6) | 200 (25.1) | 97 (23.8) | |
| No US, no CT | 1280 (36.6) | 664 (39.7) | 208 (33.4) | 256 (32.1) | 152 (37.3) | |
| Empiric Antibiotic Regimen | ||||||
| Cephalosporins alone | 448 (12.8) | 181 (10.83) | 126 (20.2) | 73 (9.2) | 68 (16.7) | <0.001 |
| Cephalosporin and clindamycin | 797 (22.8) | 359 (21.5) | 145 (23.3) | 184 (23.1) | 109 (26.7) | |
| Other antibiotic combination | 167 (4.8) | 82 (4.9) | 30 (4.8) | 38 (4.8) | 17 (4.2) | |
| Cephalosporin and vancomycin | 2088 (59.7) | 1050 (62.8) | 322 (51.7) | 502 (63.0) | 214 (52.5) | |
| Mechanical ventilation | 494 (14.1) | 251 (15.0) | 75 (12.0) | 114 (14.3) | 54 (13.2) | 0.307 |
| Corticosteroids | 520 (14.9) | 291 (17.4) | 72 (11.6) | 114 (14.3) | 43 (10.5) | <0.001 |
| Blood product transfusionsb | 761 (21.7) | 387 (23.2) | 145 (23.3) | 161 (20.2) | 68 (16.7) | 0.018 |
| Vasoactive infusionsc | 381 (10.9) | 223 (13.3) | 63 (10.1) | 72 (9.0) | 23 (5.6) | <0.001 |
| Admission to intensive care | 1397 (39.9) | 731 (43.7) | 234 (37.6) | 296 (37.1) | 136 (33.3) | <0.001 |
| Extracorporeal membranous oxygenation | 18 (0.5) | 13 (0.8) | 2 (0.3) | 3 (0.4) | 0 (0.0) | 0.163 |
| Hemolytic‐uremic syndrome | 31 (0.9) | 15 (0.9) | 6 (1.0) | 7 (0.9) | 3 (0.7) | 0.985 |
| Influenza | 108 (3.1) | 53 (3.2) | 27 (4.3) | 23 (2.9) | 5 (1.2) | 0.044 |
| Arterial blood gas measurements | 0 (0,1) | 0 (0, 2) | 0 (0,1) | 0 (0, 1) | 0 (0, 1) | <0.001 |
| Days to first procedure | 1 (0, 3) | 1 (0, 2) | 1 (1, 3) | 1 (1, 3) | 1 (1, 3) | <0.001 |
Medical records of a randomly selected subset of subjects from 6 hospitals were reviewed to determine the accuracy of our algorithm in identifying patients with complicated pneumonia; these subjects represented 1% of the study population. For the purposes of medical record review, complicated pneumonia was defined by the following: 1) radiologically‐confirmed lung infiltrate; 2) moderate or large pleural effusion; and 3) signs and symptoms of lower respiratory tract infection. Complicated pneumonia was identified in 118 of 120 reviewed subjects for a positive predictive value of 98.3%.
All analyses were clustered by hospital. Analyses were performed using SAS version 9.2 (SAS Institute, Cary, NC). A two‐tailed P < 0.05 was considered statistically significant.
Results
Patient Characteristics
During the study period, 9,680 subjects had complicated pneumonia. Subjects were excluded if they did not have a pleural drainage procedure (n = 5798), or if thoracentesis was the first pleural fluid drainage procedure performed (n = 382). The remaining 3500 patients were included. Demographic characteristics are summarized in Table 1. The median patient age was 4.1 years (IQR: 2.17.2 years). An underlying CCC was present in 424 (12.1%) patients. There was no association between type of drainage procedure and mechanical ventilation. However, factors associated with more severe systemic illness, such as blood product transfusion, were more common among those undergoing initial chest tube placement with or without fibrinolysis (Table 1).
Initial Pleural Fluid Drainage Procedures
The primary procedures included chest tube without fibrinolysis (47.8%); chest tube with fibrinolysis (17.8%); thoracotomy (22.8%); and VATS (11.7%) (Table 1). The proportion of patients undergoing primary chest tube placement with fibrinolysis increased over time from 14.2% in 2004 to 30.0% in 2009 (P < 0.001; chi‐squared test for trend). The initial procedure varied by hospital with the greatest proportion of patients undergoing primary chest tube placement without fibrinolysis at 28 (70.0%) hospitals, chest tube placement with fibrinolysis at 5 (12.5%) hospitals, thoracotomy at 5 (12.5%) hospitals, and VATS at 2 (5.0%) hospitals (Figure 1). The median proportion of patients undergoing primary VATS across all hospitals was 11.5% (IQR: 3.9%‐26.5%) (Figure 1). The median time to first procedure was 1 day (IQR: 03 days).
Outcome Measures
Variation in outcomes occurred across hospitals. Additional pleural drainage procedures were performed in a median of 20.9% of patients with a range of 6.8% to 44.8% (IQR: 14.5%‐25.3%) of patients across all hospitals. Median LOS was 10 days with a range of 714 days (IQR: 8.511 days) and the median LOS following the initial pleural fluid drainage procedure was 8 days with a range of 6 to 13 days (IQR: 78 days). Variation in timing of the initial pleural fluid drainage procedure explained 9.6% of the variability in LOS (Spearman rho, 0.31; P < 0.001).
Overall, 118 (3.4%) patients were readmitted within 14 days of index discharge; the median readmission rate was 3.8% with a range of 0.8% to 33.3% (IQR: 2.1%‐5.8%) across hospitals. The median total cost of the index hospitalization was $19,574 (IQR: $13,791‐$31,063). The total cost for the index hospitalization exceeded $54,215 for 10% of patients and the total cost of the episode exceeded $55,208 for 10% of patients. Unadjusted outcomes, stratified by primary pleural fluid drainage procedure, are summarized in Table 2.
| Overall | Chest Tube Without Fibrinolysis | Chest Tube With Fibrinolysis | Thoracotomy | VATS | P Valueb | |
|---|---|---|---|---|---|---|
| ||||||
| Additional Procedure | 716 (20.5) | 331 (19.8) | 144 (23.1) | 197 (24.7) | 44 (10.8) | <0.001 |
| Readmission within 14 days | 118 (3.4) | 54 (3.3) | 13 (2.1) | 32 (4.0) | 19 (4.7) | 0.096 |
| Total LOS (days) | 10 (7, 14) | 10 (7, 14) | 9 (7, 13) | 10 (7, 14) | 9 (7, 12) | <.001 |
| Post‐initial Procedure LOS (days) | 8 (5, 12) | 8 (6, 12) | 7 (5, 10) | 8 (5, 12) | 7 (5, 10) | <0.001 |
| Total Cost, Index Hospitalization ($)e | 19319 (13358, 30955) | 19951 (13576, 32018)c | 19565 (13209, 32778)d | 20352 (14351, 31343) | 17918 (13531, 25166) | 0.016 |
| Total Cost, Episode of Illness ($)e | 19831 (13927, 31749) | 20151 (13764, 32653) | 19593 (13210, 32861) | 20573 (14419, 31753) | 18344 (13835, 25462) | 0.029 |
In multivariable analysis, differences in total LOS and post‐procedure LOS were not significant (Table 3). The odds of additional drainage procedures were higher for all drainage procedures compared with initial VATS (Table 3). Patients undergoing initial chest tube placement with fibrinolysis were less likely to require readmission compared with patients undergoing initial VATS (Table 3). The total cost for the episode of illness (including the cost of readmission) was significantly less for those undergoing primary chest tube placement without fibrinolysis compared with primary VATS. The results of subanalyses excluding patients with an underlying CCC (Supporting Appendix online, Table 4) and restricting the cohort to patients undergoing pleural drainage within two days of admission (Supporting Appendix online, Table 5) were similar to the results of our primary analysis with one exception; in the latter subanalysis, children undergoing initial chest tube placement without fibrinolysis were also less likely to require readmission compared with patients undergoing initial VATS.
| Adjusted OR (95% CI)a | P Value | |
|---|---|---|
| ||
| Additional pleural drainage procedure | ||
| Chest tube without fibrinolysis | 1.82 (1.103.00) | .019 |
| Chest tube with fibrinolysis | 2.31 (1.443.72) | <0.001 |
| Thoracotomy | 2.59 (1.624.14) | <0.001 |
| VATS | Reference | |
| Readmission within 14 days | ||
| Chest tube without fibrinolysis | 0.61 (0.361.05) | .077 |
| Chest tube with fibrinolysis | 0.45 (0.230.86) | .015 |
| Thoracotomy | 0.85 (0.521.39) | .521 |
| VATS | Reference | |
| Adjusted Mean (95% CI)a | P Value | |
| Total LOS (days) | ||
| Chest tube without fibrinolysis | 8.0 (7.88.2) | .339 |
| Chest tube with fibrinolysis | 8.1 (7.98.3) | .812 |
| Thoracotomy | 8.1 (7.98.3) | .632 |
| VATS | 8.1 (7.98.3) | Ref |
| Post‐initial procedure LOS (days) | ||
| Chest tube without fibrinolysis | 7.3 (7.07.5) | .512 |
| Chest tube with fibrinolysis | 7.5 (7.27.8) | .239 |
| Thoracotomy | 7.3 (7.07.6) | .841 |
| VATS | 7.3 (7.17.6) | Reference |
| Total cost, index hospitalization ($) | ||
| Chest tube without fibrinolysis | 22928 (2200023895 | .012 |
| Chest tube with fibrinolysis | 23621 (2263124655) | .657 |
| Thoracotomy | 23386 (2241924395 | .262 |
| VATS | 23820 (2280824878) | Reference |
| Total cost, episode of illness ($) | ||
| Chest tube without fibrinolysis | 23218 (2227824199) | .004 |
| Chest tube with fibrinolysis | 23749 (2275224790) | .253 |
| Thoracotomy | 23673 (2269324696) | .131 |
| VATS | 24280 (2324425362) | Reference |
Discussion
This multicenter study is the largest to evaluate the management of children hospitalized with complicated pneumonia. We found considerable variation in initial management and outcomes across hospitals. Differences in timing of the initial drainage procedure explained only a small amount of the variability in outcomes. Children undergoing initial VATS less commonly required additional drainage procedures while children undergoing initial chest tube placement with fibrinolysis less commonly required readmission. Differences in total and post‐procedure LOS were not statistically significant. Differences in cost, while statistically significant, were of marginal relevance.
Previous studies have also shown significant variation in treatment and outcomes of children with complicated pneumonia across hospitals.2, 8 Our study provides data from additional hospitals, includes a substantially larger number of patients undergoing initial VATS, distinguishes between fibrinolysis recipients and nonrecipients, and is the first to compare outcomes between four different initial drainage strategies. The creation of national consensus guidelines might reduce variability in initial management strategies, although the variability in outcomes across hospitals in the current study could not be explained simply by differences in the type or timing of the initial drainage procedure. Thus, future studies examining hospital‐level factors may play an important role in improving quality of care for children with complicated pneumonia.
Patients with initial thoracotomy or chest tube placement with or without fibrinolysis more commonly received additional drainage procedures than patients with initial VATS. This difference remained when patients with CCCs were excluded from the analysis and when the analysis was limited to patients undergoing pleural fluid drainage within 2 days of hospitalization. Several small, randomized trials demonstrated conflicting results when comparing initial chest tube placement with fibrinolysis and VATS. St. Peter et al22 reported that 3 (17%) of 18 patients undergoing initial chest tube placement with fibrinolysis and none of the 18 patients undergoing initial VATS received additional pleural drainage procedures. Sonnappa et al21 found no differences between the two groups. Kurt et al19 did not state the proportion of patients receiving additional procedures. However, the mean number of drainage procedures was 2.25 among the 8 patients undergoing initial chest tube placement while none of the 10 patients with VATS received additional drainage.19
Thoracotomy is often perceived as a definitive procedure for treatment of complicated pneumonia. However, several possibilities exist to explain why additional procedures were performed less frequently in patients undergoing initial VATS compared with initial thoracotomy. The limited visual field in thoracotomy may lead to greater residual disease post‐operatively in those receiving thoracotomy compared with VATS.31 Additionally, thoracotomy substantially disrupts the integrity of the chest wall and is consequently associated with complications such as bleeding and air leak into the pleural cavity more often than VATS.31, 32 It is thus possible that some of the additional procedures in patients receiving initial thoracotomy were necessary for management of thoracotomy‐associated complications rather than for failure of the initial drainage procedure.
Similar to the randomized trials by Sonnappa et al21 and St. Peter et al,22 differences in the overall and post‐procedure LOS were not significant among patients undergoing initial VATS compared with initial chest tube placement with fibrinolysis. However, chest tube placement without fibrinolysis did not result in significant differences in LOS compared with initial VATS. In the only pediatric randomized trial, the 29 intrapleural urokinase recipients had a 2 day shorter LOS compared with the 29 intrapleural saline recipients.33 Several small, randomized controlled trials of adults with complicated pneumonia reported improved pleural fluid drainage among intrapleural fibrinolysis recipients compared with non‐recipients.3436 However, a large multicenter randomized trial in adults found no differences in mortality, requirement for surgical drainage, or LOS between intrapleural streptokinase and placebo recipients.37 Subsequent meta‐analyses of randomized trials in adults also demonstrated no benefit to fibrinolysis.38, 39 In the context of the increasing use of intrapleural fibrinolysis in children with complicated pneumonia, our results highlight the need for a large, multicenter randomized controlled trial to determine whether chest tube with fibrinolysis is superior to chest tube alone.
Two small randomized trials21, 22 and a decision analysis40 identified chest tube with fibrinolysis as the most economical approach to children with complicated pneumonia. However, the costs did not differ significantly between patients undergoing initial VATS or initial chest tube placement with fibrinolysis in our study. The least costly approach was initial chest tube placement without fibrinolysis. Unlike the randomized controlled trials, we considered costs associated with readmissions in determining the total costs. Shah et al41 found no difference in total charges for patients undergoing initial VATS compared with initial chest tube placement; however, patients undergoing initial VATS were concentrated in a few centers, making it difficult to determine the relative importance of procedural and hospital factors.
This multicenter observational study has several limitations. First, discharge diagnosis coding may be unreliable for specific diseases. However, our rigorous definition of complicated pneumonia, supported by the high positive predictive value as verified by medical record review, minimizes the likelihood of misclassification.
Second, unmeasured confounding or residual confounding by indication for the method of pleural drainage may occur, potentially influencing our results in two disparate ways. If patients with more severe systemic illness were too unstable for operative interventions, then our results would be biased towards worse outcomes for children undergoing initial chest tube placement. We adjusted for several variables associated with a greater systemic severity of illness, including intensive care unit admission, making this possibility less likely. We also could not account for some factors associated with more severe local disease such as the size and character of the effusion. We suspect that patients with more extensive local disease (ie, loculated effusions) would have worse outcomes than other patients, regardless of initial procedure, and that these patients would also be more likely to undergo primary surgical drainage. Thus, this study may have underestimated the benefit of initial surgical drainage (eg, VATS) compared with nonsurgical drainage (ie, chest tube placement).
Third, misclassification of the method of initial pleural drainage may have occurred. Patients transferred from another institution following chest tube placement could either be classified as not receiving pleural drainage and thus excluded from the study or classified as having initial VATS or thoracotomy if the reason for transfer was chest tube treatment failure. Additionally, we could not distinguish routine use of fibrinolysis from fibrinolysis to maintain chest tube patency. Whether such misclassification would falsely minimize or maximize differences in outcomes between the various groups remains uncertain. Fourth, because this study only included tertiary care children's hospitals, these data are not generalizable to community settings. VATS requires specialized surgical training that may be unavailable in some areas. Finally, this study demonstrates the relative efficacy of various pleural fluid drainage procedures on short‐term clinical outcomes and resource utilization. However, long‐term functional outcomes should be measured in future prospective studies.
Conclusions
In conclusion, emphasis on evidence driven treatment to optimize care has led to an increasing examination of unwarranted practice variation.42 The lack of evidence for best practice makes it difficult to define unwarranted variation in the treatment of complicated pneumonia. Our study demonstrates the large variability in practice and raises additional questions regarding the optimal drainage strategies. Published randomized trials have focused on comparisons between chest tube placement with fibrinolysis and VATS. However, our data suggest that future randomized trials should include chest tube placement without fibrinolysis as a treatment strategy. In determining the current best treatment for patients with complicated pneumonia, a clinician must weigh the impact of needing an additional procedure in approximately one‐quarter of patients undergoing initial chest tube placement (with or without fibrinolysis) with the risks of general anesthesia and readmission in patients undergoing initial VATS.
Acknowledgements
Dr. Hall had full access to all the data in the study and takes responsibility for the integrity of the data and accuracy of the analysis.
- ,.Parapneumonic pleural effusion and empyema in children. Review of a 19‐year experience, 1962–1980.Clin Pediatr (Phila).1983;22:414–419.
- ,,,,.Primary early thoracoscopy and reduction in length of hospital stay and additional procedures among children with complicated pneumonia: Results of a multicenter retrospective cohort study.Arch Pediatr Adolesc Med.2008;162:675–681.
- ,.Empyema hospitalizations increased in US children despite pneumococcal conjugate vaccine.Pediatrics.2010;125:26–33.
- ,,, et al.Impact of the pneumococcal conjugate vaccine on pneumococcal parapneumonic empyema.Pediatr Infect Dis J.2006;25:250–254.
- ,,,,.Five‐fold increase in pediatric parapneumonic empyema since introduction of pneumococcal conjugate vaccine.Pediatric Infect Dis J.2008;27:1030–1032.
- ,,,.Increasing incidence of empyema complicating childhood community‐acquired pneumonia in the United States.Clin Infect Dis.2010;50:805–813.
- ,,,,.National hospitalization trends for pediatric pneumonia and associated complications.Pediatrics.2010;126:204–213.
- ,,, et al.Empyema associated with community‐acquired pneumonia: A Pediatric Investigator's Collaborative Network on Infections in Canada (PICNIC) study.BMC Infect Dis.2008;8:129.
- ,,,,.Pleural empyema in children.Ann Thorac Surg.1970;10:37–44.
- ,,.Management of streptococcal empyema.Ann Thorac Surg.1966;2:658–664.
- ,.Thoracoscopy in the management of empyema in children.J Pediatr Surg.1993;28:1128–1132.
- ,,,.Surgical treatment of parapneumonic empyema.Pediatr Pulmonol.1996;22:348–356.
- ,.The controversial role of decortication in the management of pediatric empyema.J Thorac Cardiovasc Surg.1988;96:166–170.
- ,,,,,.Postpneumonic empyema in children treated by early decortication.Eur J Pediatr Surg.1997;7:135–137.
- ,.Video‐assisted thoracoscopic surgery in the management of pediatric empyema.JSLS.1997;1:251–3.
- ,,,.Early video‐assisted thoracic surgery in the management of empyema.Pediatrics.1999;103:e63.
- ,,,,.Early definitive intervention by thoracoscopy in pediatric empyema.J Pediatr Surg.1999;34:178–180; discussion80–81.
- ,,,,.Thoracoscopy in the management of pediatric empyema.J Pediatr Surg.1995;30:1211–1215.
- ,,,,.Therapy of parapneumonic effusions in children: Video‐assisted thoracoscopic surgery versus conventional thoracostomy drainage.Pediatrics.2006;118:e547–e553.
- ,.Primary operative management for pediatric empyema: Decreases in hospital length of stay and charges in a national sample.Arch Pediatr Adolesc Med.2008;162:44–48.
- ,,, et al.Comparison of urokinase and video‐assisted thoracoscopic surgery for treatment of childhood empyema.Am J Respir Crit Care Med.2006;174:221–227.
- ,,, et al.Thoracoscopic decortication vs tube thoracostomy with fibrinolysis for empyema in children: A prospective, randomized trial.J Pediatr Surg.2009;44:106–111; discussion11.
- ,,,.Corticosteroids and mortality in children with bacterial meningitis.JAMA.2008;299:2048–2055.
- ,,,,.Intravenous immunoglobulin in children with streptococcal toxic shock syndrome.Clin Infect Dis.2009;49:1369–1376.
- ,,, et al.Deaths attributed to pediatric complex chronic conditions: National trends and implications for supportive care services.Pediatrics.2001;107:e99.
- ,.Multiple regression of cost data: Use of generalised linear models.J Health Serv Res Policy.2004;9:197–204.
- ,,,.A robustified modeling approach to analyze pediatric length of stay.Ann Epidemiol.2005;15:673–677.
- ,,.Correlates of length of stay, cost of care, and mortality among patients hospitalized for necrotizing fasciitis.Epidemiol Infect.2007;135:868–876.
- ,,,,,.Health care costs of adults treated for attention‐deficit/hyperactivity disorder who received alternative drug therapies.J Manag Care Pharm.2007;13:561–569.
- .The role of the propensity score in estimating dose‐response functions.Biometrika.2000;87:706–710.
- ,,,,.Experience with video‐assisted thoracoscopic surgery in the management of complicated pneumonia in children.J Pediatr Surg.2001;36:316–319.
- ,,, et al.VATS debridement versus thoracotomy in the treatment of loculated postpneumonia empyema.Ann Thorac Surg.1996;61:1626–1630.
- ,,,,.Randomised trial of intrapleural urokinase in the treatment of childhood empyema.Thorax.2002;57:343–347.
- ,,,,,.Intrapleural urokinase versus normal saline in the treatment of complicated parapneumonic effusions and empyema. A randomized, double‐blind study.Am J Respir Crit Care Med.1999;159:37–42.
- ,,.Randomised controlled trial of intrapleural streptokinase in community acquired pleural infection.Thorax.1997;52:416–421.
- ,,,,.Intrapleural streptokinase for empyema and complicated parapneumonic effusions.Am J Respir Crit Care Med.2004;170:49–53.
- ,,, et al.U.K. Controlled trial of intrapleural streptokinase for pleural infection.N Engl J Med.2005;352:865–874.
- ,.Intra‐pleural fibrinolytic therapy versus conservative management in the treatment of adult parapneumonic effusions and empyema.Cochrane Database Syst Rev.2008:CD002312.
- ,,,.Intrapleural fibrinolytic agents for empyema and complicated parapneumonic effusions: A meta‐analysis.Chest.2006;129:783–790.
- ,,.Cost‐effectiveness of competing strategies for the treatment of pediatric empyema.Pediatrics.2008;121:e1250–e1257.
- ,,.Costs of treating children with complicated pneumonia: A comparison of primary video‐assisted thoracoscopic surgery and chest tube placement.Pediatr Pulmonol.2010;45:71–77.
- .Unwarranted variation in pediatric medical care.Pediatr Clin North Am.2009;56:745–755.
Copyright © 2011 Society of Hospital Medicine
