User login
The Medical Liability Environment: Is It Really Any Worse for Hospitalists?
Although malpractice “crises” come and go, liability fears persist near top of mind for most physicians.1 Liability insurance premiums have plateaued in recent years, but remain at high levels, and the prospect of being reported to the National Practitioner Data Bank (NPDB) or listed on a state medical board’s website for a paid liability claim is unsettling. The high-acuity setting and the absence of longitudinal patient relationships in hospital medicine may theoretically raise malpractice risk, yet hospitalists’ liability risk remains understudied.2
The contribution by Schaffer and colleagues3 in this issue of the Journal of Hospital Medicine is thus welcome and illuminating. The researchers examine the liability risk of hospitalists compared to that of other specialties by utilizing a large database of malpractice claims compiled from multiple insurers across a decade.3 In a field of research plagued by inadequate data, the Comparative Benchmarking System (CBS) built by CRICO/RMF is a treasure. Unlike the primary national database of malpractice claims, the NPDB, the CBS contains information on claims that did not result in a payment, as well as physicians’ specialty and detailed information on the allegations, injuries, and their causes. The CBS contains almost a third of all medical liability claims made in the United States during the study period, supporting generalizability.
Schaffer and colleagues1 found that hospitalists had a lower claims rate than physicians in emergency medicine or neurosurgery. The rate was on par with that for non-hospital general internists, even though hospitalists often care for higher-acuity patients. Although claims rates dropped over the study period for physicians in neurosurgery, emergency medicine, psychiatry, and internal medicine subspecialties, the rate for hospitalists did not change significantly. Further, the median payout on claims against hospitalists was the highest of all the specialties examined, except neurosurgery. This reflects higher injury severity in hospitalist cases: half the claims against hospitalists involved death and three-quarters were high severity.
The study is not without limitations. Due to missing data, only a fraction of the claims (8.2% to 11%) in the full dataset are used in the claims rate analysis. Regression models predicting a payment are based on a small number of payments for hospitalists (n = 363). Further, the authors advance, as a potential explanation for hospitalists’ higher liability risk, that hospitalists are disproportionately young compared to other specialists, but the dataset lacks age data. These limitations suggest caution in the authors’ overall conclusion that “the malpractice environment for hospitalists is becoming less favorable.”
Nevertheless, several important insights emerge from their analysis. The very existence of claims demonstrates that patient harm continues. The contributing factors and judgment errors found in these claims demonstrate that much of this harm is potentially preventable and a risk to patient safety. Whether or not the authors’ young-hospitalist hypothesis is ultimately proven, it is difficult to argue with more mentorship as a means to improve safety. Also, preventing or intercepting judgment errors remains a vexing challenge in medicine that undoubtedly calls for creative clinical decision support solutions. Schaffer and colleagues1 also note that hospitalists are increasingly co-managing patients with other specialties, such as orthopedic surgery. Whether this new practice model drives hospitalist liability risk because hospitalists are practicing in areas in which they have less experience (as the authors posit) or whether hospitalists are simply more likely to be named in a suit as part of a specialty team with higher liability risk remains unknown and merits further investigation.
Ultimately, regardless of whether the liability environment is worsening for hospitalists, the need to improve our liability system is clear. There is room to improve the system on a number of metrics, including properly compensating negligently harmed patients without unduly burdening providers. The system also induces defensive medicine and has not driven safety improvements as expected. The liability environment, as a result, remains challenging not just for hospitalists, but for all patients and physicians as well.
1. Sage WM, Boothman RC, Gallagher TH. Another medical malpractice crisis? Try something different. JAMA. 2020;324(14):1395-1396. https://doi.org/10.1001/jama.2020.16557
2. Schaffer AC, Puopolo AL, Raman S, Kachalia A. Liability impact of the hospitalist model of care. J Hosp Med. 2014;9(12):750-755. https://doi.org/10.1002/jhm.2244
3. Schaffer AC, Yu-Moe CW, Babayan A, Wachter RM, Einbinder JS. Rates and characteristics of medical malpractice claims against hospitalists. J Hosp Med. 2021;16(7):390-396. https://doi.org/10.12788/jhm.3557
Although malpractice “crises” come and go, liability fears persist near top of mind for most physicians.1 Liability insurance premiums have plateaued in recent years, but remain at high levels, and the prospect of being reported to the National Practitioner Data Bank (NPDB) or listed on a state medical board’s website for a paid liability claim is unsettling. The high-acuity setting and the absence of longitudinal patient relationships in hospital medicine may theoretically raise malpractice risk, yet hospitalists’ liability risk remains understudied.2
The contribution by Schaffer and colleagues3 in this issue of the Journal of Hospital Medicine is thus welcome and illuminating. The researchers examine the liability risk of hospitalists compared to that of other specialties by utilizing a large database of malpractice claims compiled from multiple insurers across a decade.3 In a field of research plagued by inadequate data, the Comparative Benchmarking System (CBS) built by CRICO/RMF is a treasure. Unlike the primary national database of malpractice claims, the NPDB, the CBS contains information on claims that did not result in a payment, as well as physicians’ specialty and detailed information on the allegations, injuries, and their causes. The CBS contains almost a third of all medical liability claims made in the United States during the study period, supporting generalizability.
Schaffer and colleagues1 found that hospitalists had a lower claims rate than physicians in emergency medicine or neurosurgery. The rate was on par with that for non-hospital general internists, even though hospitalists often care for higher-acuity patients. Although claims rates dropped over the study period for physicians in neurosurgery, emergency medicine, psychiatry, and internal medicine subspecialties, the rate for hospitalists did not change significantly. Further, the median payout on claims against hospitalists was the highest of all the specialties examined, except neurosurgery. This reflects higher injury severity in hospitalist cases: half the claims against hospitalists involved death and three-quarters were high severity.
The study is not without limitations. Due to missing data, only a fraction of the claims (8.2% to 11%) in the full dataset are used in the claims rate analysis. Regression models predicting a payment are based on a small number of payments for hospitalists (n = 363). Further, the authors advance, as a potential explanation for hospitalists’ higher liability risk, that hospitalists are disproportionately young compared to other specialists, but the dataset lacks age data. These limitations suggest caution in the authors’ overall conclusion that “the malpractice environment for hospitalists is becoming less favorable.”
Nevertheless, several important insights emerge from their analysis. The very existence of claims demonstrates that patient harm continues. The contributing factors and judgment errors found in these claims demonstrate that much of this harm is potentially preventable and a risk to patient safety. Whether or not the authors’ young-hospitalist hypothesis is ultimately proven, it is difficult to argue with more mentorship as a means to improve safety. Also, preventing or intercepting judgment errors remains a vexing challenge in medicine that undoubtedly calls for creative clinical decision support solutions. Schaffer and colleagues1 also note that hospitalists are increasingly co-managing patients with other specialties, such as orthopedic surgery. Whether this new practice model drives hospitalist liability risk because hospitalists are practicing in areas in which they have less experience (as the authors posit) or whether hospitalists are simply more likely to be named in a suit as part of a specialty team with higher liability risk remains unknown and merits further investigation.
Ultimately, regardless of whether the liability environment is worsening for hospitalists, the need to improve our liability system is clear. There is room to improve the system on a number of metrics, including properly compensating negligently harmed patients without unduly burdening providers. The system also induces defensive medicine and has not driven safety improvements as expected. The liability environment, as a result, remains challenging not just for hospitalists, but for all patients and physicians as well.
1. Sage WM, Boothman RC, Gallagher TH. Another medical malpractice crisis? Try something different. JAMA. 2020;324(14):1395-1396. https://doi.org/10.1001/jama.2020.16557
2. Schaffer AC, Puopolo AL, Raman S, Kachalia A. Liability impact of the hospitalist model of care. J Hosp Med. 2014;9(12):750-755. https://doi.org/10.1002/jhm.2244
3. Schaffer AC, Yu-Moe CW, Babayan A, Wachter RM, Einbinder JS. Rates and characteristics of medical malpractice claims against hospitalists. J Hosp Med. 2021;16(7):390-396. https://doi.org/10.12788/jhm.3557
© 2021 Society of Hospital Medicine
Supporting Hospitals During a New Wave of COVID-19
The COVID-19 pandemic has put an extraordinary strain on US hospitals.1 In spring 2020, many hospitals had to quickly adapt to treat a surge of patients, and many more had to prepare for a potential surge. Creating reserve capacity meant halting outpatient care and elective surgeries, repurposing inpatient units, and increasing critical care staffing. Hospitals again face these difficult decisions, as COVID-19 resurges and variants of SARS-CoV-2 increasingly circulate, with large financial losses projected for 2021.2 Some large hospital systems may have the financial reserves to weather this storm, but the precarious situation facing others likely requires policy action.
Hospitals’ financial stress emanates from multiple quarters. First, revenue from elective inpatient procedures and outpatient care dropped dramatically, has not fully rebounded,3,4 and is not fully offset by revenue from COVID-19 care. Second, high unemployment may force up to 20% of commercially insured Americans into lower-reimbursing public insurance or the ranks of the uninsured, generating a projected $95 billion annual loss for hospitals.5 Third, under the current payment system, the costs of preparing for a pandemic are not directly reimbursed. Yet—whether or not they ultimately experienced a large COVID-19 caseload—hospitals’ surge preparation has involved purchasing vast quantities of protective personal equipment (PPE) and other supplies and equipment, hiring additional staff, building SARS-CoV-2 testing capacity, and expanding occupational health services. Many expenses persist as “the new normal”: admissions now require SARS-CoV-2 testing, additional staff and PPE, and often, a private room. Physical distancing requirements mean hospitals’ capacity—and thus, revenue—will remain reduced.
Private insurers, by and large, are not volunteering to cover these increased costs, and it is difficult for hospitals to pass them along. Payment terms in many contracts (eg, for Medicare) are not modifiable; even where they are, renegotiating takes time. To date, federal relief payments from the CARES Act do not fully reimburse COVID-19 losses—a particular problem for smaller and safety-net hospitals without large reserves.
This situation raises ethical concerns. For example, it is ethically relevant that COVID-19 resurgence and hospitalizations are linked to states’ decisions to reopen quickly to ease economic burdens on businesses and workers. One result has been to shift some of the pandemic’s economic burden to the healthcare sector. From a fairness perspective, there should be limits on the losses hospitals are forced to shoulder to maintain COVID-19 preparedness and services. Even if hospitals have reserves, spending them threatens funding for other essential activities, such as capital investment.
The current situation is also fraught with perverse incentives that could jeopardize safe care. With elective care remaining at risk of being reduced,6 pressure intensifies to deliver as many services as possible as quickly as possible, which may not align with patients’ best interests. Across hospitals that need to maximize volume to survive, a push to keep elective services open may emerge, even as COVID-19 prevalence may favor a shutdown. Hospitals with a heavy COVID-19 caseload may have greater difficulty reopening than competitors with lower caseloads, potentially impacting quality if patients seek elective care at lower-volume centers or in ways that disrupt continuity of care.
Ethical dilemmas are also raised by the delicate balancing of interests that hospitals have been engaging in among patient groups. How should they balance the needs of COVID-19 patients against potential harms to others who must delay care?
It is wrong to ask hospitals to make such choices when policy solutions are available. With the resurgence of COVID-19 must come a fresh, sustained program of federal financial relief for hospitals. While direct government support is the swiftest path, consideration should be given to the role of private insurers, which have benefited economically from the widespread deferment and forgoing of elective care. Voluntary or mandatory investments by insurers in helping hospitals survive the pandemic and weather the new normal are consonant with insurers’ commitment to providing their members access to high-quality healthcare.
The 200-page National Strategy document released by the Biden administration on January 21, 2021, promises some important assistance to hospitals.7 It includes plans to accelerate the production of PPE and other essential supplies using the Defense Production Act and other federal authorities, to rationalize nationwide distribution of these supplies and take steps to prevent price gouging, and to deploy federal personnel and assets to help surge critical-care personnel.
These steps, if fully funded and implemented, would bring welcome respite from some of the most vexing problems hospitals have encountered during COVID-19 surges. Yet, plans for direct financial relief for hospitals are strikingly absent from the National Strategy. Nor does the recently passed $1.9 trillion federal stimulus package provide dedicated funds for hospitals, though some funds earmarked for vaccine delivery may land at hospitals. These are consequential omissions in otherwise comprehensive, thoughtful pandemic response plans.
Future legislation should include an immediate revenue infusion to reimburse hospitals’ COVID-19 preparations and lost volume and a firm commitment of ongoing financial support for preparedness through the end of the pandemic at a level sufficient to offset COVID-19–related losses. Experience with the CARES Act also suggests specific lessons for statutory design: support for hospitals should be allocated based on actual COVID-19–related burden for preparation and care, unlike CARES Act grants that were allocated based on hospitals’ past revenue and Medicare billing. This resulted in some large payments to relatively well-off hospitals and scant support for others (eg, rural or safety-net hospitals) with substantial COVID-19–related losses, a misstep that should not be repeated.
Hospitals are an integral part of the nation’s public health system. In the context of a pandemic, they should not be forced to serve as a backstop for shortcomings in other parts of the system without assistance. They, and their mission during the pandemic, are too important to fail.
1. Khullar D, Bond AM, Schpero WL. COVID-19 and the financial health of US hospitals. JAMA. 2020;323(21):2127-2128. https://doi.org/10.1001/jama.2020.6269
2. Coleman-Lochner L. Hospitals plead for bailout in face of runaway pandemic bills. February 26, 2021. Accessed March 25, 2021. https://www.bloomberg.com/news/articles/2021-02-26/hospitals-plead-for-bailout-in-face-of-runaway-pandemic-bills
3. American Hospital Association. Hospitals and health systems continue to face unprecedented financial challenges due to COVID-19. June 2020. Accessed February 5. 2021. https://www.aha.org/system/files/media/file/2020/06/aha-covid19-financial-impact-report.pdf
4. Birkmeyer JD, Barnato A, Birkmeyer N, Bessler R, Skinner J. The impact of the COVID-19 pandemic on hospital admissions in the United States. Health Aff (Millwood). 2020;39(11):2010-2017. https://doi.org/10.1377/hlthaff.2020.00980
5. Teasdale B, Schulman KA. Are U.S. hospitals still “recession-proof”? N Engl J Med. 2020;383(13):e82. https://doi.org/10.1056/NEJMp2018846
6. Meredith JW, High KP, Freischlag JA. Preserving elective surgeries in the COVID-19 pandemic and the future. JAMA. 2020;324(17):1725-1726. https://doi.org/10.1001/jama.2020.19594
7. Biden JR. National strategy for the COVID-19 response and pandemic preparedness. Bloomberg. January 2021. Accessed February 8, 2021. https://www.whitehouse.gov/wp-content/uploads/2021/01/National-Strategy-for-the-COVID-19-Response-and-Pandemic-Preparedness.pdf
The COVID-19 pandemic has put an extraordinary strain on US hospitals.1 In spring 2020, many hospitals had to quickly adapt to treat a surge of patients, and many more had to prepare for a potential surge. Creating reserve capacity meant halting outpatient care and elective surgeries, repurposing inpatient units, and increasing critical care staffing. Hospitals again face these difficult decisions, as COVID-19 resurges and variants of SARS-CoV-2 increasingly circulate, with large financial losses projected for 2021.2 Some large hospital systems may have the financial reserves to weather this storm, but the precarious situation facing others likely requires policy action.
Hospitals’ financial stress emanates from multiple quarters. First, revenue from elective inpatient procedures and outpatient care dropped dramatically, has not fully rebounded,3,4 and is not fully offset by revenue from COVID-19 care. Second, high unemployment may force up to 20% of commercially insured Americans into lower-reimbursing public insurance or the ranks of the uninsured, generating a projected $95 billion annual loss for hospitals.5 Third, under the current payment system, the costs of preparing for a pandemic are not directly reimbursed. Yet—whether or not they ultimately experienced a large COVID-19 caseload—hospitals’ surge preparation has involved purchasing vast quantities of protective personal equipment (PPE) and other supplies and equipment, hiring additional staff, building SARS-CoV-2 testing capacity, and expanding occupational health services. Many expenses persist as “the new normal”: admissions now require SARS-CoV-2 testing, additional staff and PPE, and often, a private room. Physical distancing requirements mean hospitals’ capacity—and thus, revenue—will remain reduced.
Private insurers, by and large, are not volunteering to cover these increased costs, and it is difficult for hospitals to pass them along. Payment terms in many contracts (eg, for Medicare) are not modifiable; even where they are, renegotiating takes time. To date, federal relief payments from the CARES Act do not fully reimburse COVID-19 losses—a particular problem for smaller and safety-net hospitals without large reserves.
This situation raises ethical concerns. For example, it is ethically relevant that COVID-19 resurgence and hospitalizations are linked to states’ decisions to reopen quickly to ease economic burdens on businesses and workers. One result has been to shift some of the pandemic’s economic burden to the healthcare sector. From a fairness perspective, there should be limits on the losses hospitals are forced to shoulder to maintain COVID-19 preparedness and services. Even if hospitals have reserves, spending them threatens funding for other essential activities, such as capital investment.
The current situation is also fraught with perverse incentives that could jeopardize safe care. With elective care remaining at risk of being reduced,6 pressure intensifies to deliver as many services as possible as quickly as possible, which may not align with patients’ best interests. Across hospitals that need to maximize volume to survive, a push to keep elective services open may emerge, even as COVID-19 prevalence may favor a shutdown. Hospitals with a heavy COVID-19 caseload may have greater difficulty reopening than competitors with lower caseloads, potentially impacting quality if patients seek elective care at lower-volume centers or in ways that disrupt continuity of care.
Ethical dilemmas are also raised by the delicate balancing of interests that hospitals have been engaging in among patient groups. How should they balance the needs of COVID-19 patients against potential harms to others who must delay care?
It is wrong to ask hospitals to make such choices when policy solutions are available. With the resurgence of COVID-19 must come a fresh, sustained program of federal financial relief for hospitals. While direct government support is the swiftest path, consideration should be given to the role of private insurers, which have benefited economically from the widespread deferment and forgoing of elective care. Voluntary or mandatory investments by insurers in helping hospitals survive the pandemic and weather the new normal are consonant with insurers’ commitment to providing their members access to high-quality healthcare.
The 200-page National Strategy document released by the Biden administration on January 21, 2021, promises some important assistance to hospitals.7 It includes plans to accelerate the production of PPE and other essential supplies using the Defense Production Act and other federal authorities, to rationalize nationwide distribution of these supplies and take steps to prevent price gouging, and to deploy federal personnel and assets to help surge critical-care personnel.
These steps, if fully funded and implemented, would bring welcome respite from some of the most vexing problems hospitals have encountered during COVID-19 surges. Yet, plans for direct financial relief for hospitals are strikingly absent from the National Strategy. Nor does the recently passed $1.9 trillion federal stimulus package provide dedicated funds for hospitals, though some funds earmarked for vaccine delivery may land at hospitals. These are consequential omissions in otherwise comprehensive, thoughtful pandemic response plans.
Future legislation should include an immediate revenue infusion to reimburse hospitals’ COVID-19 preparations and lost volume and a firm commitment of ongoing financial support for preparedness through the end of the pandemic at a level sufficient to offset COVID-19–related losses. Experience with the CARES Act also suggests specific lessons for statutory design: support for hospitals should be allocated based on actual COVID-19–related burden for preparation and care, unlike CARES Act grants that were allocated based on hospitals’ past revenue and Medicare billing. This resulted in some large payments to relatively well-off hospitals and scant support for others (eg, rural or safety-net hospitals) with substantial COVID-19–related losses, a misstep that should not be repeated.
Hospitals are an integral part of the nation’s public health system. In the context of a pandemic, they should not be forced to serve as a backstop for shortcomings in other parts of the system without assistance. They, and their mission during the pandemic, are too important to fail.
1. Khullar D, Bond AM, Schpero WL. COVID-19 and the financial health of US hospitals. JAMA. 2020;323(21):2127-2128. https://doi.org/10.1001/jama.2020.6269
2. Coleman-Lochner L. Hospitals plead for bailout in face of runaway pandemic bills. February 26, 2021. Accessed March 25, 2021. https://www.bloomberg.com/news/articles/2021-02-26/hospitals-plead-for-bailout-in-face-of-runaway-pandemic-bills
3. American Hospital Association. Hospitals and health systems continue to face unprecedented financial challenges due to COVID-19. June 2020. Accessed February 5. 2021. https://www.aha.org/system/files/media/file/2020/06/aha-covid19-financial-impact-report.pdf
4. Birkmeyer JD, Barnato A, Birkmeyer N, Bessler R, Skinner J. The impact of the COVID-19 pandemic on hospital admissions in the United States. Health Aff (Millwood). 2020;39(11):2010-2017. https://doi.org/10.1377/hlthaff.2020.00980
5. Teasdale B, Schulman KA. Are U.S. hospitals still “recession-proof”? N Engl J Med. 2020;383(13):e82. https://doi.org/10.1056/NEJMp2018846
6. Meredith JW, High KP, Freischlag JA. Preserving elective surgeries in the COVID-19 pandemic and the future. JAMA. 2020;324(17):1725-1726. https://doi.org/10.1001/jama.2020.19594
7. Biden JR. National strategy for the COVID-19 response and pandemic preparedness. Bloomberg. January 2021. Accessed February 8, 2021. https://www.whitehouse.gov/wp-content/uploads/2021/01/National-Strategy-for-the-COVID-19-Response-and-Pandemic-Preparedness.pdf
© 2021 Society of Hospital Medicine
The Need for Standardized Metrics to Drive Decision-making During the COVID-19 Pandemic
The rapid onset of the novel coronavirus disease 2019 (COVID-19) pandemic forced the US healthcare system to scramble to prepare for a health crisis with many unknowns. Early on, it was unclear exactly how the virus was transmitted, how many people would fall ill or how ill they would get, what treatments would be most efficacious, and what resources were needed to care for patients.1 Given the short window the healthcare system had to prepare, many initial and important decisions were made quickly and often at a local level, with limited coordination and standardization across localities and organizations. These decisions included what services could be offered, how best to allocate potentially scarce resources (such as personal protective equipment and ventilators), and how much surge capacity to build.2,3 In short, many of the early decisions about the pandemic were understandably varied, and the lack of standardized metrics to help guide decision-making did not help the situation.
CHALLENGES WITH MANAGING THE PANDEMIC WITHOUT STANDARDIZED METRICS
Unfortunately, as the COVID-19 pandemic continues, there has been insufficient movement toward standardizing definitions for many key measures needed to manage the public health response. Even small differences in definitions can have important implications for decision-making.4 For example, public health officials have recommended communities achieve a positivity rate of 5% or lower for 14 straight days before easing virus-related restrictions.5 In Maryland, two different entities are calculating positivity rates for the state using different methodologies and producing different results, which can have significant public health and economic implications for the state. Johns Hopkins University’s Resource Center calculates the positivity rate by comparing the number of people who tested positive for severe acute respiratory syndrome coronavirus 2 (SARS-CoV-2) to all people who were tested. This method consistently produces a positivity rate for Maryland above the 5% threshold. In contrast, the state of Maryland calculates the positivity rate by comparing the number of positive tests for SARS-CoV-2 to the number of tests conducted, even if the same person had multiple tests (unless the tests are performed the same day at the same location). This method consistently produces a positivity rate for Maryland below the 5% threshold.6
THE POLITICIZATION OF THE DATA
The lack of standardized definitions leads not only to debate and confusion over what steps to take next, but also opens the door to politicization of pandemic data. This is readily apparent when considering mortality due to COVID-19. For example, different states use different definitions for COVID-19 mortality. Alabama defines COVID-19 mortality by only including patients who tested positive for the SARS-CoV-2 virus and the cause of death was attributed to COVID-19. In contrast, Colorado’s COVID-19 mortality definition includes those patients who are believed to have died of COVID-19, but does not require confirmation of SARS-CoV-2 infection by a positive test.7 Further compounding the challenge, some politicians reference the COVID-19 mortality rate as a comparison of those who died from COVID-19 with those who were sick with COVID-19, reflecting the success rate of treating patients with COVID-19, an area in which the United States has done relatively well compared with other countries. This definition of the mortality rate suits a narrative of successful pandemic management.8 However, many public health officials suggest the COVID-19 mortality rate should be defined by comparing the number of deaths from COVID-19 as a percentage of the population, which reflects the percentage of the population dying from the disease. In this regard, the United States has not done as well relative to other countries.9 These different definitions highlight how the United States lacks a standardized way to compare its performance across states and with other countries, even on a straightforward measure like mortality.
CURRENT METRICS THAT NEED STANDARDIZATION
The lack of clarity on, and politicization of, pandemic data demonstrate the need to take stock of what metrics require standardization to help public health officials and health system leaders manage the pandemic response moving forward. The Table provides examples of currently used metrics that would benefit from better standardization to inform decision-making across a broad range of settings, including public health, hospitals, physician clinics, and nursing homes. For example, a commonly referenced metric during the pandemic has been a moving average of the incidence rate of positive COVID-19 cases in a defined geographic area (eg, a state).10,11 This data point is helpful to healthcare delivery organizations for understanding the change in COVID-19 cases in their cities and states, which can inform planning on whether or not to continue elective surgeries or how many beds need to be kept in reserve status for a potential surge of hospitalizations. But there has not been a consensus around whether the reporting of COVID-19 positive tests should reflect the day the test was performed or the day the test results were available. The day the test results were available can be influenced by lengthy or uneven turnaround times for the results (eg, backlogs in labs) and can paint a false picture of trends with the virus.
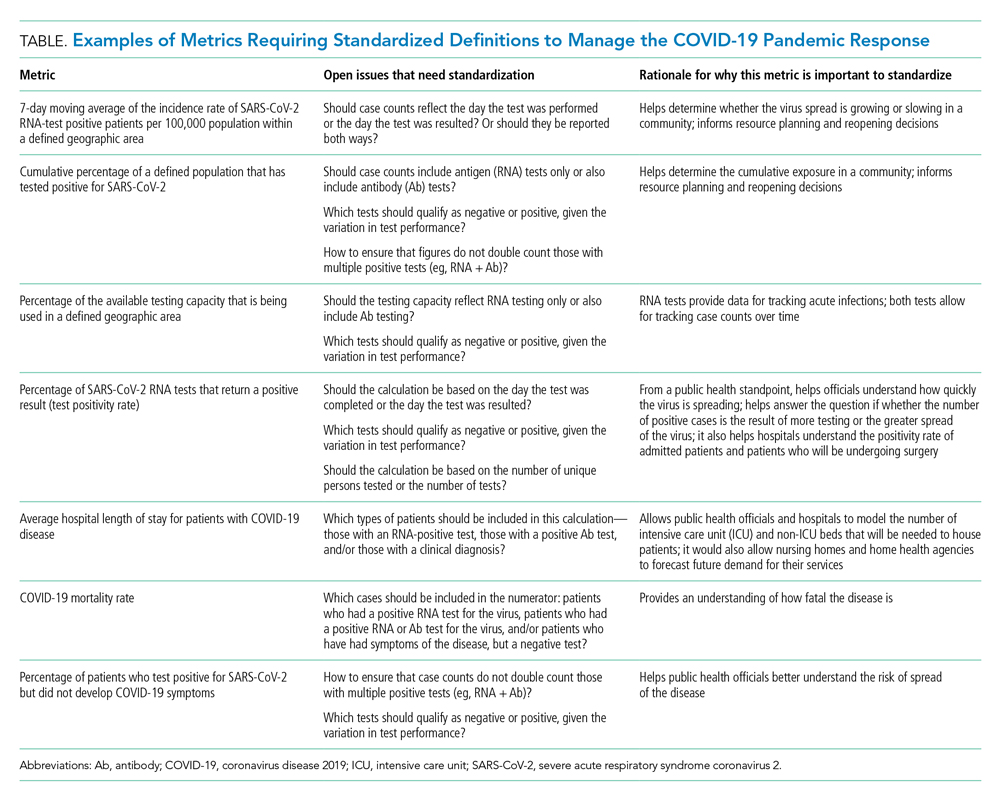
As another example, knowing the percentage of the population that has tested positive for COVID-19 can help inform both resource planning and reopening decisions. But there has been variation in whether counts of positive COVID-19 tests should only include antigen tests, or antibody tests as well. This exact question played out when the Centers for Disease Control and Prevention (CDC) made decisions that differed from those of many states about whether to include antibody tests in their publicly announced COVID-19 testing numbers,12 perhaps undermining public confidence in the reported data.
MOVING FORWARD WITH STANDARDIZING DEFINITIONS
To capture currently unstandardized metrics with broad applicability, the United States should form a consensus task force to identify and define metrics and, over time, refine them based on current science and public health priorities. The task force would require a mix of individuals with various skill sets, such as expertise in infectious diseases and epidemiology, healthcare operations, statistics, performance measurement, and public health. The US Department of Health and Human Services is likely the appropriate sponsor, with representation from the National Institutes of Health, the CDC, and the Agency for Healthcare Research and Quality, in partnership with national provider and public health group representatives.
Once standardized definitions for metrics have been agreed upon, the metric definitions will need to be made readily available to the public and healthcare organizations. Standardization will permit collection of electronic health records for quick calculation and review, with an output of dashboards for reporting. It would also prevent every public health and healthcare delivery organization from having to define its own metrics, freeing them up to focus on planning. Several metrics already have standard definitions, and those metrics have proven useful for decision-making. For example, there is agreement that the turnaround time for a SARS-CoV-2 test is measured by the difference in time between when the test was performed and when the test results were available. This standard definition allows for performance comparisons across different laboratories within the same service area and comparisons across different regions of the country. Once the metrics are standardized, public health leaders and healthcare organizations can use variation in performance and outcomes to identify leading indicators for planning.
CONCLUSION
Amid the COVID-19 pandemic, the US healthcare system finds itself in a state of managing uncertainty for a prolonged period of time. The unprecedented nature of this crisis means that best practices will not always be clear. Providing access to clearly defined, standardized metrics will be essential to public health officials and healthcare organization leaders’ ability to manage through this pandemic. The risk of not moving in this direction means forcing leaders to make decisions without the best information available. Good data will be essential to guiding the US healthcare system through this extraordinary crisis.
- Weston S, Frieman MB. COVID-19: knowns, unknowns, and questions. mSphere. 2020;5(2):e00203-20. https://doi.org/10.1128/mSphere.00203-20
- Griffin KM, Karas MG, Ivascu NS, Lief L. Hospital preparedness for COVID-19: a practical guide from a critical care perspective. Am J Respir Crit Care Med. 2020;201(11):1337-1344. https://doi.org/10.1164/rccm.202004-1037CP
- De Georgeo MR, De Georgeo JM, Egan TM, et al. Containing SARS-CoV-2 in hospitals facing finite PPE, limited testing, and physical space variability: navigating resource constrained enhanced traffic control bundling. J Microbiol Immunol. 2020;S1684-1182(20)30166-3. https://doi.org/10.1016/j.jmii.2020.07.009
- Fischhoff B. Making decisions in a COVID-19 world. JAMA. 2020;324(2):139-140. https://doi.org/10.1001/jama.2020.10178
- Collins K. Is your state doing enough coronavirus testing? New York Times. October 14, 2020. Updated October 29, 2020. Accessed October 14, 2020. https://www.nytimes.com/interactive/2020/us/coronavirus-testing.html
- Ruiz N. Why is Maryland’s coronavirus positivity rate always lower than what Johns Hopkins says it is — and does it matter? Baltimore Sun. September 10, 2020. Accessed October 14, 2020. https://www.baltimoresun.com/coronavirus/bs-md-maryland-coronavirus-positivity-rate-hopkins-20200817-zoepxdjlxbazdm6kabrjehbemq-story.html
- Brown E, Reinhard B, Thebault R. Which deaths count toward the covid-19 death toll? It depends on the state. Washington Post. April 16, 2020. Accessed July 23, 2020. https://www.washingtonpost.com/investigations/which-deaths-count-toward-the-covid-19-death-toll-it-depends-on-the-state/2020/04/16/bca84ae0-7991-11ea-a130-df573469f094_story.html
- Carlisle M. Here’s what Trump got wrong about America’s COVID-19 death rate. Time. August 4, 2020. Accessed October 14, 2020. https://time.com/5875411/trump-covid-19-death-rate-interview/
- Mortality analyses. Johns Hopkins University & Medicine Coronavirus Resource Center. October 14, 2020. Updated October 29, 2020. Accessed October 14, 2020. https://coronavirus.jhu.edu/data/mortality
- COVID-19 daily case incidence rate maps. Kentucky Cabinet for Health and Family Services. Accessed October 14, 2020. https://chfs.ky.gov/Pages/cv19maps.aspx
- COVID-19 trajectory animations. Pennsylvania Department of Health. Accessed October 14, 2020. https://www.health.pa.gov/topics/disease/coronavirus/Pages/Data-Animations.aspx
- Stolberg SG, Kaplan S, Mervosh S. CDC test counting error leaves epidemiologists ‘really baffled.’ New York Times. May 22, 2020. Updated June 3, 2020. Accessed July 23, 2020. https://www.nytimes.com/2020/05/22/us/politics/coronavirus-tests-cdc.html
The rapid onset of the novel coronavirus disease 2019 (COVID-19) pandemic forced the US healthcare system to scramble to prepare for a health crisis with many unknowns. Early on, it was unclear exactly how the virus was transmitted, how many people would fall ill or how ill they would get, what treatments would be most efficacious, and what resources were needed to care for patients.1 Given the short window the healthcare system had to prepare, many initial and important decisions were made quickly and often at a local level, with limited coordination and standardization across localities and organizations. These decisions included what services could be offered, how best to allocate potentially scarce resources (such as personal protective equipment and ventilators), and how much surge capacity to build.2,3 In short, many of the early decisions about the pandemic were understandably varied, and the lack of standardized metrics to help guide decision-making did not help the situation.
CHALLENGES WITH MANAGING THE PANDEMIC WITHOUT STANDARDIZED METRICS
Unfortunately, as the COVID-19 pandemic continues, there has been insufficient movement toward standardizing definitions for many key measures needed to manage the public health response. Even small differences in definitions can have important implications for decision-making.4 For example, public health officials have recommended communities achieve a positivity rate of 5% or lower for 14 straight days before easing virus-related restrictions.5 In Maryland, two different entities are calculating positivity rates for the state using different methodologies and producing different results, which can have significant public health and economic implications for the state. Johns Hopkins University’s Resource Center calculates the positivity rate by comparing the number of people who tested positive for severe acute respiratory syndrome coronavirus 2 (SARS-CoV-2) to all people who were tested. This method consistently produces a positivity rate for Maryland above the 5% threshold. In contrast, the state of Maryland calculates the positivity rate by comparing the number of positive tests for SARS-CoV-2 to the number of tests conducted, even if the same person had multiple tests (unless the tests are performed the same day at the same location). This method consistently produces a positivity rate for Maryland below the 5% threshold.6
THE POLITICIZATION OF THE DATA
The lack of standardized definitions leads not only to debate and confusion over what steps to take next, but also opens the door to politicization of pandemic data. This is readily apparent when considering mortality due to COVID-19. For example, different states use different definitions for COVID-19 mortality. Alabama defines COVID-19 mortality by only including patients who tested positive for the SARS-CoV-2 virus and the cause of death was attributed to COVID-19. In contrast, Colorado’s COVID-19 mortality definition includes those patients who are believed to have died of COVID-19, but does not require confirmation of SARS-CoV-2 infection by a positive test.7 Further compounding the challenge, some politicians reference the COVID-19 mortality rate as a comparison of those who died from COVID-19 with those who were sick with COVID-19, reflecting the success rate of treating patients with COVID-19, an area in which the United States has done relatively well compared with other countries. This definition of the mortality rate suits a narrative of successful pandemic management.8 However, many public health officials suggest the COVID-19 mortality rate should be defined by comparing the number of deaths from COVID-19 as a percentage of the population, which reflects the percentage of the population dying from the disease. In this regard, the United States has not done as well relative to other countries.9 These different definitions highlight how the United States lacks a standardized way to compare its performance across states and with other countries, even on a straightforward measure like mortality.
CURRENT METRICS THAT NEED STANDARDIZATION
The lack of clarity on, and politicization of, pandemic data demonstrate the need to take stock of what metrics require standardization to help public health officials and health system leaders manage the pandemic response moving forward. The Table provides examples of currently used metrics that would benefit from better standardization to inform decision-making across a broad range of settings, including public health, hospitals, physician clinics, and nursing homes. For example, a commonly referenced metric during the pandemic has been a moving average of the incidence rate of positive COVID-19 cases in a defined geographic area (eg, a state).10,11 This data point is helpful to healthcare delivery organizations for understanding the change in COVID-19 cases in their cities and states, which can inform planning on whether or not to continue elective surgeries or how many beds need to be kept in reserve status for a potential surge of hospitalizations. But there has not been a consensus around whether the reporting of COVID-19 positive tests should reflect the day the test was performed or the day the test results were available. The day the test results were available can be influenced by lengthy or uneven turnaround times for the results (eg, backlogs in labs) and can paint a false picture of trends with the virus.
As another example, knowing the percentage of the population that has tested positive for COVID-19 can help inform both resource planning and reopening decisions. But there has been variation in whether counts of positive COVID-19 tests should only include antigen tests, or antibody tests as well. This exact question played out when the Centers for Disease Control and Prevention (CDC) made decisions that differed from those of many states about whether to include antibody tests in their publicly announced COVID-19 testing numbers,12 perhaps undermining public confidence in the reported data.
MOVING FORWARD WITH STANDARDIZING DEFINITIONS
To capture currently unstandardized metrics with broad applicability, the United States should form a consensus task force to identify and define metrics and, over time, refine them based on current science and public health priorities. The task force would require a mix of individuals with various skill sets, such as expertise in infectious diseases and epidemiology, healthcare operations, statistics, performance measurement, and public health. The US Department of Health and Human Services is likely the appropriate sponsor, with representation from the National Institutes of Health, the CDC, and the Agency for Healthcare Research and Quality, in partnership with national provider and public health group representatives.
Once standardized definitions for metrics have been agreed upon, the metric definitions will need to be made readily available to the public and healthcare organizations. Standardization will permit collection of electronic health records for quick calculation and review, with an output of dashboards for reporting. It would also prevent every public health and healthcare delivery organization from having to define its own metrics, freeing them up to focus on planning. Several metrics already have standard definitions, and those metrics have proven useful for decision-making. For example, there is agreement that the turnaround time for a SARS-CoV-2 test is measured by the difference in time between when the test was performed and when the test results were available. This standard definition allows for performance comparisons across different laboratories within the same service area and comparisons across different regions of the country. Once the metrics are standardized, public health leaders and healthcare organizations can use variation in performance and outcomes to identify leading indicators for planning.
CONCLUSION
Amid the COVID-19 pandemic, the US healthcare system finds itself in a state of managing uncertainty for a prolonged period of time. The unprecedented nature of this crisis means that best practices will not always be clear. Providing access to clearly defined, standardized metrics will be essential to public health officials and healthcare organization leaders’ ability to manage through this pandemic. The risk of not moving in this direction means forcing leaders to make decisions without the best information available. Good data will be essential to guiding the US healthcare system through this extraordinary crisis.
- Weston S, Frieman MB. COVID-19: knowns, unknowns, and questions. mSphere. 2020;5(2):e00203-20. https://doi.org/10.1128/mSphere.00203-20
- Griffin KM, Karas MG, Ivascu NS, Lief L. Hospital preparedness for COVID-19: a practical guide from a critical care perspective. Am J Respir Crit Care Med. 2020;201(11):1337-1344. https://doi.org/10.1164/rccm.202004-1037CP
- De Georgeo MR, De Georgeo JM, Egan TM, et al. Containing SARS-CoV-2 in hospitals facing finite PPE, limited testing, and physical space variability: navigating resource constrained enhanced traffic control bundling. J Microbiol Immunol. 2020;S1684-1182(20)30166-3. https://doi.org/10.1016/j.jmii.2020.07.009
- Fischhoff B. Making decisions in a COVID-19 world. JAMA. 2020;324(2):139-140. https://doi.org/10.1001/jama.2020.10178
- Collins K. Is your state doing enough coronavirus testing? New York Times. October 14, 2020. Updated October 29, 2020. Accessed October 14, 2020. https://www.nytimes.com/interactive/2020/us/coronavirus-testing.html
- Ruiz N. Why is Maryland’s coronavirus positivity rate always lower than what Johns Hopkins says it is — and does it matter? Baltimore Sun. September 10, 2020. Accessed October 14, 2020. https://www.baltimoresun.com/coronavirus/bs-md-maryland-coronavirus-positivity-rate-hopkins-20200817-zoepxdjlxbazdm6kabrjehbemq-story.html
- Brown E, Reinhard B, Thebault R. Which deaths count toward the covid-19 death toll? It depends on the state. Washington Post. April 16, 2020. Accessed July 23, 2020. https://www.washingtonpost.com/investigations/which-deaths-count-toward-the-covid-19-death-toll-it-depends-on-the-state/2020/04/16/bca84ae0-7991-11ea-a130-df573469f094_story.html
- Carlisle M. Here’s what Trump got wrong about America’s COVID-19 death rate. Time. August 4, 2020. Accessed October 14, 2020. https://time.com/5875411/trump-covid-19-death-rate-interview/
- Mortality analyses. Johns Hopkins University & Medicine Coronavirus Resource Center. October 14, 2020. Updated October 29, 2020. Accessed October 14, 2020. https://coronavirus.jhu.edu/data/mortality
- COVID-19 daily case incidence rate maps. Kentucky Cabinet for Health and Family Services. Accessed October 14, 2020. https://chfs.ky.gov/Pages/cv19maps.aspx
- COVID-19 trajectory animations. Pennsylvania Department of Health. Accessed October 14, 2020. https://www.health.pa.gov/topics/disease/coronavirus/Pages/Data-Animations.aspx
- Stolberg SG, Kaplan S, Mervosh S. CDC test counting error leaves epidemiologists ‘really baffled.’ New York Times. May 22, 2020. Updated June 3, 2020. Accessed July 23, 2020. https://www.nytimes.com/2020/05/22/us/politics/coronavirus-tests-cdc.html
© 2021 Society of Hospital Medicine
Email: jmaustin@jhmi.edu; Telephone: 832-816-5618; Twitter: @JMatthewAustin.
Perception of Resources Spent on Defensive Medicine and History of Being Sued Among Hospitalists: Results from a National Survey
Annual healthcare costs in the United States are over $3 trillion and are garnering significant national attention.1 The United States spends approximately 2.5 times more per capita on healthcare when compared to other developed nations.2 One source of unnecessary cost in healthcare is defensive medicine. Defensive medicine has been defined by Congress as occurring “when doctors order tests, procedures, or visits, or avoid certain high-risk patients or procedures, primarily (but not necessarily) because of concern about malpractice liability.”3
Though difficult to assess, in 1 study, defensive medicine was estimated to cost $45 billion annually.4 While general agreement exists that physicians practice defensive medicine, the extent of defensive practices and the subsequent impact on healthcare costs remain unclear. This is especially true for a group of clinicians that is rapidly increasing in number: hospitalists. Currently, there are more than 50,000 hospitalists in the United States,5 yet the prevalence of defensive medicine in this relatively new specialty is unknown. Inpatient care is complex and time constraints can impede establishing an optimal therapeutic relationship with the patient, potentially raising liability fears. We therefore sought to quantify hospitalist physician estimates of the cost of defensive medicine and assess correlates of their estimates. As being sued might spur defensive behaviors, we also assessed how many hospitalists reported being sued and whether this was associated with their estimates of defensive medicine.
METHODS
Survey Questionnaire
In a previously published survey-based analysis, we reported on physician practice and overuse for 2 common scenarios in hospital medicine: preoperative evaluation and management of uncomplicated syncope.6 After responding to the vignettes, each physician was asked to provide demographic and employment information and malpractice history. In addition, they were asked the following: In your best estimation, what percentage of healthcare-related resources (eg, hospital admissions, diagnostic testing, treatment) are spent purely because of defensive medicine concerns? __________% resources
Survey Sample & Administration
The survey was sent to a sample of 1753 hospitalists, randomly identified through the Society of Hospital Medicine’s (SHM) database of members and annual meeting attendees. It is estimated that almost 30% of practicing hospitalists in the United States are members of the SHM.5 A full description of the sampling methodology was previously published.6 Selected hospitalists were mailed surveys, a $20 financial incentive, and subsequent reminders between June and October 2011.
The study was exempted from institutional review board review by the University of Michigan and the VA Ann Arbor Healthcare System.
Variables
The primary outcome of interest was the response to the “% resources” estimated to be spent on defensive medicine. This was analyzed as a continuous variable. Independent variables included the following: VA employment, malpractice insurance payer, employer, history of malpractice lawsuit, sex, race, and years practicing as a physician.
Statistical Analysis
Analyses were conducted using SAS, version 9.4 (SAS Institute). Descriptive statistics were first calculated for all variables. Next, bivariable comparisons between the outcome variables and other variables of interest were performed. Multivariable comparisons were made using linear regression for the outcome of estimated resources spent on defensive medicine. A P value of < 0.05 was considered statistically significant.
RESULTS
Of the 1753 surveys mailed, 253 were excluded due to incorrect addresses or because the recipients were not practicing hospitalists. A total of 1020 were completed and returned, yielding a 68% response rate (1020 out of 1500 eligible). The hospitalist respondents were in practice for an average of 11 years (range 1-40 years). Respondents represented all 50 states and had a diverse background of experience and demographic characteristics, which has been previously described.6
Resources Estimated Spent on Defensive Medicine

Hospitalists reported, on average, that they believed defensive medicine accounted for 37.5% (standard deviation, 20.2%) of all healthcare spending. Results from the multivariable regression are presented in the Table. Hospitalists affiliated with a VA hospital reported 5.5% less in resources spent on defensive medicine than those not affiliated with a VA hospital (32.2% VA vs 37.7% non-VA, P = 0.025). For every 10 years in practice, the estimate of resources spent on defensive medicine decreased by 3% (P = 0.003). Those who were male (36.4% male vs 39.4% female, P = 0.023) and non-Hispanic white (32.5% non-Hispanic white vs 44.7% other, P ≤ 0.001) also estimated less resources spent on defensive medicine. We did not find an association between a hospitalist reporting being sued and their perception of resources spent on defensive medicine.
Risk of Being Sued

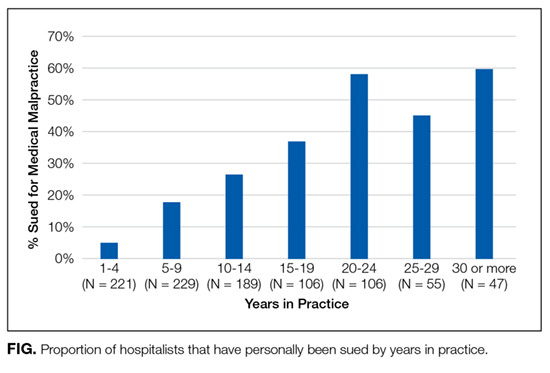
Over a quarter of our sample (25.6%) reported having been sued at least once for medical malpractice. The proportion of hospitalists that reported a history of being sued generally increased with more years of practice (Figure). For those who had been in practice for at least 20 years, more than half (55%) had been sued at least once during their career.
DISCUSSION
In a national survey, hospitalists estimated that almost 40% of all healthcare-related resources are spent purely because of defensive medicine concerns. This estimate was affected by personal demographic and employment factors. Our second major finding is that over one-quarter of a large random sample of hospitalist physicians reported being sued for malpractice.
Hospitalist perceptions of defensive medicine varied significantly based on employment at a VA hospital, with VA-affiliated hospitalists reporting less estimated spending on defensive medicine. This effect may reflect a less litigious environment within the VA, even though physicians practicing within the VA can be reported to the National Practitioner Data Bank.7 The different environment may be due to the VA’s patient mix (VA patients tend to be poorer, older, sicker, and have more mental illness)8; however, it could also be due to its de facto practice of a form of enterprise liability, in which, by law, the VA assumes responsibility for negligence, sheltering its physicians from direct liability.
We also found that the higher the number of years a hospitalist reported practicing, the lower the perception of resources being spent on defensive medicine. The reason for this finding is unclear. There has been a recent focus on high-value care and overspending, and perhaps younger hospitalists are more aware of these initiatives and thus have higher estimates. Additionally, non-Hispanic white male respondents estimated a lower amount spent on defensive medicine compared with other respondents. This is consistent with previous studies of risk perception which have noted a “white male effect” in which white males generally perceive a wide range of risks to be lower than female and non-white individuals, likely due to sociopolitical factors.9 Here, the white male effect is particularly interesting, considering that male physicians are almost 2.5 times as likely as female physicians to report being sued.10
Similar to prior studies,11 there was no association with personal liability claim experience and perceived resources spent on defensive medicine. It is unclear why personal experience of being sued does not appear to be associated with perceptions of defensive medicine practice. It is possible that the fear of being sued is worse than the actual experience or that physicians believe that lawsuits are either random events or inevitable and, as a result, do not change their practice patterns.
The lifetime risk of being named in a malpractice suit is substantial for hospitalists: in our study, over half of hospitalists in practice for 20 years or more reported they had been sued. This corresponds with the projection made by Jena and colleagues,12 which estimated that 55% of internal medicine physicians will be sued by the age of 45, a number just slightly higher than the average for all physicians.
Our study has important limitations. Our sample was of hospitalists and therefore may not be reflective of other medical specialties. Second, due to the nature of the study design, the responses to spending on defensive medicine may not represent actual practice. Third, we did not confirm details such as place of employment or history of lawsuit, and this may be subject to recall bias. However, physicians are unlikely to forget having been sued. Finally, this survey is observational and cross-sectional. Our data imply association rather than causation. Without longitudinal data, it is impossible to know if years of practice correlate with perceived defensive medicine spending due to a generational effect or a longitudinal effect (such as more confidence in diagnostic skills with more years of practice).
Despite these limitations, our survey has important policy implications. First, we found that defensive medicine is perceived by hospitalists to be costly. Although physicians likely overestimated the cost (37.5%, or an estimated $1 trillion is far higher than previous estimates of approximately 2% of all healthcare spending),4 it also demonstrates the extent to which physicians feel as though the medical care that is provided may be unnecessary. Second, at least a quarter of hospitalist physicians have been sued, and the risk of being named as a defendant in a lawsuit increases the longer they have been in clinical practice.
Given these findings, policies aimed to reduce the practice of defensive medicine may help the rising costs of healthcare. Reducing defensive medicine requires decreasing physician fears of liability and related reporting. Traditional tort reforms (with the exception of damage caps) have not been proven to do this. And damage caps can be inequitable, hard to pass, and even found to be unconstitutional in some states.13 However, other reform options hold promise in reducing liability fears, including enterprise liability, safe harbor legislation, and health courts.13 Finally, shared decision-making models may also provide a method to reduce defensive fears as well.6
Acknowledgments
The authors thank the Society of Hospital Medicine, Dr. Scott Flanders, Andrew Hickner, and David Ratz for their assistance with this project.
Disclosure
The authors received financial support from the Blue Cross Blue Shield of Michigan Foundation, the Department of Veterans Affairs Health Services Research and Development Center for Clinical Management Research, the University of Michigan Specialist-Hospitalist Allied Research Program, and the Ann Arbor University of Michigan VA Patient Safety Enhancement Program.
Disclaimer
The views expressed in this article are those of the authors and do not necessarily reflect the position or policy of Blue Cross Blue Shield of Michigan Foundation, the Department of Veterans Affairs, or the Society of Hospital Medicine.
1. Centers for Medicare & Medicaid Services. National Health Expenditures 2014 Highlights. 2015; https://www.cms.gov/Research-Statistics-Data-and-Systems/Statistics-Trends-and-Reports/NationalHealthExpendData/NationalHealthAccountsHistorical.html. Accessed on July 28, 2016.
2. OECD. Health expenditure per capita. Health at a Glance 2015. Paris: OECD Publishing; 2015.
3. U.S. Congress, Office of Technology Assessment. Defensive Medicine and Medical Malpractice. Washington, DC: U.S. Government Printing Office; July 1994. OTA-H-602.
4. Mello MM, Chandra A, Gawande AA, Studdert DM. National costs of the medical liability system. Health Aff (Millwood). 2010;29(9):1569-1577. PubMed
5. Society of Hospital Medicine. Society of Hospital Medicine: Membership. 2017; http://www.hospitalmedicine.org/Web/Membership/Web/Membership/Membership_Landing_Page.aspx?hkey=97f40c85-fdcd-411f-b3f6-e617bc38a2c5. Accessed on January 5, 2017.
6. Kachalia A, Berg A, Fagerlin A, et al. Overuse of testing in preoperative evaluation and syncope: a survey of hospitalists. Ann Intern Med. 2015;162(2):100-108. PubMed
7. Pugatch MB. Federal tort claims and military medical malpractice. J Legal Nurse Consulting. 2008;19(2):3-6.
8. Eibner C, Krull H, Brown K, et al. Current and projected characteristics and unique health care needs of the patient population served by the Department of Veterans Affairs. Santa Monica, CA: RAND Corporation; 2015. PubMed
9. Finucane ML, Slovic P, Mertz CK, Flynn J, Satterfield TA. Gender, race, and perceived risk: the ‘white male’ effect. Health, Risk & Society. 2000;2(2):159-172.
10. Unwin E, Woolf K, Wadlow C, Potts HW, Dacre J. Sex differences in medico-legal action against doctors: a systematic review and meta-analysis. BMC Med. 2015;13:172. PubMed
11. Glassman PA, Rolph JE, Petersen LP, Bradley MA, Kravitz RL. Physicians’ personal malpractice experiences are not related to defensive clinical practices. J Health Polit Policy Law. 1996;21(2):219-241. PubMed
12. Jena AB, Seabury S, Lakdawalla D, Chandra A. Malpractice risk according to physician specialty. N Engl J Med. 2011;365(7):629-636. PubMed
13. Mello MM, Studdert DM, Kachalia A. The medical liability climate and prospects for reform. JAMA. 2014;312(20):2146-2155. PubMed
Annual healthcare costs in the United States are over $3 trillion and are garnering significant national attention.1 The United States spends approximately 2.5 times more per capita on healthcare when compared to other developed nations.2 One source of unnecessary cost in healthcare is defensive medicine. Defensive medicine has been defined by Congress as occurring “when doctors order tests, procedures, or visits, or avoid certain high-risk patients or procedures, primarily (but not necessarily) because of concern about malpractice liability.”3
Though difficult to assess, in 1 study, defensive medicine was estimated to cost $45 billion annually.4 While general agreement exists that physicians practice defensive medicine, the extent of defensive practices and the subsequent impact on healthcare costs remain unclear. This is especially true for a group of clinicians that is rapidly increasing in number: hospitalists. Currently, there are more than 50,000 hospitalists in the United States,5 yet the prevalence of defensive medicine in this relatively new specialty is unknown. Inpatient care is complex and time constraints can impede establishing an optimal therapeutic relationship with the patient, potentially raising liability fears. We therefore sought to quantify hospitalist physician estimates of the cost of defensive medicine and assess correlates of their estimates. As being sued might spur defensive behaviors, we also assessed how many hospitalists reported being sued and whether this was associated with their estimates of defensive medicine.
METHODS
Survey Questionnaire
In a previously published survey-based analysis, we reported on physician practice and overuse for 2 common scenarios in hospital medicine: preoperative evaluation and management of uncomplicated syncope.6 After responding to the vignettes, each physician was asked to provide demographic and employment information and malpractice history. In addition, they were asked the following: In your best estimation, what percentage of healthcare-related resources (eg, hospital admissions, diagnostic testing, treatment) are spent purely because of defensive medicine concerns? __________% resources
Survey Sample & Administration
The survey was sent to a sample of 1753 hospitalists, randomly identified through the Society of Hospital Medicine’s (SHM) database of members and annual meeting attendees. It is estimated that almost 30% of practicing hospitalists in the United States are members of the SHM.5 A full description of the sampling methodology was previously published.6 Selected hospitalists were mailed surveys, a $20 financial incentive, and subsequent reminders between June and October 2011.
The study was exempted from institutional review board review by the University of Michigan and the VA Ann Arbor Healthcare System.
Variables
The primary outcome of interest was the response to the “% resources” estimated to be spent on defensive medicine. This was analyzed as a continuous variable. Independent variables included the following: VA employment, malpractice insurance payer, employer, history of malpractice lawsuit, sex, race, and years practicing as a physician.
Statistical Analysis
Analyses were conducted using SAS, version 9.4 (SAS Institute). Descriptive statistics were first calculated for all variables. Next, bivariable comparisons between the outcome variables and other variables of interest were performed. Multivariable comparisons were made using linear regression for the outcome of estimated resources spent on defensive medicine. A P value of < 0.05 was considered statistically significant.
RESULTS
Of the 1753 surveys mailed, 253 were excluded due to incorrect addresses or because the recipients were not practicing hospitalists. A total of 1020 were completed and returned, yielding a 68% response rate (1020 out of 1500 eligible). The hospitalist respondents were in practice for an average of 11 years (range 1-40 years). Respondents represented all 50 states and had a diverse background of experience and demographic characteristics, which has been previously described.6
Resources Estimated Spent on Defensive Medicine
Hospitalists reported, on average, that they believed defensive medicine accounted for 37.5% (standard deviation, 20.2%) of all healthcare spending. Results from the multivariable regression are presented in the Table. Hospitalists affiliated with a VA hospital reported 5.5% less in resources spent on defensive medicine than those not affiliated with a VA hospital (32.2% VA vs 37.7% non-VA, P = 0.025). For every 10 years in practice, the estimate of resources spent on defensive medicine decreased by 3% (P = 0.003). Those who were male (36.4% male vs 39.4% female, P = 0.023) and non-Hispanic white (32.5% non-Hispanic white vs 44.7% other, P ≤ 0.001) also estimated less resources spent on defensive medicine. We did not find an association between a hospitalist reporting being sued and their perception of resources spent on defensive medicine.
Risk of Being Sued
Over a quarter of our sample (25.6%) reported having been sued at least once for medical malpractice. The proportion of hospitalists that reported a history of being sued generally increased with more years of practice (Figure). For those who had been in practice for at least 20 years, more than half (55%) had been sued at least once during their career.
DISCUSSION
In a national survey, hospitalists estimated that almost 40% of all healthcare-related resources are spent purely because of defensive medicine concerns. This estimate was affected by personal demographic and employment factors. Our second major finding is that over one-quarter of a large random sample of hospitalist physicians reported being sued for malpractice.
Hospitalist perceptions of defensive medicine varied significantly based on employment at a VA hospital, with VA-affiliated hospitalists reporting less estimated spending on defensive medicine. This effect may reflect a less litigious environment within the VA, even though physicians practicing within the VA can be reported to the National Practitioner Data Bank.7 The different environment may be due to the VA’s patient mix (VA patients tend to be poorer, older, sicker, and have more mental illness)8; however, it could also be due to its de facto practice of a form of enterprise liability, in which, by law, the VA assumes responsibility for negligence, sheltering its physicians from direct liability.
We also found that the higher the number of years a hospitalist reported practicing, the lower the perception of resources being spent on defensive medicine. The reason for this finding is unclear. There has been a recent focus on high-value care and overspending, and perhaps younger hospitalists are more aware of these initiatives and thus have higher estimates. Additionally, non-Hispanic white male respondents estimated a lower amount spent on defensive medicine compared with other respondents. This is consistent with previous studies of risk perception which have noted a “white male effect” in which white males generally perceive a wide range of risks to be lower than female and non-white individuals, likely due to sociopolitical factors.9 Here, the white male effect is particularly interesting, considering that male physicians are almost 2.5 times as likely as female physicians to report being sued.10
Similar to prior studies,11 there was no association with personal liability claim experience and perceived resources spent on defensive medicine. It is unclear why personal experience of being sued does not appear to be associated with perceptions of defensive medicine practice. It is possible that the fear of being sued is worse than the actual experience or that physicians believe that lawsuits are either random events or inevitable and, as a result, do not change their practice patterns.
The lifetime risk of being named in a malpractice suit is substantial for hospitalists: in our study, over half of hospitalists in practice for 20 years or more reported they had been sued. This corresponds with the projection made by Jena and colleagues,12 which estimated that 55% of internal medicine physicians will be sued by the age of 45, a number just slightly higher than the average for all physicians.
Our study has important limitations. Our sample was of hospitalists and therefore may not be reflective of other medical specialties. Second, due to the nature of the study design, the responses to spending on defensive medicine may not represent actual practice. Third, we did not confirm details such as place of employment or history of lawsuit, and this may be subject to recall bias. However, physicians are unlikely to forget having been sued. Finally, this survey is observational and cross-sectional. Our data imply association rather than causation. Without longitudinal data, it is impossible to know if years of practice correlate with perceived defensive medicine spending due to a generational effect or a longitudinal effect (such as more confidence in diagnostic skills with more years of practice).
Despite these limitations, our survey has important policy implications. First, we found that defensive medicine is perceived by hospitalists to be costly. Although physicians likely overestimated the cost (37.5%, or an estimated $1 trillion is far higher than previous estimates of approximately 2% of all healthcare spending),4 it also demonstrates the extent to which physicians feel as though the medical care that is provided may be unnecessary. Second, at least a quarter of hospitalist physicians have been sued, and the risk of being named as a defendant in a lawsuit increases the longer they have been in clinical practice.
Given these findings, policies aimed to reduce the practice of defensive medicine may help the rising costs of healthcare. Reducing defensive medicine requires decreasing physician fears of liability and related reporting. Traditional tort reforms (with the exception of damage caps) have not been proven to do this. And damage caps can be inequitable, hard to pass, and even found to be unconstitutional in some states.13 However, other reform options hold promise in reducing liability fears, including enterprise liability, safe harbor legislation, and health courts.13 Finally, shared decision-making models may also provide a method to reduce defensive fears as well.6
Acknowledgments
The authors thank the Society of Hospital Medicine, Dr. Scott Flanders, Andrew Hickner, and David Ratz for their assistance with this project.
Disclosure
The authors received financial support from the Blue Cross Blue Shield of Michigan Foundation, the Department of Veterans Affairs Health Services Research and Development Center for Clinical Management Research, the University of Michigan Specialist-Hospitalist Allied Research Program, and the Ann Arbor University of Michigan VA Patient Safety Enhancement Program.
Disclaimer
The views expressed in this article are those of the authors and do not necessarily reflect the position or policy of Blue Cross Blue Shield of Michigan Foundation, the Department of Veterans Affairs, or the Society of Hospital Medicine.
1. Centers for Medicare & Medicaid Services. National Health Expenditures 2014 Highlights. 2015; https://www.cms.gov/Research-Statistics-Data-and-Systems/Statistics-Trends-and-Reports/NationalHealthExpendData/NationalHealthAccountsHistorical.html. Accessed on July 28, 2016.
2. OECD. Health expenditure per capita. Health at a Glance 2015. Paris: OECD Publishing; 2015.
3. U.S. Congress, Office of Technology Assessment. Defensive Medicine and Medical Malpractice. Washington, DC: U.S. Government Printing Office; July 1994. OTA-H-602.
4. Mello MM, Chandra A, Gawande AA, Studdert DM. National costs of the medical liability system. Health Aff (Millwood). 2010;29(9):1569-1577. PubMed
5. Society of Hospital Medicine. Society of Hospital Medicine: Membership. 2017; http://www.hospitalmedicine.org/Web/Membership/Web/Membership/Membership_Landing_Page.aspx?hkey=97f40c85-fdcd-411f-b3f6-e617bc38a2c5. Accessed on January 5, 2017.
6. Kachalia A, Berg A, Fagerlin A, et al. Overuse of testing in preoperative evaluation and syncope: a survey of hospitalists. Ann Intern Med. 2015;162(2):100-108. PubMed
7. Pugatch MB. Federal tort claims and military medical malpractice. J Legal Nurse Consulting. 2008;19(2):3-6.
8. Eibner C, Krull H, Brown K, et al. Current and projected characteristics and unique health care needs of the patient population served by the Department of Veterans Affairs. Santa Monica, CA: RAND Corporation; 2015. PubMed
9. Finucane ML, Slovic P, Mertz CK, Flynn J, Satterfield TA. Gender, race, and perceived risk: the ‘white male’ effect. Health, Risk & Society. 2000;2(2):159-172.
10. Unwin E, Woolf K, Wadlow C, Potts HW, Dacre J. Sex differences in medico-legal action against doctors: a systematic review and meta-analysis. BMC Med. 2015;13:172. PubMed
11. Glassman PA, Rolph JE, Petersen LP, Bradley MA, Kravitz RL. Physicians’ personal malpractice experiences are not related to defensive clinical practices. J Health Polit Policy Law. 1996;21(2):219-241. PubMed
12. Jena AB, Seabury S, Lakdawalla D, Chandra A. Malpractice risk according to physician specialty. N Engl J Med. 2011;365(7):629-636. PubMed
13. Mello MM, Studdert DM, Kachalia A. The medical liability climate and prospects for reform. JAMA. 2014;312(20):2146-2155. PubMed
© 2018 Society of Hospital Medicine
Liability of Hospitalist Model of Care
The hospitalist model of care is becoming an increasingly prominent part of the inpatient clinical landscape. The percentage of hospitals in which hospitalists provide care has risen every year since 2003, and this trend is anticipated to continue.[1] In 2010, 59.8% of hospitals reported utilizing hospitalists to provide care, with a prevalence as high as 84.9% in New England.[1] Though the model started within internal medicine,[2] hospitalists can now be found in multiple medical disciplines including pediatrics, neurology, obstetrics‐gynecology, and orthopedics.[3] This model has many strengths, which include an improved provider presence in the hospital for acute issues, as well as a better understanding of hospital operations and knowledge of inpatient care. However, concerns have been raised that the hospitalist model, which does not usually involve longitudinal relationships with patients and introduces discontinuities in care, could carry a higher risk of malpractice claims.[4, 5, 6]
However, little is known about whether the hospitalist model actually leads to greater liability. Theoretical analyses suggest that failure to provide adequate follow up care, especially with regard to tests pending at discharge, may be a source of greater medical liability risk for hospitalists.[7] Coordination of care with consulting specialists and supervision of trainees may also be areas of increased liability risk.[7, 8] Prior research evaluating the difference in malpractice payments between the inpatient and outpatient settings found that the mean payment amounts were significantly higher in the inpatient setting.[9] Another study examined the rates of malpractice claims against physicians and determined that internal medicine physicians were at average risk of claims compared to other specialties.[10] However, none of the available data have provided direct information on liability risks specific to the hospitalist model.
METHODS
Design and Malpractice Claims Data
We conducted a retrospective observational analysis using closed claims data obtained from a liability insurer‐maintained database of over 52,000 coded medical malpractice claims. This database includes claims from 20 different insurance programs providing coverage to over 3000 different organizations, including academic medical centers, community hospitals, and physician groups. Approximately 30% of closed claims in the United States are included in the database. Claims in the database are categorized by allegation type, factors contributing to the error or injury, severity of injury, and claim outcome. Database categorization of claims was performed by trained registered nurses and performed according to prespecified criteria. Data on the number of physician coverage years (PCYs) were available for only one of the medical liability carriers, which covers a number of academic medical centers and community hospitals in New England. Therefore, claims rate analyses are based on information from this one insurer, which included 34,942 PCYs during the study period.
Claims with injury dates from 1997 to 2011 were used for analyses in this study. We chose 1997 as the starting year for the analysis because that was the first year the database formally included hospitalist claims as a separate category. For malpractice claims rates, the period analyzed was for injury dates from 1997 to 2008. We used 2008 as the cutoff for the analysis of claims rates to account for the time lag that can exist between the date of the alleged malpractice and the filing of a malpractice claim. Claims were classified by physician practice specialty, based on the attending physician's specialty at the time of the care that led to the claim. Hospitalists were defined as internal medicine physicians who spend >50% of their time practicing in the inpatient setting. This study was approved by the institutional review board at Brigham and Women's Hospital in Boston, Massachusetts.
Outcome Variables
Our primary outcome was the rate of malpractice claims, expressed as the number of malpractice claims per 100 PCYs. Other outcome variables, including major allegation types, contributing factors, and severity of injury, are reported as number of cases within a given category or subcategory and percentages of cases. The percentages are calculated as the percentage of the total number of claims against hospitalists. Severity of injury is ranked based on the National Association of Insurance Commissioners' Severity of Injury Scale, a standard scale for measuring the severity of injury in tort cases.[11, 12] Payment status refers to whether or not payment was made on a malpractice claim, regardless of whether payment resulted from a court judgment or a settlement. Compensation amounts are adjusted for inflation using the US Bureau of Labor Statistics Consumer Price Index, based on the year of payment and reported in 2011 dollars.[13]
Statistical Analysis
Comparisons between mean and median payment amounts were performed using the Wilcoxon rank sum test, as the distributions of the payment amounts were non‐normal. Comparisons for physician claims rates, severity of injury, and the percentage of cases in which payment was made were performed using Fisher's exact test. Confidence intervals (CIs) for proportions were calculated using the exact (Clopper‐Pearson) method. Tests performed were 2‐sided, with a P value <0.05 considered significant. Statistical analysis was performed using the SAS statistical software package, version 9.2 (SAS Institute Inc., Cary, NC).
RESULTS
We identified 272 medical malpractice claims against hospitalists. The mean age of the claimants was 56 years (standard deviation, 22 years). Claimants were 51.8% female and 44.5% male (gender not available for 3.7%).
The rate of claims against hospitalists (0.52 claims per 100 PCYs; 95% CI: 0.30‐0.85) was significantly lower than the rate of claims against nonhospitalist internal medicine physicians (1.91 claims per 100 PCYs; 95% CI: 1.73‐2.11), as well as the other physician types studied (P<0.001 for all claims rate comparisons) (Table 1). The rate of claims against nonhospitalist internal medicine physicians and emergency medicine physicians were approximately 3.5 times and 7 times, respectively, the rate of claims against hospitalists.
| Hospitalists (Internal Medicine Only) | All Other Internal Medicine Physicians | Emergency Medicine Physicians | General Surgeons | Obstetricians‐Gynecologists | |
|---|---|---|---|---|---|
| |||||
| No. of claims | 16 | 398 | 90 | 191 | 248 |
| Physician coverage years | 3,060 | 20,787 | 2,571 | 4,062 | 4,462 |
| Claims per 100 physician coverage years (95% CI) | 0.52 (0.30‐0.85) | 1.91a (1.73‐2.11) | 3.50a (2.82‐4.29) | 4.70a (4.07‐5.40) | 5.56a (4.90‐6.27) |
The most common types of allegations against hospitalists were for issues related to medical treatment (41.5%; 95% CI: 35.6%‐47.6%) and diagnosis‐related claims (36.0%; 95% CI: 30.3%‐42.0) (Table 2). The most common steps in the diagnostic process implicated in the diagnosis‐related allegations were errors in the ordering of diagnostic or lab tests (16.2%; 95% CI: 12.0%‐21.1%) and the performance of the history and physical (12.1%; 95% CI: 8.5%‐16.6%).
| Category | No. of Cases | % of Cases (95% CI) |
|---|---|---|
| ||
| Medical treatment | 113 | 41.5% (35.6%‐47.6%) |
| Diagnosis relatedb | 98 | 36.0% (30.3%‐42.0%) |
| Patient notes problem and seeks medical care | 2 | 0.7% (0.1%‐2.6%) |
| History/physical and evaluation of symptoms | 33 | 12.1% (8.5%‐16.6%) |
| Ordering of diagnostic/labs tests | 44 | 16.2% (12.0%‐21.1%) |
| Performance of tests | 8 | 2.9% (1.3%‐5.7%) |
| Interpretation of tests | 22 | 8.1% (5.1%‐12.0%) |
| Receipt or transmittal of test results | 8 | 2.9% (1.3%‐5.7%) |
| Physician follow‐up with patient | 6 | 2.2% (0.8%‐4.7%) |
| Referral management or consultation errors | 24 | 8.8% (5.7%‐12.8%) |
| Medication related | 26 | 9.6% (6.3%‐13.7%) |
| Patient monitoring | 12 | 4.4% (2.3%‐7.6%) |
| Surgical treatment | 9 | 3.3% (1.5%‐6.2%) |
The most common categories of contributing factors were errors in clinical judgment (54.4%; 95% CI: 48.3%‐60.4%) and lapses in communication (encompassing communication among clinicians and between the clinician and patient) (36.4%; 95% CI: 30.7%‐42.4%) (Table 3). Issues involving transitions of care were a factor in 37.9% of cases (95% CI: 32.1%‐43.9%). Supervision of housestaff was a factor in 1.5% of cases (95% CI: 0.4%‐3.7%).
| Contributing Factor | No. of Cases | % of Cases (95% CI) | Definition or Example |
|---|---|---|---|
| |||
| Clinical judgment | 148 | 54.4% (48.3%‐60.4%) | Problems with patient assessment or choice of therapy; failure/delay in obtaining consult/referral |
| Failure or delay in ordering a diagnostic test | 36 | 13.2% (9.4%‐17.8%) | |
| Failure or delay in obtaining a consult or referral | 35 | 12.9% (9.1%‐17.4%) | |
| Having too narrow a diagnostic focus | 34 | 12.5% (8.8%‐17.0%) | |
| Communication | 99 | 36.4% (30.7%‐42.4%) | Issues with communication among clinicians or between the clinicians and the patient or family |
| Inadequate communication among providers regarding the patient's condition | 61 | 22.4% (17.6%‐27.9%) | |
| Poor rapport with/lack of sympathy toward and patient and/or family | 15 | 5.5% (3.1%‐8.9%) | |
| Insufficient education of the patient and/or family regarding the risks of medications | 9 | 3.3% (1.5%‐6.2%) | |
| Documentation | 53 | 19.5% (14.9%‐24.7%) | Insufficient or lack of documentation |
| Administrative | 47 | 17.3% (13.0%‐22.3%) | Problems with staffing or hospital policies and protocols |
| Clinical systems | 44 | 16.2% (12.0%‐21.1%) | Failure or delay in scheduling a recommended test or failure to identify the provider coordinating care |
| Behavior related | 28 | 10.3% (7.0%‐14.5%) | Patient not following provider recommendations; seeking other providers due to dissatisfaction with care |
The percentage of claims involving a patient death was significantly higher among hospitalist cases (50.4%; 95% CI: 44.3%‐56.5%) compared to all other inpatient cases (29.1%; 95% CI: 28.4%‐29.8%) or outpatient cases (18.2%; 95% CI: 17.6%‐18.9%) (P<0.001 for both comparisons), but lower than nonhospitalist inpatient internal medicine cases (57.6%; 95% CI: 54.6%‐60.5%) (P=0.035) (Table 4).
| Severitya | Hospitalists Cases, Internal Medicine Only, n=272 | All Other Inpatient Internal Medicine Cases, n=1120 | All Other Inpatient Cases, n=14,386 | Outpatient Cases, n=15,039 | ||||
|---|---|---|---|---|---|---|---|---|
| No. of Cases | % of Cases (95% CI) | No. of Cases | % of Cases (95% CI) | No. of Cases | % of Cases (95% CI) | No. of Cases | % of Cases (95% CI) | |
| ||||||||
| Low | 19 | 7.0% (4.3%‐10.7%) | 61 | 5.4% (4.2%‐6.9%) | 1,180 | 8.2% (7.8%‐8.7%) | 2,279 | 15.2%b (14.6%‐15.7%) |
| Medium | 65 | 23.9% (19.0%‐29.4%) | 235 | 21.0% (18.6%‐23.5%) | 6,503 | 45.2%b (44.4%‐46.0%) | 7,803 | 51.9%b (51.1%‐52.7%) |
| High | 188 | 69.1% (63.3%‐74.6%) | 824 | 73.6% (70.9%‐76.1%) | 6,703 | 46.6%b (45.8%‐47.4%) | 4,957 | 33.0%b (32.2%‐33.7%) |
| Death | 137 | 50.4% (44.3%‐56.5%) | 645 | 57.6%c (54.6%‐60.5%) | 4,186 | 29.1%b (28.4%‐29.8%) | 2,744 | 18.2%b (17.6%‐18.9%) |
There were no significant differences in the percentage of hospitalist cases in which payment was made (32.0%; 95% CI: 26.5%‐37.9%) compared to any of the other 3 groups studied (Table 5). The median payment in hospitalist cases, $240,000 (interquartile range [IQR]: $100,000$524,245), was significantly higher than that in all other inpatient cases ($156,714; IQR: $39,188$488,996) (P=0.040) and in outpatient cases ($92,671; IQR: $20,895$325,461) (P<0.001), though not significantly different than the median payment in all other inpatient internal medicine cases ($206,314; IQR: $57,382$488,996).
| Hospitalist Cases, Internal Medicine Only | All Other Inpatient Internal Medicine Cases | All Other Inpatient Cases | Outpatient Cases | |||||
|---|---|---|---|---|---|---|---|---|
| No. of Cases | % of Cases (95% CI) | No. of Cases | % of Cases (95% CI) | No. of Cases | % of Cases (95% CI) | No. of Cases | % of Cases (95% CI) | |
| ||||||||
| Payment made | 87 | 32.0% (26.5%‐37.9%) | 330 | 29.5% (26.8%‐32.2%) | 5164 | 35.9% (35.1%‐36.7%) | 4632 | 30.8% (30.1%‐31.5%) |
| No payment made | 185 | 68.0% (62.1%‐73.5%) | 790 | 70.5% (67.8%‐73.2%) | 9222 | 64.1% (63.3%‐64.9%) | 10407 | 69.2% (68.5%‐69.9%) |
| Mean payment (95% CI) | $384,617 ($289,662‐$479,573) | $451,713 ($359,656‐$543,769) | $482,963 ($452,725‐$513,202) | $305,462b ($286,517‐$324,408) | ||||
| Median payment (IQR) | $240,000 ($100,000$524,245) | $206,314 ($57,382$488,996) | $156,714c ($39,188$488,996) | $92,671b ($20,895$325,461) | ||||
| Standard deviation | $445,531 | $850,086 | $1,108,404 | $657,707 | ||||
DISCUSSION
In our analysis of closed medical malpractice claims, we found that hospitalists have a significantly lower rate of claims compared to the other types of physicians studied, including other internal medicine physicians and emergency medicine physicians. Although hospitalists had a relatively low rate of claims, the severity of injury involved in those claims was high.
Prior research has found that the proportion of internal medicine physicians who face a malpractice claim each year is between 7% and 8%.[10] The rate of claims against internal medicine physicians in this prior study was similar to that of emergency medicine physicians, who, like hospitalists, are defined by their site of practice. In addition, both frequently work with acutely ill patients with whom they do not have a longitudinal relationship. However, this prior analysis did not assess for any difference in malpractice risk based on whether internal medicine physicians were practicing primarily as outpatient physicians or as hospitalists, and so the liability risk of hospitalists (as opposed to internal medicine physicians generally) remains undefined. Our analysis sought to determine whether there is a difference in claims rates when adopting a hospitalist model.
Notably, two factors have been raised as potentially increasing the risk that hospitalists will be subject to malpractice claims. The first is that hospitalists have only a brief relationship with their patients, thus limiting their ability to form the strong physician‐patient relationships that decrease the likelihood of a malpractice claim.[14, 15, 16, 17] Second, hospitalists face the challenge of transitions of care as patients move from the outpatient to the inpatient setting, and vice versa.[4, 7, 18, 19] Despite these theoretical concerns, we found that hospitalists face a relatively low rate of claims compared to other physicians. The reasons for this low liability risk remain uncertain.
One possible explanation for this relatively low rate of claims against hospitalists is that hospitalists are actually at lower risk of missing a diagnosis, the most common reason for a malpractice claim in the ambulatory setting.[20, 21, 22] In contrast to how patients may present in the clinic or the emergency department, when patients are admitted to the hospital, it is likely that they present to the hospitalist with a known problem, rather than a clinical symptom without an etiology. For example, when a patient is admitted to the hospital for chest pain, other physicians may have already been concerned enough to raise clinical suspicion of a myocardial infarction and order basic testing, making the diagnosis less likely to be missed when the hospitalist assumes care of that patient. Indeed, we found that, among the claims made against hospitalists, the leading type of allegation was an error in treatment rather than an error in diagnosis.
It is also possible that the lower rate of claims against hospitalists reflects the high quality of care provided by hospitalists, resulting from their clinical expertise and knowledge of hospital systems. High clinical volume is associated with better outcomes for multiple surgical procedures,[23] and, to a lesser degree, for certain medical conditions.[24] Because hospitalists are likely to see a high volume of those medical conditions that regularly require admission to an inpatient medical service, this high volume could translate into higher quality of care, both because of medical expertise in managing these conditions and because of proficiency in dealing with hospital systems. However, this theory must be tempered by the conclusion from earlier work that did not show a large difference in outcomes among patients cared for by hospitalists.[25]
Another reason for the lower claims rate could be a direct result of how hospitalist jobs are structured. In prior research, an inadequate physician‐patient relationship has been found to be a factor in patients deciding to file a malpractice claim.[14, 15, 16, 17] Although hospitalists usually only care for their patients during the few days of the hospital admission, hospitalists are on site all day and thus are able to frequently communicate with patients and families face to face. This level of interaction may allow for a sufficiently healthy, even if time‐limited, physician‐patient relationship that meets patients' expectations.
For the claims that occur, deficiencies in communication and transitions of care, both of which have been cited as a special concern for hospitalists, were in fact present in 37.9% of the hospitalist cases we evaluated.[7] This proportion appears to be higher than previous work in the ambulatory setting that showed communication generally to be a factor in 30% of cases, and problems related to handoffs specifically to be a factor in 20% of cases.[20] These findings highlight the risks associated with the discontinuities inherent in the hospitalist model, which can occur on admission, during the hospitalization (where a number of hospitalists may care for one patient), and on discharge. These findings also point to the need for ongoing efforts to address these concerns.
More than half of the claims against hospitalists (50.4%; 95% CI: 44.3%‐56.5%) involved the death of the patient. However, this high rate of claims involving the death of the patient did not appear to be specific to hospitalists. Rather, this appeared to be true for inpatient internal medicine cases generally, because the rate of claims in which the severity of injury was death was significantly higher among nonhospitalist inpatient internal medicine cases (57.6%; 95% CI: 54.6%‐60.5%).
Our study has several limitations. Though the database that we used includes hospitals and physician groups from 20 different liability carriers covering multiple regions across the country, it nonetheless may not be entirely representative, especially given the variation in the hospitalist models used at different institutions (for example, coverage of intensive care unit patients) and because of geographic variability. However, the sample did contain a large proportion (approximately 30%) of closed claims nationally. Claims rates are based on data from a single insurance carrier, albeit one with 23,847 PCYs among internal medicine physicians during the study period. Second, we defined hospitalist cases as those cases in which the hospitalist was the attending of record at the time of the clinical event that gave rise to the malpractice claim. It is possible that this definition captured claims in which the hospitalist, although the attending of record, may not have been directly involved in the care leading to the claim (for example, a problem with a surgery gave rise to the claim). Third, we assessed liability risk by years covered, which does not account for risk that may vary based on clinical volume.
Overall, our results suggest that liability fears should not impede the adoption of the hospitalist model in internal medicine. Not only do hospitalists have a lower rate of claims, but there is also no difference in the rate at which claims are paid or mean indemnity amounts for the claims that are paid for hospitalists. Previous analyses of the costs associated with care by hospitalists, compared to care by other types of physicians, have not taken into account the decreased liability costs that are likely associated with care provided by hospitalists.[25, 26]
In conclusion, contrary to concerns that have been raised, we found that hospitalists face a lower rate of malpractice claims when compared to other internal medicine physicians and specialties. However, we did find that care discontinuities may be resulting in liability risk due to communication and handoff‐related errors. Improvements in the hospitalist model of care targeted at improving communication and clinical judgment may not only further reduce claims against hospitalists, but also improve the safety of care associated with this model.
Disclosures
Dr. Kachalia has received honoraria from Quantia MD for presentations on patient safety. Dr. Schaffer, Ms. Raman, and Ms. Puopolo have no disclosures. The authors report no conflicts of interest.
- American Hospital Association. AHA Hospital Statistics. 2012 ed. Chicago, IL: Health Forum; 2012.
- , . The emerging role of "hospitalists" in the American health care system. N Engl J Med. 1996;335(7):514–517.
- , , . Specialty hospitalists: analyzing an emerging phenomenon. JAMA. 2012;307(16):1699–1700.
- , , , . Primary care physician attitudes regarding communication with hospitalists. Am J Med. 2001;111(9B):15S–20S.
- . Hospitalists and the doctor‐patient relationship. J Legal Stud. 2001;30(2):589–606.
- . Rapport and the hospitalist. Am J Med. 2001;111(9B):31S–35S.
- . Key legal principles for hospitalists. Am J Med. 2001;111(9B):5S–9S.
- , . Medical malpractice. In: McKean S, Ross J, Dressler D, Brotman D, Ginsberg J, eds. Principles and Practice of Hospital Medicine. New York, NY: McGraw Hill; 2012.
- , , . Paid malpractice claims for adverse events in inpatient and outpatient settings. JAMA. 2011;305(23):2427–2431.
- , , , . Malpractice risk according to physician specialty. N Engl J Med. 2011;365(7):629–636.
- Sowka MP, ed. NAIC Malpractice Claims, Final Compilation. Brookfield, WI: National Association of Insurance Commissioners; 1980.
- , . Medical Malpractice Insurance Claims in Seven States, 2000–2004. U.S. Department of Justice, Office of Justice Programs, Bureau of Justice Statistics Special Report; March 2007.
- Bureau of Labor Statistics. Available at: http://data.bls.gov/pdq/querytool.jsp?survey=cu. Accessed December 3, 2012.
- , , , . The doctor‐patient relationship and malpractice. Lessons from plaintiff depositions. Arch Intern Med. 1994;154(12):1365–1370.
- , , , . Factors that prompted families to file medical malpractice claims following perinatal injuries. JAMA. 1992;267(10):1359–1363.
- , , . Why do people sue doctors? A study of patients and relatives taking legal action. Lancet. 1994;343(8913):1609–1613.
- , , , , . Physician‐patient communication. The relationship with malpractice claims among primary care physicians and surgeons. JAMA. 1997;277(7):553–559.
- , , , . Medical errors related to discontinuity of care from an inpatient to an outpatient setting. J Gen Intern Med. 2003;18(8):646–651.
- , . The ethics of the hospitalist model. J Hosp Med. 2010;5(3):183–188.
- , , , et al. Missed and delayed diagnoses in the ambulatory setting: a study of closed malpractice claims. Ann Intern Med. 2006;145(7):488–496.
- , , , , , . Learning from malpractice claims about negligent, adverse events in primary care in the United States. Qual Saf Health Care. 2004;13(2):121–126.
- , , , et al. Primary care closed claims experience of Massachusetts malpractice insurers. JAMA Intern Med. 2013;173(22):2063–2068.
- , , , et al. Hospital volume and surgical mortality in the United States. N Engl J Med. 2002;346(15):1128–1137.
- , , , et al. Hospital volume and 30‐day mortality for three common medical conditions. N Engl J Med. 2010;362(12):1110–1118.
- , , , , , . Outcomes of care by hospitalists, general internists, and family physicians. N Engl J Med. 2007;357(25):2589–2600.
- , , , et al. Quality of care for decompensated heart failure: comparable performance between academic hospitalists and non‐hospitalists. J Gen Intern Med. 2008;23(9):1399–1406.
The hospitalist model of care is becoming an increasingly prominent part of the inpatient clinical landscape. The percentage of hospitals in which hospitalists provide care has risen every year since 2003, and this trend is anticipated to continue.[1] In 2010, 59.8% of hospitals reported utilizing hospitalists to provide care, with a prevalence as high as 84.9% in New England.[1] Though the model started within internal medicine,[2] hospitalists can now be found in multiple medical disciplines including pediatrics, neurology, obstetrics‐gynecology, and orthopedics.[3] This model has many strengths, which include an improved provider presence in the hospital for acute issues, as well as a better understanding of hospital operations and knowledge of inpatient care. However, concerns have been raised that the hospitalist model, which does not usually involve longitudinal relationships with patients and introduces discontinuities in care, could carry a higher risk of malpractice claims.[4, 5, 6]
However, little is known about whether the hospitalist model actually leads to greater liability. Theoretical analyses suggest that failure to provide adequate follow up care, especially with regard to tests pending at discharge, may be a source of greater medical liability risk for hospitalists.[7] Coordination of care with consulting specialists and supervision of trainees may also be areas of increased liability risk.[7, 8] Prior research evaluating the difference in malpractice payments between the inpatient and outpatient settings found that the mean payment amounts were significantly higher in the inpatient setting.[9] Another study examined the rates of malpractice claims against physicians and determined that internal medicine physicians were at average risk of claims compared to other specialties.[10] However, none of the available data have provided direct information on liability risks specific to the hospitalist model.
METHODS
Design and Malpractice Claims Data
We conducted a retrospective observational analysis using closed claims data obtained from a liability insurer‐maintained database of over 52,000 coded medical malpractice claims. This database includes claims from 20 different insurance programs providing coverage to over 3000 different organizations, including academic medical centers, community hospitals, and physician groups. Approximately 30% of closed claims in the United States are included in the database. Claims in the database are categorized by allegation type, factors contributing to the error or injury, severity of injury, and claim outcome. Database categorization of claims was performed by trained registered nurses and performed according to prespecified criteria. Data on the number of physician coverage years (PCYs) were available for only one of the medical liability carriers, which covers a number of academic medical centers and community hospitals in New England. Therefore, claims rate analyses are based on information from this one insurer, which included 34,942 PCYs during the study period.
Claims with injury dates from 1997 to 2011 were used for analyses in this study. We chose 1997 as the starting year for the analysis because that was the first year the database formally included hospitalist claims as a separate category. For malpractice claims rates, the period analyzed was for injury dates from 1997 to 2008. We used 2008 as the cutoff for the analysis of claims rates to account for the time lag that can exist between the date of the alleged malpractice and the filing of a malpractice claim. Claims were classified by physician practice specialty, based on the attending physician's specialty at the time of the care that led to the claim. Hospitalists were defined as internal medicine physicians who spend >50% of their time practicing in the inpatient setting. This study was approved by the institutional review board at Brigham and Women's Hospital in Boston, Massachusetts.
Outcome Variables
Our primary outcome was the rate of malpractice claims, expressed as the number of malpractice claims per 100 PCYs. Other outcome variables, including major allegation types, contributing factors, and severity of injury, are reported as number of cases within a given category or subcategory and percentages of cases. The percentages are calculated as the percentage of the total number of claims against hospitalists. Severity of injury is ranked based on the National Association of Insurance Commissioners' Severity of Injury Scale, a standard scale for measuring the severity of injury in tort cases.[11, 12] Payment status refers to whether or not payment was made on a malpractice claim, regardless of whether payment resulted from a court judgment or a settlement. Compensation amounts are adjusted for inflation using the US Bureau of Labor Statistics Consumer Price Index, based on the year of payment and reported in 2011 dollars.[13]
Statistical Analysis
Comparisons between mean and median payment amounts were performed using the Wilcoxon rank sum test, as the distributions of the payment amounts were non‐normal. Comparisons for physician claims rates, severity of injury, and the percentage of cases in which payment was made were performed using Fisher's exact test. Confidence intervals (CIs) for proportions were calculated using the exact (Clopper‐Pearson) method. Tests performed were 2‐sided, with a P value <0.05 considered significant. Statistical analysis was performed using the SAS statistical software package, version 9.2 (SAS Institute Inc., Cary, NC).
RESULTS
We identified 272 medical malpractice claims against hospitalists. The mean age of the claimants was 56 years (standard deviation, 22 years). Claimants were 51.8% female and 44.5% male (gender not available for 3.7%).
The rate of claims against hospitalists (0.52 claims per 100 PCYs; 95% CI: 0.30‐0.85) was significantly lower than the rate of claims against nonhospitalist internal medicine physicians (1.91 claims per 100 PCYs; 95% CI: 1.73‐2.11), as well as the other physician types studied (P<0.001 for all claims rate comparisons) (Table 1). The rate of claims against nonhospitalist internal medicine physicians and emergency medicine physicians were approximately 3.5 times and 7 times, respectively, the rate of claims against hospitalists.
| Hospitalists (Internal Medicine Only) | All Other Internal Medicine Physicians | Emergency Medicine Physicians | General Surgeons | Obstetricians‐Gynecologists | |
|---|---|---|---|---|---|
| |||||
| No. of claims | 16 | 398 | 90 | 191 | 248 |
| Physician coverage years | 3,060 | 20,787 | 2,571 | 4,062 | 4,462 |
| Claims per 100 physician coverage years (95% CI) | 0.52 (0.30‐0.85) | 1.91a (1.73‐2.11) | 3.50a (2.82‐4.29) | 4.70a (4.07‐5.40) | 5.56a (4.90‐6.27) |
The most common types of allegations against hospitalists were for issues related to medical treatment (41.5%; 95% CI: 35.6%‐47.6%) and diagnosis‐related claims (36.0%; 95% CI: 30.3%‐42.0) (Table 2). The most common steps in the diagnostic process implicated in the diagnosis‐related allegations were errors in the ordering of diagnostic or lab tests (16.2%; 95% CI: 12.0%‐21.1%) and the performance of the history and physical (12.1%; 95% CI: 8.5%‐16.6%).
| Category | No. of Cases | % of Cases (95% CI) |
|---|---|---|
| ||
| Medical treatment | 113 | 41.5% (35.6%‐47.6%) |
| Diagnosis relatedb | 98 | 36.0% (30.3%‐42.0%) |
| Patient notes problem and seeks medical care | 2 | 0.7% (0.1%‐2.6%) |
| History/physical and evaluation of symptoms | 33 | 12.1% (8.5%‐16.6%) |
| Ordering of diagnostic/labs tests | 44 | 16.2% (12.0%‐21.1%) |
| Performance of tests | 8 | 2.9% (1.3%‐5.7%) |
| Interpretation of tests | 22 | 8.1% (5.1%‐12.0%) |
| Receipt or transmittal of test results | 8 | 2.9% (1.3%‐5.7%) |
| Physician follow‐up with patient | 6 | 2.2% (0.8%‐4.7%) |
| Referral management or consultation errors | 24 | 8.8% (5.7%‐12.8%) |
| Medication related | 26 | 9.6% (6.3%‐13.7%) |
| Patient monitoring | 12 | 4.4% (2.3%‐7.6%) |
| Surgical treatment | 9 | 3.3% (1.5%‐6.2%) |
The most common categories of contributing factors were errors in clinical judgment (54.4%; 95% CI: 48.3%‐60.4%) and lapses in communication (encompassing communication among clinicians and between the clinician and patient) (36.4%; 95% CI: 30.7%‐42.4%) (Table 3). Issues involving transitions of care were a factor in 37.9% of cases (95% CI: 32.1%‐43.9%). Supervision of housestaff was a factor in 1.5% of cases (95% CI: 0.4%‐3.7%).
| Contributing Factor | No. of Cases | % of Cases (95% CI) | Definition or Example |
|---|---|---|---|
| |||
| Clinical judgment | 148 | 54.4% (48.3%‐60.4%) | Problems with patient assessment or choice of therapy; failure/delay in obtaining consult/referral |
| Failure or delay in ordering a diagnostic test | 36 | 13.2% (9.4%‐17.8%) | |
| Failure or delay in obtaining a consult or referral | 35 | 12.9% (9.1%‐17.4%) | |
| Having too narrow a diagnostic focus | 34 | 12.5% (8.8%‐17.0%) | |
| Communication | 99 | 36.4% (30.7%‐42.4%) | Issues with communication among clinicians or between the clinicians and the patient or family |
| Inadequate communication among providers regarding the patient's condition | 61 | 22.4% (17.6%‐27.9%) | |
| Poor rapport with/lack of sympathy toward and patient and/or family | 15 | 5.5% (3.1%‐8.9%) | |
| Insufficient education of the patient and/or family regarding the risks of medications | 9 | 3.3% (1.5%‐6.2%) | |
| Documentation | 53 | 19.5% (14.9%‐24.7%) | Insufficient or lack of documentation |
| Administrative | 47 | 17.3% (13.0%‐22.3%) | Problems with staffing or hospital policies and protocols |
| Clinical systems | 44 | 16.2% (12.0%‐21.1%) | Failure or delay in scheduling a recommended test or failure to identify the provider coordinating care |
| Behavior related | 28 | 10.3% (7.0%‐14.5%) | Patient not following provider recommendations; seeking other providers due to dissatisfaction with care |
The percentage of claims involving a patient death was significantly higher among hospitalist cases (50.4%; 95% CI: 44.3%‐56.5%) compared to all other inpatient cases (29.1%; 95% CI: 28.4%‐29.8%) or outpatient cases (18.2%; 95% CI: 17.6%‐18.9%) (P<0.001 for both comparisons), but lower than nonhospitalist inpatient internal medicine cases (57.6%; 95% CI: 54.6%‐60.5%) (P=0.035) (Table 4).
| Severitya | Hospitalists Cases, Internal Medicine Only, n=272 | All Other Inpatient Internal Medicine Cases, n=1120 | All Other Inpatient Cases, n=14,386 | Outpatient Cases, n=15,039 | ||||
|---|---|---|---|---|---|---|---|---|
| No. of Cases | % of Cases (95% CI) | No. of Cases | % of Cases (95% CI) | No. of Cases | % of Cases (95% CI) | No. of Cases | % of Cases (95% CI) | |
| ||||||||
| Low | 19 | 7.0% (4.3%‐10.7%) | 61 | 5.4% (4.2%‐6.9%) | 1,180 | 8.2% (7.8%‐8.7%) | 2,279 | 15.2%b (14.6%‐15.7%) |
| Medium | 65 | 23.9% (19.0%‐29.4%) | 235 | 21.0% (18.6%‐23.5%) | 6,503 | 45.2%b (44.4%‐46.0%) | 7,803 | 51.9%b (51.1%‐52.7%) |
| High | 188 | 69.1% (63.3%‐74.6%) | 824 | 73.6% (70.9%‐76.1%) | 6,703 | 46.6%b (45.8%‐47.4%) | 4,957 | 33.0%b (32.2%‐33.7%) |
| Death | 137 | 50.4% (44.3%‐56.5%) | 645 | 57.6%c (54.6%‐60.5%) | 4,186 | 29.1%b (28.4%‐29.8%) | 2,744 | 18.2%b (17.6%‐18.9%) |
There were no significant differences in the percentage of hospitalist cases in which payment was made (32.0%; 95% CI: 26.5%‐37.9%) compared to any of the other 3 groups studied (Table 5). The median payment in hospitalist cases, $240,000 (interquartile range [IQR]: $100,000$524,245), was significantly higher than that in all other inpatient cases ($156,714; IQR: $39,188$488,996) (P=0.040) and in outpatient cases ($92,671; IQR: $20,895$325,461) (P<0.001), though not significantly different than the median payment in all other inpatient internal medicine cases ($206,314; IQR: $57,382$488,996).
| Hospitalist Cases, Internal Medicine Only | All Other Inpatient Internal Medicine Cases | All Other Inpatient Cases | Outpatient Cases | |||||
|---|---|---|---|---|---|---|---|---|
| No. of Cases | % of Cases (95% CI) | No. of Cases | % of Cases (95% CI) | No. of Cases | % of Cases (95% CI) | No. of Cases | % of Cases (95% CI) | |
| ||||||||
| Payment made | 87 | 32.0% (26.5%‐37.9%) | 330 | 29.5% (26.8%‐32.2%) | 5164 | 35.9% (35.1%‐36.7%) | 4632 | 30.8% (30.1%‐31.5%) |
| No payment made | 185 | 68.0% (62.1%‐73.5%) | 790 | 70.5% (67.8%‐73.2%) | 9222 | 64.1% (63.3%‐64.9%) | 10407 | 69.2% (68.5%‐69.9%) |
| Mean payment (95% CI) | $384,617 ($289,662‐$479,573) | $451,713 ($359,656‐$543,769) | $482,963 ($452,725‐$513,202) | $305,462b ($286,517‐$324,408) | ||||
| Median payment (IQR) | $240,000 ($100,000$524,245) | $206,314 ($57,382$488,996) | $156,714c ($39,188$488,996) | $92,671b ($20,895$325,461) | ||||
| Standard deviation | $445,531 | $850,086 | $1,108,404 | $657,707 | ||||
DISCUSSION
In our analysis of closed medical malpractice claims, we found that hospitalists have a significantly lower rate of claims compared to the other types of physicians studied, including other internal medicine physicians and emergency medicine physicians. Although hospitalists had a relatively low rate of claims, the severity of injury involved in those claims was high.
Prior research has found that the proportion of internal medicine physicians who face a malpractice claim each year is between 7% and 8%.[10] The rate of claims against internal medicine physicians in this prior study was similar to that of emergency medicine physicians, who, like hospitalists, are defined by their site of practice. In addition, both frequently work with acutely ill patients with whom they do not have a longitudinal relationship. However, this prior analysis did not assess for any difference in malpractice risk based on whether internal medicine physicians were practicing primarily as outpatient physicians or as hospitalists, and so the liability risk of hospitalists (as opposed to internal medicine physicians generally) remains undefined. Our analysis sought to determine whether there is a difference in claims rates when adopting a hospitalist model.
Notably, two factors have been raised as potentially increasing the risk that hospitalists will be subject to malpractice claims. The first is that hospitalists have only a brief relationship with their patients, thus limiting their ability to form the strong physician‐patient relationships that decrease the likelihood of a malpractice claim.[14, 15, 16, 17] Second, hospitalists face the challenge of transitions of care as patients move from the outpatient to the inpatient setting, and vice versa.[4, 7, 18, 19] Despite these theoretical concerns, we found that hospitalists face a relatively low rate of claims compared to other physicians. The reasons for this low liability risk remain uncertain.
One possible explanation for this relatively low rate of claims against hospitalists is that hospitalists are actually at lower risk of missing a diagnosis, the most common reason for a malpractice claim in the ambulatory setting.[20, 21, 22] In contrast to how patients may present in the clinic or the emergency department, when patients are admitted to the hospital, it is likely that they present to the hospitalist with a known problem, rather than a clinical symptom without an etiology. For example, when a patient is admitted to the hospital for chest pain, other physicians may have already been concerned enough to raise clinical suspicion of a myocardial infarction and order basic testing, making the diagnosis less likely to be missed when the hospitalist assumes care of that patient. Indeed, we found that, among the claims made against hospitalists, the leading type of allegation was an error in treatment rather than an error in diagnosis.
It is also possible that the lower rate of claims against hospitalists reflects the high quality of care provided by hospitalists, resulting from their clinical expertise and knowledge of hospital systems. High clinical volume is associated with better outcomes for multiple surgical procedures,[23] and, to a lesser degree, for certain medical conditions.[24] Because hospitalists are likely to see a high volume of those medical conditions that regularly require admission to an inpatient medical service, this high volume could translate into higher quality of care, both because of medical expertise in managing these conditions and because of proficiency in dealing with hospital systems. However, this theory must be tempered by the conclusion from earlier work that did not show a large difference in outcomes among patients cared for by hospitalists.[25]
Another reason for the lower claims rate could be a direct result of how hospitalist jobs are structured. In prior research, an inadequate physician‐patient relationship has been found to be a factor in patients deciding to file a malpractice claim.[14, 15, 16, 17] Although hospitalists usually only care for their patients during the few days of the hospital admission, hospitalists are on site all day and thus are able to frequently communicate with patients and families face to face. This level of interaction may allow for a sufficiently healthy, even if time‐limited, physician‐patient relationship that meets patients' expectations.
For the claims that occur, deficiencies in communication and transitions of care, both of which have been cited as a special concern for hospitalists, were in fact present in 37.9% of the hospitalist cases we evaluated.[7] This proportion appears to be higher than previous work in the ambulatory setting that showed communication generally to be a factor in 30% of cases, and problems related to handoffs specifically to be a factor in 20% of cases.[20] These findings highlight the risks associated with the discontinuities inherent in the hospitalist model, which can occur on admission, during the hospitalization (where a number of hospitalists may care for one patient), and on discharge. These findings also point to the need for ongoing efforts to address these concerns.
More than half of the claims against hospitalists (50.4%; 95% CI: 44.3%‐56.5%) involved the death of the patient. However, this high rate of claims involving the death of the patient did not appear to be specific to hospitalists. Rather, this appeared to be true for inpatient internal medicine cases generally, because the rate of claims in which the severity of injury was death was significantly higher among nonhospitalist inpatient internal medicine cases (57.6%; 95% CI: 54.6%‐60.5%).
Our study has several limitations. Though the database that we used includes hospitals and physician groups from 20 different liability carriers covering multiple regions across the country, it nonetheless may not be entirely representative, especially given the variation in the hospitalist models used at different institutions (for example, coverage of intensive care unit patients) and because of geographic variability. However, the sample did contain a large proportion (approximately 30%) of closed claims nationally. Claims rates are based on data from a single insurance carrier, albeit one with 23,847 PCYs among internal medicine physicians during the study period. Second, we defined hospitalist cases as those cases in which the hospitalist was the attending of record at the time of the clinical event that gave rise to the malpractice claim. It is possible that this definition captured claims in which the hospitalist, although the attending of record, may not have been directly involved in the care leading to the claim (for example, a problem with a surgery gave rise to the claim). Third, we assessed liability risk by years covered, which does not account for risk that may vary based on clinical volume.
Overall, our results suggest that liability fears should not impede the adoption of the hospitalist model in internal medicine. Not only do hospitalists have a lower rate of claims, but there is also no difference in the rate at which claims are paid or mean indemnity amounts for the claims that are paid for hospitalists. Previous analyses of the costs associated with care by hospitalists, compared to care by other types of physicians, have not taken into account the decreased liability costs that are likely associated with care provided by hospitalists.[25, 26]
In conclusion, contrary to concerns that have been raised, we found that hospitalists face a lower rate of malpractice claims when compared to other internal medicine physicians and specialties. However, we did find that care discontinuities may be resulting in liability risk due to communication and handoff‐related errors. Improvements in the hospitalist model of care targeted at improving communication and clinical judgment may not only further reduce claims against hospitalists, but also improve the safety of care associated with this model.
Disclosures
Dr. Kachalia has received honoraria from Quantia MD for presentations on patient safety. Dr. Schaffer, Ms. Raman, and Ms. Puopolo have no disclosures. The authors report no conflicts of interest.
- American Hospital Association. AHA Hospital Statistics. 2012 ed. Chicago, IL: Health Forum; 2012.
- , . The emerging role of "hospitalists" in the American health care system. N Engl J Med. 1996;335(7):514–517.
- , , . Specialty hospitalists: analyzing an emerging phenomenon. JAMA. 2012;307(16):1699–1700.
- , , , . Primary care physician attitudes regarding communication with hospitalists. Am J Med. 2001;111(9B):15S–20S.
- . Hospitalists and the doctor‐patient relationship. J Legal Stud. 2001;30(2):589–606.
- . Rapport and the hospitalist. Am J Med. 2001;111(9B):31S–35S.
- . Key legal principles for hospitalists. Am J Med. 2001;111(9B):5S–9S.
- , . Medical malpractice. In: McKean S, Ross J, Dressler D, Brotman D, Ginsberg J, eds. Principles and Practice of Hospital Medicine. New York, NY: McGraw Hill; 2012.
- , , . Paid malpractice claims for adverse events in inpatient and outpatient settings. JAMA. 2011;305(23):2427–2431.
- , , , . Malpractice risk according to physician specialty. N Engl J Med. 2011;365(7):629–636.
- Sowka MP, ed. NAIC Malpractice Claims, Final Compilation. Brookfield, WI: National Association of Insurance Commissioners; 1980.
- , . Medical Malpractice Insurance Claims in Seven States, 2000–2004. U.S. Department of Justice, Office of Justice Programs, Bureau of Justice Statistics Special Report; March 2007.
- Bureau of Labor Statistics. Available at: http://data.bls.gov/pdq/querytool.jsp?survey=cu. Accessed December 3, 2012.
- , , , . The doctor‐patient relationship and malpractice. Lessons from plaintiff depositions. Arch Intern Med. 1994;154(12):1365–1370.
- , , , . Factors that prompted families to file medical malpractice claims following perinatal injuries. JAMA. 1992;267(10):1359–1363.
- , , . Why do people sue doctors? A study of patients and relatives taking legal action. Lancet. 1994;343(8913):1609–1613.
- , , , , . Physician‐patient communication. The relationship with malpractice claims among primary care physicians and surgeons. JAMA. 1997;277(7):553–559.
- , , , . Medical errors related to discontinuity of care from an inpatient to an outpatient setting. J Gen Intern Med. 2003;18(8):646–651.
- , . The ethics of the hospitalist model. J Hosp Med. 2010;5(3):183–188.
- , , , et al. Missed and delayed diagnoses in the ambulatory setting: a study of closed malpractice claims. Ann Intern Med. 2006;145(7):488–496.
- , , , , , . Learning from malpractice claims about negligent, adverse events in primary care in the United States. Qual Saf Health Care. 2004;13(2):121–126.
- , , , et al. Primary care closed claims experience of Massachusetts malpractice insurers. JAMA Intern Med. 2013;173(22):2063–2068.
- , , , et al. Hospital volume and surgical mortality in the United States. N Engl J Med. 2002;346(15):1128–1137.
- , , , et al. Hospital volume and 30‐day mortality for three common medical conditions. N Engl J Med. 2010;362(12):1110–1118.
- , , , , , . Outcomes of care by hospitalists, general internists, and family physicians. N Engl J Med. 2007;357(25):2589–2600.
- , , , et al. Quality of care for decompensated heart failure: comparable performance between academic hospitalists and non‐hospitalists. J Gen Intern Med. 2008;23(9):1399–1406.
© 2014 Society of Hospital Medicine
Cost‐Related Medication Underuse
The affordability of prescription medications continues to be one of the most pressing public health issues in the United States. Many patients reduce their prescribed doses to make medications last longer or do not fill prescriptions because of cost.1 Cost‐related medication underuse affects patients with and without drug insurance coverage,2 and is likely to become even more problematic as employers scale back on drug benefits3 and drug prices continue to increase.4 The landmark Patient Protection and Affordability Act passed in March 2010 does little to address this issue.5
Existing estimates of cost‐related medication underuse come largely from surveys of ambulatory patients. For example, using data from the Medicare Current Beneficiary Survey, Maden et al. estimated that 11% to 15% of patients reduced medication use in the past year because of cost.6 Tseng and colleagues found very similar rates of cost‐related underuse in managed care beneficiaries with diabetes.7
Hospitalized patients, who have a high burden of disease and tend to use more medications than their ambulatory counterparts, may be particularly vulnerable to cost‐related underuse but, thus far, have been subject to little investigation. New medications, which are frequently prescribed at the time of discharge, may exacerbate these issues further and contribute to preventable readmissions. Accordingly, we surveyed a cohort of medical inpatients at a large academic medical center to estimate the prevalence and predictors of cost‐related medication underuse for hospitalized managed care patients, and to identify strategies that patients perceive as helpful to make medications more affordable.
METHODS
Study Sample
We identified consecutive patients newly admitted to the general medicine, cardiology, or oncology services at Brigham and Women's Hospital from November 2008 to December 2009. For our survey, we included only those patients who received medical benefits through 1 of 3 large insurers with whom our hospital has pay‐for‐performance contracts. Annually, there are approximately 4000 patients covered by these insurers admitted to the 3 clinical services we evaluated, We focused on patients who had a primary care physician at one of the hospital's outpatient practices because of the existence of an automated infrastructure to identify these managed care beneficiaries of these insurers who are newly hospitalized, and because patients covered by commercial insurance plans likely represent a conservative lower‐bound of cost‐related medication underuse among hospitalized patients.
Patients were surveyed on the first non‐holiday weekday after admission. We excluded patients who had been discharged prior to the daily admission list being generated, or who, on a previous admission, had completed our survey or declined to be surveyed. We also excluded several patients who were not beneficiaries of the target insurers and were erroneously included on the managed care admission roster.
Potentially eligible patients were approached on the hospital ward by 1 of 3 study care coordinators (2 nurses and 1 pharmacist) and were asked if they were willing to participate in a research project about medication use that involved a short verbally delivered in‐person (inpatient) survey, a brief postdischarge telephone call, and a review of their electronic health record. The Institutional Review Board of Brigham and Women's Hospital approved this study.
Inpatient Survey
Our survey instrument was developed iteratively and pilot‐tested to improve face validity. Questions about cost‐related underuse were based on validated measures.8, 9 Specifically, we asked whether in the past year patients had: (1) not filled a prescription because it was too expensive, (2) skipped doses to make medicines last longer, (3) took less medicine than prescribed to make the medicine last longer, or (4) split pills to make the medication last longer.
Questions about strategies to improve medication affordability assessed whether patients thought it would be helpful to: (1) discuss medication affordability with healthcare workers (inpatient doctors, outpatient doctors, nurses, pharmacists, or social workers); (2) have their medications reviewed by a nurse or pharmacist; (3) receive information about lower cost but equally effective medication options, or about programs that provide medications at reduced costs; and/or (4) have their copayments/coinsurance lowered. Possible responses to all of these questions were binary, ie, yes or no.
In addition, patients were asked about the nature of their drug insurance coverage, the prescription medications that they currently use, whether they know their copayment levels (for generic and brand‐name medications), and, if so, what these amounts were, their annual household income, and their self‐identified race. Information on patient age, gender, and the primary reason for hospitalization was obtained from the electronic health record. This source was also used to verify the accuracy of the self‐reported preadmission medication list. When there were discrepancies between preadmission medications reported by patients and those recorded in their chart, the later was used because our hospital reconciles and records all medications at the time of hospital admission for all patients.
Postdischarge Survey
Within 3 days of discharge, patients were contacted by telephone and asked about new medications they were prescribed on discharge, if any. The discharge summary was used to verify the accuracy of the information provided by patients. The interviewers clarified any apparent discrepancies between the 2 sources of information with the patient. Patients who had been prescribed a new medication were asked whether or not they had filled their prescription. For patients who had, we asked whether: (1) they knew how much they would have to pay prior to going to the pharmacy, (2) they had discussed less expensive options with their pharmacist, and (3) they had discussed medication costs with their inpatient or outpatient physicians.
Data Analysis
We used descriptive statistics to summarize the characteristics of our respondents and our overall survey results. We generated univariate and multivariable logistic regression models to identify whether prehospitalization cost‐related medication underuse was influenced by patient age, gender, income, race, and the number of medications patients used on a regular basis. For the purpose of these analyses, we classified patients as reporting cost‐related underuse if they responded yes to any of the 4 strategies described above (ie, not filling medications, skipping doses, taking less medication, or splitting pills to make medicines last longer). Patients whose incomes were above the median level in our cohort were categorized as being of high‐income. Our multivariable model had a c‐statistic of 0.75, suggesting good discriminative ability.
RESULTS
During the study period, 483 potentially‐eligible patients were admitted to the general medicine, cardiology, and oncology services. We excluded 167 because they had been discharged prior to being identified, had been surveyed or already declined participation on a prior admission, or were not managed care enrollees (see Appendix A). Of the remaining 316 subjects, 130 participated in the inpatient survey (response rate = 41%); 93 (75%) of these patients were reached by telephone after hospital discharge and completed the postdischarge survey. The baseline characteristics of our respondents are presented in Table 1. Patients had a mean age of 52 years, were 50% male and two‐thirds of white race, represented a range of household incomes, and almost all had employer‐sponsored prescription coverage. Prior to admission, patients took an average of 5 prescription medications and paid an average copayment of $10.80 and $21.60 for each generic and brand‐name prescription, respectively.
| Characteristic | N = 130 |
|---|---|
| |
| Age, mean years (SD) | 52 (11.2) |
| Male, % | 65 (50.0) |
| Race/ethnicity,* n (%) | |
| Caucasian/white | 84 (67.2) |
| Black/African American | 20 (16.0) |
| Latino/Hispanic | 13 (10.4) |
| Asian | 3 (2.4) |
| American Indian or Alaska Native | 1 (0.8) |
| Other | 4 (3.2) |
| Annual household income,* n (%) | |
| <$30,000 | 15 (12.8) |
| $30,000‐$75,000 | 49 (41.9) |
| >$75,000 | 53 (45.3) |
| Insurance coverage for outpatient prescription drugs,* n (%) | |
| Employer or spouse's employer | 123 (96.0) |
| Independent | 5 (3.9) |
| Medication copayments,* mean $ (SD) | |
| Brand‐name medications | 21.6 (14.2) |
| Generic medications | 10.8 (6.0) |
| No. of medications prior to admission, mean (SD) | 5.5 (4.3) |
| Category of discharge diagnosis, n (%) | |
| Cardiovascular | 40 (30.8) |
| Gastrointestinal | 23 (17.7) |
| Pulmonary | 23 (17.7) |
| Infectious | 13 (10.0) |
| Oncology | 5 (3.8) |
| Renal | 6 (4.6) |
| Psychiatric | 3 (2.3) |
| Hematologic | 4 (3.1) |
| Neurologic | 5 (3.8) |
| Musculoskeletal | 5 (3.8) |
| Respiratory | 2 (1.5) |
| Endocrine | 1 (0.8) |
Cost‐Related Medication Underuse
Thirty (23%) of the survey respondents reported at least 1 cost‐related medication underuse strategy in the year prior to their hospital admission (Figure 1), most commonly not filling a prescription at all because of cost (n = 26; 20%). Rates of cost‐related underuse were highest for patients of black race, low income, and women (Figure 2).
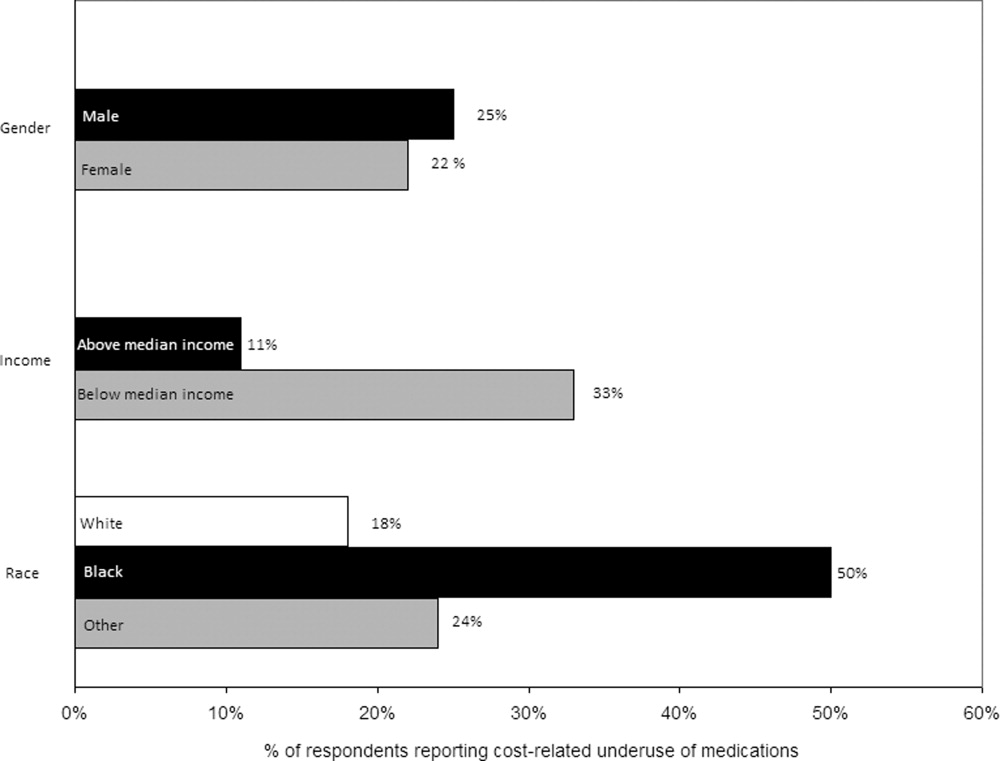
In unadjusted analyses, black respondents had 4.60 (95% confidence interval [CI], 1.63 to 13.0) times the odds of reporting cost‐related underuse than non‐Hispanic white respondents (Table 2). The association of black race and cost‐related underuse appears to be confounded, in part, by income (adjusted odds ratio for black race was 4.16; 95% CI, 1.34 to 12.86) and the number of medications patients used on a regular basis (adjusted odds ratio for black race was 4.14; 95% CI, 1.44 to 11.96). After controlling for these variables, as well as age and gender, the relationship between race and cost‐related underuse remained statistically significant (adjusted odds ratio 3.39; 95% CI, 1.05 to 11.02) (Table 2).
| Predictor | Unadjusted Odds Ratio (95% CI) | Adjusted Odds Ratio (95% CI) |
|---|---|---|
| ||
| Age (per additional year) | 0.98 (0.941.02) | 0.97 (0.931.01) |
| Male (vs female) | 0.84 (0.371.90) | 1.03 (0.432.48) |
| Race (vs white race) | ||
| Black | 4.60 (1.6313.0) | 3.39 (1.0511.02) |
| Other | 1.10 (0.363.37) | 0.77 (0.202.99) |
| No. of medications (per additional medication) | 1.10 (1.001.20) | 1.10 (1.001.22) |
| High income (vs low income) | 0.62 (0.271.42) | 0.71 (0.242.07) |
Strategies to Help Make Medications More Affordable
Virtually all respondents (n = 123; 95%) endorsed at least one of the proposed strategies to make medications more affordable (Figure 3). A majority felt that lowering cost sharing (94%), or receiving information about lower‐cost medication options (83%) or programs to subsidize medication costs (83%) would be helpful. Approximately 70% of patients stated that speaking to their outpatient physicians might be helpful, although only 14% reported actually speaking with their primary care provider about medication costs in the past year. Results were mixed for other strategies, including speaking with their inpatient physicians.
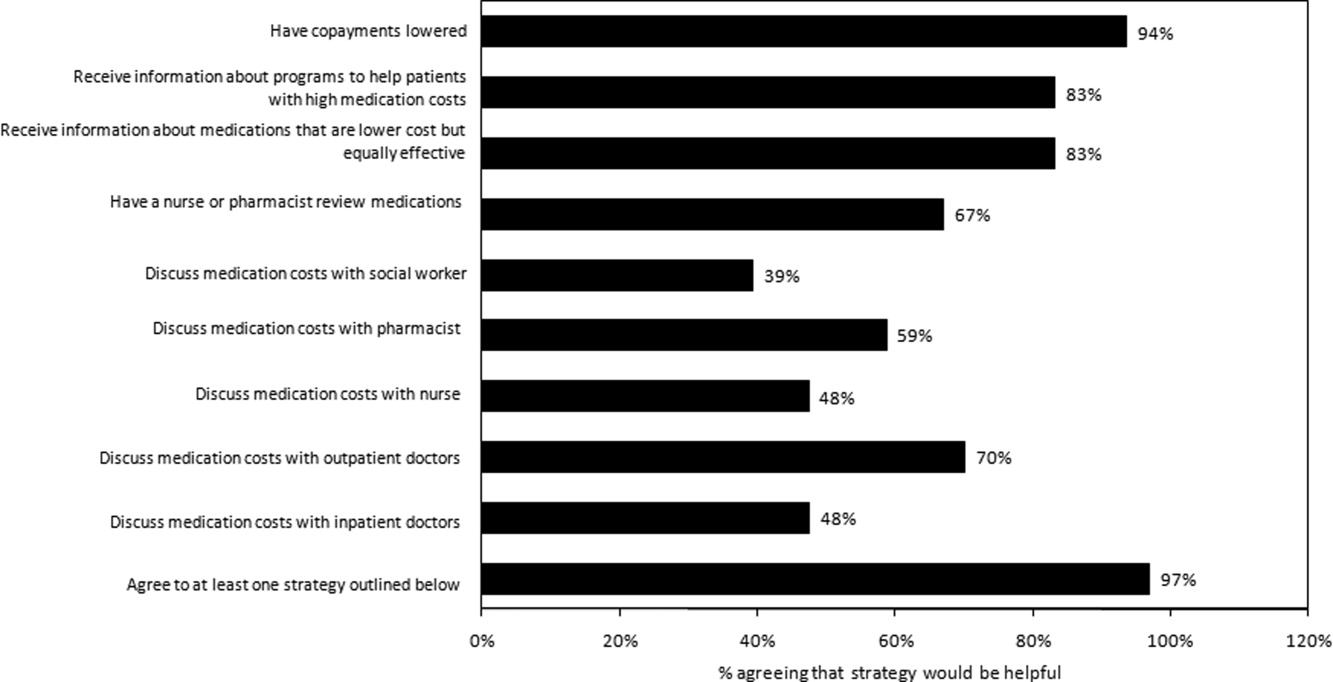
Postdischarge Medication Use
Seventy‐six (82%) respondents to the outpatient survey were prescribed a new medication at the time of hospital discharge, and virtually all (95%) had filled prescriptions for these medications by the time of the follow‐up survey. Patients paid an average of $27.63 (standard deviation $39.24) in out‐of‐pocket costs for these medications. Few (16%) patients knew how much they would have to pay before they had gone to the pharmacy to fill their prescription (see Appendix B). Even fewer patients asked, or were spoken to by their pharmacist, about less expensive medication options (7%), and almost none had spoken to their inpatient (4%) or outpatient providers (2%) about the cost of their newly prescribed drugs.
DISCUSSION
Almost a quarter of the medical inpatients we surveyed had not filled a medication because of cost, or had skipped doses, reduced dosages, or split pills to make their medicines last longer in the prior year. This amount is larger than that found in many prior studies, conducted in outpatient settings, in which 11% to 19% of patients report cost‐related underuse.68, 10, 11 Our results are particularly striking considering that our study cohort consisted exclusively of patients with commercial health insurance, the vast majority of whom also had employer‐sponsored drug coverage. Cost‐related medication underuse may be even more prevalent among hospitalized patients with less generous benefits, including the uninsured and perhaps even beneficiaries of Medicare Part D.
Reductions in medication use because of cost were particularly high among black patients, whose odds of reporting cost‐related underuse were more than 3 times higher than that of patients of non‐Hispanic white race. Race‐related differences in cost‐related underuse have been observed in outpatient studies,68, 12 and may be an important contributor to racial disparities in evidence‐based medication use.1315 These differences may, in part, reflect racial variations in socioeconomic status; lower income patients, who are more likely to be from a racial or ethnic minority, are more sensitive to cost sharing than higher income individuals.16 Consistent with this, the relationship between race and cost‐related underuse in our study was smaller but still highly significant in multivariable models that adjusted for income.
Not surprisingly, the underuse of effective prescription medications is associated with adverse clinical and economic consequences.17 Heisler et al. found that patients who had restricted medications because of cost were 76% more likely to report a decline in their health status than those who had not.18 The health effects of cost‐related underuse are likely to be particularly significant for hospitalized patients, given their high burden of disease and the frequency with which they are prescribed medications at discharge to treat the condition that led to their initial hospitalization. Thus, targeting efforts to address cost‐related underuse patients who are hospitalized may be an efficient method of improving patient health and reducing preventable readmissions. This is consistent with efforts that address, in the inpatient setting, other health issues that are commonly encountered in the ambulatory arena, such as immunizations and smoking cessation.19
Our survey respondents endorsed numerous strategies as being potentially helpful. Predictably, support for lowering copayments was extremely high. While this may not be practical or even desirable for some medications, lowering copayments for highly effective medications, such as statins and antihypertensives, in the context of value‐based insurance design, is an increasingly adopted strategy that has the potential to simultaneously improve clinical outcomes and reduce overall health spending.20, 21
While the majority of patients felt that talking to their outpatient physicians or pharmacists about medication costs might be helpful, the effectiveness of this strategy is unclear. Consistent with prior results,22, 23 the vast majority of the patients we surveyed had not discussed medication costs prior to their admission or after filling newly prescribed medications. Further, although physicians could help reduce drug expenditures in a variety of ways, including the increased ordering of generic drugs,24 many physicians are uncomfortable talking to their patients about costs,25 have limited knowledge about their patients' out‐of‐pocket expenditures, feel that addressing this issue is not their responsibility,26 or do not have resources, such as electronic formulary information, that could facilitate these discussions in an efficient manner.
An alternative strategy may be to provide patients with better education about medication costs. Virtually none of the patients we surveyed knew how much they would pay for their new prescriptions before visiting the pharmacy. These findings are similar to those observed in the outpatient setting,27 and suggest an opportunity to provide patients with information about the cost of their newly and previously prescribed drugs, and to facilitate discussions between patients and inpatient providers about predischarge prescribing decisions, in the same spirit as other predischarge patient education.28 Of course, issues related to transitions of care between the hospital and community setting, and coordination between inpatient and outpatient providers, must be adequately addressed for this strategy to be effective.
Our study has several notable limitations. It had a relatively small sample size and low response rate. Respondents may have differed systematically from non‐respondents, and we were unable to compare the characteristics of both populations. Further, we studied commercially insured inpatients on internal medicine services at an academic medical center, and thus our results may not be generalizable to patients hospitalized in other settings, or with different types of insurance coverage, including the uninsured. The primary outcome of our study was to determine self‐reported cost‐related underuse. While we used validated measures,8 it is possible that patients who reported reducing their medication use in response to cost may not have actually done so. We did not collect information on education or health literacy, nor did we have access to detailed information about our respondents' pharmacy benefit design structures; these important factors may have confounded our analyses, and/or may have been mediators of our observed results, and should be evaluated further in future studies. We did not have adequate statistical power to evaluate whether patients using specific classes of medications were particularly prone to cost‐related underuse.
Despite these limitations, our study is the first, to our knowledge, to evaluate the impact of medication costs on use in a cohort of hospitalized individuals. The high levels of cost‐related underuse that we observed is concerning. Our results support calls for the further development of interventions to address high medication costs and for the consideration of novel approaches to assist patients around the time of hospital discharge.
APPENDICES
APPENDIX A. Survey response flow diagram.
APPENDIX B. Behaviors to address the cost of medications prescribed at hospital discharge.
- USA Today/Kaiser Family Foundation/Harvard School of Public Health.The Public on Prescription Drugs and Pharmaceutical Companies.2008. Available at: http://www.kff.org/kaiserpolls/pomr030408pkg.cfm. Accessed September 5, 2008.
- ,,, et al.Pharmacy benefits and the use of drugs by the chronically ill.JAMA.2004;291(19):2344–2350.
- Kaiser Family Foundation and Health Research and Educational Trust.Employer Health Benefits Annual Survey,2009.year="2009"2009. Available at: http://ehbs.kff.org/pdf/2009/7936.pdf. Accessed May 5,year="2010"2010.
- Kaiser Family Foundation.Prescription Drug Trends.2007. Available at: http://www.kff.org/rxdrugs/upload/3057_06.pdf. Accessed December 5,year="2007"2007.
- The Patient Protection and Affordable Care Act, H.R. 3590, Section 2713 (c).Washington, DC:111 Congress;2010.
- ,,, et al.Cost‐related medication nonadherence and spending on basic needs following implementation of Medicare Part D.JAMA.2008;299(16):1922–1928.
- ,,, et al.Race/ethnicity and economic differences in cost‐related medication underuse among insured adults with diabetes: the Translating Research Into Action for Diabetes Study.Diabetes Care.2008;31(2):261–266.
- ,,, et al.Cost‐related medication nonadherence among elderly and disabled Medicare beneficiaries: a national survey 1 year before the Medicare drug benefit.Arch Intern Med.2006;166(17):1829–1835.
- ,,, et al.Prescription drug coverage and seniors: findings from a 2003 national survey.Health Aff (Millwood). Jan‐Jun 2005;Suppl Web Exclusives: W5‐152‐W155‐166.
- ,,.Cost‐related medication underuse among chronically ill adults: the treatments people forgo, how often, and who is at risk.Am J Public Health.2004;94(10):1782–1787.
- ,,.Problems paying out‐of‐pocket medication costs among older adults with diabetes.Diabetes Care.2004;27(2):384–391.
- ,,.Race/ethnicity and nonadherence to prescription medications among seniors: results of a national study.J Gen Intern Med.2007;22(11):1572–1578.
- ,,,,,.Long‐term persistence in use of statin therapy in elderly patients.JAMA.2002;288(4):455–461.
- ,,, et al.Predictors of adherence with antihypertensive and lipid‐lowering therapy.Arch Intern Med.2005;165(10):1147–1152.
- ,,,.Racial disparities in the quality of medication use in older adults: baseline findings from a longitudinal study.J Gen Intern Med.2010;25(3)228–234.
- ,,,,,.Effects of increased patient cost sharing on socioeconomic disparities in health care.J Gen Intern Med.2008;23(8):1131–1136.
- .Relationship between high cost sharing and adverse outcomes: a truism that's tough to prove.Am J Manag Care.2010;16(4):287–289.
- ,,,,,.The health effects of restricting prescription medication use because of cost.Med Care.2004;42(7):626–634.
- ,.Smoking cessation initiated during hospital stay for patients with coronary artery disease: a randomized controlled trial.Can Med Assoc J.2009;180(13):1297–1303.
- .Copayment levels and medication adherence: less is more.Circulation.2009;119(3):365–367.
- ,,,,.Cost‐effectiveness of providing full drug coverage to increase medication adherence in post‐myocardial infarction Medicare beneficiaries.Circulation.2008;117(10):1261–1268.
- ,,.Cost‐related medication underuse: do patients with chronic illnesses tell their doctors?Arch Intern Med.2004;164(16):1749–1755.
- ,,.Patient‐physician communication about out‐of‐pocket costs.JAMA.2003;290(7):953–958.
- ,,,,.Patients' perceptions of generic medications.Health Aff (Millwood).2009;28(2):546–556.
- ,,.Physician strategies to reduce patients' out‐of‐pocket prescription costs.Arch Intern Med.2005;165(6):633–636.
- ,,, et al.Physicians' perceived knowledge of and responsibility for managing patients' out‐of‐pocket costs for prescription drugs.Ann Pharmacother.2006;40(9):1534–1540.
- ,,, et al.The effect of pharmacy benefit design on patient‐physician communication about costs.J Gen Intern Med.2006;21(4):334–339.
- ,,,.Discharge education improves clinical outcomes in patients with chronic heart failure.Circulation.2005;111(2):179–185.
The affordability of prescription medications continues to be one of the most pressing public health issues in the United States. Many patients reduce their prescribed doses to make medications last longer or do not fill prescriptions because of cost.1 Cost‐related medication underuse affects patients with and without drug insurance coverage,2 and is likely to become even more problematic as employers scale back on drug benefits3 and drug prices continue to increase.4 The landmark Patient Protection and Affordability Act passed in March 2010 does little to address this issue.5
Existing estimates of cost‐related medication underuse come largely from surveys of ambulatory patients. For example, using data from the Medicare Current Beneficiary Survey, Maden et al. estimated that 11% to 15% of patients reduced medication use in the past year because of cost.6 Tseng and colleagues found very similar rates of cost‐related underuse in managed care beneficiaries with diabetes.7
Hospitalized patients, who have a high burden of disease and tend to use more medications than their ambulatory counterparts, may be particularly vulnerable to cost‐related underuse but, thus far, have been subject to little investigation. New medications, which are frequently prescribed at the time of discharge, may exacerbate these issues further and contribute to preventable readmissions. Accordingly, we surveyed a cohort of medical inpatients at a large academic medical center to estimate the prevalence and predictors of cost‐related medication underuse for hospitalized managed care patients, and to identify strategies that patients perceive as helpful to make medications more affordable.
METHODS
Study Sample
We identified consecutive patients newly admitted to the general medicine, cardiology, or oncology services at Brigham and Women's Hospital from November 2008 to December 2009. For our survey, we included only those patients who received medical benefits through 1 of 3 large insurers with whom our hospital has pay‐for‐performance contracts. Annually, there are approximately 4000 patients covered by these insurers admitted to the 3 clinical services we evaluated, We focused on patients who had a primary care physician at one of the hospital's outpatient practices because of the existence of an automated infrastructure to identify these managed care beneficiaries of these insurers who are newly hospitalized, and because patients covered by commercial insurance plans likely represent a conservative lower‐bound of cost‐related medication underuse among hospitalized patients.
Patients were surveyed on the first non‐holiday weekday after admission. We excluded patients who had been discharged prior to the daily admission list being generated, or who, on a previous admission, had completed our survey or declined to be surveyed. We also excluded several patients who were not beneficiaries of the target insurers and were erroneously included on the managed care admission roster.
Potentially eligible patients were approached on the hospital ward by 1 of 3 study care coordinators (2 nurses and 1 pharmacist) and were asked if they were willing to participate in a research project about medication use that involved a short verbally delivered in‐person (inpatient) survey, a brief postdischarge telephone call, and a review of their electronic health record. The Institutional Review Board of Brigham and Women's Hospital approved this study.
Inpatient Survey
Our survey instrument was developed iteratively and pilot‐tested to improve face validity. Questions about cost‐related underuse were based on validated measures.8, 9 Specifically, we asked whether in the past year patients had: (1) not filled a prescription because it was too expensive, (2) skipped doses to make medicines last longer, (3) took less medicine than prescribed to make the medicine last longer, or (4) split pills to make the medication last longer.
Questions about strategies to improve medication affordability assessed whether patients thought it would be helpful to: (1) discuss medication affordability with healthcare workers (inpatient doctors, outpatient doctors, nurses, pharmacists, or social workers); (2) have their medications reviewed by a nurse or pharmacist; (3) receive information about lower cost but equally effective medication options, or about programs that provide medications at reduced costs; and/or (4) have their copayments/coinsurance lowered. Possible responses to all of these questions were binary, ie, yes or no.
In addition, patients were asked about the nature of their drug insurance coverage, the prescription medications that they currently use, whether they know their copayment levels (for generic and brand‐name medications), and, if so, what these amounts were, their annual household income, and their self‐identified race. Information on patient age, gender, and the primary reason for hospitalization was obtained from the electronic health record. This source was also used to verify the accuracy of the self‐reported preadmission medication list. When there were discrepancies between preadmission medications reported by patients and those recorded in their chart, the later was used because our hospital reconciles and records all medications at the time of hospital admission for all patients.
Postdischarge Survey
Within 3 days of discharge, patients were contacted by telephone and asked about new medications they were prescribed on discharge, if any. The discharge summary was used to verify the accuracy of the information provided by patients. The interviewers clarified any apparent discrepancies between the 2 sources of information with the patient. Patients who had been prescribed a new medication were asked whether or not they had filled their prescription. For patients who had, we asked whether: (1) they knew how much they would have to pay prior to going to the pharmacy, (2) they had discussed less expensive options with their pharmacist, and (3) they had discussed medication costs with their inpatient or outpatient physicians.
Data Analysis
We used descriptive statistics to summarize the characteristics of our respondents and our overall survey results. We generated univariate and multivariable logistic regression models to identify whether prehospitalization cost‐related medication underuse was influenced by patient age, gender, income, race, and the number of medications patients used on a regular basis. For the purpose of these analyses, we classified patients as reporting cost‐related underuse if they responded yes to any of the 4 strategies described above (ie, not filling medications, skipping doses, taking less medication, or splitting pills to make medicines last longer). Patients whose incomes were above the median level in our cohort were categorized as being of high‐income. Our multivariable model had a c‐statistic of 0.75, suggesting good discriminative ability.
RESULTS
During the study period, 483 potentially‐eligible patients were admitted to the general medicine, cardiology, and oncology services. We excluded 167 because they had been discharged prior to being identified, had been surveyed or already declined participation on a prior admission, or were not managed care enrollees (see Appendix A). Of the remaining 316 subjects, 130 participated in the inpatient survey (response rate = 41%); 93 (75%) of these patients were reached by telephone after hospital discharge and completed the postdischarge survey. The baseline characteristics of our respondents are presented in Table 1. Patients had a mean age of 52 years, were 50% male and two‐thirds of white race, represented a range of household incomes, and almost all had employer‐sponsored prescription coverage. Prior to admission, patients took an average of 5 prescription medications and paid an average copayment of $10.80 and $21.60 for each generic and brand‐name prescription, respectively.
| Characteristic | N = 130 |
|---|---|
| |
| Age, mean years (SD) | 52 (11.2) |
| Male, % | 65 (50.0) |
| Race/ethnicity,* n (%) | |
| Caucasian/white | 84 (67.2) |
| Black/African American | 20 (16.0) |
| Latino/Hispanic | 13 (10.4) |
| Asian | 3 (2.4) |
| American Indian or Alaska Native | 1 (0.8) |
| Other | 4 (3.2) |
| Annual household income,* n (%) | |
| <$30,000 | 15 (12.8) |
| $30,000‐$75,000 | 49 (41.9) |
| >$75,000 | 53 (45.3) |
| Insurance coverage for outpatient prescription drugs,* n (%) | |
| Employer or spouse's employer | 123 (96.0) |
| Independent | 5 (3.9) |
| Medication copayments,* mean $ (SD) | |
| Brand‐name medications | 21.6 (14.2) |
| Generic medications | 10.8 (6.0) |
| No. of medications prior to admission, mean (SD) | 5.5 (4.3) |
| Category of discharge diagnosis, n (%) | |
| Cardiovascular | 40 (30.8) |
| Gastrointestinal | 23 (17.7) |
| Pulmonary | 23 (17.7) |
| Infectious | 13 (10.0) |
| Oncology | 5 (3.8) |
| Renal | 6 (4.6) |
| Psychiatric | 3 (2.3) |
| Hematologic | 4 (3.1) |
| Neurologic | 5 (3.8) |
| Musculoskeletal | 5 (3.8) |
| Respiratory | 2 (1.5) |
| Endocrine | 1 (0.8) |
Cost‐Related Medication Underuse
Thirty (23%) of the survey respondents reported at least 1 cost‐related medication underuse strategy in the year prior to their hospital admission (Figure 1), most commonly not filling a prescription at all because of cost (n = 26; 20%). Rates of cost‐related underuse were highest for patients of black race, low income, and women (Figure 2).
In unadjusted analyses, black respondents had 4.60 (95% confidence interval [CI], 1.63 to 13.0) times the odds of reporting cost‐related underuse than non‐Hispanic white respondents (Table 2). The association of black race and cost‐related underuse appears to be confounded, in part, by income (adjusted odds ratio for black race was 4.16; 95% CI, 1.34 to 12.86) and the number of medications patients used on a regular basis (adjusted odds ratio for black race was 4.14; 95% CI, 1.44 to 11.96). After controlling for these variables, as well as age and gender, the relationship between race and cost‐related underuse remained statistically significant (adjusted odds ratio 3.39; 95% CI, 1.05 to 11.02) (Table 2).
| Predictor | Unadjusted Odds Ratio (95% CI) | Adjusted Odds Ratio (95% CI) |
|---|---|---|
| ||
| Age (per additional year) | 0.98 (0.941.02) | 0.97 (0.931.01) |
| Male (vs female) | 0.84 (0.371.90) | 1.03 (0.432.48) |
| Race (vs white race) | ||
| Black | 4.60 (1.6313.0) | 3.39 (1.0511.02) |
| Other | 1.10 (0.363.37) | 0.77 (0.202.99) |
| No. of medications (per additional medication) | 1.10 (1.001.20) | 1.10 (1.001.22) |
| High income (vs low income) | 0.62 (0.271.42) | 0.71 (0.242.07) |
Strategies to Help Make Medications More Affordable
Virtually all respondents (n = 123; 95%) endorsed at least one of the proposed strategies to make medications more affordable (Figure 3). A majority felt that lowering cost sharing (94%), or receiving information about lower‐cost medication options (83%) or programs to subsidize medication costs (83%) would be helpful. Approximately 70% of patients stated that speaking to their outpatient physicians might be helpful, although only 14% reported actually speaking with their primary care provider about medication costs in the past year. Results were mixed for other strategies, including speaking with their inpatient physicians.
Postdischarge Medication Use
Seventy‐six (82%) respondents to the outpatient survey were prescribed a new medication at the time of hospital discharge, and virtually all (95%) had filled prescriptions for these medications by the time of the follow‐up survey. Patients paid an average of $27.63 (standard deviation $39.24) in out‐of‐pocket costs for these medications. Few (16%) patients knew how much they would have to pay before they had gone to the pharmacy to fill their prescription (see Appendix B). Even fewer patients asked, or were spoken to by their pharmacist, about less expensive medication options (7%), and almost none had spoken to their inpatient (4%) or outpatient providers (2%) about the cost of their newly prescribed drugs.
DISCUSSION
Almost a quarter of the medical inpatients we surveyed had not filled a medication because of cost, or had skipped doses, reduced dosages, or split pills to make their medicines last longer in the prior year. This amount is larger than that found in many prior studies, conducted in outpatient settings, in which 11% to 19% of patients report cost‐related underuse.68, 10, 11 Our results are particularly striking considering that our study cohort consisted exclusively of patients with commercial health insurance, the vast majority of whom also had employer‐sponsored drug coverage. Cost‐related medication underuse may be even more prevalent among hospitalized patients with less generous benefits, including the uninsured and perhaps even beneficiaries of Medicare Part D.
Reductions in medication use because of cost were particularly high among black patients, whose odds of reporting cost‐related underuse were more than 3 times higher than that of patients of non‐Hispanic white race. Race‐related differences in cost‐related underuse have been observed in outpatient studies,68, 12 and may be an important contributor to racial disparities in evidence‐based medication use.1315 These differences may, in part, reflect racial variations in socioeconomic status; lower income patients, who are more likely to be from a racial or ethnic minority, are more sensitive to cost sharing than higher income individuals.16 Consistent with this, the relationship between race and cost‐related underuse in our study was smaller but still highly significant in multivariable models that adjusted for income.
Not surprisingly, the underuse of effective prescription medications is associated with adverse clinical and economic consequences.17 Heisler et al. found that patients who had restricted medications because of cost were 76% more likely to report a decline in their health status than those who had not.18 The health effects of cost‐related underuse are likely to be particularly significant for hospitalized patients, given their high burden of disease and the frequency with which they are prescribed medications at discharge to treat the condition that led to their initial hospitalization. Thus, targeting efforts to address cost‐related underuse patients who are hospitalized may be an efficient method of improving patient health and reducing preventable readmissions. This is consistent with efforts that address, in the inpatient setting, other health issues that are commonly encountered in the ambulatory arena, such as immunizations and smoking cessation.19
Our survey respondents endorsed numerous strategies as being potentially helpful. Predictably, support for lowering copayments was extremely high. While this may not be practical or even desirable for some medications, lowering copayments for highly effective medications, such as statins and antihypertensives, in the context of value‐based insurance design, is an increasingly adopted strategy that has the potential to simultaneously improve clinical outcomes and reduce overall health spending.20, 21
While the majority of patients felt that talking to their outpatient physicians or pharmacists about medication costs might be helpful, the effectiveness of this strategy is unclear. Consistent with prior results,22, 23 the vast majority of the patients we surveyed had not discussed medication costs prior to their admission or after filling newly prescribed medications. Further, although physicians could help reduce drug expenditures in a variety of ways, including the increased ordering of generic drugs,24 many physicians are uncomfortable talking to their patients about costs,25 have limited knowledge about their patients' out‐of‐pocket expenditures, feel that addressing this issue is not their responsibility,26 or do not have resources, such as electronic formulary information, that could facilitate these discussions in an efficient manner.
An alternative strategy may be to provide patients with better education about medication costs. Virtually none of the patients we surveyed knew how much they would pay for their new prescriptions before visiting the pharmacy. These findings are similar to those observed in the outpatient setting,27 and suggest an opportunity to provide patients with information about the cost of their newly and previously prescribed drugs, and to facilitate discussions between patients and inpatient providers about predischarge prescribing decisions, in the same spirit as other predischarge patient education.28 Of course, issues related to transitions of care between the hospital and community setting, and coordination between inpatient and outpatient providers, must be adequately addressed for this strategy to be effective.
Our study has several notable limitations. It had a relatively small sample size and low response rate. Respondents may have differed systematically from non‐respondents, and we were unable to compare the characteristics of both populations. Further, we studied commercially insured inpatients on internal medicine services at an academic medical center, and thus our results may not be generalizable to patients hospitalized in other settings, or with different types of insurance coverage, including the uninsured. The primary outcome of our study was to determine self‐reported cost‐related underuse. While we used validated measures,8 it is possible that patients who reported reducing their medication use in response to cost may not have actually done so. We did not collect information on education or health literacy, nor did we have access to detailed information about our respondents' pharmacy benefit design structures; these important factors may have confounded our analyses, and/or may have been mediators of our observed results, and should be evaluated further in future studies. We did not have adequate statistical power to evaluate whether patients using specific classes of medications were particularly prone to cost‐related underuse.
Despite these limitations, our study is the first, to our knowledge, to evaluate the impact of medication costs on use in a cohort of hospitalized individuals. The high levels of cost‐related underuse that we observed is concerning. Our results support calls for the further development of interventions to address high medication costs and for the consideration of novel approaches to assist patients around the time of hospital discharge.
APPENDICES
APPENDIX A. Survey response flow diagram.
APPENDIX B. Behaviors to address the cost of medications prescribed at hospital discharge.
- USA Today/Kaiser Family Foundation/Harvard School of Public Health.The Public on Prescription Drugs and Pharmaceutical Companies.2008. Available at: http://www.kff.org/kaiserpolls/pomr030408pkg.cfm. Accessed September 5, 2008.
- ,,, et al.Pharmacy benefits and the use of drugs by the chronically ill.JAMA.2004;291(19):2344–2350.
- Kaiser Family Foundation and Health Research and Educational Trust.Employer Health Benefits Annual Survey,2009.year="2009"2009. Available at: http://ehbs.kff.org/pdf/2009/7936.pdf. Accessed May 5,year="2010"2010.
- Kaiser Family Foundation.Prescription Drug Trends.2007. Available at: http://www.kff.org/rxdrugs/upload/3057_06.pdf. Accessed December 5,year="2007"2007.
- The Patient Protection and Affordable Care Act, H.R. 3590, Section 2713 (c).Washington, DC:111 Congress;2010.
- ,,, et al.Cost‐related medication nonadherence and spending on basic needs following implementation of Medicare Part D.JAMA.2008;299(16):1922–1928.
- ,,, et al.Race/ethnicity and economic differences in cost‐related medication underuse among insured adults with diabetes: the Translating Research Into Action for Diabetes Study.Diabetes Care.2008;31(2):261–266.
- ,,, et al.Cost‐related medication nonadherence among elderly and disabled Medicare beneficiaries: a national survey 1 year before the Medicare drug benefit.Arch Intern Med.2006;166(17):1829–1835.
- ,,, et al.Prescription drug coverage and seniors: findings from a 2003 national survey.Health Aff (Millwood). Jan‐Jun 2005;Suppl Web Exclusives: W5‐152‐W155‐166.
- ,,.Cost‐related medication underuse among chronically ill adults: the treatments people forgo, how often, and who is at risk.Am J Public Health.2004;94(10):1782–1787.
- ,,.Problems paying out‐of‐pocket medication costs among older adults with diabetes.Diabetes Care.2004;27(2):384–391.
- ,,.Race/ethnicity and nonadherence to prescription medications among seniors: results of a national study.J Gen Intern Med.2007;22(11):1572–1578.
- ,,,,,.Long‐term persistence in use of statin therapy in elderly patients.JAMA.2002;288(4):455–461.
- ,,, et al.Predictors of adherence with antihypertensive and lipid‐lowering therapy.Arch Intern Med.2005;165(10):1147–1152.
- ,,,.Racial disparities in the quality of medication use in older adults: baseline findings from a longitudinal study.J Gen Intern Med.2010;25(3)228–234.
- ,,,,,.Effects of increased patient cost sharing on socioeconomic disparities in health care.J Gen Intern Med.2008;23(8):1131–1136.
- .Relationship between high cost sharing and adverse outcomes: a truism that's tough to prove.Am J Manag Care.2010;16(4):287–289.
- ,,,,,.The health effects of restricting prescription medication use because of cost.Med Care.2004;42(7):626–634.
- ,.Smoking cessation initiated during hospital stay for patients with coronary artery disease: a randomized controlled trial.Can Med Assoc J.2009;180(13):1297–1303.
- .Copayment levels and medication adherence: less is more.Circulation.2009;119(3):365–367.
- ,,,,.Cost‐effectiveness of providing full drug coverage to increase medication adherence in post‐myocardial infarction Medicare beneficiaries.Circulation.2008;117(10):1261–1268.
- ,,.Cost‐related medication underuse: do patients with chronic illnesses tell their doctors?Arch Intern Med.2004;164(16):1749–1755.
- ,,.Patient‐physician communication about out‐of‐pocket costs.JAMA.2003;290(7):953–958.
- ,,,,.Patients' perceptions of generic medications.Health Aff (Millwood).2009;28(2):546–556.
- ,,.Physician strategies to reduce patients' out‐of‐pocket prescription costs.Arch Intern Med.2005;165(6):633–636.
- ,,, et al.Physicians' perceived knowledge of and responsibility for managing patients' out‐of‐pocket costs for prescription drugs.Ann Pharmacother.2006;40(9):1534–1540.
- ,,, et al.The effect of pharmacy benefit design on patient‐physician communication about costs.J Gen Intern Med.2006;21(4):334–339.
- ,,,.Discharge education improves clinical outcomes in patients with chronic heart failure.Circulation.2005;111(2):179–185.
Copyright © 2011 Society of Hospital Medicine
