User login
Severe AH Among Inpatients From the ED
Chronic hypertension affects 32% of adults in the United States.1 Each year, over 20 million emergency department visits involve hypertension.2 While many studies describe the epidemiology and outcomes of chronic hypertension, less is known about severe acute hypertension (AH). Often classified as either hypertensive urgency or emergency, it receives little attention in national treatment guidelines.3 There is a limited understanding of the epidemiology of, and the relationship between, this syndrome and patient outcomes among hospitalized patients. One registry study suggested that severe AH was associated with high rates of new organ damage, need for treatment in the intensive care unit, and a 90‐day readmission rate of 10%.4 This investigation, however, lacked generalizability, because it only enrolled subjects requiring therapy with an intravenous antihypertensive agent and did not provide information on the prevalence of severe AH. Qureshi et al.5 analyzed information in a more representative sample from the national hospital ambulatory care survey, however, the only outcome examined was the correlation between acute blood pressure and stroke. Studies focusing on a selected patient population may be of limited value to hospitalists, because they are commonly required to treat a range of patients presenting to the hospital.
In light of severe syndromes that may be associated with, or complicated by, severe AH presented early during acute care, hospitalists require a better understanding of the prevalence and the relationship between severe AH and attendant mortality and morbidity. In addition, an assessment of the association of severe AH on the need for intensive care unit (ICU) admission and mechanical ventilation (MV) may aid the initial treatment assessments and triage decisions required of hospitalists.
Our objective was to describe the prevalence and implications of severe AH present at the time of evaluation in the ED among patients eventually hospitalized, using clinical data collected on all consecutive admissions across a range of clinical conditions. We sought to determine the independent contribution, if any, of severe AH to hospital mortality, need for MV on admission, as well as hospital length of stay (LOS).
METHODS
Study Design and Setting
This was a retrospective analysis of adults admitted to 114 acute‐care hospitals in the United States from 2005 through 2007. The New England Institutional Review Board/Human Subjects Research Committee (Wellesley, MA) reviewed and approved this study. It was conducted in compliance with the Health Insurance Portability and Accountability Act (HIPAA).
Data
Data were obtained from one of the Clinical Research Databases from CareFusion (formerly Cardinal Health [CareFusion Clinical Research Services, Marlborough, MA]).613 The database contains electronically imported or manually extracted demographic, clinical (eg, comorbidities, vital signs, laboratory values, other clinical findings), and administrative data (eg, diagnosis, procedures, and length of hospitalization). All vital signs were manually extracted, including the highest and the lowest ED systolic blood pressure (SBP) measurements during the ED stay, but before inpatient admission. Patients admitted for childbirth or mental health reasons were not included.
Patients
Our main analysis focused on patients whose highest and lowest SBP were collected in the ED. These patients accounted for approximately 90% of all inpatients admitted through the ED. For the approximately 9% of patients who had only 1 SBP collected, we conducted a sensitivity analysis by both including and excluding them in the main analysis to determine if the absence of a second SBP measurement altered our findings. Patients were grouped into 1 of the following 8 mutually exclusive strata based on the maximum SBP (mmHg) in the ED: <100, 101‐139, 140‐180, 181‐190, 191‐200, 201‐210, 211‐220, and >220.
Measures
The primary exposure of interest was the prevalence of severe AH, defined as at least 1 SBP measurement recorded in the ED in excess of 180 mmHg. Outcome measures included in‐hospital mortality, need for MV on admission day (defined by International Classification of Diseases, 9th revision, Clinical Modification [ICD‐9‐CM] procedure codes of 96.70, 96.71, and 96.72), and LOS. We stratified these outcomes for each inpatient admission according to 1 of 112 mutually exclusive groups of principal diagnoses (see Supporting Appendix A in the online version of this article). To simplify the presentations, we pooled the groups into 9 major disease categories based on organ systems.
Primary Data Analysis
All statistical analyses were performed using Statistical Analysis Software (SAS version 9.01; SAS Institute Inc, Cary, NC). For evaluating trending, we used the Cochran‐Armitage test for dichotomous variables (mortality and MV), and linear regression for continuous variable (LOS). We employed a logistic regression model to estimate risk of mortality and need for MV on admission. We used linear regression models to estimate the LOS associated with severe AH. We modeled each outcome as a function of patient disease severity and SBP strata. Because patients with the most severe AH tended to have higher mortality early in hospitalization, our analysis of LOS was limited to patients who survived index hospitalization.
The original disease‐specific risk‐adjustment models accounting for patient‐level confounding risk factors, including demographics, physiologic presentation on admission (vital signs, altered mental status, and laboratory findings), and chronic conditions, were previously developed and validated.12, 13 We recalibrated each of the 112 models, for the current study cohort, using the logit of predicted probability of death generated from the mortality risk‐adjustment model as a propensity score of disease severity. Using this propensity score as an aggregate severity adjuster, we refit 9 logistic regression models (1 for each major disease category) to estimate the odds ratios for mortality or need for MV for each of the 7 SBP strata in the regression models with 101‐139 mmHg as the reference group. To estimate the attributable LOS (if any) of severe AH among survivors, we fit the 9 LOS models using log transformed LOS (to normalize the potentially skewed distribution of LOS) as the outcome, controlling for disease severity. The attributable LOS and 95% confidence intervals (CI) were estimated from 1000 bootstrap iterations, with the median as the parameter estimate and 2.5th and 97.5th percentile as 95% CI.14, 15
Sensitivity Analysis
To address potential bias of LOS associated with inpatient mortality, we refit 9 LOS models, including both patients who died and those who survived the index hospitalization. The models adjusted for disease severity, mortality, and the interaction of severity and mortality. Because patients with only 1 SBP recorded at ED may be different from those with more than 1 SBP recorded, we conducted analysis by adding these patients in the study cohort to examine the potential change of overall prevalence of AH and associated mortality for the study population.
To address the potential for a center‐specific effect on outcomes, we refit all the models using a mixed model approach.16 The mixed model accounts for both patient‐level risk factors and hospital‐specific effects on the observed outcomes.
RESULTS
Patient Characteristics
The study cohort was comprised of 1,290,804 adults who were admitted through the ED, from 2005 through 2007, and whose highest and lowest SBP measurements were collected in the ED. Median age was 69 years (interquartile range, 53‐81) for the overall population. Median age was 74 (interquartile range, 60‐83) for patients with severe AH (Table 1). Hospital mortality was 3.6% (n = 46,033), with 6119 (13.3%) having severe AH.
| Characteristic | Prevalence, n (Column %) | Severe Acute Hypertension, n (Row %) |
|---|---|---|
| Total number of discharges | 1,290,804 (100.0) | 178,197 (13.8) |
| Mortality | 46,033 (3.6) | 6,119 (13.3) |
| Live discharges | 1,244,771 (96.4) | 172,078 (13.8) |
| Mechanical ventilation on admission | 39,238 (3.0) | 9,508 (24.2) |
| Demographics | ||
| Age, median (1st, 3rd quartiles) | 69 (53, 81) | 74 (60, 83) |
| Male | 587,553 (45.5) | 71,085 (12.1) |
| Female | 703,244 (54.5) | 107,109 (15.2) |
| Race | ||
| White | 949,869 (73.6) | 121,930 (12.8) |
| Black | 220,601 (17.1) | 39,667 (18.0) |
| Other | 120,334 (9.3) | 16,600 (13.8) |
| Insurance | ||
| Medicare | 668,420 (51.8) | 105,078 (15.7) |
| Medicaid | 108,538 (8.4) | 12,259 (11.3) |
| Commercial | 163,858 (12.7) | 18,669 (11.4) |
| Other | 349,988 (27.1) | 42,191 (12.1) |
| Disease system by the principal diagnosis | ||
| Nervous system | 76,744 (5.9) | 22,270 (29.0) |
| Respiratory system | 222,329 (17.2) | 24,678 (11.1) |
| Circulatory system | 416,847 (32.3) | 66,852 (16.0) |
| Digestive system | 186,282 (14.4) | 17,817 (9.6) |
| Hepatobiliary/pancreas system | 52,293 (4.1) | 5,664 (10.8) |
| Endocrine system | 45,050 (3.5) | 6,625 (14.7) |
| Kidney/urinary system | 81,782 (6.3) | 11,050 (13.5) |
| Infectious diseases | 60,353 (4.7) | 4,162 (6.9) |
| Other | 149,124 (11.6) | 19,079 (12.8) |
| Comorbidity by secondary diagnoses | ||
| Hypertension | 729,417 (56.5) | 135,498 (18.6) |
| Fluid and electrolyte disorders | 306,666 (23.8) | 37,836 (12.3) |
| Diabetes without chronic complications | 286,912 (22.2) | 47,979 (16.7) |
| Chronic pulmonary disease | 283,895 (22.0) | 35,977 (12.7) |
| Congestive heart failure | 213,523 (16.5) | 33,956 (15.9) |
| Deficiency anemias | 210,230 (16.3) | 30,266 (14.4) |
| Renal failure | 159,409 (12.3) | 31,984 (20.1) |
| Hypothyroidism | 153,911 (11.9) | 22,441 (14.6) |
| Valvular disease | 140,820 (10.9) | 21,453 (15.2) |
| Depression | 137,259 (10.6) | 16,886 (12.3) |
| Other neurological disorders | 126,954 (9.8) | 19,103 (15.0) |
| Peripheral vascular disease | 88,321 (6.8) | 16,180 (18.3) |
| Obesity | 84,000 (6.5) | 12,351 (14.7) |
| Diabetes with chronic complications | 65,989 (5.1) | 13,093 (19.8) |
| Psychoses | 54,769 (4.2) | 5,555 (10.1) |
| Alcohol abuse | 51,765 (4.0) | 6,014 (11.6) |
| Pulmonary circulation disease | 49,248 (3.8) | 7,128 (14.5) |
| Coagulopathy | 43,584 (3.4) | 4,339 (10.0) |
| Paralysis | 42,128 (3.3) | 8,125 (19.3) |
| Drug abuse | 36,134 (2.8) | 4,779 (13.2) |
| Liver disease | 36,094 (2.8) | 3,218 (8.9) |
| Weight loss | 35,795 (2.8) | 3,726 (10.4) |
| Metastatic cancer | 33,517 (2.6) | 2,498 (7.5) |
| Rheumatoid arthritis | 32,545 (2.5) | 4,300 (13.2) |
| Solid tumor without metastasis | 30,677 (2.4) | 3,035 (9.9) |
| Chronic blood loss anemia | 25,416 (2.0) | 2,268 (8.9) |
| Lymphoma | 9,972 (0.8) | 871 (8.7) |
| Acquired immune deficiency syndrome | 3,048 (0.2) | 307 (10.1) |
| Peptic ulcer disease | 915 (0.1) | 131 (14.3) |
| Discharges by hospital characteristics | ||
| Teaching status | ||
| Teaching hospitals | 899,786 (69.7) | 127,512 (14.2) |
| Nonteaching hospitals | 391,018 (30.3) | 50,685 (13.0) |
| Urban status | ||
| Urban hospitals | 1,164,802 (90.2) | 162,399 (13.9) |
| Rural hospitals | 126,002 (9.8) | 15,798 (12.5) |
| Bed size | ||
| Beds <100 | 36,624 (2.8) | 4,965 (13.6) |
| Beds 100‐300 | 623,327 (48.3) | 80,156 (12.9) |
| Beds >300 | 630,853 (48.9) | 93,076 (14.8) |
Prevalence of Acute Hypertension
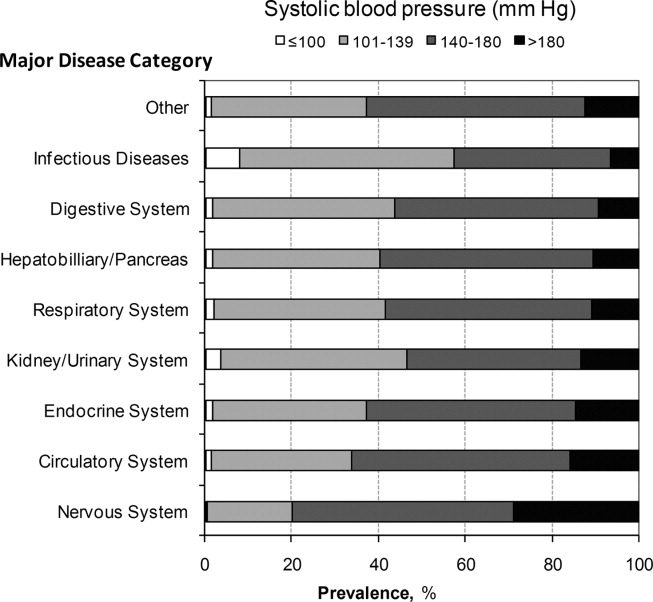
A total of 763,634 (59.2%) patients had at least 1 SBP measurement of 140 mmHg during the ED stay, including 178,197 (13.8%) with SBP >180 mmHg. Body systems associated with the highest prevalence of severe AH (SBP >180 mmHg) were nervous (29.0%), circulatory (16.0%), endocrine (14.7%), and kidney/urinary (13.5%) (Figure 1 presents the data in graphic form; Supporting Appendix B, in the online version of this article, presents corresponding data in table form).
Mortality
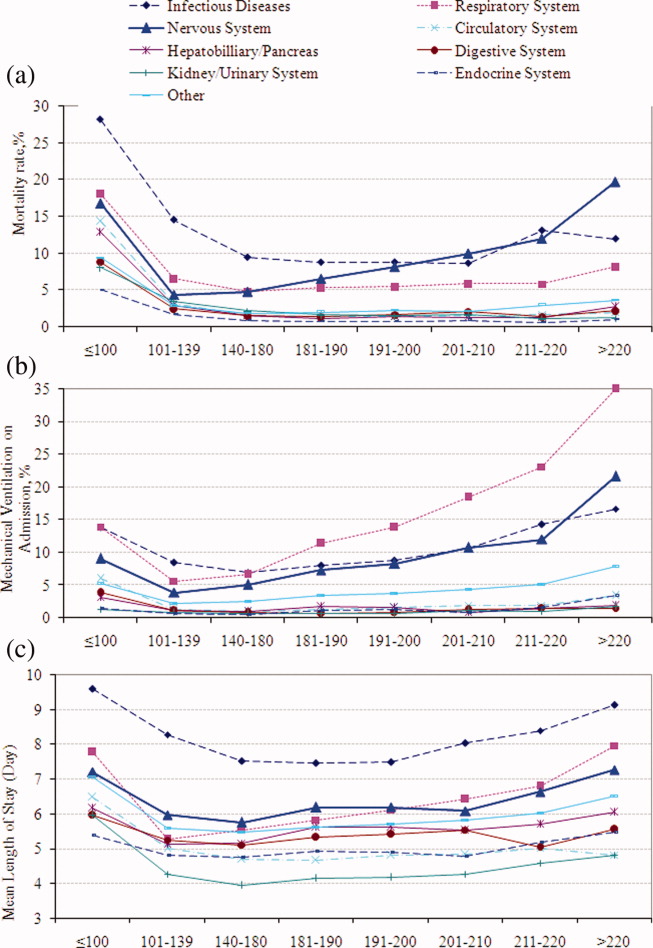
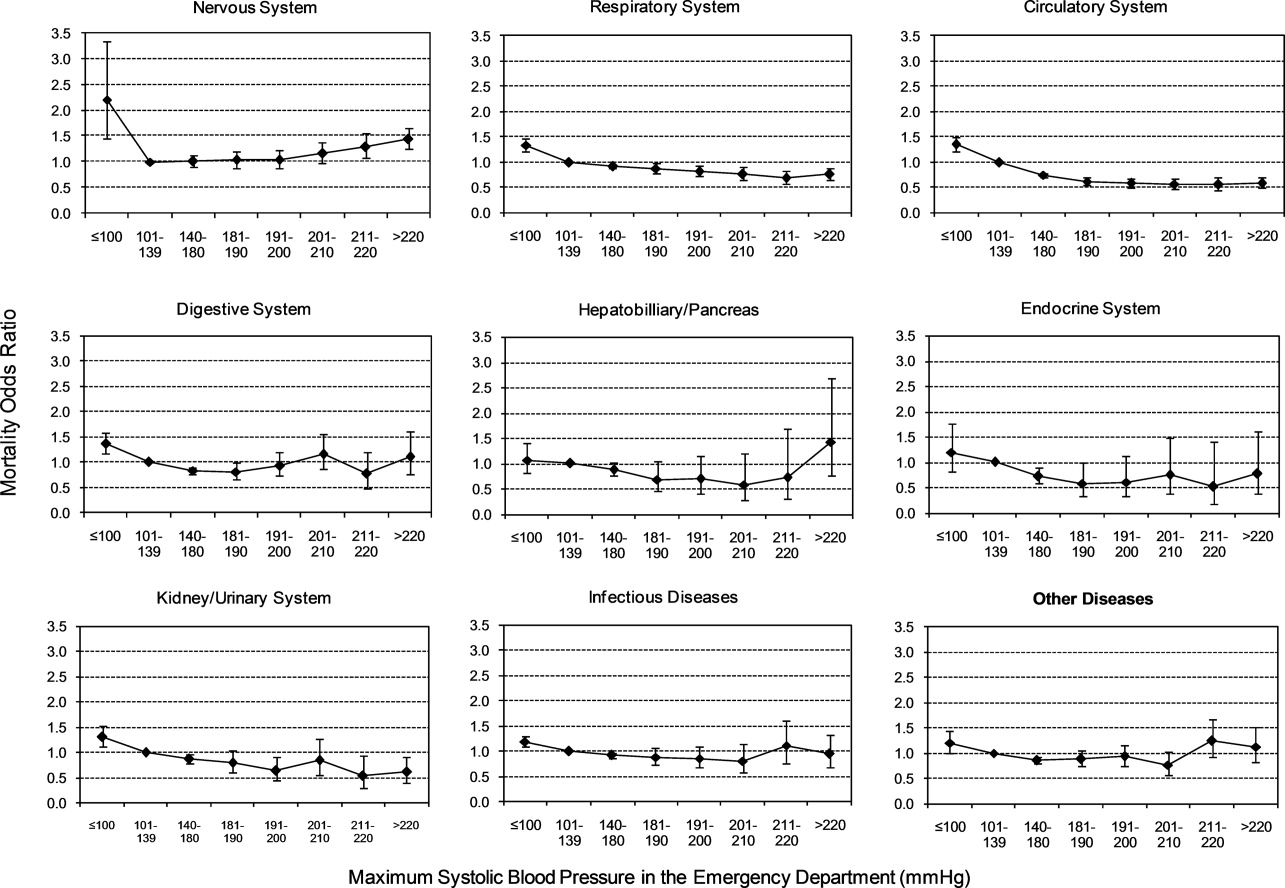
Univariable analysis revealed a graded relationship between SBP stratum and mortality risk (Figure 2a; and see Supporting Appendix C in the online version of this article). This relationship was most pronounced for nervous system diseases; mortality rates for each 10 mmHg increase in SBP from 180 to >220 mmHg were 6.5%, 8.1%, 10.0%, 12.0%, and 19.7%, respectively (trending P < 0.0001). The risk‐adjusted increase in mortality odds ratio ranged from 1.04 (95% CI: 0.89, 1.21) to 1.44 (95% CI: 1.25, 1.67) for patients in the severe AH strata compared to patients with SBP of 101 to 139 mmHg (Figure 3). Severe AH was not an independent mortality predictor in other disease categories.
Mechanical Ventilation on Admission
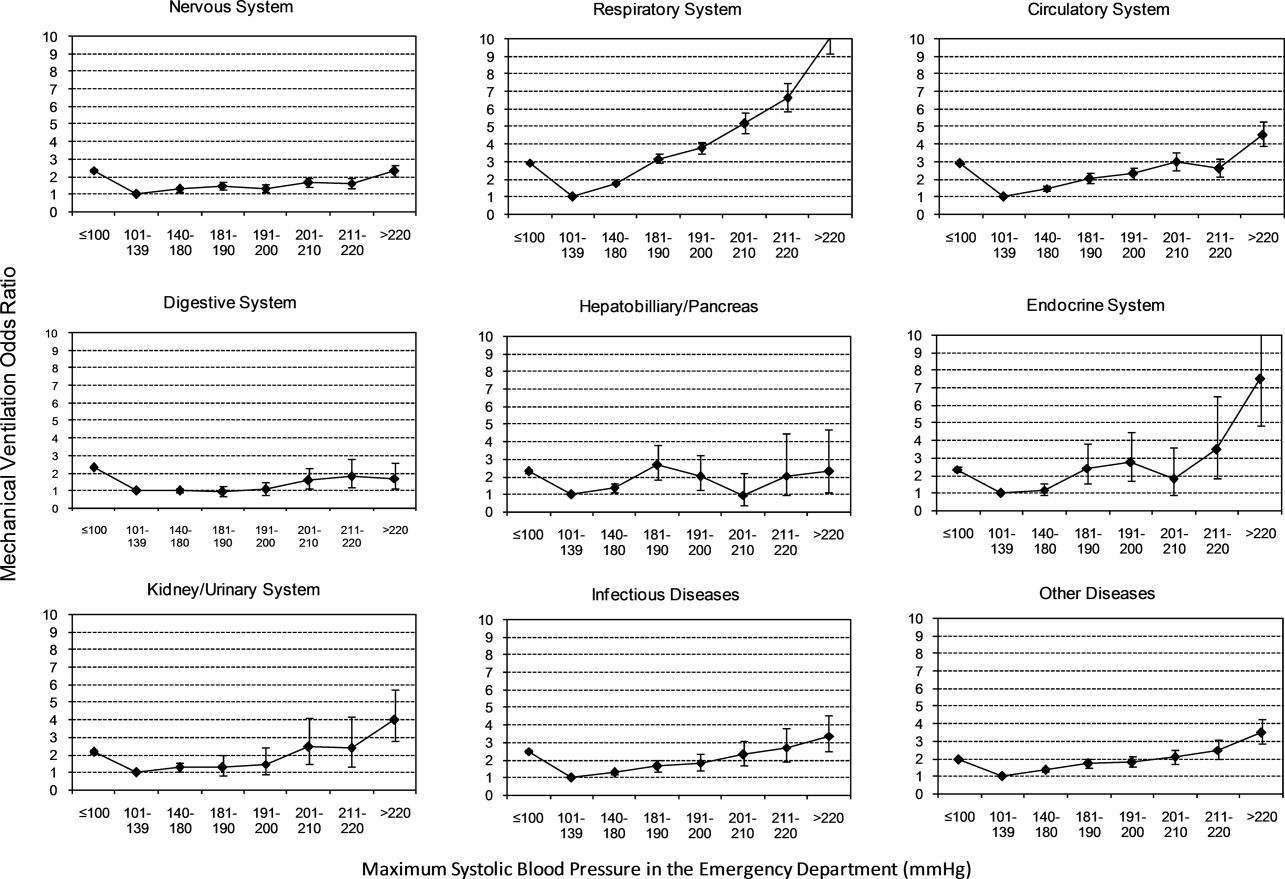
Univariable analysis revealed a graded relationship between severe AH and a need for MV on admission, especially for respiratory, circulatory, and infectious conditions (trending P < 0.0001) (Figure 2b; and see Supporting Appendix C in the online version of this article). In the multivariable analysis, there was a relationship between severe AH stratum and adjusted risk for MV on admission across nearly all disease categories (Figure 4).
Length of Stay
Univariable analysis revealed a graded relationship between severe AH strata and LOS for nearly all disease categories in survivors (trending P < 0.0001), except for digestive, kidney, and infectious diseases (Figure 2c; and see Supporting Appendix C in the online version of this article). For patients with nervous system diseases, the unadjusted LOS for each 10 mmHg increase in SBP from 180 to >220 was 5.8, 6.1, 6.4, 6.8, and 8.0 days, respectively (trending P < 0.0001). The relationship was similar for other disease categories which showed significant trending.
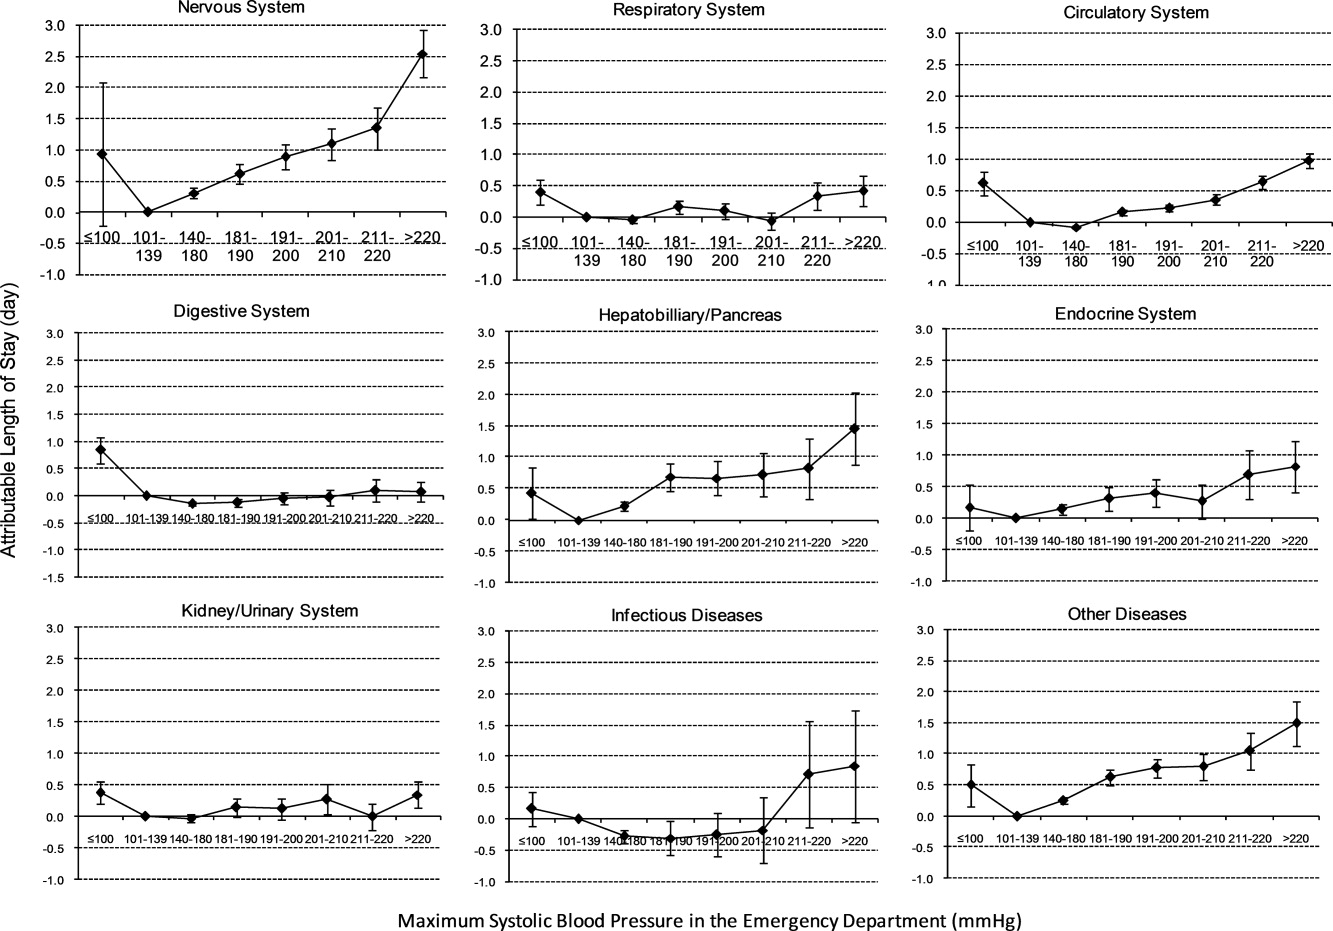
In the multivariable analysis, the relationship between severe AH strata and adjusted attributable LOS was graded across most disease categories, especially nervous, circulatory, and hepatobiliary diseases (Figure 5). The total adjusted number of hospital days attributable to severe AH was 0.43 days per case for all survivors with severe AH.
Sensitivity Analysis
Our sensitivity analysis of the LOS estimate, including those patients who died in the hospital, yielded similar findings in attributable LOS due to severe AH. In addition, when we added patients with only 1 SBP documented in the ED to the study cohort, the severe AH prevalence changed negligibly from 13.8% to 13.0%, and the associated mortality remained unchanged at 3.4%. Models using the mix model approach, which take into account hospital‐specific effects, showed similar results.
DISCUSSION
This large‐scale analysis demonstrated that severe AH was present in 13.8% of inpatients admitted through the ED. The prevalence of severe AH varied based on the primary reason for an acute care admission, ranging from 7% in infectious syndromes to nearly 30% in acute neurologic processes. Specific to patients with neurologic disease, initial severe blood pressure elevations independently correlated with mortality. Severe blood pressure elevations at ED were independently associated with an increased need for MV on admission and a prolonged LOS across a range of disease states.
Prior work on hypertension at admission has generally included single‐center analyses or only focused on patients with specific admitting diagnoses. For example, in a single ED analysis, Tilman et al.17 reported that 16% of 10,000 patients presented with elevated blood pressure (140/90 mmHg). In a multicenter review of 7000 persons, Karras et al.18, 19 described 423 patients with severe AH (180/110 mmHg) who comprised 6% of patients seen in the ED during a 1‐week period. Qureshi et al.5 noted severe AH in 13% of patients with acute stroke. While other ED‐based studies examined all ED patients, including those admitted and discharged from the ED, our study focused on those requiring hospitalization. This disparity in illness severity may, in part, explain the higher prevalence of severe AH we noted relative to others.
We further found that the prevalence of severe AH varied based on admitting diagnosis. This difference in prevalence rates by condition seems clinically plausible. Recognition of this pattern may prove valuable to hospitalists who, by the nature of their responsibilities, will encounter a broad range of patients. Because our data were derived from the largest analysis of blood pressure assessments for ED patients who were eventually hospitalized, and encompassed a multiplicity of hospitals, our findings are likely generalizable. Moreover, our large sample size enabled us to examine severe AH at each 10 mmHg increment across a variety of disease states, rather than restricting our analysis to 1 admitting diagnosis.
The independent relationship between severe blood pressure elevation and mortality was detected only in those with neurologic conditions. Incremental increases in SBP beyond 180 mmHg were associated with a stepwise escalation in the risk for death. Although recognition of the importance of blood pressure management in both ischemic and hemorrhagic stroke remains a cornerstone of therapy for these diseases, the stepwise relationship between escalating blood pressure and outcome suggests that further study is needed to determine the optimal management of severe AH among these patients. This relationship, along with the independent association between severe AH at presentation and the need for MV, underscores the importance of severe AH in critical care, representing a major challenge for intensivists and hospitalists, particularly those who practice in neurologic ICUs.
The independent association of severe AH and prolonged LOS represents a novel finding. Few reports have correlated the initial blood pressure with measures of resource use. Katz et al.4 found a median LOS of 6 days among 1000 patients who presented with severe AH and end organ dysfunction in 25 US hospitals. These investigators, however, did not explore the incremental independent contribution of initial blood pressure to LOS. Biologically, severe hypertension may exacerbate both acute and chronic conditions, thus complicating their management and resulting in longer hospitalizations.
Our analysis has limitations. While exposure misclassification is a potential concern, unlike other population‐based studies that use ICD‐9‐CM codes to identify AH cases, we relied on actual measures of blood pressure to identify subjects, thus minimizing this threat to validity. Similarly, since our end pointsmortality, MV on admission, and LOSwere also objective measures, the probability of their misclassification is minimal.
Another concerning contributor to exposure misclassification is the possibility that, in some instances, the initial elevation in BP meeting the inclusion criteria in our study cohort does not reflect the true BP. Indeed, a substantial body of research about BP measurement in the ED suggests that we may have included some persons who likely did not have AH. For example, Pitts and Adams described a regression to the mean phenomenon, with serial BP measurements in the ED, wherein the BP fell by approximately 11 mmHg over 4 hours.20 Baumann and colleagues reported a similar pattern.21 However, the findings of these 2 analyses do not necessarily apply to our study population; we focused on patients admitted to the hospital with an acute condition, while Pitts and Adams20 and Baumann et al.21 examined all ED patients. This distinction is crucial in that patients not admitted are likely less severely ill and systematically different from those who do merit hospitalization. Moreover, both Pitts and Adams20 and Cienki et al.22 observed that the regression to the mean and fall in serial BP measurements were less pronounced in those with the most extensive BP elevations. In our study, we found the strongest relationship between adverse outcomes and BP in patients with the most extreme BP elevations. Thus, misclassification is perhaps less likely to be an issue for these subjects.
In addition, misclassification may result when initially elevated BP simply represents the impact of untreated pain or anxiety in ED patients. However, Backer et al.23 and Tanabe and colleagues24 specifically explored the impact of pain and anxiety on BP in ED subjects, and neither group found a correlation between BP and either acute pain and/or anxiety scores. Our difficulties with case definitions and BP measurements for severe AH demonstrate the need for the creation and adoption of a formal, systematic approach to this syndrome, along with the need for prospective analyses to confirm our findings.
Selection bias represents a second potential threat to validity in our observational study, although this bias is mitigated by including all consecutive acute inpatient admissions to the participating hospitals. Furthermore, inclusion of the 9% of patients who had only 1 ED measurement of SBP collected did not alter the estimate of severe AH prevalence or associated outcomes.
Third, confounding may introduce the potential for false associations derived from observational data. The large sample size of our cohort allowed us to address this concern by adjusting for a large array of confounders. In addition, unlike other large‐scale population‐based studies which typically rely on administrative ICD‐9‐CM codes for risk adjustment, our analysis incorporated actual physiologic and laboratory results measured on admission, as well as a validated severity‐of‐illness scoring system for risk adjustment.12, 13
Although both SBP and diastolic blood pressure (DBP) thresholds are included in traditional definitions of hypertension, selecting SBP as the primary measure is reasonable because SBP >180 mmHg is a more important risk factor for cardiovascular disease than elevated DBP.25 Previous studies reported the relationship between the trend of SBP over time and clinical outcomes,26, 27 but we were not able to investigate the relationship of SBP trend and outcomes because the BP measurements in the our study were not collected in predefined intervals.
It would be ideal if serial blood pressure measures were to be collected at pre‐specified intervals and if more sophisticated schemas were to be used to refine the AH definition. This type of study may be possible in the future when vital signs can be collected automatically with advanced technology. Likewise, electronically captured treatment data could further help researchers to study the impact of process‐of‐care variables, including medications and other management strategies, in relation to outcomes. Finally, outpatient management of chronic hypertension is an integral part of clinical management. Unfortunately, these types of data are not available in our existing database. These limitations notwithstanding, an in‐depth understanding of the association between severe AH and potential adverse clinical and economic outcomes may direct further research in this field.
CONCLUSION
Severe AH appears common and its prevalence varies by underlying clinical condition in patients admitted from the ED. In those with acute neurologic syndromes, the degree of blood pressure elevation correlated with mortality, need for MV, and longer LOS. For many other conditions, elevation of blood pressure appeared to be linked to an increased need for MV and a prolongation in LOS. Future studies are needed to examine the potential impact of both 1) improved long‐term outpatient BP management, and 2) optimal management of severe AH upon admission on improving outcomes of patients hospitalized from the ED with severe AH.
- Health, United States, 2010.Hyattsville, MD:Centers for Disease Control and Prevention, National Center for Health Statistics;2011.
- Agency for Healthcare Research and Quality.Healthcare Cost and Utilization Project (HCUP).Rockville, MD:US Department of Health 289(19):2560–2572.
- ,,, et al.Practice patterns, outcomes, and end‐organ dysfunction for patients with acute severe hypertension: the Studying the Treatment of Acute hyperTension (STAT) registry.Am Heart J.2009;158(4):599–606.e1.
- ,,, et al.Prevalence of elevated blood pressure in 563,704 adult patients with stroke presenting to the ED in the United States.Am J Emerg Med.2007;25(1):32–38.
- ,,, et al.A prediction rule to identify low‐risk patients with community‐acquired pneumonia.N Engl J Med.1997;336(4):243–250.
- ,.A clinical assessment of MedisGroups.JAMA.1988;260(21):3159–3163.
- ,,,,,.Healthcare‐associated bloodstream infection: a distinct entity? Insights from a large U.S. database.Crit Care Med.2006;34(10):2588–2595.
- ,,,,,.Epidemiology and outcomes of health‐care‐associated pneumonia: results from a large US database of culture‐positive pneumonia.Chest.2005;128(6):3854–3862.
- ,,,,,.Morbidity and cost burden of methicillin‐resistant Staphylococcus aureus in early onset ventilator‐associated pneumonia.Crit Care.2006;10(3):R97.
- ,,,,.Evaluation of the complication rate as a measure of quality of care in coronary artery bypass graft surgery.JAMA.1995;274(4):317–323.
- ,,.Using automated clinical data for risk adjustment: development and validation of six disease‐specific mortality predictive models for pay‐for‐performance.Med Care.2007;45(8):789–805.
- ,,,,.Development and validation of a disease‐specific risk adjustment system using automated clinical data.Health Service Research.2010;45:1815–1835.
- ,.Estimating marginal and incremental effects on health outcomes using flexible link and variance function models.Biostatistics.2005;6(1):93–109.
- ,.An Introduction to the Bootstrap.London, England:Chapman 1993.
- ,.Applied Mixed Models in Medicine.2nd ed.Chichester, England:Wiley;2006.
- ,,,,,.Recognizing asymptomatic elevated blood pressure in ED patients: how good (bad) are we?Am J Emerg Med.2007;25(3):313–317.
- ,,, et al.Evaluation and treatment of patients with severely elevated blood pressure in academic emergency departments: a multicenter study.Ann Emerg Med.2006;47(3):230–236.
- ,,, et al.Elevated blood pressure in urban emergency department patients.Acad Emerg Med.2005;12(9):835–843.
- ,.Emergency department hypertension and regression to the mean.Ann Emerg Med.1998;31(2):214–218.
- ,,,.Differing prevalence estimates of elevated blood pressure in ED patients using 4 methods of categorization.Am J Emerg Med.2008;26(5):561–565.
- ,,.The validity of emergency department triage blood pressure measurements.Acad Emerg Med.2004;11(3):237–243.
- ,,.Reproducibility of increased blood pressure during an emergency department or urgent care visit.Ann Emerg Med.2003;41(4):507–512.
- ,,,,,.Increased blood pressure in the emergency department: pain, anxiety, or undiagnosed hypertension?Ann Emerg Med.2008;51(3):221–229.
- ,,.Clinical Advisory Statement. Importance of systolic blood pressure in older Americans.Hypertension.2000;35(5):1021–1024.
- ,,,.High blood pressure in early acute stroke: a sign of a poor outcome?J Hypertens.2006;24(2):381–386.
- ,,,,.Blood pressure as an independent prognostic factor in acute ischemic stroke.Can J Neurol Sci.2006;33(1):34–38.
Chronic hypertension affects 32% of adults in the United States.1 Each year, over 20 million emergency department visits involve hypertension.2 While many studies describe the epidemiology and outcomes of chronic hypertension, less is known about severe acute hypertension (AH). Often classified as either hypertensive urgency or emergency, it receives little attention in national treatment guidelines.3 There is a limited understanding of the epidemiology of, and the relationship between, this syndrome and patient outcomes among hospitalized patients. One registry study suggested that severe AH was associated with high rates of new organ damage, need for treatment in the intensive care unit, and a 90‐day readmission rate of 10%.4 This investigation, however, lacked generalizability, because it only enrolled subjects requiring therapy with an intravenous antihypertensive agent and did not provide information on the prevalence of severe AH. Qureshi et al.5 analyzed information in a more representative sample from the national hospital ambulatory care survey, however, the only outcome examined was the correlation between acute blood pressure and stroke. Studies focusing on a selected patient population may be of limited value to hospitalists, because they are commonly required to treat a range of patients presenting to the hospital.
In light of severe syndromes that may be associated with, or complicated by, severe AH presented early during acute care, hospitalists require a better understanding of the prevalence and the relationship between severe AH and attendant mortality and morbidity. In addition, an assessment of the association of severe AH on the need for intensive care unit (ICU) admission and mechanical ventilation (MV) may aid the initial treatment assessments and triage decisions required of hospitalists.
Our objective was to describe the prevalence and implications of severe AH present at the time of evaluation in the ED among patients eventually hospitalized, using clinical data collected on all consecutive admissions across a range of clinical conditions. We sought to determine the independent contribution, if any, of severe AH to hospital mortality, need for MV on admission, as well as hospital length of stay (LOS).
METHODS
Study Design and Setting
This was a retrospective analysis of adults admitted to 114 acute‐care hospitals in the United States from 2005 through 2007. The New England Institutional Review Board/Human Subjects Research Committee (Wellesley, MA) reviewed and approved this study. It was conducted in compliance with the Health Insurance Portability and Accountability Act (HIPAA).
Data
Data were obtained from one of the Clinical Research Databases from CareFusion (formerly Cardinal Health [CareFusion Clinical Research Services, Marlborough, MA]).613 The database contains electronically imported or manually extracted demographic, clinical (eg, comorbidities, vital signs, laboratory values, other clinical findings), and administrative data (eg, diagnosis, procedures, and length of hospitalization). All vital signs were manually extracted, including the highest and the lowest ED systolic blood pressure (SBP) measurements during the ED stay, but before inpatient admission. Patients admitted for childbirth or mental health reasons were not included.
Patients
Our main analysis focused on patients whose highest and lowest SBP were collected in the ED. These patients accounted for approximately 90% of all inpatients admitted through the ED. For the approximately 9% of patients who had only 1 SBP collected, we conducted a sensitivity analysis by both including and excluding them in the main analysis to determine if the absence of a second SBP measurement altered our findings. Patients were grouped into 1 of the following 8 mutually exclusive strata based on the maximum SBP (mmHg) in the ED: <100, 101‐139, 140‐180, 181‐190, 191‐200, 201‐210, 211‐220, and >220.
Measures
The primary exposure of interest was the prevalence of severe AH, defined as at least 1 SBP measurement recorded in the ED in excess of 180 mmHg. Outcome measures included in‐hospital mortality, need for MV on admission day (defined by International Classification of Diseases, 9th revision, Clinical Modification [ICD‐9‐CM] procedure codes of 96.70, 96.71, and 96.72), and LOS. We stratified these outcomes for each inpatient admission according to 1 of 112 mutually exclusive groups of principal diagnoses (see Supporting Appendix A in the online version of this article). To simplify the presentations, we pooled the groups into 9 major disease categories based on organ systems.
Primary Data Analysis
All statistical analyses were performed using Statistical Analysis Software (SAS version 9.01; SAS Institute Inc, Cary, NC). For evaluating trending, we used the Cochran‐Armitage test for dichotomous variables (mortality and MV), and linear regression for continuous variable (LOS). We employed a logistic regression model to estimate risk of mortality and need for MV on admission. We used linear regression models to estimate the LOS associated with severe AH. We modeled each outcome as a function of patient disease severity and SBP strata. Because patients with the most severe AH tended to have higher mortality early in hospitalization, our analysis of LOS was limited to patients who survived index hospitalization.
The original disease‐specific risk‐adjustment models accounting for patient‐level confounding risk factors, including demographics, physiologic presentation on admission (vital signs, altered mental status, and laboratory findings), and chronic conditions, were previously developed and validated.12, 13 We recalibrated each of the 112 models, for the current study cohort, using the logit of predicted probability of death generated from the mortality risk‐adjustment model as a propensity score of disease severity. Using this propensity score as an aggregate severity adjuster, we refit 9 logistic regression models (1 for each major disease category) to estimate the odds ratios for mortality or need for MV for each of the 7 SBP strata in the regression models with 101‐139 mmHg as the reference group. To estimate the attributable LOS (if any) of severe AH among survivors, we fit the 9 LOS models using log transformed LOS (to normalize the potentially skewed distribution of LOS) as the outcome, controlling for disease severity. The attributable LOS and 95% confidence intervals (CI) were estimated from 1000 bootstrap iterations, with the median as the parameter estimate and 2.5th and 97.5th percentile as 95% CI.14, 15
Sensitivity Analysis
To address potential bias of LOS associated with inpatient mortality, we refit 9 LOS models, including both patients who died and those who survived the index hospitalization. The models adjusted for disease severity, mortality, and the interaction of severity and mortality. Because patients with only 1 SBP recorded at ED may be different from those with more than 1 SBP recorded, we conducted analysis by adding these patients in the study cohort to examine the potential change of overall prevalence of AH and associated mortality for the study population.
To address the potential for a center‐specific effect on outcomes, we refit all the models using a mixed model approach.16 The mixed model accounts for both patient‐level risk factors and hospital‐specific effects on the observed outcomes.
RESULTS
Patient Characteristics
The study cohort was comprised of 1,290,804 adults who were admitted through the ED, from 2005 through 2007, and whose highest and lowest SBP measurements were collected in the ED. Median age was 69 years (interquartile range, 53‐81) for the overall population. Median age was 74 (interquartile range, 60‐83) for patients with severe AH (Table 1). Hospital mortality was 3.6% (n = 46,033), with 6119 (13.3%) having severe AH.
| Characteristic | Prevalence, n (Column %) | Severe Acute Hypertension, n (Row %) |
|---|---|---|
| Total number of discharges | 1,290,804 (100.0) | 178,197 (13.8) |
| Mortality | 46,033 (3.6) | 6,119 (13.3) |
| Live discharges | 1,244,771 (96.4) | 172,078 (13.8) |
| Mechanical ventilation on admission | 39,238 (3.0) | 9,508 (24.2) |
| Demographics | ||
| Age, median (1st, 3rd quartiles) | 69 (53, 81) | 74 (60, 83) |
| Male | 587,553 (45.5) | 71,085 (12.1) |
| Female | 703,244 (54.5) | 107,109 (15.2) |
| Race | ||
| White | 949,869 (73.6) | 121,930 (12.8) |
| Black | 220,601 (17.1) | 39,667 (18.0) |
| Other | 120,334 (9.3) | 16,600 (13.8) |
| Insurance | ||
| Medicare | 668,420 (51.8) | 105,078 (15.7) |
| Medicaid | 108,538 (8.4) | 12,259 (11.3) |
| Commercial | 163,858 (12.7) | 18,669 (11.4) |
| Other | 349,988 (27.1) | 42,191 (12.1) |
| Disease system by the principal diagnosis | ||
| Nervous system | 76,744 (5.9) | 22,270 (29.0) |
| Respiratory system | 222,329 (17.2) | 24,678 (11.1) |
| Circulatory system | 416,847 (32.3) | 66,852 (16.0) |
| Digestive system | 186,282 (14.4) | 17,817 (9.6) |
| Hepatobiliary/pancreas system | 52,293 (4.1) | 5,664 (10.8) |
| Endocrine system | 45,050 (3.5) | 6,625 (14.7) |
| Kidney/urinary system | 81,782 (6.3) | 11,050 (13.5) |
| Infectious diseases | 60,353 (4.7) | 4,162 (6.9) |
| Other | 149,124 (11.6) | 19,079 (12.8) |
| Comorbidity by secondary diagnoses | ||
| Hypertension | 729,417 (56.5) | 135,498 (18.6) |
| Fluid and electrolyte disorders | 306,666 (23.8) | 37,836 (12.3) |
| Diabetes without chronic complications | 286,912 (22.2) | 47,979 (16.7) |
| Chronic pulmonary disease | 283,895 (22.0) | 35,977 (12.7) |
| Congestive heart failure | 213,523 (16.5) | 33,956 (15.9) |
| Deficiency anemias | 210,230 (16.3) | 30,266 (14.4) |
| Renal failure | 159,409 (12.3) | 31,984 (20.1) |
| Hypothyroidism | 153,911 (11.9) | 22,441 (14.6) |
| Valvular disease | 140,820 (10.9) | 21,453 (15.2) |
| Depression | 137,259 (10.6) | 16,886 (12.3) |
| Other neurological disorders | 126,954 (9.8) | 19,103 (15.0) |
| Peripheral vascular disease | 88,321 (6.8) | 16,180 (18.3) |
| Obesity | 84,000 (6.5) | 12,351 (14.7) |
| Diabetes with chronic complications | 65,989 (5.1) | 13,093 (19.8) |
| Psychoses | 54,769 (4.2) | 5,555 (10.1) |
| Alcohol abuse | 51,765 (4.0) | 6,014 (11.6) |
| Pulmonary circulation disease | 49,248 (3.8) | 7,128 (14.5) |
| Coagulopathy | 43,584 (3.4) | 4,339 (10.0) |
| Paralysis | 42,128 (3.3) | 8,125 (19.3) |
| Drug abuse | 36,134 (2.8) | 4,779 (13.2) |
| Liver disease | 36,094 (2.8) | 3,218 (8.9) |
| Weight loss | 35,795 (2.8) | 3,726 (10.4) |
| Metastatic cancer | 33,517 (2.6) | 2,498 (7.5) |
| Rheumatoid arthritis | 32,545 (2.5) | 4,300 (13.2) |
| Solid tumor without metastasis | 30,677 (2.4) | 3,035 (9.9) |
| Chronic blood loss anemia | 25,416 (2.0) | 2,268 (8.9) |
| Lymphoma | 9,972 (0.8) | 871 (8.7) |
| Acquired immune deficiency syndrome | 3,048 (0.2) | 307 (10.1) |
| Peptic ulcer disease | 915 (0.1) | 131 (14.3) |
| Discharges by hospital characteristics | ||
| Teaching status | ||
| Teaching hospitals | 899,786 (69.7) | 127,512 (14.2) |
| Nonteaching hospitals | 391,018 (30.3) | 50,685 (13.0) |
| Urban status | ||
| Urban hospitals | 1,164,802 (90.2) | 162,399 (13.9) |
| Rural hospitals | 126,002 (9.8) | 15,798 (12.5) |
| Bed size | ||
| Beds <100 | 36,624 (2.8) | 4,965 (13.6) |
| Beds 100‐300 | 623,327 (48.3) | 80,156 (12.9) |
| Beds >300 | 630,853 (48.9) | 93,076 (14.8) |
Prevalence of Acute Hypertension
A total of 763,634 (59.2%) patients had at least 1 SBP measurement of 140 mmHg during the ED stay, including 178,197 (13.8%) with SBP >180 mmHg. Body systems associated with the highest prevalence of severe AH (SBP >180 mmHg) were nervous (29.0%), circulatory (16.0%), endocrine (14.7%), and kidney/urinary (13.5%) (Figure 1 presents the data in graphic form; Supporting Appendix B, in the online version of this article, presents corresponding data in table form).
Mortality
Univariable analysis revealed a graded relationship between SBP stratum and mortality risk (Figure 2a; and see Supporting Appendix C in the online version of this article). This relationship was most pronounced for nervous system diseases; mortality rates for each 10 mmHg increase in SBP from 180 to >220 mmHg were 6.5%, 8.1%, 10.0%, 12.0%, and 19.7%, respectively (trending P < 0.0001). The risk‐adjusted increase in mortality odds ratio ranged from 1.04 (95% CI: 0.89, 1.21) to 1.44 (95% CI: 1.25, 1.67) for patients in the severe AH strata compared to patients with SBP of 101 to 139 mmHg (Figure 3). Severe AH was not an independent mortality predictor in other disease categories.
Mechanical Ventilation on Admission
Univariable analysis revealed a graded relationship between severe AH and a need for MV on admission, especially for respiratory, circulatory, and infectious conditions (trending P < 0.0001) (Figure 2b; and see Supporting Appendix C in the online version of this article). In the multivariable analysis, there was a relationship between severe AH stratum and adjusted risk for MV on admission across nearly all disease categories (Figure 4).
Length of Stay
Univariable analysis revealed a graded relationship between severe AH strata and LOS for nearly all disease categories in survivors (trending P < 0.0001), except for digestive, kidney, and infectious diseases (Figure 2c; and see Supporting Appendix C in the online version of this article). For patients with nervous system diseases, the unadjusted LOS for each 10 mmHg increase in SBP from 180 to >220 was 5.8, 6.1, 6.4, 6.8, and 8.0 days, respectively (trending P < 0.0001). The relationship was similar for other disease categories which showed significant trending.
In the multivariable analysis, the relationship between severe AH strata and adjusted attributable LOS was graded across most disease categories, especially nervous, circulatory, and hepatobiliary diseases (Figure 5). The total adjusted number of hospital days attributable to severe AH was 0.43 days per case for all survivors with severe AH.
Sensitivity Analysis
Our sensitivity analysis of the LOS estimate, including those patients who died in the hospital, yielded similar findings in attributable LOS due to severe AH. In addition, when we added patients with only 1 SBP documented in the ED to the study cohort, the severe AH prevalence changed negligibly from 13.8% to 13.0%, and the associated mortality remained unchanged at 3.4%. Models using the mix model approach, which take into account hospital‐specific effects, showed similar results.
DISCUSSION
This large‐scale analysis demonstrated that severe AH was present in 13.8% of inpatients admitted through the ED. The prevalence of severe AH varied based on the primary reason for an acute care admission, ranging from 7% in infectious syndromes to nearly 30% in acute neurologic processes. Specific to patients with neurologic disease, initial severe blood pressure elevations independently correlated with mortality. Severe blood pressure elevations at ED were independently associated with an increased need for MV on admission and a prolonged LOS across a range of disease states.
Prior work on hypertension at admission has generally included single‐center analyses or only focused on patients with specific admitting diagnoses. For example, in a single ED analysis, Tilman et al.17 reported that 16% of 10,000 patients presented with elevated blood pressure (140/90 mmHg). In a multicenter review of 7000 persons, Karras et al.18, 19 described 423 patients with severe AH (180/110 mmHg) who comprised 6% of patients seen in the ED during a 1‐week period. Qureshi et al.5 noted severe AH in 13% of patients with acute stroke. While other ED‐based studies examined all ED patients, including those admitted and discharged from the ED, our study focused on those requiring hospitalization. This disparity in illness severity may, in part, explain the higher prevalence of severe AH we noted relative to others.
We further found that the prevalence of severe AH varied based on admitting diagnosis. This difference in prevalence rates by condition seems clinically plausible. Recognition of this pattern may prove valuable to hospitalists who, by the nature of their responsibilities, will encounter a broad range of patients. Because our data were derived from the largest analysis of blood pressure assessments for ED patients who were eventually hospitalized, and encompassed a multiplicity of hospitals, our findings are likely generalizable. Moreover, our large sample size enabled us to examine severe AH at each 10 mmHg increment across a variety of disease states, rather than restricting our analysis to 1 admitting diagnosis.
The independent relationship between severe blood pressure elevation and mortality was detected only in those with neurologic conditions. Incremental increases in SBP beyond 180 mmHg were associated with a stepwise escalation in the risk for death. Although recognition of the importance of blood pressure management in both ischemic and hemorrhagic stroke remains a cornerstone of therapy for these diseases, the stepwise relationship between escalating blood pressure and outcome suggests that further study is needed to determine the optimal management of severe AH among these patients. This relationship, along with the independent association between severe AH at presentation and the need for MV, underscores the importance of severe AH in critical care, representing a major challenge for intensivists and hospitalists, particularly those who practice in neurologic ICUs.
The independent association of severe AH and prolonged LOS represents a novel finding. Few reports have correlated the initial blood pressure with measures of resource use. Katz et al.4 found a median LOS of 6 days among 1000 patients who presented with severe AH and end organ dysfunction in 25 US hospitals. These investigators, however, did not explore the incremental independent contribution of initial blood pressure to LOS. Biologically, severe hypertension may exacerbate both acute and chronic conditions, thus complicating their management and resulting in longer hospitalizations.
Our analysis has limitations. While exposure misclassification is a potential concern, unlike other population‐based studies that use ICD‐9‐CM codes to identify AH cases, we relied on actual measures of blood pressure to identify subjects, thus minimizing this threat to validity. Similarly, since our end pointsmortality, MV on admission, and LOSwere also objective measures, the probability of their misclassification is minimal.
Another concerning contributor to exposure misclassification is the possibility that, in some instances, the initial elevation in BP meeting the inclusion criteria in our study cohort does not reflect the true BP. Indeed, a substantial body of research about BP measurement in the ED suggests that we may have included some persons who likely did not have AH. For example, Pitts and Adams described a regression to the mean phenomenon, with serial BP measurements in the ED, wherein the BP fell by approximately 11 mmHg over 4 hours.20 Baumann and colleagues reported a similar pattern.21 However, the findings of these 2 analyses do not necessarily apply to our study population; we focused on patients admitted to the hospital with an acute condition, while Pitts and Adams20 and Baumann et al.21 examined all ED patients. This distinction is crucial in that patients not admitted are likely less severely ill and systematically different from those who do merit hospitalization. Moreover, both Pitts and Adams20 and Cienki et al.22 observed that the regression to the mean and fall in serial BP measurements were less pronounced in those with the most extensive BP elevations. In our study, we found the strongest relationship between adverse outcomes and BP in patients with the most extreme BP elevations. Thus, misclassification is perhaps less likely to be an issue for these subjects.
In addition, misclassification may result when initially elevated BP simply represents the impact of untreated pain or anxiety in ED patients. However, Backer et al.23 and Tanabe and colleagues24 specifically explored the impact of pain and anxiety on BP in ED subjects, and neither group found a correlation between BP and either acute pain and/or anxiety scores. Our difficulties with case definitions and BP measurements for severe AH demonstrate the need for the creation and adoption of a formal, systematic approach to this syndrome, along with the need for prospective analyses to confirm our findings.
Selection bias represents a second potential threat to validity in our observational study, although this bias is mitigated by including all consecutive acute inpatient admissions to the participating hospitals. Furthermore, inclusion of the 9% of patients who had only 1 ED measurement of SBP collected did not alter the estimate of severe AH prevalence or associated outcomes.
Third, confounding may introduce the potential for false associations derived from observational data. The large sample size of our cohort allowed us to address this concern by adjusting for a large array of confounders. In addition, unlike other large‐scale population‐based studies which typically rely on administrative ICD‐9‐CM codes for risk adjustment, our analysis incorporated actual physiologic and laboratory results measured on admission, as well as a validated severity‐of‐illness scoring system for risk adjustment.12, 13
Although both SBP and diastolic blood pressure (DBP) thresholds are included in traditional definitions of hypertension, selecting SBP as the primary measure is reasonable because SBP >180 mmHg is a more important risk factor for cardiovascular disease than elevated DBP.25 Previous studies reported the relationship between the trend of SBP over time and clinical outcomes,26, 27 but we were not able to investigate the relationship of SBP trend and outcomes because the BP measurements in the our study were not collected in predefined intervals.
It would be ideal if serial blood pressure measures were to be collected at pre‐specified intervals and if more sophisticated schemas were to be used to refine the AH definition. This type of study may be possible in the future when vital signs can be collected automatically with advanced technology. Likewise, electronically captured treatment data could further help researchers to study the impact of process‐of‐care variables, including medications and other management strategies, in relation to outcomes. Finally, outpatient management of chronic hypertension is an integral part of clinical management. Unfortunately, these types of data are not available in our existing database. These limitations notwithstanding, an in‐depth understanding of the association between severe AH and potential adverse clinical and economic outcomes may direct further research in this field.
CONCLUSION
Severe AH appears common and its prevalence varies by underlying clinical condition in patients admitted from the ED. In those with acute neurologic syndromes, the degree of blood pressure elevation correlated with mortality, need for MV, and longer LOS. For many other conditions, elevation of blood pressure appeared to be linked to an increased need for MV and a prolongation in LOS. Future studies are needed to examine the potential impact of both 1) improved long‐term outpatient BP management, and 2) optimal management of severe AH upon admission on improving outcomes of patients hospitalized from the ED with severe AH.
- Health, United States, 2010.Hyattsville, MD:Centers for Disease Control and Prevention, National Center for Health Statistics;2011.
- Agency for Healthcare Research and Quality.Healthcare Cost and Utilization Project (HCUP).Rockville, MD:US Department of Health 289(19):2560–2572.
- ,,, et al.Practice patterns, outcomes, and end‐organ dysfunction for patients with acute severe hypertension: the Studying the Treatment of Acute hyperTension (STAT) registry.Am Heart J.2009;158(4):599–606.e1.
- ,,, et al.Prevalence of elevated blood pressure in 563,704 adult patients with stroke presenting to the ED in the United States.Am J Emerg Med.2007;25(1):32–38.
- ,,, et al.A prediction rule to identify low‐risk patients with community‐acquired pneumonia.N Engl J Med.1997;336(4):243–250.
- ,.A clinical assessment of MedisGroups.JAMA.1988;260(21):3159–3163.
- ,,,,,.Healthcare‐associated bloodstream infection: a distinct entity? Insights from a large U.S. database.Crit Care Med.2006;34(10):2588–2595.
- ,,,,,.Epidemiology and outcomes of health‐care‐associated pneumonia: results from a large US database of culture‐positive pneumonia.Chest.2005;128(6):3854–3862.
- ,,,,,.Morbidity and cost burden of methicillin‐resistant Staphylococcus aureus in early onset ventilator‐associated pneumonia.Crit Care.2006;10(3):R97.
- ,,,,.Evaluation of the complication rate as a measure of quality of care in coronary artery bypass graft surgery.JAMA.1995;274(4):317–323.
- ,,.Using automated clinical data for risk adjustment: development and validation of six disease‐specific mortality predictive models for pay‐for‐performance.Med Care.2007;45(8):789–805.
- ,,,,.Development and validation of a disease‐specific risk adjustment system using automated clinical data.Health Service Research.2010;45:1815–1835.
- ,.Estimating marginal and incremental effects on health outcomes using flexible link and variance function models.Biostatistics.2005;6(1):93–109.
- ,.An Introduction to the Bootstrap.London, England:Chapman 1993.
- ,.Applied Mixed Models in Medicine.2nd ed.Chichester, England:Wiley;2006.
- ,,,,,.Recognizing asymptomatic elevated blood pressure in ED patients: how good (bad) are we?Am J Emerg Med.2007;25(3):313–317.
- ,,, et al.Evaluation and treatment of patients with severely elevated blood pressure in academic emergency departments: a multicenter study.Ann Emerg Med.2006;47(3):230–236.
- ,,, et al.Elevated blood pressure in urban emergency department patients.Acad Emerg Med.2005;12(9):835–843.
- ,.Emergency department hypertension and regression to the mean.Ann Emerg Med.1998;31(2):214–218.
- ,,,.Differing prevalence estimates of elevated blood pressure in ED patients using 4 methods of categorization.Am J Emerg Med.2008;26(5):561–565.
- ,,.The validity of emergency department triage blood pressure measurements.Acad Emerg Med.2004;11(3):237–243.
- ,,.Reproducibility of increased blood pressure during an emergency department or urgent care visit.Ann Emerg Med.2003;41(4):507–512.
- ,,,,,.Increased blood pressure in the emergency department: pain, anxiety, or undiagnosed hypertension?Ann Emerg Med.2008;51(3):221–229.
- ,,.Clinical Advisory Statement. Importance of systolic blood pressure in older Americans.Hypertension.2000;35(5):1021–1024.
- ,,,.High blood pressure in early acute stroke: a sign of a poor outcome?J Hypertens.2006;24(2):381–386.
- ,,,,.Blood pressure as an independent prognostic factor in acute ischemic stroke.Can J Neurol Sci.2006;33(1):34–38.
Copyright © 2011 Society of Hospital Medicine
