User login
The Hospitalist Triage Role for Reducing Admission Delays: Impacts on Throughput, Quality, Interprofessional Practice, and Clinician Experience of Care
From the Division of Hospital Medicine, University of New Mexico Hospital, Albuquerque (Drs. Bartlett, Pizanis, Angeli, Lacy, and Rogers), Department of Emergency Medicine, University of New Mexico Hospital, Albuquerque (Dr. Scott), and University of New Mexico School of Medicine, Albuquerque (Ms. Baca).
ABSTRACT
Background: Emergency department (ED) crowding is associated with deleterious consequences for patient care and throughput. Admission delays worsen ED crowding. Time to admission (TTA)—the time between an ED admission request and internal medicine (IM) admission orders—can be shortened through implementation of a triage hospitalist role. Limited research is available highlighting the impact of triage hospitalists on throughput, care quality, interprofessional practice, and clinician experience of care.
Methods: A triage hospitalist role was piloted and implemented. Run charts were interpreted using accepted rules for deriving statistically significant conclusions. Statistical analysis was applied to interprofessional practice and clinician experience-of-care survey results.
Results: Following implementation, TTA decreased from 5 hours 19 minutes to 2 hours 8 minutes. Emergency department crowding increased from baseline. The reduction in TTA was associated with decreased time from ED arrival to IM admission request, no change in critical care transfers during the initial 24 hours, and increased admissions to inpatient status. Additionally, decreased TTA was associated with no change in referring hospital transfer rates and no change in hospital medicine length of stay. Interprofessional practice attitudes improved among ED clinicians but not IM clinicians. Clinician experience-of-care results were mixed.
Conclusion: A triage hospitalist role is an effective approach for mitigating admission delays, with no evident adverse clinical consequences. A triage hospitalist alone was incapable of resolving ED crowding issues without a complementary focus on downstream bottlenecks.
Keywords: triage hospitalist, admission delay, quality improvement.
Excess time to admission (TTA), defined as the time between an emergency department (ED) admission request and internal medicine (IM) admission orders, contributes to ED crowding, which is associated with deleterious impacts on patient care and throughput. Prior research has correlated ED crowding with an increase in length of stay (LOS)1-3 and total inpatient cost,1 as well as increased inpatient mortality, higher left-without-being-seen rates,4 delays in clinically meaningful care,5,6 and poor patient and clinician satisfaction.6,7 While various solutions have been proposed to alleviate ED crowding,8 excess TTA is one aspect that IM can directly address.
Like many institutions, ours is challenged by ED crowding. Time to admission is a known bottleneck. Underlying factors that contribute to excess TTA include varied admission request volumes in relation to fixed admitting capacity; learner-focused admitting processes; and unreliable strategies for determining whether patients are eligible for ED observation, transfer to an alternative facility, or admission to an alternative primary service.
To address excess TTA, we piloted then implemented a triage hospitalist role, envisioned as responsible for evaluating ED admission requests to IM, making timely determinations of admission appropriateness, and distributing patients to admitting teams. This intervention was selected because of its strengths, including the ability to standardize admission processes, improve the proximity of clinical decision-makers to patient care to reduce delays, and decrease hierarchical imbalances experienced by trainees, and also because the institution expressed a willingness to mitigate its primary weakness (ie, ongoing financial support for sustainability) should it prove successful.
Previously, a triage hospitalist has been defined as “a physician who assesses patients for admission, actively supporting the transition of the patient from the outpatient to the inpatient setting.”9 Velásquez et al surveyed 10 academic medical centers and identified significant heterogeneity in the roles and responsibilities of a triage hospitalist.9 Limited research addresses the impact of this role on throughput. One report described the volume and source of requests evaluated by a triage hospitalist and the frequency with which the triage hospitalists’ assessment of admission appropriateness aligned with that of the referring clinicians.10 No prior research is available demonstrating the impact of this role on care quality, interprofessional practice, or clinician experience of care. This article is intended to address these gaps in the literature.
Methods
Setting
The University of New Mexico Hospital has 537 beds and is the only level-1 trauma and academic medical center in the state. On average, approximately 8000 patients register to be seen in the ED per month. Roughly 600 are admitted to IM per month. This study coincided with the COVID-19 pandemic, with low patient volumes in April 2020, overcapacity census starting in May 2020, and markedly high patient volumes in May/June 2020 and November/December 2020. All authors participated in project development, implementation, and analysis.
Preintervention IM Admission Process
When requesting IM admission, ED clinicians (resident, advanced practice provider [APP], or attending) contacted the IM triage person (typically an IM resident physician) by phone or in person. The IM triage person would then assess whether the patient needed critical care consultation (a unique and separate admission pathway), was eligible for ED observation or transfer to an outside hospital, or was clinically appropriate for IM subacute and floor admission. Pending admissions were evaluated in order of severity of illness or based on wait time if severity of illness was equal. Transfers from the intensive care unit (ICU) and referring hospitals were prioritized. Between 7:00
Triage Hospitalist Pilot
Key changes made during the pilot included scheduling an IM attending to serve as triage hospitalist for all IM admission requests from the ED between 7:00
Measures for Triage Hospitalist Pilot
Data collected included request type (new vs overflow from night) and patient details (name, medical record number). Two time points were recorded: when the EDAR order was entered and when admission orders were entered. Process indicators, including whether the EDAR order was entered and the final triage decision (eg, discharge, IM), were recorded. General feedback was requested at the end of each shift.
Phased Implementation of Triage Hospitalist Role
Triage hospitalist role implementation was approved following the pilot, with additional salary support funded by the institution. A new performance measure (time from admission request to admission order, self-identified goal < 3 hours) was approved by all parties.
In January 2020, the role was scheduled from 7:00
In March 2020, to create a single communication pathway while simultaneously hardwiring our measurement strategy, the EDAR order was modified such that it would automatically prompt a 1-way communication to the triage hospitalist using the institution’s secure messaging software. The message included patient name, medical record number, location, ED attending, reason for admission, and consultation priority, as well as 2 questions prompting ED clinicians to reflect on the most common reasons for the triage hospitalist to recommend against IM admission (eligible for admission to other primary service, transfer to alternative hospital).
In July 2020, the triage hospitalist role was scheduled 24 hours a day, 7 days a week, to meet an institutional request. The schedule was divided into a daytime 7:00
Measures for Triage Hospitalist Role
The primary outcome measure was TTA, defined as the time between EDAR (operationalized using EDAR order timestamp) and IM admission decision (operationalized using inpatient bed request order timestamp). Additional outcome measures included the Centers for Medicare & Medicaid Services Electronic Clinical Quality Measure ED-2 (eCQM ED-2), defined as the median time from admit decision to departure from the ED for patients admitted to inpatient status.
Process measures included time between patient arrival to the ED (operationalized using ED registration timestamp) and EDAR and percentage of IM admissions with an EDAR order. Balancing measures included time between bed request order (referred to as the IM admission order) and subsequent admission orders. While the IM admission order prompts an inpatient clinical encounter and inpatient bed assignment, subsequent admission orders are necessary for clinical care. Additional balancing measures included ICU transfer rate within the first 24 hours, referring facility transfer frequency to IM (an indicator of access for patients at outside hospitals), average hospital medicine LOS (operationalized using ED registration timestamp to discharge timestamp), and admission status (inpatient vs observation).
An anonymous preintervention (December 2019) and postintervention (August 2020) survey focusing on interprofessional practice and clinician experience of care was used to obtain feedback from ED and IM attendings, APPs, and trainees. Emergency department clinicians were asked questions pertaining to their IM colleagues and vice versa. A Likert 5-point scale was used to respond.
Data Analysis
The preintervention period was June 1, 2019, to October 31, 2019; the pilot period was November 1, 2019, to December 31, 2019; the staged implementation period was January 1, 2020, to June 30, 2020; and the postintervention period was July 1, 2020, to December 31, 2020. Run charts for outcome, process, and balancing measures were interpreted using rules for deriving statistically significant conclusions.11 Statistical analysis using a t test assuming unequal variances with P < . 05 to indicate statistical significance was applied to experience-of-care results. The study was approved by the Institutional Review Board.
Results
Triage Hospitalist Pilot Time Period
Seventy-four entries were recorded, 56 (75.7%) reflecting new admission requests. Average time between EDAR order and IM admission order was 40 minutes. The EDAR order was entered into the EMR without prompting in 22 (29.7%) cases. In 56 (75.7%) cases, the final triage decision was IM admission. Other dispositions included 3 discharges, 4 transfers, 3 alternative primary service admissions, 1 ED observation, and 7 triage deferrals pending additional workup or stabilization.
Feedback substantiated several benefits, including improved coordination among IM, ED, and consultant clinicians, as well as early admission of seriously ill patients. Feedback also confirmed several expected challenges, including evidence of communication lapses, difficulty with transfer coordinator integration, difficulty hardwiring elements of the verbal and bedside handoff, and perceived high cognitive load for the triage hospitalist. Several unexpected issues included whether ED APPs can request admission independently and how reconsultation is expected to occur if admission is initially deferred.
Triage Hospitalist Implementation Time Period
Time to admission decreased from a baseline pre-pilot average of 5 hours 19 minutes (median, 4 hours 45 minutes) to a postintervention average of 2 hours 8 minutes, with a statistically significant downward shift post intervention (Figure 1). throughout pilot and staged implementation")
ED-2 increased from a baseline average of 3 hours 40 minutes (median, 2 hours 39 minutes), with a statistically significant upward shift starting in May 2020 (Figure 2). Time between patient arrival to the ED and EDAR order decreased from a baseline average of 8 hours 47 minutes (median, 8 hours 37 minutes) to a postintervention average of 5 hours 57 minutes, with a statistically significant downward shift post intervention. Percentage of IM admissions with an EDAR order increased from a baseline average of 47% (median, 47%) to 97%, with a statistically significant upward shift starting in January 2020 (Figure 3).
 from pre-intervention (July 2019) period through postintervention (December 2020).")
There was no change in observed average time between IM admission order and subsequent admission orders pre and post intervention (16 minutes vs 18 minutes). However, there was a statistically significant shift up to an average of 40 minutes from January through June 2020, which then resolved. The percentage of patients transferred to the ICU within 24 hours of admission to IM did not change (1.1% pre vs 1.4% post intervention). Frequency of patients transferred in from a referring facility also did not change (26/month vs 22/month). Average hospital medicine LOS did not change to a statistically significant degree (6.48 days vs 6.62 days). The percentage of inpatient admissions relative to short stays increased from a baseline of 74.0% (median, 73.6%) to a postintervention average of 82.4%, with a statistically significant shift upward starting March 2020.
")
Regarding interprofessional practice and clinician experience of care, 122 of 309 preintervention surveys (39.5% response rate) and 98 of 309 postintervention surveys (31.7% response rate) were completed. Pre- and postintervention responses were not linked.
Regarding interprofessional practice, EM residents and EM attendings experienced statistically significant improvements in all interprofessional practice domains (Table 1). Emergency medicine APPs experienced statistically significant improvements post intervention with “I am satisfied with the level of communication with IM hospitalist clinicians” and “Interactions

For clinician experience of care, EM residents (P < .001) and attendings (P < .001) experienced statistically significant improvements in “Patients are well informed and involved in the decision to admit,” whereas IM residents and attendings, as well as EM APPs, experienced nonstatistically significant improvements (Table 2). All groups except IM attendings experienced a statistically significant improvement (IM resident P = .011, EM resident P < .001, EM APP P = .001, EM attending P < .001) in “I believe that my patients are evaluated and treated within an appropriate time frame.” Internal medicine attendings felt that this indicator worsened to a nonstatistically significant degree. Post intervention, EM groups experienced a statistically significant worsening in “The process of admitting patients to a UNM IM hospitalist service is difficult,” while IM groups experienced a nonstatistically significant worsening.

Discussion
Implementation of the triage hospitalist role led to a significant reduction in average TTA, from 5 hours 19 minutes to 2 hours 8 minutes. Performance has been sustained at 1 hour 42 minutes on average over the past 6 months. The triage hospitalist was successful at reducing TTA because of their focus on evaluating new admission and transfer requests, deferring other admission responsibilities to on-call admitting teams. Early admission led to no increase in ICU transfers or hospitalist LOS. To ensure that earlier admission reflected improved timeliness of care and that new sources of delay were not being created, we measured the time between IM admission and subsequent admission orders. A statistically significant increase to 40 minutes from January through June 2020 was attributable to the hospitalist acclimating to their new role and the need to standardize workflow. This delay subsequently resolved. An additional benefit of the triage hospitalist was an increase in the proportion of inpatient admissions compared with short stays.
ED-2, an indicator of ED crowding, increased from 3 hours 40 minutes, with a statistically significant upward shift starting May 2020. Increasing ED-2 associated with the triage hospitalist role makes intuitive sense. Patients are admitted 2 hours 40 minutes earlier in their hospital course while downstream bottlenecks preventing patient movement to an inpatient bed remained unchanged. Unfortunately, the COVID-19 pandemic complicates interpretation of ED-2 because the measure reflects institutional capacity to match demand for inpatient beds. Fewer ED registrations and lower hospital medicine census (and resulting inpatient bed availability) in April 2020 during the first COVID-19 surge coincided with an ED-2 nadir of 1 hour 46 minutes. The statistically significant upward shift from May onward reflects ongoing and unprecedented patient volumes. It remains difficult to tease apart the presumed lesser contribution of the triage hospitalist role and presumed larger contribution of high patient volumes on ED-2 increases.
An important complementary change was linkage between the EDAR order and our secure messaging software, creating a single source of admission and transfer requests, prompting early ED clinician consideration of factors that could result in alternative disposition, and ensuring a sustainable data source for TTA. The order did not replace direct communication and included guidance for how triage hospitalists should connect with their ED colleagues. Percentage of IM admissions with the EDAR order increased to 97%. Fallouts are attributed to admissions from non-ED sources (eg, referring facility, endoscopy suite transfers). This communication strategy has been expanded as the primary mechanism of initiating consultation requests between IM and all consulting services.
This intervention was successful from the perspective of ED clinicians. Improvements can be attributed to the simplified admission process, timely patient assessment, a perception that patients are better informed of the decision to admit, and the ability to communicate with the triage hospitalist. Emergency medicine APPs may not have experienced similar improvements due to ongoing perceptions of a hierarchical imbalance. Unfortunately, the small but not statistically significant worsening perspective among ED clinicians that “efficiency is more valued than good patient care” and the statistically significant worsening perspective that “admitting patients to a UNM IM hospitalist service is difficult” may be due to the triage hospitalist responsibility for identifying the roughly 25% of patients who are safe for an alternative disposition.
Internal medicine clinicians experienced no significant changes in attitudes. Underlying causes are likely multifactorial and a focus of ongoing work. Internal medicine residents experienced statistically significant improvements for “I am satisfied with the level of communication with EM clinicians” and nonstatistically significant improvements for the other 3 domains, likely because the intervention enabled them to focus on clinical care rather than the administrative tasks and decision-making complexities inherent to the IM admission process. Internal medicine attendings reported a nonstatistically significant worsening in “I am satisfied with the level of communication with EM clinicians,” which is possibly attributable to challenges connecting with ED attendings after being notified that a new admission is pending. Unfortunately, bedside handoff was not hardwired and is done sporadically. Independent of the data, we believe that the triage hospitalist role has facilitated closer ED-IM relationships by aligning clinical priorities, standardizing processes, improving communication, and reducing sources of hierarchical imbalance and conflict. We expected IM attendings and residents to experience some degree of resolution of the perception that “efficiency is more valued than good patient care” because of the addition of a dedicated triage role. Our data also suggest that IM attendings are less likely to agree that “patients are evaluated and treated within an appropriate time frame.” Both concerns may be linked to the triage hospitalist facing multiple admission and transfer sources with variable arrival rates and variable patient complexity, resulting in high cognitive load and the perception that individual tasks are not completed to the best of their abilities.
To our knowledge, this is the first study assessing the impact of the triage hospitalist role on throughput, clinical care quality, interprofessional practice, and clinician experience of care. In the cross-sectional survey of 10 academic medical centers, 8 had defined triage roles filled by IM attendings, while the remainder had IM attendings supervising trainees.9 A complete picture of the prevalence and varying approaches of triage hospitalists models is unknown. Howell et al12 reported on an approach that reduced admission delays without a resulting increase in mortality or LOS. Our approach differed in several ways, with greater involvement of the triage hospitalist in determining a final admission decision, incorporation of EMR communication, and presence of existing throughput challenges preventing patients from moving seamlessly to an inpatient unit.
Conclusion
We believe this effort was successful for several reasons, including adherence to quality improvement best practices, such as engagement of stakeholders early on, the use of data to inform decision-making, the application of technology to hardwire process, and alignment with institutional priorities. Spread of this intervention will be limited by the financial investment required to start and maintain a triage hospitalist role. A primary limitation of this study is the confounding effect of the COVID-19 pandemic on our analysis. Next steps include identification of clinicians wishing to specialize in triage and expanding triage to include non-IM primary services. Additional research to optimize the triage hospitalist experience of care, as well as to measure improvements in patient-centered outcomes, is necessary.
Corresponding author: Christopher Bartlett, MD, MPH; MSC10 5550, 1 University of New Mexico, Albuquerque, NM 87131; CSBartlett@salud.unm.edu
Disclosures: None reported.
1. Huang Q, Thind A, Dreyer JF, et al. The impact of delays to admission from the emergency department on inpatient outcomes. BMC Emerg Med. 2010;10:16. doi:10.1186/1471-227X-10-16
2. Liew D, Liew D, Kennedy MP. Emergency department length of stay independently predicts excess inpatient length of stay. Med J Aust. 2003;179:524-526. doi:10.5694/j.1326-5377.2003.tb05676.x
3. Richardson DB. The access-block effect: relationship between delay to reaching an inpatient bed and inpatient length of stay. Med J Aust. 2002;177:492-495. doi:10.5694/j.1326-5377.2002.tb04917.x
4. Polevoi SK, Quinn JV, Kramer KR. Factors associated with patients who leave without being seen. Acad Emerg Med. 2005;12:232-236. doi:10.1197/j.aem.2004.10.029
5. Bernstein SL, Aronsky D, Duseja R, et al. The effect of emergency department crowding on clinically oriented outcomes. Acad Emerg Med. 2009;16:1-10. doi:10.1111/j.1553-2712.2008.00295.x
6. Vieth TL, Rhodes KV. The effect of crowding on access and quality in an academic ED. Am J Emerg Med. 2006;24:787-794. doi:10.1016/j.ajem.2006.03.026
7. Rondeau KV, Francescutti LH. Emergency department overcrowding: the impact of resource scarcity on physician job satisfaction. J Healthc Manag. 2005;50:327-340; discussion 341-342.
8. Emergency Department Crowding: High Impact Solutions. American College of Emergency Physicians. Emergency Medicine Practice Committee. 2016. Accessed March 31, 2023. https://www.acep.org/globalassets/sites/acep/media/crowding/empc_crowding-ip_092016.pdf
9. Velásquez ST, Wang ES, White AW, et al. Hospitalists as triagists: description of the triagist role across academic medical centers. J Hosp Med. 2020;15:87-90. doi:10.12788/jhm.3327
10. Amick A, Bann M. Characterizing the role of the “triagist”: reasons for triage discordance and impact on disposition. J Gen Intern Med. 2021;36:2177-2179. doi:10.1007/s11606-020-05887-y
11. Perla RJ, Provost LP, Murray SK. The run chart: a simple analytical tool for learning for variation in healthcare processes. BMJ Qual Saf. 2011;20:46-51. doi:10.1136/bmjqs.2009.037895
12. Howell EE, Bessman ES, Rubin HR. Hospitalists and an innovative emergency department admission process. J Gen Intern Med. 2004;19:266-268. doi:10.1111/j.1525-1497.2004.30431.x
From the Division of Hospital Medicine, University of New Mexico Hospital, Albuquerque (Drs. Bartlett, Pizanis, Angeli, Lacy, and Rogers), Department of Emergency Medicine, University of New Mexico Hospital, Albuquerque (Dr. Scott), and University of New Mexico School of Medicine, Albuquerque (Ms. Baca).
ABSTRACT
Background: Emergency department (ED) crowding is associated with deleterious consequences for patient care and throughput. Admission delays worsen ED crowding. Time to admission (TTA)—the time between an ED admission request and internal medicine (IM) admission orders—can be shortened through implementation of a triage hospitalist role. Limited research is available highlighting the impact of triage hospitalists on throughput, care quality, interprofessional practice, and clinician experience of care.
Methods: A triage hospitalist role was piloted and implemented. Run charts were interpreted using accepted rules for deriving statistically significant conclusions. Statistical analysis was applied to interprofessional practice and clinician experience-of-care survey results.
Results: Following implementation, TTA decreased from 5 hours 19 minutes to 2 hours 8 minutes. Emergency department crowding increased from baseline. The reduction in TTA was associated with decreased time from ED arrival to IM admission request, no change in critical care transfers during the initial 24 hours, and increased admissions to inpatient status. Additionally, decreased TTA was associated with no change in referring hospital transfer rates and no change in hospital medicine length of stay. Interprofessional practice attitudes improved among ED clinicians but not IM clinicians. Clinician experience-of-care results were mixed.
Conclusion: A triage hospitalist role is an effective approach for mitigating admission delays, with no evident adverse clinical consequences. A triage hospitalist alone was incapable of resolving ED crowding issues without a complementary focus on downstream bottlenecks.
Keywords: triage hospitalist, admission delay, quality improvement.
Excess time to admission (TTA), defined as the time between an emergency department (ED) admission request and internal medicine (IM) admission orders, contributes to ED crowding, which is associated with deleterious impacts on patient care and throughput. Prior research has correlated ED crowding with an increase in length of stay (LOS)1-3 and total inpatient cost,1 as well as increased inpatient mortality, higher left-without-being-seen rates,4 delays in clinically meaningful care,5,6 and poor patient and clinician satisfaction.6,7 While various solutions have been proposed to alleviate ED crowding,8 excess TTA is one aspect that IM can directly address.
Like many institutions, ours is challenged by ED crowding. Time to admission is a known bottleneck. Underlying factors that contribute to excess TTA include varied admission request volumes in relation to fixed admitting capacity; learner-focused admitting processes; and unreliable strategies for determining whether patients are eligible for ED observation, transfer to an alternative facility, or admission to an alternative primary service.
To address excess TTA, we piloted then implemented a triage hospitalist role, envisioned as responsible for evaluating ED admission requests to IM, making timely determinations of admission appropriateness, and distributing patients to admitting teams. This intervention was selected because of its strengths, including the ability to standardize admission processes, improve the proximity of clinical decision-makers to patient care to reduce delays, and decrease hierarchical imbalances experienced by trainees, and also because the institution expressed a willingness to mitigate its primary weakness (ie, ongoing financial support for sustainability) should it prove successful.
Previously, a triage hospitalist has been defined as “a physician who assesses patients for admission, actively supporting the transition of the patient from the outpatient to the inpatient setting.”9 Velásquez et al surveyed 10 academic medical centers and identified significant heterogeneity in the roles and responsibilities of a triage hospitalist.9 Limited research addresses the impact of this role on throughput. One report described the volume and source of requests evaluated by a triage hospitalist and the frequency with which the triage hospitalists’ assessment of admission appropriateness aligned with that of the referring clinicians.10 No prior research is available demonstrating the impact of this role on care quality, interprofessional practice, or clinician experience of care. This article is intended to address these gaps in the literature.
Methods
Setting
The University of New Mexico Hospital has 537 beds and is the only level-1 trauma and academic medical center in the state. On average, approximately 8000 patients register to be seen in the ED per month. Roughly 600 are admitted to IM per month. This study coincided with the COVID-19 pandemic, with low patient volumes in April 2020, overcapacity census starting in May 2020, and markedly high patient volumes in May/June 2020 and November/December 2020. All authors participated in project development, implementation, and analysis.
Preintervention IM Admission Process
When requesting IM admission, ED clinicians (resident, advanced practice provider [APP], or attending) contacted the IM triage person (typically an IM resident physician) by phone or in person. The IM triage person would then assess whether the patient needed critical care consultation (a unique and separate admission pathway), was eligible for ED observation or transfer to an outside hospital, or was clinically appropriate for IM subacute and floor admission. Pending admissions were evaluated in order of severity of illness or based on wait time if severity of illness was equal. Transfers from the intensive care unit (ICU) and referring hospitals were prioritized. Between 7:00
Triage Hospitalist Pilot
Key changes made during the pilot included scheduling an IM attending to serve as triage hospitalist for all IM admission requests from the ED between 7:00
Measures for Triage Hospitalist Pilot
Data collected included request type (new vs overflow from night) and patient details (name, medical record number). Two time points were recorded: when the EDAR order was entered and when admission orders were entered. Process indicators, including whether the EDAR order was entered and the final triage decision (eg, discharge, IM), were recorded. General feedback was requested at the end of each shift.
Phased Implementation of Triage Hospitalist Role
Triage hospitalist role implementation was approved following the pilot, with additional salary support funded by the institution. A new performance measure (time from admission request to admission order, self-identified goal < 3 hours) was approved by all parties.
In January 2020, the role was scheduled from 7:00
In March 2020, to create a single communication pathway while simultaneously hardwiring our measurement strategy, the EDAR order was modified such that it would automatically prompt a 1-way communication to the triage hospitalist using the institution’s secure messaging software. The message included patient name, medical record number, location, ED attending, reason for admission, and consultation priority, as well as 2 questions prompting ED clinicians to reflect on the most common reasons for the triage hospitalist to recommend against IM admission (eligible for admission to other primary service, transfer to alternative hospital).
In July 2020, the triage hospitalist role was scheduled 24 hours a day, 7 days a week, to meet an institutional request. The schedule was divided into a daytime 7:00
Measures for Triage Hospitalist Role
The primary outcome measure was TTA, defined as the time between EDAR (operationalized using EDAR order timestamp) and IM admission decision (operationalized using inpatient bed request order timestamp). Additional outcome measures included the Centers for Medicare & Medicaid Services Electronic Clinical Quality Measure ED-2 (eCQM ED-2), defined as the median time from admit decision to departure from the ED for patients admitted to inpatient status.
Process measures included time between patient arrival to the ED (operationalized using ED registration timestamp) and EDAR and percentage of IM admissions with an EDAR order. Balancing measures included time between bed request order (referred to as the IM admission order) and subsequent admission orders. While the IM admission order prompts an inpatient clinical encounter and inpatient bed assignment, subsequent admission orders are necessary for clinical care. Additional balancing measures included ICU transfer rate within the first 24 hours, referring facility transfer frequency to IM (an indicator of access for patients at outside hospitals), average hospital medicine LOS (operationalized using ED registration timestamp to discharge timestamp), and admission status (inpatient vs observation).
An anonymous preintervention (December 2019) and postintervention (August 2020) survey focusing on interprofessional practice and clinician experience of care was used to obtain feedback from ED and IM attendings, APPs, and trainees. Emergency department clinicians were asked questions pertaining to their IM colleagues and vice versa. A Likert 5-point scale was used to respond.
Data Analysis
The preintervention period was June 1, 2019, to October 31, 2019; the pilot period was November 1, 2019, to December 31, 2019; the staged implementation period was January 1, 2020, to June 30, 2020; and the postintervention period was July 1, 2020, to December 31, 2020. Run charts for outcome, process, and balancing measures were interpreted using rules for deriving statistically significant conclusions.11 Statistical analysis using a t test assuming unequal variances with P < . 05 to indicate statistical significance was applied to experience-of-care results. The study was approved by the Institutional Review Board.
Results
Triage Hospitalist Pilot Time Period
Seventy-four entries were recorded, 56 (75.7%) reflecting new admission requests. Average time between EDAR order and IM admission order was 40 minutes. The EDAR order was entered into the EMR without prompting in 22 (29.7%) cases. In 56 (75.7%) cases, the final triage decision was IM admission. Other dispositions included 3 discharges, 4 transfers, 3 alternative primary service admissions, 1 ED observation, and 7 triage deferrals pending additional workup or stabilization.
Feedback substantiated several benefits, including improved coordination among IM, ED, and consultant clinicians, as well as early admission of seriously ill patients. Feedback also confirmed several expected challenges, including evidence of communication lapses, difficulty with transfer coordinator integration, difficulty hardwiring elements of the verbal and bedside handoff, and perceived high cognitive load for the triage hospitalist. Several unexpected issues included whether ED APPs can request admission independently and how reconsultation is expected to occur if admission is initially deferred.
Triage Hospitalist Implementation Time Period
Time to admission decreased from a baseline pre-pilot average of 5 hours 19 minutes (median, 4 hours 45 minutes) to a postintervention average of 2 hours 8 minutes, with a statistically significant downward shift post intervention (Figure 1).
ED-2 increased from a baseline average of 3 hours 40 minutes (median, 2 hours 39 minutes), with a statistically significant upward shift starting in May 2020 (Figure 2). Time between patient arrival to the ED and EDAR order decreased from a baseline average of 8 hours 47 minutes (median, 8 hours 37 minutes) to a postintervention average of 5 hours 57 minutes, with a statistically significant downward shift post intervention. Percentage of IM admissions with an EDAR order increased from a baseline average of 47% (median, 47%) to 97%, with a statistically significant upward shift starting in January 2020 (Figure 3).
There was no change in observed average time between IM admission order and subsequent admission orders pre and post intervention (16 minutes vs 18 minutes). However, there was a statistically significant shift up to an average of 40 minutes from January through June 2020, which then resolved. The percentage of patients transferred to the ICU within 24 hours of admission to IM did not change (1.1% pre vs 1.4% post intervention). Frequency of patients transferred in from a referring facility also did not change (26/month vs 22/month). Average hospital medicine LOS did not change to a statistically significant degree (6.48 days vs 6.62 days). The percentage of inpatient admissions relative to short stays increased from a baseline of 74.0% (median, 73.6%) to a postintervention average of 82.4%, with a statistically significant shift upward starting March 2020.
Regarding interprofessional practice and clinician experience of care, 122 of 309 preintervention surveys (39.5% response rate) and 98 of 309 postintervention surveys (31.7% response rate) were completed. Pre- and postintervention responses were not linked.
Regarding interprofessional practice, EM residents and EM attendings experienced statistically significant improvements in all interprofessional practice domains (Table 1). Emergency medicine APPs experienced statistically significant improvements post intervention with “I am satisfied with the level of communication with IM hospitalist clinicians” and “Interactions
For clinician experience of care, EM residents (P < .001) and attendings (P < .001) experienced statistically significant improvements in “Patients are well informed and involved in the decision to admit,” whereas IM residents and attendings, as well as EM APPs, experienced nonstatistically significant improvements (Table 2). All groups except IM attendings experienced a statistically significant improvement (IM resident P = .011, EM resident P < .001, EM APP P = .001, EM attending P < .001) in “I believe that my patients are evaluated and treated within an appropriate time frame.” Internal medicine attendings felt that this indicator worsened to a nonstatistically significant degree. Post intervention, EM groups experienced a statistically significant worsening in “The process of admitting patients to a UNM IM hospitalist service is difficult,” while IM groups experienced a nonstatistically significant worsening.
Discussion
Implementation of the triage hospitalist role led to a significant reduction in average TTA, from 5 hours 19 minutes to 2 hours 8 minutes. Performance has been sustained at 1 hour 42 minutes on average over the past 6 months. The triage hospitalist was successful at reducing TTA because of their focus on evaluating new admission and transfer requests, deferring other admission responsibilities to on-call admitting teams. Early admission led to no increase in ICU transfers or hospitalist LOS. To ensure that earlier admission reflected improved timeliness of care and that new sources of delay were not being created, we measured the time between IM admission and subsequent admission orders. A statistically significant increase to 40 minutes from January through June 2020 was attributable to the hospitalist acclimating to their new role and the need to standardize workflow. This delay subsequently resolved. An additional benefit of the triage hospitalist was an increase in the proportion of inpatient admissions compared with short stays.
ED-2, an indicator of ED crowding, increased from 3 hours 40 minutes, with a statistically significant upward shift starting May 2020. Increasing ED-2 associated with the triage hospitalist role makes intuitive sense. Patients are admitted 2 hours 40 minutes earlier in their hospital course while downstream bottlenecks preventing patient movement to an inpatient bed remained unchanged. Unfortunately, the COVID-19 pandemic complicates interpretation of ED-2 because the measure reflects institutional capacity to match demand for inpatient beds. Fewer ED registrations and lower hospital medicine census (and resulting inpatient bed availability) in April 2020 during the first COVID-19 surge coincided with an ED-2 nadir of 1 hour 46 minutes. The statistically significant upward shift from May onward reflects ongoing and unprecedented patient volumes. It remains difficult to tease apart the presumed lesser contribution of the triage hospitalist role and presumed larger contribution of high patient volumes on ED-2 increases.
An important complementary change was linkage between the EDAR order and our secure messaging software, creating a single source of admission and transfer requests, prompting early ED clinician consideration of factors that could result in alternative disposition, and ensuring a sustainable data source for TTA. The order did not replace direct communication and included guidance for how triage hospitalists should connect with their ED colleagues. Percentage of IM admissions with the EDAR order increased to 97%. Fallouts are attributed to admissions from non-ED sources (eg, referring facility, endoscopy suite transfers). This communication strategy has been expanded as the primary mechanism of initiating consultation requests between IM and all consulting services.
This intervention was successful from the perspective of ED clinicians. Improvements can be attributed to the simplified admission process, timely patient assessment, a perception that patients are better informed of the decision to admit, and the ability to communicate with the triage hospitalist. Emergency medicine APPs may not have experienced similar improvements due to ongoing perceptions of a hierarchical imbalance. Unfortunately, the small but not statistically significant worsening perspective among ED clinicians that “efficiency is more valued than good patient care” and the statistically significant worsening perspective that “admitting patients to a UNM IM hospitalist service is difficult” may be due to the triage hospitalist responsibility for identifying the roughly 25% of patients who are safe for an alternative disposition.
Internal medicine clinicians experienced no significant changes in attitudes. Underlying causes are likely multifactorial and a focus of ongoing work. Internal medicine residents experienced statistically significant improvements for “I am satisfied with the level of communication with EM clinicians” and nonstatistically significant improvements for the other 3 domains, likely because the intervention enabled them to focus on clinical care rather than the administrative tasks and decision-making complexities inherent to the IM admission process. Internal medicine attendings reported a nonstatistically significant worsening in “I am satisfied with the level of communication with EM clinicians,” which is possibly attributable to challenges connecting with ED attendings after being notified that a new admission is pending. Unfortunately, bedside handoff was not hardwired and is done sporadically. Independent of the data, we believe that the triage hospitalist role has facilitated closer ED-IM relationships by aligning clinical priorities, standardizing processes, improving communication, and reducing sources of hierarchical imbalance and conflict. We expected IM attendings and residents to experience some degree of resolution of the perception that “efficiency is more valued than good patient care” because of the addition of a dedicated triage role. Our data also suggest that IM attendings are less likely to agree that “patients are evaluated and treated within an appropriate time frame.” Both concerns may be linked to the triage hospitalist facing multiple admission and transfer sources with variable arrival rates and variable patient complexity, resulting in high cognitive load and the perception that individual tasks are not completed to the best of their abilities.
To our knowledge, this is the first study assessing the impact of the triage hospitalist role on throughput, clinical care quality, interprofessional practice, and clinician experience of care. In the cross-sectional survey of 10 academic medical centers, 8 had defined triage roles filled by IM attendings, while the remainder had IM attendings supervising trainees.9 A complete picture of the prevalence and varying approaches of triage hospitalists models is unknown. Howell et al12 reported on an approach that reduced admission delays without a resulting increase in mortality or LOS. Our approach differed in several ways, with greater involvement of the triage hospitalist in determining a final admission decision, incorporation of EMR communication, and presence of existing throughput challenges preventing patients from moving seamlessly to an inpatient unit.
Conclusion
We believe this effort was successful for several reasons, including adherence to quality improvement best practices, such as engagement of stakeholders early on, the use of data to inform decision-making, the application of technology to hardwire process, and alignment with institutional priorities. Spread of this intervention will be limited by the financial investment required to start and maintain a triage hospitalist role. A primary limitation of this study is the confounding effect of the COVID-19 pandemic on our analysis. Next steps include identification of clinicians wishing to specialize in triage and expanding triage to include non-IM primary services. Additional research to optimize the triage hospitalist experience of care, as well as to measure improvements in patient-centered outcomes, is necessary.
Corresponding author: Christopher Bartlett, MD, MPH; MSC10 5550, 1 University of New Mexico, Albuquerque, NM 87131; CSBartlett@salud.unm.edu
Disclosures: None reported.
1. Huang Q, Thind A, Dreyer JF, et al. The impact of delays to admission from the emergency department on inpatient outcomes. BMC Emerg Med. 2010;10:16. doi:10.1186/1471-227X-10-16
2. Liew D, Liew D, Kennedy MP. Emergency department length of stay independently predicts excess inpatient length of stay. Med J Aust. 2003;179:524-526. doi:10.5694/j.1326-5377.2003.tb05676.x
3. Richardson DB. The access-block effect: relationship between delay to reaching an inpatient bed and inpatient length of stay. Med J Aust. 2002;177:492-495. doi:10.5694/j.1326-5377.2002.tb04917.x
4. Polevoi SK, Quinn JV, Kramer KR. Factors associated with patients who leave without being seen. Acad Emerg Med. 2005;12:232-236. doi:10.1197/j.aem.2004.10.029
5. Bernstein SL, Aronsky D, Duseja R, et al. The effect of emergency department crowding on clinically oriented outcomes. Acad Emerg Med. 2009;16:1-10. doi:10.1111/j.1553-2712.2008.00295.x
6. Vieth TL, Rhodes KV. The effect of crowding on access and quality in an academic ED. Am J Emerg Med. 2006;24:787-794. doi:10.1016/j.ajem.2006.03.026
7. Rondeau KV, Francescutti LH. Emergency department overcrowding: the impact of resource scarcity on physician job satisfaction. J Healthc Manag. 2005;50:327-340; discussion 341-342.
8. Emergency Department Crowding: High Impact Solutions. American College of Emergency Physicians. Emergency Medicine Practice Committee. 2016. Accessed March 31, 2023. https://www.acep.org/globalassets/sites/acep/media/crowding/empc_crowding-ip_092016.pdf
9. Velásquez ST, Wang ES, White AW, et al. Hospitalists as triagists: description of the triagist role across academic medical centers. J Hosp Med. 2020;15:87-90. doi:10.12788/jhm.3327
10. Amick A, Bann M. Characterizing the role of the “triagist”: reasons for triage discordance and impact on disposition. J Gen Intern Med. 2021;36:2177-2179. doi:10.1007/s11606-020-05887-y
11. Perla RJ, Provost LP, Murray SK. The run chart: a simple analytical tool for learning for variation in healthcare processes. BMJ Qual Saf. 2011;20:46-51. doi:10.1136/bmjqs.2009.037895
12. Howell EE, Bessman ES, Rubin HR. Hospitalists and an innovative emergency department admission process. J Gen Intern Med. 2004;19:266-268. doi:10.1111/j.1525-1497.2004.30431.x
Glucagon Prescription Rates for Individuals With Type 1 Diabetes Mellitus Following Implementation of an Electronic Health Records Intervention
From Vanderbilt University School of Medicine, and Vanderbilt University Medical Center, Nashville, TN.
ABSTRACT
Objective: Severe hypoglycemia can alter consciousness and inhibit oral intake, requiring nonoral rescue glucagon administration to raise blood glucose to safe levels. Thus, current guidelines recommend glucagon kit prescriptions for all patients at risk for hypoglycemia, especially patients with type 1 diabetes mellitus (T1DM). At the diabetes outpatient clinic at a tertiary medical center, glucagon prescription rates for T1DM patients remained suboptimal.
Methods: A quality improvement team analyzed patient flow through the endocrinology clinic and identified the lack of a systematic approach to assessing patients for home glucagon prescriptions as a major barrier. The team implemented 2 successive interventions. First, intake staff indicated whether patients lacked an active glucagon prescription on patients’ face sheets. Second, clinical pharmacists reviewed patient prescriptions prior to scheduled visits and pended glucagon orders for patients without active prescriptions. Of note, when a pharmacy pends an order, the pharmacist enters an order into the electronic health record (EHR) but does not sign it. The order is saved for a provider to later access and sign. A statistical process control p-chart tracked monthly prescription rates.
Results: After 7 months, glucagon prescription rates increased from a baseline of 59% to 72% as the new steady state.
Conclusion: This project demonstrates that a series of interventions can improve glucagon prescription rates for patients at risk for hypoglycemia. The project’s success stemmed from combining an EHR-generated report and interdisciplinary staff members’ involvement. Other endocrinology clinics may incorporate this approach to implement similar processes and improve glucagon prescription rates.
Keywords: diabetes, hypoglycemia, glucagon, quality improvement, prescription rates, medical student.
Hypoglycemia limits the management of blood glucose in patients with type 1 diabetes mellitus (T1DM). Severe hypoglycemia, characterized by altered mental status (AMS) or physical status requiring assistance for recovery, can lead to seizure, coma, or death.1 Hypoglycemia in diabetes often occurs iatrogenically, primarily from insulin therapy: 30% to 40% of patients with T1DM and 10% to 30% of patients with insulin-treated type 2 diabetes mellitus experience severe hypoglycemia in a given year.2 One study estimated that nearly 100,000 emergency department visits for hypoglycemia occur in the United States per year, with almost one-third resulting in hospitalization.3
Most patients self-treat mild hypoglycemia with oral intake of carbohydrates. However, since hypoglycemia-induced nausea and AMS can make oral intake more difficult or prevent it entirely, patients require a treatment that family, friends, or coworkers can administer. Rescue glucagon, prescribed as intramuscular injections or intranasal sprays, raises blood glucose to safe levels in 10 to 15 minutes.4 Therefore, the American Diabetes Association (ADA) recommends glucagon for all patients at risk for hypoglycemia, especially patients with T1DM.5 Despite the ADA’s recommendation, current evidence suggests suboptimal glucagon prescription rates, particularly in patients with T1DM. One study reported that, although 85% of US adults with T1DM had formerly been prescribed glucagon, only 68% of these patients (57.8% overall) had a current prescription.4 Few quality improvement efforts have tackled increasing prescription rates. Prior successful studies have attempted to do so via pharmacist-led educational interventions for providers6 and via electronic health record (EHR) notifications for patient risk.7 The project described here aimed to expand upon prior studies with a quality improvement project to increase glucagon prescription rates among patients at risk for severe hypoglycemia.
This study was conducted at a tertiary medical center’s outpatient diabetes clinic; the clinic treats more than 9500 patients with DM annually, more than 2700 of whom have T1DM. In the clinic’s multidisciplinary care model, patients typically follow up every 3 to 6 months, alternating between appointments with fellowship-trained endocrinologists and advanced practice providers (APPs). In addition to having certified diabetes educators, the clinic employs 2 dedicated clinical pharmacists whose duties include assisting providers in prescription management, helping patients identify the most affordable way to obtain their medications, and educating patients regarding their medications.
Patient flow through the clinic involves close coordination with multiple health professionals. Medical assistants (MAs) and licensed practical nurses (LPNs) perform patient intake, document vital signs, and ask screening questions, including dates of patients’ last hemoglobin A1c tests and diabetic eye examination. After intake, the provider (endocrinologist or APP) sees the patient. Once the appointment concludes, patients proceed to the in-house phlebotomy laboratory as indicated and check out with administrative staff to schedule future appointments.
From August 2021 through June 2022, teams of medical students at the tertiary center completed this project as part of a 4-week integrated science course on diabetes. Longitudinal supervision by an endocrinology faculty member ensured project continuity. The project employed the Standards for QUality Improvement Reporting Excellence (SQUIRE 2.0) method for reporting.8
Stakeholder analysis took place in August 2021. Surveyed clinic providers identified patients with T1DM as the most appropriate population and the outpatient setting as the most appropriate site for intervention. A fishbone diagram illustrated stakeholders to interview, impacts of the clinical flow, information technology to leverage, and potential holes contributing to glucagon prescription conversations falling through.
Interviews with T1DM patients, clinical pharmacists, APPs, MAs/LPNs, and endocrinologists identified barriers to glucagon prescription. The interviews and a process map analysis revealed several themes. While patients and providers understood the importance of glucagon prescription, barriers included glucagon cost, prescription fill burden, and, most pervasively, providers forgetting to ask patients whether they have a glucagon prescription and failing to consider glucagon prescriptions.For this study, each team of medical students worked on the project for 1 month. The revolving teams of medical students met approximately once per week for the duration of the project to review data and implementation phases. At the end of each month, the current team recorded the steps they had taken and information they had analyzed in a shared document, prepared short videos summarizing the work completed, and proposed next steps for the incoming team to support knowledge generation and continuity. Students from outgoing teams were available to contact if incoming teams had any questions.
Interventions
In the first implementation phase, which was carried out over 4 months (December 2021 to March 2022), the patient care manager trained MAs/LPNs to write a glucagon reminder on patients’ face sheets. At check-in, MAs/LPNs screened for a current glucagon prescription. If the patient lacked an up-to-date prescription, the MAs/LPNs hand-wrote a reminder on the patient’s face sheet, which was given to the provider immediately prior to seeing the patient. The clinical staff received an email explaining the intervention beforehand; the daily intake staff email included project reminders.
 receive glucagon prescriptions in the clinic after implementation of intervention 2.")
In the second implementation phase, which started in April 2022, had been carried out for 3 months at the time of this report, and is ongoing, clinical pharmacists have been pending glucagon prescriptions ahead of patients’ appointments. Each week, the pharmacists generate an EHR report that includes all patients with T1DM who have attended at least 1 appointment at the clinic within the past year (regardless of whether each patient possessed an active and up-to-date glucagon prescription) and the date of each patient’s next appointment. For patients who have an appointment in the upcoming week and lack an active glucagon prescription, the pharmacists run a benefits investigation to determine the insurance-preferred glucagon formulation and then pend the appropriate order in the EHR. During the patient’s next appointment, the EHR prompts the provider to review and sign the pharmacist’s pended order (Figure 1).
 receive glucagon prescriptions in the clinic after implementation of intervention 2.")
This project used a process measure in its analysis: the percentage of patients with T1DM with an active glucagon prescription at the time of their visit to the clinic. The patient population included all patients with a visit diagnosis of T1DM seen by an APP at the clinic during the time scope of the project. The project’s scope was limited to patients seen by APPs to help standardize appointment comparisons, with the intent to expand to the endocrinologist staff if the interventions proved successful with APPs. Patients seen by APPs were also under the care of endocrinologists and seen by them during this time period. The project excluded no patients.
Each individual patient appointment represented a data point: a time at which an APP could prescribe glucagon for a patient with T1DM. Thus, a single patient who had multiple appointments during the study period would generate multiple data points in this study.
For all T1DM patients at the clinic seen by an APP during the study period, the project aimed to increase the percentage with an active and up-to-date glucagon prescription from 58.8% to 70% over a 6-month period, a relatively modest goal appropriate for the time constraints and that would be similar to the changes seen in previous work in the same clinic.9
This project analyzed de-identified data using a statistical process control chart (specifically, a p-chart) and standard rules for assessing special-cause signals and thus statistical significance.
Results
Baseline data were collected from October 2020 to September 2021. During this time, APPs saw 1959 T1DM patients, of whom 1152 (58.8%) had an active glucagon prescription at the time of visit and 41.2% lacked a glucagon prescription (Figure 2). During the 4 months of implementation phase 1, analysis of the statistical process control chart identified no special cause signal. Therefore, the project moved to a second intervention with implementation phase 2 in April 2022 (3 months of postintervention data are reported). During the entire intervention, 731 of 1080 (67.7%) patients had a glucagon prescription. The average for the last 2 months, with phase 2 fully implemented, was 72.3%, surpassing the 70% threshold identified as the study target (Figure 3).
 showing the proportion of patient visits with an advanced practice provider for type 1 diabetes mellitus with an active glucagon prescription at the")
Interviews with clinical pharmacists during implementation phase 2 revealed that generating the EHR report and reviewing patients with glucagon prescription indications resulted in variable daily workload increases ranging from approximately 15 to 45 minutes, depending on the number of patients requiring intervention that day. During the first month of implementation phase 2, the EHR report required repeated modification to fulfill the intervention needs. Staffing changes over the intervention period potentially impacted the pattern of glucagon prescribing. This project excluded the 2 months immediately prior to implementation phase 1, from October 2021 to November 2021, because the staff had begun having discussions about this initiative, which may have influenced glucagon prescription rates.

Discussion
This project evaluated 2 interventions over the course of 7 months to determine their efficacy in increasing the frequency of glucagon prescribing for individuals with T1DM in an endocrinology clinic. These interventions were associated with increased prescribing from a baseline of 58.8% to 72.3% over the last 2 months of the project. In the first intervention, performed over 4 months, MAs/LPNs wrote reminders on the appropriate patients’ face sheets, which were given to providers prior to appointments. This project adapted the approach from a successful previous quality improvement study on increasing microalbuminuria screening rates.9 However, glucagon prescription rates did not increase significantly, likely because, unlike with microalbuminuria screenings, MAs/LPNs could not pend glucagon prescriptions.
In the second intervention, performed over 3 months, clinical pharmacists pended glucagon prescriptions for identified eligible patients. Glucagon prescribing rates increased considerably, with rates of 72.3% and 72.4% over May and June 2021, respectively, indicating that the intervention successfully established a new higher steady state of proportion of patient visits with active glucagon prescriptions compared with the baseline rate of 58.8%. Given that the baseline data for this clinic were higher than the baseline glucagon prescription rates reported in other studies (49.3%),10 this intervention could have a major impact in clinics with a baseline more comparable to conditions in that study.
This project demonstrated how a combination of an EHR-generated report and interdisciplinary involvement provides an actionable process to increase glucagon prescription rates for patients with T1DM. Compared to prior studies that implemented passive interventions, such as a note template that relies on provider adherence,7 this project emphasizes the benefit of implementing an active systems-level intervention with a pre-pended order.
Regarding prior studies, 1 large, 2-arm study of clinical pharmacists proactively pending orders for appropriate patients showed a 56% glucagon prescription rate in the intervention group, compared with 0.9% in the control group with no pharmacist intervention.11 Our project had a much higher baseline rate: 58.8% prior to intervention vs 0.9% in the nonintervention group for the previous study—likely due to its chosen location’s status as an endocrinology clinic rather than a general health care setting.
A different study that focused on patient education rather than glucagon prescription rates used similar EHR-generated reports to identify appropriate patients and assessed glucagon prescription needs during check-in. Following the educational interventions in that study, patients reporting self-comfort and education with glucagon administration significantly increased from 66.2% to 83.2%, and household member comfort and education with glucagon administration increased from 50.8% to 79.7%. This suggests the possibility of expanding the use of the EHR-generated report to assist not only with increasing glucagon prescription rates, but also with patient education on glucagon use rates and possibly fill rates.7 While novel glucagon products may change uptake rates, no new glucagon products arose or were prescribed at this clinic during the course of data collection.
Of note, our project increased the workload on clinical pharmacists. The pharmacists agreed to participate, despite the increased work, after a collaborative discussion about how to best address the need to increase glucagon prescriptions or patient safety; the pharmacy department had initially agreed to collaborate specifically to identify and attend to unmet needs such as this one. Although this project greatly benefited from the expertise and enthusiasm of the clinical pharmacists involved, this tradeoff requires further study to determine sustainability.
This project had several limitations. Because of the structure in which this intervention occurred (a year-long course with rotating groups of medical students), there was a necessary component of time constraint, and this project had just 2 implementation phases, for a total of 7 months of postintervention data. The clinic has permanently implemented these changes into its workflow, but subsequent assessments are needed to monitor the effects and assess sustainability.
The specific clinical site chosen for this study benefited from dedicated onsite clinical pharmacists, who are not available at all comparable clinical sites. Due to feasibility, this project only assessed whether the providers prescribed the glucagon, not whether the patients filled the prescriptions and used the glucagon when necessary. Although prescribing rates increased in our study, it cannot be assumed that fill rates increased identically.
Finally, interventions relying on EHR-generated reports carry inherent limitations, such as the risk of misidentification or omission of patients who had indications for a glucagon prescription. The project attempted to mitigate this limitation through random sampling of the EHR report to ensure accuracy. Additionally, EHR-generated reports encourage sustainability and expansion to all clinic patients, with far less required overhead work compared to manually derived data.
Future investigations may focus on expanding this intervention to all patients at risk for hypoglycemia, as well as to study further interventions into prescription fill rates and glucagon use rates.
Conclusion
This project indicates that a proactive, interdisciplinary quality improvement project can increase glucagon prescription rates for patients with T1DM in the outpatient setting. The most effective intervention mobilized clinical pharmacists to identify patients with indications for a glucagon prescription using an integrated EHR-generated report and subsequently pend a glucagon order for the endocrinology provider to sign during the visit. The strengths of the approach included using a multidisciplinary team, minimizing costs to patients by leveraging the pharmacists’ expertise to ensure insurance coverage of specific formulations, and utilizing automatic EHR reporting to streamline patient identification. Ideally, improvements in glucagon prescription rates should ultimately decrease hospitalizations and improve treatment of severe hypoglycemia for at-risk patients.
Corresponding author: Chase D. Hendrickson, MD, MPH; chase.d.hendrickson@vanderbilt.edu
Disclosures: None reported.
1. Weinstock RS, Aleppo G, Bailey TS, et al. The Role of Blood Glucose Monitoring in Diabetes Management. American Diabetes Association; 2020.
2. Lamounier RN, Geloneze B, Leite SO, et al. Hypoglycemia incidence and awareness among insulin-treated patients with diabetes: the HAT study in Brazil. Diabetol Metab Syndr. 2018;10:83. doi:10.1186/s13098-018-0379-5
3. Li P, Geng Z, Ladage VP, et al. Early hypoglycaemia and adherence after basal insulin initiation in a nationally representative sample of Medicare beneficiaries with type 2 diabetes. Diabetes Obes Metab. 2019;21(11):2486-2495. doi:10.1111/dom.13832
4. Haymond MW, Liu J, Bispham J, et al. Use of glucagon in patients with type 1 diabetes. Clin Diabetes. 2019;37(2):162-166. doi:10.2337/cd18-0028
5. American Diabetes Association Professional Practice Committee. 6. Glycemic targets: standards of medical care in diabetes-2022. Diabetes Care. 2022; 45(Suppl 1):S83-S96. doi:10.2337/dc22-S006
6. O’Reilly EA, Cross LV, Hayes JS, et al. Impact of pharmacist intervention on glucagon prescribing patterns in an outpatient internal medicine teaching clinic. J Am Pharm Assoc (2003). 2020;60(2):384-390. doi:10.1016/j.japh.2019.04.0097.
7. Cobb EC, Watson NA, Wardian J, et al. Diabetes Center of Excellence Hypoglycemia Emergency Preparedness Project. Clin Diabetes. 2018;36(2):184-186. doi:10.2337/cd17-0040
8. Ogrinc G, Davies L, Goodman D, et al. SQUIRE 2.0 (Standards for QUality Improvement Reporting Excellence): revised publication guidelines from a detailed consensus process. BMJ Qual Saf. 2016;25(12):986-992. doi:10.1136/bmjqs-2015-004411
9. Kam S, Angaramo S, Antoun J, et al. Improving annual albuminuria testing for individuals with diabetes. BMJ Open Qual. 2022;11(1):e001591. doi:10.1136/bmjoq-2021-001591
10. Mitchell BD, He X, Sturdy IM, et al. Glucagon prescription patterns in patients with either type 1 or 2 diabetes with newly prescribed insulin. Endocr Pract. 2016;22(2):123-135. doi:10.4158/EP15831.OR
11. Whitfield N, Gregory P, Liu B, et al. Impact of pharmacist outreach on glucagon prescribing. J Am Pharm Assoc. 2022;62(4):1384-1388.e.1. doi:10.1016/j.japh.2022.01.017
From Vanderbilt University School of Medicine, and Vanderbilt University Medical Center, Nashville, TN.
ABSTRACT
Objective: Severe hypoglycemia can alter consciousness and inhibit oral intake, requiring nonoral rescue glucagon administration to raise blood glucose to safe levels. Thus, current guidelines recommend glucagon kit prescriptions for all patients at risk for hypoglycemia, especially patients with type 1 diabetes mellitus (T1DM). At the diabetes outpatient clinic at a tertiary medical center, glucagon prescription rates for T1DM patients remained suboptimal.
Methods: A quality improvement team analyzed patient flow through the endocrinology clinic and identified the lack of a systematic approach to assessing patients for home glucagon prescriptions as a major barrier. The team implemented 2 successive interventions. First, intake staff indicated whether patients lacked an active glucagon prescription on patients’ face sheets. Second, clinical pharmacists reviewed patient prescriptions prior to scheduled visits and pended glucagon orders for patients without active prescriptions. Of note, when a pharmacy pends an order, the pharmacist enters an order into the electronic health record (EHR) but does not sign it. The order is saved for a provider to later access and sign. A statistical process control p-chart tracked monthly prescription rates.
Results: After 7 months, glucagon prescription rates increased from a baseline of 59% to 72% as the new steady state.
Conclusion: This project demonstrates that a series of interventions can improve glucagon prescription rates for patients at risk for hypoglycemia. The project’s success stemmed from combining an EHR-generated report and interdisciplinary staff members’ involvement. Other endocrinology clinics may incorporate this approach to implement similar processes and improve glucagon prescription rates.
Keywords: diabetes, hypoglycemia, glucagon, quality improvement, prescription rates, medical student.
Hypoglycemia limits the management of blood glucose in patients with type 1 diabetes mellitus (T1DM). Severe hypoglycemia, characterized by altered mental status (AMS) or physical status requiring assistance for recovery, can lead to seizure, coma, or death.1 Hypoglycemia in diabetes often occurs iatrogenically, primarily from insulin therapy: 30% to 40% of patients with T1DM and 10% to 30% of patients with insulin-treated type 2 diabetes mellitus experience severe hypoglycemia in a given year.2 One study estimated that nearly 100,000 emergency department visits for hypoglycemia occur in the United States per year, with almost one-third resulting in hospitalization.3
Most patients self-treat mild hypoglycemia with oral intake of carbohydrates. However, since hypoglycemia-induced nausea and AMS can make oral intake more difficult or prevent it entirely, patients require a treatment that family, friends, or coworkers can administer. Rescue glucagon, prescribed as intramuscular injections or intranasal sprays, raises blood glucose to safe levels in 10 to 15 minutes.4 Therefore, the American Diabetes Association (ADA) recommends glucagon for all patients at risk for hypoglycemia, especially patients with T1DM.5 Despite the ADA’s recommendation, current evidence suggests suboptimal glucagon prescription rates, particularly in patients with T1DM. One study reported that, although 85% of US adults with T1DM had formerly been prescribed glucagon, only 68% of these patients (57.8% overall) had a current prescription.4 Few quality improvement efforts have tackled increasing prescription rates. Prior successful studies have attempted to do so via pharmacist-led educational interventions for providers6 and via electronic health record (EHR) notifications for patient risk.7 The project described here aimed to expand upon prior studies with a quality improvement project to increase glucagon prescription rates among patients at risk for severe hypoglycemia.
This study was conducted at a tertiary medical center’s outpatient diabetes clinic; the clinic treats more than 9500 patients with DM annually, more than 2700 of whom have T1DM. In the clinic’s multidisciplinary care model, patients typically follow up every 3 to 6 months, alternating between appointments with fellowship-trained endocrinologists and advanced practice providers (APPs). In addition to having certified diabetes educators, the clinic employs 2 dedicated clinical pharmacists whose duties include assisting providers in prescription management, helping patients identify the most affordable way to obtain their medications, and educating patients regarding their medications.
Patient flow through the clinic involves close coordination with multiple health professionals. Medical assistants (MAs) and licensed practical nurses (LPNs) perform patient intake, document vital signs, and ask screening questions, including dates of patients’ last hemoglobin A1c tests and diabetic eye examination. After intake, the provider (endocrinologist or APP) sees the patient. Once the appointment concludes, patients proceed to the in-house phlebotomy laboratory as indicated and check out with administrative staff to schedule future appointments.
From August 2021 through June 2022, teams of medical students at the tertiary center completed this project as part of a 4-week integrated science course on diabetes. Longitudinal supervision by an endocrinology faculty member ensured project continuity. The project employed the Standards for QUality Improvement Reporting Excellence (SQUIRE 2.0) method for reporting.8
Stakeholder analysis took place in August 2021. Surveyed clinic providers identified patients with T1DM as the most appropriate population and the outpatient setting as the most appropriate site for intervention. A fishbone diagram illustrated stakeholders to interview, impacts of the clinical flow, information technology to leverage, and potential holes contributing to glucagon prescription conversations falling through.
Interviews with T1DM patients, clinical pharmacists, APPs, MAs/LPNs, and endocrinologists identified barriers to glucagon prescription. The interviews and a process map analysis revealed several themes. While patients and providers understood the importance of glucagon prescription, barriers included glucagon cost, prescription fill burden, and, most pervasively, providers forgetting to ask patients whether they have a glucagon prescription and failing to consider glucagon prescriptions.For this study, each team of medical students worked on the project for 1 month. The revolving teams of medical students met approximately once per week for the duration of the project to review data and implementation phases. At the end of each month, the current team recorded the steps they had taken and information they had analyzed in a shared document, prepared short videos summarizing the work completed, and proposed next steps for the incoming team to support knowledge generation and continuity. Students from outgoing teams were available to contact if incoming teams had any questions.
Interventions
In the first implementation phase, which was carried out over 4 months (December 2021 to March 2022), the patient care manager trained MAs/LPNs to write a glucagon reminder on patients’ face sheets. At check-in, MAs/LPNs screened for a current glucagon prescription. If the patient lacked an up-to-date prescription, the MAs/LPNs hand-wrote a reminder on the patient’s face sheet, which was given to the provider immediately prior to seeing the patient. The clinical staff received an email explaining the intervention beforehand; the daily intake staff email included project reminders.
In the second implementation phase, which started in April 2022, had been carried out for 3 months at the time of this report, and is ongoing, clinical pharmacists have been pending glucagon prescriptions ahead of patients’ appointments. Each week, the pharmacists generate an EHR report that includes all patients with T1DM who have attended at least 1 appointment at the clinic within the past year (regardless of whether each patient possessed an active and up-to-date glucagon prescription) and the date of each patient’s next appointment. For patients who have an appointment in the upcoming week and lack an active glucagon prescription, the pharmacists run a benefits investigation to determine the insurance-preferred glucagon formulation and then pend the appropriate order in the EHR. During the patient’s next appointment, the EHR prompts the provider to review and sign the pharmacist’s pended order (Figure 1).
This project used a process measure in its analysis: the percentage of patients with T1DM with an active glucagon prescription at the time of their visit to the clinic. The patient population included all patients with a visit diagnosis of T1DM seen by an APP at the clinic during the time scope of the project. The project’s scope was limited to patients seen by APPs to help standardize appointment comparisons, with the intent to expand to the endocrinologist staff if the interventions proved successful with APPs. Patients seen by APPs were also under the care of endocrinologists and seen by them during this time period. The project excluded no patients.
Each individual patient appointment represented a data point: a time at which an APP could prescribe glucagon for a patient with T1DM. Thus, a single patient who had multiple appointments during the study period would generate multiple data points in this study.
For all T1DM patients at the clinic seen by an APP during the study period, the project aimed to increase the percentage with an active and up-to-date glucagon prescription from 58.8% to 70% over a 6-month period, a relatively modest goal appropriate for the time constraints and that would be similar to the changes seen in previous work in the same clinic.9
This project analyzed de-identified data using a statistical process control chart (specifically, a p-chart) and standard rules for assessing special-cause signals and thus statistical significance.
Results
Baseline data were collected from October 2020 to September 2021. During this time, APPs saw 1959 T1DM patients, of whom 1152 (58.8%) had an active glucagon prescription at the time of visit and 41.2% lacked a glucagon prescription (Figure 2). During the 4 months of implementation phase 1, analysis of the statistical process control chart identified no special cause signal. Therefore, the project moved to a second intervention with implementation phase 2 in April 2022 (3 months of postintervention data are reported). During the entire intervention, 731 of 1080 (67.7%) patients had a glucagon prescription. The average for the last 2 months, with phase 2 fully implemented, was 72.3%, surpassing the 70% threshold identified as the study target (Figure 3).
Interviews with clinical pharmacists during implementation phase 2 revealed that generating the EHR report and reviewing patients with glucagon prescription indications resulted in variable daily workload increases ranging from approximately 15 to 45 minutes, depending on the number of patients requiring intervention that day. During the first month of implementation phase 2, the EHR report required repeated modification to fulfill the intervention needs. Staffing changes over the intervention period potentially impacted the pattern of glucagon prescribing. This project excluded the 2 months immediately prior to implementation phase 1, from October 2021 to November 2021, because the staff had begun having discussions about this initiative, which may have influenced glucagon prescription rates.
Discussion
This project evaluated 2 interventions over the course of 7 months to determine their efficacy in increasing the frequency of glucagon prescribing for individuals with T1DM in an endocrinology clinic. These interventions were associated with increased prescribing from a baseline of 58.8% to 72.3% over the last 2 months of the project. In the first intervention, performed over 4 months, MAs/LPNs wrote reminders on the appropriate patients’ face sheets, which were given to providers prior to appointments. This project adapted the approach from a successful previous quality improvement study on increasing microalbuminuria screening rates.9 However, glucagon prescription rates did not increase significantly, likely because, unlike with microalbuminuria screenings, MAs/LPNs could not pend glucagon prescriptions.
In the second intervention, performed over 3 months, clinical pharmacists pended glucagon prescriptions for identified eligible patients. Glucagon prescribing rates increased considerably, with rates of 72.3% and 72.4% over May and June 2021, respectively, indicating that the intervention successfully established a new higher steady state of proportion of patient visits with active glucagon prescriptions compared with the baseline rate of 58.8%. Given that the baseline data for this clinic were higher than the baseline glucagon prescription rates reported in other studies (49.3%),10 this intervention could have a major impact in clinics with a baseline more comparable to conditions in that study.
This project demonstrated how a combination of an EHR-generated report and interdisciplinary involvement provides an actionable process to increase glucagon prescription rates for patients with T1DM. Compared to prior studies that implemented passive interventions, such as a note template that relies on provider adherence,7 this project emphasizes the benefit of implementing an active systems-level intervention with a pre-pended order.
Regarding prior studies, 1 large, 2-arm study of clinical pharmacists proactively pending orders for appropriate patients showed a 56% glucagon prescription rate in the intervention group, compared with 0.9% in the control group with no pharmacist intervention.11 Our project had a much higher baseline rate: 58.8% prior to intervention vs 0.9% in the nonintervention group for the previous study—likely due to its chosen location’s status as an endocrinology clinic rather than a general health care setting.
A different study that focused on patient education rather than glucagon prescription rates used similar EHR-generated reports to identify appropriate patients and assessed glucagon prescription needs during check-in. Following the educational interventions in that study, patients reporting self-comfort and education with glucagon administration significantly increased from 66.2% to 83.2%, and household member comfort and education with glucagon administration increased from 50.8% to 79.7%. This suggests the possibility of expanding the use of the EHR-generated report to assist not only with increasing glucagon prescription rates, but also with patient education on glucagon use rates and possibly fill rates.7 While novel glucagon products may change uptake rates, no new glucagon products arose or were prescribed at this clinic during the course of data collection.
Of note, our project increased the workload on clinical pharmacists. The pharmacists agreed to participate, despite the increased work, after a collaborative discussion about how to best address the need to increase glucagon prescriptions or patient safety; the pharmacy department had initially agreed to collaborate specifically to identify and attend to unmet needs such as this one. Although this project greatly benefited from the expertise and enthusiasm of the clinical pharmacists involved, this tradeoff requires further study to determine sustainability.
This project had several limitations. Because of the structure in which this intervention occurred (a year-long course with rotating groups of medical students), there was a necessary component of time constraint, and this project had just 2 implementation phases, for a total of 7 months of postintervention data. The clinic has permanently implemented these changes into its workflow, but subsequent assessments are needed to monitor the effects and assess sustainability.
The specific clinical site chosen for this study benefited from dedicated onsite clinical pharmacists, who are not available at all comparable clinical sites. Due to feasibility, this project only assessed whether the providers prescribed the glucagon, not whether the patients filled the prescriptions and used the glucagon when necessary. Although prescribing rates increased in our study, it cannot be assumed that fill rates increased identically.
Finally, interventions relying on EHR-generated reports carry inherent limitations, such as the risk of misidentification or omission of patients who had indications for a glucagon prescription. The project attempted to mitigate this limitation through random sampling of the EHR report to ensure accuracy. Additionally, EHR-generated reports encourage sustainability and expansion to all clinic patients, with far less required overhead work compared to manually derived data.
Future investigations may focus on expanding this intervention to all patients at risk for hypoglycemia, as well as to study further interventions into prescription fill rates and glucagon use rates.
Conclusion
This project indicates that a proactive, interdisciplinary quality improvement project can increase glucagon prescription rates for patients with T1DM in the outpatient setting. The most effective intervention mobilized clinical pharmacists to identify patients with indications for a glucagon prescription using an integrated EHR-generated report and subsequently pend a glucagon order for the endocrinology provider to sign during the visit. The strengths of the approach included using a multidisciplinary team, minimizing costs to patients by leveraging the pharmacists’ expertise to ensure insurance coverage of specific formulations, and utilizing automatic EHR reporting to streamline patient identification. Ideally, improvements in glucagon prescription rates should ultimately decrease hospitalizations and improve treatment of severe hypoglycemia for at-risk patients.
Corresponding author: Chase D. Hendrickson, MD, MPH; chase.d.hendrickson@vanderbilt.edu
Disclosures: None reported.
1. Weinstock RS, Aleppo G, Bailey TS, et al. The Role of Blood Glucose Monitoring in Diabetes Management. American Diabetes Association; 2020.
2. Lamounier RN, Geloneze B, Leite SO, et al. Hypoglycemia incidence and awareness among insulin-treated patients with diabetes: the HAT study in Brazil. Diabetol Metab Syndr. 2018;10:83. doi:10.1186/s13098-018-0379-5
3. Li P, Geng Z, Ladage VP, et al. Early hypoglycaemia and adherence after basal insulin initiation in a nationally representative sample of Medicare beneficiaries with type 2 diabetes. Diabetes Obes Metab. 2019;21(11):2486-2495. doi:10.1111/dom.13832
4. Haymond MW, Liu J, Bispham J, et al. Use of glucagon in patients with type 1 diabetes. Clin Diabetes. 2019;37(2):162-166. doi:10.2337/cd18-0028
5. American Diabetes Association Professional Practice Committee. 6. Glycemic targets: standards of medical care in diabetes-2022. Diabetes Care. 2022; 45(Suppl 1):S83-S96. doi:10.2337/dc22-S006
6. O’Reilly EA, Cross LV, Hayes JS, et al. Impact of pharmacist intervention on glucagon prescribing patterns in an outpatient internal medicine teaching clinic. J Am Pharm Assoc (2003). 2020;60(2):384-390. doi:10.1016/j.japh.2019.04.0097.
7. Cobb EC, Watson NA, Wardian J, et al. Diabetes Center of Excellence Hypoglycemia Emergency Preparedness Project. Clin Diabetes. 2018;36(2):184-186. doi:10.2337/cd17-0040
8. Ogrinc G, Davies L, Goodman D, et al. SQUIRE 2.0 (Standards for QUality Improvement Reporting Excellence): revised publication guidelines from a detailed consensus process. BMJ Qual Saf. 2016;25(12):986-992. doi:10.1136/bmjqs-2015-004411
9. Kam S, Angaramo S, Antoun J, et al. Improving annual albuminuria testing for individuals with diabetes. BMJ Open Qual. 2022;11(1):e001591. doi:10.1136/bmjoq-2021-001591
10. Mitchell BD, He X, Sturdy IM, et al. Glucagon prescription patterns in patients with either type 1 or 2 diabetes with newly prescribed insulin. Endocr Pract. 2016;22(2):123-135. doi:10.4158/EP15831.OR
11. Whitfield N, Gregory P, Liu B, et al. Impact of pharmacist outreach on glucagon prescribing. J Am Pharm Assoc. 2022;62(4):1384-1388.e.1. doi:10.1016/j.japh.2022.01.017
Implementation of a Multidisciplinary Team–Based Clinical Care Pathway Is Associated With Increased Surgery Rates for Infective Endocarditis
From the University of Missouri School of Medicine, Columbia, MO (Haley Crosby); Department of Clinical Family and Community Medicine, University of Missouri, Columbia, MO (Dr. Pierce); and Department of Medicine, Divisions of Infectious Diseases and Pulmonary, Critical Care and Environmental Medicine, University of Missouri, Columbia, MO, and Divisions of Pulmonary and Critical Care Medicine and Infectious Diseases, University of Maryland Baltimore Washington Medical Center, Glen Burnie, MD (Dr. Regunath).
ABSTRACT
Objective: Multidisciplinary teams (MDTs) improve outcomes for patients with infective endocarditis (IE), but methods of implementation vary. In our academic medical center, we developed an MDT approach guided by a clinical care pathway and assessed outcomes of patients with IE.
Methods: We compared outcomes of patients with IE and indications for surgery between December 2018 and June 2020 with our prior published data for the period January to December 2016. MDT interventions involved recurring conferences with infectious diseases physicians in team meetings and promoting a clinical care pathway to guide providers on steps in management. Primary outcomes were surgery and in-hospital death.
Results: Prior to the intervention, 6 of 21 (28.6%) patients with indications for surgery underwent surgery or were transferred to higher centers for surgery, and 6 (28.6%) patients died. Post intervention, 17 of 31 (54.8%) patients underwent or were transferred for surgery, and 5 (16.1%) died. After adjusting for age and gender, the odds of surgery or transfer for surgery for patients in the postintervention period were 4.88 (95% CI, 1.20-19.79; P = .027) compared with the pre-intervention period. The odds ratio for death among patients in the postintervention period was 0.40 (95% CI, 0.09-1.69; P = .21).
Conclusion: An MDT team approach using a clinical pathway was associated with an increased number of surgeries performed for IE and may lower rates of in-hospital mortality.
Keywords: infective endocarditis, clinical pathway, quality improvement, multidisciplinary team, valve surgery.
Infective endocarditis (IE) is associated with significant morbidity and mortality.1 Rates of IE due to Staphylococcus aureus are increasing in the United States.2 Reported in-hospital mortality from IE ranges from 15% to 20%.3
Clinical pathways are defined as “structured, multidisciplinary plans of care used by health services to detail essential steps in the care of patients with a specific clinical problem.”12 In the modern era, these pathways are often developed and implemented via the electronic health record (EHR) system. Studies of clinical pathways generally demonstrate improvements in patient outcomes, quality of care, or resource utilization.13,14 Clinical pathways represent 1 possible approach to the implementation of a MDT in the care of patients with IE.15
In our earlier work, we used quality improvement principles in the design of an MDT approach to IE care at our institution.16 Despite having indications for surgery, 12 of 21 (57.1%) patients with IE did not undergo surgery, and we identified these missed opportunities for surgery as a leverage point for improvement of outcomes. With input from the various specialties and stakeholders, we developed a clinical pathway (algorithm) for the institutional management of IE that guides next steps in clinical care and their timelines, aiming to reduce by 50% (from 57.1% to 28.6%) the number of patients with IE who do not undergo surgery despite guideline indications for early surgical intervention. In this report, we describe the implementation of this clinical pathway as our MDT approach to the care of patients with IE at our institution.
Methods
The University of Missouri, Columbia, is a tertiary care academic health system with 5 hospitals and more than 60 clinic locations across central Missouri. In the spring of 2018, an MDT was developed, with support from administrative leaders, to improve the care of patients with IE at our institution. The work group prioritized one leverage point to improve IE outcomes, which was improving the number of surgeries performed on those IE patients who had guideline indications for surgery. A clinical pathway was developed around this leverage point (Figure 1). The pathway leveraged the 6 T’s (Table 1) to guide providers through the evaluation and management of IE.17 The pathway focused on improving adherence to standards of care and reduction in practice variation by defining indications for referrals and diagnostic interventions, helping to reduce delays in consultation and diagnosis. The pathway also clearly outlined the surgical indications and timing for patients with IE and provided the basis for decisions to proceed with surgery.

Starting in late 2018, in collaboration with cardiology and CTS teams, ID specialists socialized the clinical pathway to inpatient services that cared for patients with IE. Infectious diseases physicians also provided recurring conferences on the effectiveness of MDTs in IE management and participated in heart-valve team case discussions. Finally, in May 2019, an electronic version of the pathway was embedded in the EHR system using a Cerner PowerChart feature known as Care Pathways. The feature presents the user with algorithm questions in the EHR and provides recommendations, relevant orders, timelines, and other decision support in the clinical pathway. The feature is available to all providers in the health system.

To evaluate the effectiveness of our intervention, we recorded outcomes for patients with IE with surgical indications between December 2018 and June 2020 and compared them with our prior published data from January to December 2016. Cases of IE for the current study period were identified via retrospective chart review. Records from December 2018 to June 2020 were searched using International Statistical Classification of Diseases, Tenth Revision (ICD-10) discharge codes for IE (I33, I33.0, I33.9, I38, I39, M32.11). To select those patients with definitive IE and indications for surgery, the following criteria were applied: age ≥ 18 years; fulfilled modified Duke criteria for definite IE18; and met ≥ 1 American Heart Association (AHA)/Infection Diseases Society of America criteria for recommendation for surgery. Indications for surgery were ≥ 1 of the following: left-sided endocarditis caused by S aureus, fungal, or highly resistant organism; new heart block; annular or aortic abscess; persistent bacteremia or fever despite 5 days of appropriate antimicrobials; vegetation size ≥ 10 mm and evidence of embolic phenomena; recurrence of prosthetic valve infection; recurrent emboli and persistent vegetation despite antimicrobials; and increase in vegetation size despite antimicrobials.16
Age was treated as a categorical variable, using the age groups 18 to 44 years, 45 to 64 years, and 65 years and older. Gender was self-reported. Primary outcomes were surgery or transfer to a higher center for surgery and in-hospital death. Secondary outcomes included consults to teams involved in multidisciplinary care of patients with IE, including ID, cardiology, and CTS. Bivariate analyses were performed using Pearson χ2 tests. Odds ratios for surgery and death were calculated using a multivariate logistic regression model including age and gender covariates. Statistical significance was defined at α = 0.05, and statistical analysis was performed using Stata/IC v16.1 (StataCorp LLC). Our university institutional review board (IRB) reviewed the project (#2010858-QI) and determined that the project was quality-improvement activity, not human subject research, and therefore did not require additional IRB review.
Results
We identified 21 patients in the pre-intervention period and 31 patients in the postintervention period with definitive IE who had guideline indications for surgery. The postintervention cohort was older and had more male patients; this difference was not statistically significant. No differences were noted between the groups for race, gender, or intravenous (IV) drug use (Table 2). Chi-square tests of independence were performed to assess the relationship between age and our primary outcomes. There was a significant relationship between age and the likelihood of receiving or being transferred for surgery (59.3% vs 50% vs 7.7% for 18-44 y, 45-64 y, and ≥ 65 y, respectively; χ2 [2, N = 52] = 9.67; P = .008), but not between age and mortality (14.8% vs 25.0% vs 30.8% for 18-44 y, 45-64 y, and ≥ 65 y, respectively; χ2 = 1.48 [2, N = 52; P = .478]. The electronic version of the clinical pathway was activated and used in only 3 of the 31 patients in the postintervention period. Consultations to ID, cardiology, and CTS teams were compared between the study periods (Table 2). Although more consultations were seen in the postintervention period, differences were not statistically significant.

The unadjusted primary outcomes are shown in Table 2. More surgeries were performed per guideline indications, and fewer deaths were noted in the postintervention period than in the pre-intervention period, but the differences were not statistically significant (Table 2).
Because the postintervention period had more male patients and older patients, we evaluated the outcomes using a logistic regression model controlling for both age and gender. The odds of surgery or transfer for surgery for patients in the postintervention period were 4.88 (95% CI, 1.20-19.79; P = .027) as compared with the pre-intervention period, and the odds ratio for death among patients in the postintervention period compared with the pre-intervention period was 0.40 (95% CI, 0.09-1.69; P = .21) (Figure 2).
 probability of surgery or transfer for surgery and (B) probability of in-hospital death.")
Discussion
In our study, patients with IE with guideline indications for surgery had significantly higher rates of surgery in the postintervention period than in the pre-intervention period. The implementation of an MDT, recurring educational sessions, and efforts to implement and familiarize team members with the clinical pathway approach are the most likely reasons for this change. The increased rates of surgery in the postintervention period were the likely proximate cause of the 60% reduction in in-hospital mortality. This improvement in mortality, while not statistically significant, is very likely to be clinically significant and helps reinforce the value of the MDT intervention used.
Our findings are consistent with existing and mounting literature on the use of MDTs to improve outcomes for patients with IE, including 2 studies that noted an increased rate of surgery for patients with indications.8,19 Several other studies in both Europe and North America have found significant decreases in mortality,6-11,20,21 rates of complications,9 time to diagnosis and treatment,11 and length of stay9,20 for patients with IE managed with an MDT strategy. Although current AHA guidelines for care of patients with IE do suggest an MDT approach, the strategy for this approach is not well established.22 Only 1 study that has implemented a new MDT protocol for care of IE has been conducted in the United States.8
While effective MDTs certainly improve outcomes in patients with IE, there are reported differences in implementation of such an approach. With the MDT model as the core, various implementations included regular case conferences,10,11,19,21,23 formation of a consulting team,6,8 or establishment of a new protocol or algorithm for care.8,9,20 Our approach used a clinical pathway as a basis for improved communication among consulting services, education of learning providers via regular case conferences, and implementation of an electronic clinical care pathway to guide them step by step. Our pathway followed the institutionally standardized algorithm (Figure 1), using what we called the 6 T’s approach (Table 1), that guides providers to evaluate critical cases in a fast track.17
To the best of our knowledge, ours is the first report of an MDT that used an electronic clinical care pathway embedded within the EHR. The electronic version of our clinical pathway went live for only the second half of the postintervention study period, which is the most likely reason for its limited utilization. It is also possible that educational efforts in the first half of the intervention period were sufficient to familiarize providers with the care pathway such that the electronic version was seldom needed. We are exploring other possible ways of improving electronic pathway utilization, such as improving the feature usability and further systemwide educational efforts.
Our study has other limitations. Quasi-experimental before-and-after comparisons are subject to confounding from concurrent interventions. We had a substantial change in cardiothoracic faculty soon after the commencement of our efforts to form the MDT, and thus cannot rule out differences related to their comfort level in considering or offering surgery. We also cannot rule out a Hawthorne effect, where knowledge of the ongoing quality-improvement project changed provider behavior, making surgery more likely. We did not evaluate rates of right- versus left-sided endocarditis, which have been linked to mortality.24 Our study also was performed across a single academic institution, which may limit its generalizability. Finally, our study may not have been adequately powered to detect differences in mortality due to implementation of the MDT approach.
Conclusion
Our work suggests that an MDT for IE can be successfully designed and implemented with a clinical pathway using quality-improvement tools in centers where subspecialty services are available. Our approach was associated with a higher rate of surgery among patients with guideline indications for surgery and may reduce in-hospital mortality. An electronic clinical care pathway embedded in the EHR is feasible and may have a role in MDT implementation.
These data were also accepted as a poster at IDWeek 2022, Washington, DC. The poster abstract is published in an online supplement of Open Forum Infectious Diseases as an abstract publication.
Corresponding author: Haley Crosby; hwc2pd@health.missouri.edu
Disclosures: None reported.
1. Baddour LM, Wilson WR, Bayer AS, et al. Infective endocarditis in adults: diagnosis, antimicrobial therapy, and management of complications: a scientific statement for healthcare professionals from the American Heart Association. Circulation. 2015;132(15):1435-1486. doi:10.1161/cir.0000000000000296
2. Federspiel JJ, Stearns SC, Peppercorn AF, et al. Increasing US rates of endocarditis with Staphylococcus aureus: 1999-2008. Arch Intern Med. 2012;172(4):363-365. doi:10.1001/archinternmed.2011.1027
3. Nishimura RA, Otto CM, Bonow RO, et al. 2014 AHA/ACC Guideline for the Management of Patients With Valvular Heart Disease: a report of the American College of Cardiology/American Heart Association Task Force on Practice Guidelines. Circulation. 2014;129(23):e521-e643. doi:10.1161/cir.0000000000000031
4. Chambers J, Sandoe J, Ray S, et al. The infective endocarditis team: recommendations from an international working group. Heart. 2014;100(7):524-527. doi:10.1136/heartjnl-2013-304354
5. Habib G, Lancellotti P, Antunes MJ, et al. 2015 ESC Guidelines for the management of infective endocarditis: The Task Force for the Management of Infective Endocarditis of the European Society of Cardiology (ESC). Endorsed by: European Association for Cardio-Thoracic Surgery (EACTS), the European Association of Nuclear Medicine (EANM). Eur Heart J. 2015;36(44):3075-3128. doi:10.1093/eurheartj/ehv319
6. Chirillo F, Scotton P, Rocco F, et al. Impact of a multidisciplinary management strategy on the outcome of patients with native valve infective endocarditis. Am J Cardiol. 2013;112(8):1171-1176. doi:10.1016/j.amjcard.2013.05.060
7. Botelho-Nevers E, Thuny F, Casalta JP, et al. Dramatic reduction in infective endocarditis-related mortality with a management-based approach. Arch Intern Med. 2009;169(14):1290-1298. doi:10.1001/archinternmed.2009.192
8. El-Dalati S, Cronin D, Riddell IV J, et al. The clinical impact of implementation of a multidisciplinary endocarditis team. Ann Thorac Surg. 2022;113(1):118-124.
9. Carrasco-Chinchilla F, Sánchez-Espín G, Ruiz-Morales J, et al. Influence of a multidisciplinary alert strategy on mortality due to left-sided infective endocarditis. Rev Esp Cardiol (Engl Ed). 2014;67(5):380-386. doi:10.1016/j.rec.2013.09.010
10. Issa N, Dijos M, Greib C, et al. Impact of an endocarditis team in the management of 357 infective endocarditis [abstract]. Open Forum Infect Dis. 2016;3(suppl 1):S201. doi:10.1093/ofid/ofw172.825
11. Kaura A, Byrne J, Fife A, et al. Inception of the ‘endocarditis team’ is associated with improved survival in patients with infective endocarditis who are managed medically: findings from a before-and-after study. Open Heart. 2017;4(2):e000699. doi:10.1136/openhrt-2017-000699
12. Rotter T, Kinsman L, James E, et al. Clinical pathways: effects on professional practice, patient outcomes, length of stay and hospital costs. Cochrane Database Syst Rev. 2010;(3):Cd006632. doi:10.1002/14651858.CD006632.pub2
13. Neame MT, Chacko J, Surace AE, et al. A systematic review of the effects of implementing clinical pathways supported by health information technologies. J Am Med Inform Assoc. 2019;26(4):356-363. doi:10.1093/jamia/ocy176
14. Trimarchi L, Caruso R, Magon G, et al. Clinical pathways and patient-related outcomes in hospital-based settings: a systematic review and meta-analysis of randomized controlled trials. Acta Biomed. 2021;92(1):e2021093. doi:10.23750/abm.v92i1.10639
15. Gibbons EF, Huang G, Aldea G, et al. A multidisciplinary pathway for the diagnosis and treatment of infectious endocarditis. Crit Pathw Cardiol. 2020;19(4):187-194. doi:10.1097/hpc.0000000000000224
16. Regunath H, Vasudevan A, Vyas K, et al. A quality improvement initiative: developing a multi-disciplinary team for infective endocarditis. Mo Med. 2019;116(4):291-296.
17. Regunath H, Whitt SP. Multidisciplinary service delivery for the endocarditis patient. In: Infective Endocarditis: A Multidisciplinary Approach. 1st ed. Kilic A, ed. Academic Press; 2022.
18. Durack DT, Lukes AS, Bright DK. New criteria for diagnosis of infective endocarditis: utilization of specific echocardiographic findings. Duke Endocarditis Service. Am J Med. 1994;96(3):200-209. doi:10.1016/0002-9343(94)90143-0
19. Tan C, Hansen MS, Cohen G, et al. Case conferences for infective endocarditis: a quality improvement initiative. PLoS One. 2018;13(10):e0205528. doi:10.1371/journal.pone.0205528
20. Ruch Y, Mazzucotelli JP, Lefebvre F, et al. Impact of setting up an “endocarditis team” on the management of infective endocarditis. Open Forum Infect Dis. 2019;6(9):ofz308. doi:10.1093/ofid/ofz308
21. Camou F, Dijos M, Barandon L, et al. Management of infective endocarditis and multidisciplinary approach. Med Mal Infect. 2019;49(1):17-22. doi:10.1016/j.medmal.2018.06.007
22. Pettersson GB, Hussain ST. Current AATS guidelines on surgical treatment of infective endocarditis. Ann Cardiothorac Surg. 2019;8(6):630-644. doi:10.21037/acs.2019.10.05
23. Mestres CA, Paré JC, Miró JM. Organization and functioning of a multidisciplinary team for the diagnosis and treatment of infective endocarditis: a 30-year perspective (1985-2014). Rev Esp Cardiol (Engl Ed). 2015;68(5):363-368. doi:10.1016/j.rec.2014.10.006
24. Stavi V, Brandstaetter E, Sagy I, et al. Comparison of clinical characteristics and prognosis in patients with right- and left-sided infective endocarditis. Rambam Maimonides Med J. 2019;10(1):e00003. doi:10.5041/rmmj.10338
From the University of Missouri School of Medicine, Columbia, MO (Haley Crosby); Department of Clinical Family and Community Medicine, University of Missouri, Columbia, MO (Dr. Pierce); and Department of Medicine, Divisions of Infectious Diseases and Pulmonary, Critical Care and Environmental Medicine, University of Missouri, Columbia, MO, and Divisions of Pulmonary and Critical Care Medicine and Infectious Diseases, University of Maryland Baltimore Washington Medical Center, Glen Burnie, MD (Dr. Regunath).
ABSTRACT
Objective: Multidisciplinary teams (MDTs) improve outcomes for patients with infective endocarditis (IE), but methods of implementation vary. In our academic medical center, we developed an MDT approach guided by a clinical care pathway and assessed outcomes of patients with IE.
Methods: We compared outcomes of patients with IE and indications for surgery between December 2018 and June 2020 with our prior published data for the period January to December 2016. MDT interventions involved recurring conferences with infectious diseases physicians in team meetings and promoting a clinical care pathway to guide providers on steps in management. Primary outcomes were surgery and in-hospital death.
Results: Prior to the intervention, 6 of 21 (28.6%) patients with indications for surgery underwent surgery or were transferred to higher centers for surgery, and 6 (28.6%) patients died. Post intervention, 17 of 31 (54.8%) patients underwent or were transferred for surgery, and 5 (16.1%) died. After adjusting for age and gender, the odds of surgery or transfer for surgery for patients in the postintervention period were 4.88 (95% CI, 1.20-19.79; P = .027) compared with the pre-intervention period. The odds ratio for death among patients in the postintervention period was 0.40 (95% CI, 0.09-1.69; P = .21).
Conclusion: An MDT team approach using a clinical pathway was associated with an increased number of surgeries performed for IE and may lower rates of in-hospital mortality.
Keywords: infective endocarditis, clinical pathway, quality improvement, multidisciplinary team, valve surgery.
Infective endocarditis (IE) is associated with significant morbidity and mortality.1 Rates of IE due to Staphylococcus aureus are increasing in the United States.2 Reported in-hospital mortality from IE ranges from 15% to 20%.3
Clinical pathways are defined as “structured, multidisciplinary plans of care used by health services to detail essential steps in the care of patients with a specific clinical problem.”12 In the modern era, these pathways are often developed and implemented via the electronic health record (EHR) system. Studies of clinical pathways generally demonstrate improvements in patient outcomes, quality of care, or resource utilization.13,14 Clinical pathways represent 1 possible approach to the implementation of a MDT in the care of patients with IE.15
In our earlier work, we used quality improvement principles in the design of an MDT approach to IE care at our institution.16 Despite having indications for surgery, 12 of 21 (57.1%) patients with IE did not undergo surgery, and we identified these missed opportunities for surgery as a leverage point for improvement of outcomes. With input from the various specialties and stakeholders, we developed a clinical pathway (algorithm) for the institutional management of IE that guides next steps in clinical care and their timelines, aiming to reduce by 50% (from 57.1% to 28.6%) the number of patients with IE who do not undergo surgery despite guideline indications for early surgical intervention. In this report, we describe the implementation of this clinical pathway as our MDT approach to the care of patients with IE at our institution.
Methods
The University of Missouri, Columbia, is a tertiary care academic health system with 5 hospitals and more than 60 clinic locations across central Missouri. In the spring of 2018, an MDT was developed, with support from administrative leaders, to improve the care of patients with IE at our institution. The work group prioritized one leverage point to improve IE outcomes, which was improving the number of surgeries performed on those IE patients who had guideline indications for surgery. A clinical pathway was developed around this leverage point (Figure 1). The pathway leveraged the 6 T’s (Table 1) to guide providers through the evaluation and management of IE.17 The pathway focused on improving adherence to standards of care and reduction in practice variation by defining indications for referrals and diagnostic interventions, helping to reduce delays in consultation and diagnosis. The pathway also clearly outlined the surgical indications and timing for patients with IE and provided the basis for decisions to proceed with surgery.
Starting in late 2018, in collaboration with cardiology and CTS teams, ID specialists socialized the clinical pathway to inpatient services that cared for patients with IE. Infectious diseases physicians also provided recurring conferences on the effectiveness of MDTs in IE management and participated in heart-valve team case discussions. Finally, in May 2019, an electronic version of the pathway was embedded in the EHR system using a Cerner PowerChart feature known as Care Pathways. The feature presents the user with algorithm questions in the EHR and provides recommendations, relevant orders, timelines, and other decision support in the clinical pathway. The feature is available to all providers in the health system.
To evaluate the effectiveness of our intervention, we recorded outcomes for patients with IE with surgical indications between December 2018 and June 2020 and compared them with our prior published data from January to December 2016. Cases of IE for the current study period were identified via retrospective chart review. Records from December 2018 to June 2020 were searched using International Statistical Classification of Diseases, Tenth Revision (ICD-10) discharge codes for IE (I33, I33.0, I33.9, I38, I39, M32.11). To select those patients with definitive IE and indications for surgery, the following criteria were applied: age ≥ 18 years; fulfilled modified Duke criteria for definite IE18; and met ≥ 1 American Heart Association (AHA)/Infection Diseases Society of America criteria for recommendation for surgery. Indications for surgery were ≥ 1 of the following: left-sided endocarditis caused by S aureus, fungal, or highly resistant organism; new heart block; annular or aortic abscess; persistent bacteremia or fever despite 5 days of appropriate antimicrobials; vegetation size ≥ 10 mm and evidence of embolic phenomena; recurrence of prosthetic valve infection; recurrent emboli and persistent vegetation despite antimicrobials; and increase in vegetation size despite antimicrobials.16
Age was treated as a categorical variable, using the age groups 18 to 44 years, 45 to 64 years, and 65 years and older. Gender was self-reported. Primary outcomes were surgery or transfer to a higher center for surgery and in-hospital death. Secondary outcomes included consults to teams involved in multidisciplinary care of patients with IE, including ID, cardiology, and CTS. Bivariate analyses were performed using Pearson χ2 tests. Odds ratios for surgery and death were calculated using a multivariate logistic regression model including age and gender covariates. Statistical significance was defined at α = 0.05, and statistical analysis was performed using Stata/IC v16.1 (StataCorp LLC). Our university institutional review board (IRB) reviewed the project (#2010858-QI) and determined that the project was quality-improvement activity, not human subject research, and therefore did not require additional IRB review.
Results
We identified 21 patients in the pre-intervention period and 31 patients in the postintervention period with definitive IE who had guideline indications for surgery. The postintervention cohort was older and had more male patients; this difference was not statistically significant. No differences were noted between the groups for race, gender, or intravenous (IV) drug use (Table 2). Chi-square tests of independence were performed to assess the relationship between age and our primary outcomes. There was a significant relationship between age and the likelihood of receiving or being transferred for surgery (59.3% vs 50% vs 7.7% for 18-44 y, 45-64 y, and ≥ 65 y, respectively; χ2 [2, N = 52] = 9.67; P = .008), but not between age and mortality (14.8% vs 25.0% vs 30.8% for 18-44 y, 45-64 y, and ≥ 65 y, respectively; χ2 = 1.48 [2, N = 52; P = .478]. The electronic version of the clinical pathway was activated and used in only 3 of the 31 patients in the postintervention period. Consultations to ID, cardiology, and CTS teams were compared between the study periods (Table 2). Although more consultations were seen in the postintervention period, differences were not statistically significant.
The unadjusted primary outcomes are shown in Table 2. More surgeries were performed per guideline indications, and fewer deaths were noted in the postintervention period than in the pre-intervention period, but the differences were not statistically significant (Table 2).
Because the postintervention period had more male patients and older patients, we evaluated the outcomes using a logistic regression model controlling for both age and gender. The odds of surgery or transfer for surgery for patients in the postintervention period were 4.88 (95% CI, 1.20-19.79; P = .027) as compared with the pre-intervention period, and the odds ratio for death among patients in the postintervention period compared with the pre-intervention period was 0.40 (95% CI, 0.09-1.69; P = .21) (Figure 2).
Discussion
In our study, patients with IE with guideline indications for surgery had significantly higher rates of surgery in the postintervention period than in the pre-intervention period. The implementation of an MDT, recurring educational sessions, and efforts to implement and familiarize team members with the clinical pathway approach are the most likely reasons for this change. The increased rates of surgery in the postintervention period were the likely proximate cause of the 60% reduction in in-hospital mortality. This improvement in mortality, while not statistically significant, is very likely to be clinically significant and helps reinforce the value of the MDT intervention used.
Our findings are consistent with existing and mounting literature on the use of MDTs to improve outcomes for patients with IE, including 2 studies that noted an increased rate of surgery for patients with indications.8,19 Several other studies in both Europe and North America have found significant decreases in mortality,6-11,20,21 rates of complications,9 time to diagnosis and treatment,11 and length of stay9,20 for patients with IE managed with an MDT strategy. Although current AHA guidelines for care of patients with IE do suggest an MDT approach, the strategy for this approach is not well established.22 Only 1 study that has implemented a new MDT protocol for care of IE has been conducted in the United States.8
While effective MDTs certainly improve outcomes in patients with IE, there are reported differences in implementation of such an approach. With the MDT model as the core, various implementations included regular case conferences,10,11,19,21,23 formation of a consulting team,6,8 or establishment of a new protocol or algorithm for care.8,9,20 Our approach used a clinical pathway as a basis for improved communication among consulting services, education of learning providers via regular case conferences, and implementation of an electronic clinical care pathway to guide them step by step. Our pathway followed the institutionally standardized algorithm (Figure 1), using what we called the 6 T’s approach (Table 1), that guides providers to evaluate critical cases in a fast track.17
To the best of our knowledge, ours is the first report of an MDT that used an electronic clinical care pathway embedded within the EHR. The electronic version of our clinical pathway went live for only the second half of the postintervention study period, which is the most likely reason for its limited utilization. It is also possible that educational efforts in the first half of the intervention period were sufficient to familiarize providers with the care pathway such that the electronic version was seldom needed. We are exploring other possible ways of improving electronic pathway utilization, such as improving the feature usability and further systemwide educational efforts.
Our study has other limitations. Quasi-experimental before-and-after comparisons are subject to confounding from concurrent interventions. We had a substantial change in cardiothoracic faculty soon after the commencement of our efforts to form the MDT, and thus cannot rule out differences related to their comfort level in considering or offering surgery. We also cannot rule out a Hawthorne effect, where knowledge of the ongoing quality-improvement project changed provider behavior, making surgery more likely. We did not evaluate rates of right- versus left-sided endocarditis, which have been linked to mortality.24 Our study also was performed across a single academic institution, which may limit its generalizability. Finally, our study may not have been adequately powered to detect differences in mortality due to implementation of the MDT approach.
Conclusion
Our work suggests that an MDT for IE can be successfully designed and implemented with a clinical pathway using quality-improvement tools in centers where subspecialty services are available. Our approach was associated with a higher rate of surgery among patients with guideline indications for surgery and may reduce in-hospital mortality. An electronic clinical care pathway embedded in the EHR is feasible and may have a role in MDT implementation.
These data were also accepted as a poster at IDWeek 2022, Washington, DC. The poster abstract is published in an online supplement of Open Forum Infectious Diseases as an abstract publication.
Corresponding author: Haley Crosby; hwc2pd@health.missouri.edu
Disclosures: None reported.
1. Baddour LM, Wilson WR, Bayer AS, et al. Infective endocarditis in adults: diagnosis, antimicrobial therapy, and management of complications: a scientific statement for healthcare professionals from the American Heart Association. Circulation. 2015;132(15):1435-1486. doi:10.1161/cir.0000000000000296
2. Federspiel JJ, Stearns SC, Peppercorn AF, et al. Increasing US rates of endocarditis with Staphylococcus aureus: 1999-2008. Arch Intern Med. 2012;172(4):363-365. doi:10.1001/archinternmed.2011.1027
3. Nishimura RA, Otto CM, Bonow RO, et al. 2014 AHA/ACC Guideline for the Management of Patients With Valvular Heart Disease: a report of the American College of Cardiology/American Heart Association Task Force on Practice Guidelines. Circulation. 2014;129(23):e521-e643. doi:10.1161/cir.0000000000000031
4. Chambers J, Sandoe J, Ray S, et al. The infective endocarditis team: recommendations from an international working group. Heart. 2014;100(7):524-527. doi:10.1136/heartjnl-2013-304354
5. Habib G, Lancellotti P, Antunes MJ, et al. 2015 ESC Guidelines for the management of infective endocarditis: The Task Force for the Management of Infective Endocarditis of the European Society of Cardiology (ESC). Endorsed by: European Association for Cardio-Thoracic Surgery (EACTS), the European Association of Nuclear Medicine (EANM). Eur Heart J. 2015;36(44):3075-3128. doi:10.1093/eurheartj/ehv319
6. Chirillo F, Scotton P, Rocco F, et al. Impact of a multidisciplinary management strategy on the outcome of patients with native valve infective endocarditis. Am J Cardiol. 2013;112(8):1171-1176. doi:10.1016/j.amjcard.2013.05.060
7. Botelho-Nevers E, Thuny F, Casalta JP, et al. Dramatic reduction in infective endocarditis-related mortality with a management-based approach. Arch Intern Med. 2009;169(14):1290-1298. doi:10.1001/archinternmed.2009.192
8. El-Dalati S, Cronin D, Riddell IV J, et al. The clinical impact of implementation of a multidisciplinary endocarditis team. Ann Thorac Surg. 2022;113(1):118-124.
9. Carrasco-Chinchilla F, Sánchez-Espín G, Ruiz-Morales J, et al. Influence of a multidisciplinary alert strategy on mortality due to left-sided infective endocarditis. Rev Esp Cardiol (Engl Ed). 2014;67(5):380-386. doi:10.1016/j.rec.2013.09.010
10. Issa N, Dijos M, Greib C, et al. Impact of an endocarditis team in the management of 357 infective endocarditis [abstract]. Open Forum Infect Dis. 2016;3(suppl 1):S201. doi:10.1093/ofid/ofw172.825
11. Kaura A, Byrne J, Fife A, et al. Inception of the ‘endocarditis team’ is associated with improved survival in patients with infective endocarditis who are managed medically: findings from a before-and-after study. Open Heart. 2017;4(2):e000699. doi:10.1136/openhrt-2017-000699
12. Rotter T, Kinsman L, James E, et al. Clinical pathways: effects on professional practice, patient outcomes, length of stay and hospital costs. Cochrane Database Syst Rev. 2010;(3):Cd006632. doi:10.1002/14651858.CD006632.pub2
13. Neame MT, Chacko J, Surace AE, et al. A systematic review of the effects of implementing clinical pathways supported by health information technologies. J Am Med Inform Assoc. 2019;26(4):356-363. doi:10.1093/jamia/ocy176
14. Trimarchi L, Caruso R, Magon G, et al. Clinical pathways and patient-related outcomes in hospital-based settings: a systematic review and meta-analysis of randomized controlled trials. Acta Biomed. 2021;92(1):e2021093. doi:10.23750/abm.v92i1.10639
15. Gibbons EF, Huang G, Aldea G, et al. A multidisciplinary pathway for the diagnosis and treatment of infectious endocarditis. Crit Pathw Cardiol. 2020;19(4):187-194. doi:10.1097/hpc.0000000000000224
16. Regunath H, Vasudevan A, Vyas K, et al. A quality improvement initiative: developing a multi-disciplinary team for infective endocarditis. Mo Med. 2019;116(4):291-296.
17. Regunath H, Whitt SP. Multidisciplinary service delivery for the endocarditis patient. In: Infective Endocarditis: A Multidisciplinary Approach. 1st ed. Kilic A, ed. Academic Press; 2022.
18. Durack DT, Lukes AS, Bright DK. New criteria for diagnosis of infective endocarditis: utilization of specific echocardiographic findings. Duke Endocarditis Service. Am J Med. 1994;96(3):200-209. doi:10.1016/0002-9343(94)90143-0
19. Tan C, Hansen MS, Cohen G, et al. Case conferences for infective endocarditis: a quality improvement initiative. PLoS One. 2018;13(10):e0205528. doi:10.1371/journal.pone.0205528
20. Ruch Y, Mazzucotelli JP, Lefebvre F, et al. Impact of setting up an “endocarditis team” on the management of infective endocarditis. Open Forum Infect Dis. 2019;6(9):ofz308. doi:10.1093/ofid/ofz308
21. Camou F, Dijos M, Barandon L, et al. Management of infective endocarditis and multidisciplinary approach. Med Mal Infect. 2019;49(1):17-22. doi:10.1016/j.medmal.2018.06.007
22. Pettersson GB, Hussain ST. Current AATS guidelines on surgical treatment of infective endocarditis. Ann Cardiothorac Surg. 2019;8(6):630-644. doi:10.21037/acs.2019.10.05
23. Mestres CA, Paré JC, Miró JM. Organization and functioning of a multidisciplinary team for the diagnosis and treatment of infective endocarditis: a 30-year perspective (1985-2014). Rev Esp Cardiol (Engl Ed). 2015;68(5):363-368. doi:10.1016/j.rec.2014.10.006
24. Stavi V, Brandstaetter E, Sagy I, et al. Comparison of clinical characteristics and prognosis in patients with right- and left-sided infective endocarditis. Rambam Maimonides Med J. 2019;10(1):e00003. doi:10.5041/rmmj.10338

Leading for High Reliability During the COVID-19 Pandemic: A Pilot Quality Improvement Initiative to Identify Challenges Faced and Lessons Learned
From the U.S. Department of Veterans Affairs (all authors), and Cognosante, LLC, Falls Church, VA (Dr. Murray, Dr. Sawyer, and Jessica Fankhauser).
Abstract
Objective: The COVID-19 pandemic posed unprecedented leadership challenges to health care organizations worldwide, especially those on the journey to high reliability. The objective of this pilot quality improvement initiative was to describe the experiences of medical center leaders continuing along the journey to high reliability during the pandemic.
Methods: A convenience sample of Veterans Health Administration medical center directors at facilities that had initiated the journey to high reliability prior to or during the COVID-19 pandemic were asked to complete a confidential survey to explore the challenges experienced and lessons learned.
Results: Of the 35 potential participants, 15 completed the confidential web-based survey. Five major themes emerged from participants’ responses: (1) managing competing priorities, (2) staying committed, (3) adapting and overcoming, (4) prioritizing competing demands, and (5) maintaining momentum.
Conclusion: This pilot quality improvement initiative provides some insight into the challenges experienced and lessons learned during the COVID-19 pandemic to help inform health care leaders’ responses during crises they may encounter along the journey to becoming a high reliability organization.
Keywords: HRO, leadership, patient safety.
Health care leaders worldwide agree that the
Maintaining continuous progress toward advancing high reliability organization (HRO) principles and practices can be especially challenging during crises of unprecedented scale such as the pandemic. HROs must be continually focused on achieving safety, quality, and efficiency goals by attending to the 3 pillars of HRO: culture, leadership, and continuous process improvement. HROs promote a culture where all staff across the organization watch for and report any unsafe conditions before these conditions pose a greater risk in the workplace. Hospital leaders, from executives to frontline managers, must be cognizant of all systems and processes that have the potential to affect patient care.12 All of the principles of HROs must continue without fail to ensure patient safety; these principles include preoccupation with failure, anticipating unexpected risks, sensitivity to dynamic and ever-changing operations, avoiding oversimplifications of identified problems, fostering resilience across the organization, and deferring to those with the expertise to make the best decisions regardless of position, rank, or title.12,13 Given the demands faced by leaders during crises with unprecedented disruption to normal operating procedures, it can be especially difficult to identify systemic challenges and apply lessons learned in a timely manner. However, it is critical to identify such lessons in order to continuously improve and to increase preparedness for subsequent crises.13,14
Because of the COVID-19 pandemic’s unprecedented nature in recent history, a review of the literature produced little evidence exploring the challenges experienced and lessons learned by health care leaders, especially as it relates to implementing or sustaining HRO journeys during the COVID-19 pandemic. Related literature published to date consists of editorials on reliability, uncertainty, and the management of errors15; patient safety and high reliability preventive strategies16; and authentic leadership.17 Five viewpoints were published on HROs and maladaptive stress behaviors,18 mindful organizing and organizational reliability,19 the practical essence of HROs,20 embracing principles of HROs in crisis,8 and using observation and high reliability strategies when facing an unprecedented safety threat.21 Finally, the authors identified 2 studies that used a qualitative research approach to explore leadership functions within an HRO when managing crises22 and organizational change in response to the COVID-19 pandemic.23 Due to the paucity of available information, the authors undertook a pilot quality improvement (QI) initiative to address this knowledge gap.
The aim of this initiative was to gain a better understanding of the challenges experienced, lessons learned, and recommendations to be shared by VHA medical center directors (MCDs) of health care facilities that had initiated the journey to high reliability before or during the COVID-19 pandemic. The authors hope that this information will help health care leaders across both governmental and nongovernmental organizations, nationally and globally, to prepare for future pandemics, other unanticipated crises (eg, natural disasters, terrorist attacks), and major change initiatives (eg, electronic health record modernization) that may affect the delivery of safe, high-quality, and effective patient care. The initiative is described using the SQUIRE 2.0 guidelines.24,25
Methods
Survey
We used a qualitative approach and administered a confidential web-based survey, developed by the project team, to VHA MCDs at facilities that had initiated the journey to high reliability before or during the COVID-19 pandemic. The survey consisted of 8 participant characteristic questions (Table 1) and 4 open-ended questions. The open-ended questions were designed to encourage MCD participants to freely provide detailed descriptions of the challenges experienced, lessons learned, recommendations for other health care leaders, and any additional information they believed was relevant.26,27 Participants were asked to respond to the following items:
- Please describe any challenges you experienced while in the role of MCD at a facility that initiated implementation of HRO principles and practices prior to (February 2020) or during (March 2020–September 2021) the initial onset of the COVID-19 pandemic.
- What are some lessons that you learned when responding to the COVID-19 pandemic while on the journey to high reliability?
- What recommendations would you like to make to other health care leaders to enable them to respond effectively to crises while on the journey to high reliability?
- Please provide any additional information that would be of value.
An invitation to participate in this pilot QI initiative was sent via e-mail to 35 potential participants, who were all MCDs at Cohort 1 and Cohort 2 facilities. The invitation was sent on June 17, 2022, by a VHA senior High Reliability Enterprise Support government team member not directly involved with the initiative.

The invitation included the objective of the initiative, estimated time to complete the confidential web-based survey, time allotted for responses to be submitted, and a link to the survey should potential participants agree to participate. Potential participants were informed that their involvement was voluntary, based on their willingness to participate and available time to complete the survey. Finally, the invitation noted that any comments provided would remain confidential and nonattributional for the purpose of publishing and presenting. The inclusion criteria for participation were: (1) serving
Data Gathering and Analysis
To minimize bias and maintain neutrality at the organizational level, only non-VHA individuals working on the project were directly involved with participants’ data review and analysis. Participant characteristics were analyzed using descriptive statistics. Responses to the 4 open-ended questions were coded and analyzed by an experienced researcher and coauthor using NVivo 11 qualitative data analysis software.28 To ensure trustworthiness (credibility, transferability, dependability, and confirmability) in the data analysis procedure,29 inductive thematic analysis was also performed manually using the methodologies of Braun and Clarke (Table 2)30 and Erlingsson and Brysiewicz.31 The goal of inductive analysis is to allow themes to emerge from the data while minimizing preconceptions.32,33 Regular team meetings were held to discuss and review the progress of data collection and analysis. The authors agreed that the themes were representative of the participants’ responses.

Institutional review board (IRB) review and approval were not required, as this project was a pilot QI initiative. The intent of the initiative was to explore ways to improve the quality of care delivered in the participants’ local care settings and not to generalize the findings. Under these circumstances, formal IRB review and approval of a QI initiative are not required.34 Participation in this pilot QI initiative was voluntary, and participants could withdraw at any time without consequences. Completion of the survey indicated consent. Confidentiality was ensured at all times by avoiding both the use of facility names and the collection of participant identifiers. Unique numbers were assigned to each participant. All comments provided by survey participants remained confidential and nonattributional for the purpose of publishing and presenting.
Results
Of the 35 potential participants, 15 VHA MCDs (43%) completed the confidential web-based survey. Out of the 17 potential participants in Cohort 1, 6 (35%) completed the survey. With Cohort 2, 9 (50%) of the potential 18 participants responded. Although saturation was reached at 10 responses, the additional completed surveys were included in the analysis. Saturation can be achieved with a small number of participants (n = 9–17), particularly when the potential participants are relatively homogenous and project aims are narrowly defined.35 Most participants had more than 10 years of executive-level experience and most medical centers had been on the journey to high reliability for more than 12 months at the time of the pandemic (Table 3).

“There were too many competing priorities dealing with the pandemic and staffing crisis.” (Participant 8)
Other participants shared:
“We had our HRO mentor designated just as our first peak was descending on us. It was initially challenging to determine the proper pace of implementation when we clearly had other things going on. There was a real risk that people would say, ‘What, are you kidding?’ as we tried to roll this out.” (Participant 4)
“Prior to COVID, our main challenges were getting organized and operational rollout. During the pandemic, we had to shift our focus to COVID and the training aspects suffered. Also, many other priorities pulled us away from an HRO rollout focus.” (Participant 6)
“If you don’t need a highly reliable organization during a crisis, when do you need it? That was the message that we kicked off with. It was also VERY important to take things slowly. Education had to be done in bits, and we had a much more modest timeline than what would have been the norm for any initiative pre-COVID. The emphasis was on this being a long-term commitment, that we would be doing it the right way rather than rushing it, etc.” (Participant 4)
“Keeping HRO principles and a Just Culture on the forefront of our minds, we looked for opportunities to progress on our HRO journey, despite the challenges of the pandemic. Our monthly Town Halls became weekly events to share COVID updates and information with staff. We used the Town Halls to promote our HRO mission and to open communication lines with staff, designating 1 week each month as a ‘Safety Forum.’ The pandemic provided the springboard and backdrop for staff Safety Stories submissions, many of which were shared at our Town Halls and Safety Forums.” (Participant 7)
“We were able to utilize HRO principles in response to the COVID pandemic. Specifically standardized communication from the facility to VISN [Veterans Integrated Services Network] was initiated on a daily basis. This practice provided daily communication on key operational items and clinical items at the medical center, allowed timely feedback on actions being taken, as was instrumental in daily checks on staffing, COVID testing supplies, overall supply chain issues.” (Participant 9)
The recommendations provided by 10 participants (Cohort 1, n = 6; Cohort 2, n = 4) for other health care leaders experiencing a crisis during the journey to high reliability were insightful. The themes that frequently emerged from the responses to the survey were to adapt and overcome. Participants shared:
“Utilize the many tools you’re given, specifically your team. Try even the craziest ideas from frontline staff.” (Participant 1)
“Use your mentors for younger directors and, even if you think you know the answer, involve your staff. It makes them feel they have a voice and gives them ownership of the issues.” (Participant 5)
“Make sure that you have key leaders in place who are committed to HRO and can help the organization adjust.” (Participant 6)
“Take advantage of HRO Leader Coaching, which pairs MCDs with coaches who act as consultants for HRO leadership practices to ensure progress in reaching the next level in the journey to High Reliability.” (Participant 7)
“Meet regularly with the HRO Lead and team (more frequently during early stages of implementation) to provide support, eliminate barriers, and champion the HRO mission. It is important to include other members of the ELT [Executive Leadership Team] to ensure their involvement with the facility HRO strategic plan.” (Participant 7)
“Prioritize and understand that not everything is priority #1. Continue what you can with HRO, incorporate high reliability principles into the work being done during a crisis, but understand you may need to modify rollout schedules.” (Participant 8)
The theme of prioritizing competing demands emerged again from 5 participants (Cohort 1, n = 3; Cohort 2, n = 2) with question 3 describing recommendations for other leaders:
“Your first priority is to the crisis. Don’t get distracted by this or any other initiative. That was not a very popular message for the people pushing HRO, but it is the reality and the necessity. However, it IS possible to move forward with HRO (or other important initiatives) during crisis times, as long as you carefully consider what you are asking of people and don’t overload/overwhelm them. It is not your ego (or that of Central Office) that needs to be stoked. If the initiative truly has value, you need to be patient to see it done properly, rather than rushed/pushed/forced. Don’t kill it by being overeager and overwhelming your already overtaxed people. That said, keep moving forward. The key is pacing—and remember that your Type A hard-driving leader types (you know who you are) will certainly fail if they push it. Or even if they go at a normal pace that would be appropriate for noncrisis times.” (Participant 4)
“Prioritize and understand that not everything is priority #1. Continue what you can with HRO, incorporate high reliability principles into the work being done during a crisis, but understand you may need to modify rollout schedules.” (Participant 8)
“It was critical for us to always focus on the immediate workplace safety of staff (especially those on the frontlines of the pandemic response) when in the process of rolling out HRO initiatives.” (Participant 14)
Maintaining Momentum
“It seemed as though communication and education from VHA on HRO slowed down at the same time, which further slowed our progress. We are now trying to ramp our engagement up again.” (Participant 3)
“There can be synergy between crisis response and HRO implementation. As an example, one of the first steps we took was leadership rounding. That was necessary anyways for crisis management (raising the spirits on the front lines, so to speak). What we did was include scheduled time instead of (in addition to) ad hoc. And we got credit for taking an HRO step. I resisted whiteboards/visual management systems for a long time because (in my opinion) that would have been much too distracting during the crisis. Having waited for better times, I was able to move forward with that several months later and with good success.” (Participant 4)
Discussion
Health care leaders worldwide experienced an immense set of challenges because of the COVID-19 pandemic, which is a crisis of a magnitude with no parallel in modern times. Strong, adaptive leadership at all levels of health care systems was needed to effectively address the immense crisis at hand.36,37 Findings from this pilot QI initiative suggest that MCDs faced many new challenges, requiring them to perform unfamiliar tasks and manage numerous overlapping challenges (eg, staffing shortages and reassignments, safety concerns, changes to patient appointments, backlogs in essential services), all while also trying to continue with the journey to high reliability. Despite the challenges leaders faced, they recognized the need to manage competing priorities early and effectively. At times, the priority was to address the wide-ranging, urgent issues related to the pandemic. When the conditions improved, there was time to refocus efforts on important but longer-term activities related to the HRO journey. Other participants recognized that their commitment to HRO needed to remain a priority even during the periods of intense focus on COVID-19.
Some participants felt compelled to stay committed to the HRO journey despite numerous competing demands. They stayed committed to looking for opportunities to progress by implementing HRO principles and practices to achieve safety, quality, and efficiency goals. This dedication is noteworthy, especially in light of recently published research that demonstrates the vast number of patient safety issues that presented during the COVID-19 pandemic (eg, ineffective communication, poor teamwork, the absence of coordination)1 as well as perceptions that patient safety and quality of care had significantly declined as a result of the crisis.36,37
Participants also highlighted the need to be adaptive when responding to the complexity and unpredictability of the pandemic. Participants regularly sought ways to increase their knowledge, skills, and abilities by using the resources (eg, tools, experts) available to them. Research shows that in increasingly complex and ever-changing situation such as the COVID-19 pandemic, leaders must be adaptive with all levels of performance, especially when limited information is available.38,39
This is the first initiative of its kind to specifically explore the challenges experienced and lessons learned from health care leaders continuing along the journey to high reliability during the COVID-19 pandemic. Findings from this pilot QI initiative revealed that many participants recommended that leaders adapt and overcome challenges as much as possible when continuing with HRO during a crisis. These findings are echoed in the current literature suggesting that adaptive performance is a highly effective form of leadership during crises.38,40 Being able to effectively adapt during a crisis is essential for reducing further vulnerabilities across health care systems. In fact, this lesson is shared by many countries in response to the unprecedented global crisis.41A limitation of this pilot QI initiative is that the authors did not directly solicit responses from all VHA MCDs or from other health care executives (eg, Chief of Staff, Associate Director for Operations, Associate Director for Patient Care, and Nurse Executive). As such, our findings represent only a small segment of senior leadership perspectives from a large, integrated health care system. Individuals who did not respond to the survey may have had different experiences than those who did, and the authors excluded many MCDs who formally began their HRO journeys in 2022, well after the pandemic was underway. Similarly, the experiences of Veterans Affairs leaders may or may not be similar to that of other health care organizations. Although the goal of this initiative was to explore the participants’ experiences during the period of crisis, time and distance from the events at the height of the COVID-19 pandemic may have resulted in difficulty recalling information as well as making sense of the occurrence. This potential recall bias is a common occurrence in trying to explore past experiences, especially as they relate to crises. Finally, this pilot QI initiative did not explore personal challenges participants may have faced during this period of time (eg, burnout, personal or family illness), which may have also shaped their responses.
Conclusion
This initiative suggests that VHA MCDs often relied on HRO principles to guide and assist with their response to the COVID-19 pandemic, including managing periods of unprecedented crisis. The ability to adapt and prioritize was seen as an especially important lesson. Many MCDs continued their personal and organizational efforts toward high reliability even in periods of intense challenge because of the pandemic. These findings can help with future crises that may occur during an organization’s journey to high reliability. This pilot QI initiative’s findings warrant further investigation to explore the experiences of the broader range of health care leaders while responding to unplanned crises or even planned large-scale cultural change or technology modernization initiatives (eg, electronic health record modernization) to expand the state of the science of high reliability as well as inform policy and decision-making. Finally, another area for future study is examining how leadership responses vary across facilities, depending on factors such as leader roles, facility complexity level, resource availability, patient population characteristics, and organizational culture.
Acknowledgment: The authors express their sincere gratitude to the medical center directors who participated in this pilot study.
Corresponding author: John S. Murray, PhD, MPH, MSGH, RN, FAAN, 20 Chapel St., Unit A502, Brookline, MA 02446; JMurray325@aol.com
Disclosures: None reported.
1. Editors: Dying in a leadership vacuum. 9.4N Engl J Med. 2020;383(15):1479-1480. doi:10.1056/NEJMe2029812
2. Geerts JM, Kinnair D, Taheri P, et al. Guidance for health care leaders during the recovery stage of the COVID-19 pandemic: a consensus statement. JAMA Netw Open. 2021;4(7):1-16. doi:10.1001/jamanetworkopen.2021.20295
3. Boiral O, Brotherton M-C, Rivaud L, et al. Organizations’ management of the COVID-19 pandemic: a scoping review of business articles. Sustainability. 2021;13:1-20. doi:10.3390/su13073993
4. Razu SR, Yasmin T, Arif TB, et al. Challenges faced by healthcare professionals during the COVID-19 pandemic: a qualitative inquiry from Bangladesh. Front Public Health. 2021;9:1-13. doi:10.3389/fpubh.2021.647315
5. Lyng HB, Ree E, Wibe T, et al. Healthcare leaders’ use of innovative solutions to ensure resilience in healthcare during the Covid-19 pandemic: a qualitative study in Norwegian nursing homes and home care services. BMC Health Serv Res. 2021;21(1):1-11. doi:1186/s12913-021-06923-1
6. Freitas J. Queiroz A, Bortotti I, et al. Nurse leaders’ challenges fighting the COVID-19 pandemic: a qualitative study. Open J Nurs. 2021;11:267-280. doi:10.4236/ojn.2021.115024
7. McGuire AL, Aulisio MP, Davis FD, et al. Ethical challenges arising in the COVID-19 pandemic: an overview from the Association of Bioethics Program Directors (ABPD) Task Force. 9.4Am J Bioeth. 2020;20(7):15-27. doi:10.1080/15265161.2020.1764138
8. Turbow RM, Scibilia JP. Embracing principles of high reliability organizations can improve patient safety during pandemic. AAP News. January 19, 2021. Accessed March 1, 2023. https://publications.aap.org/aapnews/news/8975
9. Roberts BH, Damiano LA, Graham S, et al. A case study in fostering a learning culture in the context of Covid-19. American Association for Physician Leadership. June 24, 2021. Accessed March 1, 2023. https://www.physicianleaders.org/news/a-case-study-in-fostering-a-learning-culture-in-the-context-of-covid-19
10. U.S. Department of Veterans Affairs. Department of Veterans AffairsCOVID-19 National Summary. Veterans Affairs. Accessed December 4, 2022. https://www.accesstocare.va.gov/Healthcare/COVID19NationalSummary
11. U.S. Department of Veterans Affairs. VA fourth mission summary. Veterans Affairs. Accessed December 4, 2022. https://www.va.gov/health/coronavirus/statesupport.asp#:~:text=As%20part%20of%20the%20Fourth,the%20facilities%20we%20are%20supporting
12. Veazie S, Peterson K, Bourne D, et al. Implementing high-reliability organization principles into practice: a rapid evidence review. J Patient Saf. 2022;18(1):e320-e328. doi:10.1097/PTS.0000000000000768
13. Murray JS, Kelly S, Hanover C. Promoting psychological safety in healthcare organizations. 9.4Mil Med. 2022;187(7-8):808-810. doi:10.1093/milmed/usac041
14. Maison D, Jaworska D, Adamczyk D, et al. The challenges arising from the COVID-19 pandemic and the way people deal with them: a qualitative longitudinal study. PLoS One. 2021;16(10):1-17. doi:10.1371/journal.pone.0258133
15. Schulman PR. Reliability, uncertainty and the management of error: new perspectives in the COVID-19 era. J Contingencies Crisis Manag. 2022;30:92-101. doi:10.1111/1468-5973.12356
16. Adelman JS, Gandhi TK. COVID-19 and patient safety: time to tap into our investment in high reliability. J Patient Saf. 2021;17(4): 331-333. doi:10.1097/PTS.0000000000000843
17. Shingler-Nace A. COVID-19: when leadership calls. Nurs Lead. 2020;18(3):202-203. doi:10.1016/j.mnl.2020.03.017
18. Van Stralen D, Mercer TA. During pandemic COVID 19, the high reliability organization (HRO) identifies maladaptive stress behaviors: the stress-fear-threat cascade. Neonatol Tod. 2020;15(11):113-124. doi: 10.51362/neonatology.today/2020111511113124
19. Vogus TJ, Wilson AD, Randall K, et al. We’re all in this together: how COVID-19 revealed the coconstruction of mindful organising and organisational reliability. BMJ Qual Saf. 2022;31(3):230-233. doi:10.1136/bmjqs-2021-014068
20. Van Stralen D. Pragmatic high-reliability organization (HRO) during pandemic COVID-19. Neonatol Tod. 2020(4);15:109-117. doi:10.51362/neonatology.today/20208158109117
21. Thull-Freedman J, Mondoux S, Stang A, et al. Going to the COVID-19 Gemba: using observation and high reliability strategies to achieve safety in a time of crisis. CJEM. 2020;22(6):738-741. doi:10.1017/cem.2020.380
22. Sarihasan I, Dajnoki K, Oláh J, et al. The importance of the leadership functions of a high-reliability health care organization in managing the COVID-19 pandemic in Turkey. Econ Sociol. 2022;15:78-93. doi:10.14254/2071-789x.2022/15-1/5
23. Crain MA, Bush AL, Hayanga H, et al. Healthcare leadership in the COVID-19 pandemic: from innovative preparation to evolutionary transformation. J Health Leadersh. 2021;13:199-207. doi:10.2147/JHL.S319829
24. SQUIRE. Revised Standards for Quality Improvement Reporting Excellence (SQUIRE 2.0) SQUIRE; 2020. Accessed March 1, 2023. http://www.squire-statement.org/index.cfm?fuseaction=Page.ViewPage&pageId=471
25. Lounsbury O. How to write a quality improvement project. Patient Safety J. 2022;4(1):65-67. doi:10.33940/culture/2022.3.6
26. Bengtsson M. How to plan and perform a qualitative study using content analysis. Nurs Plus Open. 2016;2:8-14. doi:10.1016/j.npls.2016.01.001
27. Allen M. The Sage Encyclopedia of Communication Research Methods. (Vols. 1-4). SAGE Publications, Inc; 2017
28. Unlock insights with qualitative data analysis software. Lumivero. Accessed March 2, 2023. https://lumivero.com/products/nvivo/
29. Maher C, Hadfield M, Hutchings M, et al. Ensuring rigor in qualitative data analysis: a design research approach to coding combining NVivo with traditional material methods. Int J Qual Methods. 2018;17:1-13. doi:10.1177/1609406918786362
30. Braun V, Clarke V. Using thematic analysis in psychology. Qual Res Psychol. 2006;3:77-101. doi:10.1191/1478088706qp063oa
31. Erlingsson C, Brysiewicz P. A hands-on guide to doing content analysis. Afr J Emerg Med. 2017;7:93-99. doi:10.1016/j.afjem.2017.08.001
32. Vears DF, Gillam L. Inductive content analysis: a guide for beginning qualitative researchers. FoHPE. 2022;23:111-127. doi:10.11157/fohpe.v23i1.544
33. Nowell LS, Norris JM, White DE, et al. Thematic analysis: striving to meet the trustworthiness criteria. Int J Qual Methods. 2017;16:1-13. doi:10.1177/1609406917733847
34. Gautham KS, Pearlman S. Do quality improvement projects require IRB approval? J Perinatol. 2021;41:1209-1212. doi:10.1038/s41372-021-01038-1
35. Hennink M, Kaiser BN. Sample sizes for saturation in qualitative research: a systematic review of empirical tests. Soc Sci Med. 2022;292:1-10. doi:10.1016/j.socscimed.2021.114523
36. Balogun M, Dada FO, Oladimeji A, et al. Leading in a time of crisis: a qualitative study capturing experiences of health facility leaders during the early phases of the COVID-19 pandemic in Nigeria’s epicentre. Leadersh Health Serv (Bradf Engl). Published online May 12, 2022. doi:10.1108/lhs-02-2022-0017
37. Guttormson J, Calkins K, McAndrew N, et al. Critical care nurses’ experiences during the COVID-19 pandemic: a US national survey. Am J Crit Care. 2022;31:96-103. doi:10.4037/ajcc2022312
38. Bajaba A, Bajaba S, Algarni M, et al. Adaptive managers as emerging leaders during the COVID-19 crisis. Front Psychol. 2021;12:1-11. doi:10.3389/fpsyg.2021.661628
39. Ahern S, Loh E. Leadership during the COVID-19 pandemic: building and sustaining trust in times of uncertainty. BMJ Lead. 2021;59(4):266-269. doi.org/10.1136/leader-2020-000271
40. Cote R. Adaptive leadership approach with COVID 19 adaptive challenges. J Leadersh Account Ethics. 2022;19:34-44. doi:10.33423/jlae.v19i1.4992
41. Juvet TM, Corbaz-Kurth S, Roos P, et al. Adapting to the unexpected: problematic work situations and resilience strategies in healthcare institutions during the COVID-19 pandemic’s first wave. Saf Sci. 2021;139:1-9. doi:10.1016/j.ssci.2021.105277
From the U.S. Department of Veterans Affairs (all authors), and Cognosante, LLC, Falls Church, VA (Dr. Murray, Dr. Sawyer, and Jessica Fankhauser).
Abstract
Objective: The COVID-19 pandemic posed unprecedented leadership challenges to health care organizations worldwide, especially those on the journey to high reliability. The objective of this pilot quality improvement initiative was to describe the experiences of medical center leaders continuing along the journey to high reliability during the pandemic.
Methods: A convenience sample of Veterans Health Administration medical center directors at facilities that had initiated the journey to high reliability prior to or during the COVID-19 pandemic were asked to complete a confidential survey to explore the challenges experienced and lessons learned.
Results: Of the 35 potential participants, 15 completed the confidential web-based survey. Five major themes emerged from participants’ responses: (1) managing competing priorities, (2) staying committed, (3) adapting and overcoming, (4) prioritizing competing demands, and (5) maintaining momentum.
Conclusion: This pilot quality improvement initiative provides some insight into the challenges experienced and lessons learned during the COVID-19 pandemic to help inform health care leaders’ responses during crises they may encounter along the journey to becoming a high reliability organization.
Keywords: HRO, leadership, patient safety.
Health care leaders worldwide agree that the
Maintaining continuous progress toward advancing high reliability organization (HRO) principles and practices can be especially challenging during crises of unprecedented scale such as the pandemic. HROs must be continually focused on achieving safety, quality, and efficiency goals by attending to the 3 pillars of HRO: culture, leadership, and continuous process improvement. HROs promote a culture where all staff across the organization watch for and report any unsafe conditions before these conditions pose a greater risk in the workplace. Hospital leaders, from executives to frontline managers, must be cognizant of all systems and processes that have the potential to affect patient care.12 All of the principles of HROs must continue without fail to ensure patient safety; these principles include preoccupation with failure, anticipating unexpected risks, sensitivity to dynamic and ever-changing operations, avoiding oversimplifications of identified problems, fostering resilience across the organization, and deferring to those with the expertise to make the best decisions regardless of position, rank, or title.12,13 Given the demands faced by leaders during crises with unprecedented disruption to normal operating procedures, it can be especially difficult to identify systemic challenges and apply lessons learned in a timely manner. However, it is critical to identify such lessons in order to continuously improve and to increase preparedness for subsequent crises.13,14
Because of the COVID-19 pandemic’s unprecedented nature in recent history, a review of the literature produced little evidence exploring the challenges experienced and lessons learned by health care leaders, especially as it relates to implementing or sustaining HRO journeys during the COVID-19 pandemic. Related literature published to date consists of editorials on reliability, uncertainty, and the management of errors15; patient safety and high reliability preventive strategies16; and authentic leadership.17 Five viewpoints were published on HROs and maladaptive stress behaviors,18 mindful organizing and organizational reliability,19 the practical essence of HROs,20 embracing principles of HROs in crisis,8 and using observation and high reliability strategies when facing an unprecedented safety threat.21 Finally, the authors identified 2 studies that used a qualitative research approach to explore leadership functions within an HRO when managing crises22 and organizational change in response to the COVID-19 pandemic.23 Due to the paucity of available information, the authors undertook a pilot quality improvement (QI) initiative to address this knowledge gap.
The aim of this initiative was to gain a better understanding of the challenges experienced, lessons learned, and recommendations to be shared by VHA medical center directors (MCDs) of health care facilities that had initiated the journey to high reliability before or during the COVID-19 pandemic. The authors hope that this information will help health care leaders across both governmental and nongovernmental organizations, nationally and globally, to prepare for future pandemics, other unanticipated crises (eg, natural disasters, terrorist attacks), and major change initiatives (eg, electronic health record modernization) that may affect the delivery of safe, high-quality, and effective patient care. The initiative is described using the SQUIRE 2.0 guidelines.24,25
Methods
Survey
We used a qualitative approach and administered a confidential web-based survey, developed by the project team, to VHA MCDs at facilities that had initiated the journey to high reliability before or during the COVID-19 pandemic. The survey consisted of 8 participant characteristic questions (Table 1) and 4 open-ended questions. The open-ended questions were designed to encourage MCD participants to freely provide detailed descriptions of the challenges experienced, lessons learned, recommendations for other health care leaders, and any additional information they believed was relevant.26,27 Participants were asked to respond to the following items:
- Please describe any challenges you experienced while in the role of MCD at a facility that initiated implementation of HRO principles and practices prior to (February 2020) or during (March 2020–September 2021) the initial onset of the COVID-19 pandemic.
- What are some lessons that you learned when responding to the COVID-19 pandemic while on the journey to high reliability?
- What recommendations would you like to make to other health care leaders to enable them to respond effectively to crises while on the journey to high reliability?
- Please provide any additional information that would be of value.
An invitation to participate in this pilot QI initiative was sent via e-mail to 35 potential participants, who were all MCDs at Cohort 1 and Cohort 2 facilities. The invitation was sent on June 17, 2022, by a VHA senior High Reliability Enterprise Support government team member not directly involved with the initiative.
The invitation included the objective of the initiative, estimated time to complete the confidential web-based survey, time allotted for responses to be submitted, and a link to the survey should potential participants agree to participate. Potential participants were informed that their involvement was voluntary, based on their willingness to participate and available time to complete the survey. Finally, the invitation noted that any comments provided would remain confidential and nonattributional for the purpose of publishing and presenting. The inclusion criteria for participation were: (1) serving
Data Gathering and Analysis
To minimize bias and maintain neutrality at the organizational level, only non-VHA individuals working on the project were directly involved with participants’ data review and analysis. Participant characteristics were analyzed using descriptive statistics. Responses to the 4 open-ended questions were coded and analyzed by an experienced researcher and coauthor using NVivo 11 qualitative data analysis software.28 To ensure trustworthiness (credibility, transferability, dependability, and confirmability) in the data analysis procedure,29 inductive thematic analysis was also performed manually using the methodologies of Braun and Clarke (Table 2)30 and Erlingsson and Brysiewicz.31 The goal of inductive analysis is to allow themes to emerge from the data while minimizing preconceptions.32,33 Regular team meetings were held to discuss and review the progress of data collection and analysis. The authors agreed that the themes were representative of the participants’ responses.
Institutional review board (IRB) review and approval were not required, as this project was a pilot QI initiative. The intent of the initiative was to explore ways to improve the quality of care delivered in the participants’ local care settings and not to generalize the findings. Under these circumstances, formal IRB review and approval of a QI initiative are not required.34 Participation in this pilot QI initiative was voluntary, and participants could withdraw at any time without consequences. Completion of the survey indicated consent. Confidentiality was ensured at all times by avoiding both the use of facility names and the collection of participant identifiers. Unique numbers were assigned to each participant. All comments provided by survey participants remained confidential and nonattributional for the purpose of publishing and presenting.
Results
Of the 35 potential participants, 15 VHA MCDs (43%) completed the confidential web-based survey. Out of the 17 potential participants in Cohort 1, 6 (35%) completed the survey. With Cohort 2, 9 (50%) of the potential 18 participants responded. Although saturation was reached at 10 responses, the additional completed surveys were included in the analysis. Saturation can be achieved with a small number of participants (n = 9–17), particularly when the potential participants are relatively homogenous and project aims are narrowly defined.35 Most participants had more than 10 years of executive-level experience and most medical centers had been on the journey to high reliability for more than 12 months at the time of the pandemic (Table 3).
“There were too many competing priorities dealing with the pandemic and staffing crisis.” (Participant 8)
Other participants shared:
“We had our HRO mentor designated just as our first peak was descending on us. It was initially challenging to determine the proper pace of implementation when we clearly had other things going on. There was a real risk that people would say, ‘What, are you kidding?’ as we tried to roll this out.” (Participant 4)
“Prior to COVID, our main challenges were getting organized and operational rollout. During the pandemic, we had to shift our focus to COVID and the training aspects suffered. Also, many other priorities pulled us away from an HRO rollout focus.” (Participant 6)
“If you don’t need a highly reliable organization during a crisis, when do you need it? That was the message that we kicked off with. It was also VERY important to take things slowly. Education had to be done in bits, and we had a much more modest timeline than what would have been the norm for any initiative pre-COVID. The emphasis was on this being a long-term commitment, that we would be doing it the right way rather than rushing it, etc.” (Participant 4)
“Keeping HRO principles and a Just Culture on the forefront of our minds, we looked for opportunities to progress on our HRO journey, despite the challenges of the pandemic. Our monthly Town Halls became weekly events to share COVID updates and information with staff. We used the Town Halls to promote our HRO mission and to open communication lines with staff, designating 1 week each month as a ‘Safety Forum.’ The pandemic provided the springboard and backdrop for staff Safety Stories submissions, many of which were shared at our Town Halls and Safety Forums.” (Participant 7)
“We were able to utilize HRO principles in response to the COVID pandemic. Specifically standardized communication from the facility to VISN [Veterans Integrated Services Network] was initiated on a daily basis. This practice provided daily communication on key operational items and clinical items at the medical center, allowed timely feedback on actions being taken, as was instrumental in daily checks on staffing, COVID testing supplies, overall supply chain issues.” (Participant 9)
The recommendations provided by 10 participants (Cohort 1, n = 6; Cohort 2, n = 4) for other health care leaders experiencing a crisis during the journey to high reliability were insightful. The themes that frequently emerged from the responses to the survey were to adapt and overcome. Participants shared:
“Utilize the many tools you’re given, specifically your team. Try even the craziest ideas from frontline staff.” (Participant 1)
“Use your mentors for younger directors and, even if you think you know the answer, involve your staff. It makes them feel they have a voice and gives them ownership of the issues.” (Participant 5)
“Make sure that you have key leaders in place who are committed to HRO and can help the organization adjust.” (Participant 6)
“Take advantage of HRO Leader Coaching, which pairs MCDs with coaches who act as consultants for HRO leadership practices to ensure progress in reaching the next level in the journey to High Reliability.” (Participant 7)
“Meet regularly with the HRO Lead and team (more frequently during early stages of implementation) to provide support, eliminate barriers, and champion the HRO mission. It is important to include other members of the ELT [Executive Leadership Team] to ensure their involvement with the facility HRO strategic plan.” (Participant 7)
“Prioritize and understand that not everything is priority #1. Continue what you can with HRO, incorporate high reliability principles into the work being done during a crisis, but understand you may need to modify rollout schedules.” (Participant 8)
The theme of prioritizing competing demands emerged again from 5 participants (Cohort 1, n = 3; Cohort 2, n = 2) with question 3 describing recommendations for other leaders:
“Your first priority is to the crisis. Don’t get distracted by this or any other initiative. That was not a very popular message for the people pushing HRO, but it is the reality and the necessity. However, it IS possible to move forward with HRO (or other important initiatives) during crisis times, as long as you carefully consider what you are asking of people and don’t overload/overwhelm them. It is not your ego (or that of Central Office) that needs to be stoked. If the initiative truly has value, you need to be patient to see it done properly, rather than rushed/pushed/forced. Don’t kill it by being overeager and overwhelming your already overtaxed people. That said, keep moving forward. The key is pacing—and remember that your Type A hard-driving leader types (you know who you are) will certainly fail if they push it. Or even if they go at a normal pace that would be appropriate for noncrisis times.” (Participant 4)
“Prioritize and understand that not everything is priority #1. Continue what you can with HRO, incorporate high reliability principles into the work being done during a crisis, but understand you may need to modify rollout schedules.” (Participant 8)
“It was critical for us to always focus on the immediate workplace safety of staff (especially those on the frontlines of the pandemic response) when in the process of rolling out HRO initiatives.” (Participant 14)
Maintaining Momentum
“It seemed as though communication and education from VHA on HRO slowed down at the same time, which further slowed our progress. We are now trying to ramp our engagement up again.” (Participant 3)
“There can be synergy between crisis response and HRO implementation. As an example, one of the first steps we took was leadership rounding. That was necessary anyways for crisis management (raising the spirits on the front lines, so to speak). What we did was include scheduled time instead of (in addition to) ad hoc. And we got credit for taking an HRO step. I resisted whiteboards/visual management systems for a long time because (in my opinion) that would have been much too distracting during the crisis. Having waited for better times, I was able to move forward with that several months later and with good success.” (Participant 4)
Discussion
Health care leaders worldwide experienced an immense set of challenges because of the COVID-19 pandemic, which is a crisis of a magnitude with no parallel in modern times. Strong, adaptive leadership at all levels of health care systems was needed to effectively address the immense crisis at hand.36,37 Findings from this pilot QI initiative suggest that MCDs faced many new challenges, requiring them to perform unfamiliar tasks and manage numerous overlapping challenges (eg, staffing shortages and reassignments, safety concerns, changes to patient appointments, backlogs in essential services), all while also trying to continue with the journey to high reliability. Despite the challenges leaders faced, they recognized the need to manage competing priorities early and effectively. At times, the priority was to address the wide-ranging, urgent issues related to the pandemic. When the conditions improved, there was time to refocus efforts on important but longer-term activities related to the HRO journey. Other participants recognized that their commitment to HRO needed to remain a priority even during the periods of intense focus on COVID-19.
Some participants felt compelled to stay committed to the HRO journey despite numerous competing demands. They stayed committed to looking for opportunities to progress by implementing HRO principles and practices to achieve safety, quality, and efficiency goals. This dedication is noteworthy, especially in light of recently published research that demonstrates the vast number of patient safety issues that presented during the COVID-19 pandemic (eg, ineffective communication, poor teamwork, the absence of coordination)1 as well as perceptions that patient safety and quality of care had significantly declined as a result of the crisis.36,37
Participants also highlighted the need to be adaptive when responding to the complexity and unpredictability of the pandemic. Participants regularly sought ways to increase their knowledge, skills, and abilities by using the resources (eg, tools, experts) available to them. Research shows that in increasingly complex and ever-changing situation such as the COVID-19 pandemic, leaders must be adaptive with all levels of performance, especially when limited information is available.38,39
This is the first initiative of its kind to specifically explore the challenges experienced and lessons learned from health care leaders continuing along the journey to high reliability during the COVID-19 pandemic. Findings from this pilot QI initiative revealed that many participants recommended that leaders adapt and overcome challenges as much as possible when continuing with HRO during a crisis. These findings are echoed in the current literature suggesting that adaptive performance is a highly effective form of leadership during crises.38,40 Being able to effectively adapt during a crisis is essential for reducing further vulnerabilities across health care systems. In fact, this lesson is shared by many countries in response to the unprecedented global crisis.41A limitation of this pilot QI initiative is that the authors did not directly solicit responses from all VHA MCDs or from other health care executives (eg, Chief of Staff, Associate Director for Operations, Associate Director for Patient Care, and Nurse Executive). As such, our findings represent only a small segment of senior leadership perspectives from a large, integrated health care system. Individuals who did not respond to the survey may have had different experiences than those who did, and the authors excluded many MCDs who formally began their HRO journeys in 2022, well after the pandemic was underway. Similarly, the experiences of Veterans Affairs leaders may or may not be similar to that of other health care organizations. Although the goal of this initiative was to explore the participants’ experiences during the period of crisis, time and distance from the events at the height of the COVID-19 pandemic may have resulted in difficulty recalling information as well as making sense of the occurrence. This potential recall bias is a common occurrence in trying to explore past experiences, especially as they relate to crises. Finally, this pilot QI initiative did not explore personal challenges participants may have faced during this period of time (eg, burnout, personal or family illness), which may have also shaped their responses.
Conclusion
This initiative suggests that VHA MCDs often relied on HRO principles to guide and assist with their response to the COVID-19 pandemic, including managing periods of unprecedented crisis. The ability to adapt and prioritize was seen as an especially important lesson. Many MCDs continued their personal and organizational efforts toward high reliability even in periods of intense challenge because of the pandemic. These findings can help with future crises that may occur during an organization’s journey to high reliability. This pilot QI initiative’s findings warrant further investigation to explore the experiences of the broader range of health care leaders while responding to unplanned crises or even planned large-scale cultural change or technology modernization initiatives (eg, electronic health record modernization) to expand the state of the science of high reliability as well as inform policy and decision-making. Finally, another area for future study is examining how leadership responses vary across facilities, depending on factors such as leader roles, facility complexity level, resource availability, patient population characteristics, and organizational culture.
Acknowledgment: The authors express their sincere gratitude to the medical center directors who participated in this pilot study.
Corresponding author: John S. Murray, PhD, MPH, MSGH, RN, FAAN, 20 Chapel St., Unit A502, Brookline, MA 02446; JMurray325@aol.com
Disclosures: None reported.
1. Editors: Dying in a leadership vacuum. 9.4N Engl J Med. 2020;383(15):1479-1480. doi:10.1056/NEJMe2029812
2. Geerts JM, Kinnair D, Taheri P, et al. Guidance for health care leaders during the recovery stage of the COVID-19 pandemic: a consensus statement. JAMA Netw Open. 2021;4(7):1-16. doi:10.1001/jamanetworkopen.2021.20295
3. Boiral O, Brotherton M-C, Rivaud L, et al. Organizations’ management of the COVID-19 pandemic: a scoping review of business articles. Sustainability. 2021;13:1-20. doi:10.3390/su13073993
4. Razu SR, Yasmin T, Arif TB, et al. Challenges faced by healthcare professionals during the COVID-19 pandemic: a qualitative inquiry from Bangladesh. Front Public Health. 2021;9:1-13. doi:10.3389/fpubh.2021.647315
5. Lyng HB, Ree E, Wibe T, et al. Healthcare leaders’ use of innovative solutions to ensure resilience in healthcare during the Covid-19 pandemic: a qualitative study in Norwegian nursing homes and home care services. BMC Health Serv Res. 2021;21(1):1-11. doi:1186/s12913-021-06923-1
6. Freitas J. Queiroz A, Bortotti I, et al. Nurse leaders’ challenges fighting the COVID-19 pandemic: a qualitative study. Open J Nurs. 2021;11:267-280. doi:10.4236/ojn.2021.115024
7. McGuire AL, Aulisio MP, Davis FD, et al. Ethical challenges arising in the COVID-19 pandemic: an overview from the Association of Bioethics Program Directors (ABPD) Task Force. 9.4Am J Bioeth. 2020;20(7):15-27. doi:10.1080/15265161.2020.1764138
8. Turbow RM, Scibilia JP. Embracing principles of high reliability organizations can improve patient safety during pandemic. AAP News. January 19, 2021. Accessed March 1, 2023. https://publications.aap.org/aapnews/news/8975
9. Roberts BH, Damiano LA, Graham S, et al. A case study in fostering a learning culture in the context of Covid-19. American Association for Physician Leadership. June 24, 2021. Accessed March 1, 2023. https://www.physicianleaders.org/news/a-case-study-in-fostering-a-learning-culture-in-the-context-of-covid-19
10. U.S. Department of Veterans Affairs. Department of Veterans AffairsCOVID-19 National Summary. Veterans Affairs. Accessed December 4, 2022. https://www.accesstocare.va.gov/Healthcare/COVID19NationalSummary
11. U.S. Department of Veterans Affairs. VA fourth mission summary. Veterans Affairs. Accessed December 4, 2022. https://www.va.gov/health/coronavirus/statesupport.asp#:~:text=As%20part%20of%20the%20Fourth,the%20facilities%20we%20are%20supporting
12. Veazie S, Peterson K, Bourne D, et al. Implementing high-reliability organization principles into practice: a rapid evidence review. J Patient Saf. 2022;18(1):e320-e328. doi:10.1097/PTS.0000000000000768
13. Murray JS, Kelly S, Hanover C. Promoting psychological safety in healthcare organizations. 9.4Mil Med. 2022;187(7-8):808-810. doi:10.1093/milmed/usac041
14. Maison D, Jaworska D, Adamczyk D, et al. The challenges arising from the COVID-19 pandemic and the way people deal with them: a qualitative longitudinal study. PLoS One. 2021;16(10):1-17. doi:10.1371/journal.pone.0258133
15. Schulman PR. Reliability, uncertainty and the management of error: new perspectives in the COVID-19 era. J Contingencies Crisis Manag. 2022;30:92-101. doi:10.1111/1468-5973.12356
16. Adelman JS, Gandhi TK. COVID-19 and patient safety: time to tap into our investment in high reliability. J Patient Saf. 2021;17(4): 331-333. doi:10.1097/PTS.0000000000000843
17. Shingler-Nace A. COVID-19: when leadership calls. Nurs Lead. 2020;18(3):202-203. doi:10.1016/j.mnl.2020.03.017
18. Van Stralen D, Mercer TA. During pandemic COVID 19, the high reliability organization (HRO) identifies maladaptive stress behaviors: the stress-fear-threat cascade. Neonatol Tod. 2020;15(11):113-124. doi: 10.51362/neonatology.today/2020111511113124
19. Vogus TJ, Wilson AD, Randall K, et al. We’re all in this together: how COVID-19 revealed the coconstruction of mindful organising and organisational reliability. BMJ Qual Saf. 2022;31(3):230-233. doi:10.1136/bmjqs-2021-014068
20. Van Stralen D. Pragmatic high-reliability organization (HRO) during pandemic COVID-19. Neonatol Tod. 2020(4);15:109-117. doi:10.51362/neonatology.today/20208158109117
21. Thull-Freedman J, Mondoux S, Stang A, et al. Going to the COVID-19 Gemba: using observation and high reliability strategies to achieve safety in a time of crisis. CJEM. 2020;22(6):738-741. doi:10.1017/cem.2020.380
22. Sarihasan I, Dajnoki K, Oláh J, et al. The importance of the leadership functions of a high-reliability health care organization in managing the COVID-19 pandemic in Turkey. Econ Sociol. 2022;15:78-93. doi:10.14254/2071-789x.2022/15-1/5
23. Crain MA, Bush AL, Hayanga H, et al. Healthcare leadership in the COVID-19 pandemic: from innovative preparation to evolutionary transformation. J Health Leadersh. 2021;13:199-207. doi:10.2147/JHL.S319829
24. SQUIRE. Revised Standards for Quality Improvement Reporting Excellence (SQUIRE 2.0) SQUIRE; 2020. Accessed March 1, 2023. http://www.squire-statement.org/index.cfm?fuseaction=Page.ViewPage&pageId=471
25. Lounsbury O. How to write a quality improvement project. Patient Safety J. 2022;4(1):65-67. doi:10.33940/culture/2022.3.6
26. Bengtsson M. How to plan and perform a qualitative study using content analysis. Nurs Plus Open. 2016;2:8-14. doi:10.1016/j.npls.2016.01.001
27. Allen M. The Sage Encyclopedia of Communication Research Methods. (Vols. 1-4). SAGE Publications, Inc; 2017
28. Unlock insights with qualitative data analysis software. Lumivero. Accessed March 2, 2023. https://lumivero.com/products/nvivo/
29. Maher C, Hadfield M, Hutchings M, et al. Ensuring rigor in qualitative data analysis: a design research approach to coding combining NVivo with traditional material methods. Int J Qual Methods. 2018;17:1-13. doi:10.1177/1609406918786362
30. Braun V, Clarke V. Using thematic analysis in psychology. Qual Res Psychol. 2006;3:77-101. doi:10.1191/1478088706qp063oa
31. Erlingsson C, Brysiewicz P. A hands-on guide to doing content analysis. Afr J Emerg Med. 2017;7:93-99. doi:10.1016/j.afjem.2017.08.001
32. Vears DF, Gillam L. Inductive content analysis: a guide for beginning qualitative researchers. FoHPE. 2022;23:111-127. doi:10.11157/fohpe.v23i1.544
33. Nowell LS, Norris JM, White DE, et al. Thematic analysis: striving to meet the trustworthiness criteria. Int J Qual Methods. 2017;16:1-13. doi:10.1177/1609406917733847
34. Gautham KS, Pearlman S. Do quality improvement projects require IRB approval? J Perinatol. 2021;41:1209-1212. doi:10.1038/s41372-021-01038-1
35. Hennink M, Kaiser BN. Sample sizes for saturation in qualitative research: a systematic review of empirical tests. Soc Sci Med. 2022;292:1-10. doi:10.1016/j.socscimed.2021.114523
36. Balogun M, Dada FO, Oladimeji A, et al. Leading in a time of crisis: a qualitative study capturing experiences of health facility leaders during the early phases of the COVID-19 pandemic in Nigeria’s epicentre. Leadersh Health Serv (Bradf Engl). Published online May 12, 2022. doi:10.1108/lhs-02-2022-0017
37. Guttormson J, Calkins K, McAndrew N, et al. Critical care nurses’ experiences during the COVID-19 pandemic: a US national survey. Am J Crit Care. 2022;31:96-103. doi:10.4037/ajcc2022312
38. Bajaba A, Bajaba S, Algarni M, et al. Adaptive managers as emerging leaders during the COVID-19 crisis. Front Psychol. 2021;12:1-11. doi:10.3389/fpsyg.2021.661628
39. Ahern S, Loh E. Leadership during the COVID-19 pandemic: building and sustaining trust in times of uncertainty. BMJ Lead. 2021;59(4):266-269. doi.org/10.1136/leader-2020-000271
40. Cote R. Adaptive leadership approach with COVID 19 adaptive challenges. J Leadersh Account Ethics. 2022;19:34-44. doi:10.33423/jlae.v19i1.4992
41. Juvet TM, Corbaz-Kurth S, Roos P, et al. Adapting to the unexpected: problematic work situations and resilience strategies in healthcare institutions during the COVID-19 pandemic’s first wave. Saf Sci. 2021;139:1-9. doi:10.1016/j.ssci.2021.105277
Development of a Safety Awards Program at a Veterans Affairs Health Care System: A Quality Improvement Initiative
ABSTRACT
Objective: Promoting a culture of safety is a critical component of improving health care quality. Recognizing staff who stop the line for safety can positively impact the growth of a culture of safety. The purpose of this initiative was to demonstrate to staff the importance of speaking up for safety and being acknowledged for doing so.
Methods: Following a review of the literature on safety awards programs and their role in promoting a culture of safety in health care covering the period 2017 to 2020, a formal process was developed and implemented to disseminate safety awards to employees.
Results: During the initial 18 months of the initiative, a total of 59 awards were presented. The awards were well received by the recipients and other staff members. Within this period, adjustments were made to enhance the scope and reach of the program.
Conclusion: Recognizing staff behaviors that support a culture of safety is important for improving health care quality and employee engagement. Future research should focus on a formal evaluation of the impact of safety awards programs on patient safety outcomes.
Keywords: patient safety, culture of safety, incident reporting, near miss.
A key aspect of improving health care quality is promoting and sustaining a culture of safety in the workplace. Improving the quality of health care services and systems involves making informed choices regarding the types of strategies to implement.1 An essential aspect of supporting a safety culture is safety-event reporting. To approach the goal of zero harm, all safety events, whether they result in actual harm or are considered near misses, need to be reported. Near-miss events are errors that occur while care is being provided but are detected and corrected before harm reaches the patient.1-3 Near-miss reporting plays a critical role in helping to identify and correct weaknesses in health care delivery systems and processes.4 However, evidence shows that there are a multitude of barriers to the reporting of near-miss events, such as fear of punitive actions, additional workload, unsupportive work environments, a culture with poor psychological safety, knowledge deficit, and lack of recognition of staff who do report near misses.4-11
According to The Joint Commission (TJC), acknowledging health care team members who recognize and report unsafe conditions that provide insight for improving patient safety is a key method for promoting the reporting of near-miss events.6 As a result, some health care organizations and patient safety agencies have started to institute some form of recognition for their employees in the realm of safety.8-10 The Pennsylvania Patient Safety Authority offers exceptional guidance for creating a safety awards program to promote a culture of safety.12 Furthermore, TJC supports recognizing individuals and health care teams who identify and report near misses, or who have suggestions for initiatives to promote patient safety, with “good catch” awards. Individuals or teams working to promote and sustain a culture of safety should be recognized for their efforts. Acknowledging “good catches” to reward the identification, communication, and resolution of safety issues is an effective strategy for improving patient safety and health care quality.6,8
This quality improvement (QI) initiative was undertaken to demonstrate to staff that, in building an organizational culture of safety, it is important that staff be encouraged to speak up for safety and be acknowledged for doing so. If health care organizations want staff to be motivated to report near misses and improve safety and health care quality, the culture needs to shift from focusing on blame to incentivizing individuals and teams to speak up when they have concerns.8-10 Although deciding which safety actions are worthy of recognition can be challenging, recognizing all safe acts, regardless of how big or small they are perceived to be, is important. This QI initiative aimed to establish a tiered approach to recognize staff members for various categories of safety acts.
METHODS
A review of the literature from January 2017 to May 2020 for peer-reviewed publications regarding how other organizations implemented safety award programs to promote a culture of safety resulted in a dearth of evidence. This prompted us at the Veterans Affairs Connecticut Healthcare System to develop and implement a formal program to disseminate safety awards to employees.
Program Launch and Promotion
In 2020, our institution embarked on a journey to high reliability with the goal of approaching zero harm. As part of efforts to promote a culture of safety, the hospital’s High Reliability Organization (HRO) team worked to develop a safety awards recognition program. Prior to the launch, the hospital’s patient safety committee recognized staff members through the medical center safety event reporting system (the Joint Patient Safety Reporting system [JPSR]) or through direct communication with staff members on safety actions they were engaged in. JPSR is the Veterans Health Administration National Center for Patient Safety incident reporting system for reporting, tracking, and trending of patient incidents in a national database. The award consisted of a certificate presented by the patient safety committee chairpersons to the employee in front of their peers in their respective work area. Hospital leadership was not involved in the safety awards recognition program at that time. No nomination process existed prior to our QI launch.
Once the QI initiative was launched and marketed heavily at staff meetings, we started to receive nominations for actions that were truly exceptional, while many others were submitted for behaviors that were within the day-to-day scope of practice of the staff member. For those early nominations that did not meet criteria for an award, we thanked staff for their submissions with a gentle statement that their nomination did not meet the criteria for an award. After following this practice for a few weeks, we became concerned that if we did not acknowledge the staff who came forward to request recognition for their routine work that supported safety, we could risk losing their engagement in a culture of safety. As such, we decided to create 3 levels of awards to recognize behaviors that went above and beyond while also acknowledging staff for actions within their scope of practice. Additionally, hospital leadership wanted to ensure that all staff recognize that their safety efforts are valued by leadership and that that sense of value will hopefully contribute to a culture of safety over time.
Initially, the single award system was called the “Good Catch Award” to acknowledge staff who go above and beyond to speak up and take action when they have safety concerns. This particular recognition includes a certificate, an encased baseball card that has been personalized by including the staff member’s picture and safety event identified, a stress-release baseball, and a stick of Bazooka gum (similar to what used to come in baseball cards packs). The award is presented to employees in their work area by the HRO and patient safety teams and includes representatives from the executive leadership team (ELT). The safety event identified is described by an ELT member, and all items are presented to the employee. Participation by the leadership team communicates how much the work being done to promote a culture of safety and advance quality health care is appreciated. This action also encourages others in the organization to identify and report safety concerns.13
With the rollout of the QI initiative, the volume of nominations submitted quickly increased (eg, approximately 1 every 2 months before to 3 per month following implementation). Frequently, nominations were for actions believed to be within the scope of the employee’s responsibilities. Our institution’s leadership team quickly recognized that, as an organization, not diminishing the importance of the “Good Catch Award” was important. However, the
The original Good Catch Award was labelled as a Level 1 award. The Level 2 safety recognition award, named the HRO Safety Champion Award, is given to employees who stop the line for a safety concern within their scope of practice and also participate as part of a team to investigate and improve processes to avoid recurring safety concerns in the future. For the Level Two award, a certificate is presented to an employee by the hospital’s HRO lead, HRO physician champion, patient safety manager, immediate supervisor, and peers. With the Level 3 award, the Culture of Safety Appreciation Award, individuals are recognized for addressing safety concerns within their assigned scope of responsibilities. Recognition is bestowed by an email of appreciation sent to the employee, acknowledging their commitment to promoting a culture of safety and quality health care. The recipient’s direct supervisor and other hospital leaders are copied on the message.14 See Table 1 for a

Our institution’s HRO and patient safety teams utilized many additional venues to disseminate information regarding awardees and their actions. These included our monthly HRO newsletter, monthly safety forums, and biweekly Team Connecticut Healthcare system-wide huddles.
Nomination Process
Awards nominations are submitted via the hospital intranet homepage, where there is an “HRO Safety Award Nomination” icon. Once a staff member clicks the icon, a template opens asking for information, such as the reason for the nomination submission, and then walks them through the template using the CAR (C-context, A-actions, and R-results)15 format for describing the situation, identifying actions taken, and specifying the outcome of the action. Emails with award nominations can also be sent to the HRO lead, HRO champion, or Patient Safety Committee co-chairs. Calls for nominations are made at several venues attended by employees as well as supervisors. These include monthly safety forums, biweekly Team Connecticut Healthcare system-wide huddles, supervisory staff meetings, department and unit-based staff meetings, and many other formal and informal settings. This QI initiative has allowed us to capture potential awardees through several avenues, including self-nominations. All nominations are reviewed by a safety awards committee. Each committee member ranks the nomination as a Level 1, 2, or 3 award. For nominations where conflicting scores are obtained, the committee discusses the nomination together to resolve discrepancies.
Needed Resources
Material resources required for this QI initiative include certificate paper, plastic baseball card sleeves, stress-release baseballs, and Bazooka gum. The largest resource investment was the time needed to support the initiative. This included the time spent scheduling the Level 1 and 2 award presentations with staff and leadership. Time was also required to put the individual award packages together, which included printing the paper certificates, obtaining awardee pictures, placing them with their safety stories in a plastic baseball card sleeve, and arranging for the hospital photographer to take pictures of the awardees with their peers and leaders.
RESULTS
Prior to this QI initiative launch, 14 awards were given out over the preceding 2-year period. During the initial 18 months of the initiative (December 2020 to June 2022), 59 awards were presented (Level 1, n = 26; Level 2, n = 22; and Level 3, n = 11). Looking further into the Level 1 awards presented, 25 awardees worked in clinical roles and 1 in a nonclinical position (Table 2). The awardees represented multidisciplinary areas, including medical/surgical (med/surg) inpatient units, anesthesia, operating room, pharmacy, mental health clinics, surgical intensive care, specialty care clinics, and nutrition and food services. With the Level 2 awards, 18 clinical staff and 4 nonclinical staff received awards from the areas of med/surg inpatient, outpatient surgical suites, the medical center director’s office, radiology, pharmacy, primary care, facilities management, environmental management, infection prevention, and emergency services. All Level 3 awardees were from clinical areas, including primary care, hospital education, sterile processing, pharmacies, operating rooms, and med/surg inpatient units.

With the inception of this QI initiative, our organization has begun to see trends reflecting increased reporting of both actual and close-call events in JPSR (Figure 1). 
With the inclusion of information regarding awardees and their actions in monthly safety forums, attendance at these forums has increased from an average of 64 attendees per month in 2021 to an average of 131 attendees per month in 2022 (Figure 2).

Finally, our organization’s annual All-Employee Survey results have shown incremental increases in staff reporting feeling psychologically safe and not fearing reprisal (Figure 3). It is important to note that there may be other contributing factors to these incremental changes.

Level 1 – Good Catch Award. M.S. was assigned as a continuous safety monitor, or “sitter,” on one of the med/surg inpatient units. M.S. arrived at the bedside and asked for a report on the patient at a change in shift. The report stated that the patient was sleeping and had not moved in a while. M.S. set about to perform the functions of a sitter and did her usual tasks in cleaning and tidying the room for the patient for breakfast and taking care of all items in the room, in general. M.S. introduced herself to the patient, who she thought might wake up because of her speaking to him. She thought the patient was in an odd position, and knowing that a patient should be a little further up in the bed, she tried with touch to awaken him to adjust his position. M.S. found that the patient was rather chilly to the touch and immediately became concerned. She continued to attempt to rouse the patient. M.S. called for the nurse and began to adjust the patient’s position. M.S. insisted that the patient was cold and “something was wrong.” A set of vitals was taken and a rapid response team code was called. The patient was immediately transferred to the intensive care unit to receive a higher level of care. If not for the diligence and caring attitude of M.S., this patient may have had a very poor outcome.
Reason for criteria being met: The scope of practice of a sitter is to be present in a patient’s room to monitor for falls and overall safety. This employee noticed that the patient was not responsive to verbal or tactile stimuli. Her immediate reporting of her concern to the nurse resulted in prompt intervention. If she had let the patient be, the patient could have died. The staff member went above and beyond by speaking up and taking action when she had a patient safety concern.
Level 2 – HRO Safety Champion Award. A patient presented to an outpatient clinic for monoclonal antibody (mAb) therapy for a COVID-19 infection; the treatment has been scheduled by the patient’s primary care provider. At that time, outpatient mAb therapy was the recommended care option for patients stable enough to receive treatment in this setting, but it is contraindicated in patients who are too unstable to receive mAb therapy in an outpatient setting, such as those with increased oxygen demands. R.L., a staff nurse, assessed the patient on arrival and found that his vital signs were stable, except for a slightly elevated respiratory rate. Upon questioning, the patient reported that he had increased his oxygen use at home from 2 to 4 L via a nasal cannula. R.L. assessed that the patient was too high-risk for outpatient mAb therapy and had the patient checked into the emergency department (ED) to receive a full diagnostic workup and evaluation by Dr. W., an ED provider. The patient required admission to the hospital for a higher level of care in an inpatient unit because of severe COVID-19 infection. Within 48 hours of admission, the patient’s condition further declined, requiring an upgrade to the medical intensive care unit with progressive interventions. Owing to the clinical assessment skills and prompt action of R.L., the patient was admitted to the hospital instead of receiving treatment in a suboptimal care setting and returning home. Had the patient gone home, his rapid decline could have had serious consequences.
Reason for criteria being met: On a cursory look, the patient may have passed as someone sufficiently stable to undergo outpatient treatment. However, the nurse stopped the line, paid close attention, and picked up on an abnormal vital sign and the projected consequences. The nurse brought the patient to a higher level of care in the ED so that he could get the attention he needed. If this patient was given mAb therapy in the outpatient setting, he would have been discharged and become sicker with the COVID-19 illness. As a result of this incident, R.L. is working with the outpatient clinic and ED staff to enahance triage and evaluation of patients referred for outpatient therapy for COVID-19 infections to prevent a similar event from recurring.
Level 3 – Culture of Safety Appreciation Award. While C.C. was reviewing the hazardous item
Reason for criteria being met: The employee works in the hospital education department. It is within her scope of responsibilities to provide ongoing education to staff in order to address potential safety concerns.
DISCUSSION
This QI initiative was undertaken to demonstrate to staff that, in building an organizational culture of safety and advancing quality health care, it is important that staff be encouraged to speak up for safety and be acknowledged for doing so. As part of efforts to continuously build on a safety-first culture, transparency and celebration of successes were demonstrated. This QI initiative demonstrated that a diverse and wide range of employees were reached, from clinical to nonclinical staff, and frontline to supervisory staff, as all were included in the recognition process. While many award nominations were received through the submission of safety concerns to the high-reliability team and patient safety office, several came directly from staff who wanted to recognize their peers for their work, supporting a culture of safety. This showed that staff felt that taking the time to submit a write-up to recognize a peer was an important task. Achieving zero harm for patients and staff alike is a top priority for our institution and guides all decisions, which reinforces that everyone has a responsibility to ensure that safety is always the first consideration. A culture of safety is enhanced by staff recognition. This QI initiative also showed that staff felt valued when they were acknowledged, regardless of the level of recognition they received. The theme of feeling valued came from unsolicited feedback. For example, some direct comments from awardees are presented in the Box.

In addition to endorsing the importance of safe practices to staff, safety award programs can identify gaps in existing standard procedures that can be updated quickly and shared broadly across a health care organization. The authors observed that the existence of the award program gives staff permission to use their voice to speak up when they have questions or concerns related to safety and to proactively engage in safety practices; a cultural shift of this kind informs safety practices and procedures and contributes to a more inspiring workplace. Staff at our organization who have received any of the safety awards, and those who are aware of these awards, have embraced the program readily. At the time of submission of this manuscript, there was a relative paucity of published literature on the details, performance, and impact of such programs. This initiative aims to share a road map highlighting the various dimensions of staff recognition and how the program supports our health care system in fostering a strong, sustainable culture of safety and health care quality. A next step is to formally assess the impact of the awards program on our culture of safety and quality using a psychometrically sound measurement tool, as recommended by TJC,16 such as the
CONCLUSION
A health care organization safety awards program is a strategy for building and sustaining a culture of safety. This QI initiative may be valuable to other organizations in the process of establishing a safety awards program of their own. Future research should focus on a formal evaluation of the impact of safety awards programs on patient safety outcomes.
Corresponding author: John S. Murray, PhD, MPH, MSGH, RN, FAAN, 20 Chapel Street, Unit A502, Brookline, MA 02446; JMurray325@aol.com
Disclosures: None reported.
1. National Center for Biotechnology Information. Improving healthcare quality in Europe: Characteristics, effectiveness and implementation of different strategies. National Library of Medicine; 2019.
2.
3. Agency for Healthcare Research and Quality. Implementing near-miss reporting and improvement tracking in primary care practices: lessons learned. Agency for Healthcare Research and Quality; 2017.
4. Hamed M, Konstantinidis S. Barriers to incident reporting among nurses: a qualitative systematic review. West J Nurs Res. 2022;44(5):506-523. doi:10.1177/0193945921999449
5. Mohamed M, Abubeker IY, Al-Mohanadi D, et al. Perceived barriers of incident reporting among internists: results from Hamad medical corporation in Qatar. Avicenna J Med. 2021;11(3):139-144. doi:10.1055/s-0041-1734386
6. The Joint Commission. The essential role of leadership in developing a safety culture. The Joint Commission; 2017.
7. Yali G, Nzala S. Healthcare providers’ perspective on barriers to patient safety incident reporting in Lusaka District. J Prev Rehabil Med. 2022;4:44-52. doi:10.21617/jprm2022.417
8. Herzer KR, Mirrer M, Xie Y, et al. Patient safety reporting systems: sustained quality improvement using a multidisciplinary team and “good catch” awards. Jt Comm J Qual Patient Saf. 2012;38(8):339-347. doi:10.1016/s1553-7250(12)38044-6
9. Rogers E, Griffin E, Carnie W, et al. A just culture approach to managing medication errors. Hosp Pharm. 2017;52(4):308-315. doi:10.1310/hpj5204-308
10. Murray JS, Clifford J, Larson S, et al. Implementing just culture to improve patient safety. Mil Med. 2022;0: 1. doi:10.1093/milmed/usac115
11. Paradiso L, Sweeney N. Just culture: it’s more than policy. Nurs Manag. 2019;50(6):38–45. doi:10.1097/01.NUMA.0000558482.07815.ae
12. Wallace S, Mamrol M, Finley E; Pennsylvania Patient Safety Authority. Promote a culture of safety with good catch reports. PA Patient Saf Advis. 2017;14(3).
13. Tan KH, Pang NL, Siau C, et al: Building an organizational culture of patient safety. J Patient Saf Risk Manag. 2019;24:253-261. doi.10.1177/251604351987897
14. Merchant N, O’Neal J, Dealino-Perez C, et al: A high reliability mindset. Am J Med Qual. 2022;37(6):504-510. doi:10.1097/JMQ.0000000000000086
15. Behavioral interview questions and answers. Hudson. Accessed December 23, 2022. https://au.hudson.com/insights/career-advice/job-interviews/behavioural-interview-questions-and-answers/
16. The Joint Commission. Safety culture assessment: Improving the survey process. Accessed December 26, 2022. https://www.jointcommission.org/-/media/tjc/documents/accred-and-cert/safety_culture_assessment_improving_the_survey_process.pdf
17. Reis CT, Paiva SG, Sousa P. The patient safety culture: a systematic review by characteristics of hospital survey on patient safety culture dimensions. Int J Qual Heal Care. 2018;30(9):660-677. doi:10.1093/intqhc/mzy080
18. Fourar YO, Benhassine W, Boughaba A, et al. Contribution to the assessment of patient safety culture in Algerian healthcare settings: the ASCO project. Int J Healthc Manag. 2022;15:52-61. doi.org/10.1080/20479700.2020.1836736
ABSTRACT
Objective: Promoting a culture of safety is a critical component of improving health care quality. Recognizing staff who stop the line for safety can positively impact the growth of a culture of safety. The purpose of this initiative was to demonstrate to staff the importance of speaking up for safety and being acknowledged for doing so.
Methods: Following a review of the literature on safety awards programs and their role in promoting a culture of safety in health care covering the period 2017 to 2020, a formal process was developed and implemented to disseminate safety awards to employees.
Results: During the initial 18 months of the initiative, a total of 59 awards were presented. The awards were well received by the recipients and other staff members. Within this period, adjustments were made to enhance the scope and reach of the program.
Conclusion: Recognizing staff behaviors that support a culture of safety is important for improving health care quality and employee engagement. Future research should focus on a formal evaluation of the impact of safety awards programs on patient safety outcomes.
Keywords: patient safety, culture of safety, incident reporting, near miss.
A key aspect of improving health care quality is promoting and sustaining a culture of safety in the workplace. Improving the quality of health care services and systems involves making informed choices regarding the types of strategies to implement.1 An essential aspect of supporting a safety culture is safety-event reporting. To approach the goal of zero harm, all safety events, whether they result in actual harm or are considered near misses, need to be reported. Near-miss events are errors that occur while care is being provided but are detected and corrected before harm reaches the patient.1-3 Near-miss reporting plays a critical role in helping to identify and correct weaknesses in health care delivery systems and processes.4 However, evidence shows that there are a multitude of barriers to the reporting of near-miss events, such as fear of punitive actions, additional workload, unsupportive work environments, a culture with poor psychological safety, knowledge deficit, and lack of recognition of staff who do report near misses.4-11
According to The Joint Commission (TJC), acknowledging health care team members who recognize and report unsafe conditions that provide insight for improving patient safety is a key method for promoting the reporting of near-miss events.6 As a result, some health care organizations and patient safety agencies have started to institute some form of recognition for their employees in the realm of safety.8-10 The Pennsylvania Patient Safety Authority offers exceptional guidance for creating a safety awards program to promote a culture of safety.12 Furthermore, TJC supports recognizing individuals and health care teams who identify and report near misses, or who have suggestions for initiatives to promote patient safety, with “good catch” awards. Individuals or teams working to promote and sustain a culture of safety should be recognized for their efforts. Acknowledging “good catches” to reward the identification, communication, and resolution of safety issues is an effective strategy for improving patient safety and health care quality.6,8
This quality improvement (QI) initiative was undertaken to demonstrate to staff that, in building an organizational culture of safety, it is important that staff be encouraged to speak up for safety and be acknowledged for doing so. If health care organizations want staff to be motivated to report near misses and improve safety and health care quality, the culture needs to shift from focusing on blame to incentivizing individuals and teams to speak up when they have concerns.8-10 Although deciding which safety actions are worthy of recognition can be challenging, recognizing all safe acts, regardless of how big or small they are perceived to be, is important. This QI initiative aimed to establish a tiered approach to recognize staff members for various categories of safety acts.
METHODS
A review of the literature from January 2017 to May 2020 for peer-reviewed publications regarding how other organizations implemented safety award programs to promote a culture of safety resulted in a dearth of evidence. This prompted us at the Veterans Affairs Connecticut Healthcare System to develop and implement a formal program to disseminate safety awards to employees.
Program Launch and Promotion
In 2020, our institution embarked on a journey to high reliability with the goal of approaching zero harm. As part of efforts to promote a culture of safety, the hospital’s High Reliability Organization (HRO) team worked to develop a safety awards recognition program. Prior to the launch, the hospital’s patient safety committee recognized staff members through the medical center safety event reporting system (the Joint Patient Safety Reporting system [JPSR]) or through direct communication with staff members on safety actions they were engaged in. JPSR is the Veterans Health Administration National Center for Patient Safety incident reporting system for reporting, tracking, and trending of patient incidents in a national database. The award consisted of a certificate presented by the patient safety committee chairpersons to the employee in front of their peers in their respective work area. Hospital leadership was not involved in the safety awards recognition program at that time. No nomination process existed prior to our QI launch.
Once the QI initiative was launched and marketed heavily at staff meetings, we started to receive nominations for actions that were truly exceptional, while many others were submitted for behaviors that were within the day-to-day scope of practice of the staff member. For those early nominations that did not meet criteria for an award, we thanked staff for their submissions with a gentle statement that their nomination did not meet the criteria for an award. After following this practice for a few weeks, we became concerned that if we did not acknowledge the staff who came forward to request recognition for their routine work that supported safety, we could risk losing their engagement in a culture of safety. As such, we decided to create 3 levels of awards to recognize behaviors that went above and beyond while also acknowledging staff for actions within their scope of practice. Additionally, hospital leadership wanted to ensure that all staff recognize that their safety efforts are valued by leadership and that that sense of value will hopefully contribute to a culture of safety over time.
Initially, the single award system was called the “Good Catch Award” to acknowledge staff who go above and beyond to speak up and take action when they have safety concerns. This particular recognition includes a certificate, an encased baseball card that has been personalized by including the staff member’s picture and safety event identified, a stress-release baseball, and a stick of Bazooka gum (similar to what used to come in baseball cards packs). The award is presented to employees in their work area by the HRO and patient safety teams and includes representatives from the executive leadership team (ELT). The safety event identified is described by an ELT member, and all items are presented to the employee. Participation by the leadership team communicates how much the work being done to promote a culture of safety and advance quality health care is appreciated. This action also encourages others in the organization to identify and report safety concerns.13
With the rollout of the QI initiative, the volume of nominations submitted quickly increased (eg, approximately 1 every 2 months before to 3 per month following implementation). Frequently, nominations were for actions believed to be within the scope of the employee’s responsibilities. Our institution’s leadership team quickly recognized that, as an organization, not diminishing the importance of the “Good Catch Award” was important. However, the
The original Good Catch Award was labelled as a Level 1 award. The Level 2 safety recognition award, named the HRO Safety Champion Award, is given to employees who stop the line for a safety concern within their scope of practice and also participate as part of a team to investigate and improve processes to avoid recurring safety concerns in the future. For the Level Two award, a certificate is presented to an employee by the hospital’s HRO lead, HRO physician champion, patient safety manager, immediate supervisor, and peers. With the Level 3 award, the Culture of Safety Appreciation Award, individuals are recognized for addressing safety concerns within their assigned scope of responsibilities. Recognition is bestowed by an email of appreciation sent to the employee, acknowledging their commitment to promoting a culture of safety and quality health care. The recipient’s direct supervisor and other hospital leaders are copied on the message.14 See Table 1 for a
Our institution’s HRO and patient safety teams utilized many additional venues to disseminate information regarding awardees and their actions. These included our monthly HRO newsletter, monthly safety forums, and biweekly Team Connecticut Healthcare system-wide huddles.
Nomination Process
Awards nominations are submitted via the hospital intranet homepage, where there is an “HRO Safety Award Nomination” icon. Once a staff member clicks the icon, a template opens asking for information, such as the reason for the nomination submission, and then walks them through the template using the CAR (C-context, A-actions, and R-results)15 format for describing the situation, identifying actions taken, and specifying the outcome of the action. Emails with award nominations can also be sent to the HRO lead, HRO champion, or Patient Safety Committee co-chairs. Calls for nominations are made at several venues attended by employees as well as supervisors. These include monthly safety forums, biweekly Team Connecticut Healthcare system-wide huddles, supervisory staff meetings, department and unit-based staff meetings, and many other formal and informal settings. This QI initiative has allowed us to capture potential awardees through several avenues, including self-nominations. All nominations are reviewed by a safety awards committee. Each committee member ranks the nomination as a Level 1, 2, or 3 award. For nominations where conflicting scores are obtained, the committee discusses the nomination together to resolve discrepancies.
Needed Resources
Material resources required for this QI initiative include certificate paper, plastic baseball card sleeves, stress-release baseballs, and Bazooka gum. The largest resource investment was the time needed to support the initiative. This included the time spent scheduling the Level 1 and 2 award presentations with staff and leadership. Time was also required to put the individual award packages together, which included printing the paper certificates, obtaining awardee pictures, placing them with their safety stories in a plastic baseball card sleeve, and arranging for the hospital photographer to take pictures of the awardees with their peers and leaders.
RESULTS
Prior to this QI initiative launch, 14 awards were given out over the preceding 2-year period. During the initial 18 months of the initiative (December 2020 to June 2022), 59 awards were presented (Level 1, n = 26; Level 2, n = 22; and Level 3, n = 11). Looking further into the Level 1 awards presented, 25 awardees worked in clinical roles and 1 in a nonclinical position (Table 2). The awardees represented multidisciplinary areas, including medical/surgical (med/surg) inpatient units, anesthesia, operating room, pharmacy, mental health clinics, surgical intensive care, specialty care clinics, and nutrition and food services. With the Level 2 awards, 18 clinical staff and 4 nonclinical staff received awards from the areas of med/surg inpatient, outpatient surgical suites, the medical center director’s office, radiology, pharmacy, primary care, facilities management, environmental management, infection prevention, and emergency services. All Level 3 awardees were from clinical areas, including primary care, hospital education, sterile processing, pharmacies, operating rooms, and med/surg inpatient units.
With the inception of this QI initiative, our organization has begun to see trends reflecting increased reporting of both actual and close-call events in JPSR (Figure 1).
With the inclusion of information regarding awardees and their actions in monthly safety forums, attendance at these forums has increased from an average of 64 attendees per month in 2021 to an average of 131 attendees per month in 2022 (Figure 2).
Finally, our organization’s annual All-Employee Survey results have shown incremental increases in staff reporting feeling psychologically safe and not fearing reprisal (Figure 3). It is important to note that there may be other contributing factors to these incremental changes.
Level 1 – Good Catch Award. M.S. was assigned as a continuous safety monitor, or “sitter,” on one of the med/surg inpatient units. M.S. arrived at the bedside and asked for a report on the patient at a change in shift. The report stated that the patient was sleeping and had not moved in a while. M.S. set about to perform the functions of a sitter and did her usual tasks in cleaning and tidying the room for the patient for breakfast and taking care of all items in the room, in general. M.S. introduced herself to the patient, who she thought might wake up because of her speaking to him. She thought the patient was in an odd position, and knowing that a patient should be a little further up in the bed, she tried with touch to awaken him to adjust his position. M.S. found that the patient was rather chilly to the touch and immediately became concerned. She continued to attempt to rouse the patient. M.S. called for the nurse and began to adjust the patient’s position. M.S. insisted that the patient was cold and “something was wrong.” A set of vitals was taken and a rapid response team code was called. The patient was immediately transferred to the intensive care unit to receive a higher level of care. If not for the diligence and caring attitude of M.S., this patient may have had a very poor outcome.
Reason for criteria being met: The scope of practice of a sitter is to be present in a patient’s room to monitor for falls and overall safety. This employee noticed that the patient was not responsive to verbal or tactile stimuli. Her immediate reporting of her concern to the nurse resulted in prompt intervention. If she had let the patient be, the patient could have died. The staff member went above and beyond by speaking up and taking action when she had a patient safety concern.
Level 2 – HRO Safety Champion Award. A patient presented to an outpatient clinic for monoclonal antibody (mAb) therapy for a COVID-19 infection; the treatment has been scheduled by the patient’s primary care provider. At that time, outpatient mAb therapy was the recommended care option for patients stable enough to receive treatment in this setting, but it is contraindicated in patients who are too unstable to receive mAb therapy in an outpatient setting, such as those with increased oxygen demands. R.L., a staff nurse, assessed the patient on arrival and found that his vital signs were stable, except for a slightly elevated respiratory rate. Upon questioning, the patient reported that he had increased his oxygen use at home from 2 to 4 L via a nasal cannula. R.L. assessed that the patient was too high-risk for outpatient mAb therapy and had the patient checked into the emergency department (ED) to receive a full diagnostic workup and evaluation by Dr. W., an ED provider. The patient required admission to the hospital for a higher level of care in an inpatient unit because of severe COVID-19 infection. Within 48 hours of admission, the patient’s condition further declined, requiring an upgrade to the medical intensive care unit with progressive interventions. Owing to the clinical assessment skills and prompt action of R.L., the patient was admitted to the hospital instead of receiving treatment in a suboptimal care setting and returning home. Had the patient gone home, his rapid decline could have had serious consequences.
Reason for criteria being met: On a cursory look, the patient may have passed as someone sufficiently stable to undergo outpatient treatment. However, the nurse stopped the line, paid close attention, and picked up on an abnormal vital sign and the projected consequences. The nurse brought the patient to a higher level of care in the ED so that he could get the attention he needed. If this patient was given mAb therapy in the outpatient setting, he would have been discharged and become sicker with the COVID-19 illness. As a result of this incident, R.L. is working with the outpatient clinic and ED staff to enahance triage and evaluation of patients referred for outpatient therapy for COVID-19 infections to prevent a similar event from recurring.
Level 3 – Culture of Safety Appreciation Award. While C.C. was reviewing the hazardous item
Reason for criteria being met: The employee works in the hospital education department. It is within her scope of responsibilities to provide ongoing education to staff in order to address potential safety concerns.
DISCUSSION
This QI initiative was undertaken to demonstrate to staff that, in building an organizational culture of safety and advancing quality health care, it is important that staff be encouraged to speak up for safety and be acknowledged for doing so. As part of efforts to continuously build on a safety-first culture, transparency and celebration of successes were demonstrated. This QI initiative demonstrated that a diverse and wide range of employees were reached, from clinical to nonclinical staff, and frontline to supervisory staff, as all were included in the recognition process. While many award nominations were received through the submission of safety concerns to the high-reliability team and patient safety office, several came directly from staff who wanted to recognize their peers for their work, supporting a culture of safety. This showed that staff felt that taking the time to submit a write-up to recognize a peer was an important task. Achieving zero harm for patients and staff alike is a top priority for our institution and guides all decisions, which reinforces that everyone has a responsibility to ensure that safety is always the first consideration. A culture of safety is enhanced by staff recognition. This QI initiative also showed that staff felt valued when they were acknowledged, regardless of the level of recognition they received. The theme of feeling valued came from unsolicited feedback. For example, some direct comments from awardees are presented in the Box.
In addition to endorsing the importance of safe practices to staff, safety award programs can identify gaps in existing standard procedures that can be updated quickly and shared broadly across a health care organization. The authors observed that the existence of the award program gives staff permission to use their voice to speak up when they have questions or concerns related to safety and to proactively engage in safety practices; a cultural shift of this kind informs safety practices and procedures and contributes to a more inspiring workplace. Staff at our organization who have received any of the safety awards, and those who are aware of these awards, have embraced the program readily. At the time of submission of this manuscript, there was a relative paucity of published literature on the details, performance, and impact of such programs. This initiative aims to share a road map highlighting the various dimensions of staff recognition and how the program supports our health care system in fostering a strong, sustainable culture of safety and health care quality. A next step is to formally assess the impact of the awards program on our culture of safety and quality using a psychometrically sound measurement tool, as recommended by TJC,16 such as the
CONCLUSION
A health care organization safety awards program is a strategy for building and sustaining a culture of safety. This QI initiative may be valuable to other organizations in the process of establishing a safety awards program of their own. Future research should focus on a formal evaluation of the impact of safety awards programs on patient safety outcomes.
Corresponding author: John S. Murray, PhD, MPH, MSGH, RN, FAAN, 20 Chapel Street, Unit A502, Brookline, MA 02446; JMurray325@aol.com
Disclosures: None reported.
1. National Center for Biotechnology Information. Improving healthcare quality in Europe: Characteristics, effectiveness and implementation of different strategies. National Library of Medicine; 2019.
2.
3. Agency for Healthcare Research and Quality. Implementing near-miss reporting and improvement tracking in primary care practices: lessons learned. Agency for Healthcare Research and Quality; 2017.
4. Hamed M, Konstantinidis S. Barriers to incident reporting among nurses: a qualitative systematic review. West J Nurs Res. 2022;44(5):506-523. doi:10.1177/0193945921999449
5. Mohamed M, Abubeker IY, Al-Mohanadi D, et al. Perceived barriers of incident reporting among internists: results from Hamad medical corporation in Qatar. Avicenna J Med. 2021;11(3):139-144. doi:10.1055/s-0041-1734386
6. The Joint Commission. The essential role of leadership in developing a safety culture. The Joint Commission; 2017.
7. Yali G, Nzala S. Healthcare providers’ perspective on barriers to patient safety incident reporting in Lusaka District. J Prev Rehabil Med. 2022;4:44-52. doi:10.21617/jprm2022.417
8. Herzer KR, Mirrer M, Xie Y, et al. Patient safety reporting systems: sustained quality improvement using a multidisciplinary team and “good catch” awards. Jt Comm J Qual Patient Saf. 2012;38(8):339-347. doi:10.1016/s1553-7250(12)38044-6
9. Rogers E, Griffin E, Carnie W, et al. A just culture approach to managing medication errors. Hosp Pharm. 2017;52(4):308-315. doi:10.1310/hpj5204-308
10. Murray JS, Clifford J, Larson S, et al. Implementing just culture to improve patient safety. Mil Med. 2022;0: 1. doi:10.1093/milmed/usac115
11. Paradiso L, Sweeney N. Just culture: it’s more than policy. Nurs Manag. 2019;50(6):38–45. doi:10.1097/01.NUMA.0000558482.07815.ae
12. Wallace S, Mamrol M, Finley E; Pennsylvania Patient Safety Authority. Promote a culture of safety with good catch reports. PA Patient Saf Advis. 2017;14(3).
13. Tan KH, Pang NL, Siau C, et al: Building an organizational culture of patient safety. J Patient Saf Risk Manag. 2019;24:253-261. doi.10.1177/251604351987897
14. Merchant N, O’Neal J, Dealino-Perez C, et al: A high reliability mindset. Am J Med Qual. 2022;37(6):504-510. doi:10.1097/JMQ.0000000000000086
15. Behavioral interview questions and answers. Hudson. Accessed December 23, 2022. https://au.hudson.com/insights/career-advice/job-interviews/behavioural-interview-questions-and-answers/
16. The Joint Commission. Safety culture assessment: Improving the survey process. Accessed December 26, 2022. https://www.jointcommission.org/-/media/tjc/documents/accred-and-cert/safety_culture_assessment_improving_the_survey_process.pdf
17. Reis CT, Paiva SG, Sousa P. The patient safety culture: a systematic review by characteristics of hospital survey on patient safety culture dimensions. Int J Qual Heal Care. 2018;30(9):660-677. doi:10.1093/intqhc/mzy080
18. Fourar YO, Benhassine W, Boughaba A, et al. Contribution to the assessment of patient safety culture in Algerian healthcare settings: the ASCO project. Int J Healthc Manag. 2022;15:52-61. doi.org/10.1080/20479700.2020.1836736
Quality of Life and Population Health in Behavioral Health Care: A Retrospective, Cross-Sectional Study
From Milwaukee County Behavioral Health Services, Milwaukee, WI.
Abstract
Objectives: The goal of this study was to determine whether a single-item quality of life (QOL) measure could serve as a useful population health–level metric within the Quadruple Aim framework in a publicly funded behavioral health system.
Design: This was a retrospective, cross-sectional study that examined the correlation between the single-item QOL measure and several other key measures of the social determinants of health and a composite measure of acute service utilization for all patients receiving mental health and substance use services in a community behavioral health system.
Methods: Data were collected for 4488 patients who had at least 1 assessment between October 1, 2020, and September 30, 2021. Data on social determinants of health were obtained through patient self-report; acute service use data were obtained from electronic health records.
Results: Statistical analyses revealed results in the expected direction for all relationships tested. Patients with higher QOL were more likely to report “Good” or better self-rated physical health, be employed, have a private residence, and report recent positive social interactions, and were less likely to have received acute services in the previous 90 days.
Conclusion: A single-item QOL measure shows promise as a general, minimally burdensome whole-system metric that can function as a target for population health management efforts in a large behavioral health system. Future research should explore whether this QOL measure is sensitive to change over time and examine its temporal relationship with other key outcome metrics.
Keywords: Quadruple Aim, single-item measures, social determinants of health, acute service utilization metrics.
The Triple Aim for health care—improving the individual experience of care, increasing the health of populations, and reducing the costs of care—was first proposed in 2008.1 More recently, some have advocated for an expanded focus to include a fourth aim: the quality of staff work life.2 Since this seminal paper was published, many health care systems have endeavored to adopt and implement the Quadruple Aim3,4; however, the concepts representing each of the aims are not universally defined,3 nor are the measures needed to populate the Quadruple Aim always available within the health system in question.5
Although several assessment models and frameworks that provide guidance to stakeholders have been developed,6,7 it is ultimately up to organizations themselves to determine which measures they should deploy to best represent the different quadrants of the Quadruple Aim.6 Evidence suggests, however, that quality measurement, and the administrative time required to conduct it, can be both financially and emotionally burdensome to providers and health systems.8-10 Thus, it is incumbent on organizations to select a set of measures that are not only meaningful but as parsimonious as possible.6,11,12
Quality of life (QOL) is a potential candidate to assess the aim of population health. Brief health-related QOL questions have long been used in epidemiological surveys, such as the Behavioral Risk Factor Surveillance System survey.13 Such questions are also a key component of community health frameworks, such as the County Health Rankings developed by the University of Wisconsin Population Health Institute.14 Furthermore, Humana recently revealed that increasing the number of physical and mental health “Healthy Days” (which are among the Centers for Disease Control and Prevention’s Health-Related Quality of Life questions15) among the members enrolled in their insurance plan would become a major goal for the organization.16,17 Many of these measures, while brief, focus on QOL as a function of health, often as a self-rated construct (from “Poor” to “Excellent”) or in the form of days of poor physical or mental health in the past 30 days,15 rather than evaluating QOL itself; however, several authors have pointed out that health status and QOL are related but distinct concepts.18,19
Brief single-item assessments focused specifically on QOL have been developed and implemented within nonclinical20 and clinical populations, including individuals with cancer,21 adults with disabilities,22 individuals with cystic fibrosis,23 and children with epilepsy.24 Despite the long history of QOL assessment in behavioral health treatment,25 single-item measures have not been widely implemented in this population.
Milwaukee County Behavioral Health Services (BHS), a publicly funded, county-based behavioral health care system in Milwaukee, Wisconsin, provides inpatient and ambulatory treatment, psychiatric emergency care, withdrawal management, care management, crisis services, and other support services to individuals in Milwaukee County. In 2018 the community services arm of BHS began implementing a single QOL question from the World Health Organization’s WHOQOL-BREF26: On a 5-point rating scale of “Very Poor” to “Very Good,” “How would you rate your overall quality of life right now?” Previous research by Atroszko and colleagues,20 which used a similar approach with the same item from the WHOQOL-BREF, reported correlations in the expected direction of the single-item QOL measure with perceived stress, depression, anxiety, loneliness, and daily hours of sleep. This study’s sample, however, comprised opportunistically recruited college students, not a clinical population. Further, the researchers did not examine the relationship of QOL with acute service utilization or other measures of the social determinants of health, such as housing, employment, or social connectedness.
The following study was designed to extend these results by focusing on a clinical population—individuals with mental health or substance use issues—being served in a large, publicly funded behavioral health system in Milwaukee, Wisconsin. The objective of this study was to determine whether a single-item QOL measure could be used as a brief, parsimonious measure of overall population health by examining its relationship with other key outcome measures for patients receiving services from BHS. This study was reviewed and approved by BHS’s Institutional Review Board.
Methods
All patients engaged in nonacute community services are offered a standardized assessment that includes, among other measures, items related to QOL, housing status, employment status, self-rated physical health, and social connectedness. This assessment is administered at intake, discharge, and every 6 months while patients are enrolled in services. Patients who received at least 1 assessment between October 1, 2020, and September 30, 2021, were included in the analyses. Patients receiving crisis, inpatient, or withdrawal management services alone (ie, did not receive any other community-based services) were not offered the standard assessment and thus were not included in the analyses. If patients had more than 1 assessment during this time period, QOL data from the last assessment were used. Data on housing (private residence status, defined as adults living alone or with others without supervision in a house or apartment), employment status, self-rated physical health, and social connectedness (measured by asking people whether they have had positive interactions with family or friends in the past 30 days) were extracted from the same timepoint as well.
Also included in the analyses were rates of acute service utilization, in which any patient with at least 1 visit to BHS’s psychiatric emergency department, withdrawal management facility, or psychiatric inpatient facility in the 90 days prior to the date of the assessment received a code of “Yes,” and any patient who did not receive any of these services received a code of “No.” Chi-square analyses were conducted to determine the relationship between QOL rankings (“Very Poor,” “Poor,” “Neither Good nor Poor,” “Good,” and “Very Good”) and housing, employment, self-rated physical health, social connectedness, and 90-day acute service use. All acute service utilization data were obtained from BHS’s electronic health records system. All data used in the study were stored on a secure, password-protected server. All analyses were conducted with SPSS software (SPSS 28; IBM).
Results
Data were available for 4488 patients who received an assessment between October 1, 2020, and September 30, 2021 (total numbers per item vary because some items had missing data; see supplementary eTables 1-3 for sample size per item). Demographics of the patient sample are listed in Table 1; the demographics of the patients who were missing data for specific outcomes are presented in eTables 1-3.


Statistical analyses revealed results in the expected direction for all relationships tested (Table 2). As patients’ self-reported QOL improved, so did the likelihood of higher rates of self-reported “Good” or better physical health, which was 576% higher among individuals who reported “Very Good” QOL relative to those who reported “Very Poor” QOL. Similarly, when compared with individuals with “Very Poor” QOL, individuals who reported “Very Good” QOL were 21.91% more likely to report having a private residence, 126.7% more likely to report being employed, and 29.17% more likely to report having had positive social interactions with family and friends in the past 30 days. There was an inverse relationship between QOL and the likelihood that a patient had received at least 1 admission for an acute service in the previous 90 days, such that patients who reported “Very Good” QOL were 86.34% less likely to have had an admission compared to patients with “Very Poor” QOL (2.8% vs 20.5%, respectively). The relationships among the criterion variables used in this study are presented in Table 3.

Discussion
The results of this preliminary analysis suggest that self-rated QOL is related to key health, social determinants of health, and acute service utilization metrics. These data are important for several reasons. First, because QOL is a diagnostically agnostic measure, it is a cross-cutting measure to use with clinically diverse populations receiving an array of different services. Second, at 1 item, the QOL measure is extremely brief and therefore minimally onerous to implement for both patients and administratively overburdened providers. Third, its correlation with other key metrics suggests that it can function as a broad population health measure for health care organizations because individuals with higher QOL will also likely have better outcomes in other key areas. This suggests that it has the potential to broadly represent the overall status of a population of patients, thus functioning as a type of “whole system” measure, which the Institute for Healthcare Improvement describes as “a small set of measures that reflect a health system’s overall performance on core dimensions of quality guided by the Triple Aim.”7 These whole system measures can help focus an organization’s strategic initiatives and efforts on the issues that matter most to the patients and community it serves.
The relationship of QOL to acute service utilization deserves special mention. As an administrative measure, utilization is not susceptible to the same response bias as the other self-reported variables. Furthermore, acute services are costly to health systems, and hospital readmissions are associated with payment reductions in the Centers for Medicare and Medicaid Services (CMS) Hospital Readmissions Reduction Program for hospitals that fail to meet certain performance targets.27 Thus, because of its alignment with federal mandates, improved QOL (and potentially concomitant decreases in acute service use) may have significant financial implications for health systems as well.
This study was limited by several factors. First, it was focused on a population receiving publicly funded behavioral health services with strict eligibility requirements, one of which stipulated that individuals must be at 200% or less of the Federal Poverty Level; therefore, the results might not be applicable to health systems with a more clinically or socioeconomically diverse patient population. Second, because these data are cross-sectional, it was not possible to determine whether QOL improved over time or whether changes in QOL covaried longitudinally with the other metrics under observation. For example, if patients’ QOL improved from the first to last assessment, did their employment or residential status improve as well, or were these patients more likely to be employed at their first assessment? Furthermore, if there was covariance, did changes in employment, housing status, and so on precede changes in QOL or vice versa? Multiple longitudinal observations would help to address these questions and will be the focus of future analyses.
Conclusion
This preliminary study suggests that a single-item QOL measure may be a valuable population health–level metric for health systems. It requires little administrative effort on the part of either the clinician or patient. It is also agnostic with regard to clinical issue or treatment approach and can therefore admit of a range of diagnoses or patient-specific, idiosyncratic recovery goals. It is correlated with other key health, social determinants of health, and acute service utilization indicators and can therefore serve as a “whole system” measure because of its ability to broadly represent improvements in an entire population. Furthermore, QOL is patient-centered in that data are obtained through patient self-report, which is a high priority for CMS and other health care organizations.28 In summary, a single-item QOL measure holds promise for health care organizations looking to implement the Quadruple Aim and assess the health of the populations they serve in a manner that is simple, efficient, and patient-centered.
Acknowledgments: The author thanks Jennifer Wittwer for her thoughtful comments on the initial draft of this manuscript and Gary Kraft for his help extracting the data used in the analyses.
Corresponding author: Walter Matthew Drymalski, PhD; walter.drymalski@milwaukeecountywi.gov
Disclosures: None reported.
1. Berwick DM, Nolan TW, Whittington J. The triple aim: care, health, and cost. Health Aff (Millwood). 2008;27(3):759-769. doi:10.1377/hlthaff.27.3.759
2. Bodenheimer T, Sinsky C. From triple to quadruple aim: care of the patient requires care of the provider. Ann Fam Med. 2014;12(6):573-576. doi:10.1370/afm.1713
3. Hendrikx RJP, Drewes HW, Spreeuwenberg M, et al. Which triple aim related measures are being used to evaluate population management initiatives? An international comparative analysis. Health Policy. 2016;120(5):471-485. doi:10.1016/j.healthpol.2016.03.008
4. Whittington JW, Nolan K, Lewis N, Torres T. Pursuing the triple aim: the first 7 years. Milbank Q. 2015;93(2):263-300. doi:10.1111/1468-0009.12122
5. Ryan BL, Brown JB, Glazier RH, Hutchison B. Examining primary healthcare performance through a triple aim lens. Healthc Policy. 2016;11(3):19-31.
6. Stiefel M, Nolan K. A guide to measuring the Triple Aim: population health, experience of care, and per capita cost. Institute for Healthcare Improvement; 2012. Accessed November 1, 2022. https://nhchc.org/wp-content/uploads/2019/08/ihiguidetomeasuringtripleaimwhitepaper2012.pdf
7. Martin L, Nelson E, Rakover J, Chase A. Whole system measures 2.0: a compass for health system leaders. Institute for Healthcare Improvement; 2016. Accessed November 1, 2022. http://www.ihi.org:80/resources/Pages/IHIWhitePapers/Whole-System-Measures-Compass-for-Health-System-Leaders.aspx
8. Casalino LP, Gans D, Weber R, et al. US physician practices spend more than $15.4 billion annually to report quality measures. Health Aff (Millwood). 2016;35(3):401-406. doi:10.1377/hlthaff.2015.1258
9. Rao SK, Kimball AB, Lehrhoff SR, et al. The impact of administrative burden on academic physicians: results of a hospital-wide physician survey. Acad Med. 2017;92(2):237-243. doi:10.1097/ACM.0000000000001461
10. Woolhandler S, Himmelstein DU. Administrative work consumes one-sixth of U.S. physicians’ working hours and lowers their career satisfaction. Int J Health Serv. 2014;44(4):635-642. doi:10.2190/HS.44.4.a
11. Meyer GS, Nelson EC, Pryor DB, et al. More quality measures versus measuring what matters: a call for balance and parsimony. BMJ Qual Saf. 2012;21(11):964-968. doi:10.1136/bmjqs-2012-001081
12. Vital Signs: Core Metrics for Health and Health Care Progress. Washington, DC: National Academies Press; 2015. doi:10.17226/19402
13. Centers for Disease Control and Prevention. BRFSS questionnaires. Accessed November 1, 2022. https://www.cdc.gov/brfss/questionnaires/index.htm
14. County Health Rankings and Roadmaps. Measures & data sources. University of Wisconsin Population Health Institute. Accessed November 1, 2022. https://www.countyhealthrankings.org/explore-health-rankings/measures-data-sources
15. Centers for Disease Control and Prevention. Healthy days core module (CDC HRQOL-4). Accessed November 1, 2022. https://www.cdc.gov/hrqol/hrqol14_measure.htm
16. Cordier T, Song Y, Cambon J, et al. A bold goal: more healthy days through improved community health. Popul Health Manag. 2018;21(3):202-208. doi:10.1089/pop.2017.0142
17. Slabaugh SL, Shah M, Zack M, et al. Leveraging health-related quality of life in population health management: the case for healthy days. Popul Health Manag. 2017;20(1):13-22. doi:10.1089/pop.2015.0162
18. Karimi M, Brazier J. Health, health-related quality of life, and quality of life: what is the difference? Pharmacoeconomics. 2016;34(7):645-649. doi:10.1007/s40273-016-0389-9
19. Smith KW, Avis NE, Assmann SF. Distinguishing between quality of life and health status in quality of life research: a meta-analysis. Qual Life Res. 1999;8(5):447-459. doi:10.1023/a:1008928518577
20. Atroszko PA, Baginska P, Mokosinska M, et al. Validity and reliability of single-item self-report measures of general quality of life, general health and sleep quality. In: CER Comparative European Research 2015. Sciemcee Publishing; 2015:207-211.
21. Singh JA, Satele D, Pattabasavaiah S, et al. Normative data and clinically significant effect sizes for single-item numerical linear analogue self-assessment (LASA) scales. Health Qual Life Outcomes. 2014;12:187. doi:10.1186/s12955-014-0187-z
22. Siebens HC, Tsukerman D, Adkins RH, et al. Correlates of a single-item quality-of-life measure in people aging with disabilities. Am J Phys Med Rehabil. 2015;94(12):1065-1074. doi:10.1097/PHM.0000000000000298
23. Yohannes AM, Dodd M, Morris J, Webb K. Reliability and validity of a single item measure of quality of life scale for adult patients with cystic fibrosis. Health Qual Life Outcomes. 2011;9:105. doi:10.1186/1477-7525-9-105
24. Conway L, Widjaja E, Smith ML. Single-item measure for assessing quality of life in children with drug-resistant epilepsy. Epilepsia Open. 2017;3(1):46-54. doi:10.1002/epi4.12088
25. Barry MM, Zissi A. Quality of life as an outcome measure in evaluating mental health services: a review of the empirical evidence. Soc Psychiatry Psychiatr Epidemiol. 1997;32(1):38-47. doi:10.1007/BF00800666
26. Skevington SM, Lotfy M, O’Connell KA. The World Health Organization’s WHOQOL-BREF quality of life assessment: psychometric properties and results of the international field trial. Qual Life Res. 2004;13(2):299-310. doi:10.1023/B:QURE.0000018486.91360.00
27. Centers for Medicare & Medicaid Services. Hospital readmissions reduction program (HRRP). Accessed November 1, 2022. https://www.cms.gov/Medicare/Medicare-Fee-for-Service-Payment/AcuteInpatientPPS/Readmissions-Reduction-Program
28. Centers for Medicare & Medicaid Services. Patient-reported outcome measures. CMS Measures Management System. Published May 2022. Accessed November 1, 2022. https://www.cms.gov/files/document/blueprint-patient-reported-outcome-measures.pdf
From Milwaukee County Behavioral Health Services, Milwaukee, WI.
Abstract
Objectives: The goal of this study was to determine whether a single-item quality of life (QOL) measure could serve as a useful population health–level metric within the Quadruple Aim framework in a publicly funded behavioral health system.
Design: This was a retrospective, cross-sectional study that examined the correlation between the single-item QOL measure and several other key measures of the social determinants of health and a composite measure of acute service utilization for all patients receiving mental health and substance use services in a community behavioral health system.
Methods: Data were collected for 4488 patients who had at least 1 assessment between October 1, 2020, and September 30, 2021. Data on social determinants of health were obtained through patient self-report; acute service use data were obtained from electronic health records.
Results: Statistical analyses revealed results in the expected direction for all relationships tested. Patients with higher QOL were more likely to report “Good” or better self-rated physical health, be employed, have a private residence, and report recent positive social interactions, and were less likely to have received acute services in the previous 90 days.
Conclusion: A single-item QOL measure shows promise as a general, minimally burdensome whole-system metric that can function as a target for population health management efforts in a large behavioral health system. Future research should explore whether this QOL measure is sensitive to change over time and examine its temporal relationship with other key outcome metrics.
Keywords: Quadruple Aim, single-item measures, social determinants of health, acute service utilization metrics.
The Triple Aim for health care—improving the individual experience of care, increasing the health of populations, and reducing the costs of care—was first proposed in 2008.1 More recently, some have advocated for an expanded focus to include a fourth aim: the quality of staff work life.2 Since this seminal paper was published, many health care systems have endeavored to adopt and implement the Quadruple Aim3,4; however, the concepts representing each of the aims are not universally defined,3 nor are the measures needed to populate the Quadruple Aim always available within the health system in question.5
Although several assessment models and frameworks that provide guidance to stakeholders have been developed,6,7 it is ultimately up to organizations themselves to determine which measures they should deploy to best represent the different quadrants of the Quadruple Aim.6 Evidence suggests, however, that quality measurement, and the administrative time required to conduct it, can be both financially and emotionally burdensome to providers and health systems.8-10 Thus, it is incumbent on organizations to select a set of measures that are not only meaningful but as parsimonious as possible.6,11,12
Quality of life (QOL) is a potential candidate to assess the aim of population health. Brief health-related QOL questions have long been used in epidemiological surveys, such as the Behavioral Risk Factor Surveillance System survey.13 Such questions are also a key component of community health frameworks, such as the County Health Rankings developed by the University of Wisconsin Population Health Institute.14 Furthermore, Humana recently revealed that increasing the number of physical and mental health “Healthy Days” (which are among the Centers for Disease Control and Prevention’s Health-Related Quality of Life questions15) among the members enrolled in their insurance plan would become a major goal for the organization.16,17 Many of these measures, while brief, focus on QOL as a function of health, often as a self-rated construct (from “Poor” to “Excellent”) or in the form of days of poor physical or mental health in the past 30 days,15 rather than evaluating QOL itself; however, several authors have pointed out that health status and QOL are related but distinct concepts.18,19
Brief single-item assessments focused specifically on QOL have been developed and implemented within nonclinical20 and clinical populations, including individuals with cancer,21 adults with disabilities,22 individuals with cystic fibrosis,23 and children with epilepsy.24 Despite the long history of QOL assessment in behavioral health treatment,25 single-item measures have not been widely implemented in this population.
Milwaukee County Behavioral Health Services (BHS), a publicly funded, county-based behavioral health care system in Milwaukee, Wisconsin, provides inpatient and ambulatory treatment, psychiatric emergency care, withdrawal management, care management, crisis services, and other support services to individuals in Milwaukee County. In 2018 the community services arm of BHS began implementing a single QOL question from the World Health Organization’s WHOQOL-BREF26: On a 5-point rating scale of “Very Poor” to “Very Good,” “How would you rate your overall quality of life right now?” Previous research by Atroszko and colleagues,20 which used a similar approach with the same item from the WHOQOL-BREF, reported correlations in the expected direction of the single-item QOL measure with perceived stress, depression, anxiety, loneliness, and daily hours of sleep. This study’s sample, however, comprised opportunistically recruited college students, not a clinical population. Further, the researchers did not examine the relationship of QOL with acute service utilization or other measures of the social determinants of health, such as housing, employment, or social connectedness.
The following study was designed to extend these results by focusing on a clinical population—individuals with mental health or substance use issues—being served in a large, publicly funded behavioral health system in Milwaukee, Wisconsin. The objective of this study was to determine whether a single-item QOL measure could be used as a brief, parsimonious measure of overall population health by examining its relationship with other key outcome measures for patients receiving services from BHS. This study was reviewed and approved by BHS’s Institutional Review Board.
Methods
All patients engaged in nonacute community services are offered a standardized assessment that includes, among other measures, items related to QOL, housing status, employment status, self-rated physical health, and social connectedness. This assessment is administered at intake, discharge, and every 6 months while patients are enrolled in services. Patients who received at least 1 assessment between October 1, 2020, and September 30, 2021, were included in the analyses. Patients receiving crisis, inpatient, or withdrawal management services alone (ie, did not receive any other community-based services) were not offered the standard assessment and thus were not included in the analyses. If patients had more than 1 assessment during this time period, QOL data from the last assessment were used. Data on housing (private residence status, defined as adults living alone or with others without supervision in a house or apartment), employment status, self-rated physical health, and social connectedness (measured by asking people whether they have had positive interactions with family or friends in the past 30 days) were extracted from the same timepoint as well.
Also included in the analyses were rates of acute service utilization, in which any patient with at least 1 visit to BHS’s psychiatric emergency department, withdrawal management facility, or psychiatric inpatient facility in the 90 days prior to the date of the assessment received a code of “Yes,” and any patient who did not receive any of these services received a code of “No.” Chi-square analyses were conducted to determine the relationship between QOL rankings (“Very Poor,” “Poor,” “Neither Good nor Poor,” “Good,” and “Very Good”) and housing, employment, self-rated physical health, social connectedness, and 90-day acute service use. All acute service utilization data were obtained from BHS’s electronic health records system. All data used in the study were stored on a secure, password-protected server. All analyses were conducted with SPSS software (SPSS 28; IBM).
Results
Data were available for 4488 patients who received an assessment between October 1, 2020, and September 30, 2021 (total numbers per item vary because some items had missing data; see supplementary eTables 1-3 for sample size per item). Demographics of the patient sample are listed in Table 1; the demographics of the patients who were missing data for specific outcomes are presented in eTables 1-3.
Statistical analyses revealed results in the expected direction for all relationships tested (Table 2). As patients’ self-reported QOL improved, so did the likelihood of higher rates of self-reported “Good” or better physical health, which was 576% higher among individuals who reported “Very Good” QOL relative to those who reported “Very Poor” QOL. Similarly, when compared with individuals with “Very Poor” QOL, individuals who reported “Very Good” QOL were 21.91% more likely to report having a private residence, 126.7% more likely to report being employed, and 29.17% more likely to report having had positive social interactions with family and friends in the past 30 days. There was an inverse relationship between QOL and the likelihood that a patient had received at least 1 admission for an acute service in the previous 90 days, such that patients who reported “Very Good” QOL were 86.34% less likely to have had an admission compared to patients with “Very Poor” QOL (2.8% vs 20.5%, respectively). The relationships among the criterion variables used in this study are presented in Table 3.
Discussion
The results of this preliminary analysis suggest that self-rated QOL is related to key health, social determinants of health, and acute service utilization metrics. These data are important for several reasons. First, because QOL is a diagnostically agnostic measure, it is a cross-cutting measure to use with clinically diverse populations receiving an array of different services. Second, at 1 item, the QOL measure is extremely brief and therefore minimally onerous to implement for both patients and administratively overburdened providers. Third, its correlation with other key metrics suggests that it can function as a broad population health measure for health care organizations because individuals with higher QOL will also likely have better outcomes in other key areas. This suggests that it has the potential to broadly represent the overall status of a population of patients, thus functioning as a type of “whole system” measure, which the Institute for Healthcare Improvement describes as “a small set of measures that reflect a health system’s overall performance on core dimensions of quality guided by the Triple Aim.”7 These whole system measures can help focus an organization’s strategic initiatives and efforts on the issues that matter most to the patients and community it serves.
The relationship of QOL to acute service utilization deserves special mention. As an administrative measure, utilization is not susceptible to the same response bias as the other self-reported variables. Furthermore, acute services are costly to health systems, and hospital readmissions are associated with payment reductions in the Centers for Medicare and Medicaid Services (CMS) Hospital Readmissions Reduction Program for hospitals that fail to meet certain performance targets.27 Thus, because of its alignment with federal mandates, improved QOL (and potentially concomitant decreases in acute service use) may have significant financial implications for health systems as well.
This study was limited by several factors. First, it was focused on a population receiving publicly funded behavioral health services with strict eligibility requirements, one of which stipulated that individuals must be at 200% or less of the Federal Poverty Level; therefore, the results might not be applicable to health systems with a more clinically or socioeconomically diverse patient population. Second, because these data are cross-sectional, it was not possible to determine whether QOL improved over time or whether changes in QOL covaried longitudinally with the other metrics under observation. For example, if patients’ QOL improved from the first to last assessment, did their employment or residential status improve as well, or were these patients more likely to be employed at their first assessment? Furthermore, if there was covariance, did changes in employment, housing status, and so on precede changes in QOL or vice versa? Multiple longitudinal observations would help to address these questions and will be the focus of future analyses.
Conclusion
This preliminary study suggests that a single-item QOL measure may be a valuable population health–level metric for health systems. It requires little administrative effort on the part of either the clinician or patient. It is also agnostic with regard to clinical issue or treatment approach and can therefore admit of a range of diagnoses or patient-specific, idiosyncratic recovery goals. It is correlated with other key health, social determinants of health, and acute service utilization indicators and can therefore serve as a “whole system” measure because of its ability to broadly represent improvements in an entire population. Furthermore, QOL is patient-centered in that data are obtained through patient self-report, which is a high priority for CMS and other health care organizations.28 In summary, a single-item QOL measure holds promise for health care organizations looking to implement the Quadruple Aim and assess the health of the populations they serve in a manner that is simple, efficient, and patient-centered.
Acknowledgments: The author thanks Jennifer Wittwer for her thoughtful comments on the initial draft of this manuscript and Gary Kraft for his help extracting the data used in the analyses.
Corresponding author: Walter Matthew Drymalski, PhD; walter.drymalski@milwaukeecountywi.gov
Disclosures: None reported.
1. Berwick DM, Nolan TW, Whittington J. The triple aim: care, health, and cost. Health Aff (Millwood). 2008;27(3):759-769. doi:10.1377/hlthaff.27.3.759
2. Bodenheimer T, Sinsky C. From triple to quadruple aim: care of the patient requires care of the provider. Ann Fam Med. 2014;12(6):573-576. doi:10.1370/afm.1713
3. Hendrikx RJP, Drewes HW, Spreeuwenberg M, et al. Which triple aim related measures are being used to evaluate population management initiatives? An international comparative analysis. Health Policy. 2016;120(5):471-485. doi:10.1016/j.healthpol.2016.03.008
4. Whittington JW, Nolan K, Lewis N, Torres T. Pursuing the triple aim: the first 7 years. Milbank Q. 2015;93(2):263-300. doi:10.1111/1468-0009.12122
5. Ryan BL, Brown JB, Glazier RH, Hutchison B. Examining primary healthcare performance through a triple aim lens. Healthc Policy. 2016;11(3):19-31.
6. Stiefel M, Nolan K. A guide to measuring the Triple Aim: population health, experience of care, and per capita cost. Institute for Healthcare Improvement; 2012. Accessed November 1, 2022. https://nhchc.org/wp-content/uploads/2019/08/ihiguidetomeasuringtripleaimwhitepaper2012.pdf
7. Martin L, Nelson E, Rakover J, Chase A. Whole system measures 2.0: a compass for health system leaders. Institute for Healthcare Improvement; 2016. Accessed November 1, 2022. http://www.ihi.org:80/resources/Pages/IHIWhitePapers/Whole-System-Measures-Compass-for-Health-System-Leaders.aspx
8. Casalino LP, Gans D, Weber R, et al. US physician practices spend more than $15.4 billion annually to report quality measures. Health Aff (Millwood). 2016;35(3):401-406. doi:10.1377/hlthaff.2015.1258
9. Rao SK, Kimball AB, Lehrhoff SR, et al. The impact of administrative burden on academic physicians: results of a hospital-wide physician survey. Acad Med. 2017;92(2):237-243. doi:10.1097/ACM.0000000000001461
10. Woolhandler S, Himmelstein DU. Administrative work consumes one-sixth of U.S. physicians’ working hours and lowers their career satisfaction. Int J Health Serv. 2014;44(4):635-642. doi:10.2190/HS.44.4.a
11. Meyer GS, Nelson EC, Pryor DB, et al. More quality measures versus measuring what matters: a call for balance and parsimony. BMJ Qual Saf. 2012;21(11):964-968. doi:10.1136/bmjqs-2012-001081
12. Vital Signs: Core Metrics for Health and Health Care Progress. Washington, DC: National Academies Press; 2015. doi:10.17226/19402
13. Centers for Disease Control and Prevention. BRFSS questionnaires. Accessed November 1, 2022. https://www.cdc.gov/brfss/questionnaires/index.htm
14. County Health Rankings and Roadmaps. Measures & data sources. University of Wisconsin Population Health Institute. Accessed November 1, 2022. https://www.countyhealthrankings.org/explore-health-rankings/measures-data-sources
15. Centers for Disease Control and Prevention. Healthy days core module (CDC HRQOL-4). Accessed November 1, 2022. https://www.cdc.gov/hrqol/hrqol14_measure.htm
16. Cordier T, Song Y, Cambon J, et al. A bold goal: more healthy days through improved community health. Popul Health Manag. 2018;21(3):202-208. doi:10.1089/pop.2017.0142
17. Slabaugh SL, Shah M, Zack M, et al. Leveraging health-related quality of life in population health management: the case for healthy days. Popul Health Manag. 2017;20(1):13-22. doi:10.1089/pop.2015.0162
18. Karimi M, Brazier J. Health, health-related quality of life, and quality of life: what is the difference? Pharmacoeconomics. 2016;34(7):645-649. doi:10.1007/s40273-016-0389-9
19. Smith KW, Avis NE, Assmann SF. Distinguishing between quality of life and health status in quality of life research: a meta-analysis. Qual Life Res. 1999;8(5):447-459. doi:10.1023/a:1008928518577
20. Atroszko PA, Baginska P, Mokosinska M, et al. Validity and reliability of single-item self-report measures of general quality of life, general health and sleep quality. In: CER Comparative European Research 2015. Sciemcee Publishing; 2015:207-211.
21. Singh JA, Satele D, Pattabasavaiah S, et al. Normative data and clinically significant effect sizes for single-item numerical linear analogue self-assessment (LASA) scales. Health Qual Life Outcomes. 2014;12:187. doi:10.1186/s12955-014-0187-z
22. Siebens HC, Tsukerman D, Adkins RH, et al. Correlates of a single-item quality-of-life measure in people aging with disabilities. Am J Phys Med Rehabil. 2015;94(12):1065-1074. doi:10.1097/PHM.0000000000000298
23. Yohannes AM, Dodd M, Morris J, Webb K. Reliability and validity of a single item measure of quality of life scale for adult patients with cystic fibrosis. Health Qual Life Outcomes. 2011;9:105. doi:10.1186/1477-7525-9-105
24. Conway L, Widjaja E, Smith ML. Single-item measure for assessing quality of life in children with drug-resistant epilepsy. Epilepsia Open. 2017;3(1):46-54. doi:10.1002/epi4.12088
25. Barry MM, Zissi A. Quality of life as an outcome measure in evaluating mental health services: a review of the empirical evidence. Soc Psychiatry Psychiatr Epidemiol. 1997;32(1):38-47. doi:10.1007/BF00800666
26. Skevington SM, Lotfy M, O’Connell KA. The World Health Organization’s WHOQOL-BREF quality of life assessment: psychometric properties and results of the international field trial. Qual Life Res. 2004;13(2):299-310. doi:10.1023/B:QURE.0000018486.91360.00
27. Centers for Medicare & Medicaid Services. Hospital readmissions reduction program (HRRP). Accessed November 1, 2022. https://www.cms.gov/Medicare/Medicare-Fee-for-Service-Payment/AcuteInpatientPPS/Readmissions-Reduction-Program
28. Centers for Medicare & Medicaid Services. Patient-reported outcome measures. CMS Measures Management System. Published May 2022. Accessed November 1, 2022. https://www.cms.gov/files/document/blueprint-patient-reported-outcome-measures.pdf
Improving Inpatient COVID-19 Vaccination Rates Among Adult Patients at a Tertiary Academic Medical Center
From the Department of Medicine, The George Washington University School of Medicine and Health Sciences, Washington, DC.
Abstract
Objective: Inpatient vaccination initiatives are well described in the literature. During the COVID-19 pandemic, hospitals began administering COVID-19 vaccines to hospitalized patients. Although vaccination rates increased, there remained many unvaccinated patients despite community efforts. This quality improvement project aimed to increase the COVID-19 vaccination rates of hospitalized patients on the medicine service at the George Washington University Hospital (GWUH).
Methods: From November 2021 through February 2022, we conducted a Plan-Do-Study-Act (PDSA) cycle with 3 phases. Initial steps included gathering baseline data from the electronic health record and consulting stakeholders. The first 2 phases focused on educating housestaff on the availability, ordering process, and administration of the Pfizer vaccine. The third phase consisted of developing educational pamphlets for patients to be included in their admission packets.
Results: The baseline mean COVID-19 vaccination rate (August to October 2021) of eligible patients on the medicine service was 10.7%. In the months after we implemented the PDSA cycle (November 2021 to February 2022), the mean vaccination rate increased to 15.4%.
Conclusion: This quality improvement project implemented measures to increase administration of the Pfizer vaccine to eligible patients admitted to the medicine service at GWUH. The mean vaccination rate increased from 10.7% in the 3 months prior to implementation to 15.4% during the 4 months post implementation. Other measures to consider in the future include increasing the availability of other COVID-19 vaccines at our hospital and incorporating the vaccine into the admission order set to help facilitate vaccination early in the hospital course.
Keywords: housestaff, quality improvement, PDSA, COVID-19, BNT162b2 vaccine, patient education
Throughout the COVID-19 pandemic, case rates in the United States have fluctuated considerably, corresponding to epidemic waves. In 2021, US daily cases of COVID-19 peaked at nearly 300,000 in early January and reached a nadir of 8000 cases in mid-June.1 In September 2021, new cases had increased to 200,000 per day due to the prevalence of the Delta variant.1 Particularly with the emergence of new variants of SARS-CoV-2, vaccination efforts to limit the spread of infection and severity of illness are critical. Data have shown that 2 doses of the BNT162b2 vaccine (Pfizer-BioNTech) were largely protective against severe infection for approximately 6 months.2,3 When we began this quality improvement (QI) project in September 2021, only 179 million Americans had been fully vaccinated, according to data from the Centers for Disease Control and Prevention, which is just over half of the US population.4 An electronic survey conducted in the United States with more than 5 million responses found that, of those who were hesitant about receiving the vaccine, 49% reported a fear of adverse effects and 48% reported a lack of trust in the vaccine.5
This QI project sought to target unvaccinated individuals admitted to the internal medicine inpatient service. Vaccinating hospitalized patients is especially important since they are sicker than the general population and at higher risk of having poor outcomes from COVID-19. Inpatient vaccine initiatives, such as administering influenza vaccine prior to discharge, have been successfully implemented in the past.6 One large COVID-19 vaccination program featured an admission order set to increase the rates of vaccination among hospitalized patients.7 Our QI project piloted a multidisciplinary approach involving the nursing staff, pharmacy, information technology (IT) department, and internal medicine housestaff to increase COVID-19 vaccination rates among hospitalized patients on the medical service. This project aimed to increase inpatient vaccination rates through interventions targeting both primary providers as well as the patients themselves.
Methods
Setting and Interventions
This project was conducted at the George Washington University Hospital (GWUH) in Washington, DC. The clinicians involved in the study were the internal medicine housestaff, and the patients included were adults admitted to the resident medicine ward teams. The project was exempt by the institutional review board and did not require informed consent.
The quality improvement initiative had 3 phases, each featuring a different intervention (Table 1). The first phase involved sending a weekly announcement (via email and a secure health care messaging app) to current residents rotating on the inpatient medicine service. The announcement contained information regarding COVID-19 vaccine availability at the hospital, instructions on ordering the vaccine, and the process of coordinating with pharmacy to facilitate vaccine administration. Thereafter, residents were educated on the process of giving a COVID-19 vaccine to a patient from start to finish. Due to the nature of the residency schedule, different housestaff members rotated in and out of the medicine wards during the intervention periods. The weekly email was sent to the entire internal medicine housestaff, informing all residents about the QI project, while the weekly secure messages served as reminders and were only sent to residents currently on the medicine wards.

In the second phase, we posted paper flyers throughout the hospital to remind housestaff to give the vaccine and again educate them on the process of ordering the vaccine. For the third intervention, a COVID-19 vaccine educational pamphlet was developed for distribution to inpatients at GWUH. The pamphlet included information on vaccine efficacy, safety, side effects, and eligibility. The pamphlet was incorporated in the admission packet that every patient receives upon admission to the hospital. The patients reviewed the pamphlets with nursing staff, who would answer any questions, with residents available to discuss any outstanding concerns.
Measures and Data Gathering
The primary endpoint of the study was inpatient vaccination rate, defined as the number of COVID-19 vaccines administered divided by the number of patients eligible to receive a vaccine (not fully vaccinated). During initial triage, nursing staff documented vaccination status in the electronic health record (EHR), checking a box in a data entry form if a patient had received 0, 1, or 2 doses of the COVID-19 vaccine. The GWUH IT department generated data from this form to determine the number of patients eligible to receive a COVID-19 vaccine. Data were extracted from the medication administration record in the EHR to determine the number of vaccines that were administered to patients during their hospitalization on the inpatient medical service. Each month, the IT department extracted data for the number of eligible patients and the number of vaccines administered. This yielded the monthly vaccination rates. The monthly vaccination rates in the period prior to starting the QI initiative were compared to the rates in the period after the interventions were implemented.
Of note, during the course of this project, patients became eligible for a third COVID-19 vaccine (booster). We decided to continue with the original aim of vaccinating adults who had only received 0 or 1 dose of the vaccine. Therefore, the eligibility criteria remained the same throughout the study. We obtained retrospective data to ensure that the vaccines being counted toward the vaccination rate were vaccines given to patients not yet fully vaccinated and not vaccines given as boosters.

Results
From August to October 2021, the baseline average monthly vaccination rate of patients on the medicine service who were eligible to receive a COVID-19 vaccine was 10.7%. After the first intervention, the vaccination rate increased to 19.7% in November 2021 (Table 2). The second intervention yielded vaccination rates of 11.4% and 11.8% in December 2021 and January 2022, respectively. During the final phase in February 2022, the vaccination rate was 19.0%. At the conclusion of the study, the mean vaccination rate for the intervention months was 15.4% (Figure 1). Process stability and variation are demonstrated with a statistical process control chart (Figure 2).

 chart.")
Discussion
For this housestaff-driven QI project, we implemented an inpatient COVID-19 vaccination campaign consisting of 3 phases that targeted both providers and patients. During the intervention period, we observed an increased vaccination rate compared to the period just prior to implementation of the QI project. While our interventions may certainly have boosted vaccination rates, we understand other variables could have contributed to increased rates as well. The emergence of variants in the United States, such as omicron in December 2021,8 could have precipitated a demand for vaccinations among patients. Holidays in November and December may also have increased patients’ desire to get vaccinated before travel.
We encountered a number of roadblocks that challenged our project, including difficulty identifying patients who were eligible for the vaccine, logistical vaccine administration challenges, and hesitancy among the inpatient population. Accurately identifying patients who were eligible for a vaccine in the EHR was especially challenging in the setting of rapidly changing guidelines regarding COVID-19 vaccination. In September 2021, the US Food and Drug Administration authorized the Pfizer booster for certain populations and later, in November 2021, for all adults. This meant that some fully vaccinated hospitalized patients (those with 2 doses) then qualified for an additional dose of the vaccine and received a dose during hospitalization. To determine the true vaccination rate, we obtained retrospective data that allowed us to track each vaccine administered. If a patient had already received 2 doses of the COVID-19 vaccine, the vaccine administered was counted as a booster and excluded from the calculation of the vaccination rate. Future PDSA cycles could include updating the EHR to capture the whole range of COVID-19 vaccination status (unvaccinated, partially vaccinated, fully vaccinated, fully vaccinated with 1 booster, fully vaccinated with 2 boosters).
We also encountered logistical challenges with the administration of the COVID-19 vaccine to hospitalized patients. During the intervention period, our pharmacy department required 5 COVID-19 vaccination orders before opening a vial and administering the vaccine doses in order to reduce waste. This policy may have limited our ability to vaccinate eligible inpatients because we were not always able to identify 5 patients simultaneously on the service who were eligible and consented to the vaccine.
The majority of patients who were interested in receiving COVID-19 vaccination had already been vaccinated in the outpatient setting. This fact made the inpatient internal medicine subset of patients a particularly challenging population to target, given their possible hesitancy regarding vaccination. By utilizing a multidisciplinary team and increasing communication of providers and nursing staff, we helped to increase the COVID-19 vaccination rates at our hospital from 10.7% to 15.4%.
Future Directions
Future interventions to consider include increasing the availability of other approved COVID-19 vaccines at our hospital besides the Pfizer-BioNTech vaccine. Furthermore, incorporating the vaccine into the admission order set would help initiate the vaccination process early in the hospital course. We encourage other institutions to utilize similar approaches to not only remind providers about inpatient vaccination, but also educate and encourage patients to receive the vaccine. These measures will help institutions increase inpatient COVID-19 vaccination rates in a high-risk population.
Corresponding author: Anna Rubin, MD, Department of Medicine, The George Washington University School of Medicine and Health Sciences, Washington, DC; arubin@mfa.gwu.edu
Disclosures: None reported.
1. Trends in number of COVID-19 cases and deaths in the US reported to CDC, by state/territory. Centers for Disease Control and Prevention. Accessed February 25, 2022. https://covid.cdc.gov/covid-data-tracker/#trends_dailycases
2. Polack FP, Thomas SJ, Kitchin N, et al. Safety and efficacy of the BNT162B2 MRNA COVID-19 vaccine. N Engl J Med. 2020;383(27):2603-2615. doi:10.1056/nejmoa2034577
3. Hall V, Foulkes S, Insalata F, et al. Protection against SARS-COV-2 after covid-19 vaccination and previous infection. N Engl J Med. 2022;386(13):1207-1220. doi:10.1056/nejmoa2118691
4. Trends in number of COVID-19 vaccinations in the US. Centers for Disease Control and Prevention. Accessed February 25, 2022. https://covid.cdc.gov/covid-data-tracker/#vaccination-trends_vacctrends-fully-cum
5. King WC, Rubinstein M, Reinhart A, Mejia R. Time trends, factors associated with, and reasons for covid-19 vaccine hesitancy: A massive online survey of US adults from January-May 2021. PLOS ONE. 2021;16(12). doi:10.1371/journal.pone.0260731
6. Cohen ES, Ogrinc G, Taylor T, et al. Influenza vaccination rates for hospitalised patients: A multiyear quality improvement effort. BMJ Qual Saf. 2015;24(3):221-227. doi:10.1136/bmjqs-2014-003556
7. Berger RE, Diaz DC, Chacko S, et al. Implementation of an inpatient covid-19 vaccination program. NEJM Catalyst. 2021;2(10). doi:10.1056/cat.21.0235
8. CDC COVID-19 Response Team. SARS-CoV-2 B.1.1.529 (Omicron) Variant - United States, December 1-8, 2021. MMWR Morb Mortal Wkly Rep. 2021;70(50):1731-1734. doi:10.15585/mmwr.mm7050e1
From the Department of Medicine, The George Washington University School of Medicine and Health Sciences, Washington, DC.
Abstract
Objective: Inpatient vaccination initiatives are well described in the literature. During the COVID-19 pandemic, hospitals began administering COVID-19 vaccines to hospitalized patients. Although vaccination rates increased, there remained many unvaccinated patients despite community efforts. This quality improvement project aimed to increase the COVID-19 vaccination rates of hospitalized patients on the medicine service at the George Washington University Hospital (GWUH).
Methods: From November 2021 through February 2022, we conducted a Plan-Do-Study-Act (PDSA) cycle with 3 phases. Initial steps included gathering baseline data from the electronic health record and consulting stakeholders. The first 2 phases focused on educating housestaff on the availability, ordering process, and administration of the Pfizer vaccine. The third phase consisted of developing educational pamphlets for patients to be included in their admission packets.
Results: The baseline mean COVID-19 vaccination rate (August to October 2021) of eligible patients on the medicine service was 10.7%. In the months after we implemented the PDSA cycle (November 2021 to February 2022), the mean vaccination rate increased to 15.4%.
Conclusion: This quality improvement project implemented measures to increase administration of the Pfizer vaccine to eligible patients admitted to the medicine service at GWUH. The mean vaccination rate increased from 10.7% in the 3 months prior to implementation to 15.4% during the 4 months post implementation. Other measures to consider in the future include increasing the availability of other COVID-19 vaccines at our hospital and incorporating the vaccine into the admission order set to help facilitate vaccination early in the hospital course.
Keywords: housestaff, quality improvement, PDSA, COVID-19, BNT162b2 vaccine, patient education
Throughout the COVID-19 pandemic, case rates in the United States have fluctuated considerably, corresponding to epidemic waves. In 2021, US daily cases of COVID-19 peaked at nearly 300,000 in early January and reached a nadir of 8000 cases in mid-June.1 In September 2021, new cases had increased to 200,000 per day due to the prevalence of the Delta variant.1 Particularly with the emergence of new variants of SARS-CoV-2, vaccination efforts to limit the spread of infection and severity of illness are critical. Data have shown that 2 doses of the BNT162b2 vaccine (Pfizer-BioNTech) were largely protective against severe infection for approximately 6 months.2,3 When we began this quality improvement (QI) project in September 2021, only 179 million Americans had been fully vaccinated, according to data from the Centers for Disease Control and Prevention, which is just over half of the US population.4 An electronic survey conducted in the United States with more than 5 million responses found that, of those who were hesitant about receiving the vaccine, 49% reported a fear of adverse effects and 48% reported a lack of trust in the vaccine.5
This QI project sought to target unvaccinated individuals admitted to the internal medicine inpatient service. Vaccinating hospitalized patients is especially important since they are sicker than the general population and at higher risk of having poor outcomes from COVID-19. Inpatient vaccine initiatives, such as administering influenza vaccine prior to discharge, have been successfully implemented in the past.6 One large COVID-19 vaccination program featured an admission order set to increase the rates of vaccination among hospitalized patients.7 Our QI project piloted a multidisciplinary approach involving the nursing staff, pharmacy, information technology (IT) department, and internal medicine housestaff to increase COVID-19 vaccination rates among hospitalized patients on the medical service. This project aimed to increase inpatient vaccination rates through interventions targeting both primary providers as well as the patients themselves.
Methods
Setting and Interventions
This project was conducted at the George Washington University Hospital (GWUH) in Washington, DC. The clinicians involved in the study were the internal medicine housestaff, and the patients included were adults admitted to the resident medicine ward teams. The project was exempt by the institutional review board and did not require informed consent.
The quality improvement initiative had 3 phases, each featuring a different intervention (Table 1). The first phase involved sending a weekly announcement (via email and a secure health care messaging app) to current residents rotating on the inpatient medicine service. The announcement contained information regarding COVID-19 vaccine availability at the hospital, instructions on ordering the vaccine, and the process of coordinating with pharmacy to facilitate vaccine administration. Thereafter, residents were educated on the process of giving a COVID-19 vaccine to a patient from start to finish. Due to the nature of the residency schedule, different housestaff members rotated in and out of the medicine wards during the intervention periods. The weekly email was sent to the entire internal medicine housestaff, informing all residents about the QI project, while the weekly secure messages served as reminders and were only sent to residents currently on the medicine wards.
In the second phase, we posted paper flyers throughout the hospital to remind housestaff to give the vaccine and again educate them on the process of ordering the vaccine. For the third intervention, a COVID-19 vaccine educational pamphlet was developed for distribution to inpatients at GWUH. The pamphlet included information on vaccine efficacy, safety, side effects, and eligibility. The pamphlet was incorporated in the admission packet that every patient receives upon admission to the hospital. The patients reviewed the pamphlets with nursing staff, who would answer any questions, with residents available to discuss any outstanding concerns.
Measures and Data Gathering
The primary endpoint of the study was inpatient vaccination rate, defined as the number of COVID-19 vaccines administered divided by the number of patients eligible to receive a vaccine (not fully vaccinated). During initial triage, nursing staff documented vaccination status in the electronic health record (EHR), checking a box in a data entry form if a patient had received 0, 1, or 2 doses of the COVID-19 vaccine. The GWUH IT department generated data from this form to determine the number of patients eligible to receive a COVID-19 vaccine. Data were extracted from the medication administration record in the EHR to determine the number of vaccines that were administered to patients during their hospitalization on the inpatient medical service. Each month, the IT department extracted data for the number of eligible patients and the number of vaccines administered. This yielded the monthly vaccination rates. The monthly vaccination rates in the period prior to starting the QI initiative were compared to the rates in the period after the interventions were implemented.
Of note, during the course of this project, patients became eligible for a third COVID-19 vaccine (booster). We decided to continue with the original aim of vaccinating adults who had only received 0 or 1 dose of the vaccine. Therefore, the eligibility criteria remained the same throughout the study. We obtained retrospective data to ensure that the vaccines being counted toward the vaccination rate were vaccines given to patients not yet fully vaccinated and not vaccines given as boosters.
Results
From August to October 2021, the baseline average monthly vaccination rate of patients on the medicine service who were eligible to receive a COVID-19 vaccine was 10.7%. After the first intervention, the vaccination rate increased to 19.7% in November 2021 (Table 2). The second intervention yielded vaccination rates of 11.4% and 11.8% in December 2021 and January 2022, respectively. During the final phase in February 2022, the vaccination rate was 19.0%. At the conclusion of the study, the mean vaccination rate for the intervention months was 15.4% (Figure 1). Process stability and variation are demonstrated with a statistical process control chart (Figure 2).
Discussion
For this housestaff-driven QI project, we implemented an inpatient COVID-19 vaccination campaign consisting of 3 phases that targeted both providers and patients. During the intervention period, we observed an increased vaccination rate compared to the period just prior to implementation of the QI project. While our interventions may certainly have boosted vaccination rates, we understand other variables could have contributed to increased rates as well. The emergence of variants in the United States, such as omicron in December 2021,8 could have precipitated a demand for vaccinations among patients. Holidays in November and December may also have increased patients’ desire to get vaccinated before travel.
We encountered a number of roadblocks that challenged our project, including difficulty identifying patients who were eligible for the vaccine, logistical vaccine administration challenges, and hesitancy among the inpatient population. Accurately identifying patients who were eligible for a vaccine in the EHR was especially challenging in the setting of rapidly changing guidelines regarding COVID-19 vaccination. In September 2021, the US Food and Drug Administration authorized the Pfizer booster for certain populations and later, in November 2021, for all adults. This meant that some fully vaccinated hospitalized patients (those with 2 doses) then qualified for an additional dose of the vaccine and received a dose during hospitalization. To determine the true vaccination rate, we obtained retrospective data that allowed us to track each vaccine administered. If a patient had already received 2 doses of the COVID-19 vaccine, the vaccine administered was counted as a booster and excluded from the calculation of the vaccination rate. Future PDSA cycles could include updating the EHR to capture the whole range of COVID-19 vaccination status (unvaccinated, partially vaccinated, fully vaccinated, fully vaccinated with 1 booster, fully vaccinated with 2 boosters).
We also encountered logistical challenges with the administration of the COVID-19 vaccine to hospitalized patients. During the intervention period, our pharmacy department required 5 COVID-19 vaccination orders before opening a vial and administering the vaccine doses in order to reduce waste. This policy may have limited our ability to vaccinate eligible inpatients because we were not always able to identify 5 patients simultaneously on the service who were eligible and consented to the vaccine.
The majority of patients who were interested in receiving COVID-19 vaccination had already been vaccinated in the outpatient setting. This fact made the inpatient internal medicine subset of patients a particularly challenging population to target, given their possible hesitancy regarding vaccination. By utilizing a multidisciplinary team and increasing communication of providers and nursing staff, we helped to increase the COVID-19 vaccination rates at our hospital from 10.7% to 15.4%.
Future Directions
Future interventions to consider include increasing the availability of other approved COVID-19 vaccines at our hospital besides the Pfizer-BioNTech vaccine. Furthermore, incorporating the vaccine into the admission order set would help initiate the vaccination process early in the hospital course. We encourage other institutions to utilize similar approaches to not only remind providers about inpatient vaccination, but also educate and encourage patients to receive the vaccine. These measures will help institutions increase inpatient COVID-19 vaccination rates in a high-risk population.
Corresponding author: Anna Rubin, MD, Department of Medicine, The George Washington University School of Medicine and Health Sciences, Washington, DC; arubin@mfa.gwu.edu
Disclosures: None reported.
1. Trends in number of COVID-19 cases and deaths in the US reported to CDC, by state/territory. Centers for Disease Control and Prevention. Accessed February 25, 2022. https://covid.cdc.gov/covid-data-tracker/#trends_dailycases
2. Polack FP, Thomas SJ, Kitchin N, et al. Safety and efficacy of the BNT162B2 MRNA COVID-19 vaccine. N Engl J Med. 2020;383(27):2603-2615. doi:10.1056/nejmoa2034577
3. Hall V, Foulkes S, Insalata F, et al. Protection against SARS-COV-2 after covid-19 vaccination and previous infection. N Engl J Med. 2022;386(13):1207-1220. doi:10.1056/nejmoa2118691
4. Trends in number of COVID-19 vaccinations in the US. Centers for Disease Control and Prevention. Accessed February 25, 2022. https://covid.cdc.gov/covid-data-tracker/#vaccination-trends_vacctrends-fully-cum
5. King WC, Rubinstein M, Reinhart A, Mejia R. Time trends, factors associated with, and reasons for covid-19 vaccine hesitancy: A massive online survey of US adults from January-May 2021. PLOS ONE. 2021;16(12). doi:10.1371/journal.pone.0260731
6. Cohen ES, Ogrinc G, Taylor T, et al. Influenza vaccination rates for hospitalised patients: A multiyear quality improvement effort. BMJ Qual Saf. 2015;24(3):221-227. doi:10.1136/bmjqs-2014-003556
7. Berger RE, Diaz DC, Chacko S, et al. Implementation of an inpatient covid-19 vaccination program. NEJM Catalyst. 2021;2(10). doi:10.1056/cat.21.0235
8. CDC COVID-19 Response Team. SARS-CoV-2 B.1.1.529 (Omicron) Variant - United States, December 1-8, 2021. MMWR Morb Mortal Wkly Rep. 2021;70(50):1731-1734. doi:10.15585/mmwr.mm7050e1
Diabetes Population Health Innovations in the Age of COVID-19: Insights From the T1D Exchange Quality Improvement Collaborative
From the T1D Exchange, Boston, MA (Ann Mungmode, Nicole Rioles, Jesse Cases, Dr. Ebekozien); The Leona M. and Harry B. Hemsley Charitable Trust, New York, NY (Laurel Koester); and the University of Mississippi School of Population Health, Jackson, MS (Dr. Ebekozien).
Abstract
There have been remarkable innovations in diabetes management since the start of the COVID-19 pandemic, but these groundbreaking innovations are drawing limited focus as the field focuses on the adverse impact of the pandemic on patients with diabetes. This article reviews select population health innovations in diabetes management that have become available over the past 2 years of the COVID-19 pandemic from the perspective of the T1D Exchange Quality Improvement Collaborative, a learning health network that focuses on improving care and outcomes for individuals with type 1 diabetes (T1D). Such innovations include expanded telemedicine access, collection of real-world data, machine learning and artificial intelligence, and new diabetes medications and devices. In addition, multiple innovative studies have been undertaken to explore contributors to health inequities in diabetes, and advocacy efforts for specific populations have been successful. Looking to the future, work is required to explore additional health equity successes that do not further exacerbate inequities and to look for additional innovative ways to engage people with T1D in their health care through conversations on social determinants of health and societal structures.
Keywords: type 1 diabetes, learning health network, continuous glucose monitoring, health equity
One in 10 people in the United States has diabetes.1 Diabetes is the nation’s second leading cause of death, costing the US health system more than $300 billion annually.2 The COVID-19 pandemic presented additional health burdens for people living with diabetes. For example, preexisting diabetes was identified as a risk factor for COVID-19–associated morbidity and mortality.3,4 Over the past 2 years, there have been remarkable innovations in diabetes management, including stem cell therapy and new medication options. Additionally, improved technology solutions have aided in diabetes management through continuous glucose monitors (CGM), smart insulin pens, advanced hybrid closed-loop systems, and continuous subcutaneous insulin injections.5,6 Unfortunately, these groundbreaking innovations are drawing limited focus, as the field is rightfully focused on the adverse impact of the pandemic on patients with diabetes.

Learning health networks like the T1D Exchange Quality Improvement Collaborative (T1DX-QI) have implemented some of these innovative solutions to improve care for people with diabetes.7 T1DX-QI has more than 50 data-sharing endocrinology centers that care for over 75,000 people with diabetes across the United States (Figure 1). Centers participating in the T1DX-QI use quality improvement (QI) and implementation science methods to quickly translate research into evidence-based clinical practice. T1DX-QI leads diabetes population health and health system research and supports widespread transferability across health care organizations through regular collaborative calls, conferences, and case study documentation.8

In this review, we summarize impactful population health innovations in diabetes management that have become available over the past 2 years of the COVID-19 pandemic from the perspective of T1DX-QI (see Figure 2 for relevant definitions). This review is limited in scope and is not meant to be an exhaustive list of innovations. The review also reflects significant changes from the perspective of academic diabetes centers, which may not apply to rural or primary care diabetes practices.
Methods
The first (A.M.), second (H.H.), and senior (O.E.) authors conducted a scoping review of published literature using terms related to diabetes, population health, and innovation on PubMed Central and Google Scholar for the period March 2020 to June 2022. To complement the review, A.M. and O.E. also reviewed abstracts from presentations at major international diabetes conferences, including the American Diabetes Association (ADA), the International Society for Pediatric and Adolescent Diabetes (ISPAD), the T1DX-QI Learning Session Conference, and the Advanced Technologies & Treatments for Diabetes (ATTD) 2020 to 2022 conferences.9-14 The authors also searched FDA.gov and ClinicalTrials.gov for relevant insights. A.M. and O.E. sorted the reviewed literature into major themes (Figure 3) from the population health improvement perspective of the T1DX-QI.

Population Health Innovations in Diabetes Management
Expansion of Telemedicine Access
Telemedicine is cost-effective for patients with diabetes,15 including those with complex cases.16 Before the COVID-19 pandemic, telemedicine and virtual care were rare in diabetes management. However, the pandemic offered a new opportunity to expand the practice of telemedicine in diabetes management. A study from the T1DX-QI showed that telemedicine visits grew from comprising <1% of visits pre-pandemic (December 2019) to 95.2% during the pandemic (August 2020).17 Additional studies, like those conducted by Phillip et al,18 confirmed the noninferiority of telemedicine practice for patients with diabetes.Telemedicine was also found to be an effective strategy to educate patients on the use of diabetes technologies.19
Real-World Data and Disease Surveillance
As the COVID-19 pandemic exacerbated outcomes for people with type 1 diabetes (T1D), a need arose to understand the immediate effects of the pandemic on people with T1D through real-world data and disease surveillance. In April 2020, the T1DX-QI initiated a multicenter surveillance study to collect data and analyze the impact of COVID-19 on people with T1D. The existing health collaborative served as a springboard for robust surveillance study, documenting numerous works on the effects of COVID-19.3,4,20-28 Other investigators also embraced the power of real-world surveillance and real-world data.29,30
Big Data, Machine Learning, and Artificial Intelligence
The past 2 years have seen a shift toward embracing the incredible opportunity to tap the large volume of data generated from routine care for practical insights.31 In particular, researchers have demonstrated the widespread application of machine learning and artificial intelligence to improve diabetes management.32 The T1DX-QI also harnessed the growing power of big data by expanding the functionality of innovative benchmarking software. The T1DX QI Portal uses electronic medical record data of diabetes patients for clinic-to-clinic benchmarking and data analysis, using business intelligence solutions.33
Health Equity
While inequities across various health outcomes have been well documented for years,34 the COVID-19 pandemic further exaggerated racial/ethnic health inequities in T1D.23,35 In response, several organizations have outlined specific strategies to address these health inequities. Emboldened by the pandemic, the T1DX-QI announced a multipronged approach to address health inequities among patients with T1D through the Health Equity Advancement Lab (HEAL).36 One of HEAL’s main components is using real-world data to champion population-level insights and demonstrate progress in QI efforts.
Multiple innovative studies have been undertaken to explore contributors to health inequities in diabetes, and these studies are expanding our understanding of the chasm.37 There have also been innovative solutions to addressing these inequities, with multiple studies published over the past 2 years.38 A source of inequity among patients with T1D is the lack of representation of racial/ethnic minorities with T1D in clinical trials.39 The T1DX-QI suggests that the equity-adapted framework for QI can be applied by research leaders to support trial diversity and representation, ensuring future device innovations are meaningful for all people with T1D.40
Diabetes Devices
Glucose monitoring and insulin therapy are vital tools to support individuals living with T1D, and devices such as CGM and insulin pumps have become the standard of care for diabetes management (Table).41 Innovations in diabetes technology and device access are imperative for a chronic disease with no cure.

The COVID-19 pandemic created an opportunity to increase access to diabetes devices in inpatient settings. In 2020, the US Food and Drug Administration expanded the use of CGM to support remote monitoring of patients in inpatient hospital settings, simultaneously supporting the glucose monitoring needs of patients with T1D and reducing COVID-19 transmission through reduced patient-clinician contact.42 This effort has been expanded and will continue in 2022 and beyond,43 and aligns with the growing consensus that supports patients wearing both CGMs and insulin pumps in ambulatory settings to improve patient health outcomes.44
Since 2020, innovations in diabetes technology have improved and increased the variety of options available to people with T1D and made them easier to use (Table). New, advanced hybrid closed-loop systems have progressed to offer Bluetooth features, including automatic software upgrades, tubeless systems, and the ability to allow parents to use their smartphones to bolus for children.45-47 The next big step in insulin delivery innovation is the release of functioning, fully closed loop systems, of which several are currently in clinical trials.48 These systems support reduced hypoglycemia and improved time in range.49
Additional innovations in insulin delivery have improved the user experience and expanded therapeutic options, including a variety of smart insulin pens complete with dosing logs50,51 and even a patch to deliver insulin without the burden of injections.52 As barriers to diabetes technology persist,53 innovations in alternate insulin delivery provide people with T1D more options to align with their personal access and technology preferences.
Innovations in CGM address cited barriers to their use, including size or overall wear.53-55 CGMs released in the past few years are smaller in physical size, have longer durations of time between changings, are more accurate, and do not require calibrations for accuracy.
New Diabetes Medications
Many new medications and therapeutic advances have become available in the past 2 years.56 Additionally, more medications are being tested as adjunct therapies to support glycemic management in patients with T1D, including metformin, sodium-glucose cotransporter 1 and 2 inhibitors, pramlintide, glucagon-like polypeptide-1 analogs, and glucagon receptor agonists.57 Other recent advances include stem cell replacement therapy for patients with T1D.58 The ultra-long-acting biosimilar insulins are one medical innovation that has been stalled, rather than propelled, during the COVID-19 pandemic.59
Diabetes Policy Advocacy
People with T1D require insulin to survive. The cost of insulin has increased in recent years, with some studies citing a 64% to 100% increase in the past decade.60,61 In fact, 1 in 4 insulin users report that cost has impacted their insulin use, including rationing their insulin.62 Lockdowns during the COVID-19 pandemic stressed US families financially, increasing the urgency for insulin cost caps.
Although the COVID-19 pandemic halted national conversations on drug financing,63 advocacy efforts have succeeded for specific populations. The new Medicare Part D Senior Savings Model will cap the cost of insulin at $35 for a 30-day supply,64 and 20 states passed legislation capping insulin pricing.62 Efforts to codify national cost caps are under debate, including the passage of the Affordable Insulin Now Act, which passed the House in March 2022 and is currently under review in the Senate.65
Perspective: The Role of Private Philanthropy in Supporting Population Health Innovations
Funders and industry partners play a crucial role in leading and supporting innovations that improve the lives of people with T1D and reduce society’s costs of living with the disease. Data infrastructure is critical to supporting population health. While building the data infrastructure to support population health is both time- and resource-intensive, private foundations such as Helmsley are uniquely positioned—and have a responsibility—to take large, informed risks to help reach all communities with T1D.
The T1DX-QI is the largest source of population health data on T1D in the United States and is becoming the premiere data authority on its incidence, prevalence, and outcomes. The T1DX-QI enables a robust understanding of T1D-related health trends at the population level, as well as trends among clinics and providers. Pilot centers in the T1DX-QI have reported reductions in patients’ A1c and acute diabetes-related events, as well as improvements in device usage and depression screening. The ability to capture changes speaks to the promise and power of these data to demonstrate the clinical impact of QI interventions and to support the spread of best practices and learnings across health systems.
Additional philanthropic efforts have supported innovation in the last 2 years. For example, the JDRF, a nonprofit philanthropic equity firm, has supported efforts in developing artificial pancreas systems and cell therapies currently in clinical trials like teplizumab, a drug that has demonstrated delayed onset of T1D through JDRF’s T1D Fund.66 Industry partners also have an opportunity for significant influence in this area, as they continue to fund meaningful projects to advance care for people with T1D.67
Conclusion
We are optimistic that the innovations summarized here describe a shift in the tide of equitable T1D outcomes; however, future work is required to explore additional health equity successes that do not further exacerbate inequities. We also see further opportunities for innovative ways to engage people with T1D in their health care through conversations on social determinants of health and societal structures.
Corresponding author: Ann Mungmode, MPH, T1D Exchange, 11 Avenue de Lafayette, Boston, MA 02111; Email: amungmode@t1dexchange.org
Disclosures: Dr. Ebekozien serve(d) as a director, officer, partner, employee, advisor, consultant, or trustee for the Medtronic Advisory Board and received research grants from Medtronic Diabetes, Eli Lilly, and Dexcom.
Funding: The T1DX-QI is funded by The Leona M. and Harry B. Hemsley Charitable Trust.
1. Centers for Disease Control and Prevention. National diabetes statistics report. Accessed August 30, 2022. www.cdc.gov/diabetes/data/statistics-report/index.html
2. Centers for Disease Control and Prevention. Diabetes fast facts. Accessed August 30, 2022. www.cdc.gov/diabetes/basics/quick-facts.html
3. O’Malley G, Ebekozien O, Desimone M, et al. COVID-19 hospitalization in adults with type 1 diabetes: results from the T1D Exchange Multicenter Surveillance Study. J Clin Endocrinol Metab. 2020;106(2):e936-e942. doi:10.1210/clinem/dgaa825
4. Ebekozien OA, Noor N, Gallagher MP, Alonso GT. Type 1 diabetes and COVID-19: preliminary findings from a multicenter surveillance study in the U.S. Diabetes Care. 2020;43(8):e83-e85. doi:10.2337/dc20-1088
5. Zimmerman C, Albanese-O’Neill A, Haller MJ. Advances in type 1 diabetes technology over the last decade. Eur Endocrinol. 2019;15(2):70-76. doi:10.17925/ee.2019.15.2.70
6. Wake DJ, Gibb FW, Kar P, et al. Endocrinology in the time of COVID-19: remodelling diabetes services and emerging innovation. Eur J Endocrinol. 2020;183(2):G67-G77. doi:10.1530/eje-20-0377
7. Alonso GT, Corathers S, Shah A, et al. Establishment of the T1D Exchange Quality Improvement Collaborative (T1DX-QI). Clin Diabetes. 2020;38(2):141-151. doi:10.2337/cd19-0032
8. Ginnard OZB, Alonso GT, Corathers SD, et al. Quality improvement in diabetes care: a review of initiatives and outcomes in the T1D Exchange Quality Improvement Collaborative. Clin Diabetes. 2021;39(3):256-263. doi:10.2337/cd21-0029
9. ATTD 2021 invited speaker abstracts. Diabetes Technol Ther. 2021;23(S2):A1-A206. doi:10.1089/dia.2021.2525.abstracts
10. Rompicherla SN, Edelen N, Gallagher R, et al. Children and adolescent patients with pre-existing type 1 diabetes and additional comorbidities have an increased risk of hospitalization from COVID-19; data from the T1D Exchange COVID Registry. Pediatr Diabetes. 2021;22(S30):3-32. doi:10.1111/pedi.13268
11. Abstracts for the T1D Exchange QI Collaborative (T1DX-QI) Learning Session 2021. November 8-9, 2021. J Diabetes. 2021;13(S1):3-17. doi:10.1111/1753-0407.13227
12. The Official Journal of ATTD Advanced Technologies & Treatments for Diabetes conference 27-30 April 2022. Barcelona and online. Diabetes Technol Ther. 2022;24(S1):A1-A237. doi:10.1089/dia.2022.2525.abstracts
13. Ebekozien ON, Kamboj N, Odugbesan MK, et al. Inequities in glycemic outcomes for patients with type 1 diabetes: six-year (2016-2021) longitudinal follow-up by race and ethnicity of 36,390 patients in the T1DX-QI Collaborative. Diabetes. 2022;71(suppl 1). doi:10.2337/db22-167-OR
14. Narayan KA, Noor M, Rompicherla N, et al. No BMI increase during the COVID-pandemic in children and adults with T1D in three continents: joint analysis of ADDN, T1DX, and DPV registries. Diabetes. 2022;71(suppl 1). doi:10.2337/db22-269-OR
15. Lee JY, Lee SWH. Telemedicine cost-effectiveness for diabetes management: a systematic review. Diabetes Technol Ther. 2018;20(7):492-500. doi:10.1089/dia.2018.0098
16. McDonnell ME. Telemedicine in complex diabetes management. Curr Diab Rep. 2018;18(7):42. doi:10.1007/s11892-018-1015-3
17. Lee JM, Carlson E, Albanese-O’Neill A, et al. Adoption of telemedicine for type 1 diabetes care during the COVID-19 pandemic. Diabetes Technol Ther. 2021;23(9):642-651. doi:10.1089/dia.2021.0080
18. Phillip M, Bergenstal RM, Close KL, et al. The digital/virtual diabetes clinic: the future is now–recommendations from an international panel on diabetes digital technologies introduction. Diabetes Technol Ther. 2021;23(2):146-154. doi:10.1089/dia.2020.0375
19. Garg SK, Rodriguez E. COVID‐19 pandemic and diabetes care. Diabetes Technol Ther. 2022;24(S1):S2-S20. doi:10.1089/dia.2022.2501
20. Beliard K, Ebekozien O, Demeterco-Berggren C, et al. Increased DKA at presentation among newly diagnosed type 1 diabetes patients with or without COVID-19: data from a multi-site surveillance registry. J Diabetes. 2021;13(3):270-272. doi:10.1111/1753-0407.13141
21. Ebekozien O, Agarwal S, Noor N, et al. Inequities in diabetic ketoacidosis among patients with type 1 diabetes and COVID-19: data from 52 US clinical centers. J Clin Endocrinol Metab. 2020;106(4):1755-1762. doi:10.1210/clinem/dgaa920
22. Alonso GT, Ebekozien O, Gallagher MP, et al. Diabetic ketoacidosis drives COVID-19 related hospitalizations in children with type 1 diabetes. J Diabetes. 2021;13(8):681-687. doi:10.1111/1753-0407.13184
23. Noor N, Ebekozien O, Levin L, et al. Diabetes technology use for management of type 1 diabetes is associated with fewer adverse COVID-19 outcomes: findings from the T1D Exchange COVID-19 Surveillance Registry. Diabetes Care. 2021;44(8):e160-e162. doi:10.2337/dc21-0074
24. Demeterco-Berggren C, Ebekozien O, Rompicherla S, et al. Age and hospitalization risk in people with type 1 diabetes and COVID-19: data from the T1D Exchange Surveillance Study. J Clin Endocrinol Metab. 2021;107(2):410-418. doi:10.1210/clinem/dgab668
25. DeSalvo DJ, Noor N, Xie C, et al. Patient demographics and clinical outcomes among type 1 diabetes patients using continuous glucose monitors: data from T1D Exchange real-world observational study. J Diabetes Sci Technol. 2021 Oct 9. [Epub ahead of print] doi:10.1177/19322968211049783
26. Gallagher MP, Rompicherla S, Ebekozien O, et al. Differences in COVID-19 outcomes among patients with type 1 diabetes: first vs later surges. J Clin Outcomes Manage. 2022;29(1):27-31. doi:10.12788/jcom.0084
27. Wolf RM, Noor N, Izquierdo R, et al. Increase in newly diagnosed type 1 diabetes in youth during the COVID-19 pandemic in the United States: a multi-center analysis. Pediatr Diabetes. 2022;23(4):433-438. doi:10.1111/pedi.13328
28. Lavik AR, Ebekozien O, Noor N, et al. Trends in type 1 diabetic ketoacidosis during COVID-19 surges at 7 US centers: highest burden on non-Hispanic Black patients. J Clin Endocrinol Metab. 2022;107(7):1948-1955. doi:10.1210/clinem/dgac158
29. van der Linden J, Welsh JB, Hirsch IB, Garg SK. Real-time continuous glucose monitoring during the coronavirus disease 2019 pandemic and its impact on time in range. Diabetes Technol Ther. 2021;23(S1):S1-S7. doi:10.1089/dia.2020.0649
30. Nwosu BU, Al-Halbouni L, Parajuli S, et al. COVID-19 pandemic and pediatric type 1 diabetes: no significant change in glycemic control during the pandemic lockdown of 2020. Front Endocrinol (Lausanne). 2021;12:703905. doi:10.3389/fendo.2021.703905
31. Ellahham S. Artificial intelligence: the future for diabetes care. Am J Med. 2020;133(8):895-900. doi:10.1016/j.amjmed.2020.03.033
32. Nomura A, Noguchi M, Kometani M, et al. Artificial intelligence in current diabetes management and prediction. Curr Diab Rep. 2021;21(12):61. doi:10.1007/s11892-021-01423-2
33. Mungmode A, Noor N, Weinstock RS, et al. Making diabetes electronic medical record data actionable: promoting benchmarking and population health using the T1D Exchange Quality Improvement Portal. Clin Diabetes. Forthcoming 2022.
34. Lavizzo-Mourey RJ, Besser RE, Williams DR. Understanding and mitigating health inequities—past, current, and future directions. N Engl J Med. 2021;384(18):1681-1684. doi:10.1056/NEJMp2008628
35. Majidi S, Ebekozien O, Noor N, et al. Inequities in health outcomes in children and adults with type 1 diabetes: data from the T1D Exchange Quality Improvement Collaborative. Clin Diabetes. 2021;39(3):278-283. doi:10.2337/cd21-0028
36. Ebekozien O, Mungmode A, Odugbesan O, et al. Addressing type 1 diabetes health inequities in the United States: approaches from the T1D Exchange QI Collaborative. J Diabetes. 2022;14(1):79-82. doi:10.1111/1753-0407.13235
37. Odugbesan O, Addala A, Nelson G, et al. Implicit racial-ethnic and insurance-mediated bias to recommending diabetes technology: insights from T1D Exchange multicenter pediatric and adult diabetes provider cohort. Diabetes Technol Ther. 2022 Jun 13. [Epub ahead of print] doi:10.1089/dia.2022.0042
38. Schmitt J, Fogle K, Scott ML, Iyer P. Improving equitable access to continuous glucose monitors for Alabama’s children with type 1 diabetes: a quality improvement project. Diabetes Technol Ther. 2022;24(7):481-491. doi:10.1089/dia.2021.0511
39. Akturk HK, Agarwal S, Hoffecker L, Shah VN. Inequity in racial-ethnic representation in randomized controlled trials of diabetes technologies in type 1 diabetes: critical need for new standards. Diabetes Care. 2021;44(6):e121-e123. doi:10.2337/dc20-3063
40. Ebekozien O, Mungmode A, Buckingham D, et al. Achieving equity in diabetes research: borrowing from the field of quality improvement using a practical framework and improvement tools. Diabetes Spectr. 2022;35(3):304-312. doi:10.2237/dsi22-0002
41. Zhang J, Xu J, Lim J, et al. Wearable glucose monitoring and implantable drug delivery systems for diabetes management. Adv Healthc Mater. 2021;10(17):e2100194. doi:10.1002/adhm.202100194
42. FDA expands remote patient monitoring in hospitals for people with diabetes during COVID-19; manufacturers donate CGM supplies. News release. April 21, 2020. Accessed August 30, 2022. https://www.diabetes.org/newsroom/press-releases/2020/fda-remote-patient-monitoring-cgm
43. Campbell P. FDA grants Dexcom CGM breakthrough designation for in-hospital use. March 2, 2022. Accessed August 30, 2022. https://www.endocrinologynetwork.com/view/fda-grants-dexcom-cgm-breakthrough-designation-for-in-hospital-use
44. Yeh T, Yeung M, Mendelsohn Curanaj FA. Managing patients with insulin pumps and continuous glucose monitors in the hospital: to wear or not to wear. Curr Diab Rep. 2021;21(2):7. doi:10.1007/s11892-021-01375-7
45. Medtronic announces FDA approval for MiniMed 770G insulin pump system. News release. September 21, 2020. Accessed August 30, 2022. https://bit.ly/3TyEna4
46. Tandem Diabetes Care announces commercial launch of the t:slim X2 insulin pump with Control-IQ technology in the United States. News release. January 15, 2020. Accessed August 30, 2022. https://investor.tandemdiabetes.com/news-releases/news-release-details/tandem-diabetes-care-announces-commercial-launch-tslim-x2-0
47. Garza M, Gutow H, Mahoney K. Omnipod 5 cleared by the FDA. Updated August 22, 2022. Accessed August 30, 2022.https://diatribe.org/omnipod-5-approved-fda
48. Boughton CK. Fully closed-loop insulin delivery—are we nearly there yet? Lancet Digit Health. 2021;3(11):e689-e690. doi:10.1016/s2589-7500(21)00218-1
49. Noor N, Kamboj MK, Triolo T, et al. Hybrid closed-loop systems and glycemic outcomes in children and adults with type 1 diabetes: real-world evidence from a U.S.-based multicenter collaborative. Diabetes Care. 2022;45(8):e118-e119. doi:10.2337/dc22-0329
50. Medtronic launches InPen with real-time Guardian Connect CGM data--the first integrated smart insulin pen for people with diabetes on MDI. News release. November 12, 2020. Accessed August 30, 2022. https://bit.ly/3CTSWPL
51. Bigfoot Biomedical receives FDA clearance for Bigfoot Unity Diabetes Management System, featuring first-of-its-kind smart pen caps for insulin pens used to treat type 1 and type 2 diabetes. News release. May 10, 2021. Accessed August 30, 2022. https://bit.ly/3BeyoAh
52. Vieira G. All about the CeQur Simplicity insulin patch. Updated May 24, 2022. Accessed August 30, 2022. https://beyondtype1.org/cequr-simplicity-insulin-patch/.
53. Messer LH, Tanenbaum ML, Cook PF, et al. Cost, hassle, and on-body experience: barriers to diabetes device use in adolescents and potential intervention targets. Diabetes Technol Ther. 2020;22(10):760-767. doi:10.1089/dia.2019.0509
54. Hilliard ME, Levy W, Anderson BJ, et al. Benefits and barriers of continuous glucose monitoring in young children with type 1 diabetes. Diabetes Technol Ther. 2019;21(9):493-498. doi:10.1089/dia.2019.0142
55. Dexcom G7 Release Delayed Until Late 2022. News release. August 8, 2022. Accessed September 7, 2022. https://diatribe.org/dexcom-g7-release-delayed-until-late-2022
56. Drucker DJ. Transforming type 1 diabetes: the next wave of innovation. Diabetologia. 2021;64(5):1059-1065. doi:10.1007/s00125-021-05396-5
57. Garg SK, Rodriguez E, Shah VN, Hirsch IB. New medications for the treatment of diabetes. Diabetes Technol Ther. 2022;24(S1):S190-S208. doi:10.1089/dia.2022.2513
58. Melton D. The promise of stem cell-derived islet replacement therapy. Diabetologia. 2021;64(5):1030-1036. doi:10.1007/s00125-020-05367-2
59. Danne T, Heinemann L, Bolinder J. New insulins, biosimilars, and insulin therapy. Diabetes Technol Ther. 2022;24(S1):S35-S57. doi:10.1089/dia.2022.2503
60. Kenney J. Insulin copay caps–a path to affordability. July 6, 2021. Accessed August 30, 2022.https://diatribechange.org/news/insulin-copay-caps-path-affordability
61. Glied SA, Zhu B. Not so sweet: insulin affordability over time. September 25, 2020. Accessed August 30, 2022. https://www.commonwealthfund.org/publications/issue-briefs/2020/sep/not-so-sweet-insulin-affordability-over-time
62. American Diabetes Association. Insulin and drug affordability. Accessed August 30, 2022. https://www.diabetes.org/advocacy/insulin-and-drug-affordability
63. Sullivan P. Chances for drug pricing, surprise billing action fade until November. March 24, 2020. Accessed August 30, 2022. https://thehill.com/policy/healthcare/489334-chances-for-drug-pricing-surprise-billing-action-fade-until-november/
64. Brown TD. How Medicare’s new Senior Savings Model makes insulin more affordable. June 4, 2020. Accessed August 30, 2022. https://www.diabetes.org/blog/how-medicares-new-senior-savings-model-makes-insulin-more-affordable
65. American Diabetes Association. ADA applauds the U.S. House of Representatives passage of the Affordable Insulin Now Act. News release. April 1, 2022. https://www.diabetes.org/newsroom/official-statement/2022/ada-applauds-us-house-of-representatives-passage-of-the-affordable-insulin-now-act
66. JDRF. Driving T1D cures during challenging times. 2022.
67. Medtronic announces ongoing initiatives to address health equity for people of color living with diabetes. News release. April 7, 2021. Access August 30, 2022. https://bit.ly/3KGTOZU
From the T1D Exchange, Boston, MA (Ann Mungmode, Nicole Rioles, Jesse Cases, Dr. Ebekozien); The Leona M. and Harry B. Hemsley Charitable Trust, New York, NY (Laurel Koester); and the University of Mississippi School of Population Health, Jackson, MS (Dr. Ebekozien).
Abstract
There have been remarkable innovations in diabetes management since the start of the COVID-19 pandemic, but these groundbreaking innovations are drawing limited focus as the field focuses on the adverse impact of the pandemic on patients with diabetes. This article reviews select population health innovations in diabetes management that have become available over the past 2 years of the COVID-19 pandemic from the perspective of the T1D Exchange Quality Improvement Collaborative, a learning health network that focuses on improving care and outcomes for individuals with type 1 diabetes (T1D). Such innovations include expanded telemedicine access, collection of real-world data, machine learning and artificial intelligence, and new diabetes medications and devices. In addition, multiple innovative studies have been undertaken to explore contributors to health inequities in diabetes, and advocacy efforts for specific populations have been successful. Looking to the future, work is required to explore additional health equity successes that do not further exacerbate inequities and to look for additional innovative ways to engage people with T1D in their health care through conversations on social determinants of health and societal structures.
Keywords: type 1 diabetes, learning health network, continuous glucose monitoring, health equity
One in 10 people in the United States has diabetes.1 Diabetes is the nation’s second leading cause of death, costing the US health system more than $300 billion annually.2 The COVID-19 pandemic presented additional health burdens for people living with diabetes. For example, preexisting diabetes was identified as a risk factor for COVID-19–associated morbidity and mortality.3,4 Over the past 2 years, there have been remarkable innovations in diabetes management, including stem cell therapy and new medication options. Additionally, improved technology solutions have aided in diabetes management through continuous glucose monitors (CGM), smart insulin pens, advanced hybrid closed-loop systems, and continuous subcutaneous insulin injections.5,6 Unfortunately, these groundbreaking innovations are drawing limited focus, as the field is rightfully focused on the adverse impact of the pandemic on patients with diabetes.
Learning health networks like the T1D Exchange Quality Improvement Collaborative (T1DX-QI) have implemented some of these innovative solutions to improve care for people with diabetes.7 T1DX-QI has more than 50 data-sharing endocrinology centers that care for over 75,000 people with diabetes across the United States (Figure 1). Centers participating in the T1DX-QI use quality improvement (QI) and implementation science methods to quickly translate research into evidence-based clinical practice. T1DX-QI leads diabetes population health and health system research and supports widespread transferability across health care organizations through regular collaborative calls, conferences, and case study documentation.8
In this review, we summarize impactful population health innovations in diabetes management that have become available over the past 2 years of the COVID-19 pandemic from the perspective of T1DX-QI (see Figure 2 for relevant definitions). This review is limited in scope and is not meant to be an exhaustive list of innovations. The review also reflects significant changes from the perspective of academic diabetes centers, which may not apply to rural or primary care diabetes practices.
Methods
The first (A.M.), second (H.H.), and senior (O.E.) authors conducted a scoping review of published literature using terms related to diabetes, population health, and innovation on PubMed Central and Google Scholar for the period March 2020 to June 2022. To complement the review, A.M. and O.E. also reviewed abstracts from presentations at major international diabetes conferences, including the American Diabetes Association (ADA), the International Society for Pediatric and Adolescent Diabetes (ISPAD), the T1DX-QI Learning Session Conference, and the Advanced Technologies & Treatments for Diabetes (ATTD) 2020 to 2022 conferences.9-14 The authors also searched FDA.gov and ClinicalTrials.gov for relevant insights. A.M. and O.E. sorted the reviewed literature into major themes (Figure 3) from the population health improvement perspective of the T1DX-QI.
Population Health Innovations in Diabetes Management
Expansion of Telemedicine Access
Telemedicine is cost-effective for patients with diabetes,15 including those with complex cases.16 Before the COVID-19 pandemic, telemedicine and virtual care were rare in diabetes management. However, the pandemic offered a new opportunity to expand the practice of telemedicine in diabetes management. A study from the T1DX-QI showed that telemedicine visits grew from comprising <1% of visits pre-pandemic (December 2019) to 95.2% during the pandemic (August 2020).17 Additional studies, like those conducted by Phillip et al,18 confirmed the noninferiority of telemedicine practice for patients with diabetes.Telemedicine was also found to be an effective strategy to educate patients on the use of diabetes technologies.19
Real-World Data and Disease Surveillance
As the COVID-19 pandemic exacerbated outcomes for people with type 1 diabetes (T1D), a need arose to understand the immediate effects of the pandemic on people with T1D through real-world data and disease surveillance. In April 2020, the T1DX-QI initiated a multicenter surveillance study to collect data and analyze the impact of COVID-19 on people with T1D. The existing health collaborative served as a springboard for robust surveillance study, documenting numerous works on the effects of COVID-19.3,4,20-28 Other investigators also embraced the power of real-world surveillance and real-world data.29,30
Big Data, Machine Learning, and Artificial Intelligence
The past 2 years have seen a shift toward embracing the incredible opportunity to tap the large volume of data generated from routine care for practical insights.31 In particular, researchers have demonstrated the widespread application of machine learning and artificial intelligence to improve diabetes management.32 The T1DX-QI also harnessed the growing power of big data by expanding the functionality of innovative benchmarking software. The T1DX QI Portal uses electronic medical record data of diabetes patients for clinic-to-clinic benchmarking and data analysis, using business intelligence solutions.33
Health Equity
While inequities across various health outcomes have been well documented for years,34 the COVID-19 pandemic further exaggerated racial/ethnic health inequities in T1D.23,35 In response, several organizations have outlined specific strategies to address these health inequities. Emboldened by the pandemic, the T1DX-QI announced a multipronged approach to address health inequities among patients with T1D through the Health Equity Advancement Lab (HEAL).36 One of HEAL’s main components is using real-world data to champion population-level insights and demonstrate progress in QI efforts.
Multiple innovative studies have been undertaken to explore contributors to health inequities in diabetes, and these studies are expanding our understanding of the chasm.37 There have also been innovative solutions to addressing these inequities, with multiple studies published over the past 2 years.38 A source of inequity among patients with T1D is the lack of representation of racial/ethnic minorities with T1D in clinical trials.39 The T1DX-QI suggests that the equity-adapted framework for QI can be applied by research leaders to support trial diversity and representation, ensuring future device innovations are meaningful for all people with T1D.40
Diabetes Devices
Glucose monitoring and insulin therapy are vital tools to support individuals living with T1D, and devices such as CGM and insulin pumps have become the standard of care for diabetes management (Table).41 Innovations in diabetes technology and device access are imperative for a chronic disease with no cure.
The COVID-19 pandemic created an opportunity to increase access to diabetes devices in inpatient settings. In 2020, the US Food and Drug Administration expanded the use of CGM to support remote monitoring of patients in inpatient hospital settings, simultaneously supporting the glucose monitoring needs of patients with T1D and reducing COVID-19 transmission through reduced patient-clinician contact.42 This effort has been expanded and will continue in 2022 and beyond,43 and aligns with the growing consensus that supports patients wearing both CGMs and insulin pumps in ambulatory settings to improve patient health outcomes.44
Since 2020, innovations in diabetes technology have improved and increased the variety of options available to people with T1D and made them easier to use (Table). New, advanced hybrid closed-loop systems have progressed to offer Bluetooth features, including automatic software upgrades, tubeless systems, and the ability to allow parents to use their smartphones to bolus for children.45-47 The next big step in insulin delivery innovation is the release of functioning, fully closed loop systems, of which several are currently in clinical trials.48 These systems support reduced hypoglycemia and improved time in range.49
Additional innovations in insulin delivery have improved the user experience and expanded therapeutic options, including a variety of smart insulin pens complete with dosing logs50,51 and even a patch to deliver insulin without the burden of injections.52 As barriers to diabetes technology persist,53 innovations in alternate insulin delivery provide people with T1D more options to align with their personal access and technology preferences.
Innovations in CGM address cited barriers to their use, including size or overall wear.53-55 CGMs released in the past few years are smaller in physical size, have longer durations of time between changings, are more accurate, and do not require calibrations for accuracy.
New Diabetes Medications
Many new medications and therapeutic advances have become available in the past 2 years.56 Additionally, more medications are being tested as adjunct therapies to support glycemic management in patients with T1D, including metformin, sodium-glucose cotransporter 1 and 2 inhibitors, pramlintide, glucagon-like polypeptide-1 analogs, and glucagon receptor agonists.57 Other recent advances include stem cell replacement therapy for patients with T1D.58 The ultra-long-acting biosimilar insulins are one medical innovation that has been stalled, rather than propelled, during the COVID-19 pandemic.59
Diabetes Policy Advocacy
People with T1D require insulin to survive. The cost of insulin has increased in recent years, with some studies citing a 64% to 100% increase in the past decade.60,61 In fact, 1 in 4 insulin users report that cost has impacted their insulin use, including rationing their insulin.62 Lockdowns during the COVID-19 pandemic stressed US families financially, increasing the urgency for insulin cost caps.
Although the COVID-19 pandemic halted national conversations on drug financing,63 advocacy efforts have succeeded for specific populations. The new Medicare Part D Senior Savings Model will cap the cost of insulin at $35 for a 30-day supply,64 and 20 states passed legislation capping insulin pricing.62 Efforts to codify national cost caps are under debate, including the passage of the Affordable Insulin Now Act, which passed the House in March 2022 and is currently under review in the Senate.65
Perspective: The Role of Private Philanthropy in Supporting Population Health Innovations
Funders and industry partners play a crucial role in leading and supporting innovations that improve the lives of people with T1D and reduce society’s costs of living with the disease. Data infrastructure is critical to supporting population health. While building the data infrastructure to support population health is both time- and resource-intensive, private foundations such as Helmsley are uniquely positioned—and have a responsibility—to take large, informed risks to help reach all communities with T1D.
The T1DX-QI is the largest source of population health data on T1D in the United States and is becoming the premiere data authority on its incidence, prevalence, and outcomes. The T1DX-QI enables a robust understanding of T1D-related health trends at the population level, as well as trends among clinics and providers. Pilot centers in the T1DX-QI have reported reductions in patients’ A1c and acute diabetes-related events, as well as improvements in device usage and depression screening. The ability to capture changes speaks to the promise and power of these data to demonstrate the clinical impact of QI interventions and to support the spread of best practices and learnings across health systems.
Additional philanthropic efforts have supported innovation in the last 2 years. For example, the JDRF, a nonprofit philanthropic equity firm, has supported efforts in developing artificial pancreas systems and cell therapies currently in clinical trials like teplizumab, a drug that has demonstrated delayed onset of T1D through JDRF’s T1D Fund.66 Industry partners also have an opportunity for significant influence in this area, as they continue to fund meaningful projects to advance care for people with T1D.67
Conclusion
We are optimistic that the innovations summarized here describe a shift in the tide of equitable T1D outcomes; however, future work is required to explore additional health equity successes that do not further exacerbate inequities. We also see further opportunities for innovative ways to engage people with T1D in their health care through conversations on social determinants of health and societal structures.
Corresponding author: Ann Mungmode, MPH, T1D Exchange, 11 Avenue de Lafayette, Boston, MA 02111; Email: amungmode@t1dexchange.org
Disclosures: Dr. Ebekozien serve(d) as a director, officer, partner, employee, advisor, consultant, or trustee for the Medtronic Advisory Board and received research grants from Medtronic Diabetes, Eli Lilly, and Dexcom.
Funding: The T1DX-QI is funded by The Leona M. and Harry B. Hemsley Charitable Trust.
1. Centers for Disease Control and Prevention. National diabetes statistics report. Accessed August 30, 2022. www.cdc.gov/diabetes/data/statistics-report/index.html
2. Centers for Disease Control and Prevention. Diabetes fast facts. Accessed August 30, 2022. www.cdc.gov/diabetes/basics/quick-facts.html
3. O’Malley G, Ebekozien O, Desimone M, et al. COVID-19 hospitalization in adults with type 1 diabetes: results from the T1D Exchange Multicenter Surveillance Study. J Clin Endocrinol Metab. 2020;106(2):e936-e942. doi:10.1210/clinem/dgaa825
4. Ebekozien OA, Noor N, Gallagher MP, Alonso GT. Type 1 diabetes and COVID-19: preliminary findings from a multicenter surveillance study in the U.S. Diabetes Care. 2020;43(8):e83-e85. doi:10.2337/dc20-1088
5. Zimmerman C, Albanese-O’Neill A, Haller MJ. Advances in type 1 diabetes technology over the last decade. Eur Endocrinol. 2019;15(2):70-76. doi:10.17925/ee.2019.15.2.70
6. Wake DJ, Gibb FW, Kar P, et al. Endocrinology in the time of COVID-19: remodelling diabetes services and emerging innovation. Eur J Endocrinol. 2020;183(2):G67-G77. doi:10.1530/eje-20-0377
7. Alonso GT, Corathers S, Shah A, et al. Establishment of the T1D Exchange Quality Improvement Collaborative (T1DX-QI). Clin Diabetes. 2020;38(2):141-151. doi:10.2337/cd19-0032
8. Ginnard OZB, Alonso GT, Corathers SD, et al. Quality improvement in diabetes care: a review of initiatives and outcomes in the T1D Exchange Quality Improvement Collaborative. Clin Diabetes. 2021;39(3):256-263. doi:10.2337/cd21-0029
9. ATTD 2021 invited speaker abstracts. Diabetes Technol Ther. 2021;23(S2):A1-A206. doi:10.1089/dia.2021.2525.abstracts
10. Rompicherla SN, Edelen N, Gallagher R, et al. Children and adolescent patients with pre-existing type 1 diabetes and additional comorbidities have an increased risk of hospitalization from COVID-19; data from the T1D Exchange COVID Registry. Pediatr Diabetes. 2021;22(S30):3-32. doi:10.1111/pedi.13268
11. Abstracts for the T1D Exchange QI Collaborative (T1DX-QI) Learning Session 2021. November 8-9, 2021. J Diabetes. 2021;13(S1):3-17. doi:10.1111/1753-0407.13227
12. The Official Journal of ATTD Advanced Technologies & Treatments for Diabetes conference 27-30 April 2022. Barcelona and online. Diabetes Technol Ther. 2022;24(S1):A1-A237. doi:10.1089/dia.2022.2525.abstracts
13. Ebekozien ON, Kamboj N, Odugbesan MK, et al. Inequities in glycemic outcomes for patients with type 1 diabetes: six-year (2016-2021) longitudinal follow-up by race and ethnicity of 36,390 patients in the T1DX-QI Collaborative. Diabetes. 2022;71(suppl 1). doi:10.2337/db22-167-OR
14. Narayan KA, Noor M, Rompicherla N, et al. No BMI increase during the COVID-pandemic in children and adults with T1D in three continents: joint analysis of ADDN, T1DX, and DPV registries. Diabetes. 2022;71(suppl 1). doi:10.2337/db22-269-OR
15. Lee JY, Lee SWH. Telemedicine cost-effectiveness for diabetes management: a systematic review. Diabetes Technol Ther. 2018;20(7):492-500. doi:10.1089/dia.2018.0098
16. McDonnell ME. Telemedicine in complex diabetes management. Curr Diab Rep. 2018;18(7):42. doi:10.1007/s11892-018-1015-3
17. Lee JM, Carlson E, Albanese-O’Neill A, et al. Adoption of telemedicine for type 1 diabetes care during the COVID-19 pandemic. Diabetes Technol Ther. 2021;23(9):642-651. doi:10.1089/dia.2021.0080
18. Phillip M, Bergenstal RM, Close KL, et al. The digital/virtual diabetes clinic: the future is now–recommendations from an international panel on diabetes digital technologies introduction. Diabetes Technol Ther. 2021;23(2):146-154. doi:10.1089/dia.2020.0375
19. Garg SK, Rodriguez E. COVID‐19 pandemic and diabetes care. Diabetes Technol Ther. 2022;24(S1):S2-S20. doi:10.1089/dia.2022.2501
20. Beliard K, Ebekozien O, Demeterco-Berggren C, et al. Increased DKA at presentation among newly diagnosed type 1 diabetes patients with or without COVID-19: data from a multi-site surveillance registry. J Diabetes. 2021;13(3):270-272. doi:10.1111/1753-0407.13141
21. Ebekozien O, Agarwal S, Noor N, et al. Inequities in diabetic ketoacidosis among patients with type 1 diabetes and COVID-19: data from 52 US clinical centers. J Clin Endocrinol Metab. 2020;106(4):1755-1762. doi:10.1210/clinem/dgaa920
22. Alonso GT, Ebekozien O, Gallagher MP, et al. Diabetic ketoacidosis drives COVID-19 related hospitalizations in children with type 1 diabetes. J Diabetes. 2021;13(8):681-687. doi:10.1111/1753-0407.13184
23. Noor N, Ebekozien O, Levin L, et al. Diabetes technology use for management of type 1 diabetes is associated with fewer adverse COVID-19 outcomes: findings from the T1D Exchange COVID-19 Surveillance Registry. Diabetes Care. 2021;44(8):e160-e162. doi:10.2337/dc21-0074
24. Demeterco-Berggren C, Ebekozien O, Rompicherla S, et al. Age and hospitalization risk in people with type 1 diabetes and COVID-19: data from the T1D Exchange Surveillance Study. J Clin Endocrinol Metab. 2021;107(2):410-418. doi:10.1210/clinem/dgab668
25. DeSalvo DJ, Noor N, Xie C, et al. Patient demographics and clinical outcomes among type 1 diabetes patients using continuous glucose monitors: data from T1D Exchange real-world observational study. J Diabetes Sci Technol. 2021 Oct 9. [Epub ahead of print] doi:10.1177/19322968211049783
26. Gallagher MP, Rompicherla S, Ebekozien O, et al. Differences in COVID-19 outcomes among patients with type 1 diabetes: first vs later surges. J Clin Outcomes Manage. 2022;29(1):27-31. doi:10.12788/jcom.0084
27. Wolf RM, Noor N, Izquierdo R, et al. Increase in newly diagnosed type 1 diabetes in youth during the COVID-19 pandemic in the United States: a multi-center analysis. Pediatr Diabetes. 2022;23(4):433-438. doi:10.1111/pedi.13328
28. Lavik AR, Ebekozien O, Noor N, et al. Trends in type 1 diabetic ketoacidosis during COVID-19 surges at 7 US centers: highest burden on non-Hispanic Black patients. J Clin Endocrinol Metab. 2022;107(7):1948-1955. doi:10.1210/clinem/dgac158
29. van der Linden J, Welsh JB, Hirsch IB, Garg SK. Real-time continuous glucose monitoring during the coronavirus disease 2019 pandemic and its impact on time in range. Diabetes Technol Ther. 2021;23(S1):S1-S7. doi:10.1089/dia.2020.0649
30. Nwosu BU, Al-Halbouni L, Parajuli S, et al. COVID-19 pandemic and pediatric type 1 diabetes: no significant change in glycemic control during the pandemic lockdown of 2020. Front Endocrinol (Lausanne). 2021;12:703905. doi:10.3389/fendo.2021.703905
31. Ellahham S. Artificial intelligence: the future for diabetes care. Am J Med. 2020;133(8):895-900. doi:10.1016/j.amjmed.2020.03.033
32. Nomura A, Noguchi M, Kometani M, et al. Artificial intelligence in current diabetes management and prediction. Curr Diab Rep. 2021;21(12):61. doi:10.1007/s11892-021-01423-2
33. Mungmode A, Noor N, Weinstock RS, et al. Making diabetes electronic medical record data actionable: promoting benchmarking and population health using the T1D Exchange Quality Improvement Portal. Clin Diabetes. Forthcoming 2022.
34. Lavizzo-Mourey RJ, Besser RE, Williams DR. Understanding and mitigating health inequities—past, current, and future directions. N Engl J Med. 2021;384(18):1681-1684. doi:10.1056/NEJMp2008628
35. Majidi S, Ebekozien O, Noor N, et al. Inequities in health outcomes in children and adults with type 1 diabetes: data from the T1D Exchange Quality Improvement Collaborative. Clin Diabetes. 2021;39(3):278-283. doi:10.2337/cd21-0028
36. Ebekozien O, Mungmode A, Odugbesan O, et al. Addressing type 1 diabetes health inequities in the United States: approaches from the T1D Exchange QI Collaborative. J Diabetes. 2022;14(1):79-82. doi:10.1111/1753-0407.13235
37. Odugbesan O, Addala A, Nelson G, et al. Implicit racial-ethnic and insurance-mediated bias to recommending diabetes technology: insights from T1D Exchange multicenter pediatric and adult diabetes provider cohort. Diabetes Technol Ther. 2022 Jun 13. [Epub ahead of print] doi:10.1089/dia.2022.0042
38. Schmitt J, Fogle K, Scott ML, Iyer P. Improving equitable access to continuous glucose monitors for Alabama’s children with type 1 diabetes: a quality improvement project. Diabetes Technol Ther. 2022;24(7):481-491. doi:10.1089/dia.2021.0511
39. Akturk HK, Agarwal S, Hoffecker L, Shah VN. Inequity in racial-ethnic representation in randomized controlled trials of diabetes technologies in type 1 diabetes: critical need for new standards. Diabetes Care. 2021;44(6):e121-e123. doi:10.2337/dc20-3063
40. Ebekozien O, Mungmode A, Buckingham D, et al. Achieving equity in diabetes research: borrowing from the field of quality improvement using a practical framework and improvement tools. Diabetes Spectr. 2022;35(3):304-312. doi:10.2237/dsi22-0002
41. Zhang J, Xu J, Lim J, et al. Wearable glucose monitoring and implantable drug delivery systems for diabetes management. Adv Healthc Mater. 2021;10(17):e2100194. doi:10.1002/adhm.202100194
42. FDA expands remote patient monitoring in hospitals for people with diabetes during COVID-19; manufacturers donate CGM supplies. News release. April 21, 2020. Accessed August 30, 2022. https://www.diabetes.org/newsroom/press-releases/2020/fda-remote-patient-monitoring-cgm
43. Campbell P. FDA grants Dexcom CGM breakthrough designation for in-hospital use. March 2, 2022. Accessed August 30, 2022. https://www.endocrinologynetwork.com/view/fda-grants-dexcom-cgm-breakthrough-designation-for-in-hospital-use
44. Yeh T, Yeung M, Mendelsohn Curanaj FA. Managing patients with insulin pumps and continuous glucose monitors in the hospital: to wear or not to wear. Curr Diab Rep. 2021;21(2):7. doi:10.1007/s11892-021-01375-7
45. Medtronic announces FDA approval for MiniMed 770G insulin pump system. News release. September 21, 2020. Accessed August 30, 2022. https://bit.ly/3TyEna4
46. Tandem Diabetes Care announces commercial launch of the t:slim X2 insulin pump with Control-IQ technology in the United States. News release. January 15, 2020. Accessed August 30, 2022. https://investor.tandemdiabetes.com/news-releases/news-release-details/tandem-diabetes-care-announces-commercial-launch-tslim-x2-0
47. Garza M, Gutow H, Mahoney K. Omnipod 5 cleared by the FDA. Updated August 22, 2022. Accessed August 30, 2022.https://diatribe.org/omnipod-5-approved-fda
48. Boughton CK. Fully closed-loop insulin delivery—are we nearly there yet? Lancet Digit Health. 2021;3(11):e689-e690. doi:10.1016/s2589-7500(21)00218-1
49. Noor N, Kamboj MK, Triolo T, et al. Hybrid closed-loop systems and glycemic outcomes in children and adults with type 1 diabetes: real-world evidence from a U.S.-based multicenter collaborative. Diabetes Care. 2022;45(8):e118-e119. doi:10.2337/dc22-0329
50. Medtronic launches InPen with real-time Guardian Connect CGM data--the first integrated smart insulin pen for people with diabetes on MDI. News release. November 12, 2020. Accessed August 30, 2022. https://bit.ly/3CTSWPL
51. Bigfoot Biomedical receives FDA clearance for Bigfoot Unity Diabetes Management System, featuring first-of-its-kind smart pen caps for insulin pens used to treat type 1 and type 2 diabetes. News release. May 10, 2021. Accessed August 30, 2022. https://bit.ly/3BeyoAh
52. Vieira G. All about the CeQur Simplicity insulin patch. Updated May 24, 2022. Accessed August 30, 2022. https://beyondtype1.org/cequr-simplicity-insulin-patch/.
53. Messer LH, Tanenbaum ML, Cook PF, et al. Cost, hassle, and on-body experience: barriers to diabetes device use in adolescents and potential intervention targets. Diabetes Technol Ther. 2020;22(10):760-767. doi:10.1089/dia.2019.0509
54. Hilliard ME, Levy W, Anderson BJ, et al. Benefits and barriers of continuous glucose monitoring in young children with type 1 diabetes. Diabetes Technol Ther. 2019;21(9):493-498. doi:10.1089/dia.2019.0142
55. Dexcom G7 Release Delayed Until Late 2022. News release. August 8, 2022. Accessed September 7, 2022. https://diatribe.org/dexcom-g7-release-delayed-until-late-2022
56. Drucker DJ. Transforming type 1 diabetes: the next wave of innovation. Diabetologia. 2021;64(5):1059-1065. doi:10.1007/s00125-021-05396-5
57. Garg SK, Rodriguez E, Shah VN, Hirsch IB. New medications for the treatment of diabetes. Diabetes Technol Ther. 2022;24(S1):S190-S208. doi:10.1089/dia.2022.2513
58. Melton D. The promise of stem cell-derived islet replacement therapy. Diabetologia. 2021;64(5):1030-1036. doi:10.1007/s00125-020-05367-2
59. Danne T, Heinemann L, Bolinder J. New insulins, biosimilars, and insulin therapy. Diabetes Technol Ther. 2022;24(S1):S35-S57. doi:10.1089/dia.2022.2503
60. Kenney J. Insulin copay caps–a path to affordability. July 6, 2021. Accessed August 30, 2022.https://diatribechange.org/news/insulin-copay-caps-path-affordability
61. Glied SA, Zhu B. Not so sweet: insulin affordability over time. September 25, 2020. Accessed August 30, 2022. https://www.commonwealthfund.org/publications/issue-briefs/2020/sep/not-so-sweet-insulin-affordability-over-time
62. American Diabetes Association. Insulin and drug affordability. Accessed August 30, 2022. https://www.diabetes.org/advocacy/insulin-and-drug-affordability
63. Sullivan P. Chances for drug pricing, surprise billing action fade until November. March 24, 2020. Accessed August 30, 2022. https://thehill.com/policy/healthcare/489334-chances-for-drug-pricing-surprise-billing-action-fade-until-november/
64. Brown TD. How Medicare’s new Senior Savings Model makes insulin more affordable. June 4, 2020. Accessed August 30, 2022. https://www.diabetes.org/blog/how-medicares-new-senior-savings-model-makes-insulin-more-affordable
65. American Diabetes Association. ADA applauds the U.S. House of Representatives passage of the Affordable Insulin Now Act. News release. April 1, 2022. https://www.diabetes.org/newsroom/official-statement/2022/ada-applauds-us-house-of-representatives-passage-of-the-affordable-insulin-now-act
66. JDRF. Driving T1D cures during challenging times. 2022.
67. Medtronic announces ongoing initiatives to address health equity for people of color living with diabetes. News release. April 7, 2021. Access August 30, 2022. https://bit.ly/3KGTOZU
Improving Epistaxis Knowledge and Management Among Nursing Staff
From the University of Chicago Medical Center, Chicago, IL.
Abstract
Background: Epistaxis is a common chief complaint addressed by otolaryngologists. A review of the literature showed that there is a deficit in epistaxis education within the nursing community. Conversations with our nursing colleagues confirmed this unmet demand.
Objective: This quality improvement project aimed to increase general epistaxis knowledge, perceived comfort level managing nosebleeds, and perceived ability to stop nosebleeds among our nursing staff.
Methods: Data were collected through a survey administered before and after our intervention. The survey tested general epistaxis knowledge and assessed comfort and confidence in stopping epistaxis. Our intervention was an educational session covering pertinent epistaxis etiology and management. Quality improvement principles were used to optimize delivery of the intervention.
Results: A total of 51 nurses participated in the project. After participating in the in-service educational session, nurses answered significantly more epistaxis general knowledge questions correctly (mean [SD] difference, 2.07 [1.10] questions; 95% CI, 1.74-2.39; P < .001). There was no statistically significant difference in additional correct questions when stratified by clinical experience or clinical setting (P = .128 and P = 0.446, respectively). Nurses also reported feeling significantly more comfortable and significantly more confident in managing nosebleeds after the in-service (P = .007 and P < 0.001, respectively); 74.46% of nurses had an improvement in comfort level in managing epistaxis and 43.90% of nurses had an improvement in confidence in stopping epistaxis. After we moved the educational session from mid-shift to shift change, the nursing staff reported more satisfaction while maintaining similar improvements in knowledge and confidence.
Conclusion: We were able to significantly increase epistaxis knowledge, improve comfort levels managing epistaxis, and improve confidence in successful epistaxis management. Nurses of varying clinical experience and different clinical settings benefitted equally from our intervention.
Keywords: nosebleed; in-service; quality improvement.
Epistaxis, or nosebleed, is estimated to be the chief complaint in 1 in 200 emergency department visits in the United States.1 Additionally, it represents up to one-third of otolaryngology-related emergency room admissions.2 There is no existing literature, to our best knowledge, specifically investigating the incidence of epistaxis after a patient is admitted. Anecdotally, inpatients who develop epistaxis account for an appreciable number of consults to otolaryngology (ENT). Epistaxis is a cross-disciplinary issue, occurring in a range of clinical settings. For example, patients with epistaxis can present to the emergency department or to an outpatient primary care clinic before being referred to ENT. Additionally, inpatients on many different services can develop spontaneous epistaxis due to a variety of environmental and iatrogenic factors, such as dry air, use of nasal cannula, and initiation of anticoagulation. Based on the experience of our ENT providers and discussions with our nursing colleagues, we concluded that there was an interest in epistaxis management training among our nursing workforce.
The presence of unmet demand for epistaxis education among our nursing colleagues was supported by our literature review. A study performed in England surveyed emergency department nurses on first aid measures for management of epistaxis, including ideal head positioning, location of pressure application, and duration of pressure application.3 Overall, only 12% to 14% of the nursing staff answered all 3 questions correctly.3 Additionally, 73% to 78% of the nursing staff felt that their training in epistaxis management was inadequate, and 88% desired further training in epistaxis management.3 If generalized, this study confirms the demand for further epistaxis education among nurses.
In-services have previously been shown to be effective educational tools within the nursing community. A study in Ethiopia that evaluated pain management knowledge and attitudes before and after an in-service found a significant improvement in mean rank score of nurses’ knowledge and attitudes regarding pain management after they participated in the in-service.4 Scores on the knowledge survey improved from 41.4% before the intervention to 63.0% post intervention.4 A study in Connecticut evaluated nurses’ confidence in discussing suicidal ideation with patients and knowledge surrounding suicide precautions.5 After participating in an in-service, nurses were significantly more confident in discussing suicidal ideation with patients; application of appropriate suicide precautions also increased after the in-service.5
Our aim was for nurses to have an improvement in overall epistaxis knowledge, perceived comfort level managing nosebleeds, and perceived ability to stop nosebleeds after attending our in-service. Additionally, an overarching priority was to provide high-quality epistaxis education based on the literature and best practice guidelines.
Methods
Setting
This study was carried out at an 811-bed quaternary care center located in Chicago, Illinois. In fiscal year 2021, there were 91 643 emergency department visits and 33 805 hospital admissions. At our flagship hospital, 2658 patients were diagnosed with epistaxis during fiscal year 2021. The emergency department saw 533 patients with epistaxis, with 342 requiring admission and 191 being discharged. Separately, 566 inpatients received a diagnosis of epistaxis during their admission. The remainder of the patients with epistaxis were seen on an outpatient basis.
Data Collection
Data were collected from nurses on 5 different inpatient units. An email with information about the in-service was sent to the nurse managers of the inpatient units. These 5 units were included because the nurse managers responded to the email and facilitated delivery of the in-service. Data collection took place from August to December 2020.
Intervention
A quality improvement team composed of a resident physician champion, nurse educators, and nurse managers was formed. The physician champion was a senior otolaryngology resident who was responsible for designing and administering the pre-test, in-service, and post test. The nurse educators and nurse managers helped coordinate times for the in-service and promoted the in-service for their staff.
Our intervention was an educational in-service, a technique that is commonly used at our institution for nurse education. In-services typically involve delivering a lecture on a clinically relevant topic to a group of nurses on a unit. In developing the in-service, a top priority was to present high-quality evidence-based material. There is an abundance of information in the literature surrounding epistaxis management. The clinical practice guideline published by the American Academy of Otolaryngology lists nasal compression, application of vasoconstrictors, nasal packing, and nasal cautery as first-line treatments for the management of epistaxis.6 Nasal packing and nasal cautery tend to be perceived as interventions that require a certain level of expertise and specialized supplies. As such, these interventions are not often performed by floor nurses. In contrast, nasal compression and application of vasoconstrictors require only a few easily accessible supplies, and the risks are relatively minimal. When performing nasal compression, the clinical practice guidelines recommend firm, sustained compression to the lower third of the nose for 5 minutes or longer.6 Topical vasoconstrictors are generally underutilized in epistaxis management. In a study looking at a random sample of all US emergency department visits from 1992 to 2001, only 18% of visits used an epistaxis-related medication.2 Oxymetazoline hydrochloride is a topical vasoconstrictor that is commonly used as a nasal decongestant. However, its vasoconstrictor properties also make it a useful tool for controlling epistaxis. In a study looking at emergency department visits at the University of Texas Health Science Center, 65% of patients had resolution of nosebleed with application of oxymetazoline hydrochloride as the only intervention, with another 18% experiencing resolution of nosebleed with a combination of oxymetazoline hydrochloride and silver nitrate cautery.7 Based on review of the literature, nasal compression and application of vasoconstrictors seemed to be low-resource interventions with minimal morbidity. Therefore, management centered around nasal compression and use of topical vasoconstrictors seemed appropriate for our nursing staff.
The in-service included information about the etiology and management of epistaxis. Particular emphasis was placed on addressing and debunking common misconceptions about nosebleed management. With regards to management, our presentation focused on the use of topical vasoconstrictors and firm pressure to the lower third of the nose for at least 5 minutes. Nasal packing and nasal cautery were presented as procedures that ENT would perform. After the in-service, questions from the nurses were answered as time permitted.
Testing and Outcomes
A pre-test was administered before each in-service. The pre-test components comprised a knowledge survey and a descriptive survey. The general epistaxis knowledge questions on the pre-test included the location of blood vessels most commonly responsible for nosebleeds, the ideal positioning of a patient during a nosebleed, the appropriate location to hold pressure during a nosebleed, and the appropriate duration to hold pressure during a nosebleed. The descriptive survey portion asked nurses to rate whether they felt “very comfortable,” “comfortable,” “uncomfortable,” or “very uncomfortable” managing nosebleeds. It also asked whether nurses thought they would be able to “always,” “usually,” “rarely,” or “never” stop nosebleeds on the floor. We collected demographic information, including gender identity, years of clinical experience, and primary clinical environment.
The post test asked the same questions as the pre-test and was administered immediately after the in-service in order to assess its impact. We also established an ongoing dialogue with our nursing colleagues to obtain feedback on the sessions.
Primary outcomes of interest were the difference in general epistaxis knowledge questions answered correctly between the pre-test and the post test; the difference in comfort level in managing epistaxis before and after the in-service; and the difference in confidence to stop nosebleeds before and after the in-service. A secondary outcome was determining the audience for the in-service. Specifically, we wanted to determine whether there were different outcomes based on clinical setting or years of clinical experience. If nurses in a certain clinical environment or beyond a certain experience level did not show significant improvement from pre-test to post test, we would not target them for the in-service. Another secondary outcome was determining optimal timing for delivery of the in-service. We wanted to determine if there was a nursing preference for delivering the in-service at mid-shift vs shift change.
Analysis
Statistical calculations were performed using Stata 15 (StataCorp LLC). A P value < .05 was considered to be statistically significant. Where applicable, 95% confidence intervals (CI) were calculated. T-test was used to determine whether there was a statistically significant difference between pre-test and post-test epistaxis knowledge question scores. T-test was also used to determine whether there was a statistically significant difference in test scores between nurses receiving the in-service at mid-shift vs shift change. Pearson chi-squared tests were used to determine if there was a statistically significant difference between pre-test and post-test perceptions of epistaxis management, and to investigate outcomes between different subsets of nurses.
SQUIRE 2.0 guidelines were utilized to provide a framework for this project and to structure the manuscript.8 This study met criteria for exemption from institutional review board approval.
Results
Fifty-one nurses took part in this project (Table). The majority of participants identified as female (88.24%), and just over half worked on medical floors (52.94%), with most of the remainder working in intensive care (25.49%) and surgical (15.69%) settings. There was a wide range of clinical experience, with 1.96% reporting 0 to 1 years of experience, 29.41% reporting 2 to 5 years, 23.53% reporting 5 to 10 years, 25.49% reporting 10 to 20 years, and 17.65% reporting more than 20 years.

There were unanswered questions on both the pre-test and post test. There was no consistently unanswered question. Omitted answers on the epistaxis knowledge questions were recorded as an “incorrect” answer. Omitted answers on the perception questions were considered null values and not considered in final analysis.
Primary Measures
General epistaxis knowledge (Figure, part A) improved from the pre-test, where out of 4 questions, the mean (SD) score was 1.74 (1.02) correct questions, to the post-test, where out of 4 questions, the mean score was 3.80 (0.40) correct questions. After participating in the in-service, nurses answered significantly more questions about epistaxis general knowledge correctly (mean difference, 2.07 [1.10]; 95% CI, 1.74-2.39; P < .001), and 80.43% of them got a perfect score on the epistaxis knowledge questions.
 Number of epistaxis knowledge questions correct before in-service and after in-service. (B) Perceived comfort level in managing epistaxis before in-service versus after in-service. (C) Confidence in stopping nosebleeds before")
The second primary measure was the difference in comfort level in managing nosebleed. After participating in the in-service, nurses felt significantly more comfortable in managing nosebleeds (Figure, part B; P = .007), with 74.46% of nurses having an improved comfort level managing nosebleeds. Before the in-service, 12.76% of nurses felt “very comfortable” in managing nosebleeds vs more than three-quarters (76.59%) after the in-service. Of those who answered that they felt “comfortable” managing nosebleeds on the pre-test, 82.35% improved to feeling “very comfortable” in managing nosebleeds. Before the in-service, 14.89% of nurses felt “uncomfortable” or “very uncomfortable” in managing nosebleeds, and this decreased to 0 post intervention. After the in-service, 100.00% of nurses felt “comfortable” or “very comfortable” in managing nosebleeds.
After receiving the in-service, nurses felt significantly more confident in stopping nosebleeds (Figure, part C; P < .001), with 43.90% of them having an improvement in confidence in stopping epistaxis. Before the in-service, 7.31% of nurses felt that they would “always” be able to stop a nose-bleed, and this increased to 41.46% after the in-service. Of those who answered that they felt that they would “usually” be able to stop a nosebleed on the pre-test, 36.67% changed their answer to state that they would “always” be able to stop a nosebleed on the post test. Before the in-service, 19.51% of nurses felt that they would “rarely” or “never” be able to stop a nosebleed, and this decreased to 2.44% after the in-service.
Secondary Measures
All of the nurses who participated either “strongly agreed” or “agreed” that they learned something new from the in-service. However, to determine whether there was a population who would benefit most from the in-service, we stratified the data by years of clinical experience. There was no statistically significant difference in whether nurses with varying clinical experience learned something new (P = .148): 100% of nurses with 0-1 years of experience, 80.00% of nurses with 2-5 years of experience, 100% of nurses with 5-10 years of experience, 69.23% of nurses with 10-20 years of experience, and 100% of nurses with >20 years of experience “strongly agreed” that they learned something new from this in-service. There was no statistically significant difference on the post test compared to the pre-test in additional correct questions when stratified by clinical experience (P = .128). Second, when we stratified by clinical setting, we did not find a statistically significant difference in whether nurses in different clinical settings learned something new (P = .929): 88.89% of nurses in the medical setting, 87.50% of nurses in the surgical setting, and 84.62% of nurses in the intensive care setting “strongly agreed” that they learned something new from this presentation. On investigating additional questions correct on the post test compared to the pre-test, there was no statistically significant difference in additional correct questions when stratified by clinical setting (P = .446).
Optimal timing of the in-service was another important outcome. Initially, the in-service was administered at mid-shift, with 9 nurses participating at mid-shift, but our nursing colleagues gave unanimous feedback that this was a suboptimal time for delivery of an in-service. We changed the timing of the in-service to shift change; 42 nurses received the in-service at shift-change. There was no statistically significant difference in scores on the epistaxis knowledge questions between these two groups (P = .123). This indicated to us that changing the timing of the delivery resulted in similarly improved outcomes while having the added benefit of being preferred by our nursing colleagues.
Discussion
In undertaking this project, our primary aims were to improve epistaxis knowledge and perceived management in our nursing staff. Among our nursing staff, we were able to significantly increase epistaxis knowledge, improve comfort levels managing epistaxis, and improve confidence in successful epistaxis management. We also found that nurses of varying clinical experience and different clinical settings benefited equally from our intervention. Using quality improvement principles, we optimized our delivery. Our in-service focused on educating nurses to use epistaxis management techniques that were resource-efficient and low risk.
After participating in the in-service, nurses answered significantly more questions about epistaxis general knowledge correctly (Figure, part A; mean difference, 2.07 questions [1.10]; 95% CI, 1.74-2.39; P < .001), felt significantly more comfortable in managing nosebleeds (Figure, part B; P = .007), and felt significantly more confident in stopping nosebleeds (Figure, part C; P < .001). Based on these results, we successfully achieved our primary aims.
Our secondary aim was to determine the audience that would benefit the most from the in-service. All of the nurses who participated either “strongly agreed” or “agreed” that they learned something new from the in-service. There was no statistically significant difference in whether nurses of varying clinical experience learned something new (P = .148) or in additional correct questions when stratified by clinical experience (P =.128). Also, there was no statistically significant difference in whether nurses in different clinical settings learned something new (P = .929) or in additional correct questions when stratified by clinical setting (P = .446). These results indicated to us that all participants learned something new and that there was no specific target audience, but rather that all participants benefitted from our session.
Our nursing colleagues gave us feedback that the timing of the in-service during mid-shift was not ideal. It was difficult to gather nurses mid-shift due to pressing patient-care duties. Nurses also found it difficult to give their full attention at this time. Nurses, nurse educators, and nurse managers suggested that we conduct the in-service at shift change in order to capture a larger population and take advantage of time relatively free of clinical duties. Giving the in-service at a time with relatively fewer clinical responsibilities allowed for a more robust question-and-answer session. It also allowed our nursing colleagues to pay full attention to the in-service. There was no statistically significant difference in epistaxis general knowledge questions answered correctly; this indicates that the quality of the education session did not vary greatly. However, our nursing colleagues strongly preferred the in-service at shift change. By making this modification to our intervention, we were able to optimize our intervention.
The previously mentioned study in England reported that only 12% to 14% of their nursing staff got a perfect score on epistaxis knowledge questions. Prior to our study, there was no literature investigating the impact of an in-service on epistaxis knowledge. After our intervention, 80.43% of our nurses got a perfect score on the epistaxis knowledge questions. We believe that this is a fair comparison because our post-test questions were identical to the survey questions used in the previously mentioned study in England, with the addition of one question.3 Further, the findings of our study are consistent with other studies regarding the positive effect of in-service education on knowledge and attitudes surrounding clinical topics. Similar to the study in Ethiopia investigating nurses’ knowledge surrounding pain management, our study noted a significant improvement in nurses’ knowledge after participating in the in-service.4 Also, when comparing our study to the study performed in Connecticut investigating nurses’ confidence surrounding suicide precautions, we found a similar significant improvement in confidence in management after participating in the in-service.5
Given our reliance on a survey as a tool to collect information, our study was subject to nonresponse bias. For each main outcome question, there was a handful of nonresponders. While this likely indicated either overlooking a question or deferring to answer due to clinical inexperience or nonapplicable clinical role, it is possible that this may have represented a respondent who did not benefit from the in-service. Another source of possible bias is sampling bias. Attempts were made to capture a wide range of nurses at the in-service. However, if a nurse was not interested in the topic material, whether due to abundant clinical experience or disinterest, it is possible that they may not have attended. Additionally, the cohort was selected purely based on responses from nursing managers to the initial email. It is possible that nonresponding units may have benefitted differently from this in-service.
There were several limitations within our analysis. We did not collect data assessing the long-term retention of epistaxis knowledge and management techniques. It is possible that epistaxis knowledge, comfort in managing nosebleeds, and perceived confidence in stopping nosebleeds decreased back to baseline several months after the in-service. Ideally, we would have been able to collect this data to assess retention of the in-service information. Unfortunately, a significant number of nurses who initially participated in the project became lost to follow-up, making such data collection impossible. Additionally, there was no assessment of actual ability to stop nosebleeds before vs after this in-service. Perceived management of epistaxis vs actual management of epistaxis are 2 vastly different things. However, this data would have been difficult to collect, and it likely would not have been in the best interest of patients, especially before the in-service was administered. As an improvement to this project, we could have assessed how many nosebleeds nurses had seen and successfully stopped after the in-service. As previously mentioned, this was not possible due to losing a significant number of nurses to follow-up. Finally, we did not collect objective data on preference for administration of in-service at mid-shift vs shift change. We relied on subjective data from conversations with our colleagues. By collecting objective data, we could have supported this change to our intervention with data.
The primary challenge to sustainability for this intervention is nursing turnover. With each wave of departing nurses and new nursing hires, the difficulty of ensuring a consistent knowledge base and management standards within our nursing workforce became clearer. After optimizing our intervention, our solution was to provide a hospital-wide in-service, which was recorded and uploaded to an institution-wide in-service library. In this way, a nurse with the desire to learn about epistaxis management could access the material at any point in time. Another solution would have been to appoint champions for epistaxis management within each major department to deliver the epistaxis in-service to new hires and new rotators within the department. However, given the turnover witnessed in our study cohort, this may not be sustainable long term.
Conclusion
Epistaxis is a chief complaint that can present in many different clinical settings and situations. Therefore, the ability to stop epistaxis in a timely and effective fashion is valuable. Our study demonstrated that in-services can improve epistaxis knowledge and improve perceived epistaxis management. Ideally, this intervention will lead to improved patient care. Given that epistaxis is a ubiquitous issue, this study may benefit other institutions who want to improve care for patients with epistaxis.
Next steps for this intervention include utilizing in-services for epistaxis education at other institutions and collecting long-term data within our own institution. Collecting long-term data would allow us to assess the retention of epistaxis knowledge from our in-service.
Acknowledgments: The author thanks the nurse managers, nurse educators, and staff nurses involved in this project, as well as Dr. Louis Portugal for providing mentorship throughout this process and Dr. Dara Adams for assisting with statistical analysis.
Corresponding author: Avery Nelson, MD, University of Chicago Medical Center, 5841 S Maryland Ave, MC 1035, Chicago, IL 60637; avery.nelson@uchospitals.edu
Disclosures: None reported.
1. Pallin DJ, Chng Y-M, McKay MP, et al. Epidemiology of epistaxis in US emergency departments, 1992 to 2001. Ann Emerg Med. 2005;46(1):77-81. doi:10.1016/j.annemergmed.2004.12.014
2. Walker TWM, Macfarlane TV, McGarry GW. The epidemiology and chronobiology of epistaxis: An investigation of Scottish hospital admissions 1995-2004. Clin Otolaryngol. 2007;32(5):361-365. doi:10.1111/j.1749-4486.2007.01530.x
3. Hakim N, Mummadi SM, Jolly K, et al. Nurse-led epistaxis management within the emergency department. Br J Nurs. 2018;27(1):41-46. doi:10.12968/bjon.2018.27.1.41
4. Germossa GN, Sjetne IS, Hellesø R. The impact of an in-service educational program on nurses’ knowledge and attitudes regarding pain management in an Ethiopian University Hospital. Front Public Health. 2018;6:229. doi:10.3389/fpubh.2018.00229
5. Manister NN, Murray S, Burke JM, Finegan M, McKiernan ME. Effectiveness of nursing education to prevent inpatient suicide. J Contin Educ Nurs. 2017;48(9):413-419. doi:10.3928/00220124-20170816-07
6. Tunkel DE, Anne S, Payne SC, et al. Clinical practice guideline: nosebleed (epistaxis) executive summary. Otolaryngol Head Neck Surg. 2020;162(1):S1-S38. doi:10.1177/0194599819890327
7. Krempl GA, Noorily AD. Use of oxymetazoline in the management of epistaxis. Ann Otol Rhinol Laryngol. 1995;104(9 Part 1):704-706. doi:10.1177/000348949510400906
8. Ogrinc G, Davies L, Goodman D, et al. SQUIRE 2.0—standards for quality improvement reporting excellence—revised publication guidelines from a detailed consensus process. J Am Coll Surg. 2016;222(3):317-323. doi:10.1016/j.jamcollsurg.2015.07.456
From the University of Chicago Medical Center, Chicago, IL.
Abstract
Background: Epistaxis is a common chief complaint addressed by otolaryngologists. A review of the literature showed that there is a deficit in epistaxis education within the nursing community. Conversations with our nursing colleagues confirmed this unmet demand.
Objective: This quality improvement project aimed to increase general epistaxis knowledge, perceived comfort level managing nosebleeds, and perceived ability to stop nosebleeds among our nursing staff.
Methods: Data were collected through a survey administered before and after our intervention. The survey tested general epistaxis knowledge and assessed comfort and confidence in stopping epistaxis. Our intervention was an educational session covering pertinent epistaxis etiology and management. Quality improvement principles were used to optimize delivery of the intervention.
Results: A total of 51 nurses participated in the project. After participating in the in-service educational session, nurses answered significantly more epistaxis general knowledge questions correctly (mean [SD] difference, 2.07 [1.10] questions; 95% CI, 1.74-2.39; P < .001). There was no statistically significant difference in additional correct questions when stratified by clinical experience or clinical setting (P = .128 and P = 0.446, respectively). Nurses also reported feeling significantly more comfortable and significantly more confident in managing nosebleeds after the in-service (P = .007 and P < 0.001, respectively); 74.46% of nurses had an improvement in comfort level in managing epistaxis and 43.90% of nurses had an improvement in confidence in stopping epistaxis. After we moved the educational session from mid-shift to shift change, the nursing staff reported more satisfaction while maintaining similar improvements in knowledge and confidence.
Conclusion: We were able to significantly increase epistaxis knowledge, improve comfort levels managing epistaxis, and improve confidence in successful epistaxis management. Nurses of varying clinical experience and different clinical settings benefitted equally from our intervention.
Keywords: nosebleed; in-service; quality improvement.
Epistaxis, or nosebleed, is estimated to be the chief complaint in 1 in 200 emergency department visits in the United States.1 Additionally, it represents up to one-third of otolaryngology-related emergency room admissions.2 There is no existing literature, to our best knowledge, specifically investigating the incidence of epistaxis after a patient is admitted. Anecdotally, inpatients who develop epistaxis account for an appreciable number of consults to otolaryngology (ENT). Epistaxis is a cross-disciplinary issue, occurring in a range of clinical settings. For example, patients with epistaxis can present to the emergency department or to an outpatient primary care clinic before being referred to ENT. Additionally, inpatients on many different services can develop spontaneous epistaxis due to a variety of environmental and iatrogenic factors, such as dry air, use of nasal cannula, and initiation of anticoagulation. Based on the experience of our ENT providers and discussions with our nursing colleagues, we concluded that there was an interest in epistaxis management training among our nursing workforce.
The presence of unmet demand for epistaxis education among our nursing colleagues was supported by our literature review. A study performed in England surveyed emergency department nurses on first aid measures for management of epistaxis, including ideal head positioning, location of pressure application, and duration of pressure application.3 Overall, only 12% to 14% of the nursing staff answered all 3 questions correctly.3 Additionally, 73% to 78% of the nursing staff felt that their training in epistaxis management was inadequate, and 88% desired further training in epistaxis management.3 If generalized, this study confirms the demand for further epistaxis education among nurses.
In-services have previously been shown to be effective educational tools within the nursing community. A study in Ethiopia that evaluated pain management knowledge and attitudes before and after an in-service found a significant improvement in mean rank score of nurses’ knowledge and attitudes regarding pain management after they participated in the in-service.4 Scores on the knowledge survey improved from 41.4% before the intervention to 63.0% post intervention.4 A study in Connecticut evaluated nurses’ confidence in discussing suicidal ideation with patients and knowledge surrounding suicide precautions.5 After participating in an in-service, nurses were significantly more confident in discussing suicidal ideation with patients; application of appropriate suicide precautions also increased after the in-service.5
Our aim was for nurses to have an improvement in overall epistaxis knowledge, perceived comfort level managing nosebleeds, and perceived ability to stop nosebleeds after attending our in-service. Additionally, an overarching priority was to provide high-quality epistaxis education based on the literature and best practice guidelines.
Methods
Setting
This study was carried out at an 811-bed quaternary care center located in Chicago, Illinois. In fiscal year 2021, there were 91 643 emergency department visits and 33 805 hospital admissions. At our flagship hospital, 2658 patients were diagnosed with epistaxis during fiscal year 2021. The emergency department saw 533 patients with epistaxis, with 342 requiring admission and 191 being discharged. Separately, 566 inpatients received a diagnosis of epistaxis during their admission. The remainder of the patients with epistaxis were seen on an outpatient basis.
Data Collection
Data were collected from nurses on 5 different inpatient units. An email with information about the in-service was sent to the nurse managers of the inpatient units. These 5 units were included because the nurse managers responded to the email and facilitated delivery of the in-service. Data collection took place from August to December 2020.
Intervention
A quality improvement team composed of a resident physician champion, nurse educators, and nurse managers was formed. The physician champion was a senior otolaryngology resident who was responsible for designing and administering the pre-test, in-service, and post test. The nurse educators and nurse managers helped coordinate times for the in-service and promoted the in-service for their staff.
Our intervention was an educational in-service, a technique that is commonly used at our institution for nurse education. In-services typically involve delivering a lecture on a clinically relevant topic to a group of nurses on a unit. In developing the in-service, a top priority was to present high-quality evidence-based material. There is an abundance of information in the literature surrounding epistaxis management. The clinical practice guideline published by the American Academy of Otolaryngology lists nasal compression, application of vasoconstrictors, nasal packing, and nasal cautery as first-line treatments for the management of epistaxis.6 Nasal packing and nasal cautery tend to be perceived as interventions that require a certain level of expertise and specialized supplies. As such, these interventions are not often performed by floor nurses. In contrast, nasal compression and application of vasoconstrictors require only a few easily accessible supplies, and the risks are relatively minimal. When performing nasal compression, the clinical practice guidelines recommend firm, sustained compression to the lower third of the nose for 5 minutes or longer.6 Topical vasoconstrictors are generally underutilized in epistaxis management. In a study looking at a random sample of all US emergency department visits from 1992 to 2001, only 18% of visits used an epistaxis-related medication.2 Oxymetazoline hydrochloride is a topical vasoconstrictor that is commonly used as a nasal decongestant. However, its vasoconstrictor properties also make it a useful tool for controlling epistaxis. In a study looking at emergency department visits at the University of Texas Health Science Center, 65% of patients had resolution of nosebleed with application of oxymetazoline hydrochloride as the only intervention, with another 18% experiencing resolution of nosebleed with a combination of oxymetazoline hydrochloride and silver nitrate cautery.7 Based on review of the literature, nasal compression and application of vasoconstrictors seemed to be low-resource interventions with minimal morbidity. Therefore, management centered around nasal compression and use of topical vasoconstrictors seemed appropriate for our nursing staff.
The in-service included information about the etiology and management of epistaxis. Particular emphasis was placed on addressing and debunking common misconceptions about nosebleed management. With regards to management, our presentation focused on the use of topical vasoconstrictors and firm pressure to the lower third of the nose for at least 5 minutes. Nasal packing and nasal cautery were presented as procedures that ENT would perform. After the in-service, questions from the nurses were answered as time permitted.
Testing and Outcomes
A pre-test was administered before each in-service. The pre-test components comprised a knowledge survey and a descriptive survey. The general epistaxis knowledge questions on the pre-test included the location of blood vessels most commonly responsible for nosebleeds, the ideal positioning of a patient during a nosebleed, the appropriate location to hold pressure during a nosebleed, and the appropriate duration to hold pressure during a nosebleed. The descriptive survey portion asked nurses to rate whether they felt “very comfortable,” “comfortable,” “uncomfortable,” or “very uncomfortable” managing nosebleeds. It also asked whether nurses thought they would be able to “always,” “usually,” “rarely,” or “never” stop nosebleeds on the floor. We collected demographic information, including gender identity, years of clinical experience, and primary clinical environment.
The post test asked the same questions as the pre-test and was administered immediately after the in-service in order to assess its impact. We also established an ongoing dialogue with our nursing colleagues to obtain feedback on the sessions.
Primary outcomes of interest were the difference in general epistaxis knowledge questions answered correctly between the pre-test and the post test; the difference in comfort level in managing epistaxis before and after the in-service; and the difference in confidence to stop nosebleeds before and after the in-service. A secondary outcome was determining the audience for the in-service. Specifically, we wanted to determine whether there were different outcomes based on clinical setting or years of clinical experience. If nurses in a certain clinical environment or beyond a certain experience level did not show significant improvement from pre-test to post test, we would not target them for the in-service. Another secondary outcome was determining optimal timing for delivery of the in-service. We wanted to determine if there was a nursing preference for delivering the in-service at mid-shift vs shift change.
Analysis
Statistical calculations were performed using Stata 15 (StataCorp LLC). A P value < .05 was considered to be statistically significant. Where applicable, 95% confidence intervals (CI) were calculated. T-test was used to determine whether there was a statistically significant difference between pre-test and post-test epistaxis knowledge question scores. T-test was also used to determine whether there was a statistically significant difference in test scores between nurses receiving the in-service at mid-shift vs shift change. Pearson chi-squared tests were used to determine if there was a statistically significant difference between pre-test and post-test perceptions of epistaxis management, and to investigate outcomes between different subsets of nurses.
SQUIRE 2.0 guidelines were utilized to provide a framework for this project and to structure the manuscript.8 This study met criteria for exemption from institutional review board approval.
Results
Fifty-one nurses took part in this project (Table). The majority of participants identified as female (88.24%), and just over half worked on medical floors (52.94%), with most of the remainder working in intensive care (25.49%) and surgical (15.69%) settings. There was a wide range of clinical experience, with 1.96% reporting 0 to 1 years of experience, 29.41% reporting 2 to 5 years, 23.53% reporting 5 to 10 years, 25.49% reporting 10 to 20 years, and 17.65% reporting more than 20 years.
There were unanswered questions on both the pre-test and post test. There was no consistently unanswered question. Omitted answers on the epistaxis knowledge questions were recorded as an “incorrect” answer. Omitted answers on the perception questions were considered null values and not considered in final analysis.
Primary Measures
General epistaxis knowledge (Figure, part A) improved from the pre-test, where out of 4 questions, the mean (SD) score was 1.74 (1.02) correct questions, to the post-test, where out of 4 questions, the mean score was 3.80 (0.40) correct questions. After participating in the in-service, nurses answered significantly more questions about epistaxis general knowledge correctly (mean difference, 2.07 [1.10]; 95% CI, 1.74-2.39; P < .001), and 80.43% of them got a perfect score on the epistaxis knowledge questions.
The second primary measure was the difference in comfort level in managing nosebleed. After participating in the in-service, nurses felt significantly more comfortable in managing nosebleeds (Figure, part B; P = .007), with 74.46% of nurses having an improved comfort level managing nosebleeds. Before the in-service, 12.76% of nurses felt “very comfortable” in managing nosebleeds vs more than three-quarters (76.59%) after the in-service. Of those who answered that they felt “comfortable” managing nosebleeds on the pre-test, 82.35% improved to feeling “very comfortable” in managing nosebleeds. Before the in-service, 14.89% of nurses felt “uncomfortable” or “very uncomfortable” in managing nosebleeds, and this decreased to 0 post intervention. After the in-service, 100.00% of nurses felt “comfortable” or “very comfortable” in managing nosebleeds.
After receiving the in-service, nurses felt significantly more confident in stopping nosebleeds (Figure, part C; P < .001), with 43.90% of them having an improvement in confidence in stopping epistaxis. Before the in-service, 7.31% of nurses felt that they would “always” be able to stop a nose-bleed, and this increased to 41.46% after the in-service. Of those who answered that they felt that they would “usually” be able to stop a nosebleed on the pre-test, 36.67% changed their answer to state that they would “always” be able to stop a nosebleed on the post test. Before the in-service, 19.51% of nurses felt that they would “rarely” or “never” be able to stop a nosebleed, and this decreased to 2.44% after the in-service.
Secondary Measures
All of the nurses who participated either “strongly agreed” or “agreed” that they learned something new from the in-service. However, to determine whether there was a population who would benefit most from the in-service, we stratified the data by years of clinical experience. There was no statistically significant difference in whether nurses with varying clinical experience learned something new (P = .148): 100% of nurses with 0-1 years of experience, 80.00% of nurses with 2-5 years of experience, 100% of nurses with 5-10 years of experience, 69.23% of nurses with 10-20 years of experience, and 100% of nurses with >20 years of experience “strongly agreed” that they learned something new from this in-service. There was no statistically significant difference on the post test compared to the pre-test in additional correct questions when stratified by clinical experience (P = .128). Second, when we stratified by clinical setting, we did not find a statistically significant difference in whether nurses in different clinical settings learned something new (P = .929): 88.89% of nurses in the medical setting, 87.50% of nurses in the surgical setting, and 84.62% of nurses in the intensive care setting “strongly agreed” that they learned something new from this presentation. On investigating additional questions correct on the post test compared to the pre-test, there was no statistically significant difference in additional correct questions when stratified by clinical setting (P = .446).
Optimal timing of the in-service was another important outcome. Initially, the in-service was administered at mid-shift, with 9 nurses participating at mid-shift, but our nursing colleagues gave unanimous feedback that this was a suboptimal time for delivery of an in-service. We changed the timing of the in-service to shift change; 42 nurses received the in-service at shift-change. There was no statistically significant difference in scores on the epistaxis knowledge questions between these two groups (P = .123). This indicated to us that changing the timing of the delivery resulted in similarly improved outcomes while having the added benefit of being preferred by our nursing colleagues.
Discussion
In undertaking this project, our primary aims were to improve epistaxis knowledge and perceived management in our nursing staff. Among our nursing staff, we were able to significantly increase epistaxis knowledge, improve comfort levels managing epistaxis, and improve confidence in successful epistaxis management. We also found that nurses of varying clinical experience and different clinical settings benefited equally from our intervention. Using quality improvement principles, we optimized our delivery. Our in-service focused on educating nurses to use epistaxis management techniques that were resource-efficient and low risk.
After participating in the in-service, nurses answered significantly more questions about epistaxis general knowledge correctly (Figure, part A; mean difference, 2.07 questions [1.10]; 95% CI, 1.74-2.39; P < .001), felt significantly more comfortable in managing nosebleeds (Figure, part B; P = .007), and felt significantly more confident in stopping nosebleeds (Figure, part C; P < .001). Based on these results, we successfully achieved our primary aims.
Our secondary aim was to determine the audience that would benefit the most from the in-service. All of the nurses who participated either “strongly agreed” or “agreed” that they learned something new from the in-service. There was no statistically significant difference in whether nurses of varying clinical experience learned something new (P = .148) or in additional correct questions when stratified by clinical experience (P =.128). Also, there was no statistically significant difference in whether nurses in different clinical settings learned something new (P = .929) or in additional correct questions when stratified by clinical setting (P = .446). These results indicated to us that all participants learned something new and that there was no specific target audience, but rather that all participants benefitted from our session.
Our nursing colleagues gave us feedback that the timing of the in-service during mid-shift was not ideal. It was difficult to gather nurses mid-shift due to pressing patient-care duties. Nurses also found it difficult to give their full attention at this time. Nurses, nurse educators, and nurse managers suggested that we conduct the in-service at shift change in order to capture a larger population and take advantage of time relatively free of clinical duties. Giving the in-service at a time with relatively fewer clinical responsibilities allowed for a more robust question-and-answer session. It also allowed our nursing colleagues to pay full attention to the in-service. There was no statistically significant difference in epistaxis general knowledge questions answered correctly; this indicates that the quality of the education session did not vary greatly. However, our nursing colleagues strongly preferred the in-service at shift change. By making this modification to our intervention, we were able to optimize our intervention.
The previously mentioned study in England reported that only 12% to 14% of their nursing staff got a perfect score on epistaxis knowledge questions. Prior to our study, there was no literature investigating the impact of an in-service on epistaxis knowledge. After our intervention, 80.43% of our nurses got a perfect score on the epistaxis knowledge questions. We believe that this is a fair comparison because our post-test questions were identical to the survey questions used in the previously mentioned study in England, with the addition of one question.3 Further, the findings of our study are consistent with other studies regarding the positive effect of in-service education on knowledge and attitudes surrounding clinical topics. Similar to the study in Ethiopia investigating nurses’ knowledge surrounding pain management, our study noted a significant improvement in nurses’ knowledge after participating in the in-service.4 Also, when comparing our study to the study performed in Connecticut investigating nurses’ confidence surrounding suicide precautions, we found a similar significant improvement in confidence in management after participating in the in-service.5
Given our reliance on a survey as a tool to collect information, our study was subject to nonresponse bias. For each main outcome question, there was a handful of nonresponders. While this likely indicated either overlooking a question or deferring to answer due to clinical inexperience or nonapplicable clinical role, it is possible that this may have represented a respondent who did not benefit from the in-service. Another source of possible bias is sampling bias. Attempts were made to capture a wide range of nurses at the in-service. However, if a nurse was not interested in the topic material, whether due to abundant clinical experience or disinterest, it is possible that they may not have attended. Additionally, the cohort was selected purely based on responses from nursing managers to the initial email. It is possible that nonresponding units may have benefitted differently from this in-service.
There were several limitations within our analysis. We did not collect data assessing the long-term retention of epistaxis knowledge and management techniques. It is possible that epistaxis knowledge, comfort in managing nosebleeds, and perceived confidence in stopping nosebleeds decreased back to baseline several months after the in-service. Ideally, we would have been able to collect this data to assess retention of the in-service information. Unfortunately, a significant number of nurses who initially participated in the project became lost to follow-up, making such data collection impossible. Additionally, there was no assessment of actual ability to stop nosebleeds before vs after this in-service. Perceived management of epistaxis vs actual management of epistaxis are 2 vastly different things. However, this data would have been difficult to collect, and it likely would not have been in the best interest of patients, especially before the in-service was administered. As an improvement to this project, we could have assessed how many nosebleeds nurses had seen and successfully stopped after the in-service. As previously mentioned, this was not possible due to losing a significant number of nurses to follow-up. Finally, we did not collect objective data on preference for administration of in-service at mid-shift vs shift change. We relied on subjective data from conversations with our colleagues. By collecting objective data, we could have supported this change to our intervention with data.
The primary challenge to sustainability for this intervention is nursing turnover. With each wave of departing nurses and new nursing hires, the difficulty of ensuring a consistent knowledge base and management standards within our nursing workforce became clearer. After optimizing our intervention, our solution was to provide a hospital-wide in-service, which was recorded and uploaded to an institution-wide in-service library. In this way, a nurse with the desire to learn about epistaxis management could access the material at any point in time. Another solution would have been to appoint champions for epistaxis management within each major department to deliver the epistaxis in-service to new hires and new rotators within the department. However, given the turnover witnessed in our study cohort, this may not be sustainable long term.
Conclusion
Epistaxis is a chief complaint that can present in many different clinical settings and situations. Therefore, the ability to stop epistaxis in a timely and effective fashion is valuable. Our study demonstrated that in-services can improve epistaxis knowledge and improve perceived epistaxis management. Ideally, this intervention will lead to improved patient care. Given that epistaxis is a ubiquitous issue, this study may benefit other institutions who want to improve care for patients with epistaxis.
Next steps for this intervention include utilizing in-services for epistaxis education at other institutions and collecting long-term data within our own institution. Collecting long-term data would allow us to assess the retention of epistaxis knowledge from our in-service.
Acknowledgments: The author thanks the nurse managers, nurse educators, and staff nurses involved in this project, as well as Dr. Louis Portugal for providing mentorship throughout this process and Dr. Dara Adams for assisting with statistical analysis.
Corresponding author: Avery Nelson, MD, University of Chicago Medical Center, 5841 S Maryland Ave, MC 1035, Chicago, IL 60637; avery.nelson@uchospitals.edu
Disclosures: None reported.
1. Pallin DJ, Chng Y-M, McKay MP, et al. Epidemiology of epistaxis in US emergency departments, 1992 to 2001. Ann Emerg Med. 2005;46(1):77-81. doi:10.1016/j.annemergmed.2004.12.014
2. Walker TWM, Macfarlane TV, McGarry GW. The epidemiology and chronobiology of epistaxis: An investigation of Scottish hospital admissions 1995-2004. Clin Otolaryngol. 2007;32(5):361-365. doi:10.1111/j.1749-4486.2007.01530.x
3. Hakim N, Mummadi SM, Jolly K, et al. Nurse-led epistaxis management within the emergency department. Br J Nurs. 2018;27(1):41-46. doi:10.12968/bjon.2018.27.1.41
4. Germossa GN, Sjetne IS, Hellesø R. The impact of an in-service educational program on nurses’ knowledge and attitudes regarding pain management in an Ethiopian University Hospital. Front Public Health. 2018;6:229. doi:10.3389/fpubh.2018.00229
5. Manister NN, Murray S, Burke JM, Finegan M, McKiernan ME. Effectiveness of nursing education to prevent inpatient suicide. J Contin Educ Nurs. 2017;48(9):413-419. doi:10.3928/00220124-20170816-07
6. Tunkel DE, Anne S, Payne SC, et al. Clinical practice guideline: nosebleed (epistaxis) executive summary. Otolaryngol Head Neck Surg. 2020;162(1):S1-S38. doi:10.1177/0194599819890327
7. Krempl GA, Noorily AD. Use of oxymetazoline in the management of epistaxis. Ann Otol Rhinol Laryngol. 1995;104(9 Part 1):704-706. doi:10.1177/000348949510400906
8. Ogrinc G, Davies L, Goodman D, et al. SQUIRE 2.0—standards for quality improvement reporting excellence—revised publication guidelines from a detailed consensus process. J Am Coll Surg. 2016;222(3):317-323. doi:10.1016/j.jamcollsurg.2015.07.456
Evaluation of the Empower Veterans Program for Military Veterans With Chronic Pain
From Neurology/Chronic Pain Management Services, Department of Veterans Affairs (VA) Maryland Health Care System, Baltimore VA Medical Center, Baltimore, MD (Dr. Uche), and School of Nursing, Washburn University, Topeka, KS (Drs. Jamison and Waugh).
Abstract
Objective: The purpose of this quality improvement project was to abstract and analyze previously collected data from veterans with high-impact chronic pain who attended the Empower Veterans Program (EVP) offered by a Veterans Administration facility in the northeastern United States.
Methods: This quality improvement project used data collected from veterans with chronic pain who completed the veterans health care facility’s EVP between August 2017 and August 2019. Pre- and post-intervention data on pain intensity, pain interference, quality of life, and pain catastrophizing were compared using paired t-tests.
Results: Although data were abstracted from 115 patients, the final sample included
Conclusion: Veterans with chronic high-impact noncancer pain who completed the EVP had reduced pain intensity, pain interference, pain catastrophizing as well as improved quality of life and satisfaction with their health.
Keywords: musculoskeletal pain, Veterans Affairs, complementary and integrative health, acceptance and commitment therapy, mind-body therapies, whole health, multidisciplinary pain management.
More than 100 million American adults suffer from chronic pain; costs associated with managing chronic pain are approximately $635 billion
One such program is the Empower Veterans Program (EVP). Originally developed at the Atlanta Veterans Affairs Health Care System, the EVP is a CIH modality based on the biopsychosocial model of pain developed by psychiatrist George Engel in 1977.3 The biopsychosocial model of pain recognizes that pain is a complex, multidimensional, biopsychosocial experience. Under this model, the mind and body work in unison as interconnected entities. Because the model acknowledges biological, psychological, and social components of pain and illness,4 treatment focuses on all aspects of a person’s health, life, and relationships.
The EVP fits into the VHA Pain Management Stepped Care Model and is an adjunctive complement for that model.5-7 The EVP complements care at the first step, where patient/family provide self-care and where care is provided by patient-aligned primary care teams, at the second step, which includes secondary consultation with multidisciplinary pain medicine specialty teams and other specialists, and at the third step, with the addition of tertiary interdisciplinary pain centers.
The VA Maryland Health Care System (VAMHCS) implemented the EVP as part of a quality improvement project for the management of chronic pain. The objectives of the program were to reduce pain intensity, pain catastrophizing, and pain interference, as well as improve functionality and quality of life among veterans with chronic high-impact noncancer pain. More than 2 years after the program was implemented, collected data had not been analyzed. The purpose of this quality improvement project was to abstract and analyze the previously collected data from veterans with high-impact chronic pain who attended an EVP offered by the VAMHCS. The results of the data analysis were used to inform decisions regarding the future of the program.
Methods
This quality improvement project used the Plan-Do-Study-Act (PDSA) process.8 The first 2 phases of the PDSA cycle (Plan and Do) were completed by a team of VA employees from the VAMHCS, who donated their time to establish and implement the program at the project site. This team consisted of psychologists, a physical therapist, a social worker, and a chaplain, and included support from medical administrative staff. This team planned and implemented the EVP at the VA facility based on the model developed at the Atlanta VA Health Care System. During the “Do” phase, the team collected data on pain intensity, pain interference, quality of life, and pain negative cognition (catastrophizing) before the intervention and post intervention. They also collected data on program outcome (patient treatment satisfaction) post intervention. Because these employees did not have time to retrieve and analyze the data, they welcomed the opportunity to have the data analyzed by the investigators during the Study phase of the PDSA cycle. Based on the results of the analysis, recommendations for program changes were made during the Act phase of the cycle.
Intervention
The EVP was developed as a 10-week (30 hours) interdisciplinary CIH approach that coached veterans with chronic pain to live fuller lives based on their individual values and what matters to them. EVP is the “What Else” management modality for the 5% of veterans with high-impact chronic pain.9 The EVP provided functional restoration through its components of whole health, mindfulness training, coaching calls, acceptance and commitment therapy, and mindful movement. It used the Wheel of Health with the 4 key components of me, self-care, professional care, and community.10,11
Veterans who had a diagnosis of chronic nonmalignant pain for 3 months or more and who agreed to participate in the EVP at this facility attended 3-hour classes every Tuesday with a cohort of 8 to 12 peers and engaged in one-on-one coaching with interdisciplinary team members. During the class sessions, veterans were coached to understand and accept their pain and commit to maintaining function despite their pain. Mindful movement by the physical therapist emphasized the pivotal place of exercise in pain management. The therapist used the mantra “Motion is Lotion.”9 The guiding principle of the EVP was that small incremental changes can have a big impact on the individual’s whole life. Emphasis was placed on increasing self-efficacy and mindful awareness for veterans with high-impact pain by giving them “Skills before Pills.”9
Outcome Measures
Outcome measures included the Numerical Pain Rating Scale (NPRS), the Multidimensional Pain Inventory (MPI), the World Health Organization Quality of Life assessment (WHOQOL-BREF), the Pain Catastrophizing Scale (PCS), and the Pain Treatment Satisfaction Scale (PTSS). Cronbach alpha coefficients were calculated to assess internal consistency reliability of these measures in the sample of veterans who completed the EVP.
NPRS. The NPRS is ubiquitous as a screening tool in many health care environments and its use is mandated by the VA health care system.12 The choice of the NPRS as the tool for pain screening in the VA health care system was based on a large body of research that supports the reliability and validity of the NPRS as a single index of pain intensity or severity. Studies suggest that the NPRS is valid for use in the assessment of acute, cancer, or chronic nonmalignant pain and in varied clinical settings.13 The NPRS has 4 items, each on a scale of 0 to 10. For the purpose of this project, only 3 items were used. The 3 items assessed the worst pain, usual pain, and the current pain (right now). The higher the score, the higher the pain intensity. Cronbach alpha coefficients on the NPRS obtained from the current sample of veterans were 0.85 on both pre- and postintervention assessments.
MPI. The MPI is an easily accessible, reliable, and valid self-report questionnaire that measures the impact of pain on an individual’s life, quality of social support, and general activity.14 This instrument is a short version of the West Haven-Yale MPI.15 The MPI contains 9 items rated on a scale from 0 to 6. The higher the score, the greater pain interference a person is experiencing. The MPI produces reliable, valid information for diagnostic purposes and for therapy outcome studies.16 The MPI had a Cronbach alpha of 0.90 on pre-intervention and 0.92 on postintervention assessments in the current sample.
WHOQOL-BREF. The WHOQOL-BREF is a measure of quality of life and is an abbreviated version of the WHOQOL-100. Quality of life is defined by the World Health Organization17 “as an individuals’ perception of their position in life in the context of the culture and value systems in which they live and in relation to their goals, expectations, standards and concerns.” The WHOQOL-BREF contains 26 items. The first 2 items were examined separately; the first item asks individuals to rate their overall quality of life and the second asks individuals how satisfied they are with their health. The remaining 24 items were used to calculate the following 4 domain scores: physical health, psychological health, social relationship, and environment.18 Each item is measured on a scale of 1 to 5. Higher scores denote higher or better quality of life. Domain scores have demonstrated good reliability and validity.19-21 Cronbach alpha coefficients for the domain subscales ranged from 0.63 to 0.84 in the current sample, with the lowest alphas for the 3-item Social Relationships Domain.
PCS. The PCS is a widely used measure of catastrophic thinking related to pain. Catastrophizing has been conceived by Sullivan and colleagues as “an exaggerated negative mental set brought to bear during actual or anticipated painful experience.”22 The PCS provides a total score and scores for the following subscales: rumination, magnification, and helplessness.23 It has been used in a variety of chronic pain populations and has demonstrated good reliability and validity in clinical as well as nonclinical samples.24-26 The PCS has 13 items rated on a scale of 0 to 4. Higher scores mean greater negative pain cognition (catastrophizing). In the current sample, the PCS total scale had a Cronbach alpha coefficient of 0.95 and 0.94 on the 2 assessments. The coefficients for the subscales ranged from 0.81 to 0.90.
PTSS. The PTSS is a 5-item tool that measures patient satisfaction with pain treatment. It includes items that address overall satisfaction, staff warmth, staff skill level, ease of scheduling appointments, and recommendation of the program to other veterans. It was derived from the post-treatment version of The Pain Outcome Questionnaire-VA and has demonstrated reliability and validity.27 The questions are scaled from 0 to 10. High scores on the PTSS denote high patient satisfaction with the EVP. The Cronbach alpha coefficient on the PTSS obtained from the current sample was 0.80.
Data Gathering and Analysis
Prior to starting the Study phase, Washburn University’s Institutional Review Board (IRB) and the VA IRB approved the project. The VA IRB, through its affiliate, gave a Not Human Research Determination and granted a waiver of informed consent and the Health Insurance Portability and Accountability Act authorization. The VA facility’s Research and Development department also approved the quality improvement project.
Once these approvals were obtained, the Study phase began with the abstraction of retrospective data obtained from veterans who participated in the VA health care facility’s EVP between
Veterans who completed the program were compared to veterans who did not complete the program on age, gender, and baseline measures. The investigators used independent samples t-tests to compare completers and noncompleters on age, pain intensity, pain interference, quality of life, and pain catastrophizing. They used the chi-square test of independence to analyze the association between gender and program completion.
Data were included in the pre- and postintervention analysis if the veteran completed the NPRS, MPI, WHOQOL-BREF, and PCS pre and post intervention. This became an important eligibility requirement as some of the tools/measures were changed towards the end of the review period in 2019. Pre- and postintervention data on pain intensity, pain interference, quality of life, pain catastrophizing, and patient satisfaction were compared using paired samples t-test at .004 level of significance based on the Bonferroni correction.28 Data on patient satisfaction with pain treatment were collected at program completion (week 8 or 10) and were analyzed using descriptive statistics.
Effect sizes (Cohen’s d) were calculated to determine the substantive significance or magnitude of the mean differences in scores. Effect sizes (expressed as absolute values of Cohen’s d) were calculated as the mean difference divided by the standard deviation. Values of 0.2 were considered a small effect size, 0.5 a medium effect size, and 0.8 a large effect size.29
Results
Data were abstracted for 115 veterans who started the EVP. Of these, 48 left the program, leaving 67 veterans (58%) who completed the program. Completers and noncompleters were similar in age, gender, and baseline measures (Table 1). Fifty-three (79%) completers and 35 (73%) noncompleters were male. A chi-square test of independence showed no significant association between gender and program completion (χ21 [N = 115] = .595, P = .440).
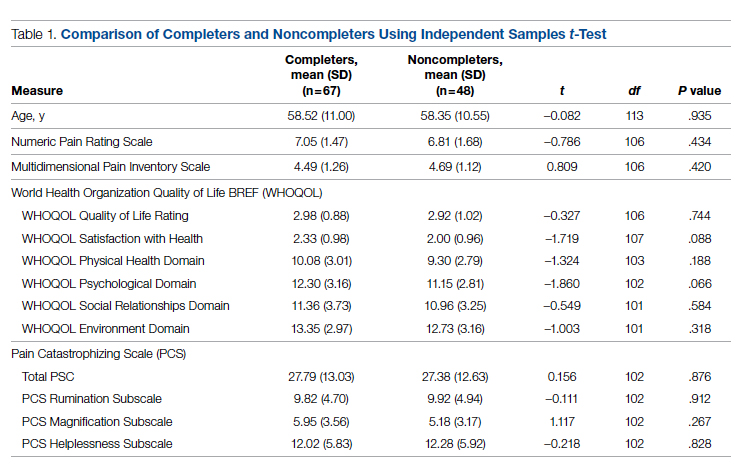
Comparison of pre-and postintervention mean scale scores resulted in statistically significant
Analysis of data obtained using the PTSS yielded high mean scores for items that focused on patient satisfaction with treatment (Table 3). Scaled statistics yielded a mean (SD) of 46.95 (4.40). These results denoted overall patient satisfaction with the EVP.
Discussion
The purpose of this quality improvement project was to abstract and analyze previously collected data from veterans with high-impact chronic pain who attended the EVP. Comparison of pre-intervention and postintervention data obtained from 67 veterans who completed the program revealed improvements in pain intensity, pain interference, negative cognition (catastrophizing), and quality of life. The differences were statistically significant and clinically meaningful, with medium and large effect sizes. In addition, veterans reported high satisfaction with the EVP.
The EVP includes CIH approaches that have demonstrated effectiveness among veterans and other populations with chronic pain. A wealth of studies, for example, support the effectiveness of CIH approaches among veterans.30-34 Other studies focus on specific CIH approaches that are components of the EVP. Evidence supports, for example, the efficacy of mindfulness-based stress reduction,35-39 acceptance and commitment therapy,40-43 brief peer support intervention,44 and interdisciplinary biopsychosocial rehabilitation.45,46
While empirical evidence supports components of the EVP, only one study focused on the outcomes of the Atlanta VA EVP among veterans with chronic pain. Results of a qualitative study conducted by Penney and Haro47 described the experience of veterans with the EVP. Those veterans reported adopting new self-care or lifestyle practices for pain management and health, accepting pain, being better able to adjust and set boundaries, feeling more in control, participating in life, and changing their medication use.
The mean baseline scores from the current sample were similar to samples of patients with chronic pain in other studies (NPRS,48 MPI,48 and PCS48-51). After converting scores on the WHOQOL-BREF from those that ranged from 4 to 20 to those that ranged from 0 to 100,18 the scores from the current sample were similar to those of other studies of patients with chronic pain.48,52,53Several strengths of the project should be noted. Data were collected using well established measurement tools that had previously demonstrated reliability and validity. All the tools used in data collection demonstrated good internal consistency reliabilities in the current sample of veterans. Weaknesses of the project include the use of a convenience sample of veterans and small sample size. Data were not available on the number of veterans who were offered participation or on how many veterans declined enrollment. The sample of veterans who chose to participate in the EVP may or may not have been representative of the population of veterans with high-impact chronic pain. As a pre- and postintervention design with no comparison group, the results are subject to multiple threats to internal validity, including the Hawthorne effect, maturation in the form of healing, and attrition. Reasons for leaving the program had not been recorded, so the investigators had no way of knowing factors that may have contributed to attrition. Also, data on when veterans left the program were unavailable. Research is needed with a control group to reduce the effect of confounding variables on the outcome measures. This project used data collected at a single VA facility, which limits its generalizability.
While completers and noncompleters of the EVP were similar on age, gender, and baseline measures, there may have been unidentified characteristics that influenced program completion. The investigators noticed the presence of more missing data among noncompleters compared to completers on the pre-intervention PCS; thus, noncompleters may have scored lower than completers on this instrument simply because there were more individual items that were unanswered/missing among this group of noncompleters.
Data were analyzed using a limited number of outcome measures that had previously been collected. Other outcome measures might include whether EVP participants reduced their use of medications, clinical resources, and personnel. Future projects, for example, could determine whether the EVP is effective in reducing opioid analgesic medication use and decreasing primary care and emergency department visits. Cost-benefit analyses could be completed to determine whether EVP is associated with financial savings.
Because no follow-up assessments were made to determine whether improvements were maintained over time, the project focus was limited to an evaluation of the short-term changes in the outcome measures. Future projects could include a follow-up assessment of the veterans 1- or 2-years post completion of the EVP.
Data for the project were collected prior to the COVID-19 pandemic, when the EVP was implemented through face-to-face meetings with participants and their peers. It is not clear how changes to the delivery of the program (such as offering it through telehealth) might impact veterans’ satisfaction with the program, willingness to complete it, and other variables of interest.
The results of this project were made available to stakeholders with recommendations for program expansion both at the current location and at other VA facilities, including the recommendation to hire additional personnel that would implement the program. As the VA network of facilities expand the EVP program and adapt it for telehealth delivery, the investigators recommended a similar analysis of data be performed following telehealth delivery. If delivery through telehealth is shown to improve outcome measures, the EVP could provide pain management treatment options for patients challenged by transportation barriers, including rural veterans.
Conclusion
This quality improvement project provided evidence of improvement in measures of pain severity, pain interference, negative cognition (catastrophizing), quality of life, and patient treatment satisfaction among veterans with chronic high-impact pain. Findings have been well received by the northeastern VA as well as the Veterans Integrated Systems Network 5. The results of the analyses were used to inform decisions regarding the future of the program.
Disclaimer: This material is the result of work supported with resources and the use of facilities at the VA Maryland Health Care System, Baltimore, Maryland. The views expressed are those of the authors and do not necessarily represent the views of the Department of Veterans Affairs or the United States Government.
Acknowledgments: The authors thank Dr. Arianna Perra, the recent past coordinator of the Empower Veterans Program (EVP), who provided initial insights and support that motivated the decision to evaluate the program. We also thank the veterans and VA EVP clinicians who contributed data for the evaluation, and Dr. Michael Saenger (Director, TelePain-EVP: EVP) and Dr. Robert Lavin for their ongoing support, care, and concern for veteran patients. We also thank Dr. Beverly Bradley and the neurology service administrative team for their guidance in the process of obtaining necessary VA approvals for this project.
Corresponding author: Jessica U. Uche, DNP, CRNP-Family; jessica.uche@va.gov
doi:10.12788/jcom.0089
1. Institute of Medicine (US) Committee on Advancing Pain Research, Care, and Education. Relieving Pain in America: A Blueprint for Transforming Prevention, Care, Education, and Research. The National Academies Press (US); 2011.
2. Bastian LA, Heapy A, Becker WC, et al. Understanding pain and pain treatment for veterans: responding to the federal pain research strategy. Pain Med. 2018;19(suppl_1); S1-S4. doi:10.1093/pm/pny1433
3. Engle GL. The need for a new medical model: a challenge for biomedicine. Science. 1977;196(4286):129-136. doi:10.1126/science.847460
4. Bevers K, Watts L, Kishino ND, et al. The biopsychosocial model of the assessment, prevention, and treatment of chronic pain. US Neurology. 2016;12(2):98-104. doi:10.17925/USN.2016.12.02.98
5. Bair MJ, Ang D, Wu J, et al. Evaluation of stepped care for chronic pain (ESCAPE) in veterans of the Iraq and Afghanistan conflicts: A randomized clinical trial. JAMA Intern Med. 2015;175(5):682-689. doi:10.1001/jamainternmed.2015.97
6. Veterans Health Administration. Pain Management. VHA Directive 2009-053. Washington, DC: Department of Veterans Affairs; 2009.https://www.va.gov/painmanagement/docs/vha09paindirective.pdf
7. Moore BA, Anderson D, Dorflinger L, et al. Stepped care model for pain management and quality of pain care in long-term opioid therapy. J Rehabil Res Dev. 2016;53(1):137-146. doi:10.1682/JRRD.2014.10.0254
8. Institute for Healthcare Improvement. How to improve. Accessed March 14, 2022. http://www.ihi.org/resources/Pages/HowtoImprove/default.aspx
9. Saenger M. Empower Veterans Program. APA PCSS-O Webinars. Evidence CAM LBP 2016.
10. Gaudet T, Kligler B. Whole health in the whole system of the Veterans Administration: How will we know we have reached this future state? J Altern Complement Med. 2019;25(S1):S7-S11. doi:10.1089/acm.2018.29061.gau
11. Veterans Health Administration. Whole health: Circle of health. Updated April 1, 2021. Accessed March 14, 2022. https://www.va.gov/WHOLEHEALTH/circle-of-health/index.asp
12. Krebs EE, Carey TS, Weinberger M. Accuracy of the pain numeric rating scale as a screening test in primary care. J Gen Intern Med. 2007;22(10):1453-1458. doi:10.1007/s11606-007-0321-2
13. Veterans Health Administration. Pain as the 5th vital sign toolkit. October 2000, revised edition. Geriatrics and Extended Care Strategic Healthcare Group, National Pain Management Coordinating Committee. https://www.va.gov/PAINMANAGEMENT/docs/Pain_As_the_5th_Vital_Sign_Toolkit.pdf
14. McKillop JM, Nielson WR. Improving the usefulness of the Multidimensional Pain Inventory. Pain Res Manag. 2011;16(4):239-244. doi:10.1155/2011/873424
15. Kerns RD, Turk DC, Rudy TE. The West Haven-Yale Multidimensional Pain Inventory (WHYMPI). Pain.1985;23(4):345-356. doi:10.1016/0304-3959(85)90004-1
16. Verra ML, Angst F, Staal JB, et al. Reliability of the multidimensional pain inventory and stability of the MPI classification system in chronic back pain. BMC Musculoskelet Disord. 2012;13:155. doi:10.1186/1471-2474-13-155
17. Development of the World Health Organization WHOQOL-BREF quality of life assessment. The WHOQOL Group. Psychol Med. 1998;28(3):551-558. doi:10.1017/s0033291798006667
18. World Health Organization. Division of Mental Health. WHOQOL-BREF: introduction, administration, scoring and generic version of the assessment: field trial version, December 1996. Accessed March 14, 2022. https://apps.who.int/iris/handle/10665/63529
19. Guay S, Fortin C, Fikretoglu D, et al. Validation of the WHOQOL-BREF in a sample of male treatment-seeking veterans. Mil Psychol. 2015;27(2):85-92. doi:10.1037/mil0000065
20. Skevington S, Lotfy M, O’Connell K, WHOQOL Group. The World Health Organization’s WHOQOL-BREF quality of life assessment: Psychometric properties and results of the international field trial. A Report from the WHOQOL Group. Qual Life Res. 2004;13(2):299-310. doi:10.1023/B:QURE.0000018486.91360.00
21. Stratton KJ, Bender MC, Cameron JJ, Pickett TC. Development and evaluation of a behavioral pain management treatment program in a Veterans Affairs Medical Center. Mil Med. 2015;180(3):263-268. doi:10.7205/MILMED-D-14-00281.
22. Sullivan MJ, Thorn B, Haythornthwaite JA, et al. Theoretical perspectives on the relation between catastrophizing and pain. Clin J Pain. 2001;17(1):52-64. doi:10.1097/00002508-200103000-00008
23. Sullivan JL. The Pain Catastrophizing Scale: User manual. Accessed March 14, 2022. https://studylib.net/doc/8330191/the-pain-catastrophizing-scale---dr.-michael-sullivan
24. Darnall BD, Sturgeon JA, Cook KF, et al. Development and validation of a daily pain catastrophizing scale. J Pain. 2017;18(9):1139-1149. doi:10.1016/j.jpain.2017.05.003
25. Osman A, Barrios FX, Kopper BA, et al. Factor structure, reliability, and validity of the Pain Catastrophizing Scale. J Behav Med. 1997;20(6):589-605. doi:10.1023/a:1025570508954
26. Sullivan MJL, Bishop S, Pivik J. The Pain Catastrophizing Scale: development and validation. Psychol Assessment. 1995;7(4):524-532. doi:10.1037/1040-3590.7.4.524
27. Walker R, Clark M, Gironda R. Psychometric characteristics of the Pain Treatment Satisfaction Scale. J Pain. 2015;6(3Suppl.):S76.
28. Emerson RW. Bonferroni correction and type I error. J Vis Impair Blind. 2020;114(1):77-78. doi:10.1177/0145482X20901378
29. Cohen J. Statistical power analysis for the behavioral sciences. 2nd ed. Routledge; 1988. doi:10.4324/9780203771587
30. Craner JR, Lake ES, Bancroft KA, George LL. Treatment outcomes and mechanisms for an ACT-based 10-week interdisciplinary chronic pain rehabilitation program. Pain Pract. 2020;20(1):44-54. doi:10.1111/papr.12824
31. Han L, Goulet JL, Skanderson M, et al. Evaluation of complementary and integrative health approaches among US veterans with musculoskeletal pain using propensity score methods. Pain Med. 2019;20(1):90-102. doi:10.1093/pm/pny027
32. Herman PM, Yuan AH, Cefalu MS, et al. The use of complementary and integrative health approaches for chronic musculoskeletal pain in younger US veterans: an economic evaluation. PLoS One. 2019;14(6):e0217831. doi:10.1371/journal.pone.0217831
33. National Academies of Sciences, Engineering, and Medicine; Health and Medicine Division; Board on Global Health; Board on Health Sciences Policy; Global Forum on Innovation in Health Professional Education; Forum on Neuroscience and Nervous System Disorders; Stroud C, Posey Norris SM, Bain L, eds. The Role of Nonpharmacological Approaches to Pain Management: Proceedings of a Workshop. National Academies Press (US); April 12, 2019.
34. Richmond H, Hall AM, Copsey B, et al. The effectiveness of cognitive behavioural treatment for non-specific low back pain: a systematic review and meta-analysis. PLoS One. 2015;10(8):e0134192. doi:10.1371/journal.pone.0134192

35. Kearney DJ, Simpson TL, Malte CA, et al. Mindfulness-based stress reduction in addition to usual care is associated with improvements in pain, fatigue, and cognitive failures among veterans with Gulf War illness. Am J Med. 2016;129(2):204-214. doi:10.1016/j.amjmed.2015.09.015
36. Khoo E, Small R, Cheng W, et al. Comparative evaluation of group-based mindfulness-based stress reduction and cognitive behavioral therapy for the treatment and management of chronic pain: a systematic review and network meta-analysis. Evid Based Ment Health. 2019;22(1):26-35. doi:10.1136/ebmental-2018-300062
37. Khusid MA, Vythilingam M. The emerging role of mindfulness meditation as effective self-management strategy, Part 2: clinical implications for chronic pain, substance misuse, and insomnia. Mil Med. 2016;181(9):969-975. doi:10.7205/MILMED-D-14-00678
38. la Cour P, Petersen M. Effects of mindfulness meditation on chronic pain: A randomized controlled trial. Pain Med. 2015;16(4):641-652. doi:10.1111/pme.12605
39. Zou L, Zhang Y, Yang L, et al. Are mindful exercises safe and beneficial for treating chronic lower back pain? A systematic review and meta-analysis of randomized controlled trials. J Clin Med. 2019;8(5):628. doi:10.3390/jcm8050628
40. Hughes LS, Clark J, Colclough JA, et al. Acceptance and commitment therapy (ACT) for chronic pain: a systematic review and meta-analyses. Clin J Pain. 2017;33(6):552-568. doi:10.1097/AJP.0000000000000425
41. Kemani MK, Olsson GL, Lekander M, et al. Efficacy and cost-effectiveness of acceptance and commitment therapy and applied relaxation for longstanding pain: a randomized controlled trial. Clin J Pain. 2015;31(11):1004-1016. doi:10.1097/AJP.0000000000000203
42. Scott W, Daly A, Yu L, McCracken LM. Treatment of chronic pain for adults 65 and over: analyses of outcomes and changes in psychological flexibility following interdisciplinary acceptance and commitment therapy (ACT). Pain Med. 2017;18(2):252. doi:10.1093/pm/pnw073
43. Veehof MM, Trompetter HR, Bohlmeijer ET, Schreurs KMG. Acceptance- and mindfulness-based interventions for the treatment of chronic pain: a meta-analytic review. Cogn Behav Ther. 2016;45(1):5-31. doi:10.1080/16506073.2015.1098724
44. Matthias MS, McGuire AB, Kukla M, et al. A brief peer support intervention for veterans with chronic musculoskeletal pain: a pilot study of feasibility and effectiveness. Pain Med. 2015;16(1):81-87. doi:10.1111/pme.12571
45. Anamkath NS, Palyo SA, Jacobs SC, et al. An interdisciplinary pain rehabilitation program for veterans with chronic pain: description and initial evaluation of outcomes. Pain Res Manag. 2018;2018(3941682):1-9. doi:10.1155/2018/3941682
46. Kamper SJ, Apeldoorn AT, Chiarotto A, et al. Multidisciplinary biopsychosocial rehabilitation for chronic low back pain. Cochrane Database Syst Rev. 2014;9: CD000963. doi:10.1002/14651858.CD000963.pub3
47. Penney LS, Haro E. Qualitative evaluation of an interdisciplinary chronic pain intervention: Outcomes and barriers and facilitators to ongoing pain management. J Pain Res. 2019;12:865-878. doi:10.2147/JPR.S185652
48. Murphy JL, Cordova MJ, Dedert EA. Cognitive behavioral therapy for chronic pain in veterans; Evidence for clinical effectiveness in a model program. Psychol Serv. 2022;19(1):95-102. doi:10.1037/ser0000506
49. Katz L, Patterson L, Zacharias R. Evaluation of an interdisciplinary chronic pain program and predictors of readiness for change. Can J Pain. 2019;3(1):70-78. doi:10.1080/24740527.2019.1582296
50. Majumder SMM, Ahmed S, Shazzad N, et al. Translation, cross-cultural adaptation and validation of the Pain Catastrophizing Scale (PCS) into Bengali I patients with chronic non-malignant musculoskeletal pain. Int J Rheum Dis. 2020;23:1481-1487. doi:10.1111/1756-185X.13954
51. Margiotta F, Hannigan A, Imran A, et al. Pain, perceived injustice, and pain catastrophizing in chronic pain patients in Ireland. Pain Pract. 2016;17(5):663-668. doi:10.1111/papr.12
52. Bras M, Milunovic V, Boban M, et al. Quality of live in Croatian Homeland war (1991-1995) veterans who suffer from post-traumatic stress disorder and chronic pain. Health Qual Life Out. 2011;9:56. doi:10.1186/1477-7525-9-56
53. Liu C-H, Kung Y-Y, Lin C-L, et al. Therapeutic efficacy and the impact of the “dose” effect of acupuncture to treat sciatica: A randomized controlled pilot study. J Pain Res. 2019;12:3511-3520. doi:10.2147/JPR.S210672
From Neurology/Chronic Pain Management Services, Department of Veterans Affairs (VA) Maryland Health Care System, Baltimore VA Medical Center, Baltimore, MD (Dr. Uche), and School of Nursing, Washburn University, Topeka, KS (Drs. Jamison and Waugh).
Abstract
Objective: The purpose of this quality improvement project was to abstract and analyze previously collected data from veterans with high-impact chronic pain who attended the Empower Veterans Program (EVP) offered by a Veterans Administration facility in the northeastern United States.
Methods: This quality improvement project used data collected from veterans with chronic pain who completed the veterans health care facility’s EVP between August 2017 and August 2019. Pre- and post-intervention data on pain intensity, pain interference, quality of life, and pain catastrophizing were compared using paired t-tests.
Results: Although data were abstracted from 115 patients, the final sample included
Conclusion: Veterans with chronic high-impact noncancer pain who completed the EVP had reduced pain intensity, pain interference, pain catastrophizing as well as improved quality of life and satisfaction with their health.
Keywords: musculoskeletal pain, Veterans Affairs, complementary and integrative health, acceptance and commitment therapy, mind-body therapies, whole health, multidisciplinary pain management.
More than 100 million American adults suffer from chronic pain; costs associated with managing chronic pain are approximately $635 billion
One such program is the Empower Veterans Program (EVP). Originally developed at the Atlanta Veterans Affairs Health Care System, the EVP is a CIH modality based on the biopsychosocial model of pain developed by psychiatrist George Engel in 1977.3 The biopsychosocial model of pain recognizes that pain is a complex, multidimensional, biopsychosocial experience. Under this model, the mind and body work in unison as interconnected entities. Because the model acknowledges biological, psychological, and social components of pain and illness,4 treatment focuses on all aspects of a person’s health, life, and relationships.
The EVP fits into the VHA Pain Management Stepped Care Model and is an adjunctive complement for that model.5-7 The EVP complements care at the first step, where patient/family provide self-care and where care is provided by patient-aligned primary care teams, at the second step, which includes secondary consultation with multidisciplinary pain medicine specialty teams and other specialists, and at the third step, with the addition of tertiary interdisciplinary pain centers.
The VA Maryland Health Care System (VAMHCS) implemented the EVP as part of a quality improvement project for the management of chronic pain. The objectives of the program were to reduce pain intensity, pain catastrophizing, and pain interference, as well as improve functionality and quality of life among veterans with chronic high-impact noncancer pain. More than 2 years after the program was implemented, collected data had not been analyzed. The purpose of this quality improvement project was to abstract and analyze the previously collected data from veterans with high-impact chronic pain who attended an EVP offered by the VAMHCS. The results of the data analysis were used to inform decisions regarding the future of the program.
Methods
This quality improvement project used the Plan-Do-Study-Act (PDSA) process.8 The first 2 phases of the PDSA cycle (Plan and Do) were completed by a team of VA employees from the VAMHCS, who donated their time to establish and implement the program at the project site. This team consisted of psychologists, a physical therapist, a social worker, and a chaplain, and included support from medical administrative staff. This team planned and implemented the EVP at the VA facility based on the model developed at the Atlanta VA Health Care System. During the “Do” phase, the team collected data on pain intensity, pain interference, quality of life, and pain negative cognition (catastrophizing) before the intervention and post intervention. They also collected data on program outcome (patient treatment satisfaction) post intervention. Because these employees did not have time to retrieve and analyze the data, they welcomed the opportunity to have the data analyzed by the investigators during the Study phase of the PDSA cycle. Based on the results of the analysis, recommendations for program changes were made during the Act phase of the cycle.
Intervention
The EVP was developed as a 10-week (30 hours) interdisciplinary CIH approach that coached veterans with chronic pain to live fuller lives based on their individual values and what matters to them. EVP is the “What Else” management modality for the 5% of veterans with high-impact chronic pain.9 The EVP provided functional restoration through its components of whole health, mindfulness training, coaching calls, acceptance and commitment therapy, and mindful movement. It used the Wheel of Health with the 4 key components of me, self-care, professional care, and community.10,11
Veterans who had a diagnosis of chronic nonmalignant pain for 3 months or more and who agreed to participate in the EVP at this facility attended 3-hour classes every Tuesday with a cohort of 8 to 12 peers and engaged in one-on-one coaching with interdisciplinary team members. During the class sessions, veterans were coached to understand and accept their pain and commit to maintaining function despite their pain. Mindful movement by the physical therapist emphasized the pivotal place of exercise in pain management. The therapist used the mantra “Motion is Lotion.”9 The guiding principle of the EVP was that small incremental changes can have a big impact on the individual’s whole life. Emphasis was placed on increasing self-efficacy and mindful awareness for veterans with high-impact pain by giving them “Skills before Pills.”9
Outcome Measures
Outcome measures included the Numerical Pain Rating Scale (NPRS), the Multidimensional Pain Inventory (MPI), the World Health Organization Quality of Life assessment (WHOQOL-BREF), the Pain Catastrophizing Scale (PCS), and the Pain Treatment Satisfaction Scale (PTSS). Cronbach alpha coefficients were calculated to assess internal consistency reliability of these measures in the sample of veterans who completed the EVP.
NPRS. The NPRS is ubiquitous as a screening tool in many health care environments and its use is mandated by the VA health care system.12 The choice of the NPRS as the tool for pain screening in the VA health care system was based on a large body of research that supports the reliability and validity of the NPRS as a single index of pain intensity or severity. Studies suggest that the NPRS is valid for use in the assessment of acute, cancer, or chronic nonmalignant pain and in varied clinical settings.13 The NPRS has 4 items, each on a scale of 0 to 10. For the purpose of this project, only 3 items were used. The 3 items assessed the worst pain, usual pain, and the current pain (right now). The higher the score, the higher the pain intensity. Cronbach alpha coefficients on the NPRS obtained from the current sample of veterans were 0.85 on both pre- and postintervention assessments.
MPI. The MPI is an easily accessible, reliable, and valid self-report questionnaire that measures the impact of pain on an individual’s life, quality of social support, and general activity.14 This instrument is a short version of the West Haven-Yale MPI.15 The MPI contains 9 items rated on a scale from 0 to 6. The higher the score, the greater pain interference a person is experiencing. The MPI produces reliable, valid information for diagnostic purposes and for therapy outcome studies.16 The MPI had a Cronbach alpha of 0.90 on pre-intervention and 0.92 on postintervention assessments in the current sample.
WHOQOL-BREF. The WHOQOL-BREF is a measure of quality of life and is an abbreviated version of the WHOQOL-100. Quality of life is defined by the World Health Organization17 “as an individuals’ perception of their position in life in the context of the culture and value systems in which they live and in relation to their goals, expectations, standards and concerns.” The WHOQOL-BREF contains 26 items. The first 2 items were examined separately; the first item asks individuals to rate their overall quality of life and the second asks individuals how satisfied they are with their health. The remaining 24 items were used to calculate the following 4 domain scores: physical health, psychological health, social relationship, and environment.18 Each item is measured on a scale of 1 to 5. Higher scores denote higher or better quality of life. Domain scores have demonstrated good reliability and validity.19-21 Cronbach alpha coefficients for the domain subscales ranged from 0.63 to 0.84 in the current sample, with the lowest alphas for the 3-item Social Relationships Domain.
PCS. The PCS is a widely used measure of catastrophic thinking related to pain. Catastrophizing has been conceived by Sullivan and colleagues as “an exaggerated negative mental set brought to bear during actual or anticipated painful experience.”22 The PCS provides a total score and scores for the following subscales: rumination, magnification, and helplessness.23 It has been used in a variety of chronic pain populations and has demonstrated good reliability and validity in clinical as well as nonclinical samples.24-26 The PCS has 13 items rated on a scale of 0 to 4. Higher scores mean greater negative pain cognition (catastrophizing). In the current sample, the PCS total scale had a Cronbach alpha coefficient of 0.95 and 0.94 on the 2 assessments. The coefficients for the subscales ranged from 0.81 to 0.90.
PTSS. The PTSS is a 5-item tool that measures patient satisfaction with pain treatment. It includes items that address overall satisfaction, staff warmth, staff skill level, ease of scheduling appointments, and recommendation of the program to other veterans. It was derived from the post-treatment version of The Pain Outcome Questionnaire-VA and has demonstrated reliability and validity.27 The questions are scaled from 0 to 10. High scores on the PTSS denote high patient satisfaction with the EVP. The Cronbach alpha coefficient on the PTSS obtained from the current sample was 0.80.
Data Gathering and Analysis
Prior to starting the Study phase, Washburn University’s Institutional Review Board (IRB) and the VA IRB approved the project. The VA IRB, through its affiliate, gave a Not Human Research Determination and granted a waiver of informed consent and the Health Insurance Portability and Accountability Act authorization. The VA facility’s Research and Development department also approved the quality improvement project.
Once these approvals were obtained, the Study phase began with the abstraction of retrospective data obtained from veterans who participated in the VA health care facility’s EVP between
Veterans who completed the program were compared to veterans who did not complete the program on age, gender, and baseline measures. The investigators used independent samples t-tests to compare completers and noncompleters on age, pain intensity, pain interference, quality of life, and pain catastrophizing. They used the chi-square test of independence to analyze the association between gender and program completion.
Data were included in the pre- and postintervention analysis if the veteran completed the NPRS, MPI, WHOQOL-BREF, and PCS pre and post intervention. This became an important eligibility requirement as some of the tools/measures were changed towards the end of the review period in 2019. Pre- and postintervention data on pain intensity, pain interference, quality of life, pain catastrophizing, and patient satisfaction were compared using paired samples t-test at .004 level of significance based on the Bonferroni correction.28 Data on patient satisfaction with pain treatment were collected at program completion (week 8 or 10) and were analyzed using descriptive statistics.
Effect sizes (Cohen’s d) were calculated to determine the substantive significance or magnitude of the mean differences in scores. Effect sizes (expressed as absolute values of Cohen’s d) were calculated as the mean difference divided by the standard deviation. Values of 0.2 were considered a small effect size, 0.5 a medium effect size, and 0.8 a large effect size.29
Results
Data were abstracted for 115 veterans who started the EVP. Of these, 48 left the program, leaving 67 veterans (58%) who completed the program. Completers and noncompleters were similar in age, gender, and baseline measures (Table 1). Fifty-three (79%) completers and 35 (73%) noncompleters were male. A chi-square test of independence showed no significant association between gender and program completion (χ21 [N = 115] = .595, P = .440).
Comparison of pre-and postintervention mean scale scores resulted in statistically significant
Analysis of data obtained using the PTSS yielded high mean scores for items that focused on patient satisfaction with treatment (Table 3). Scaled statistics yielded a mean (SD) of 46.95 (4.40). These results denoted overall patient satisfaction with the EVP.
Discussion
The purpose of this quality improvement project was to abstract and analyze previously collected data from veterans with high-impact chronic pain who attended the EVP. Comparison of pre-intervention and postintervention data obtained from 67 veterans who completed the program revealed improvements in pain intensity, pain interference, negative cognition (catastrophizing), and quality of life. The differences were statistically significant and clinically meaningful, with medium and large effect sizes. In addition, veterans reported high satisfaction with the EVP.
The EVP includes CIH approaches that have demonstrated effectiveness among veterans and other populations with chronic pain. A wealth of studies, for example, support the effectiveness of CIH approaches among veterans.30-34 Other studies focus on specific CIH approaches that are components of the EVP. Evidence supports, for example, the efficacy of mindfulness-based stress reduction,35-39 acceptance and commitment therapy,40-43 brief peer support intervention,44 and interdisciplinary biopsychosocial rehabilitation.45,46
While empirical evidence supports components of the EVP, only one study focused on the outcomes of the Atlanta VA EVP among veterans with chronic pain. Results of a qualitative study conducted by Penney and Haro47 described the experience of veterans with the EVP. Those veterans reported adopting new self-care or lifestyle practices for pain management and health, accepting pain, being better able to adjust and set boundaries, feeling more in control, participating in life, and changing their medication use.
The mean baseline scores from the current sample were similar to samples of patients with chronic pain in other studies (NPRS,48 MPI,48 and PCS48-51). After converting scores on the WHOQOL-BREF from those that ranged from 4 to 20 to those that ranged from 0 to 100,18 the scores from the current sample were similar to those of other studies of patients with chronic pain.48,52,53Several strengths of the project should be noted. Data were collected using well established measurement tools that had previously demonstrated reliability and validity. All the tools used in data collection demonstrated good internal consistency reliabilities in the current sample of veterans. Weaknesses of the project include the use of a convenience sample of veterans and small sample size. Data were not available on the number of veterans who were offered participation or on how many veterans declined enrollment. The sample of veterans who chose to participate in the EVP may or may not have been representative of the population of veterans with high-impact chronic pain. As a pre- and postintervention design with no comparison group, the results are subject to multiple threats to internal validity, including the Hawthorne effect, maturation in the form of healing, and attrition. Reasons for leaving the program had not been recorded, so the investigators had no way of knowing factors that may have contributed to attrition. Also, data on when veterans left the program were unavailable. Research is needed with a control group to reduce the effect of confounding variables on the outcome measures. This project used data collected at a single VA facility, which limits its generalizability.
While completers and noncompleters of the EVP were similar on age, gender, and baseline measures, there may have been unidentified characteristics that influenced program completion. The investigators noticed the presence of more missing data among noncompleters compared to completers on the pre-intervention PCS; thus, noncompleters may have scored lower than completers on this instrument simply because there were more individual items that were unanswered/missing among this group of noncompleters.
Data were analyzed using a limited number of outcome measures that had previously been collected. Other outcome measures might include whether EVP participants reduced their use of medications, clinical resources, and personnel. Future projects, for example, could determine whether the EVP is effective in reducing opioid analgesic medication use and decreasing primary care and emergency department visits. Cost-benefit analyses could be completed to determine whether EVP is associated with financial savings.
Because no follow-up assessments were made to determine whether improvements were maintained over time, the project focus was limited to an evaluation of the short-term changes in the outcome measures. Future projects could include a follow-up assessment of the veterans 1- or 2-years post completion of the EVP.
Data for the project were collected prior to the COVID-19 pandemic, when the EVP was implemented through face-to-face meetings with participants and their peers. It is not clear how changes to the delivery of the program (such as offering it through telehealth) might impact veterans’ satisfaction with the program, willingness to complete it, and other variables of interest.
The results of this project were made available to stakeholders with recommendations for program expansion both at the current location and at other VA facilities, including the recommendation to hire additional personnel that would implement the program. As the VA network of facilities expand the EVP program and adapt it for telehealth delivery, the investigators recommended a similar analysis of data be performed following telehealth delivery. If delivery through telehealth is shown to improve outcome measures, the EVP could provide pain management treatment options for patients challenged by transportation barriers, including rural veterans.
Conclusion
This quality improvement project provided evidence of improvement in measures of pain severity, pain interference, negative cognition (catastrophizing), quality of life, and patient treatment satisfaction among veterans with chronic high-impact pain. Findings have been well received by the northeastern VA as well as the Veterans Integrated Systems Network 5. The results of the analyses were used to inform decisions regarding the future of the program.
Disclaimer: This material is the result of work supported with resources and the use of facilities at the VA Maryland Health Care System, Baltimore, Maryland. The views expressed are those of the authors and do not necessarily represent the views of the Department of Veterans Affairs or the United States Government.
Acknowledgments: The authors thank Dr. Arianna Perra, the recent past coordinator of the Empower Veterans Program (EVP), who provided initial insights and support that motivated the decision to evaluate the program. We also thank the veterans and VA EVP clinicians who contributed data for the evaluation, and Dr. Michael Saenger (Director, TelePain-EVP: EVP) and Dr. Robert Lavin for their ongoing support, care, and concern for veteran patients. We also thank Dr. Beverly Bradley and the neurology service administrative team for their guidance in the process of obtaining necessary VA approvals for this project.
Corresponding author: Jessica U. Uche, DNP, CRNP-Family; jessica.uche@va.gov
doi:10.12788/jcom.0089
1. Institute of Medicine (US) Committee on Advancing Pain Research, Care, and Education. Relieving Pain in America: A Blueprint for Transforming Prevention, Care, Education, and Research. The National Academies Press (US); 2011.
2. Bastian LA, Heapy A, Becker WC, et al. Understanding pain and pain treatment for veterans: responding to the federal pain research strategy. Pain Med. 2018;19(suppl_1); S1-S4. doi:10.1093/pm/pny1433
3. Engle GL. The need for a new medical model: a challenge for biomedicine. Science. 1977;196(4286):129-136. doi:10.1126/science.847460
4. Bevers K, Watts L, Kishino ND, et al. The biopsychosocial model of the assessment, prevention, and treatment of chronic pain. US Neurology. 2016;12(2):98-104. doi:10.17925/USN.2016.12.02.98
5. Bair MJ, Ang D, Wu J, et al. Evaluation of stepped care for chronic pain (ESCAPE) in veterans of the Iraq and Afghanistan conflicts: A randomized clinical trial. JAMA Intern Med. 2015;175(5):682-689. doi:10.1001/jamainternmed.2015.97
6. Veterans Health Administration. Pain Management. VHA Directive 2009-053. Washington, DC: Department of Veterans Affairs; 2009.https://www.va.gov/painmanagement/docs/vha09paindirective.pdf
7. Moore BA, Anderson D, Dorflinger L, et al. Stepped care model for pain management and quality of pain care in long-term opioid therapy. J Rehabil Res Dev. 2016;53(1):137-146. doi:10.1682/JRRD.2014.10.0254
8. Institute for Healthcare Improvement. How to improve. Accessed March 14, 2022. http://www.ihi.org/resources/Pages/HowtoImprove/default.aspx
9. Saenger M. Empower Veterans Program. APA PCSS-O Webinars. Evidence CAM LBP 2016.
10. Gaudet T, Kligler B. Whole health in the whole system of the Veterans Administration: How will we know we have reached this future state? J Altern Complement Med. 2019;25(S1):S7-S11. doi:10.1089/acm.2018.29061.gau
11. Veterans Health Administration. Whole health: Circle of health. Updated April 1, 2021. Accessed March 14, 2022. https://www.va.gov/WHOLEHEALTH/circle-of-health/index.asp
12. Krebs EE, Carey TS, Weinberger M. Accuracy of the pain numeric rating scale as a screening test in primary care. J Gen Intern Med. 2007;22(10):1453-1458. doi:10.1007/s11606-007-0321-2
13. Veterans Health Administration. Pain as the 5th vital sign toolkit. October 2000, revised edition. Geriatrics and Extended Care Strategic Healthcare Group, National Pain Management Coordinating Committee. https://www.va.gov/PAINMANAGEMENT/docs/Pain_As_the_5th_Vital_Sign_Toolkit.pdf
14. McKillop JM, Nielson WR. Improving the usefulness of the Multidimensional Pain Inventory. Pain Res Manag. 2011;16(4):239-244. doi:10.1155/2011/873424
15. Kerns RD, Turk DC, Rudy TE. The West Haven-Yale Multidimensional Pain Inventory (WHYMPI). Pain.1985;23(4):345-356. doi:10.1016/0304-3959(85)90004-1
16. Verra ML, Angst F, Staal JB, et al. Reliability of the multidimensional pain inventory and stability of the MPI classification system in chronic back pain. BMC Musculoskelet Disord. 2012;13:155. doi:10.1186/1471-2474-13-155
17. Development of the World Health Organization WHOQOL-BREF quality of life assessment. The WHOQOL Group. Psychol Med. 1998;28(3):551-558. doi:10.1017/s0033291798006667
18. World Health Organization. Division of Mental Health. WHOQOL-BREF: introduction, administration, scoring and generic version of the assessment: field trial version, December 1996. Accessed March 14, 2022. https://apps.who.int/iris/handle/10665/63529
19. Guay S, Fortin C, Fikretoglu D, et al. Validation of the WHOQOL-BREF in a sample of male treatment-seeking veterans. Mil Psychol. 2015;27(2):85-92. doi:10.1037/mil0000065
20. Skevington S, Lotfy M, O’Connell K, WHOQOL Group. The World Health Organization’s WHOQOL-BREF quality of life assessment: Psychometric properties and results of the international field trial. A Report from the WHOQOL Group. Qual Life Res. 2004;13(2):299-310. doi:10.1023/B:QURE.0000018486.91360.00
21. Stratton KJ, Bender MC, Cameron JJ, Pickett TC. Development and evaluation of a behavioral pain management treatment program in a Veterans Affairs Medical Center. Mil Med. 2015;180(3):263-268. doi:10.7205/MILMED-D-14-00281.
22. Sullivan MJ, Thorn B, Haythornthwaite JA, et al. Theoretical perspectives on the relation between catastrophizing and pain. Clin J Pain. 2001;17(1):52-64. doi:10.1097/00002508-200103000-00008
23. Sullivan JL. The Pain Catastrophizing Scale: User manual. Accessed March 14, 2022. https://studylib.net/doc/8330191/the-pain-catastrophizing-scale---dr.-michael-sullivan
24. Darnall BD, Sturgeon JA, Cook KF, et al. Development and validation of a daily pain catastrophizing scale. J Pain. 2017;18(9):1139-1149. doi:10.1016/j.jpain.2017.05.003
25. Osman A, Barrios FX, Kopper BA, et al. Factor structure, reliability, and validity of the Pain Catastrophizing Scale. J Behav Med. 1997;20(6):589-605. doi:10.1023/a:1025570508954
26. Sullivan MJL, Bishop S, Pivik J. The Pain Catastrophizing Scale: development and validation. Psychol Assessment. 1995;7(4):524-532. doi:10.1037/1040-3590.7.4.524
27. Walker R, Clark M, Gironda R. Psychometric characteristics of the Pain Treatment Satisfaction Scale. J Pain. 2015;6(3Suppl.):S76.
28. Emerson RW. Bonferroni correction and type I error. J Vis Impair Blind. 2020;114(1):77-78. doi:10.1177/0145482X20901378
29. Cohen J. Statistical power analysis for the behavioral sciences. 2nd ed. Routledge; 1988. doi:10.4324/9780203771587
30. Craner JR, Lake ES, Bancroft KA, George LL. Treatment outcomes and mechanisms for an ACT-based 10-week interdisciplinary chronic pain rehabilitation program. Pain Pract. 2020;20(1):44-54. doi:10.1111/papr.12824
31. Han L, Goulet JL, Skanderson M, et al. Evaluation of complementary and integrative health approaches among US veterans with musculoskeletal pain using propensity score methods. Pain Med. 2019;20(1):90-102. doi:10.1093/pm/pny027
32. Herman PM, Yuan AH, Cefalu MS, et al. The use of complementary and integrative health approaches for chronic musculoskeletal pain in younger US veterans: an economic evaluation. PLoS One. 2019;14(6):e0217831. doi:10.1371/journal.pone.0217831
33. National Academies of Sciences, Engineering, and Medicine; Health and Medicine Division; Board on Global Health; Board on Health Sciences Policy; Global Forum on Innovation in Health Professional Education; Forum on Neuroscience and Nervous System Disorders; Stroud C, Posey Norris SM, Bain L, eds. The Role of Nonpharmacological Approaches to Pain Management: Proceedings of a Workshop. National Academies Press (US); April 12, 2019.
34. Richmond H, Hall AM, Copsey B, et al. The effectiveness of cognitive behavioural treatment for non-specific low back pain: a systematic review and meta-analysis. PLoS One. 2015;10(8):e0134192. doi:10.1371/journal.pone.0134192
35. Kearney DJ, Simpson TL, Malte CA, et al. Mindfulness-based stress reduction in addition to usual care is associated with improvements in pain, fatigue, and cognitive failures among veterans with Gulf War illness. Am J Med. 2016;129(2):204-214. doi:10.1016/j.amjmed.2015.09.015
36. Khoo E, Small R, Cheng W, et al. Comparative evaluation of group-based mindfulness-based stress reduction and cognitive behavioral therapy for the treatment and management of chronic pain: a systematic review and network meta-analysis. Evid Based Ment Health. 2019;22(1):26-35. doi:10.1136/ebmental-2018-300062
37. Khusid MA, Vythilingam M. The emerging role of mindfulness meditation as effective self-management strategy, Part 2: clinical implications for chronic pain, substance misuse, and insomnia. Mil Med. 2016;181(9):969-975. doi:10.7205/MILMED-D-14-00678
38. la Cour P, Petersen M. Effects of mindfulness meditation on chronic pain: A randomized controlled trial. Pain Med. 2015;16(4):641-652. doi:10.1111/pme.12605
39. Zou L, Zhang Y, Yang L, et al. Are mindful exercises safe and beneficial for treating chronic lower back pain? A systematic review and meta-analysis of randomized controlled trials. J Clin Med. 2019;8(5):628. doi:10.3390/jcm8050628
40. Hughes LS, Clark J, Colclough JA, et al. Acceptance and commitment therapy (ACT) for chronic pain: a systematic review and meta-analyses. Clin J Pain. 2017;33(6):552-568. doi:10.1097/AJP.0000000000000425
41. Kemani MK, Olsson GL, Lekander M, et al. Efficacy and cost-effectiveness of acceptance and commitment therapy and applied relaxation for longstanding pain: a randomized controlled trial. Clin J Pain. 2015;31(11):1004-1016. doi:10.1097/AJP.0000000000000203
42. Scott W, Daly A, Yu L, McCracken LM. Treatment of chronic pain for adults 65 and over: analyses of outcomes and changes in psychological flexibility following interdisciplinary acceptance and commitment therapy (ACT). Pain Med. 2017;18(2):252. doi:10.1093/pm/pnw073
43. Veehof MM, Trompetter HR, Bohlmeijer ET, Schreurs KMG. Acceptance- and mindfulness-based interventions for the treatment of chronic pain: a meta-analytic review. Cogn Behav Ther. 2016;45(1):5-31. doi:10.1080/16506073.2015.1098724
44. Matthias MS, McGuire AB, Kukla M, et al. A brief peer support intervention for veterans with chronic musculoskeletal pain: a pilot study of feasibility and effectiveness. Pain Med. 2015;16(1):81-87. doi:10.1111/pme.12571
45. Anamkath NS, Palyo SA, Jacobs SC, et al. An interdisciplinary pain rehabilitation program for veterans with chronic pain: description and initial evaluation of outcomes. Pain Res Manag. 2018;2018(3941682):1-9. doi:10.1155/2018/3941682
46. Kamper SJ, Apeldoorn AT, Chiarotto A, et al. Multidisciplinary biopsychosocial rehabilitation for chronic low back pain. Cochrane Database Syst Rev. 2014;9: CD000963. doi:10.1002/14651858.CD000963.pub3
47. Penney LS, Haro E. Qualitative evaluation of an interdisciplinary chronic pain intervention: Outcomes and barriers and facilitators to ongoing pain management. J Pain Res. 2019;12:865-878. doi:10.2147/JPR.S185652
48. Murphy JL, Cordova MJ, Dedert EA. Cognitive behavioral therapy for chronic pain in veterans; Evidence for clinical effectiveness in a model program. Psychol Serv. 2022;19(1):95-102. doi:10.1037/ser0000506
49. Katz L, Patterson L, Zacharias R. Evaluation of an interdisciplinary chronic pain program and predictors of readiness for change. Can J Pain. 2019;3(1):70-78. doi:10.1080/24740527.2019.1582296
50. Majumder SMM, Ahmed S, Shazzad N, et al. Translation, cross-cultural adaptation and validation of the Pain Catastrophizing Scale (PCS) into Bengali I patients with chronic non-malignant musculoskeletal pain. Int J Rheum Dis. 2020;23:1481-1487. doi:10.1111/1756-185X.13954
51. Margiotta F, Hannigan A, Imran A, et al. Pain, perceived injustice, and pain catastrophizing in chronic pain patients in Ireland. Pain Pract. 2016;17(5):663-668. doi:10.1111/papr.12
52. Bras M, Milunovic V, Boban M, et al. Quality of live in Croatian Homeland war (1991-1995) veterans who suffer from post-traumatic stress disorder and chronic pain. Health Qual Life Out. 2011;9:56. doi:10.1186/1477-7525-9-56
53. Liu C-H, Kung Y-Y, Lin C-L, et al. Therapeutic efficacy and the impact of the “dose” effect of acupuncture to treat sciatica: A randomized controlled pilot study. J Pain Res. 2019;12:3511-3520. doi:10.2147/JPR.S210672