User login
Utility of ICD Codes for Stress Cardiomyopathy in Hospital Administrative Databases: What Do They Signify?
Stress cardiomyopathy (SCM), also known as takotsubo cardiomyopathy, is a nonischemic cardiomyopathy initially identified in Japan in 1990. In 2006, SCM gained an International Classification of Diseases code at the 9th Clinical Modification (ICD-9 CM). Subsequently, several epidemiological studies have used ICD codes to evaluate trends in the diagnosis of SCM;1-8 however, to our knowledge, no previous studies have validated ICD-9 or -10 codes using chart review. We aimed to determine the positive predictive value (PPV) and the limitations of these ICD codes among hospitalized patients.
METHODS
We performed a retrospective cohort study at a single tertiary care center, identifying all adults aged ≥18 years from 2010 to 2016 who were hospitalized with a first known diagnosis of SCM in our Electronic Health Records (EHR) system (Cerner, Stoltenberg Consulting, Inc., Bethel Park, Pennsylvania), which includes both inpatient and outpatient records. We included patients hospitalized with a principal or secondary ICD-9 discharge diagnosis code of 429.83 (for those hospitalized before October 2015) or an ICD-10 discharge diagnosis code of I51.81 (for those hospitalized from October 1, 2015 through December 2016). We excluded hospital readmissions and patients with recurrent SCM, but we could not administratively remove patients who carried a prior diagnosis of SCM made previously at other institutions. One investigator (KW) then reviewed our EHR for a documentation of SCM anywhere in the chart by performing a systematic review of discharge, admission, consultation, daily progress notes, as well as biomarkers, electrocardiograms, echocardiograms, and coronary angiograms. If the first reviewer did not find documentation of SCM anywhere in the EHR, this finding was confirmed by a second chart review by a cardiologist (QP).
Principal and secondary discharge diagnoses were entered into our administrative database by hospital coders using standard coding practices. Because ICD codes also record comorbidities that were present prior to admission, we determined whether each patient had a new diagnosis of SCM during the hospitalization. If not, we considered their ICD code as a preexisting comorbidity and labeled these as chronic cases.
We recorded age, sex, race, ethnicity, and frequency of echocardiogram and cardiac catheterization among all patients. To determine the burden of other comorbidities, we used the Charlson Comorbidity Index and the Elixhauser Comorbidity Index,9,10 but limited our reporting to comorbidities with >5% prevalence.
Our primary aim was to measure the PPV of these ICD codes to determine a diagnosis of SCM. This was done by dividing the total number of cases with a clinical documentation of SCM by the total number of patients with an ICD diagnosis of SCM. As secondary aims, we noted the percentage of new and chronic SCM, the proportion of patients who underwent echocardiography and/or cardiac catheterization and recorded the annual number of total cases of confirmed SCM from 2010 to 2016. Trends were evaluated using the Cochran-Armitage test. To better understand the difference between patients given a principal and secondary code for SCM, we compared these two groups using summary statistics using t tests and chi-squared tests as appropriate, noted the PPV, and determined the 95% confidence intervals of ICD codes in these subgroups. This study was approved by the institutional review board of Baystate Medical Center (#1109756-4). Statistical analysis was done using JMP version12.0.1 (SAS Institute, Cary, North Carolina, 2015).
RESULTS
During 2010-2016, a total of 592 patients with a first known ICD code in our EHR for SCM were hospitalized, comprising 242 (41.0%) with a principal diagnosis code. Upon chart review, we were unable to confirm a clinical diagnosis of SCM among 12 (2.0%) patients. In addition, 38 (6.4%) were chronic cases of SCM, without evidence of active disease at the time of hospitalization. In general, chronic cases typically carried an SCM diagnosis from a hospitalization at a non-Baystate hospital (outside our EHR), or from an outpatient setting. Occasionally, we also found cases where the diagnosis of SCM was mentioned but testing was not pursued, and the patient had no symptoms that were attributed to SCM. Overall use of echocardiogram and cardiac angiography was 91.5% and 66.8%, respectively, and was lower in chronic than in new cases of SCM.
Compared with patients with a secondary diagnosis code, patients with a principal diagnosis of SCM underwent more cardiac angiography and echocardiography (Table 1). When comparing the difference between those with principal and secondary ICD codes, we found that 237 (98%) vs 305 (87%) were new cases of SCM, respectively, and all 12 patients without any clinical diagnosis of SCM had been given a secondary ICD code. Between 2010 and 2016, we noted a significant increase in the number of cases of SCM (Cochrane–Armitage, P < .0001).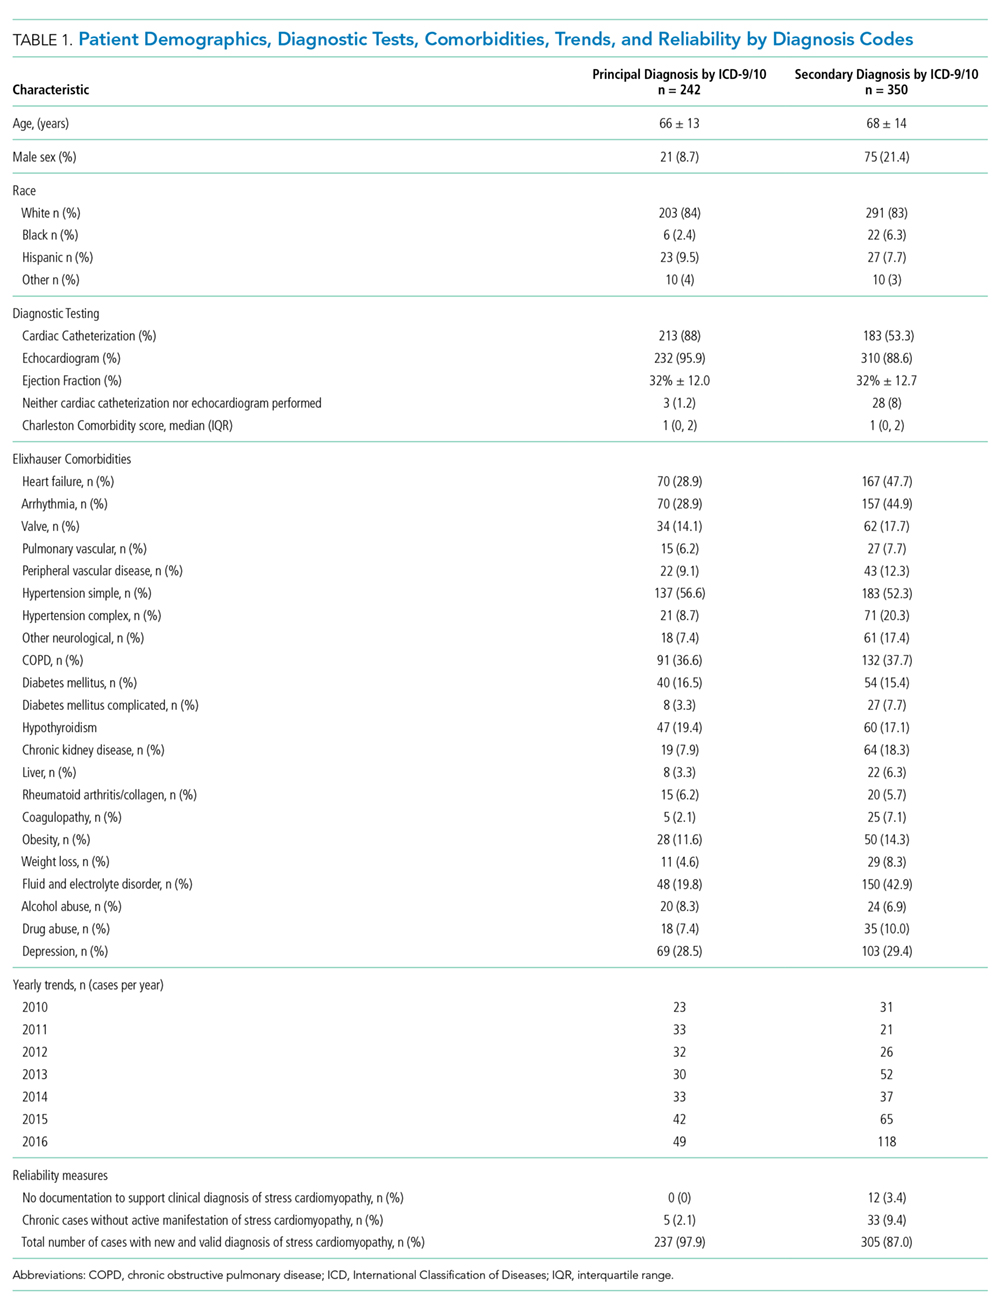
The overall PPV (95% CI) of either principal or secondary ICD codes for any form or presentation of SCM was 98.0% (96.4-98.8) with no difference in PPV between the coding systems (ICD-9, 66% of cases, PPV 98% [96.0-99.0] vs ICD-10, PPV 98% [94.9-99.2; P = .98]). Because all patients without a diagnosis of SCM were given secondary ICD codes, this changed the PPV (95% CI) for principal and secondary SCM to 100% (98.4-100.0) and 96.6% (94.1-98.0), respectively. When chronic cases were included as noncases, the PPV (95% CI) to detect a new case of SCM decreased to 97.9% (95.2-99.1) and 87.1% (83.0-90.2) for principal and secondary SCM, respectively (Table 1).
DISCUSSION
In this study, we found a strong relationship between the receipt of an ICD code for SCM and the clinical documentation of a diagnosis of SCM, with an overall PPV of 98%. The PPV was higher when the sample was limited to those assigned a principal ICD code for SCM, but it was lower when considering that some ICD codes represented chronic SCM from prior hospitalizations, despite our attempts to exclude these cases administratively prior to chart review. Furthermore, cardiac catheterization and echocardiography were used inconsistently and were less frequent among secondary compared with a principal diagnosis of SCM. Thus, although a principal ICD diagnosis code for SCM appears to accurately reflect a diagnosis of SCM, a secondary code for SCM appears less reliable. These findings suggest that future epidemiological studies can rely on principal diagnosis codes for use in research studies, but that they should use caution when including patients with secondary codes for SCM.
Our study makes an important contribution to the literature because it quantitates the reliability of ICD codes to identify patients with SCM. This finding is important because multiple studies have used this code to study trends in the incidence of this disease,1-8 and futures studies will almost certainly continue to do so. Our results also showed similar demographics and trends in the incidence of SCM compared with those of prior studies1-3,11 but additionally revealed that these codes also have some important limitations.
A key factor to remember is that neither a clinical diagnosis nor an ICD code at the time of hospital discharge is based upon formal diagnostic criteria for SCM. Importantly, all currently proposed diagnostic criteria require resolution of typical regional wall motion abnormalities before finalizing a research-grade diagnosis of SCM (Table 2).12,13 However, because the median time to recovery of ejection fraction in SCM is between three and four weeks after hospital discharge (with some recovery extending much longer),6 it is almost impossible to make a research-grade diagnosis of SCM after a three- to four-day hospitalization. Moreover, 33% of our patients did not undergo cardiac catheterization, 8.5% did not undergo echocardiography, and it is our experience that testing for pheochromocytoma and myocarditis is rarely done. Thus, we emphasize that ICD codes for SCM assigned at the time of hospital discharge represent a clinical diagnosis of SCM and not research-grade criteria for this disease. This is a significant limitation of prior epidemiologic studies that consider only the short time frame of hospitalization.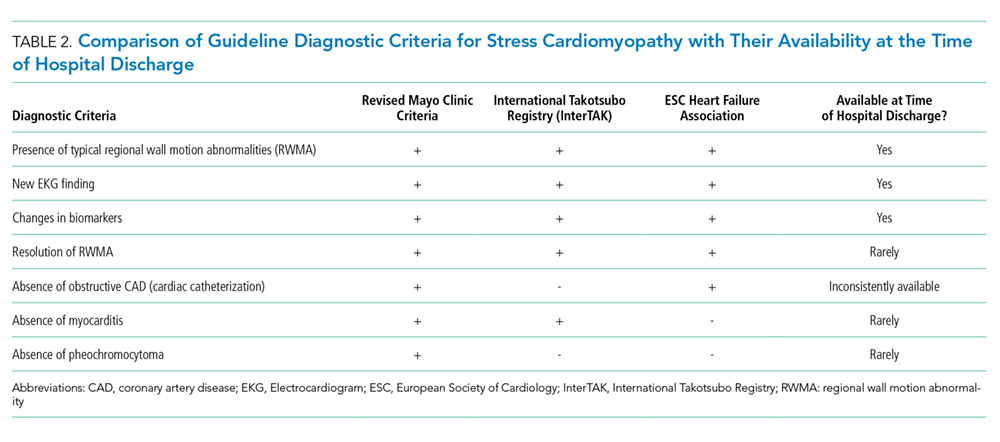
A limitation of our study is that we did not attempt to measure sensitivity, specificity, or the negative predictive value of these codes. This is because measurement of these diagnostic features would require sampling some of our hospital’s 53,000 annual hospital admissions to find cases where SCM was present but not recognized. This did not seem practical, particularly because it might also require directly overreading imaging studies. Moreover, we believe that for the purposes of future epidemiology research, the PPV is the most important feature of these codes because a high PPV indicates that when a principal ICD code is present, it almost always represents a new case of SCM. Other limitations include this being a single-center study; the rates of echocardiograms, cardiac angiography, clinical diagnosis, and coding may differ at other institutions.
In conclusion, we found a high PPV of ICD codes for SCM, particularly among patients with a principal discharge diagnosis of SCM. However, we also found that approximately 8% of cases were either wrongly coded or were chronic cases. Moreover, because of the need to document resolution of wall motion abnormalities, essentially no patients met the research-grade diagnostic criteria at the time of hospital discharge. Although this increases our confidence in the results of past studies, it also provides some caution to researchers who may use these codes in the future.
1. Khera R, Light-McGroary K, Zahr F, Horwitz PA, Girotra S. Trends in hospitalization for takotsubo cardiomyopathy in the United States. Am Heart J. 2016;172:53-63. https://doi.org/10.1016/j.ahj.2015.10.022.
2. Murugiah K, Wang Y, Desai NR, et al. Trends in short- and long-term outcomes for takotsubo cardiomyopathy among medicare fee-for-service beneficiaries, 2007 to 2012. JACC Heart Fail. 2016;4(3):197-205. https://doi.org/10.1016/j.jchf.2015.09.013.
3. Brinjikji W, El-Sayed AM, Salka S. In-hospital mortality among patients with takotsubo cardiomyopathy: a study of the National Inpatient Sample 2008 to 2009. Am Heart J. 2012;164(2):215-221. https://doi.org/10.1016/j.ahj.2012.04.010.
4. Smilowitz NR, Hausvater A, Reynolds HR. Hospital readmission following takotsubo syndrome. Eur Heart J Qual Care Clin Outcomes. 2018;5(2):114-120. https://doi.org/10.1093/ehjqcco/qcy045.
5. Vallabhajosyula S, Deshmukh AJ, Kashani K, Prasad A, Sakhuja A. Tako-Tsubo cardiomyopathy in severe sepsis: nationwide trends, predictors, and outcomes. J Am Heart Assoc. 2018;7(18):e009160. https://doi.org/10.1161/JAHA.118.009160.
6. Shaikh N, Sardar M, Jacob A, et al. Possible predictive factors for recovery of left ventricular systolic function in takotsubo cardiomyopathy. Intractable Rare Dis Res. 2018;7(2):100-105. https://doi.org/10.5582/irdr.2018.01042.
7. Shah M, Ram P, Lo KBU, et al. Etiologies, predictors, and economic impact of readmission within 1 month among patients with takotsubo cardiomyopathy. Clin Cardiol. 2018;41(7):916-923. https://doi.org/10.1002/clc.22974.
8. Misumida N, Ogunbayo GO, Kim SM, Abdel-Latif A, Ziada KM, Sorrell VL. Clinical outcome of takotsubo cardiomyopathy diagnosed with or without coronary angiography. Angiology. 2019;70(1):56-61. https://doi.org/10.1177/0003319718782049.
9. Charlson ME, Pompei P, Ales KL, MacKenzie CR. A new method of classifying prognostic comorbidity in longitudinal studies: development and validation. J Chronic Dis. 1987;40(5):373-383. https://doi.org/10.1016/0021-9681(87)90171-8.
10. Elixhauser A, Steiner C, Harris DR, Coffey RM. Comorbidity measures for use with administrative data. Med Care. 1998;36(1):8-27. https://doi.org/10.1097/00005650-199801000-00004.
11. Templin C, Ghadri JR, Diekmann J, et al. Clinical features and outcomes of takotsubo (stress) cardiomyopathy. N Engl J Med. Sep 3 2015;373(10):929-938. https://doi.org/10.1056/NEJMoa1406761.
12. Medina de Chazal H, Del Buono MG, Keyser-Marcus L, et al. Stress cardiomyopathy diagnosis and treatment: JACC state-of-the-art review. J Am Coll Cardiol. 2018;72(16):1955-1971. https://doi.org/10.1016/j.jacc.2018.07.072.
13. Ghadri JR, Wittstein IS, Prasad A, et al. international expert consensus document on takotsubo syndrome (part I): clinical characteristics, diagnostic criteria, and pathophysiology. Eur Heart J. 2018;39(22):2032-2046. https://doi.org/10.1093/eurheartj/ehy076.
Stress cardiomyopathy (SCM), also known as takotsubo cardiomyopathy, is a nonischemic cardiomyopathy initially identified in Japan in 1990. In 2006, SCM gained an International Classification of Diseases code at the 9th Clinical Modification (ICD-9 CM). Subsequently, several epidemiological studies have used ICD codes to evaluate trends in the diagnosis of SCM;1-8 however, to our knowledge, no previous studies have validated ICD-9 or -10 codes using chart review. We aimed to determine the positive predictive value (PPV) and the limitations of these ICD codes among hospitalized patients.
METHODS
We performed a retrospective cohort study at a single tertiary care center, identifying all adults aged ≥18 years from 2010 to 2016 who were hospitalized with a first known diagnosis of SCM in our Electronic Health Records (EHR) system (Cerner, Stoltenberg Consulting, Inc., Bethel Park, Pennsylvania), which includes both inpatient and outpatient records. We included patients hospitalized with a principal or secondary ICD-9 discharge diagnosis code of 429.83 (for those hospitalized before October 2015) or an ICD-10 discharge diagnosis code of I51.81 (for those hospitalized from October 1, 2015 through December 2016). We excluded hospital readmissions and patients with recurrent SCM, but we could not administratively remove patients who carried a prior diagnosis of SCM made previously at other institutions. One investigator (KW) then reviewed our EHR for a documentation of SCM anywhere in the chart by performing a systematic review of discharge, admission, consultation, daily progress notes, as well as biomarkers, electrocardiograms, echocardiograms, and coronary angiograms. If the first reviewer did not find documentation of SCM anywhere in the EHR, this finding was confirmed by a second chart review by a cardiologist (QP).
Principal and secondary discharge diagnoses were entered into our administrative database by hospital coders using standard coding practices. Because ICD codes also record comorbidities that were present prior to admission, we determined whether each patient had a new diagnosis of SCM during the hospitalization. If not, we considered their ICD code as a preexisting comorbidity and labeled these as chronic cases.
We recorded age, sex, race, ethnicity, and frequency of echocardiogram and cardiac catheterization among all patients. To determine the burden of other comorbidities, we used the Charlson Comorbidity Index and the Elixhauser Comorbidity Index,9,10 but limited our reporting to comorbidities with >5% prevalence.
Our primary aim was to measure the PPV of these ICD codes to determine a diagnosis of SCM. This was done by dividing the total number of cases with a clinical documentation of SCM by the total number of patients with an ICD diagnosis of SCM. As secondary aims, we noted the percentage of new and chronic SCM, the proportion of patients who underwent echocardiography and/or cardiac catheterization and recorded the annual number of total cases of confirmed SCM from 2010 to 2016. Trends were evaluated using the Cochran-Armitage test. To better understand the difference between patients given a principal and secondary code for SCM, we compared these two groups using summary statistics using t tests and chi-squared tests as appropriate, noted the PPV, and determined the 95% confidence intervals of ICD codes in these subgroups. This study was approved by the institutional review board of Baystate Medical Center (#1109756-4). Statistical analysis was done using JMP version12.0.1 (SAS Institute, Cary, North Carolina, 2015).
RESULTS
During 2010-2016, a total of 592 patients with a first known ICD code in our EHR for SCM were hospitalized, comprising 242 (41.0%) with a principal diagnosis code. Upon chart review, we were unable to confirm a clinical diagnosis of SCM among 12 (2.0%) patients. In addition, 38 (6.4%) were chronic cases of SCM, without evidence of active disease at the time of hospitalization. In general, chronic cases typically carried an SCM diagnosis from a hospitalization at a non-Baystate hospital (outside our EHR), or from an outpatient setting. Occasionally, we also found cases where the diagnosis of SCM was mentioned but testing was not pursued, and the patient had no symptoms that were attributed to SCM. Overall use of echocardiogram and cardiac angiography was 91.5% and 66.8%, respectively, and was lower in chronic than in new cases of SCM.
Compared with patients with a secondary diagnosis code, patients with a principal diagnosis of SCM underwent more cardiac angiography and echocardiography (Table 1). When comparing the difference between those with principal and secondary ICD codes, we found that 237 (98%) vs 305 (87%) were new cases of SCM, respectively, and all 12 patients without any clinical diagnosis of SCM had been given a secondary ICD code. Between 2010 and 2016, we noted a significant increase in the number of cases of SCM (Cochrane–Armitage, P < .0001).
The overall PPV (95% CI) of either principal or secondary ICD codes for any form or presentation of SCM was 98.0% (96.4-98.8) with no difference in PPV between the coding systems (ICD-9, 66% of cases, PPV 98% [96.0-99.0] vs ICD-10, PPV 98% [94.9-99.2; P = .98]). Because all patients without a diagnosis of SCM were given secondary ICD codes, this changed the PPV (95% CI) for principal and secondary SCM to 100% (98.4-100.0) and 96.6% (94.1-98.0), respectively. When chronic cases were included as noncases, the PPV (95% CI) to detect a new case of SCM decreased to 97.9% (95.2-99.1) and 87.1% (83.0-90.2) for principal and secondary SCM, respectively (Table 1).
DISCUSSION
In this study, we found a strong relationship between the receipt of an ICD code for SCM and the clinical documentation of a diagnosis of SCM, with an overall PPV of 98%. The PPV was higher when the sample was limited to those assigned a principal ICD code for SCM, but it was lower when considering that some ICD codes represented chronic SCM from prior hospitalizations, despite our attempts to exclude these cases administratively prior to chart review. Furthermore, cardiac catheterization and echocardiography were used inconsistently and were less frequent among secondary compared with a principal diagnosis of SCM. Thus, although a principal ICD diagnosis code for SCM appears to accurately reflect a diagnosis of SCM, a secondary code for SCM appears less reliable. These findings suggest that future epidemiological studies can rely on principal diagnosis codes for use in research studies, but that they should use caution when including patients with secondary codes for SCM.
Our study makes an important contribution to the literature because it quantitates the reliability of ICD codes to identify patients with SCM. This finding is important because multiple studies have used this code to study trends in the incidence of this disease,1-8 and futures studies will almost certainly continue to do so. Our results also showed similar demographics and trends in the incidence of SCM compared with those of prior studies1-3,11 but additionally revealed that these codes also have some important limitations.
A key factor to remember is that neither a clinical diagnosis nor an ICD code at the time of hospital discharge is based upon formal diagnostic criteria for SCM. Importantly, all currently proposed diagnostic criteria require resolution of typical regional wall motion abnormalities before finalizing a research-grade diagnosis of SCM (Table 2).12,13 However, because the median time to recovery of ejection fraction in SCM is between three and four weeks after hospital discharge (with some recovery extending much longer),6 it is almost impossible to make a research-grade diagnosis of SCM after a three- to four-day hospitalization. Moreover, 33% of our patients did not undergo cardiac catheterization, 8.5% did not undergo echocardiography, and it is our experience that testing for pheochromocytoma and myocarditis is rarely done. Thus, we emphasize that ICD codes for SCM assigned at the time of hospital discharge represent a clinical diagnosis of SCM and not research-grade criteria for this disease. This is a significant limitation of prior epidemiologic studies that consider only the short time frame of hospitalization.
A limitation of our study is that we did not attempt to measure sensitivity, specificity, or the negative predictive value of these codes. This is because measurement of these diagnostic features would require sampling some of our hospital’s 53,000 annual hospital admissions to find cases where SCM was present but not recognized. This did not seem practical, particularly because it might also require directly overreading imaging studies. Moreover, we believe that for the purposes of future epidemiology research, the PPV is the most important feature of these codes because a high PPV indicates that when a principal ICD code is present, it almost always represents a new case of SCM. Other limitations include this being a single-center study; the rates of echocardiograms, cardiac angiography, clinical diagnosis, and coding may differ at other institutions.
In conclusion, we found a high PPV of ICD codes for SCM, particularly among patients with a principal discharge diagnosis of SCM. However, we also found that approximately 8% of cases were either wrongly coded or were chronic cases. Moreover, because of the need to document resolution of wall motion abnormalities, essentially no patients met the research-grade diagnostic criteria at the time of hospital discharge. Although this increases our confidence in the results of past studies, it also provides some caution to researchers who may use these codes in the future.
1. Khera R, Light-McGroary K, Zahr F, Horwitz PA, Girotra S. Trends in hospitalization for takotsubo cardiomyopathy in the United States. Am Heart J. 2016;172:53-63. https://doi.org/10.1016/j.ahj.2015.10.022.
2. Murugiah K, Wang Y, Desai NR, et al. Trends in short- and long-term outcomes for takotsubo cardiomyopathy among medicare fee-for-service beneficiaries, 2007 to 2012. JACC Heart Fail. 2016;4(3):197-205. https://doi.org/10.1016/j.jchf.2015.09.013.
3. Brinjikji W, El-Sayed AM, Salka S. In-hospital mortality among patients with takotsubo cardiomyopathy: a study of the National Inpatient Sample 2008 to 2009. Am Heart J. 2012;164(2):215-221. https://doi.org/10.1016/j.ahj.2012.04.010.
4. Smilowitz NR, Hausvater A, Reynolds HR. Hospital readmission following takotsubo syndrome. Eur Heart J Qual Care Clin Outcomes. 2018;5(2):114-120. https://doi.org/10.1093/ehjqcco/qcy045.
5. Vallabhajosyula S, Deshmukh AJ, Kashani K, Prasad A, Sakhuja A. Tako-Tsubo cardiomyopathy in severe sepsis: nationwide trends, predictors, and outcomes. J Am Heart Assoc. 2018;7(18):e009160. https://doi.org/10.1161/JAHA.118.009160.
6. Shaikh N, Sardar M, Jacob A, et al. Possible predictive factors for recovery of left ventricular systolic function in takotsubo cardiomyopathy. Intractable Rare Dis Res. 2018;7(2):100-105. https://doi.org/10.5582/irdr.2018.01042.
7. Shah M, Ram P, Lo KBU, et al. Etiologies, predictors, and economic impact of readmission within 1 month among patients with takotsubo cardiomyopathy. Clin Cardiol. 2018;41(7):916-923. https://doi.org/10.1002/clc.22974.
8. Misumida N, Ogunbayo GO, Kim SM, Abdel-Latif A, Ziada KM, Sorrell VL. Clinical outcome of takotsubo cardiomyopathy diagnosed with or without coronary angiography. Angiology. 2019;70(1):56-61. https://doi.org/10.1177/0003319718782049.
9. Charlson ME, Pompei P, Ales KL, MacKenzie CR. A new method of classifying prognostic comorbidity in longitudinal studies: development and validation. J Chronic Dis. 1987;40(5):373-383. https://doi.org/10.1016/0021-9681(87)90171-8.
10. Elixhauser A, Steiner C, Harris DR, Coffey RM. Comorbidity measures for use with administrative data. Med Care. 1998;36(1):8-27. https://doi.org/10.1097/00005650-199801000-00004.
11. Templin C, Ghadri JR, Diekmann J, et al. Clinical features and outcomes of takotsubo (stress) cardiomyopathy. N Engl J Med. Sep 3 2015;373(10):929-938. https://doi.org/10.1056/NEJMoa1406761.
12. Medina de Chazal H, Del Buono MG, Keyser-Marcus L, et al. Stress cardiomyopathy diagnosis and treatment: JACC state-of-the-art review. J Am Coll Cardiol. 2018;72(16):1955-1971. https://doi.org/10.1016/j.jacc.2018.07.072.
13. Ghadri JR, Wittstein IS, Prasad A, et al. international expert consensus document on takotsubo syndrome (part I): clinical characteristics, diagnostic criteria, and pathophysiology. Eur Heart J. 2018;39(22):2032-2046. https://doi.org/10.1093/eurheartj/ehy076.
© 2020 Society of Hospital Medicine
Are Pediatric Readmission Reduction Efforts Falling Flat?
In an effort to improve healthcare for Americans by linking hospital payments to quality of care, Medicare’s Hospital Readmission Reduction Program (HRRP) began penalizing hospitals with “excess” readmission rates in 2012. The decision sparked widespread debate about the definition of a preventable readmission and whether a patient’s socioeconomic status should be considered for risk adjustment. Although coming back to the hospital after an admission is an undesirable outcome for any patient, the suitability of readmission as a quality measure remains a hot and debated topic. Research on the subject skyrocketed; over 12000 articles about hospital readmissions have been indexed in PubMed since 2000, and the number of publications has steadily increased since 2010 (Figure).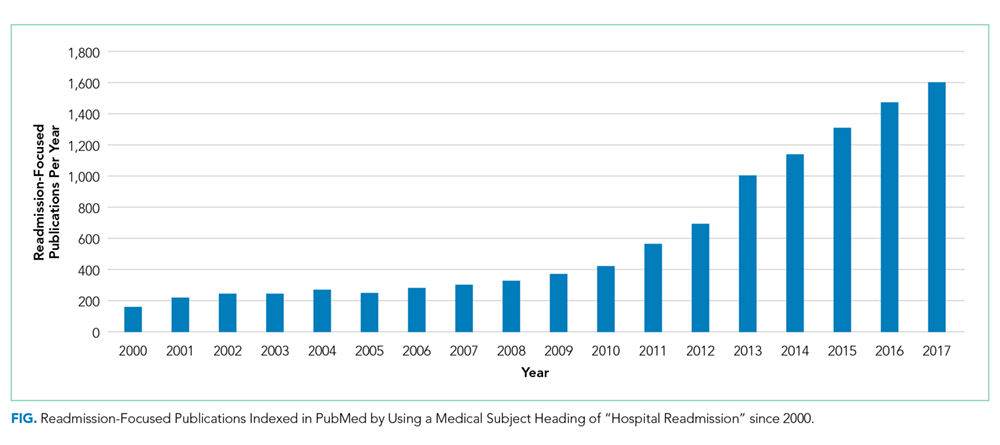
Although the HRRP is a Medicare initiative, there has been a substantial focus on readmissions in pediatrics as well. The National Quality Forum has endorsed three quality measures specific to readmission in children: (1) the rate of unplanned readmissions to the pediatric intensive care unit within 24 hours after discharge or transfer, (2) the pediatric lower respiratory infection readmission measure, defined as the percentage of admissions followed by one or more readmissions within 30 days of hospitalization for lower respiratory infection, and (3) the pediatric all-cause readmission measure, defined as the percentage of admissions followed by one or more readmissions within 30 days. These endorsements were preceded by studies showing that pediatric readmission rates varied substantially across hospitals and clinical conditions, and that children with chronic illnesses were at the highest risk.
Readmission is an attractive pediatric quality measure for a number of reasons. This measure is easy to apply to data at the hospital, health system, and payor levels at relatively low cost. Relatedly, the all-condition measure can be applied to all pediatric hospitalizations, overcoming the very real challenge in pediatric quality measurement of inadequate sample sizes to discern differences in healthcare quality at the hospital level for many disease-specific measures.1 In addition, this measure moves beyond process measurement to quantify an outcome relevant to families as well as healthcare systems. Finally, the measure is founded on a compelling conceptual framework (albeit one that remains challenging to prove) that efforts to improve a patient’s hospital-to-home transition and discharge readiness will reduce their likelihood of readmission.
In this issue of the Journal of Hospital Medicine, Katherine Auger and colleagues present their analysis of pediatric readmission rates from 2010 to 2016 across 66 children’s hospitals.2 They found that the median seven-day all-cause pediatric readmission rate was 5.1%, with no change in rates over the seven-year study period. Applying proprietary software to identify potentially preventable readmissions (PPR), they reported that approximately 40% of these readmissions may be preventable, a proportion that was also unchanged over time. Interestingly, 88% of the hospitals represented in their data were participating in the Solutions for Patient Safety national learning collaborative during the study period, making efforts to reduce seven-day readmission rates. Despite this, the figures presented in this paper of all-condition and potentially preventable readmission rates over time are very, very flat.
This work by Auger et al. contributes to our understanding about the preventability, or lack thereof, of pediatric all-condition readmissions. If 40% of these readmissions are indeed preventable, then why did Auger et al. not observe a declining proportion of PPR over time as a result of hospital participation in a national collaborative? Past quantitative and qualitative studies provide important context. First, the 40% rate of readmission preventability is twofold higher than that reported in past studies that relied on physician judgement to determine readmission preventability;3,4 the authors’ use of proprietary software to categorize the preventability of a readmission limits our ability to explain the differences in these rates. However, in these past studies, the rates of initial agreement between physician reviewers about readmission preventability were poor, highlighting the challenges associated with determining readmission preventability. Moreover, qualitative studies suggest that physicians and families lack a shared understanding of the preventability of readmissions.5 Finally, a systematic review of pediatric hospital discharge interventions did not identify any one intervention that was consistently effective in reducing hospital readmission rates.6 The following important questions remain: Were hospitals’ efforts to reduce PPR targeting the wrong patients? Were the interventions insufficient or ineffective? Or are readmission measures insufficiently sensitive to improved processes of care?
Recognizing that the majority of research on readmission as well as HRRP penalties focuses on adult populations, perhaps we can apply some lessons learned from the HRRP to pediatrics. Recent analyses by Medicare Payment Advisory Commission (MedPAC) suggest that raw and risk-adjusted readmission rates have declined for conditions covered by the HRRP, with readmission rates for HRRP target conditions declining more quickly than that for nontarget conditions.7 Just as the HRRP has focused on target conditions with relatively high readmission rates, analogous efforts to focus pediatric readmission reduction on children at greatest risk may enable measurement of change over time. For example, although children with complex chronic medical conditions represent a small proportion of the pediatric population, they account for 60% of all pediatric readmissions in the United States. However, similar to the above-described meta-analysis of readmission reduction efforts in children, at least one meta-analysis has demonstrated that there is no one intervention or even bundle of interventions that has consistently reduced readmissions in adults.8 Although the readmission rates for HRRP target conditions have decreased, the results of clinical trials evaluating readmission reduction efforts are difficult to translate into practice given substantial heterogeneity in study designs, interventions, and patient populations.
Does this study by Auger et al. suggest that pediatric readmission reduction efforts are misguided or futile? No. But it does provide compelling data that efforts to reduce all-cause readmissions for all children may not yield measureable changes using the current measures. A narrowed focus on children with chronic illnesses, who account for approximately half of all pediatric admissions, may be warranted. A number of studies have summarized families’ preferences regarding their hospital-to-home transitions; the results indicate that families of children with chronic illness have unique desires and needs.9,10 Perhaps it is time to take a step back from pediatric readmission reduction efforts, largely inspired by the HRRP, and redirect our resources to implement and evaluate processes and outcomes most valued by children and their families.
Disclosures
Drs. Lagu and Lindenauer have served as consultants for the Yale Center for Outcomes Research and Evaluation (under contract to the Centers for Medicare and Medicaid Services) providing clinical and methodological expertise and input on the development, reevaluation, and implementation of hospital outcome and efficiency measures.
Funding
Dr. Lagu is supported by the National Heart, Lung, and Blood Institute of the National Institutes of Health under Award R01 HL139985-01A1 and 1R01HL146884-01. Dr. Lindenauer was supported by the National Heart, Lung, and Blood Institute of the National Institutes of Health under Award Number K24HL132008.
Disclaimer
The views expressed in this manuscript do not necessarily reflect those of the Yale Center for Outcomes Research and Evaluation or the Centers for Medicare and Medicaid Services. The content is solely the responsibility of the authors and does not necessarily represent the official views of the NIH.
1. Berry JG, Zaslavsky AM, Toomey SL, et al. Recognizing differences in hospital quality performance for pediatric inpatient care. Pediatrics. 2015;136(2):251-262. https://doi.org/10.1542/peds.2014-3131.
2. Auger K, Harris M, Gay J, et al. Progress (?) towards reducing pediatric readmissions. J Hosp Med. 2019;14(10):618-621. https://doi.org/10.12788/jhm.3210
3. Hain PD, Gay JC, Berutti TW, Whitney GM, Wang W, Saville BR. Preventability of early readmissions at a children’s hospital. Pediatrics. 2013;131(1):e171-e181. https://doi.org/10.1542/peds.2012-0820.
4. Wallace SS, Keller SL, Falco CN, et al. An examination of physician-, caregiver-, and disease-related factors associated with readmission from a pediatric hospital medicine service. Hosp Pediatr. 2015;5(11):566-573. https://doi.org/10.1542/hpeds.2015-0015.
5. Brittan M, Albright K, Cifuentes M, Jimenez-Zambrano A, Kempe A. Parent and provider perspectives on pediatric readmissions: what can we learn about readiness for discharge?. Hosp Pediatr. 2015;5(11):559-565. https://doi.org/10.1542/hpeds.2015-0034.
6. Auger K, Kenyon CC, Feudtner C, Davis MM. Pediatric hospital discharge interventions to reduce subsequent utilization: a systematic review. J Hosp Med. 2014;9(4):251-260. https://doi.org/10.1002/jhm.2134.
7. NEJM Catalyst. Hospital Readmissions Reduction Program (HRRP). Available at: https://catalyst.nejm.org/hospital-readmissions-reduction-program-hrrp/. Accessed May 21, 2019.
8. Hansen L, Young R, Hinami K, Leung A, Williams M. Interventions to reduce 30-day rehospitalization: a systematic review. Ann Intern Med. 2011;155(8):520-528. https://doi.org/10.7326/0003-4819-155-8-201110180-00008.
9. Leyenaar J, O’Brien E, Leslie L, Lindenauer P, Mangione-Smith R. Families’ priorities regarding hospital-to-home transitions for children with medical complexity. Pediatrics. 2017;139(1): e20161581. https://doi.org/10.1542/peds.2016-1581.
10. Desai AD, Durkin LK, Jacob-Files EA, Mangione-Smith R. Caregiver perceptions of hospital to home transitions according to medical complexity: a qualitative study. Acad Pediatr. 2016;16(2):136-144. https://doi.org/10.1016/j.acap.2015.08.003.
In an effort to improve healthcare for Americans by linking hospital payments to quality of care, Medicare’s Hospital Readmission Reduction Program (HRRP) began penalizing hospitals with “excess” readmission rates in 2012. The decision sparked widespread debate about the definition of a preventable readmission and whether a patient’s socioeconomic status should be considered for risk adjustment. Although coming back to the hospital after an admission is an undesirable outcome for any patient, the suitability of readmission as a quality measure remains a hot and debated topic. Research on the subject skyrocketed; over 12000 articles about hospital readmissions have been indexed in PubMed since 2000, and the number of publications has steadily increased since 2010 (Figure).
Although the HRRP is a Medicare initiative, there has been a substantial focus on readmissions in pediatrics as well. The National Quality Forum has endorsed three quality measures specific to readmission in children: (1) the rate of unplanned readmissions to the pediatric intensive care unit within 24 hours after discharge or transfer, (2) the pediatric lower respiratory infection readmission measure, defined as the percentage of admissions followed by one or more readmissions within 30 days of hospitalization for lower respiratory infection, and (3) the pediatric all-cause readmission measure, defined as the percentage of admissions followed by one or more readmissions within 30 days. These endorsements were preceded by studies showing that pediatric readmission rates varied substantially across hospitals and clinical conditions, and that children with chronic illnesses were at the highest risk.
Readmission is an attractive pediatric quality measure for a number of reasons. This measure is easy to apply to data at the hospital, health system, and payor levels at relatively low cost. Relatedly, the all-condition measure can be applied to all pediatric hospitalizations, overcoming the very real challenge in pediatric quality measurement of inadequate sample sizes to discern differences in healthcare quality at the hospital level for many disease-specific measures.1 In addition, this measure moves beyond process measurement to quantify an outcome relevant to families as well as healthcare systems. Finally, the measure is founded on a compelling conceptual framework (albeit one that remains challenging to prove) that efforts to improve a patient’s hospital-to-home transition and discharge readiness will reduce their likelihood of readmission.
In this issue of the Journal of Hospital Medicine, Katherine Auger and colleagues present their analysis of pediatric readmission rates from 2010 to 2016 across 66 children’s hospitals.2 They found that the median seven-day all-cause pediatric readmission rate was 5.1%, with no change in rates over the seven-year study period. Applying proprietary software to identify potentially preventable readmissions (PPR), they reported that approximately 40% of these readmissions may be preventable, a proportion that was also unchanged over time. Interestingly, 88% of the hospitals represented in their data were participating in the Solutions for Patient Safety national learning collaborative during the study period, making efforts to reduce seven-day readmission rates. Despite this, the figures presented in this paper of all-condition and potentially preventable readmission rates over time are very, very flat.
This work by Auger et al. contributes to our understanding about the preventability, or lack thereof, of pediatric all-condition readmissions. If 40% of these readmissions are indeed preventable, then why did Auger et al. not observe a declining proportion of PPR over time as a result of hospital participation in a national collaborative? Past quantitative and qualitative studies provide important context. First, the 40% rate of readmission preventability is twofold higher than that reported in past studies that relied on physician judgement to determine readmission preventability;3,4 the authors’ use of proprietary software to categorize the preventability of a readmission limits our ability to explain the differences in these rates. However, in these past studies, the rates of initial agreement between physician reviewers about readmission preventability were poor, highlighting the challenges associated with determining readmission preventability. Moreover, qualitative studies suggest that physicians and families lack a shared understanding of the preventability of readmissions.5 Finally, a systematic review of pediatric hospital discharge interventions did not identify any one intervention that was consistently effective in reducing hospital readmission rates.6 The following important questions remain: Were hospitals’ efforts to reduce PPR targeting the wrong patients? Were the interventions insufficient or ineffective? Or are readmission measures insufficiently sensitive to improved processes of care?
Recognizing that the majority of research on readmission as well as HRRP penalties focuses on adult populations, perhaps we can apply some lessons learned from the HRRP to pediatrics. Recent analyses by Medicare Payment Advisory Commission (MedPAC) suggest that raw and risk-adjusted readmission rates have declined for conditions covered by the HRRP, with readmission rates for HRRP target conditions declining more quickly than that for nontarget conditions.7 Just as the HRRP has focused on target conditions with relatively high readmission rates, analogous efforts to focus pediatric readmission reduction on children at greatest risk may enable measurement of change over time. For example, although children with complex chronic medical conditions represent a small proportion of the pediatric population, they account for 60% of all pediatric readmissions in the United States. However, similar to the above-described meta-analysis of readmission reduction efforts in children, at least one meta-analysis has demonstrated that there is no one intervention or even bundle of interventions that has consistently reduced readmissions in adults.8 Although the readmission rates for HRRP target conditions have decreased, the results of clinical trials evaluating readmission reduction efforts are difficult to translate into practice given substantial heterogeneity in study designs, interventions, and patient populations.
Does this study by Auger et al. suggest that pediatric readmission reduction efforts are misguided or futile? No. But it does provide compelling data that efforts to reduce all-cause readmissions for all children may not yield measureable changes using the current measures. A narrowed focus on children with chronic illnesses, who account for approximately half of all pediatric admissions, may be warranted. A number of studies have summarized families’ preferences regarding their hospital-to-home transitions; the results indicate that families of children with chronic illness have unique desires and needs.9,10 Perhaps it is time to take a step back from pediatric readmission reduction efforts, largely inspired by the HRRP, and redirect our resources to implement and evaluate processes and outcomes most valued by children and their families.
Disclosures
Drs. Lagu and Lindenauer have served as consultants for the Yale Center for Outcomes Research and Evaluation (under contract to the Centers for Medicare and Medicaid Services) providing clinical and methodological expertise and input on the development, reevaluation, and implementation of hospital outcome and efficiency measures.
Funding
Dr. Lagu is supported by the National Heart, Lung, and Blood Institute of the National Institutes of Health under Award R01 HL139985-01A1 and 1R01HL146884-01. Dr. Lindenauer was supported by the National Heart, Lung, and Blood Institute of the National Institutes of Health under Award Number K24HL132008.
Disclaimer
The views expressed in this manuscript do not necessarily reflect those of the Yale Center for Outcomes Research and Evaluation or the Centers for Medicare and Medicaid Services. The content is solely the responsibility of the authors and does not necessarily represent the official views of the NIH.
1. Berry JG, Zaslavsky AM, Toomey SL, et al. Recognizing differences in hospital quality performance for pediatric inpatient care. Pediatrics. 2015;136(2):251-262. https://doi.org/10.1542/peds.2014-3131.
2. Auger K, Harris M, Gay J, et al. Progress (?) towards reducing pediatric readmissions. J Hosp Med. 2019;14(10):618-621. https://doi.org/10.12788/jhm.3210
3. Hain PD, Gay JC, Berutti TW, Whitney GM, Wang W, Saville BR. Preventability of early readmissions at a children’s hospital. Pediatrics. 2013;131(1):e171-e181. https://doi.org/10.1542/peds.2012-0820.
4. Wallace SS, Keller SL, Falco CN, et al. An examination of physician-, caregiver-, and disease-related factors associated with readmission from a pediatric hospital medicine service. Hosp Pediatr. 2015;5(11):566-573. https://doi.org/10.1542/hpeds.2015-0015.
5. Brittan M, Albright K, Cifuentes M, Jimenez-Zambrano A, Kempe A. Parent and provider perspectives on pediatric readmissions: what can we learn about readiness for discharge?. Hosp Pediatr. 2015;5(11):559-565. https://doi.org/10.1542/hpeds.2015-0034.
6. Auger K, Kenyon CC, Feudtner C, Davis MM. Pediatric hospital discharge interventions to reduce subsequent utilization: a systematic review. J Hosp Med. 2014;9(4):251-260. https://doi.org/10.1002/jhm.2134.
7. NEJM Catalyst. Hospital Readmissions Reduction Program (HRRP). Available at: https://catalyst.nejm.org/hospital-readmissions-reduction-program-hrrp/. Accessed May 21, 2019.
8. Hansen L, Young R, Hinami K, Leung A, Williams M. Interventions to reduce 30-day rehospitalization: a systematic review. Ann Intern Med. 2011;155(8):520-528. https://doi.org/10.7326/0003-4819-155-8-201110180-00008.
9. Leyenaar J, O’Brien E, Leslie L, Lindenauer P, Mangione-Smith R. Families’ priorities regarding hospital-to-home transitions for children with medical complexity. Pediatrics. 2017;139(1): e20161581. https://doi.org/10.1542/peds.2016-1581.
10. Desai AD, Durkin LK, Jacob-Files EA, Mangione-Smith R. Caregiver perceptions of hospital to home transitions according to medical complexity: a qualitative study. Acad Pediatr. 2016;16(2):136-144. https://doi.org/10.1016/j.acap.2015.08.003.
© 2019 Society of Hospital Medicine
Examining the “Repletion Reflex”: The Association between Serum Potassium and Outcomes in Hospitalized Patients with Heart Failure
Heart failure (HF) is a leading cause of hospital admission and mortality, accounting for approximately 900,000 discharges in 2014.1 One-year all-cause mortality risk has been estimated at 17% after hospitalization,2 and roughly 50% of deaths are related to sudden cardiac death, mostly due to ventricular arrhythmia.
The principles underlying potassium management in acute HF are complex. Both low and high values have been linked to fatal arrhythmias, notably ventricular fibrillation, and small serum changes often reflect large total body potassium fluctuations.11 Recent literature links hypokalemia to general membrane hypoexcitability, skeletal muscle hyporeflexia, and arrhythmias initiated by reduced sodium-potassium adenosine triphosphatase activity, leading to increased intracellular calcium and regional variations in action potential duration.12 Potassium abnormalities are common at admission and may be exacerbated by both acute illness and treatments given during hospitalization, including baseline potassium, acute kidney injury, aggressive diuretic therapy, or other potassium-related treatments and conditions.13 The success of potassium repletion may also be affected by the choice of HF therapies.14
The belief that patients with HF must maintain a potassium >4.0 mEq/L remains pervasive, with at least one family medicine guideline recommending that patients with HF maintain a serum potassium level >4.0 mEq/L.
METHODS
Data Sources and Cohort Definition
The Institutional Review Board at Baystate Medical Center approved this study. We identified patients with HF who were admitted for more than 72 hours between January 2010 and December 2012 to hospitals contributing to the HealthFacts database, a multihospital dataset derived from the comprehensive electronic health records of 116 geographically and structurally diverse hospitals throughout the United States (Cerner Corp.). HealthFacts—which includes date-stamped pharmacy, laboratory, and billing information—contains records of more than 84 million acute admissions, emergency room visits, and ambulatory visits. We limited the sample to hospitals that contributed to the pharmacy, laboratory, and diagnosis segments.
We included patients who had a principal International Classification of Disease (ICD-9-CM) diagnosis of HF or a principal diagnosis of respiratory failure with secondary diagnosis of HF (ICD-9-CM codes for HF: 402.01, 402.11, 402.91, 404.01, 404.03, 404.11, 404.13, 404.91, 404.93, 428.xx16 and for respiratory failure: 518.81, 518.82, 518.84) and were 18 years or older. We ensured that patients were treated for acute decompensated HF during the hospitalization by restricting the cohort to patients in whom at least one HF therapy (eg, loop diuretics, metolazone, inotropes, and intra-aortic balloon pump) was initiated within the first two days of hospitalization. We excluded patients with a pediatric or psychiatric attending physician, those with elective admissions, and those who were transferred from or to another acute care facility because we could not accurately determine the onset or subsequent course of their illness.
Definition of Variables Describing Serum Potassium Levels
We limited the sample to patients hospitalized for longer than 72 hours in order to observe how initial potassium values influenced outcomes over the course of hospitalization. We chose an exposure window of 72 hours because this allowed, on average, three potential observations of serum potassium per patient. We further restricted the sample to those who had a normal potassium value (3.5-5.0 mEq/L) at admission (defined as 24 hours prior to admission through midnight of the day of admission) to ensure that the included patients did not have abnormal potassium values upon presentation. We identified the period of time from 24 hours prior to admission through 72 hours following admission as “the exposure window” (the time during which patients were eligible to be classified into average serum potassium levels of <4.0, 4.0-4.5, or >4.5 mEq/L). We excluded patients who, during this window, had fewer than three serum potassium levels drawn (“exposure” levels could be disproportionately influenced by a single value) or received sodium polystyrene (as this would indicate that the physicians felt the potassium was dangerously high). For patients with repeated hospitalizations, we randomly selected one visit for inclusion to reduce the risk of survivor bias. We calculated the mean of all serum potassium levels during the exposure window, including the admission value, and then evaluated two different categorizations of mean serum potassium, based on categories of risk previously reported in the literature:8,17,18: (1) <4.0, 4.0-4.5, or >4.5 mEq/L and (2) <4.0 versus ≥4.0 mEq/L.
Outcomes
We assessed three outcomes: in-hospital mortality, transfer to an intensive care unit (ICU), and length of stay (LOS). Admission to the ICU was defined as any evidence, after the exposure window, that the patient received care in the ICU. We excluded patients with ICU admissions during the exposure window from the analysis of this outcome. We calculated LOS as the difference between discharge date/time and the admission date/time.
Covariates and Comorbidity Adjustment
We obtained information on patient demographics (age and race) and identified the presence of comorbid conditions using previously derived and validated models.19,20 We then further quantified these conditions into a single combined score to adjust for differences in presenting illness severity (including kidney disease) and help reduce confounding.21 To account for presenting severity of illness, we calculated the Laboratory-based Acute Physiology Score (LAPS-2).22,23 LAPS-2 was developed for predicting mortality risk in general medical patients, but we previously externally validated it against other published clinical HF models in a cohort of patients hospitalized with acute decompensated HF.5
Potassium Repletion
Analysis
We evaluated the differences in patient characteristics across serum potassium categories. Categorical variables are presented as frequencies and percentages, whereas continuous variables are presented as means and standard deviations. For binary outcomes, we used generalized estimating equations (with a binomial family and logit link and clustering by hospital) to estimate incidence and calculate unadjusted and adjusted odds ratios (ORs) and 95% confidence intervals (CIs). For LOS, we estimated the median and 95% CIs using quantile regression with clustered standard errors.24 We calculated all models using both a binary exposure (<4.0 versus ≥4.0 mEq/L) and a three-level categorization (<4.0, 4.0-4.5, and >4.5 mEq/L) to explore the effects at the highest potassium level. We adjusted all models for age, race, LAPS-2 score, and combined comorbidity score. We conducted two sensitivity analyses. First, we restricted our sample to those who never received potassium during the exposure window, as these patients may be different than patients who required potassium repletion. Second, we stratified our findings by the presence or absence of acute or chronic renal insufficiency (defined as an admission creatinine >1 or the presence of a diagnostic code for renal insufficiency, as defined by Elixhauser et al.).19,21 Statistical significance was set at an alpha of 0.05. Analysis was completed using Stata v15.1, StataCorp LP, College Station, Texas.
RESULTS
Cohort Description
We identified patients from 56 geographically diverse US hospitals, although most were located in either the northeast (n = 21; 38%) or south (n = 18; 32%). A total of 59% of the hospitals were teaching hospitals, and nearly 95% were in an urban setting. We identified 13,163 patients with HF, of which 4,995 (38.0%) met the inclusion criteria. We excluded 3,744 (28.4%) patients with LOS < 72 hours, 2,210 (16.8%) with admission potassium values outside of the defined range, and 896 (6.8%) with fewer than three potassium values during the exposure window. Of the patients who met the inclusion criteria, 2,080 (41.6%), 2,326 (46.6%), and 589 (11.8%) were categorized in the <4.0, 4.0-4.5, and >4.5 mEq/L groups, respectively (Table 1). The groups were clinically similar in terms of age, sex, illness severity (LAPS-2), and comorbidity score. Compared with other racial groups, black patients had higher potassium values. While the <4.0 and 4.0-4.5 mEq/L groups were relatively similar, the group with mean potassium >4.5 mEq/L had higher admission creatinine and a greater prevalence of chronic kidney disease, deficiency anemias, and chronic obstructive pulmonary disease (Table 1).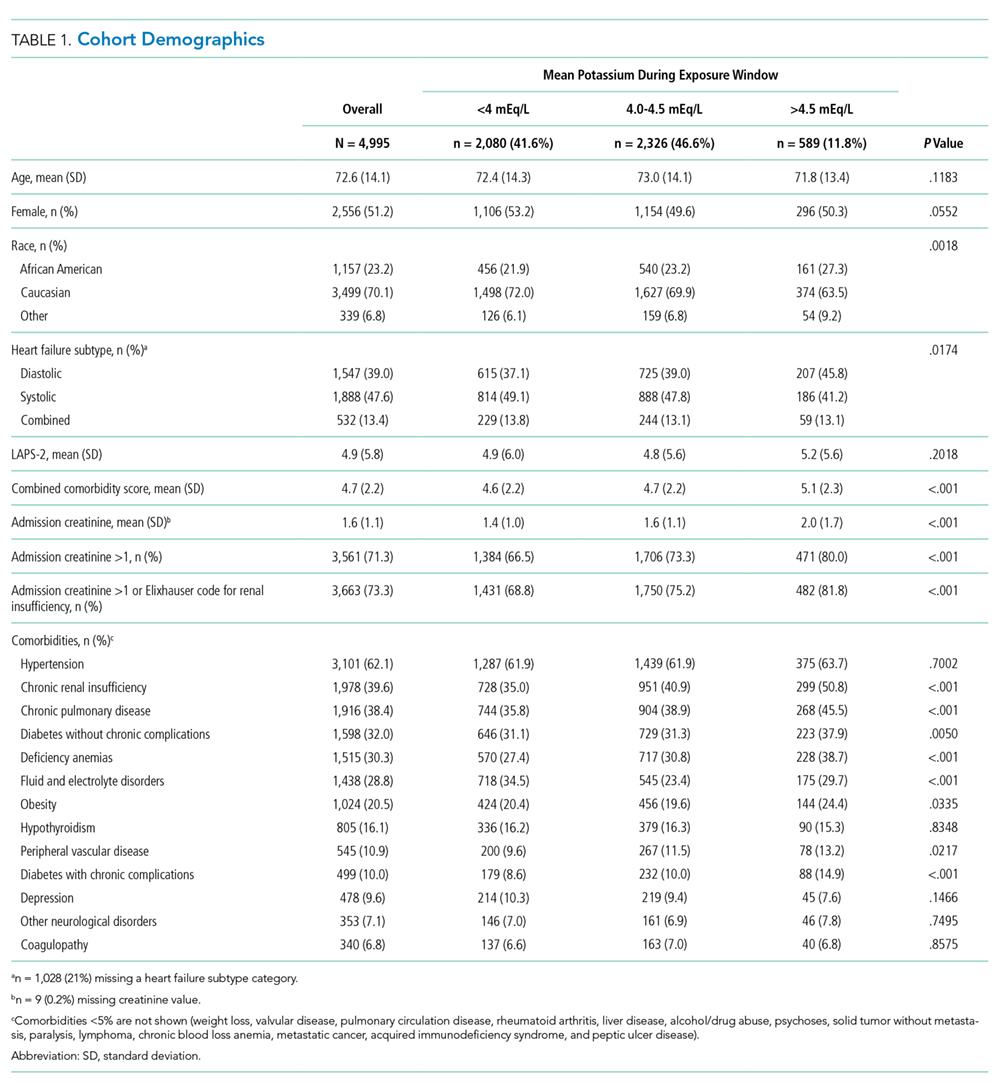
Serum Potassium Values
Individuals’ mean serum potassium within the 72-hour exposure window ranged from 2.9 to 5.8 mEq/L (Table 2). In the <4.0, 4-4.5, and >4.5 mEq/L cohorts respectively, patients had a median serum potassium of 3.8 mEq/L (2.9-3.9), 4.2 mEq/L (4.0-4.5), and 4.7 mEq/L (4.5-5.8) during the exposure window. Approximately half of the patients in the <4.0 mEq/L group had a serum potassium <3.5 mEq/L at some point during the exposure window. In contrast, <10% of the other groups had this low value during the exposure window.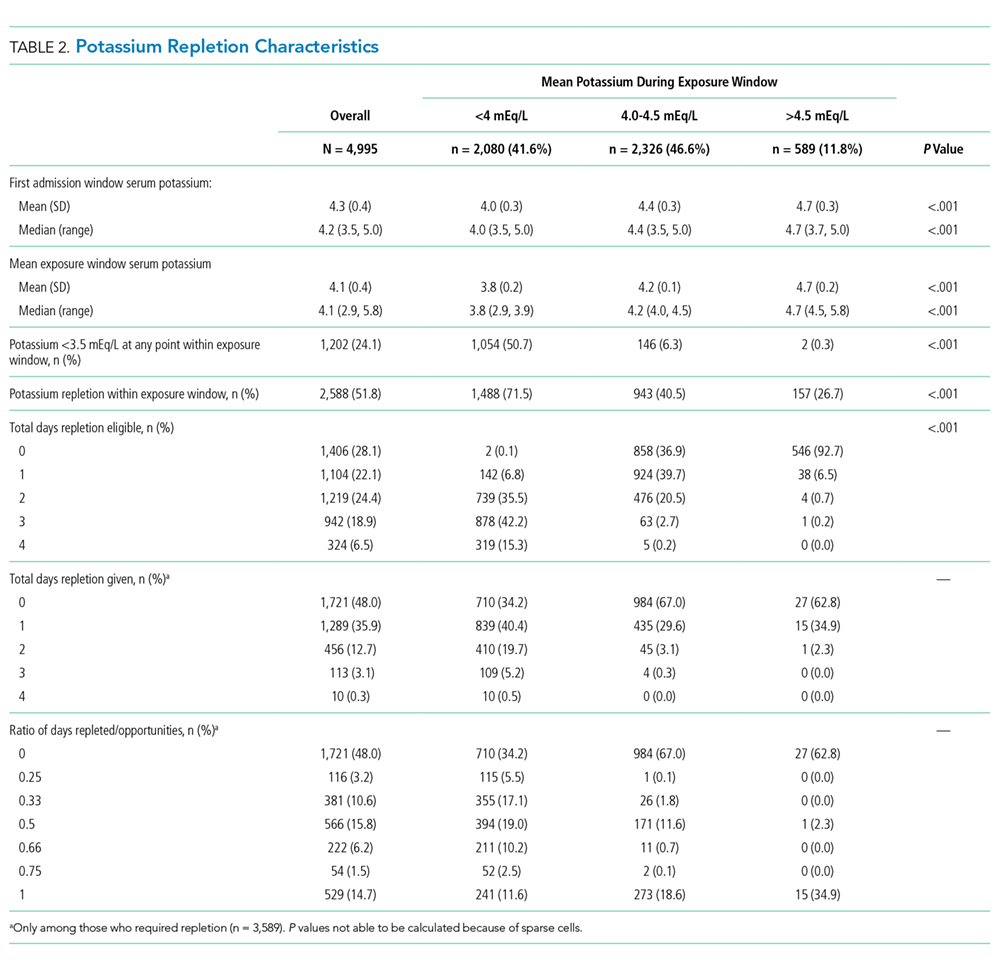
Potassium Repletion
Patients in the <4.0 mEq/L group were much more likely to receive potassium repletion during the exposure window when compared with the 4.0-4.5 mEq/L (71.5% vs 40.5%) and >4.5 mEq/L (71.5% vs 26.7%) groups. On days that they were eligible for repletion (defined as a daily potassium value <4.0 mEq/L), patients with mean serum potassium >4.0 mEq/L were less likely to receive potassium repletion compared with those with values <4.0 mEq/L. There were 592 (28.5%), 1,383 (59.5%), and 432 (73.3%) patients in the <4.0, 4-4.5, and >4,5 mEq/L groups, respectively, who did not receive potassium repletion therapy during the exposure window.
Relationship of Serum Potassium Levels and Outcomes
Overall, 3.7% (n = 187) of patients died during the hospitalization, 2.4% (n = 98) were admitted to the ICU after the exposure window, and the median LOS was 5.6 days. We did not observe a significant association between mean serum potassium of <4.0 or 4.0-4.5 mEq/L and increased risk of mortality, ICU transfer, or LOS (Table 3). Our unadjusted analysis showed that patients with values >4.5 mEq/L had worse outcomes, including more deaths (5.3%; OR = 1.55; 95% CI: 1.01 to 2.39) and ICU admission (3.8%; OR = 2.10; 95% CI: 1.16 to 3.80) compared with those with values <4.0 mEq/L (Table 3). We also found that, compared with the <4.0 mEq/L group, the >4.5 mEq/L group showed just over a half-day longer LOS (0.6 days; 95% CI: 0.0 to 1.0; Table 3). However, we found that mortality and ICU admission results were attenuated after adjustment for age, race, comorbidity score, and LAPS-2 and were no longer statistically significant, whereas the association with LOS was consistent after adjustment. When using a binary exposure (<4.0 versus ≥4.0 mEq/L), we observed no association between mean potassium value and increased risk of mortality, ICU transfer, or LOS both before and after adjustment for age, race, LAPS-2, and comorbidity score (data not shown).
Sensitivity Analyses
In the sensitivity analysis restricted to those who did not receive potassium repletion during the exposure window, we continued to observe no association between the <4.0 and 4.0-4.5 mEq/L groups and outcomes (Table 3). In adjusted models for the >4.5 versus <4.0 mEq/L groups, risk estimates for mortality were similar to the full sample, but statistical significance was lost (OR = 1.56; 95% CI: 0.81 to 3.01). Adjusted risk estimates for ICU transfer were attenuated and not statistically significant (OR = 1.40; 95% CI: 0.60 to 3.26). However, LOS estimates were very similar to that observed in the full dataset (0.6 days; 95% CI: 0.1 to 1.2).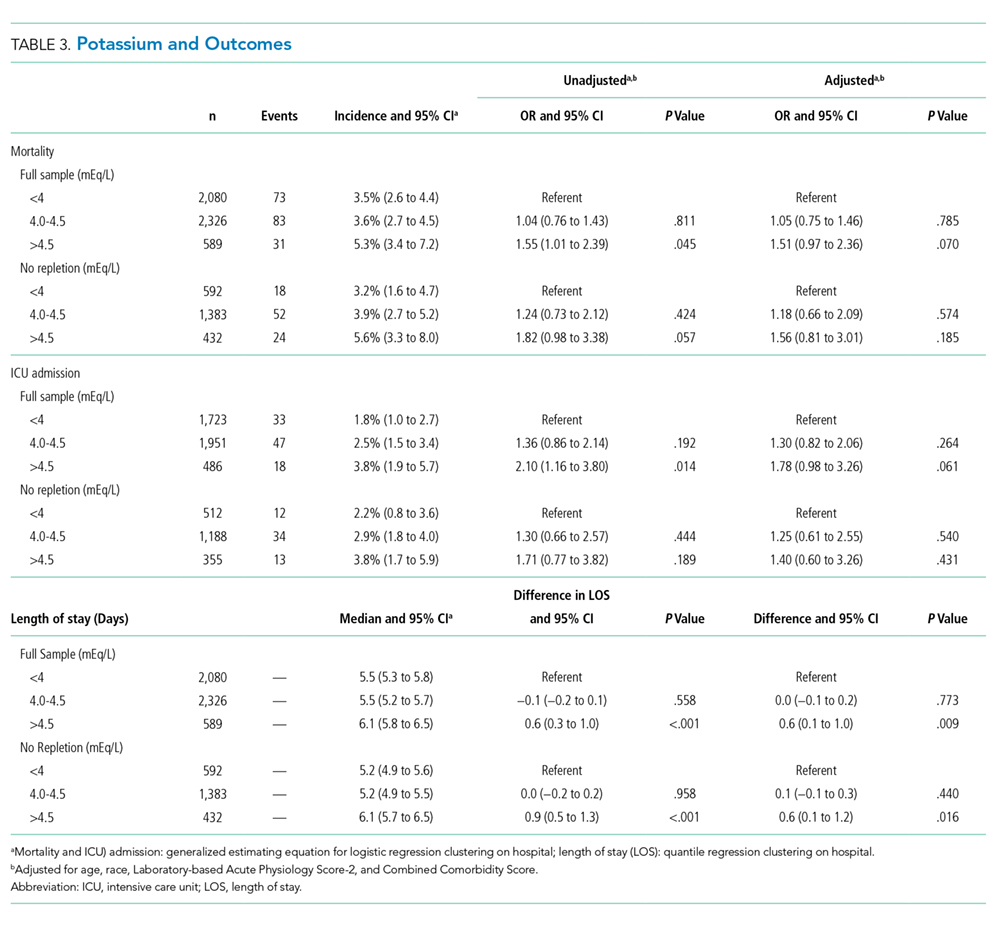
When stratifying our results by the presence or absence of acute or chronic renal insufficiency, we continued to observe no increased risk of any outcome in the 4.0-4.5 mEq/L compared with the <4.0 mEq/L groups across all strata (Table 4). Interestingly, even after adjustment, we did find that most of the increased risk of mortality and ICU admission in the >4.5 versus <4.0 mEq/L groups was among those without renal insufficiency (mortality OR = 3.03; ICU admission OR = 3.00) and was not statistically significant in those with renal insufficiency (mortality OR = 1.27; ICU admission OR = 1.63). Adjusted LOS estimates remained relatively similar in this stratified analysis.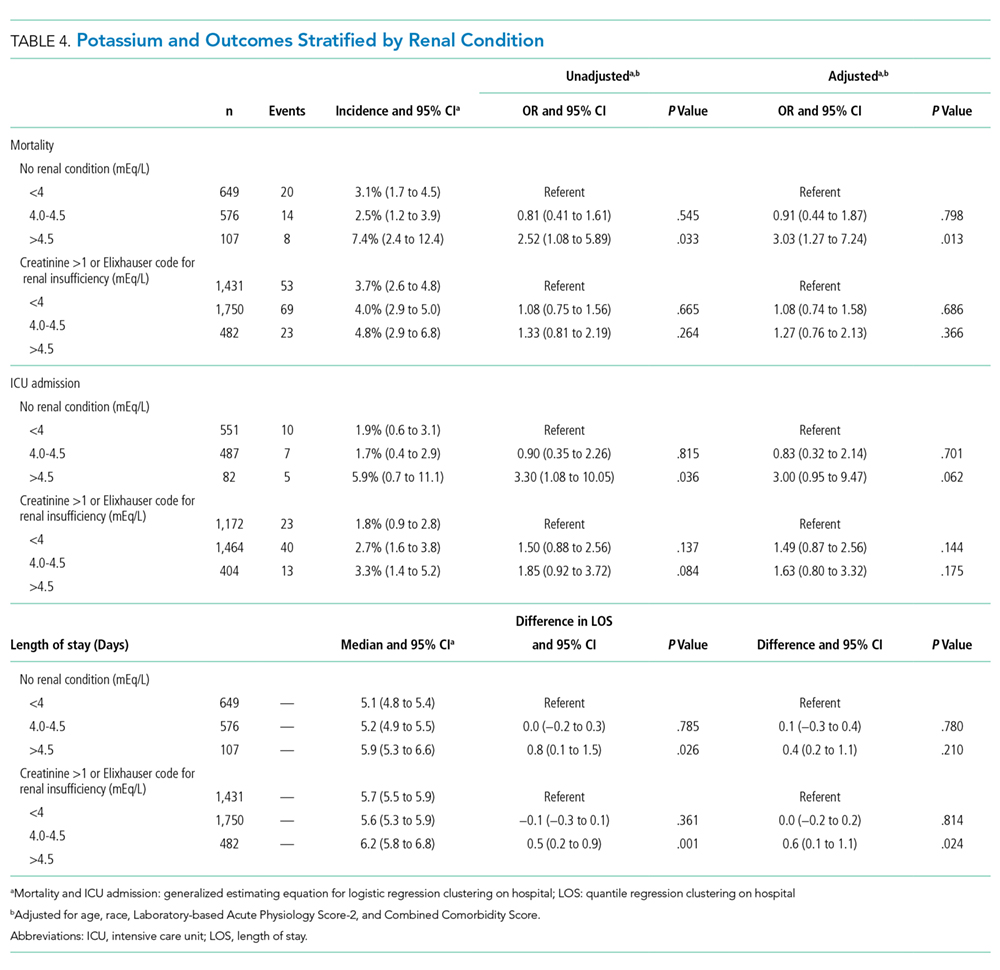
DISCUSSION
The best approach to mild serum potassium value abnormalities in patients hospitalized with HF remains unclear. Many physicians reflexively replete potassium to ensure all patients maintain a serum value of >4.0 mEq/L.15 Yet, in this large observational study of patients hospitalized with an acute HF exacerbation, we found little evidence of association between serum potassium <4.0 mEq/L and negative outcomes.
Compared with those with mean potassium values <4.0 mEq/L (in unadjusted models), there was an association between potassium values of >4.5 mEq/L and increased risk of mortality and ICU transfer. This association was attenuated after adjustment, suggesting that factors beyond potassium values influenced the observed relationship. These findings seem to suggest that unobserved differences in the >4.5 mEq/L group (there were observed differences in this group, eg, greater presenting severity and higher comorbidity scores, suggesting that there were also unobserved differences), and not average potassium value, were the reasons for the observed differences in outcomes. However, we cannot rule out the possibility that potassium >4.5 mEq/L has some associated increased risk compared with mean potassium values of <4.0 mEq/L for patients hospitalized with acute decompensated HF.
Patients in our study routinely received exogenous potassium: more than 70% of patients received repletion at least once, although it is notable that the majority of patients in the 4.0-4.5 and >4.5 mEq/L groups did not receive repletion. Despite this practice, the data supporting this approach to potassium management for patients hospitalized with HF remain mixed. A serum potassium decline of >15% during an acute HF hospital stay has been reported as a predictor of all-cause mortality after controlling for disease severity and associated comorbidities, including renal function.25 However, this study was focused on decline in admission potassium rather than an absolute cut-off (eg, >4.0 mEq/L). Additionally, potassium levels <3.9 mEq/L were associated with increased mortality in patients with acute HF following a myocardial infarction, but this study was not focused on patients with HF.26 Most of the prior literature in patients with HF was conducted in patients in outpatient settings and examined patients who were not experiencing acute exacerbations. MacDonald and Struthers advocate that patients with HF have their potassium maintained above 4.0 mEq/L but did not specify whether this included patients with acute HF exacerbations.10 Additionally, many studies evaluating potassium repletion were conducted before widespread availability of angiotensin-converting enzyme (ACE) inhibitors or potassium-sparing diuretics, including spironolactone. Prior work has consistently reported that hyperkalemia, defined as serum potassium >4.5 mEq/L, is associated with mortality in patients with acute HF over the course of hospitalization (which aligned with the results from our sensitivity analysis), but concurrent medication regimens and underlying impaired renal function likely accounted for most of this association.17 The picture is further complicated as patients with acute HF presenting with hypokalemia may be at risk for subsequent hyperkalemia, and potassium repletion can stimulate aldosterone secretion, potentially exacerbating underlying HF.27,28
These data are observational and are unlikely to change practice. However, daily potassium repletion represents a huge cost in time, money, and effort to the health system. Furthermore, the greatest burden occurs for the patients, who have labs drawn and values checked routinely and potassium administered orally or parenterally. While future randomized clinical trials (RCTs) would best examine the benefits of repletion, future pragmatic trials could attempt to disentangle the associated risks and benefits of potassium repletion in the absence of RCTs. Additionally, such studies could better take into account the role of concurrent medication use (like ACEs or angiotensin II receptor blockers), as well as assess the role of chronic renal insufficiency, acute kidney injury, and magnesium levels.29
This study has limitations. Its retrospective design leads to unmeasured confounding; however, we adjusted for multiple variables (including LAPS-2), which reflect the severity of disease at admission and underlying kidney function at presentation, as well as other comorbid conditions. In addition, data from the cohort only extend to 2012, so more recent changes in practice may not be completely reflected. The nature of the data did not allow us to directly investigate the relationship between serum potassium and arrhythmias, although ICU transfer and mortality were used as surrogates.
In conclusion, the benefit of a serum potassium level >4.0 mEq/L in patients admitted with HF remains unclear. We did not observe that mean potassium values <4.0 mEq/L were associated with worse outcomes, and, more concerning, there may be some risk for patients with mean values >4.5 mEq/L.
Acknowledgments
Dr. Lagu had full access to all the data in the study and takes responsibility for the integrity of the data and the accuracy of the data analysis.
Disclosures
The authors report no potential conflicts of interest. Dr. Lagu has served as a consultant for the Yale Center for Outcomes Research and Evaluation, under contract to the Centers for Medicare and Medicaid Services, for which she has provided clinical and methodological expertise and input on the development, reevaluation, and implementation of hospital outcome and efficiency measures.
Funding
Dr. Lagu is supported by the National Heart, Lung, and Blood Institute of the National Institutes of Health under Award Number K01HL114745 and R01 HL139985-01A1. Dr. Stefan is supported by the National Heart, Lung, and Blood Institute of the National Institutes of Health under Award Number K01HL114631-01A1. Dr. Pack is supported by NHLBI 1K23HL135440. Dr. Lindenauer is supported by the National Heart, Lung, and Blood Institute of the National Institutes of Health under Award Number 1K24HL132008.
Disclaimer
The views expressed in this manuscript do not necessarily reflect those of the Yale Center for Outcomes Research and Evaluation or the Centers for Medicare and Medicaid Services.
1. Benjamin EJ, Virani SS, Callaway CW, et al. Heart disease and stroke statistics–2018 update: a report from the American Heart Association. Circulation. 2018;137(12):e67-e492. https://doi.org/10.1161/CIR.0000000000000558.
2. Maggioni AP, Dahlström U, Filippatos G, et al. EURObservational Research Programme: regional differences and 1-year follow-up results of the Heart Failure Pilot Survey (ESC-HF Pilot). Eur J Heart Fail. 2013;15(7):808-817. https://doi.org/10.1093/eurjhf/hft050.
3. Tomaselli GF, Zipes DP. What causes sudden death in heart failure? Circ Res. 2004;95(8):754-763. https://doi.org/10.1161/01.RES.0000145047.
4. Bowen GS, Diop MS, Jiang L, Wu W-C, Rudolph JL. A multivariable prediction model for mortality in individuals admitted for heart failure. J Am Geriatr Soc. 2018;66(5):902-908. https://doi.org/10.1111/jgs.15319.
5. Lagu T, Pekow PS, Shieh M-S, et al. Validation and comparison of seven mortality prediction models for hospitalized patients with acute decompensated heart failure. Circ Heart Fail. 2016;9(8). https://doi.org/10.1161/CIRCHEARTFAILURE.115.002912.
6. Núñez J, Bayés-Genís A, Zannad F, et al. Long-term potassium monitoring and dynamics in heart failure and risk of mortality. Circulation. 2018;137(13):1320-1330. https://doi.org/10.1161/CIRCULATIONAHA.117.030576.
7. Vardeny O, Claggett B, Anand I, et al. Incidence, predictors, and outcomes related to hypo- and hyperkalemia in patients with severe heart failure treated with a mineralocorticoid receptor antagonist. Circ Heart Fail. 2014;7(4):573-579. https://doi.org/10.1161/CIRCHEARTFAILURE.114.00110.
8. Aldahl M, Jensen A-SC, Davidsen L, et al. Associations of serum potassium levels with mortality in chronic heart failure patients. Eur Heart J. 2017;38(38):2890-2896. https://doi.org/10.1093/eurheartj/ehx460.
9. Hoppe LK, Muhlack DC, Koenig W, Carr PR, Brenner H, Schöttker B. Association of abnormal serum potassium levels with arrhythmias and cardiovascular mortality: a systematic review and meta-analysis of observational studies. Cardiovasc Drugs Ther. 2018;32(2):197-212. https://doi.org/10.1007/s10557-018-6783-0.
10. Macdonald JE, Struthers AD. What is the optimal serum potassium level in cardiovascular patients? J Am Coll Cardiol. 2004;43(2):155-161. https://doi.org/10.1016/j.jacc.2003.06.021.
11. Hulting J. In-hospital ventricular fibrillation and its relation to serum potassium. Acta Med Scand Suppl. 1981;647(647):109-116. https://doi.org/10.1111/j.0954-6820.1981.tb02646.x.
12. Skogestad J, Aronsen JM. Hypokalemia-induced arrhythmias and heart failure: new insights and implications for therapy. Front Physiol. 2018;9:1500. https://doi.org/10.3389/fphys.2018.01500.
13. Tromp J, Ter Maaten JM, Damman K, et al. Serum potassium levels and outcome in acute heart failure (data from the PROTECT and COACH trials). Am J Cardiol. 2017;119(2):290-296. https://doi.org/10.1016/j.amjcard.2016.09.038.
14. Khan SS, Campia U, Chioncel O, et al. Changes in serum potassium levels during hospitalization in patients with worsening heart failure and reduced ejection fraction (from the EVEREST trial). Am J Cardiol. 2015;115(6):790-796. https://doi.org/10.1016/j.amjcard.2014.12.045
15. Viera AJ, Wouk N. Potassium disorders: hypokalemia and hyperkalemia. Am Fam Physician. 2015;92(6):487-495.
16. Krumholz HM, Wang Y, Mattera JA, et al. An administrative claims model suitable for profiling hospital performance based on 30-day mortality rates among patients with heart failure. Circulation. 2006;113(13):1693-1701. https://doi.org/10.1161/CIRCULATIONAHA.105.611194.
17. Legrand M, Ludes P-O, Massy Z, et al. Association between hypo- and hyperkalemia and outcome in acute heart failure patients: the role of medications. Clin Res Cardiol. 2018;107(3):214-221. https://doi.org/10.1007/s00392-017-1173-3.
18. Kok W, Salah K, Stienen S. Are changes in serum potassium levels during admissions for acute decompensated heart failure irrelevant for prognosis: the end of the story? Am J Cardiol. 2015;116(5):825. https://doi.org/10.1016/j.amjcard.2015.05.059.
19. Elixhauser A, Steiner C, Harris DR, Coffey RM. Comorbidity measures for use with administrative data. Med Care. 1998;36(1):8-27. https://doi.org/10.1097/00005650-199801000-00004.
20. Quan H, Parsons GA, Ghali WA. Validity of information on comorbidity derived from ICD-9-CCM administrative data. Med Care. 2002;40(8):675-685. https://doi.org/10.1097/01.MLR.0000020927.46398.5D.
21. Gagne JJ, Glynn RJ, Avorn J, Levin R, Schneeweiss S. A combined comorbidity score predicted mortality in elderly patients better than existing scores. J Clin Epidemiol. 2011;64(7):749-759. https://doi.org/10.1016/j.jclinepi.2010.10.004.
22. Escobar GJ, Gardner MN, Greene JD, Draper D, Kipnis P. Risk-adjusting hospital mortality using a comprehensive electronic record in an integrated health care delivery system. Med Care. 2013;51(5):446-453. https://doi.org/10.1097/MLR.0b013e3182881c8e.
23. Escobar GJ, Greene JD, Scheirer P, Gardner MN, Draper D, Kipnis P. Risk-adjusting hospital inpatient mortality using automated inpatient, outpatient, and laboratory databases. Med Care. 2008;46(3):232-239. https://doi.org/10.1097/MLR.0b013e3181589bb6.
24. Parente PMDC, Santos Silva JMC. Quantile regression with clustered data. J Econom Method. 2016;5(1):1-15. https://doi.org/10.1515/jem-2014-0011.
25. Salah K, Pinto YM, Eurlings LW, et al. Serum potassium decline during hospitalization for acute decompensated heart failure is a predictor of 6-month mortality, independent of N-terminal pro-B-type natriuretic peptide levels: An individual patient data analysis. Am Heart J. 2015;170(3):531-542.e1. https://doi.org/10.1016/j.ahj.2015.06.003.
26. Krogager ML, Eggers-Kaas L, Aasbjerg K, et al. Short-term mortality risk of serum potassium levels in acute heart failure following myocardial infarction. Eur Heart J Cardiovasc Pharmacother. 2015;1(4):245-251. https://doi.org/10.1093/ehjcvp/pvv026.
27. Crop MJ, Hoorn EJ, Lindemans J, Zietse R. Hypokalaemia and subsequent hyperkalaemia in hospitalized patients. Nephrol Dial Transplant. 2007;22(12):3471-3477.https://doi.org/10.1093/ndt/gfm471.
28. Kok W, Salah K, Stienen S. Serum potassium levels during admissions for acute decompensated heart failure: identifying possible threats to outcome. Am J Cardiol. 2018;121(1):141. https://doi.org/10.1016/j.amjcard.2017.09.032.
29. Freda BJ, Knee AB, Braden GL, Visintainer PF, Thakar CV. Effect of transient and sustained acute kidney injury on readmissions in acute decompensated heart failure. Am J Cardiol. 2017;119(11):1809-1814. https://doi.org/10.1016/j.amjcard.2017.02.044.
Heart failure (HF) is a leading cause of hospital admission and mortality, accounting for approximately 900,000 discharges in 2014.1 One-year all-cause mortality risk has been estimated at 17% after hospitalization,2 and roughly 50% of deaths are related to sudden cardiac death, mostly due to ventricular arrhythmia.
The principles underlying potassium management in acute HF are complex. Both low and high values have been linked to fatal arrhythmias, notably ventricular fibrillation, and small serum changes often reflect large total body potassium fluctuations.11 Recent literature links hypokalemia to general membrane hypoexcitability, skeletal muscle hyporeflexia, and arrhythmias initiated by reduced sodium-potassium adenosine triphosphatase activity, leading to increased intracellular calcium and regional variations in action potential duration.12 Potassium abnormalities are common at admission and may be exacerbated by both acute illness and treatments given during hospitalization, including baseline potassium, acute kidney injury, aggressive diuretic therapy, or other potassium-related treatments and conditions.13 The success of potassium repletion may also be affected by the choice of HF therapies.14
The belief that patients with HF must maintain a potassium >4.0 mEq/L remains pervasive, with at least one family medicine guideline recommending that patients with HF maintain a serum potassium level >4.0 mEq/L.
METHODS
Data Sources and Cohort Definition
The Institutional Review Board at Baystate Medical Center approved this study. We identified patients with HF who were admitted for more than 72 hours between January 2010 and December 2012 to hospitals contributing to the HealthFacts database, a multihospital dataset derived from the comprehensive electronic health records of 116 geographically and structurally diverse hospitals throughout the United States (Cerner Corp.). HealthFacts—which includes date-stamped pharmacy, laboratory, and billing information—contains records of more than 84 million acute admissions, emergency room visits, and ambulatory visits. We limited the sample to hospitals that contributed to the pharmacy, laboratory, and diagnosis segments.
We included patients who had a principal International Classification of Disease (ICD-9-CM) diagnosis of HF or a principal diagnosis of respiratory failure with secondary diagnosis of HF (ICD-9-CM codes for HF: 402.01, 402.11, 402.91, 404.01, 404.03, 404.11, 404.13, 404.91, 404.93, 428.xx16 and for respiratory failure: 518.81, 518.82, 518.84) and were 18 years or older. We ensured that patients were treated for acute decompensated HF during the hospitalization by restricting the cohort to patients in whom at least one HF therapy (eg, loop diuretics, metolazone, inotropes, and intra-aortic balloon pump) was initiated within the first two days of hospitalization. We excluded patients with a pediatric or psychiatric attending physician, those with elective admissions, and those who were transferred from or to another acute care facility because we could not accurately determine the onset or subsequent course of their illness.
Definition of Variables Describing Serum Potassium Levels
We limited the sample to patients hospitalized for longer than 72 hours in order to observe how initial potassium values influenced outcomes over the course of hospitalization. We chose an exposure window of 72 hours because this allowed, on average, three potential observations of serum potassium per patient. We further restricted the sample to those who had a normal potassium value (3.5-5.0 mEq/L) at admission (defined as 24 hours prior to admission through midnight of the day of admission) to ensure that the included patients did not have abnormal potassium values upon presentation. We identified the period of time from 24 hours prior to admission through 72 hours following admission as “the exposure window” (the time during which patients were eligible to be classified into average serum potassium levels of <4.0, 4.0-4.5, or >4.5 mEq/L). We excluded patients who, during this window, had fewer than three serum potassium levels drawn (“exposure” levels could be disproportionately influenced by a single value) or received sodium polystyrene (as this would indicate that the physicians felt the potassium was dangerously high). For patients with repeated hospitalizations, we randomly selected one visit for inclusion to reduce the risk of survivor bias. We calculated the mean of all serum potassium levels during the exposure window, including the admission value, and then evaluated two different categorizations of mean serum potassium, based on categories of risk previously reported in the literature:8,17,18: (1) <4.0, 4.0-4.5, or >4.5 mEq/L and (2) <4.0 versus ≥4.0 mEq/L.
Outcomes
We assessed three outcomes: in-hospital mortality, transfer to an intensive care unit (ICU), and length of stay (LOS). Admission to the ICU was defined as any evidence, after the exposure window, that the patient received care in the ICU. We excluded patients with ICU admissions during the exposure window from the analysis of this outcome. We calculated LOS as the difference between discharge date/time and the admission date/time.
Covariates and Comorbidity Adjustment
We obtained information on patient demographics (age and race) and identified the presence of comorbid conditions using previously derived and validated models.19,20 We then further quantified these conditions into a single combined score to adjust for differences in presenting illness severity (including kidney disease) and help reduce confounding.21 To account for presenting severity of illness, we calculated the Laboratory-based Acute Physiology Score (LAPS-2).22,23 LAPS-2 was developed for predicting mortality risk in general medical patients, but we previously externally validated it against other published clinical HF models in a cohort of patients hospitalized with acute decompensated HF.5
Potassium Repletion
Analysis
We evaluated the differences in patient characteristics across serum potassium categories. Categorical variables are presented as frequencies and percentages, whereas continuous variables are presented as means and standard deviations. For binary outcomes, we used generalized estimating equations (with a binomial family and logit link and clustering by hospital) to estimate incidence and calculate unadjusted and adjusted odds ratios (ORs) and 95% confidence intervals (CIs). For LOS, we estimated the median and 95% CIs using quantile regression with clustered standard errors.24 We calculated all models using both a binary exposure (<4.0 versus ≥4.0 mEq/L) and a three-level categorization (<4.0, 4.0-4.5, and >4.5 mEq/L) to explore the effects at the highest potassium level. We adjusted all models for age, race, LAPS-2 score, and combined comorbidity score. We conducted two sensitivity analyses. First, we restricted our sample to those who never received potassium during the exposure window, as these patients may be different than patients who required potassium repletion. Second, we stratified our findings by the presence or absence of acute or chronic renal insufficiency (defined as an admission creatinine >1 or the presence of a diagnostic code for renal insufficiency, as defined by Elixhauser et al.).19,21 Statistical significance was set at an alpha of 0.05. Analysis was completed using Stata v15.1, StataCorp LP, College Station, Texas.
RESULTS
Cohort Description
We identified patients from 56 geographically diverse US hospitals, although most were located in either the northeast (n = 21; 38%) or south (n = 18; 32%). A total of 59% of the hospitals were teaching hospitals, and nearly 95% were in an urban setting. We identified 13,163 patients with HF, of which 4,995 (38.0%) met the inclusion criteria. We excluded 3,744 (28.4%) patients with LOS < 72 hours, 2,210 (16.8%) with admission potassium values outside of the defined range, and 896 (6.8%) with fewer than three potassium values during the exposure window. Of the patients who met the inclusion criteria, 2,080 (41.6%), 2,326 (46.6%), and 589 (11.8%) were categorized in the <4.0, 4.0-4.5, and >4.5 mEq/L groups, respectively (Table 1). The groups were clinically similar in terms of age, sex, illness severity (LAPS-2), and comorbidity score. Compared with other racial groups, black patients had higher potassium values. While the <4.0 and 4.0-4.5 mEq/L groups were relatively similar, the group with mean potassium >4.5 mEq/L had higher admission creatinine and a greater prevalence of chronic kidney disease, deficiency anemias, and chronic obstructive pulmonary disease (Table 1).
Serum Potassium Values
Individuals’ mean serum potassium within the 72-hour exposure window ranged from 2.9 to 5.8 mEq/L (Table 2). In the <4.0, 4-4.5, and >4.5 mEq/L cohorts respectively, patients had a median serum potassium of 3.8 mEq/L (2.9-3.9), 4.2 mEq/L (4.0-4.5), and 4.7 mEq/L (4.5-5.8) during the exposure window. Approximately half of the patients in the <4.0 mEq/L group had a serum potassium <3.5 mEq/L at some point during the exposure window. In contrast, <10% of the other groups had this low value during the exposure window.
Potassium Repletion
Patients in the <4.0 mEq/L group were much more likely to receive potassium repletion during the exposure window when compared with the 4.0-4.5 mEq/L (71.5% vs 40.5%) and >4.5 mEq/L (71.5% vs 26.7%) groups. On days that they were eligible for repletion (defined as a daily potassium value <4.0 mEq/L), patients with mean serum potassium >4.0 mEq/L were less likely to receive potassium repletion compared with those with values <4.0 mEq/L. There were 592 (28.5%), 1,383 (59.5%), and 432 (73.3%) patients in the <4.0, 4-4.5, and >4,5 mEq/L groups, respectively, who did not receive potassium repletion therapy during the exposure window.
Relationship of Serum Potassium Levels and Outcomes
Overall, 3.7% (n = 187) of patients died during the hospitalization, 2.4% (n = 98) were admitted to the ICU after the exposure window, and the median LOS was 5.6 days. We did not observe a significant association between mean serum potassium of <4.0 or 4.0-4.5 mEq/L and increased risk of mortality, ICU transfer, or LOS (Table 3). Our unadjusted analysis showed that patients with values >4.5 mEq/L had worse outcomes, including more deaths (5.3%; OR = 1.55; 95% CI: 1.01 to 2.39) and ICU admission (3.8%; OR = 2.10; 95% CI: 1.16 to 3.80) compared with those with values <4.0 mEq/L (Table 3). We also found that, compared with the <4.0 mEq/L group, the >4.5 mEq/L group showed just over a half-day longer LOS (0.6 days; 95% CI: 0.0 to 1.0; Table 3). However, we found that mortality and ICU admission results were attenuated after adjustment for age, race, comorbidity score, and LAPS-2 and were no longer statistically significant, whereas the association with LOS was consistent after adjustment. When using a binary exposure (<4.0 versus ≥4.0 mEq/L), we observed no association between mean potassium value and increased risk of mortality, ICU transfer, or LOS both before and after adjustment for age, race, LAPS-2, and comorbidity score (data not shown).
Sensitivity Analyses
In the sensitivity analysis restricted to those who did not receive potassium repletion during the exposure window, we continued to observe no association between the <4.0 and 4.0-4.5 mEq/L groups and outcomes (Table 3). In adjusted models for the >4.5 versus <4.0 mEq/L groups, risk estimates for mortality were similar to the full sample, but statistical significance was lost (OR = 1.56; 95% CI: 0.81 to 3.01). Adjusted risk estimates for ICU transfer were attenuated and not statistically significant (OR = 1.40; 95% CI: 0.60 to 3.26). However, LOS estimates were very similar to that observed in the full dataset (0.6 days; 95% CI: 0.1 to 1.2).
When stratifying our results by the presence or absence of acute or chronic renal insufficiency, we continued to observe no increased risk of any outcome in the 4.0-4.5 mEq/L compared with the <4.0 mEq/L groups across all strata (Table 4). Interestingly, even after adjustment, we did find that most of the increased risk of mortality and ICU admission in the >4.5 versus <4.0 mEq/L groups was among those without renal insufficiency (mortality OR = 3.03; ICU admission OR = 3.00) and was not statistically significant in those with renal insufficiency (mortality OR = 1.27; ICU admission OR = 1.63). Adjusted LOS estimates remained relatively similar in this stratified analysis.
DISCUSSION
The best approach to mild serum potassium value abnormalities in patients hospitalized with HF remains unclear. Many physicians reflexively replete potassium to ensure all patients maintain a serum value of >4.0 mEq/L.15 Yet, in this large observational study of patients hospitalized with an acute HF exacerbation, we found little evidence of association between serum potassium <4.0 mEq/L and negative outcomes.
Compared with those with mean potassium values <4.0 mEq/L (in unadjusted models), there was an association between potassium values of >4.5 mEq/L and increased risk of mortality and ICU transfer. This association was attenuated after adjustment, suggesting that factors beyond potassium values influenced the observed relationship. These findings seem to suggest that unobserved differences in the >4.5 mEq/L group (there were observed differences in this group, eg, greater presenting severity and higher comorbidity scores, suggesting that there were also unobserved differences), and not average potassium value, were the reasons for the observed differences in outcomes. However, we cannot rule out the possibility that potassium >4.5 mEq/L has some associated increased risk compared with mean potassium values of <4.0 mEq/L for patients hospitalized with acute decompensated HF.
Patients in our study routinely received exogenous potassium: more than 70% of patients received repletion at least once, although it is notable that the majority of patients in the 4.0-4.5 and >4.5 mEq/L groups did not receive repletion. Despite this practice, the data supporting this approach to potassium management for patients hospitalized with HF remain mixed. A serum potassium decline of >15% during an acute HF hospital stay has been reported as a predictor of all-cause mortality after controlling for disease severity and associated comorbidities, including renal function.25 However, this study was focused on decline in admission potassium rather than an absolute cut-off (eg, >4.0 mEq/L). Additionally, potassium levels <3.9 mEq/L were associated with increased mortality in patients with acute HF following a myocardial infarction, but this study was not focused on patients with HF.26 Most of the prior literature in patients with HF was conducted in patients in outpatient settings and examined patients who were not experiencing acute exacerbations. MacDonald and Struthers advocate that patients with HF have their potassium maintained above 4.0 mEq/L but did not specify whether this included patients with acute HF exacerbations.10 Additionally, many studies evaluating potassium repletion were conducted before widespread availability of angiotensin-converting enzyme (ACE) inhibitors or potassium-sparing diuretics, including spironolactone. Prior work has consistently reported that hyperkalemia, defined as serum potassium >4.5 mEq/L, is associated with mortality in patients with acute HF over the course of hospitalization (which aligned with the results from our sensitivity analysis), but concurrent medication regimens and underlying impaired renal function likely accounted for most of this association.17 The picture is further complicated as patients with acute HF presenting with hypokalemia may be at risk for subsequent hyperkalemia, and potassium repletion can stimulate aldosterone secretion, potentially exacerbating underlying HF.27,28
These data are observational and are unlikely to change practice. However, daily potassium repletion represents a huge cost in time, money, and effort to the health system. Furthermore, the greatest burden occurs for the patients, who have labs drawn and values checked routinely and potassium administered orally or parenterally. While future randomized clinical trials (RCTs) would best examine the benefits of repletion, future pragmatic trials could attempt to disentangle the associated risks and benefits of potassium repletion in the absence of RCTs. Additionally, such studies could better take into account the role of concurrent medication use (like ACEs or angiotensin II receptor blockers), as well as assess the role of chronic renal insufficiency, acute kidney injury, and magnesium levels.29
This study has limitations. Its retrospective design leads to unmeasured confounding; however, we adjusted for multiple variables (including LAPS-2), which reflect the severity of disease at admission and underlying kidney function at presentation, as well as other comorbid conditions. In addition, data from the cohort only extend to 2012, so more recent changes in practice may not be completely reflected. The nature of the data did not allow us to directly investigate the relationship between serum potassium and arrhythmias, although ICU transfer and mortality were used as surrogates.
In conclusion, the benefit of a serum potassium level >4.0 mEq/L in patients admitted with HF remains unclear. We did not observe that mean potassium values <4.0 mEq/L were associated with worse outcomes, and, more concerning, there may be some risk for patients with mean values >4.5 mEq/L.
Acknowledgments
Dr. Lagu had full access to all the data in the study and takes responsibility for the integrity of the data and the accuracy of the data analysis.
Disclosures
The authors report no potential conflicts of interest. Dr. Lagu has served as a consultant for the Yale Center for Outcomes Research and Evaluation, under contract to the Centers for Medicare and Medicaid Services, for which she has provided clinical and methodological expertise and input on the development, reevaluation, and implementation of hospital outcome and efficiency measures.
Funding
Dr. Lagu is supported by the National Heart, Lung, and Blood Institute of the National Institutes of Health under Award Number K01HL114745 and R01 HL139985-01A1. Dr. Stefan is supported by the National Heart, Lung, and Blood Institute of the National Institutes of Health under Award Number K01HL114631-01A1. Dr. Pack is supported by NHLBI 1K23HL135440. Dr. Lindenauer is supported by the National Heart, Lung, and Blood Institute of the National Institutes of Health under Award Number 1K24HL132008.
Disclaimer
The views expressed in this manuscript do not necessarily reflect those of the Yale Center for Outcomes Research and Evaluation or the Centers for Medicare and Medicaid Services.
1. Benjamin EJ, Virani SS, Callaway CW, et al. Heart disease and stroke statistics–2018 update: a report from the American Heart Association. Circulation. 2018;137(12):e67-e492. https://doi.org/10.1161/CIR.0000000000000558.
2. Maggioni AP, Dahlström U, Filippatos G, et al. EURObservational Research Programme: regional differences and 1-year follow-up results of the Heart Failure Pilot Survey (ESC-HF Pilot). Eur J Heart Fail. 2013;15(7):808-817. https://doi.org/10.1093/eurjhf/hft050.
3. Tomaselli GF, Zipes DP. What causes sudden death in heart failure? Circ Res. 2004;95(8):754-763. https://doi.org/10.1161/01.RES.0000145047.
4. Bowen GS, Diop MS, Jiang L, Wu W-C, Rudolph JL. A multivariable prediction model for mortality in individuals admitted for heart failure. J Am Geriatr Soc. 2018;66(5):902-908. https://doi.org/10.1111/jgs.15319.
5. Lagu T, Pekow PS, Shieh M-S, et al. Validation and comparison of seven mortality prediction models for hospitalized patients with acute decompensated heart failure. Circ Heart Fail. 2016;9(8). https://doi.org/10.1161/CIRCHEARTFAILURE.115.002912.
6. Núñez J, Bayés-Genís A, Zannad F, et al. Long-term potassium monitoring and dynamics in heart failure and risk of mortality. Circulation. 2018;137(13):1320-1330. https://doi.org/10.1161/CIRCULATIONAHA.117.030576.
7. Vardeny O, Claggett B, Anand I, et al. Incidence, predictors, and outcomes related to hypo- and hyperkalemia in patients with severe heart failure treated with a mineralocorticoid receptor antagonist. Circ Heart Fail. 2014;7(4):573-579. https://doi.org/10.1161/CIRCHEARTFAILURE.114.00110.
8. Aldahl M, Jensen A-SC, Davidsen L, et al. Associations of serum potassium levels with mortality in chronic heart failure patients. Eur Heart J. 2017;38(38):2890-2896. https://doi.org/10.1093/eurheartj/ehx460.
9. Hoppe LK, Muhlack DC, Koenig W, Carr PR, Brenner H, Schöttker B. Association of abnormal serum potassium levels with arrhythmias and cardiovascular mortality: a systematic review and meta-analysis of observational studies. Cardiovasc Drugs Ther. 2018;32(2):197-212. https://doi.org/10.1007/s10557-018-6783-0.
10. Macdonald JE, Struthers AD. What is the optimal serum potassium level in cardiovascular patients? J Am Coll Cardiol. 2004;43(2):155-161. https://doi.org/10.1016/j.jacc.2003.06.021.
11. Hulting J. In-hospital ventricular fibrillation and its relation to serum potassium. Acta Med Scand Suppl. 1981;647(647):109-116. https://doi.org/10.1111/j.0954-6820.1981.tb02646.x.
12. Skogestad J, Aronsen JM. Hypokalemia-induced arrhythmias and heart failure: new insights and implications for therapy. Front Physiol. 2018;9:1500. https://doi.org/10.3389/fphys.2018.01500.
13. Tromp J, Ter Maaten JM, Damman K, et al. Serum potassium levels and outcome in acute heart failure (data from the PROTECT and COACH trials). Am J Cardiol. 2017;119(2):290-296. https://doi.org/10.1016/j.amjcard.2016.09.038.
14. Khan SS, Campia U, Chioncel O, et al. Changes in serum potassium levels during hospitalization in patients with worsening heart failure and reduced ejection fraction (from the EVEREST trial). Am J Cardiol. 2015;115(6):790-796. https://doi.org/10.1016/j.amjcard.2014.12.045
15. Viera AJ, Wouk N. Potassium disorders: hypokalemia and hyperkalemia. Am Fam Physician. 2015;92(6):487-495.
16. Krumholz HM, Wang Y, Mattera JA, et al. An administrative claims model suitable for profiling hospital performance based on 30-day mortality rates among patients with heart failure. Circulation. 2006;113(13):1693-1701. https://doi.org/10.1161/CIRCULATIONAHA.105.611194.
17. Legrand M, Ludes P-O, Massy Z, et al. Association between hypo- and hyperkalemia and outcome in acute heart failure patients: the role of medications. Clin Res Cardiol. 2018;107(3):214-221. https://doi.org/10.1007/s00392-017-1173-3.
18. Kok W, Salah K, Stienen S. Are changes in serum potassium levels during admissions for acute decompensated heart failure irrelevant for prognosis: the end of the story? Am J Cardiol. 2015;116(5):825. https://doi.org/10.1016/j.amjcard.2015.05.059.
19. Elixhauser A, Steiner C, Harris DR, Coffey RM. Comorbidity measures for use with administrative data. Med Care. 1998;36(1):8-27. https://doi.org/10.1097/00005650-199801000-00004.
20. Quan H, Parsons GA, Ghali WA. Validity of information on comorbidity derived from ICD-9-CCM administrative data. Med Care. 2002;40(8):675-685. https://doi.org/10.1097/01.MLR.0000020927.46398.5D.
21. Gagne JJ, Glynn RJ, Avorn J, Levin R, Schneeweiss S. A combined comorbidity score predicted mortality in elderly patients better than existing scores. J Clin Epidemiol. 2011;64(7):749-759. https://doi.org/10.1016/j.jclinepi.2010.10.004.
22. Escobar GJ, Gardner MN, Greene JD, Draper D, Kipnis P. Risk-adjusting hospital mortality using a comprehensive electronic record in an integrated health care delivery system. Med Care. 2013;51(5):446-453. https://doi.org/10.1097/MLR.0b013e3182881c8e.
23. Escobar GJ, Greene JD, Scheirer P, Gardner MN, Draper D, Kipnis P. Risk-adjusting hospital inpatient mortality using automated inpatient, outpatient, and laboratory databases. Med Care. 2008;46(3):232-239. https://doi.org/10.1097/MLR.0b013e3181589bb6.
24. Parente PMDC, Santos Silva JMC. Quantile regression with clustered data. J Econom Method. 2016;5(1):1-15. https://doi.org/10.1515/jem-2014-0011.
25. Salah K, Pinto YM, Eurlings LW, et al. Serum potassium decline during hospitalization for acute decompensated heart failure is a predictor of 6-month mortality, independent of N-terminal pro-B-type natriuretic peptide levels: An individual patient data analysis. Am Heart J. 2015;170(3):531-542.e1. https://doi.org/10.1016/j.ahj.2015.06.003.
26. Krogager ML, Eggers-Kaas L, Aasbjerg K, et al. Short-term mortality risk of serum potassium levels in acute heart failure following myocardial infarction. Eur Heart J Cardiovasc Pharmacother. 2015;1(4):245-251. https://doi.org/10.1093/ehjcvp/pvv026.
27. Crop MJ, Hoorn EJ, Lindemans J, Zietse R. Hypokalaemia and subsequent hyperkalaemia in hospitalized patients. Nephrol Dial Transplant. 2007;22(12):3471-3477.https://doi.org/10.1093/ndt/gfm471.
28. Kok W, Salah K, Stienen S. Serum potassium levels during admissions for acute decompensated heart failure: identifying possible threats to outcome. Am J Cardiol. 2018;121(1):141. https://doi.org/10.1016/j.amjcard.2017.09.032.
29. Freda BJ, Knee AB, Braden GL, Visintainer PF, Thakar CV. Effect of transient and sustained acute kidney injury on readmissions in acute decompensated heart failure. Am J Cardiol. 2017;119(11):1809-1814. https://doi.org/10.1016/j.amjcard.2017.02.044.
© 2019 Society of Hospital Medicine