User login
Examining the “Repletion Reflex”: The Association between Serum Potassium and Outcomes in Hospitalized Patients with Heart Failure
Heart failure (HF) is a leading cause of hospital admission and mortality, accounting for approximately 900,000 discharges in 2014.1 One-year all-cause mortality risk has been estimated at 17% after hospitalization,2 and roughly 50% of deaths are related to sudden cardiac death, mostly due to ventricular arrhythmia.
The principles underlying potassium management in acute HF are complex. Both low and high values have been linked to fatal arrhythmias, notably ventricular fibrillation, and small serum changes often reflect large total body potassium fluctuations.11 Recent literature links hypokalemia to general membrane hypoexcitability, skeletal muscle hyporeflexia, and arrhythmias initiated by reduced sodium-potassium adenosine triphosphatase activity, leading to increased intracellular calcium and regional variations in action potential duration.12 Potassium abnormalities are common at admission and may be exacerbated by both acute illness and treatments given during hospitalization, including baseline potassium, acute kidney injury, aggressive diuretic therapy, or other potassium-related treatments and conditions.13 The success of potassium repletion may also be affected by the choice of HF therapies.14
The belief that patients with HF must maintain a potassium >4.0 mEq/L remains pervasive, with at least one family medicine guideline recommending that patients with HF maintain a serum potassium level >4.0 mEq/L.
METHODS
Data Sources and Cohort Definition
The Institutional Review Board at Baystate Medical Center approved this study. We identified patients with HF who were admitted for more than 72 hours between January 2010 and December 2012 to hospitals contributing to the HealthFacts database, a multihospital dataset derived from the comprehensive electronic health records of 116 geographically and structurally diverse hospitals throughout the United States (Cerner Corp.). HealthFacts—which includes date-stamped pharmacy, laboratory, and billing information—contains records of more than 84 million acute admissions, emergency room visits, and ambulatory visits. We limited the sample to hospitals that contributed to the pharmacy, laboratory, and diagnosis segments.
We included patients who had a principal International Classification of Disease (ICD-9-CM) diagnosis of HF or a principal diagnosis of respiratory failure with secondary diagnosis of HF (ICD-9-CM codes for HF: 402.01, 402.11, 402.91, 404.01, 404.03, 404.11, 404.13, 404.91, 404.93, 428.xx16 and for respiratory failure: 518.81, 518.82, 518.84) and were 18 years or older. We ensured that patients were treated for acute decompensated HF during the hospitalization by restricting the cohort to patients in whom at least one HF therapy (eg, loop diuretics, metolazone, inotropes, and intra-aortic balloon pump) was initiated within the first two days of hospitalization. We excluded patients with a pediatric or psychiatric attending physician, those with elective admissions, and those who were transferred from or to another acute care facility because we could not accurately determine the onset or subsequent course of their illness.
Definition of Variables Describing Serum Potassium Levels
We limited the sample to patients hospitalized for longer than 72 hours in order to observe how initial potassium values influenced outcomes over the course of hospitalization. We chose an exposure window of 72 hours because this allowed, on average, three potential observations of serum potassium per patient. We further restricted the sample to those who had a normal potassium value (3.5-5.0 mEq/L) at admission (defined as 24 hours prior to admission through midnight of the day of admission) to ensure that the included patients did not have abnormal potassium values upon presentation. We identified the period of time from 24 hours prior to admission through 72 hours following admission as “the exposure window” (the time during which patients were eligible to be classified into average serum potassium levels of <4.0, 4.0-4.5, or >4.5 mEq/L). We excluded patients who, during this window, had fewer than three serum potassium levels drawn (“exposure” levels could be disproportionately influenced by a single value) or received sodium polystyrene (as this would indicate that the physicians felt the potassium was dangerously high). For patients with repeated hospitalizations, we randomly selected one visit for inclusion to reduce the risk of survivor bias. We calculated the mean of all serum potassium levels during the exposure window, including the admission value, and then evaluated two different categorizations of mean serum potassium, based on categories of risk previously reported in the literature:8,17,18: (1) <4.0, 4.0-4.5, or >4.5 mEq/L and (2) <4.0 versus ≥4.0 mEq/L.
Outcomes
We assessed three outcomes: in-hospital mortality, transfer to an intensive care unit (ICU), and length of stay (LOS). Admission to the ICU was defined as any evidence, after the exposure window, that the patient received care in the ICU. We excluded patients with ICU admissions during the exposure window from the analysis of this outcome. We calculated LOS as the difference between discharge date/time and the admission date/time.
Covariates and Comorbidity Adjustment
We obtained information on patient demographics (age and race) and identified the presence of comorbid conditions using previously derived and validated models.19,20 We then further quantified these conditions into a single combined score to adjust for differences in presenting illness severity (including kidney disease) and help reduce confounding.21 To account for presenting severity of illness, we calculated the Laboratory-based Acute Physiology Score (LAPS-2).22,23 LAPS-2 was developed for predicting mortality risk in general medical patients, but we previously externally validated it against other published clinical HF models in a cohort of patients hospitalized with acute decompensated HF.5
Potassium Repletion
Analysis
We evaluated the differences in patient characteristics across serum potassium categories. Categorical variables are presented as frequencies and percentages, whereas continuous variables are presented as means and standard deviations. For binary outcomes, we used generalized estimating equations (with a binomial family and logit link and clustering by hospital) to estimate incidence and calculate unadjusted and adjusted odds ratios (ORs) and 95% confidence intervals (CIs). For LOS, we estimated the median and 95% CIs using quantile regression with clustered standard errors.24 We calculated all models using both a binary exposure (<4.0 versus ≥4.0 mEq/L) and a three-level categorization (<4.0, 4.0-4.5, and >4.5 mEq/L) to explore the effects at the highest potassium level. We adjusted all models for age, race, LAPS-2 score, and combined comorbidity score. We conducted two sensitivity analyses. First, we restricted our sample to those who never received potassium during the exposure window, as these patients may be different than patients who required potassium repletion. Second, we stratified our findings by the presence or absence of acute or chronic renal insufficiency (defined as an admission creatinine >1 or the presence of a diagnostic code for renal insufficiency, as defined by Elixhauser et al.).19,21 Statistical significance was set at an alpha of 0.05. Analysis was completed using Stata v15.1, StataCorp LP, College Station, Texas.
RESULTS
Cohort Description
We identified patients from 56 geographically diverse US hospitals, although most were located in either the northeast (n = 21; 38%) or south (n = 18; 32%). A total of 59% of the hospitals were teaching hospitals, and nearly 95% were in an urban setting. We identified 13,163 patients with HF, of which 4,995 (38.0%) met the inclusion criteria. We excluded 3,744 (28.4%) patients with LOS < 72 hours, 2,210 (16.8%) with admission potassium values outside of the defined range, and 896 (6.8%) with fewer than three potassium values during the exposure window. Of the patients who met the inclusion criteria, 2,080 (41.6%), 2,326 (46.6%), and 589 (11.8%) were categorized in the <4.0, 4.0-4.5, and >4.5 mEq/L groups, respectively (Table 1). The groups were clinically similar in terms of age, sex, illness severity (LAPS-2), and comorbidity score. Compared with other racial groups, black patients had higher potassium values. While the <4.0 and 4.0-4.5 mEq/L groups were relatively similar, the group with mean potassium >4.5 mEq/L had higher admission creatinine and a greater prevalence of chronic kidney disease, deficiency anemias, and chronic obstructive pulmonary disease (Table 1).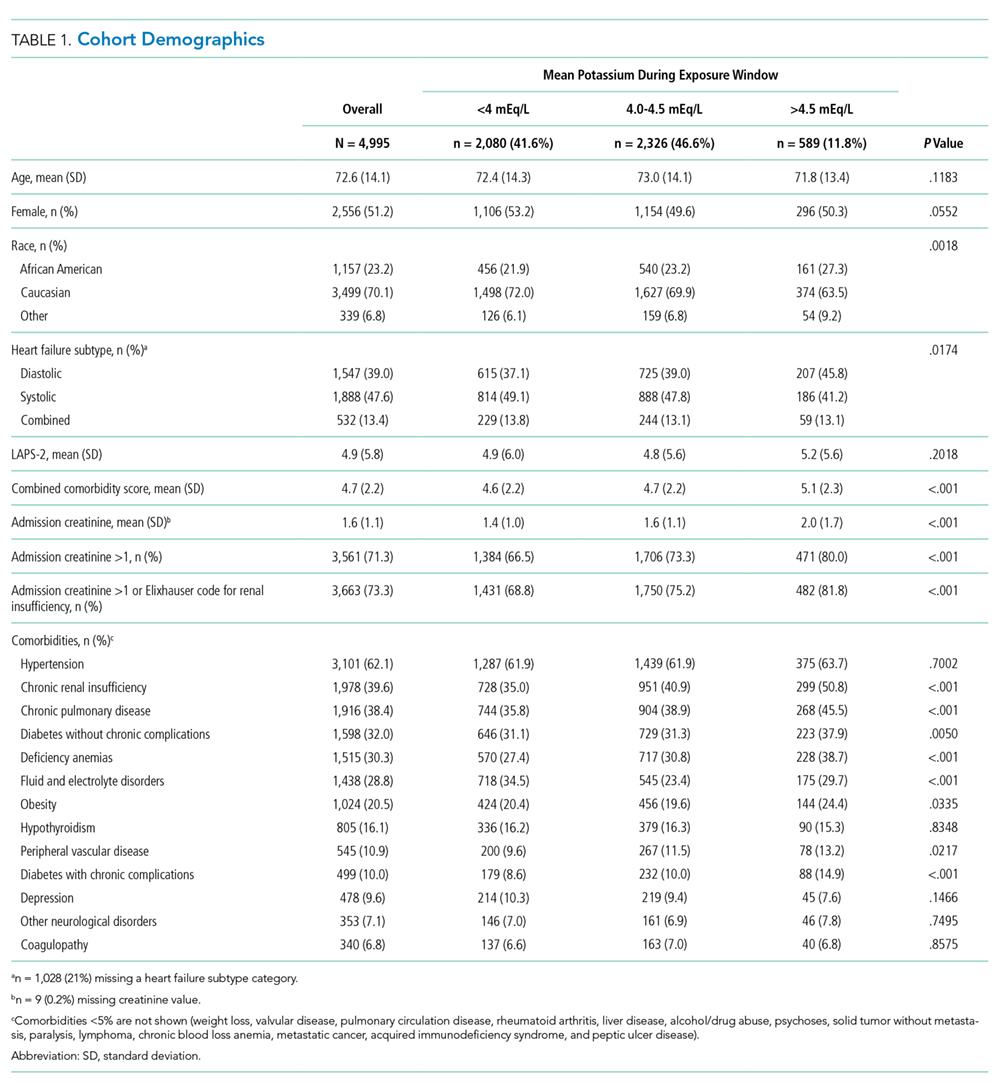
Serum Potassium Values
Individuals’ mean serum potassium within the 72-hour exposure window ranged from 2.9 to 5.8 mEq/L (Table 2). In the <4.0, 4-4.5, and >4.5 mEq/L cohorts respectively, patients had a median serum potassium of 3.8 mEq/L (2.9-3.9), 4.2 mEq/L (4.0-4.5), and 4.7 mEq/L (4.5-5.8) during the exposure window. Approximately half of the patients in the <4.0 mEq/L group had a serum potassium <3.5 mEq/L at some point during the exposure window. In contrast, <10% of the other groups had this low value during the exposure window.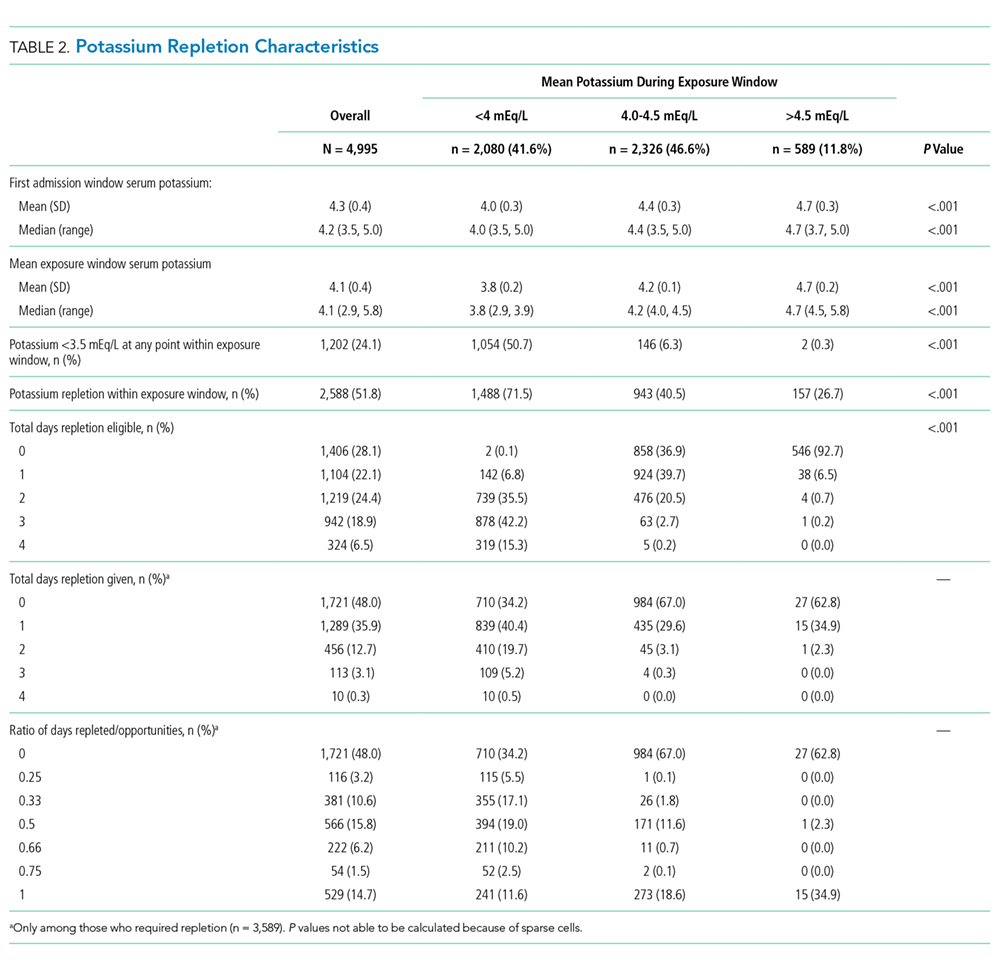
Potassium Repletion
Patients in the <4.0 mEq/L group were much more likely to receive potassium repletion during the exposure window when compared with the 4.0-4.5 mEq/L (71.5% vs 40.5%) and >4.5 mEq/L (71.5% vs 26.7%) groups. On days that they were eligible for repletion (defined as a daily potassium value <4.0 mEq/L), patients with mean serum potassium >4.0 mEq/L were less likely to receive potassium repletion compared with those with values <4.0 mEq/L. There were 592 (28.5%), 1,383 (59.5%), and 432 (73.3%) patients in the <4.0, 4-4.5, and >4,5 mEq/L groups, respectively, who did not receive potassium repletion therapy during the exposure window.
Relationship of Serum Potassium Levels and Outcomes
Overall, 3.7% (n = 187) of patients died during the hospitalization, 2.4% (n = 98) were admitted to the ICU after the exposure window, and the median LOS was 5.6 days. We did not observe a significant association between mean serum potassium of <4.0 or 4.0-4.5 mEq/L and increased risk of mortality, ICU transfer, or LOS (Table 3). Our unadjusted analysis showed that patients with values >4.5 mEq/L had worse outcomes, including more deaths (5.3%; OR = 1.55; 95% CI: 1.01 to 2.39) and ICU admission (3.8%; OR = 2.10; 95% CI: 1.16 to 3.80) compared with those with values <4.0 mEq/L (Table 3). We also found that, compared with the <4.0 mEq/L group, the >4.5 mEq/L group showed just over a half-day longer LOS (0.6 days; 95% CI: 0.0 to 1.0; Table 3). However, we found that mortality and ICU admission results were attenuated after adjustment for age, race, comorbidity score, and LAPS-2 and were no longer statistically significant, whereas the association with LOS was consistent after adjustment. When using a binary exposure (<4.0 versus ≥4.0 mEq/L), we observed no association between mean potassium value and increased risk of mortality, ICU transfer, or LOS both before and after adjustment for age, race, LAPS-2, and comorbidity score (data not shown).
Sensitivity Analyses
In the sensitivity analysis restricted to those who did not receive potassium repletion during the exposure window, we continued to observe no association between the <4.0 and 4.0-4.5 mEq/L groups and outcomes (Table 3). In adjusted models for the >4.5 versus <4.0 mEq/L groups, risk estimates for mortality were similar to the full sample, but statistical significance was lost (OR = 1.56; 95% CI: 0.81 to 3.01). Adjusted risk estimates for ICU transfer were attenuated and not statistically significant (OR = 1.40; 95% CI: 0.60 to 3.26). However, LOS estimates were very similar to that observed in the full dataset (0.6 days; 95% CI: 0.1 to 1.2).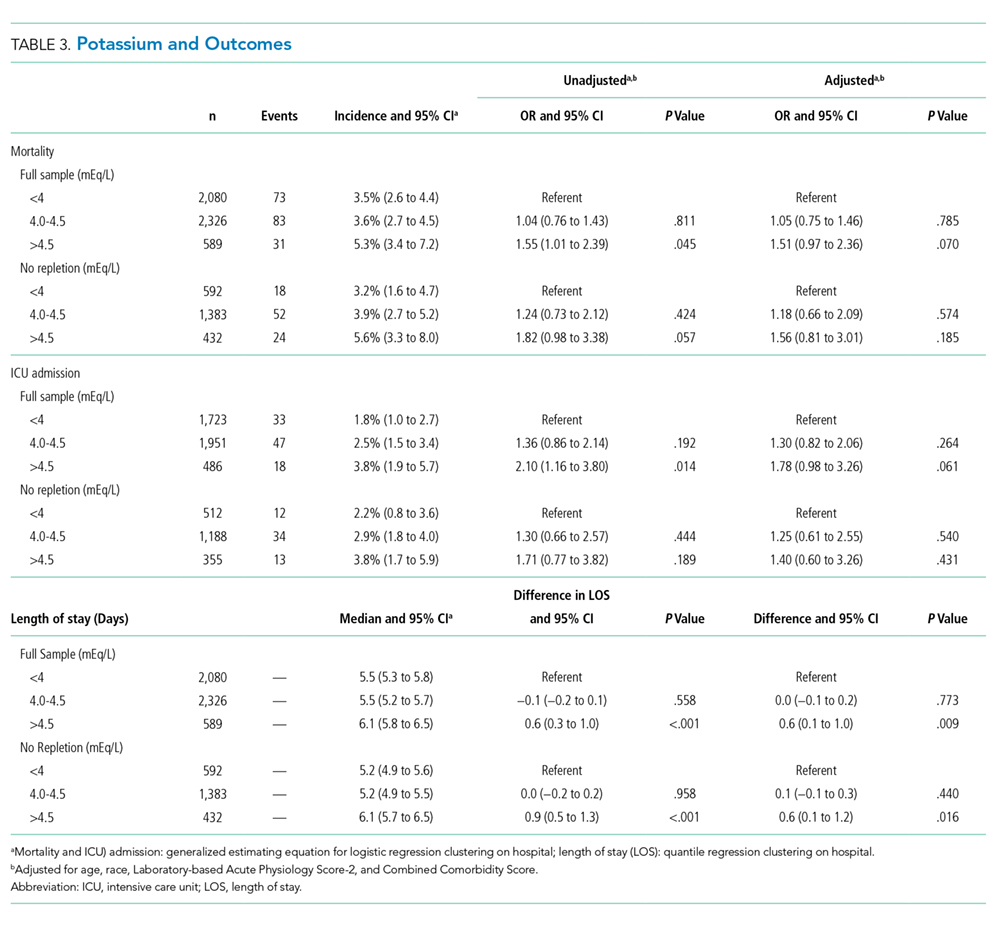
When stratifying our results by the presence or absence of acute or chronic renal insufficiency, we continued to observe no increased risk of any outcome in the 4.0-4.5 mEq/L compared with the <4.0 mEq/L groups across all strata (Table 4). Interestingly, even after adjustment, we did find that most of the increased risk of mortality and ICU admission in the >4.5 versus <4.0 mEq/L groups was among those without renal insufficiency (mortality OR = 3.03; ICU admission OR = 3.00) and was not statistically significant in those with renal insufficiency (mortality OR = 1.27; ICU admission OR = 1.63). Adjusted LOS estimates remained relatively similar in this stratified analysis.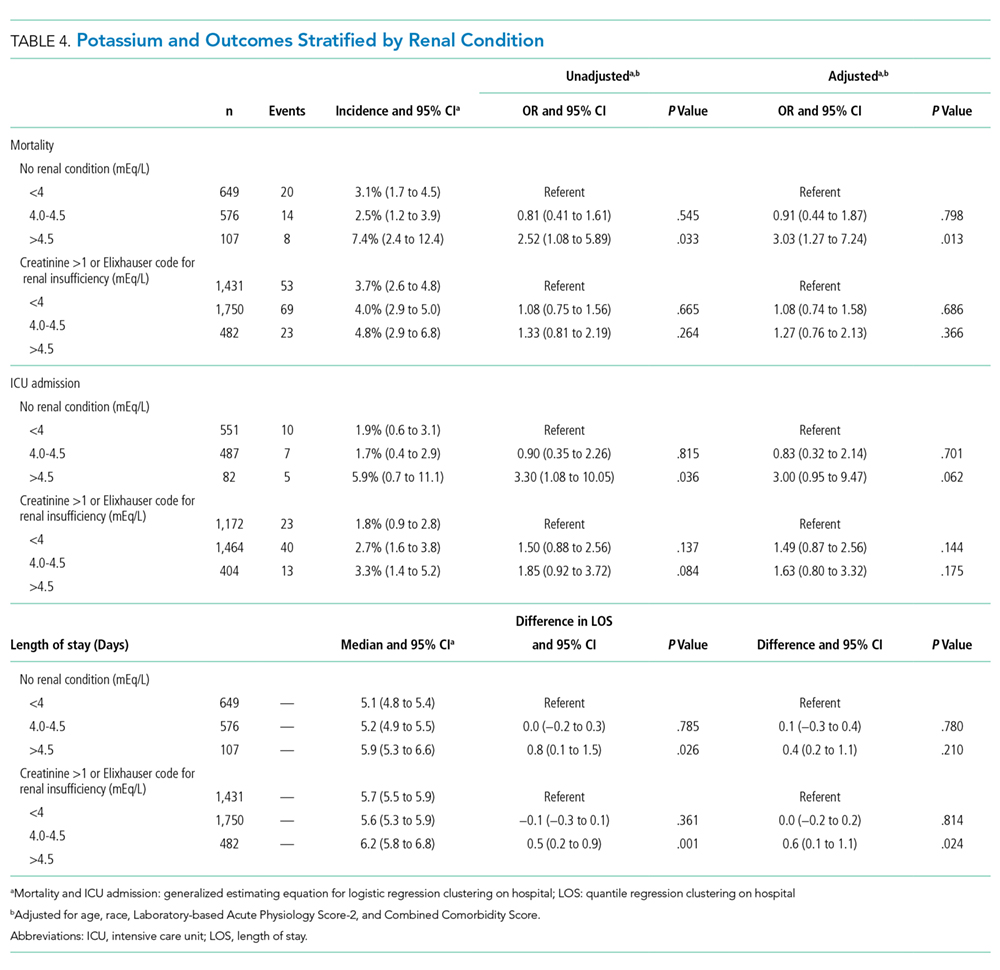
DISCUSSION
The best approach to mild serum potassium value abnormalities in patients hospitalized with HF remains unclear. Many physicians reflexively replete potassium to ensure all patients maintain a serum value of >4.0 mEq/L.15 Yet, in this large observational study of patients hospitalized with an acute HF exacerbation, we found little evidence of association between serum potassium <4.0 mEq/L and negative outcomes.
Compared with those with mean potassium values <4.0 mEq/L (in unadjusted models), there was an association between potassium values of >4.5 mEq/L and increased risk of mortality and ICU transfer. This association was attenuated after adjustment, suggesting that factors beyond potassium values influenced the observed relationship. These findings seem to suggest that unobserved differences in the >4.5 mEq/L group (there were observed differences in this group, eg, greater presenting severity and higher comorbidity scores, suggesting that there were also unobserved differences), and not average potassium value, were the reasons for the observed differences in outcomes. However, we cannot rule out the possibility that potassium >4.5 mEq/L has some associated increased risk compared with mean potassium values of <4.0 mEq/L for patients hospitalized with acute decompensated HF.
Patients in our study routinely received exogenous potassium: more than 70% of patients received repletion at least once, although it is notable that the majority of patients in the 4.0-4.5 and >4.5 mEq/L groups did not receive repletion. Despite this practice, the data supporting this approach to potassium management for patients hospitalized with HF remain mixed. A serum potassium decline of >15% during an acute HF hospital stay has been reported as a predictor of all-cause mortality after controlling for disease severity and associated comorbidities, including renal function.25 However, this study was focused on decline in admission potassium rather than an absolute cut-off (eg, >4.0 mEq/L). Additionally, potassium levels <3.9 mEq/L were associated with increased mortality in patients with acute HF following a myocardial infarction, but this study was not focused on patients with HF.26 Most of the prior literature in patients with HF was conducted in patients in outpatient settings and examined patients who were not experiencing acute exacerbations. MacDonald and Struthers advocate that patients with HF have their potassium maintained above 4.0 mEq/L but did not specify whether this included patients with acute HF exacerbations.10 Additionally, many studies evaluating potassium repletion were conducted before widespread availability of angiotensin-converting enzyme (ACE) inhibitors or potassium-sparing diuretics, including spironolactone. Prior work has consistently reported that hyperkalemia, defined as serum potassium >4.5 mEq/L, is associated with mortality in patients with acute HF over the course of hospitalization (which aligned with the results from our sensitivity analysis), but concurrent medication regimens and underlying impaired renal function likely accounted for most of this association.17 The picture is further complicated as patients with acute HF presenting with hypokalemia may be at risk for subsequent hyperkalemia, and potassium repletion can stimulate aldosterone secretion, potentially exacerbating underlying HF.27,28
These data are observational and are unlikely to change practice. However, daily potassium repletion represents a huge cost in time, money, and effort to the health system. Furthermore, the greatest burden occurs for the patients, who have labs drawn and values checked routinely and potassium administered orally or parenterally. While future randomized clinical trials (RCTs) would best examine the benefits of repletion, future pragmatic trials could attempt to disentangle the associated risks and benefits of potassium repletion in the absence of RCTs. Additionally, such studies could better take into account the role of concurrent medication use (like ACEs or angiotensin II receptor blockers), as well as assess the role of chronic renal insufficiency, acute kidney injury, and magnesium levels.29
This study has limitations. Its retrospective design leads to unmeasured confounding; however, we adjusted for multiple variables (including LAPS-2), which reflect the severity of disease at admission and underlying kidney function at presentation, as well as other comorbid conditions. In addition, data from the cohort only extend to 2012, so more recent changes in practice may not be completely reflected. The nature of the data did not allow us to directly investigate the relationship between serum potassium and arrhythmias, although ICU transfer and mortality were used as surrogates.
In conclusion, the benefit of a serum potassium level >4.0 mEq/L in patients admitted with HF remains unclear. We did not observe that mean potassium values <4.0 mEq/L were associated with worse outcomes, and, more concerning, there may be some risk for patients with mean values >4.5 mEq/L.
Acknowledgments
Dr. Lagu had full access to all the data in the study and takes responsibility for the integrity of the data and the accuracy of the data analysis.
Disclosures
The authors report no potential conflicts of interest. Dr. Lagu has served as a consultant for the Yale Center for Outcomes Research and Evaluation, under contract to the Centers for Medicare and Medicaid Services, for which she has provided clinical and methodological expertise and input on the development, reevaluation, and implementation of hospital outcome and efficiency measures.
Funding
Dr. Lagu is supported by the National Heart, Lung, and Blood Institute of the National Institutes of Health under Award Number K01HL114745 and R01 HL139985-01A1. Dr. Stefan is supported by the National Heart, Lung, and Blood Institute of the National Institutes of Health under Award Number K01HL114631-01A1. Dr. Pack is supported by NHLBI 1K23HL135440. Dr. Lindenauer is supported by the National Heart, Lung, and Blood Institute of the National Institutes of Health under Award Number 1K24HL132008.
Disclaimer
The views expressed in this manuscript do not necessarily reflect those of the Yale Center for Outcomes Research and Evaluation or the Centers for Medicare and Medicaid Services.
1. Benjamin EJ, Virani SS, Callaway CW, et al. Heart disease and stroke statistics–2018 update: a report from the American Heart Association. Circulation. 2018;137(12):e67-e492. https://doi.org/10.1161/CIR.0000000000000558.
2. Maggioni AP, Dahlström U, Filippatos G, et al. EURObservational Research Programme: regional differences and 1-year follow-up results of the Heart Failure Pilot Survey (ESC-HF Pilot). Eur J Heart Fail. 2013;15(7):808-817. https://doi.org/10.1093/eurjhf/hft050.
3. Tomaselli GF, Zipes DP. What causes sudden death in heart failure? Circ Res. 2004;95(8):754-763. https://doi.org/10.1161/01.RES.0000145047.
4. Bowen GS, Diop MS, Jiang L, Wu W-C, Rudolph JL. A multivariable prediction model for mortality in individuals admitted for heart failure. J Am Geriatr Soc. 2018;66(5):902-908. https://doi.org/10.1111/jgs.15319.
5. Lagu T, Pekow PS, Shieh M-S, et al. Validation and comparison of seven mortality prediction models for hospitalized patients with acute decompensated heart failure. Circ Heart Fail. 2016;9(8). https://doi.org/10.1161/CIRCHEARTFAILURE.115.002912.
6. Núñez J, Bayés-Genís A, Zannad F, et al. Long-term potassium monitoring and dynamics in heart failure and risk of mortality. Circulation. 2018;137(13):1320-1330. https://doi.org/10.1161/CIRCULATIONAHA.117.030576.
7. Vardeny O, Claggett B, Anand I, et al. Incidence, predictors, and outcomes related to hypo- and hyperkalemia in patients with severe heart failure treated with a mineralocorticoid receptor antagonist. Circ Heart Fail. 2014;7(4):573-579. https://doi.org/10.1161/CIRCHEARTFAILURE.114.00110.
8. Aldahl M, Jensen A-SC, Davidsen L, et al. Associations of serum potassium levels with mortality in chronic heart failure patients. Eur Heart J. 2017;38(38):2890-2896. https://doi.org/10.1093/eurheartj/ehx460.
9. Hoppe LK, Muhlack DC, Koenig W, Carr PR, Brenner H, Schöttker B. Association of abnormal serum potassium levels with arrhythmias and cardiovascular mortality: a systematic review and meta-analysis of observational studies. Cardiovasc Drugs Ther. 2018;32(2):197-212. https://doi.org/10.1007/s10557-018-6783-0.
10. Macdonald JE, Struthers AD. What is the optimal serum potassium level in cardiovascular patients? J Am Coll Cardiol. 2004;43(2):155-161. https://doi.org/10.1016/j.jacc.2003.06.021.
11. Hulting J. In-hospital ventricular fibrillation and its relation to serum potassium. Acta Med Scand Suppl. 1981;647(647):109-116. https://doi.org/10.1111/j.0954-6820.1981.tb02646.x.
12. Skogestad J, Aronsen JM. Hypokalemia-induced arrhythmias and heart failure: new insights and implications for therapy. Front Physiol. 2018;9:1500. https://doi.org/10.3389/fphys.2018.01500.
13. Tromp J, Ter Maaten JM, Damman K, et al. Serum potassium levels and outcome in acute heart failure (data from the PROTECT and COACH trials). Am J Cardiol. 2017;119(2):290-296. https://doi.org/10.1016/j.amjcard.2016.09.038.
14. Khan SS, Campia U, Chioncel O, et al. Changes in serum potassium levels during hospitalization in patients with worsening heart failure and reduced ejection fraction (from the EVEREST trial). Am J Cardiol. 2015;115(6):790-796. https://doi.org/10.1016/j.amjcard.2014.12.045
15. Viera AJ, Wouk N. Potassium disorders: hypokalemia and hyperkalemia. Am Fam Physician. 2015;92(6):487-495.
16. Krumholz HM, Wang Y, Mattera JA, et al. An administrative claims model suitable for profiling hospital performance based on 30-day mortality rates among patients with heart failure. Circulation. 2006;113(13):1693-1701. https://doi.org/10.1161/CIRCULATIONAHA.105.611194.
17. Legrand M, Ludes P-O, Massy Z, et al. Association between hypo- and hyperkalemia and outcome in acute heart failure patients: the role of medications. Clin Res Cardiol. 2018;107(3):214-221. https://doi.org/10.1007/s00392-017-1173-3.
18. Kok W, Salah K, Stienen S. Are changes in serum potassium levels during admissions for acute decompensated heart failure irrelevant for prognosis: the end of the story? Am J Cardiol. 2015;116(5):825. https://doi.org/10.1016/j.amjcard.2015.05.059.
19. Elixhauser A, Steiner C, Harris DR, Coffey RM. Comorbidity measures for use with administrative data. Med Care. 1998;36(1):8-27. https://doi.org/10.1097/00005650-199801000-00004.
20. Quan H, Parsons GA, Ghali WA. Validity of information on comorbidity derived from ICD-9-CCM administrative data. Med Care. 2002;40(8):675-685. https://doi.org/10.1097/01.MLR.0000020927.46398.5D.
21. Gagne JJ, Glynn RJ, Avorn J, Levin R, Schneeweiss S. A combined comorbidity score predicted mortality in elderly patients better than existing scores. J Clin Epidemiol. 2011;64(7):749-759. https://doi.org/10.1016/j.jclinepi.2010.10.004.
22. Escobar GJ, Gardner MN, Greene JD, Draper D, Kipnis P. Risk-adjusting hospital mortality using a comprehensive electronic record in an integrated health care delivery system. Med Care. 2013;51(5):446-453. https://doi.org/10.1097/MLR.0b013e3182881c8e.
23. Escobar GJ, Greene JD, Scheirer P, Gardner MN, Draper D, Kipnis P. Risk-adjusting hospital inpatient mortality using automated inpatient, outpatient, and laboratory databases. Med Care. 2008;46(3):232-239. https://doi.org/10.1097/MLR.0b013e3181589bb6.
24. Parente PMDC, Santos Silva JMC. Quantile regression with clustered data. J Econom Method. 2016;5(1):1-15. https://doi.org/10.1515/jem-2014-0011.
25. Salah K, Pinto YM, Eurlings LW, et al. Serum potassium decline during hospitalization for acute decompensated heart failure is a predictor of 6-month mortality, independent of N-terminal pro-B-type natriuretic peptide levels: An individual patient data analysis. Am Heart J. 2015;170(3):531-542.e1. https://doi.org/10.1016/j.ahj.2015.06.003.
26. Krogager ML, Eggers-Kaas L, Aasbjerg K, et al. Short-term mortality risk of serum potassium levels in acute heart failure following myocardial infarction. Eur Heart J Cardiovasc Pharmacother. 2015;1(4):245-251. https://doi.org/10.1093/ehjcvp/pvv026.
27. Crop MJ, Hoorn EJ, Lindemans J, Zietse R. Hypokalaemia and subsequent hyperkalaemia in hospitalized patients. Nephrol Dial Transplant. 2007;22(12):3471-3477.https://doi.org/10.1093/ndt/gfm471.
28. Kok W, Salah K, Stienen S. Serum potassium levels during admissions for acute decompensated heart failure: identifying possible threats to outcome. Am J Cardiol. 2018;121(1):141. https://doi.org/10.1016/j.amjcard.2017.09.032.
29. Freda BJ, Knee AB, Braden GL, Visintainer PF, Thakar CV. Effect of transient and sustained acute kidney injury on readmissions in acute decompensated heart failure. Am J Cardiol. 2017;119(11):1809-1814. https://doi.org/10.1016/j.amjcard.2017.02.044.
Heart failure (HF) is a leading cause of hospital admission and mortality, accounting for approximately 900,000 discharges in 2014.1 One-year all-cause mortality risk has been estimated at 17% after hospitalization,2 and roughly 50% of deaths are related to sudden cardiac death, mostly due to ventricular arrhythmia.
The principles underlying potassium management in acute HF are complex. Both low and high values have been linked to fatal arrhythmias, notably ventricular fibrillation, and small serum changes often reflect large total body potassium fluctuations.11 Recent literature links hypokalemia to general membrane hypoexcitability, skeletal muscle hyporeflexia, and arrhythmias initiated by reduced sodium-potassium adenosine triphosphatase activity, leading to increased intracellular calcium and regional variations in action potential duration.12 Potassium abnormalities are common at admission and may be exacerbated by both acute illness and treatments given during hospitalization, including baseline potassium, acute kidney injury, aggressive diuretic therapy, or other potassium-related treatments and conditions.13 The success of potassium repletion may also be affected by the choice of HF therapies.14
The belief that patients with HF must maintain a potassium >4.0 mEq/L remains pervasive, with at least one family medicine guideline recommending that patients with HF maintain a serum potassium level >4.0 mEq/L.
METHODS
Data Sources and Cohort Definition
The Institutional Review Board at Baystate Medical Center approved this study. We identified patients with HF who were admitted for more than 72 hours between January 2010 and December 2012 to hospitals contributing to the HealthFacts database, a multihospital dataset derived from the comprehensive electronic health records of 116 geographically and structurally diverse hospitals throughout the United States (Cerner Corp.). HealthFacts—which includes date-stamped pharmacy, laboratory, and billing information—contains records of more than 84 million acute admissions, emergency room visits, and ambulatory visits. We limited the sample to hospitals that contributed to the pharmacy, laboratory, and diagnosis segments.
We included patients who had a principal International Classification of Disease (ICD-9-CM) diagnosis of HF or a principal diagnosis of respiratory failure with secondary diagnosis of HF (ICD-9-CM codes for HF: 402.01, 402.11, 402.91, 404.01, 404.03, 404.11, 404.13, 404.91, 404.93, 428.xx16 and for respiratory failure: 518.81, 518.82, 518.84) and were 18 years or older. We ensured that patients were treated for acute decompensated HF during the hospitalization by restricting the cohort to patients in whom at least one HF therapy (eg, loop diuretics, metolazone, inotropes, and intra-aortic balloon pump) was initiated within the first two days of hospitalization. We excluded patients with a pediatric or psychiatric attending physician, those with elective admissions, and those who were transferred from or to another acute care facility because we could not accurately determine the onset or subsequent course of their illness.
Definition of Variables Describing Serum Potassium Levels
We limited the sample to patients hospitalized for longer than 72 hours in order to observe how initial potassium values influenced outcomes over the course of hospitalization. We chose an exposure window of 72 hours because this allowed, on average, three potential observations of serum potassium per patient. We further restricted the sample to those who had a normal potassium value (3.5-5.0 mEq/L) at admission (defined as 24 hours prior to admission through midnight of the day of admission) to ensure that the included patients did not have abnormal potassium values upon presentation. We identified the period of time from 24 hours prior to admission through 72 hours following admission as “the exposure window” (the time during which patients were eligible to be classified into average serum potassium levels of <4.0, 4.0-4.5, or >4.5 mEq/L). We excluded patients who, during this window, had fewer than three serum potassium levels drawn (“exposure” levels could be disproportionately influenced by a single value) or received sodium polystyrene (as this would indicate that the physicians felt the potassium was dangerously high). For patients with repeated hospitalizations, we randomly selected one visit for inclusion to reduce the risk of survivor bias. We calculated the mean of all serum potassium levels during the exposure window, including the admission value, and then evaluated two different categorizations of mean serum potassium, based on categories of risk previously reported in the literature:8,17,18: (1) <4.0, 4.0-4.5, or >4.5 mEq/L and (2) <4.0 versus ≥4.0 mEq/L.
Outcomes
We assessed three outcomes: in-hospital mortality, transfer to an intensive care unit (ICU), and length of stay (LOS). Admission to the ICU was defined as any evidence, after the exposure window, that the patient received care in the ICU. We excluded patients with ICU admissions during the exposure window from the analysis of this outcome. We calculated LOS as the difference between discharge date/time and the admission date/time.
Covariates and Comorbidity Adjustment
We obtained information on patient demographics (age and race) and identified the presence of comorbid conditions using previously derived and validated models.19,20 We then further quantified these conditions into a single combined score to adjust for differences in presenting illness severity (including kidney disease) and help reduce confounding.21 To account for presenting severity of illness, we calculated the Laboratory-based Acute Physiology Score (LAPS-2).22,23 LAPS-2 was developed for predicting mortality risk in general medical patients, but we previously externally validated it against other published clinical HF models in a cohort of patients hospitalized with acute decompensated HF.5
Potassium Repletion
Analysis
We evaluated the differences in patient characteristics across serum potassium categories. Categorical variables are presented as frequencies and percentages, whereas continuous variables are presented as means and standard deviations. For binary outcomes, we used generalized estimating equations (with a binomial family and logit link and clustering by hospital) to estimate incidence and calculate unadjusted and adjusted odds ratios (ORs) and 95% confidence intervals (CIs). For LOS, we estimated the median and 95% CIs using quantile regression with clustered standard errors.24 We calculated all models using both a binary exposure (<4.0 versus ≥4.0 mEq/L) and a three-level categorization (<4.0, 4.0-4.5, and >4.5 mEq/L) to explore the effects at the highest potassium level. We adjusted all models for age, race, LAPS-2 score, and combined comorbidity score. We conducted two sensitivity analyses. First, we restricted our sample to those who never received potassium during the exposure window, as these patients may be different than patients who required potassium repletion. Second, we stratified our findings by the presence or absence of acute or chronic renal insufficiency (defined as an admission creatinine >1 or the presence of a diagnostic code for renal insufficiency, as defined by Elixhauser et al.).19,21 Statistical significance was set at an alpha of 0.05. Analysis was completed using Stata v15.1, StataCorp LP, College Station, Texas.
RESULTS
Cohort Description
We identified patients from 56 geographically diverse US hospitals, although most were located in either the northeast (n = 21; 38%) or south (n = 18; 32%). A total of 59% of the hospitals were teaching hospitals, and nearly 95% were in an urban setting. We identified 13,163 patients with HF, of which 4,995 (38.0%) met the inclusion criteria. We excluded 3,744 (28.4%) patients with LOS < 72 hours, 2,210 (16.8%) with admission potassium values outside of the defined range, and 896 (6.8%) with fewer than three potassium values during the exposure window. Of the patients who met the inclusion criteria, 2,080 (41.6%), 2,326 (46.6%), and 589 (11.8%) were categorized in the <4.0, 4.0-4.5, and >4.5 mEq/L groups, respectively (Table 1). The groups were clinically similar in terms of age, sex, illness severity (LAPS-2), and comorbidity score. Compared with other racial groups, black patients had higher potassium values. While the <4.0 and 4.0-4.5 mEq/L groups were relatively similar, the group with mean potassium >4.5 mEq/L had higher admission creatinine and a greater prevalence of chronic kidney disease, deficiency anemias, and chronic obstructive pulmonary disease (Table 1).
Serum Potassium Values
Individuals’ mean serum potassium within the 72-hour exposure window ranged from 2.9 to 5.8 mEq/L (Table 2). In the <4.0, 4-4.5, and >4.5 mEq/L cohorts respectively, patients had a median serum potassium of 3.8 mEq/L (2.9-3.9), 4.2 mEq/L (4.0-4.5), and 4.7 mEq/L (4.5-5.8) during the exposure window. Approximately half of the patients in the <4.0 mEq/L group had a serum potassium <3.5 mEq/L at some point during the exposure window. In contrast, <10% of the other groups had this low value during the exposure window.
Potassium Repletion
Patients in the <4.0 mEq/L group were much more likely to receive potassium repletion during the exposure window when compared with the 4.0-4.5 mEq/L (71.5% vs 40.5%) and >4.5 mEq/L (71.5% vs 26.7%) groups. On days that they were eligible for repletion (defined as a daily potassium value <4.0 mEq/L), patients with mean serum potassium >4.0 mEq/L were less likely to receive potassium repletion compared with those with values <4.0 mEq/L. There were 592 (28.5%), 1,383 (59.5%), and 432 (73.3%) patients in the <4.0, 4-4.5, and >4,5 mEq/L groups, respectively, who did not receive potassium repletion therapy during the exposure window.
Relationship of Serum Potassium Levels and Outcomes
Overall, 3.7% (n = 187) of patients died during the hospitalization, 2.4% (n = 98) were admitted to the ICU after the exposure window, and the median LOS was 5.6 days. We did not observe a significant association between mean serum potassium of <4.0 or 4.0-4.5 mEq/L and increased risk of mortality, ICU transfer, or LOS (Table 3). Our unadjusted analysis showed that patients with values >4.5 mEq/L had worse outcomes, including more deaths (5.3%; OR = 1.55; 95% CI: 1.01 to 2.39) and ICU admission (3.8%; OR = 2.10; 95% CI: 1.16 to 3.80) compared with those with values <4.0 mEq/L (Table 3). We also found that, compared with the <4.0 mEq/L group, the >4.5 mEq/L group showed just over a half-day longer LOS (0.6 days; 95% CI: 0.0 to 1.0; Table 3). However, we found that mortality and ICU admission results were attenuated after adjustment for age, race, comorbidity score, and LAPS-2 and were no longer statistically significant, whereas the association with LOS was consistent after adjustment. When using a binary exposure (<4.0 versus ≥4.0 mEq/L), we observed no association between mean potassium value and increased risk of mortality, ICU transfer, or LOS both before and after adjustment for age, race, LAPS-2, and comorbidity score (data not shown).
Sensitivity Analyses
In the sensitivity analysis restricted to those who did not receive potassium repletion during the exposure window, we continued to observe no association between the <4.0 and 4.0-4.5 mEq/L groups and outcomes (Table 3). In adjusted models for the >4.5 versus <4.0 mEq/L groups, risk estimates for mortality were similar to the full sample, but statistical significance was lost (OR = 1.56; 95% CI: 0.81 to 3.01). Adjusted risk estimates for ICU transfer were attenuated and not statistically significant (OR = 1.40; 95% CI: 0.60 to 3.26). However, LOS estimates were very similar to that observed in the full dataset (0.6 days; 95% CI: 0.1 to 1.2).
When stratifying our results by the presence or absence of acute or chronic renal insufficiency, we continued to observe no increased risk of any outcome in the 4.0-4.5 mEq/L compared with the <4.0 mEq/L groups across all strata (Table 4). Interestingly, even after adjustment, we did find that most of the increased risk of mortality and ICU admission in the >4.5 versus <4.0 mEq/L groups was among those without renal insufficiency (mortality OR = 3.03; ICU admission OR = 3.00) and was not statistically significant in those with renal insufficiency (mortality OR = 1.27; ICU admission OR = 1.63). Adjusted LOS estimates remained relatively similar in this stratified analysis.
DISCUSSION
The best approach to mild serum potassium value abnormalities in patients hospitalized with HF remains unclear. Many physicians reflexively replete potassium to ensure all patients maintain a serum value of >4.0 mEq/L.15 Yet, in this large observational study of patients hospitalized with an acute HF exacerbation, we found little evidence of association between serum potassium <4.0 mEq/L and negative outcomes.
Compared with those with mean potassium values <4.0 mEq/L (in unadjusted models), there was an association between potassium values of >4.5 mEq/L and increased risk of mortality and ICU transfer. This association was attenuated after adjustment, suggesting that factors beyond potassium values influenced the observed relationship. These findings seem to suggest that unobserved differences in the >4.5 mEq/L group (there were observed differences in this group, eg, greater presenting severity and higher comorbidity scores, suggesting that there were also unobserved differences), and not average potassium value, were the reasons for the observed differences in outcomes. However, we cannot rule out the possibility that potassium >4.5 mEq/L has some associated increased risk compared with mean potassium values of <4.0 mEq/L for patients hospitalized with acute decompensated HF.
Patients in our study routinely received exogenous potassium: more than 70% of patients received repletion at least once, although it is notable that the majority of patients in the 4.0-4.5 and >4.5 mEq/L groups did not receive repletion. Despite this practice, the data supporting this approach to potassium management for patients hospitalized with HF remain mixed. A serum potassium decline of >15% during an acute HF hospital stay has been reported as a predictor of all-cause mortality after controlling for disease severity and associated comorbidities, including renal function.25 However, this study was focused on decline in admission potassium rather than an absolute cut-off (eg, >4.0 mEq/L). Additionally, potassium levels <3.9 mEq/L were associated with increased mortality in patients with acute HF following a myocardial infarction, but this study was not focused on patients with HF.26 Most of the prior literature in patients with HF was conducted in patients in outpatient settings and examined patients who were not experiencing acute exacerbations. MacDonald and Struthers advocate that patients with HF have their potassium maintained above 4.0 mEq/L but did not specify whether this included patients with acute HF exacerbations.10 Additionally, many studies evaluating potassium repletion were conducted before widespread availability of angiotensin-converting enzyme (ACE) inhibitors or potassium-sparing diuretics, including spironolactone. Prior work has consistently reported that hyperkalemia, defined as serum potassium >4.5 mEq/L, is associated with mortality in patients with acute HF over the course of hospitalization (which aligned with the results from our sensitivity analysis), but concurrent medication regimens and underlying impaired renal function likely accounted for most of this association.17 The picture is further complicated as patients with acute HF presenting with hypokalemia may be at risk for subsequent hyperkalemia, and potassium repletion can stimulate aldosterone secretion, potentially exacerbating underlying HF.27,28
These data are observational and are unlikely to change practice. However, daily potassium repletion represents a huge cost in time, money, and effort to the health system. Furthermore, the greatest burden occurs for the patients, who have labs drawn and values checked routinely and potassium administered orally or parenterally. While future randomized clinical trials (RCTs) would best examine the benefits of repletion, future pragmatic trials could attempt to disentangle the associated risks and benefits of potassium repletion in the absence of RCTs. Additionally, such studies could better take into account the role of concurrent medication use (like ACEs or angiotensin II receptor blockers), as well as assess the role of chronic renal insufficiency, acute kidney injury, and magnesium levels.29
This study has limitations. Its retrospective design leads to unmeasured confounding; however, we adjusted for multiple variables (including LAPS-2), which reflect the severity of disease at admission and underlying kidney function at presentation, as well as other comorbid conditions. In addition, data from the cohort only extend to 2012, so more recent changes in practice may not be completely reflected. The nature of the data did not allow us to directly investigate the relationship between serum potassium and arrhythmias, although ICU transfer and mortality were used as surrogates.
In conclusion, the benefit of a serum potassium level >4.0 mEq/L in patients admitted with HF remains unclear. We did not observe that mean potassium values <4.0 mEq/L were associated with worse outcomes, and, more concerning, there may be some risk for patients with mean values >4.5 mEq/L.
Acknowledgments
Dr. Lagu had full access to all the data in the study and takes responsibility for the integrity of the data and the accuracy of the data analysis.
Disclosures
The authors report no potential conflicts of interest. Dr. Lagu has served as a consultant for the Yale Center for Outcomes Research and Evaluation, under contract to the Centers for Medicare and Medicaid Services, for which she has provided clinical and methodological expertise and input on the development, reevaluation, and implementation of hospital outcome and efficiency measures.
Funding
Dr. Lagu is supported by the National Heart, Lung, and Blood Institute of the National Institutes of Health under Award Number K01HL114745 and R01 HL139985-01A1. Dr. Stefan is supported by the National Heart, Lung, and Blood Institute of the National Institutes of Health under Award Number K01HL114631-01A1. Dr. Pack is supported by NHLBI 1K23HL135440. Dr. Lindenauer is supported by the National Heart, Lung, and Blood Institute of the National Institutes of Health under Award Number 1K24HL132008.
Disclaimer
The views expressed in this manuscript do not necessarily reflect those of the Yale Center for Outcomes Research and Evaluation or the Centers for Medicare and Medicaid Services.
1. Benjamin EJ, Virani SS, Callaway CW, et al. Heart disease and stroke statistics–2018 update: a report from the American Heart Association. Circulation. 2018;137(12):e67-e492. https://doi.org/10.1161/CIR.0000000000000558.
2. Maggioni AP, Dahlström U, Filippatos G, et al. EURObservational Research Programme: regional differences and 1-year follow-up results of the Heart Failure Pilot Survey (ESC-HF Pilot). Eur J Heart Fail. 2013;15(7):808-817. https://doi.org/10.1093/eurjhf/hft050.
3. Tomaselli GF, Zipes DP. What causes sudden death in heart failure? Circ Res. 2004;95(8):754-763. https://doi.org/10.1161/01.RES.0000145047.
4. Bowen GS, Diop MS, Jiang L, Wu W-C, Rudolph JL. A multivariable prediction model for mortality in individuals admitted for heart failure. J Am Geriatr Soc. 2018;66(5):902-908. https://doi.org/10.1111/jgs.15319.
5. Lagu T, Pekow PS, Shieh M-S, et al. Validation and comparison of seven mortality prediction models for hospitalized patients with acute decompensated heart failure. Circ Heart Fail. 2016;9(8). https://doi.org/10.1161/CIRCHEARTFAILURE.115.002912.
6. Núñez J, Bayés-Genís A, Zannad F, et al. Long-term potassium monitoring and dynamics in heart failure and risk of mortality. Circulation. 2018;137(13):1320-1330. https://doi.org/10.1161/CIRCULATIONAHA.117.030576.
7. Vardeny O, Claggett B, Anand I, et al. Incidence, predictors, and outcomes related to hypo- and hyperkalemia in patients with severe heart failure treated with a mineralocorticoid receptor antagonist. Circ Heart Fail. 2014;7(4):573-579. https://doi.org/10.1161/CIRCHEARTFAILURE.114.00110.
8. Aldahl M, Jensen A-SC, Davidsen L, et al. Associations of serum potassium levels with mortality in chronic heart failure patients. Eur Heart J. 2017;38(38):2890-2896. https://doi.org/10.1093/eurheartj/ehx460.
9. Hoppe LK, Muhlack DC, Koenig W, Carr PR, Brenner H, Schöttker B. Association of abnormal serum potassium levels with arrhythmias and cardiovascular mortality: a systematic review and meta-analysis of observational studies. Cardiovasc Drugs Ther. 2018;32(2):197-212. https://doi.org/10.1007/s10557-018-6783-0.
10. Macdonald JE, Struthers AD. What is the optimal serum potassium level in cardiovascular patients? J Am Coll Cardiol. 2004;43(2):155-161. https://doi.org/10.1016/j.jacc.2003.06.021.
11. Hulting J. In-hospital ventricular fibrillation and its relation to serum potassium. Acta Med Scand Suppl. 1981;647(647):109-116. https://doi.org/10.1111/j.0954-6820.1981.tb02646.x.
12. Skogestad J, Aronsen JM. Hypokalemia-induced arrhythmias and heart failure: new insights and implications for therapy. Front Physiol. 2018;9:1500. https://doi.org/10.3389/fphys.2018.01500.
13. Tromp J, Ter Maaten JM, Damman K, et al. Serum potassium levels and outcome in acute heart failure (data from the PROTECT and COACH trials). Am J Cardiol. 2017;119(2):290-296. https://doi.org/10.1016/j.amjcard.2016.09.038.
14. Khan SS, Campia U, Chioncel O, et al. Changes in serum potassium levels during hospitalization in patients with worsening heart failure and reduced ejection fraction (from the EVEREST trial). Am J Cardiol. 2015;115(6):790-796. https://doi.org/10.1016/j.amjcard.2014.12.045
15. Viera AJ, Wouk N. Potassium disorders: hypokalemia and hyperkalemia. Am Fam Physician. 2015;92(6):487-495.
16. Krumholz HM, Wang Y, Mattera JA, et al. An administrative claims model suitable for profiling hospital performance based on 30-day mortality rates among patients with heart failure. Circulation. 2006;113(13):1693-1701. https://doi.org/10.1161/CIRCULATIONAHA.105.611194.
17. Legrand M, Ludes P-O, Massy Z, et al. Association between hypo- and hyperkalemia and outcome in acute heart failure patients: the role of medications. Clin Res Cardiol. 2018;107(3):214-221. https://doi.org/10.1007/s00392-017-1173-3.
18. Kok W, Salah K, Stienen S. Are changes in serum potassium levels during admissions for acute decompensated heart failure irrelevant for prognosis: the end of the story? Am J Cardiol. 2015;116(5):825. https://doi.org/10.1016/j.amjcard.2015.05.059.
19. Elixhauser A, Steiner C, Harris DR, Coffey RM. Comorbidity measures for use with administrative data. Med Care. 1998;36(1):8-27. https://doi.org/10.1097/00005650-199801000-00004.
20. Quan H, Parsons GA, Ghali WA. Validity of information on comorbidity derived from ICD-9-CCM administrative data. Med Care. 2002;40(8):675-685. https://doi.org/10.1097/01.MLR.0000020927.46398.5D.
21. Gagne JJ, Glynn RJ, Avorn J, Levin R, Schneeweiss S. A combined comorbidity score predicted mortality in elderly patients better than existing scores. J Clin Epidemiol. 2011;64(7):749-759. https://doi.org/10.1016/j.jclinepi.2010.10.004.
22. Escobar GJ, Gardner MN, Greene JD, Draper D, Kipnis P. Risk-adjusting hospital mortality using a comprehensive electronic record in an integrated health care delivery system. Med Care. 2013;51(5):446-453. https://doi.org/10.1097/MLR.0b013e3182881c8e.
23. Escobar GJ, Greene JD, Scheirer P, Gardner MN, Draper D, Kipnis P. Risk-adjusting hospital inpatient mortality using automated inpatient, outpatient, and laboratory databases. Med Care. 2008;46(3):232-239. https://doi.org/10.1097/MLR.0b013e3181589bb6.
24. Parente PMDC, Santos Silva JMC. Quantile regression with clustered data. J Econom Method. 2016;5(1):1-15. https://doi.org/10.1515/jem-2014-0011.
25. Salah K, Pinto YM, Eurlings LW, et al. Serum potassium decline during hospitalization for acute decompensated heart failure is a predictor of 6-month mortality, independent of N-terminal pro-B-type natriuretic peptide levels: An individual patient data analysis. Am Heart J. 2015;170(3):531-542.e1. https://doi.org/10.1016/j.ahj.2015.06.003.
26. Krogager ML, Eggers-Kaas L, Aasbjerg K, et al. Short-term mortality risk of serum potassium levels in acute heart failure following myocardial infarction. Eur Heart J Cardiovasc Pharmacother. 2015;1(4):245-251. https://doi.org/10.1093/ehjcvp/pvv026.
27. Crop MJ, Hoorn EJ, Lindemans J, Zietse R. Hypokalaemia and subsequent hyperkalaemia in hospitalized patients. Nephrol Dial Transplant. 2007;22(12):3471-3477.https://doi.org/10.1093/ndt/gfm471.
28. Kok W, Salah K, Stienen S. Serum potassium levels during admissions for acute decompensated heart failure: identifying possible threats to outcome. Am J Cardiol. 2018;121(1):141. https://doi.org/10.1016/j.amjcard.2017.09.032.
29. Freda BJ, Knee AB, Braden GL, Visintainer PF, Thakar CV. Effect of transient and sustained acute kidney injury on readmissions in acute decompensated heart failure. Am J Cardiol. 2017;119(11):1809-1814. https://doi.org/10.1016/j.amjcard.2017.02.044.
© 2019 Society of Hospital Medicine
An Acute Care for Elders Quality Improvement Program for Complex, High-Cost Patients Yields Savings for the System
In 2016, 15.2% of older Americans were hospitalized compared with 7% of the overall population and their length of stay (LOS) was 0.7 days greater.1 Geriatric hospitalizations frequently result in complications, functional decline, nursing home transfers, and increased cost.2-4 This pattern of decline has been termed “hospitalitis” or dysfunctional syndrome.5,6 Hospitals need data-driven approaches to improve outcomes for elders. The Acute Care for Elders (ACE) program, which has been in existence for roughly 25 years, is one such model. ACE features include an environment prepared for older adults, patient-centered care to prevent functional and cognitive decline, frequent medical review to prevent iatrogenic injury or new geriatric syndromes, and early discharge and rehabilitation planning to maximize the likelihood of return to the community.7 Although published data vary somewhat, ACE programs have robust evidence documenting improved safety, quality, and value.8-15 A recent meta-analysis found that ACE programs decrease LOS, costs, new nursing home discharges, falls, delirium, and functional decline.16 However, of the 13 ACE trials reported to date, only five were published in the last decade. Recent rising pressure to decrease hospitalizations and reduce LOS has shifted some care to other settings and it is unclear whether the same results would persist in today’s rapid-paced hospitals.
ACE programs require enhanced resources and restructured care processes but there is a notable lack of data to guide patient selection. Admission criteria vary among the published reports, and information on whether comorbidity burden impacts the magnitude of benefit is scarce. One ACE investigator commented, “We were not able to identify a subgroup of patients who were most likely to benefit.”17 Not all hospitalized older adults can receive ACE care, and some units have closed due to financial and logistic pressures; thus, criteria to target this scarce resource are urgently needed. Our hospital implemented an ACE program in 2014 and we have measured and internally benchmarked important quality improvement metrics. Using this data, we conducted an exploratory analysis to generate hypotheses on the differential impact across the spectrum of cost, LOS, 30-day readmissions, and variations across quartiles of comorbidity severity.
METHODS
Setting and Patients
In September 2014, our 716-bed teaching hospital in Springfield, Massachusetts launched an ACE program to improve care for older adults on a single medical unit. The program succeeded in engaging the senior leadership, and geriatrics was identified as a priority in Baystate’s 5-year strategic plan. ACE patients ≥70 years were admitted from the emergency department with inpatient status. Patients transferred from other units or with advanced dementia or nearing death were excluded. Core components of the ACE program were derived from published summaries (see supplementary material).7,16
Interprofessional ”ACE Rounds”
Interprofessional ACE Rounds occurred every weekday. As one ACE analyst has noted, “the interdisciplinary team…ensures that the multifactorial nature of functional decline is met with a multicomponent plan to prevent it.”18 Rounds participants shifted over time but always included a geriatrics physician assistant (PA) or geriatrician (team leader), a pharmacist, staff nurses, and a chaplain. The nurse educator, dietician, research assistant, and patient advocate/volunteers attended intermittently. Before rounds, the PA reviewed the admission notes for new ACE patients. Initially, rounds were lengthy and included nurse coaching. Later, nurses’ presentations were structured by the SPICES tool (Sleep, Problems with eating/feeding, Incontinence, Confusion, Evidence of falls, Skin Breakdown)19 and tracking and reporting templates. Coaching and education, along with conversations that did not require the full team, were removed from rounds. Thus, the time required for rounds declined from about 75 minutes to 35 minutes, which allowed more patients to be discussed efficiently. This change was critical as the number of ACE patients rose following the shift to the larger unit. The pharmacist reviewed medications focusing on potentially inappropriate drugs. Following rounds, the nurses and pharmacist conveyed recommendations to the hospitalists.
Patient-Centered Activities to Prevent Functional and Cognitive Decline
Project leaders coached staff about the importance of mobility, sleep, and delirium prevention and identification. The nurses screened patients using the Confusion Assessment Method (CAM) and reported delirium promptly. Specific care sets for ACE patients were implemented (see supplementary material).
The project was enhanced by several palliative care components, ie tracking pain, noting psychiatric symptoms, and considering prognosis by posing the “Surprise Question” during rounds.20 (“Would you be surprised if this patient died in the next year?”). As far as staffing and logistics allowed, the goals of care conversation were held by a geriatrics PA with patients/families who “screened in.”
Prepared Environment
The ACE program’s unit was remodeled to facilitate physical and cognitive functioning and promote sleep at night (quiet hours: 10 PM-6 AM).
In accordance with quality improvement processes, iterative shifts were implemented over time in terms of checklist, presentation format, timing, and team participation. In December 2016, the program relocated to a unit with 34 ACE beds and 5 end-of-life beds; this move markedly increased the number of eligible ACE patients.
Study Design, Data Source, and Patients
Since we were implementing and measuring our ACE program with a quality improvement lens, we chose a descriptive cross-sectional study design to generate hypotheses regarding our program’s impact compared to usual care. Using a hospital-wide billing database (McKesson Performance Analytics, v19, Alpharetta, Georgia) we sampled inpatients aged >70 years with a medical Diagnosis Related Group (DRGs) admitted through the emergency department and discharged from a medical unit from September 22, 2014 to August 31, 2017. These criteria mirrored those in the ACE unit. Older adults requiring specialized care (eg, those with myocardial infarct) were excluded, as were those with billing codes for mechanical ventilation, admission to critical care units, or discharge to hospice. Because one of our outcomes was readmission, we excluded patients who died during hospitalization. Patient characteristics collected included demographics and insurance category. To evaluate comorbidity burden, we collected ICD-9/ICD-10 diagnostic codes and generated a combined comorbidity score as described by Gagne, et al.21 This score was devised to predict mortality and 30-day readmissions and had better predictive ability in elders than the Elixhauser or Charlson scores. Scores ranged from −2 to 26, although values >20 are rare.
Exposure
Subjects were categorized as either discharged from the ACE or discharged from usual care. ACE discharges were tracked daily on a spreadsheet that was linked into our sample of eligible subjects.
Outcomes
Total cost of hospitalization (direct plus indirect costs), LOS, and all-cause 30-day readmissions were queried from the same billing database.
Statistical Analysis
As this study was a quality improvement project, analyses were descriptive and exploratory; no statistical hypothesis testing was conducted. We initially evaluated subject characteristics and comorbidities across study groups to determine group balance and comparability using means and standard deviations for continuous data and frequencies and percentages for categorical data. To analyze total cost and LOS, we utilized quantile regression with clustered standard errors to account for clustering by patient. We calculated the median difference between hospitalization cost and LOS for usual care versus ACE patients (with ACE as the referent group). To explore variations across the distributions of outcomes, we determined differences in cost and LOS and their 95% confidence intervals at the 25th, 50th, 75th, and 90th percentiles. Thirty-day readmission risk was estimated using a generalized estimating equation model with a logit link and binomial family. Readmission risk is presented along with 95% confidence intervals. For all models, we initially evaluated change over time (by quarter). After establishing the absence of time trends, we collapsed results into a comparison of usual care versus ACE care. Model estimates are presented both unadjusted and adjusted for age and comorbidity score. Following our initial analyses of cost, LOS, and 30-day readmission risk; we explored differences across quartiles of combined comorbidity scores. We used the same unadjusted models described above but incorporated an interaction term to generate estimates stratified by quartile of comorbidity score. We performed two additional analyses to evaluate the robustness of our findings. First, because hemiplegia prevalence was higher in the usual-care group than in the ACE group and can result in higher cost of care, we repeated the analysis after excluding those patients with hemiplegia. Second, because we were unable to control for functional capacity in the entire sample, we evaluated group differences in mobility for a subsample obtained prior to October 2015 using ICD-9 diagnostic codes, which can be considered surrogate markers for mobility.22 The results of our first analysis did not substantively change our main findings; in our second analysis, groups were balanced by mobility factors which suggested that confounding by functional capacity would be limited in our full sample. The results of these analyses are reported in the supplemental material.
Analysis was completed using Stata v15.1 (StataCorp, LP College Station, Texas). The Baystate Medical Center Institutional Review Board determined that the initiative was quality improvement and “not research.”
RESULTS
A total of 13,209 patients met the initial inclusion criteria; 1,621 were excluded, resulting in a sample of 11,588 patients. Over the 3-year study period, 1,429 (12.3%) were discharged from ACE and 10,159 (87.7%) were discharged from usual care. The groups were similar in age, sex, race and insurance status. Compared with the usual-care group, ACE patients had a higher median comorbidity score (3 vs 2 for usual care) and higher rates for anemia, dementia, fluid and electrolyte disorders, hypertension, and chronic obstructive pulmonary disease (COPD). However, ACE patients had lower rates of hemiplegia (0.9% vs 3%), arrhythmias, and pulmonary circulation disorders than those with usual care (Table 1).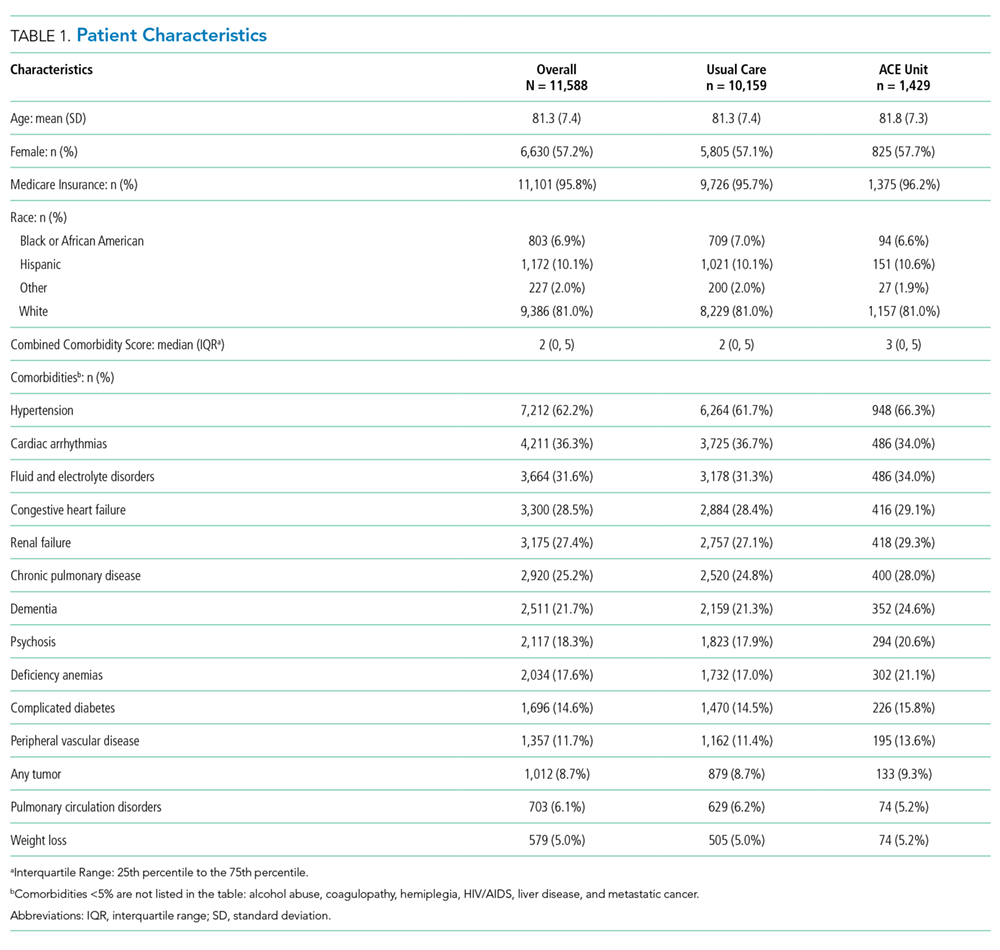
The median cost per ACE patient was slightly lower at $6,258 (interquartile range [IQR] = $4,683-$8,547) versus $6,858 (IQR = $4,855-$10,478) in usual care. Across the cost distribution, the ACE program had lower costs than usual care; however, these differences became more pronounced at the higher end of the distribution. For example, compared with the ACE group, the usual-care group’s unadjusted cost difference was $171 higher at the 25th percentile, $600 higher at the median, $1,932 higher at the 75th percentile, and $3,687 higher at the 90th percentile. The ACE median LOS was 3.7 days (IQR = 2.7-5.0) compared with 3.8 days (IQR = 2.7-6.0) for non-ACE patients. Similar to cost, LOS differences rose at higher percentiles of the distribution, with shorter stays for the ACE patients within each grouping. Compared with the ACE group, the unadjusted LOS difference for usual-care patients ranged from 0 days at the 25th percentile to 0.2 day longer at the median, 1.0 day longer at the 75th percentile, and 1.9 days longer at the 90th percentile. For both cost and LOS models, estimates remained stable after adjusting for age and combined comorbidity score (Table 2).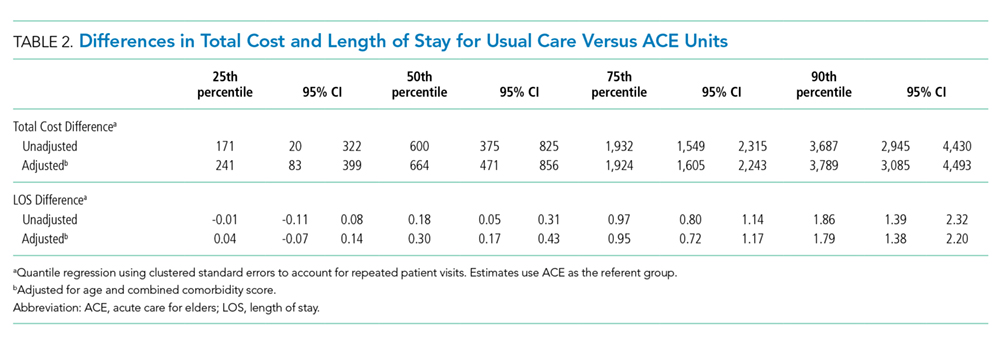
We explored the impact of increasing comorbidity burden on these outcomes using the following quartiles of the combined comorbidity score: −2 to 0 (387 ACE vs 3,322 usual-care patients), 1 to 2 (264 ACE vs 1,856 usual-care patients), 3 to 5 (476 ACE vs 2,859 usual-care patients), and 6 to 15 (301 ACE vs 2,122 usual-care patients). It was not surprising that cost and LOS paralleled each other, with the greatest cost and LOS benefits in the highest quartile of the combined comorbidity score (Figure 1). For example, at the 90th percentile, the cost difference approached $6,000 higher for the usual-care group in the top quartile of combined comorbidity score compared with nearly $3,000 higher for the lowest quartile. Similarly, at the 90th percentile, LOS for usual-care patients was 2.9 days longer at the top quartile compared with 1.7 days longer at the lowest quartile.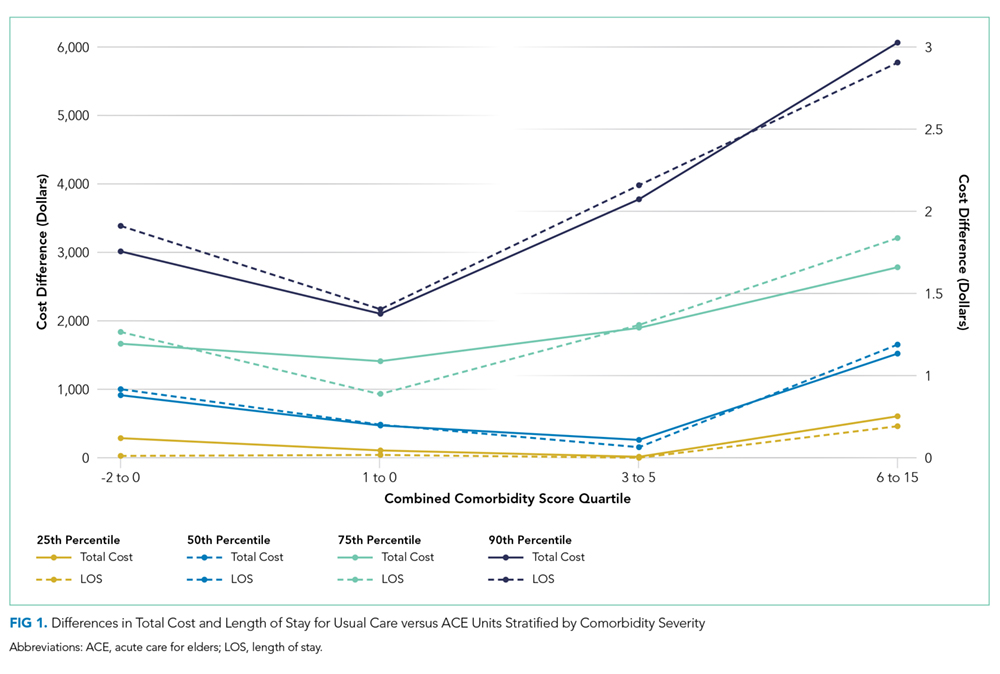
The all-cause 30-day readmission risk was similar for both groups, with an absolute risk difference of −0.7% (95% CI = −2.6% to 1.3%). Adjustment for age and comorbidity score did not substantially change this result. Following stratification by quartile of combined comorbidity scores, we observed similar readmission risks at each quartile (Figure 2).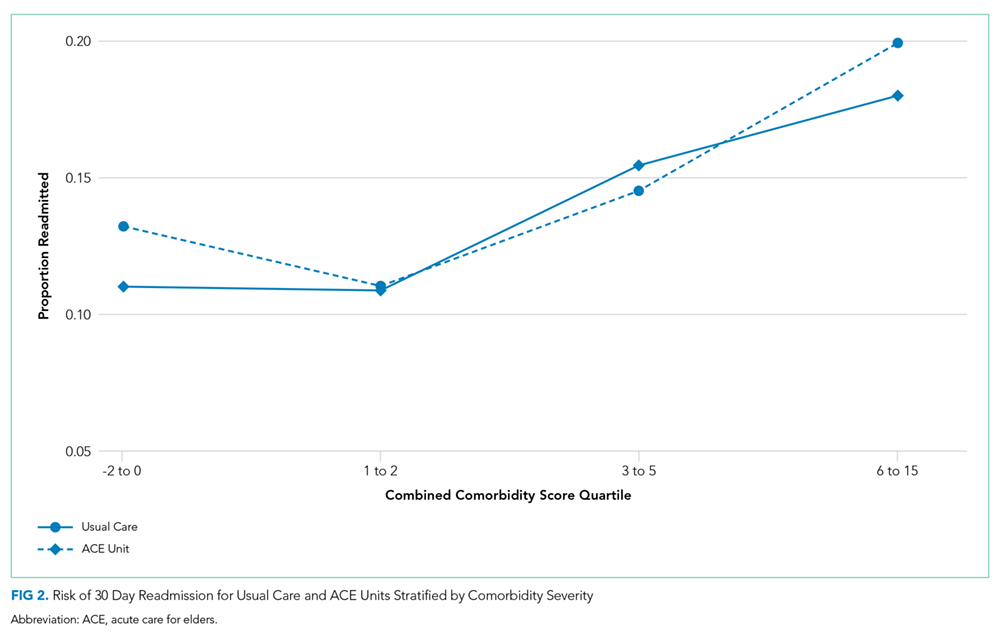
DISCUSSION
This quality improvement initiative evaluated which ACE admissions yielded the greatest value and found the largest reductions in LOS and cost in patients with the greatest comorbidity scores (frequently referred to as “high need, high cost”).23,24 Based on prior literature, we had anticipated that moderate risk patients would show the maximum benefit.15,25 In contrast to our findings, a University of Alabama (UAB) ACE program subgroup analysis using the CMS Case Mix Index (CMI) found a cost reduction for patients with low or intermediate CMI scores but not for those with high scores.15 The Hospital Elder Life Program (HELP) has yielded maximal impact for patients at moderate risk for delirium.26 Our results are supported by a University of Texas, Houston, study revealing lower LOS and cost for ACE patients, despite high CMI scores and endemic frailty, although it did not report outcomes across a range of comorbidities or costs.27 Our results may be determined by the specific characteristics of the Baystate ACE initiative. Our emphasis on considering prognosis and encouraging advance care planning could have contributed to the improved metrics for more complicated patients. It is possible that patients with high comorbidity burden were more likely to screen in with the surprise question, leading to more frequent goals of care discussions by the hospitalists or geriatrics team, which, in turn, may have resulted in less aggressive care and consequently lower costs. The emphasis on prognosis and palliative care was not a feature of the UAB or Texas studies. Additional components, such as the delirium screening and the presence of volunteer advocates, could also have impacted the results. Our tiered approach during rounds with rapid reviews for most patients and longer discussions for those at highest risk may have further contributed to the findings. Finally, although we did not track the recommendation acceptance rate for the entire study period, in the first 9 months of the project, 9,325 recommendations were made with an acceptance rate of >85%. We previously reported a similar acceptance rate for medication recommendations.28 Another factor contributing to our results may be the ways in which we categorized patients and calculated costs. We used the Gagne combined comorbidity score, which includes only prior conditions;21 the UAB study used CMI, which includes severity of presenting illness and complications, as well as baseline comorbidities. We also compared total cost, while UAB reported variable direct cost.
This study has a number of limitations. First, it was conducted at a single site and may not apply to other hospitals. Second, as a quality improvement program, its design, processes, and personnel evolved over time, and, as in any multicomponent initiative, the effect of individual factors on the outcomes is unknown. Third, this is an observational study with the aim of generating hypotheses for more rigorous studies in the future and residual confounding factors may exist despite efforts to adjust for variables present in an administrative database. Thus, we were unable to completely adjust for potentially important social factors, presence of delirium, or baseline functional status.
To our knowledge, this study is the first report on the differential impact of comorbidity scores and cost distribution on ACE total cost and LOS reductions. Despite its limitations, it contributes to the existing literature by suggesting that the Gagne comorbidity score can help identify which admissions will yield the greatest value. The Gagne score could be calculated at admission using the ePrognosis risk calculator or incorporated and automated in the EMR.29 Many health systems are reluctant to designate beds for specific subpopulations since doing so decreases flexibility and complicates the admission process. A dynamic tension exists between increasing income streams now and generating future savings by supporting initiatives with upfront costs. Other successful acute care geriatrics programs, such as NICHE,30 HELP,31 MACE,32 and consultation teams, exist.33 Studies reporting the outcomes of combining ACE units with these other approaches in a “portfolio approach” will inform the design of the most efficient and impactful programs.34 Scrupulous attention to symptom control and advance care planning are key features of our program, and, given the high prevalence of advanced serious illness in hospitalized older adults, this consideration may be critical for success.
As ACE units can only care for a small fraction of hospitalized older adults, determining which patients will maximally benefit from the structured, team-based care on ACE units is crucial. We found that the greatest impact on LOS and costs occurred in the subgroup with the highest comorbidity scores and overall cost. ACE care for the most vulnerable patients appeared to yield the greatest value for the system; thus, these older adults may need to be prioritized for admission. This improvement may enhance quality and value outcomes, maximize a scarce resource, and secure results needed to sustain the “clinician-led and data-driven” ACE model in the face of changing clinical and financial landscapes.35
Acknowledgments
All those with significant contributions to this work are included as authors.
The authors express their deep appreciation to all their Baystate collaborators, particularly to Rebecca Starr, MD, the first geriatrics medical director of the program, Ms. Virginia Chipps, RN, the program’s first nurse manager, and Tasmiah Chowdhury, PharmD, the program’s first pharmacist. We are also deeply grateful to those persons who provided programmatic advice and input on model ACE programs elsewhere, including Kyle Allen, MD, Michael Malone MD, Robert Palmer MD, and, especially, Kellie Flood, MD.
Disclosures
None of the authors have any existing or potential personal or financial conflicts relevant to this paper to report.
Funding
This work was supported in part by a Geriatric Workforce Enhancement Program award (grant # U1QHP28702) from the Health Resources and Services Administration and by internal support from Baystate Health
1. National Hospital Survey: number and rate of hospital discharge 2010 table. 2010; https://www.cdc.gov/nchs/fastats/hospital.htm. Accessed February, 10th 2019.
2. Brennan TA, Leape LL, Laird NM, Hebert L, Localio AR, Lawthers AG, Newhouse JP, Weiler PC, Hiatt HH. Incidence of adverse events and negligence in hospitalized patients. results of the Harvard medical practice study I. N Engl J Med. 1991;324(6):370-376. https://doi.org/10.1056/NEJM199102073240604.
3. Creditor MC. Hazards of hospitalization of the elderly. Ann Intern Med. 1993;118(3):219-223. PubMed
4. Levinson D. Adverse vents in hospitals: National incidence among Medicare beneficiaries; US Department of Health and Human Services, Office of the Inspector General 2010. Accessed February, 10th, 2019.
5. Palmer RM, Counsell S, Landefeld CS. Clinical intervention trials: the ACE unit. Clin Geriatr Med. 1998;14(4):831-849. PubMed
6. Landefeld CS. Foreword. In: Malone ML, Palmer MR, Capezuti E, eds. Acute Care for Elders New York Humana Press; 2014:v-xii.
7. Fox MT, Persaud M, Maimets I, O’Brien K, Brooks D, Tregunno D, Schraa E. Effectiveness of acute geriatric unit care using acute care for elders components: a systematic review and meta-analysis. J Am Geriatr Soc. 2012;60(12):2237-2245. https://doi.org/10.1111/jgs.12028.
8. Landefeld CS, Palmer RM, Kresevic DM, Fortinsky RH, Kowal J. A randomized trial of care in a hospital medical unit especially designed to improve the functional outcomes of acutely ill older patients. N Engl J Med. 1995;332(20):1338-1344. https://doi.org/10.1056/NEJM199505183322006.
9. Covinsky KE, King JT, Jr., Quinn LM, Siddique R, Palmer R, Kresevic DM, Fortinsky RH, Kowal J, Landefeld CS. Do acute care for elders units increase hospital costs? A cost analysis using the hospital perspective. J Am Geriatr Soc. 1997;45(6):729-734. PubMed
10. Counsell SR, Holder CM, Liebenauer LL, Palmer RM, Fortinsky RH, Kresevic DM, Quinn LM, Allen KR, Covinsky KE, Landefeld CS. Effects of a multicomponent intervention on functional outcomes and process of care in hospitalized older patients: a randomized controlled trial of Acute Care for Elders (ACE) in a community hospital. J Am Geriatr Soc. 2000;48(12):1572-1581. PubMed
11. Asplund K, Gustafson Y, Jacobsson C, Bucht G, Wahlin A, Peterson J, Blom JO, Angquist KA. Geriatric-based versus general wards for older acute medical patients: a randomized comparison of outcomes and use of resources. J Am Geriatr Soc. 2000;48(11):1381-1388. PubMed
12. Saltvedt I, Mo ES, Fayers P, Kaasa S, Sletvold O. Reduced mortality in treating acutely sick, frail older patients in a geriatric evaluation and management unit. A prospective randomized trial. J Am Geriatr Soc. 2002;50(5):792-798. PubMed
13. Jayadevappa R, Chhatre S, Weiner M, Raziano DB. Health resource utilization and medical care cost of Acute Care Elderly unit patients. Value Health. 2006;9(3):186-192. https://doi.org/10.1111/j.1524-4733.2006.00099.x.
14. Barnes DE, Palmer RM, Kresevic DM, Fortinsky RH, Kowal J, Chren MM, Landefeld CS. Acute Care for Elders units produced shorter hospital stays at lower cost while maintaining patients’ functional status. Health Aff (Millwood). 2012;31(6):1227-1236. https://doi.org/10.1377/hlthaff.2012.0142.
15. Flood KL, Maclennan PA, McGrew D, Green D, Dodd C, Brown CJ. Effects of an Acute Care for Elders unit on costs and 30-day readmissions. JAMA Intern Med. 2013;173(11):981-987. https://doi.org/10.1001/jamainternmed.2013.524.
16. Fox MT, Sidani S, Persaud M, Tregunno D, Maimets I, Brooks D, O’Brien K. Acute Care for Elders components of acute geriatric unit care: systematic descriptive review. J Am Geriatr Soc. 2013;61(6):939-946. https://doi.org/10.1111/jgs.12282.
17. Palmer MR, Kresevic DM. The Acute Care for Elders unit In: Malone ML, Palmer MR, Capezuti E, eds. Acute Care for Elders New York: Humana Press 2014:92.
18. Pierluissi E, Francis D, Covinsky KE. Patient and hospital factors that lead to adverse outcomes in hospitalized elders In: Malone ML, Palmer MR, Capezuti E, eds. Acute Care for Elders New York: Humana Press 2014:42.
19. Fulmer T. How to try this: Fulmer SPICES. Am J Nurs. 2007;107(10):40-48; quiz 48-49. https://doi.org/10.1097/01.NAJ.0000292197.76076.e1.
20. Downar J, Goldman R, Pinto R, Englesakis M, Adhikari NK. The “surprise question” for predicting death in seriously ill patients: a systematic review and meta-analysis. CMAJ. 2017;189(13):E484-E493. https://doi.org/10.1503/cmaj.160775.
21. Gagne JJ, Glynn RJ, Avorn J, Levin R, Schneeweiss S. A combined comorbidity score predicted mortality in elderly patients better than existing scores. J Clin Epidemiol. 2010;64(7):749-759. doi: 10.1016/j.jclinepi.2010.10.004.
22. Segal JB, Chang HY, Du Y, Walston JD, Carlson MC, Varadhan R. Development of a claims-based frailty indicator anchored to a well-established frailty phenotype. Med Care. 2017;55(7):716-722. https://doi.org/10.1097/MLR.0000000000000729.
23. Blumenthal D, Chernof B, Fulmer T, Lumpkin J, Selberg J. Caring for high-need, high-cost patients - an urgent priority. N Engl J Med. 2016;375(10):909-911. https://doi.org/10.1056/NEJMp1804276.
24. Blumenthal D. Caring for high-need, high-cost patients: what makes for a successful care management program? . https://www.commonwealthfund.org/publications/journal-article/2016/jul/caring-high-need-high-cost-patients-urgent-priority. Accessed March, 20th 2019.
25. Ahmed NN, Pearce SE. Acute Care for the Elderly: a literature review. Popul Health Manag. 2010;13(4):219-225. https://doi.org/10.1089/pop.2009.0058.
26. Inouye SK, Bogardus ST, Jr., Charpentier PA, Leo-Summers L, Acampora D, Holford TR, Cooney LM, Jr. A multicomponent intervention to prevent delirium in hospitalized older patients. N Engl J Med. 1999;340(9):669-676. https://doi.org/10.1056/NEJM199903043400901.
27. Ahmed N, Taylor K, McDaniel Y, Dyer CB. The role of an Acute Care for the Elderly unit in achieving hospital quality indicators while caring for frail hospitalized elders. Popul Health Manag. 2012;15(4):236-240. https://doi.org/10.1089/pop.2011.0055.
28. Chowdhury TP, Starr R, Brennan M, Knee A, Ehresman M, Velayutham L, Malanowski AJ, Courtney HA, Stefan MS. A quality improvement initiative to improve medication management in an Acute Care for Elders program through integration of a clinical pharmacist. J Pharm Pract. 2018:897190018786618. https://doi.org/10.1177/0897190018786618.
29. Lee S, Smith A, Widera E. ePrognosis -Gagne index. https://eprognosis.ucsf.edu/gagne.php. Accessed March 20th, 2019.
30. Turner JT, Lee V, Fletcher K, Hudson K, Barton D. Measuring quality of care with an inpatient elderly population. The geriatric resource nurse model. J Gerontol Nurs. 2001;27(3):8-18. PubMed
31. Hshieh TT, Yang T, Gartaganis SL, Yue J, Inouye SK. Hospital Elder Life Program: systematic review and meta-analysis of effectiveness. Am J Geriatr Psychiatry. 2018;26(10):1015-1033. https://doi.org/10.1016/j.jagp.2018.06.007.
32. Hung WW, Ross JS, Farber J, Siu AL. Evaluation of the Mobile Acute Care of the Elderly (MACE) service. JAMA Intern Med. 2013;173(11):990-996. https://doi.org/10.1001/jamainternmed.2013.478.
33. Sennour Y, Counsell SR, Jones J, Weiner M. Development and implementation of a proactive geriatrics consultation model in collaboration with hospitalists. J Am Geriatr Soc. 2009;57(11):2139-2145. https://doi.org/10.1111/j.1532-5415.2009.02496.x.
34. Capezuti E, Boltz M. An overview of hospital-based models of care. In: Malone ML, Palmer MR, Capezuti E, eds. Acute Care for Elders. New York: Humana Press 2014:49-68.
35. Malone ML, Yoo JW, Goodwin SJ. An introduction to the Acute Care for Elders In: Malone ML, Palmer MR, Capezuti E, eds. Acute Care for Elders New York: Humana Press 2014:1-9.
In 2016, 15.2% of older Americans were hospitalized compared with 7% of the overall population and their length of stay (LOS) was 0.7 days greater.1 Geriatric hospitalizations frequently result in complications, functional decline, nursing home transfers, and increased cost.2-4 This pattern of decline has been termed “hospitalitis” or dysfunctional syndrome.5,6 Hospitals need data-driven approaches to improve outcomes for elders. The Acute Care for Elders (ACE) program, which has been in existence for roughly 25 years, is one such model. ACE features include an environment prepared for older adults, patient-centered care to prevent functional and cognitive decline, frequent medical review to prevent iatrogenic injury or new geriatric syndromes, and early discharge and rehabilitation planning to maximize the likelihood of return to the community.7 Although published data vary somewhat, ACE programs have robust evidence documenting improved safety, quality, and value.8-15 A recent meta-analysis found that ACE programs decrease LOS, costs, new nursing home discharges, falls, delirium, and functional decline.16 However, of the 13 ACE trials reported to date, only five were published in the last decade. Recent rising pressure to decrease hospitalizations and reduce LOS has shifted some care to other settings and it is unclear whether the same results would persist in today’s rapid-paced hospitals.
ACE programs require enhanced resources and restructured care processes but there is a notable lack of data to guide patient selection. Admission criteria vary among the published reports, and information on whether comorbidity burden impacts the magnitude of benefit is scarce. One ACE investigator commented, “We were not able to identify a subgroup of patients who were most likely to benefit.”17 Not all hospitalized older adults can receive ACE care, and some units have closed due to financial and logistic pressures; thus, criteria to target this scarce resource are urgently needed. Our hospital implemented an ACE program in 2014 and we have measured and internally benchmarked important quality improvement metrics. Using this data, we conducted an exploratory analysis to generate hypotheses on the differential impact across the spectrum of cost, LOS, 30-day readmissions, and variations across quartiles of comorbidity severity.
METHODS
Setting and Patients
In September 2014, our 716-bed teaching hospital in Springfield, Massachusetts launched an ACE program to improve care for older adults on a single medical unit. The program succeeded in engaging the senior leadership, and geriatrics was identified as a priority in Baystate’s 5-year strategic plan. ACE patients ≥70 years were admitted from the emergency department with inpatient status. Patients transferred from other units or with advanced dementia or nearing death were excluded. Core components of the ACE program were derived from published summaries (see supplementary material).7,16
Interprofessional ”ACE Rounds”
Interprofessional ACE Rounds occurred every weekday. As one ACE analyst has noted, “the interdisciplinary team…ensures that the multifactorial nature of functional decline is met with a multicomponent plan to prevent it.”18 Rounds participants shifted over time but always included a geriatrics physician assistant (PA) or geriatrician (team leader), a pharmacist, staff nurses, and a chaplain. The nurse educator, dietician, research assistant, and patient advocate/volunteers attended intermittently. Before rounds, the PA reviewed the admission notes for new ACE patients. Initially, rounds were lengthy and included nurse coaching. Later, nurses’ presentations were structured by the SPICES tool (Sleep, Problems with eating/feeding, Incontinence, Confusion, Evidence of falls, Skin Breakdown)19 and tracking and reporting templates. Coaching and education, along with conversations that did not require the full team, were removed from rounds. Thus, the time required for rounds declined from about 75 minutes to 35 minutes, which allowed more patients to be discussed efficiently. This change was critical as the number of ACE patients rose following the shift to the larger unit. The pharmacist reviewed medications focusing on potentially inappropriate drugs. Following rounds, the nurses and pharmacist conveyed recommendations to the hospitalists.
Patient-Centered Activities to Prevent Functional and Cognitive Decline
Project leaders coached staff about the importance of mobility, sleep, and delirium prevention and identification. The nurses screened patients using the Confusion Assessment Method (CAM) and reported delirium promptly. Specific care sets for ACE patients were implemented (see supplementary material).
The project was enhanced by several palliative care components, ie tracking pain, noting psychiatric symptoms, and considering prognosis by posing the “Surprise Question” during rounds.20 (“Would you be surprised if this patient died in the next year?”). As far as staffing and logistics allowed, the goals of care conversation were held by a geriatrics PA with patients/families who “screened in.”
Prepared Environment
The ACE program’s unit was remodeled to facilitate physical and cognitive functioning and promote sleep at night (quiet hours: 10 PM-6 AM).
In accordance with quality improvement processes, iterative shifts were implemented over time in terms of checklist, presentation format, timing, and team participation. In December 2016, the program relocated to a unit with 34 ACE beds and 5 end-of-life beds; this move markedly increased the number of eligible ACE patients.
Study Design, Data Source, and Patients
Since we were implementing and measuring our ACE program with a quality improvement lens, we chose a descriptive cross-sectional study design to generate hypotheses regarding our program’s impact compared to usual care. Using a hospital-wide billing database (McKesson Performance Analytics, v19, Alpharetta, Georgia) we sampled inpatients aged >70 years with a medical Diagnosis Related Group (DRGs) admitted through the emergency department and discharged from a medical unit from September 22, 2014 to August 31, 2017. These criteria mirrored those in the ACE unit. Older adults requiring specialized care (eg, those with myocardial infarct) were excluded, as were those with billing codes for mechanical ventilation, admission to critical care units, or discharge to hospice. Because one of our outcomes was readmission, we excluded patients who died during hospitalization. Patient characteristics collected included demographics and insurance category. To evaluate comorbidity burden, we collected ICD-9/ICD-10 diagnostic codes and generated a combined comorbidity score as described by Gagne, et al.21 This score was devised to predict mortality and 30-day readmissions and had better predictive ability in elders than the Elixhauser or Charlson scores. Scores ranged from −2 to 26, although values >20 are rare.
Exposure
Subjects were categorized as either discharged from the ACE or discharged from usual care. ACE discharges were tracked daily on a spreadsheet that was linked into our sample of eligible subjects.
Outcomes
Total cost of hospitalization (direct plus indirect costs), LOS, and all-cause 30-day readmissions were queried from the same billing database.
Statistical Analysis
As this study was a quality improvement project, analyses were descriptive and exploratory; no statistical hypothesis testing was conducted. We initially evaluated subject characteristics and comorbidities across study groups to determine group balance and comparability using means and standard deviations for continuous data and frequencies and percentages for categorical data. To analyze total cost and LOS, we utilized quantile regression with clustered standard errors to account for clustering by patient. We calculated the median difference between hospitalization cost and LOS for usual care versus ACE patients (with ACE as the referent group). To explore variations across the distributions of outcomes, we determined differences in cost and LOS and their 95% confidence intervals at the 25th, 50th, 75th, and 90th percentiles. Thirty-day readmission risk was estimated using a generalized estimating equation model with a logit link and binomial family. Readmission risk is presented along with 95% confidence intervals. For all models, we initially evaluated change over time (by quarter). After establishing the absence of time trends, we collapsed results into a comparison of usual care versus ACE care. Model estimates are presented both unadjusted and adjusted for age and comorbidity score. Following our initial analyses of cost, LOS, and 30-day readmission risk; we explored differences across quartiles of combined comorbidity scores. We used the same unadjusted models described above but incorporated an interaction term to generate estimates stratified by quartile of comorbidity score. We performed two additional analyses to evaluate the robustness of our findings. First, because hemiplegia prevalence was higher in the usual-care group than in the ACE group and can result in higher cost of care, we repeated the analysis after excluding those patients with hemiplegia. Second, because we were unable to control for functional capacity in the entire sample, we evaluated group differences in mobility for a subsample obtained prior to October 2015 using ICD-9 diagnostic codes, which can be considered surrogate markers for mobility.22 The results of our first analysis did not substantively change our main findings; in our second analysis, groups were balanced by mobility factors which suggested that confounding by functional capacity would be limited in our full sample. The results of these analyses are reported in the supplemental material.
Analysis was completed using Stata v15.1 (StataCorp, LP College Station, Texas). The Baystate Medical Center Institutional Review Board determined that the initiative was quality improvement and “not research.”
RESULTS
A total of 13,209 patients met the initial inclusion criteria; 1,621 were excluded, resulting in a sample of 11,588 patients. Over the 3-year study period, 1,429 (12.3%) were discharged from ACE and 10,159 (87.7%) were discharged from usual care. The groups were similar in age, sex, race and insurance status. Compared with the usual-care group, ACE patients had a higher median comorbidity score (3 vs 2 for usual care) and higher rates for anemia, dementia, fluid and electrolyte disorders, hypertension, and chronic obstructive pulmonary disease (COPD). However, ACE patients had lower rates of hemiplegia (0.9% vs 3%), arrhythmias, and pulmonary circulation disorders than those with usual care (Table 1).
The median cost per ACE patient was slightly lower at $6,258 (interquartile range [IQR] = $4,683-$8,547) versus $6,858 (IQR = $4,855-$10,478) in usual care. Across the cost distribution, the ACE program had lower costs than usual care; however, these differences became more pronounced at the higher end of the distribution. For example, compared with the ACE group, the usual-care group’s unadjusted cost difference was $171 higher at the 25th percentile, $600 higher at the median, $1,932 higher at the 75th percentile, and $3,687 higher at the 90th percentile. The ACE median LOS was 3.7 days (IQR = 2.7-5.0) compared with 3.8 days (IQR = 2.7-6.0) for non-ACE patients. Similar to cost, LOS differences rose at higher percentiles of the distribution, with shorter stays for the ACE patients within each grouping. Compared with the ACE group, the unadjusted LOS difference for usual-care patients ranged from 0 days at the 25th percentile to 0.2 day longer at the median, 1.0 day longer at the 75th percentile, and 1.9 days longer at the 90th percentile. For both cost and LOS models, estimates remained stable after adjusting for age and combined comorbidity score (Table 2).
We explored the impact of increasing comorbidity burden on these outcomes using the following quartiles of the combined comorbidity score: −2 to 0 (387 ACE vs 3,322 usual-care patients), 1 to 2 (264 ACE vs 1,856 usual-care patients), 3 to 5 (476 ACE vs 2,859 usual-care patients), and 6 to 15 (301 ACE vs 2,122 usual-care patients). It was not surprising that cost and LOS paralleled each other, with the greatest cost and LOS benefits in the highest quartile of the combined comorbidity score (Figure 1). For example, at the 90th percentile, the cost difference approached $6,000 higher for the usual-care group in the top quartile of combined comorbidity score compared with nearly $3,000 higher for the lowest quartile. Similarly, at the 90th percentile, LOS for usual-care patients was 2.9 days longer at the top quartile compared with 1.7 days longer at the lowest quartile.
The all-cause 30-day readmission risk was similar for both groups, with an absolute risk difference of −0.7% (95% CI = −2.6% to 1.3%). Adjustment for age and comorbidity score did not substantially change this result. Following stratification by quartile of combined comorbidity scores, we observed similar readmission risks at each quartile (Figure 2).
DISCUSSION
This quality improvement initiative evaluated which ACE admissions yielded the greatest value and found the largest reductions in LOS and cost in patients with the greatest comorbidity scores (frequently referred to as “high need, high cost”).23,24 Based on prior literature, we had anticipated that moderate risk patients would show the maximum benefit.15,25 In contrast to our findings, a University of Alabama (UAB) ACE program subgroup analysis using the CMS Case Mix Index (CMI) found a cost reduction for patients with low or intermediate CMI scores but not for those with high scores.15 The Hospital Elder Life Program (HELP) has yielded maximal impact for patients at moderate risk for delirium.26 Our results are supported by a University of Texas, Houston, study revealing lower LOS and cost for ACE patients, despite high CMI scores and endemic frailty, although it did not report outcomes across a range of comorbidities or costs.27 Our results may be determined by the specific characteristics of the Baystate ACE initiative. Our emphasis on considering prognosis and encouraging advance care planning could have contributed to the improved metrics for more complicated patients. It is possible that patients with high comorbidity burden were more likely to screen in with the surprise question, leading to more frequent goals of care discussions by the hospitalists or geriatrics team, which, in turn, may have resulted in less aggressive care and consequently lower costs. The emphasis on prognosis and palliative care was not a feature of the UAB or Texas studies. Additional components, such as the delirium screening and the presence of volunteer advocates, could also have impacted the results. Our tiered approach during rounds with rapid reviews for most patients and longer discussions for those at highest risk may have further contributed to the findings. Finally, although we did not track the recommendation acceptance rate for the entire study period, in the first 9 months of the project, 9,325 recommendations were made with an acceptance rate of >85%. We previously reported a similar acceptance rate for medication recommendations.28 Another factor contributing to our results may be the ways in which we categorized patients and calculated costs. We used the Gagne combined comorbidity score, which includes only prior conditions;21 the UAB study used CMI, which includes severity of presenting illness and complications, as well as baseline comorbidities. We also compared total cost, while UAB reported variable direct cost.
This study has a number of limitations. First, it was conducted at a single site and may not apply to other hospitals. Second, as a quality improvement program, its design, processes, and personnel evolved over time, and, as in any multicomponent initiative, the effect of individual factors on the outcomes is unknown. Third, this is an observational study with the aim of generating hypotheses for more rigorous studies in the future and residual confounding factors may exist despite efforts to adjust for variables present in an administrative database. Thus, we were unable to completely adjust for potentially important social factors, presence of delirium, or baseline functional status.
To our knowledge, this study is the first report on the differential impact of comorbidity scores and cost distribution on ACE total cost and LOS reductions. Despite its limitations, it contributes to the existing literature by suggesting that the Gagne comorbidity score can help identify which admissions will yield the greatest value. The Gagne score could be calculated at admission using the ePrognosis risk calculator or incorporated and automated in the EMR.29 Many health systems are reluctant to designate beds for specific subpopulations since doing so decreases flexibility and complicates the admission process. A dynamic tension exists between increasing income streams now and generating future savings by supporting initiatives with upfront costs. Other successful acute care geriatrics programs, such as NICHE,30 HELP,31 MACE,32 and consultation teams, exist.33 Studies reporting the outcomes of combining ACE units with these other approaches in a “portfolio approach” will inform the design of the most efficient and impactful programs.34 Scrupulous attention to symptom control and advance care planning are key features of our program, and, given the high prevalence of advanced serious illness in hospitalized older adults, this consideration may be critical for success.
As ACE units can only care for a small fraction of hospitalized older adults, determining which patients will maximally benefit from the structured, team-based care on ACE units is crucial. We found that the greatest impact on LOS and costs occurred in the subgroup with the highest comorbidity scores and overall cost. ACE care for the most vulnerable patients appeared to yield the greatest value for the system; thus, these older adults may need to be prioritized for admission. This improvement may enhance quality and value outcomes, maximize a scarce resource, and secure results needed to sustain the “clinician-led and data-driven” ACE model in the face of changing clinical and financial landscapes.35
Acknowledgments
All those with significant contributions to this work are included as authors.
The authors express their deep appreciation to all their Baystate collaborators, particularly to Rebecca Starr, MD, the first geriatrics medical director of the program, Ms. Virginia Chipps, RN, the program’s first nurse manager, and Tasmiah Chowdhury, PharmD, the program’s first pharmacist. We are also deeply grateful to those persons who provided programmatic advice and input on model ACE programs elsewhere, including Kyle Allen, MD, Michael Malone MD, Robert Palmer MD, and, especially, Kellie Flood, MD.
Disclosures
None of the authors have any existing or potential personal or financial conflicts relevant to this paper to report.
Funding
This work was supported in part by a Geriatric Workforce Enhancement Program award (grant # U1QHP28702) from the Health Resources and Services Administration and by internal support from Baystate Health
1. National Hospital Survey: number and rate of hospital discharge 2010 table. 2010; https://www.cdc.gov/nchs/fastats/hospital.htm. Accessed February, 10th 2019.
2. Brennan TA, Leape LL, Laird NM, Hebert L, Localio AR, Lawthers AG, Newhouse JP, Weiler PC, Hiatt HH. Incidence of adverse events and negligence in hospitalized patients. results of the Harvard medical practice study I. N Engl J Med. 1991;324(6):370-376. https://doi.org/10.1056/NEJM199102073240604.
3. Creditor MC. Hazards of hospitalization of the elderly. Ann Intern Med. 1993;118(3):219-223. PubMed
4. Levinson D. Adverse vents in hospitals: National incidence among Medicare beneficiaries; US Department of Health and Human Services, Office of the Inspector General 2010. Accessed February, 10th, 2019.
5. Palmer RM, Counsell S, Landefeld CS. Clinical intervention trials: the ACE unit. Clin Geriatr Med. 1998;14(4):831-849. PubMed
6. Landefeld CS. Foreword. In: Malone ML, Palmer MR, Capezuti E, eds. Acute Care for Elders New York Humana Press; 2014:v-xii.
7. Fox MT, Persaud M, Maimets I, O’Brien K, Brooks D, Tregunno D, Schraa E. Effectiveness of acute geriatric unit care using acute care for elders components: a systematic review and meta-analysis. J Am Geriatr Soc. 2012;60(12):2237-2245. https://doi.org/10.1111/jgs.12028.
8. Landefeld CS, Palmer RM, Kresevic DM, Fortinsky RH, Kowal J. A randomized trial of care in a hospital medical unit especially designed to improve the functional outcomes of acutely ill older patients. N Engl J Med. 1995;332(20):1338-1344. https://doi.org/10.1056/NEJM199505183322006.
9. Covinsky KE, King JT, Jr., Quinn LM, Siddique R, Palmer R, Kresevic DM, Fortinsky RH, Kowal J, Landefeld CS. Do acute care for elders units increase hospital costs? A cost analysis using the hospital perspective. J Am Geriatr Soc. 1997;45(6):729-734. PubMed
10. Counsell SR, Holder CM, Liebenauer LL, Palmer RM, Fortinsky RH, Kresevic DM, Quinn LM, Allen KR, Covinsky KE, Landefeld CS. Effects of a multicomponent intervention on functional outcomes and process of care in hospitalized older patients: a randomized controlled trial of Acute Care for Elders (ACE) in a community hospital. J Am Geriatr Soc. 2000;48(12):1572-1581. PubMed
11. Asplund K, Gustafson Y, Jacobsson C, Bucht G, Wahlin A, Peterson J, Blom JO, Angquist KA. Geriatric-based versus general wards for older acute medical patients: a randomized comparison of outcomes and use of resources. J Am Geriatr Soc. 2000;48(11):1381-1388. PubMed
12. Saltvedt I, Mo ES, Fayers P, Kaasa S, Sletvold O. Reduced mortality in treating acutely sick, frail older patients in a geriatric evaluation and management unit. A prospective randomized trial. J Am Geriatr Soc. 2002;50(5):792-798. PubMed
13. Jayadevappa R, Chhatre S, Weiner M, Raziano DB. Health resource utilization and medical care cost of Acute Care Elderly unit patients. Value Health. 2006;9(3):186-192. https://doi.org/10.1111/j.1524-4733.2006.00099.x.
14. Barnes DE, Palmer RM, Kresevic DM, Fortinsky RH, Kowal J, Chren MM, Landefeld CS. Acute Care for Elders units produced shorter hospital stays at lower cost while maintaining patients’ functional status. Health Aff (Millwood). 2012;31(6):1227-1236. https://doi.org/10.1377/hlthaff.2012.0142.
15. Flood KL, Maclennan PA, McGrew D, Green D, Dodd C, Brown CJ. Effects of an Acute Care for Elders unit on costs and 30-day readmissions. JAMA Intern Med. 2013;173(11):981-987. https://doi.org/10.1001/jamainternmed.2013.524.
16. Fox MT, Sidani S, Persaud M, Tregunno D, Maimets I, Brooks D, O’Brien K. Acute Care for Elders components of acute geriatric unit care: systematic descriptive review. J Am Geriatr Soc. 2013;61(6):939-946. https://doi.org/10.1111/jgs.12282.
17. Palmer MR, Kresevic DM. The Acute Care for Elders unit In: Malone ML, Palmer MR, Capezuti E, eds. Acute Care for Elders New York: Humana Press 2014:92.
18. Pierluissi E, Francis D, Covinsky KE. Patient and hospital factors that lead to adverse outcomes in hospitalized elders In: Malone ML, Palmer MR, Capezuti E, eds. Acute Care for Elders New York: Humana Press 2014:42.
19. Fulmer T. How to try this: Fulmer SPICES. Am J Nurs. 2007;107(10):40-48; quiz 48-49. https://doi.org/10.1097/01.NAJ.0000292197.76076.e1.
20. Downar J, Goldman R, Pinto R, Englesakis M, Adhikari NK. The “surprise question” for predicting death in seriously ill patients: a systematic review and meta-analysis. CMAJ. 2017;189(13):E484-E493. https://doi.org/10.1503/cmaj.160775.
21. Gagne JJ, Glynn RJ, Avorn J, Levin R, Schneeweiss S. A combined comorbidity score predicted mortality in elderly patients better than existing scores. J Clin Epidemiol. 2010;64(7):749-759. doi: 10.1016/j.jclinepi.2010.10.004.
22. Segal JB, Chang HY, Du Y, Walston JD, Carlson MC, Varadhan R. Development of a claims-based frailty indicator anchored to a well-established frailty phenotype. Med Care. 2017;55(7):716-722. https://doi.org/10.1097/MLR.0000000000000729.
23. Blumenthal D, Chernof B, Fulmer T, Lumpkin J, Selberg J. Caring for high-need, high-cost patients - an urgent priority. N Engl J Med. 2016;375(10):909-911. https://doi.org/10.1056/NEJMp1804276.
24. Blumenthal D. Caring for high-need, high-cost patients: what makes for a successful care management program? . https://www.commonwealthfund.org/publications/journal-article/2016/jul/caring-high-need-high-cost-patients-urgent-priority. Accessed March, 20th 2019.
25. Ahmed NN, Pearce SE. Acute Care for the Elderly: a literature review. Popul Health Manag. 2010;13(4):219-225. https://doi.org/10.1089/pop.2009.0058.
26. Inouye SK, Bogardus ST, Jr., Charpentier PA, Leo-Summers L, Acampora D, Holford TR, Cooney LM, Jr. A multicomponent intervention to prevent delirium in hospitalized older patients. N Engl J Med. 1999;340(9):669-676. https://doi.org/10.1056/NEJM199903043400901.
27. Ahmed N, Taylor K, McDaniel Y, Dyer CB. The role of an Acute Care for the Elderly unit in achieving hospital quality indicators while caring for frail hospitalized elders. Popul Health Manag. 2012;15(4):236-240. https://doi.org/10.1089/pop.2011.0055.
28. Chowdhury TP, Starr R, Brennan M, Knee A, Ehresman M, Velayutham L, Malanowski AJ, Courtney HA, Stefan MS. A quality improvement initiative to improve medication management in an Acute Care for Elders program through integration of a clinical pharmacist. J Pharm Pract. 2018:897190018786618. https://doi.org/10.1177/0897190018786618.
29. Lee S, Smith A, Widera E. ePrognosis -Gagne index. https://eprognosis.ucsf.edu/gagne.php. Accessed March 20th, 2019.
30. Turner JT, Lee V, Fletcher K, Hudson K, Barton D. Measuring quality of care with an inpatient elderly population. The geriatric resource nurse model. J Gerontol Nurs. 2001;27(3):8-18. PubMed
31. Hshieh TT, Yang T, Gartaganis SL, Yue J, Inouye SK. Hospital Elder Life Program: systematic review and meta-analysis of effectiveness. Am J Geriatr Psychiatry. 2018;26(10):1015-1033. https://doi.org/10.1016/j.jagp.2018.06.007.
32. Hung WW, Ross JS, Farber J, Siu AL. Evaluation of the Mobile Acute Care of the Elderly (MACE) service. JAMA Intern Med. 2013;173(11):990-996. https://doi.org/10.1001/jamainternmed.2013.478.
33. Sennour Y, Counsell SR, Jones J, Weiner M. Development and implementation of a proactive geriatrics consultation model in collaboration with hospitalists. J Am Geriatr Soc. 2009;57(11):2139-2145. https://doi.org/10.1111/j.1532-5415.2009.02496.x.
34. Capezuti E, Boltz M. An overview of hospital-based models of care. In: Malone ML, Palmer MR, Capezuti E, eds. Acute Care for Elders. New York: Humana Press 2014:49-68.
35. Malone ML, Yoo JW, Goodwin SJ. An introduction to the Acute Care for Elders In: Malone ML, Palmer MR, Capezuti E, eds. Acute Care for Elders New York: Humana Press 2014:1-9.
© 2019 Society of Hospital Medicine