User login
Safety Assessment of a Noninvasive Respiratory Protocol for Adults With COVID-19
Hypoxemic respiratory failure is a hallmark of severe coronavirus disease 2019 (COVID-19). Initial guidelines favored early mechanical ventilation (MV) over traditional noninvasive strategies, such as high-flow nasal cannula (HFNC) and noninvasive positive pressure ventilation (NIV), based on perceived ineffectiveness and dangers extrapolated from severe acute respiratory syndrome coronavirus (SARS-CoV) and Middle East respiratory syndrome coronavirus (MERS-CoV) patients.1,2 As COVID-19 progressed, early MV became associated with prolonged ventilator courses and high mortality.3-6 Simultaneously, data emerged that HFNC/NIV and self-proning, could successfully stabilize some COVID-19 patients.7-10 Based on evolving evidence, we implemented a noninvasive COVID-19 respiratory protocol (NCRP) that promoted the early use of HFNC, NIV, and self-proning for hypoxemia in patients with COVID-19, with the intention of avoiding MV in some patients. The protocol was implemented throughout our hospital system, from the Emergency Departments (EDs) to the medical floors and critical care units.
Although preliminary evidence supported the use of HFNC, NIV, and self-proning, the impact of a system-wide noninvasive COVID-19 respiratory protocol on safety has not been well described. The objective of this study was to evaluate patient safety outcomes after implementation of the NCRP, including intubation rate and mortality.
METHODS
Study Design and Setting
We performed a retrospective chart review, adhering to SQUIRE (Standards for Quality Improvement Reporting Excellence) Guidelines, to assess safety outcomes after implementation of the NCRP.11 Baystate Health is a not-for-profit, integrated healthcare system in western Massachusetts composed of four hospitals and one free-standing ED with 980 beds serving over 800,000 people. The Baystate Health IRB determined that this project did not meet criteria for Human Subjects Research.
Selection of Participants
A consecutive sample of adults (≥18 years old) admitted to the hospital with a positive nucleic acid test for SARS-CoV-2 (reverse transcriptase–polymerase chain reaction [RT-PCR]) test via nasopharyngeal swab (Cepheid or Roche Cobas 6800) between March 15, 2020, and April 15, 2020, were included. Participants were identified by either an order for the COVID-19 test with a positive result or a discharge diagnosis of COVID-19. Daily rapid response team (RRT), intensive care unit (ICU), and COVID-19 unit logs were reviewed to ensure all COVID-19 patients were included. Patients with positive tests admitted for reasons unrelated to COVID-19 infections, such as patients in labor, were excluded.
Interventions
At the start of the COVID-19 pandemic, the Baystate Health system adopted a conservative approach to the respiratory management of patients with COVID-19. This approach started with nasal cannula up to 6 L/min or nonrebreather up to 15 L/min. If the patient remained in respiratory distress, intubation was recommended.
Based on emerging evidence, the NCRP was created. The details of the NCRP implementation have been previously described.12 Briefly, over a 4-day period (April 3, 2020, to April 7, 2020), a multidisciplinary team developed, refined, and rapidly implemented a COVID-19 respiratory protocol that encouraged the early use of HFNC, NIV, and self-proning in clinically appropriate patients with hypoxemia and respiratory distress due to COVID-19 prior to intubation across all departments of the Baystate Health system (Appendix 1).
Measurements
A chart review was performed using a structured data collection form (Appendix 2). The data collection form was piloted by three physician-researchers. Data abstraction was performed by 16 clinicians. Abstractors were practicing emergency providers and hospitalists and were blinded to the study outcomes. Abstractors received a 1-hour training and abstracted data from at least five charts in parallel with investigators. An additional 10% of charts were double abstracted to calculate interrater reliability for five variables determined a priori.
To validate the capture of outcomes of interest, we triangulated data sources by cross-referencing the monthly RRT log, the ICU list, all orders for HFNC, and RRT activations. Data abstraction occurred from April 21, 2020, to April 30, 2020. Patients who were still hospitalized after April 30,2020, were followed until hospital discharge, ending July 1, 2020.
Outcomes and Analysis
The primary outcome was mortality, defined as the proportion of deaths by admissions during the post–NCRP implementation period (April 3, 2020, to April 15, 2020), compared with the preimplementation period (March 15, 2020, to April 2, 2020). Deaths were stratified by patient code status (do not resuscitate/do not intubate [DNR/DNI] established prior to admission vs Full Code or presumed Full Code). Mortality outcomes were evaluated using one-sided Fisher exact tests.
To assess whether the protocol led to an increase in the use of the interventions and a decrease in intubations, we compared the use of proning, HFNC, NIV, and intubation before the protocol was implemented and with use after. Intubation rates were analyzed using interrupted time series (piecemeal regression), without adjustments, using a cut point of April 2, 2020.
Secondary outcomes included unexpected cardiac arrests, ICU transfers and consultations, and RRT activations during the postimplementation period, compared with the preimplementation period. Secondary outcomes were evaluated using standard chi-square tests (χ2). Additional descriptive outcomes included use of the NCRP, overall and by components, and in-hospital rates of MV.
RESULTS
From March 15, 2020, through April 15, 2020, there were 469 patients with COVID-19 admitted to the four hospitals of the Baystate Health system. Patients had an average age of 70 years (SD, 16.4), 241 (52%) were female, and 336 (72%) spoke English as their primary language. Most patients, 405 (86.4%), required supplemental oxygen upon being admitted to the hospital (Table 1).

Postimplementation Mortality
Overall, 123 (26.2%) patients died during the study period. In the preimplementation cohort, 24% (61 of 254) of patients died, compared with 28.8% (62 of 215) in the postimplementation cohort (one-sided Fisher exact, P = .14). Excluding patients with an established DNR/DNI prior to admission, 21.8% (48 of 220) patients died in the preimplementation period vs 21.9% (35 of 160) patients after implementation of the NCRP (Table 2).

Secondary Safety Outcomes
There was no increase in RRT activations (preimplementation, 16.5% [42 of 254], vs postimplementation, 11.6% [25 of 215]; χ2P = 0.17) or ICU consultations (preimplementation, 18.1% [47 of 254], vs postimplementation, 16.3% [35 of 215]; χ2P = 0.52). ICU transfers decreased in the postimplementation period (preimplementation, 26.8% [68 of 254], vs postimplementation, 13.5% [29 of 215], χ2P < .001). There was one unexpected cardiac arrest documented in the postimplementation period, compared to none before implementation.
NCRP Protocol Implementation
After implementation, the proportion of patients using HFNC increased from 5.5% (14 of 254) to 24.7% (53 of 215), and self-proning increased from 7.5% (19 of 254) to 22.8% (49 of 215). The proportion of patients who were intubated (MV) decreased from 25.2% (64 of 254) to 10.7% (23 of 215) (χ2P < .01). Interrupted time series analysis demonstrated an immediate reduction in the proportion of patients intubated after the intervention (incident rate ratio, 0.44; 95% CI, 0.23-0.83; P = .012) (Figure). The median time from admission to MV was longer in the postimplementation period patients (postimplementation, 1.4 days; interquartile range, 0.21-2.9; vs preimplementation, 0.66 days; IQR 0.23-1.69).

Interrater Reliability
Interrater reliability for variables chosen a priori was k = 1.0 for self-proning, k = 1.0 for intubation, k = 0.95 for discharge disposition, k = 0.94 for nasal cannula, and k = 0.74 for HFNC.
DISCUSSION
The rapid spread of SARS-CoV-2 led to early recommendations based on minimal data. As evidence emerged, hospitals were forced to adapt to protect patients and medical providers. As a healthcare system, we incorporated emerging evidence to rapidly implement a noninvasive respiratory treatment protocol. Aware of the methodological problems in evaluating the NCRP itself, we integrated best practices of quality improvement to examine multiple patient safety outcomes after NCRP implementation. We found the rate of intubation decreased with no significant increase in mortality, ICU transfers, RRT activations, or unexpected deaths after the implementation of the NCRP.
Although we were unable to measure all confounders and changes that co-occurred during the study period, initial vital signs, age, BMI, past medical history, and use of oxygen were similar between the pre- and postimplementation cohorts. Further, there were many constants worth noting. First, COVID-19 respiratory protocols were highly regulated to ensure patient safety and minimize COVID-19 transmission. Second, there were no new nonrespiratory treatments or medications during the study. Third, although the COVID-19 hospital census rose during the study, it never overwhelmed resources; there was no rationing of clinical care.
The nonsignificant increase in mortality in the postimplementation period was limited to patients with an established DNR/DNI prior to admission. Established DNR/DNI patients were largely from skilled nursing facilities that were disproportionally impacted in the postimplementation period through clustered outbreaks of COVID-19 in our region, which likely contributed to the increased mortality.13
Additionally, despite decreased MV rates in the postimplementation period, we did not find a concurrent decrease in mortality. We do not believe this is a failure of noninvasive treatments. Rather, the increased proportion of DNR/DNI patients, combined with increased nursing home outbreaks in the postimplementation period likely influenced mortality. The postimplementation decreases in ICU transfers and RRT activations supports this hypothesis.
Finally, it is worth nothing that, although the goal of decreasing intubations was to improve patient care and decrease mortality, a decrease in intubations alone, without a change in mortality, may be important because mechanical ventilation has been associated with increased morbidity, such as posttraumatic stress disorder.14
Taken together, the post–NCRP implementation period appears to have been safe for patients, compared to the preimplementation period’s protocol. Future research may help understand the impact of specific noninvasive interventions on COVID-19–related MV and mortality.
Limitations
Given the urgency of COVID-19 treatment, the NCRP was designed as a quality improvement initiative rather than a prospective trial. Issues of selection bias and confounding limit our ability to evaluate the effect of the NCRP itself. Additionally, unmeasured patient and provider factors may have influenced outcomes. For example, increased provider knowledge and experience treating COVID-19 may have improved outcomes over time, and unmeasured patient characteristics may have been different in the pre- and postimplementation groups. Finally, our study was limited to a single healthcare system, which may limit generalizability
That said, the objective of our study was to evaluate patient safety outcomes of the NCRP, an important first step while other hospital systems continue to confront increasing rates of COVID-19 and must decide on appropriate respiratory management. To that end, our enrollment captured 469 COVID-19 admissions across four diverse hospitals without obvious differences in initial measured covariates. Further, the strict protocolization of respiratory treatments, the evaluation of multiple safety outcomes, and the complete patient follow-up all support the conclusion that NCRP in the postimplementation period did not increase adverse patient outcomes. Further studies are needed to determine the efficacy of the NCRP protocol itself.
CONCLUSION
In our health system, patients with COVID-19 did not experience a significant increase in mortality, RRT activations, or ICU admissions despite decreased rates of MV after implementation of a respiratory protocol that encouraged early noninvasive management of COVID-19 respiratory distress.
ACKNOWLEDGEMENTS
The authors would like to acknowledge Elizabeth Coray, Joseph Lahey, Richard Gabor, Cheryl Greenstein, Sarah Badach, Marie Boutin, Adrienne Wurl, Anthony Kitchen, Michelle Holton, Matthew Shapiro, Eleanor Ragone, Nageshwar Jonnalagadda, Ryan Flynn, Raghuveer Rakasi, and Jasmine Paadam.
1. Brown CA 3rd, Mosier JM, Carlson JN, Gibbs MA. Pragmatic recommendations for intubating critically ill patients with suspected COVID-19. J Am Coll Emerg Physicians Open. 2020;1(2):80-84. https://doi.org/10.1002/emp2.12063
2. Arabi YM, Arifi AA, Balkhy HH, et al. Clinical course and outcomes of critically ill patients with middle east respiratory syndrome coronavirus infection. Ann Intern Med. 2014;160(6):389-397. https://doi.org/10.7326/m13-2486
3. Ziehr DR, Alladina J, Petri CR, et al. Respiratory pathophysiology of mechanically ventilated patients with COVID-19: a cohort study. Am J Respir Crit Care Med. 2020;201(12):1560-1564. https://doi.org/10.1164/rccm.202004-1163le
4. Richardson S, Hirsch JS, Narasimhan M, et al. Presenting characteristics, comorbidities, and outcomes among 5700 patients hospitalized with COVID-19 in the New York City area. JAMA. 2020;323(20):2052-2059. https://doi.org/10.1001/jama.2020.6775
5. Cummings MJ, Baldwin MR, Abrams D, et al. Epidemiology, clinical course, and outcomes of critically ill adults with COVID-19 in New York City: a prospective cohort study. Lancet. 2020;395(10239):1763-1770. https://doi.org/10.1016/s0140-6736(20)31189-2
6. Farfel JM, Franca SA, Sitta Mdo C, Filho WJ, Carvalho CR. Age, invasive ventilatory support and outcomes in elderly patients admitted to intensive care units. Age Ageing. 2009;38(5):515-520. https://doi.org/10.1093/ageing/afp119
7. Caputo ND, Strayer RJ, Levitan R. Early self-proning in awake, non-intubated patients in the emergency department: a single ED’s experience during the COVID-19 pandemic. Acad Emerg Med. 2020;27(5):375-378. https://doi.org/10.1111/acem.13994
8. Sun Q, Qiu H, Huang M, Yang Y. Lower mortality of COVID-19 by early recognition and intervention: experience from Jiangsu Province. Ann Intensive Care. 2020;10(1):33. https://doi.org/10.1186/s13613-020-00650-2
9. Wang K, Zhao W, Li J, Shu W, Duan J. The experience of high-flow nasal cannula in hospitalized patients with 2019 novel coronavirus-infected pneumonia in two hospitals of Chongqing, China. Ann Intensive Care. 2020;10(1):37. https://doi.org/10.1186/s13613-020-00653-z
10. Alhazzani W, Møller MH, Arabi YM, et al. Surviving Sepsis Campaign: guidelines on the management of critically ill adults with coronavirus disease 2019 (COVID-19). Intensive Care Med. 2020;46(5):854-887 https://doi.org/10.1007/s00134-020-06022-5
11. Ogrinc G, Davies L, Goodman D, Batalden P, Davidoff F, Stevens D. SQUIRE 2.0 (standards for quality improvement reporting excellence): revised publication guidelines from a detailed consensus process. BMJ Qual Saf. 2016;25(12):986-992. https://doi.org/10.1136/bmjqs-2015-004411
12. Westafer LM, Elia T, Medarametla V, Lagu T. A transdiciplinary COVID-19 early respiratory intervention protocol: an implementation story. J Hosp Med. 2020;15(6):372-374. https://doi.org/10.12788/jhm.3456
13. COVID-19 Response Reporting. Mass.gov. Accessed July 20, 2020. https://www.mass.gov/info-details/covid-19-response-reporting#covid-19-daily-dashboard-
14. Shaw RJ, Harvey JE, Bernard R, Gunary R, Tiley M, Steiner H. Comparison of short-term psychological outcomes of respiratory failure treated by either invasive or non-invasive ventilation. Psychosomatics. 2009;50(6):586-591. https://doi.org/10.1176/appi.psy.50.6.586
Hypoxemic respiratory failure is a hallmark of severe coronavirus disease 2019 (COVID-19). Initial guidelines favored early mechanical ventilation (MV) over traditional noninvasive strategies, such as high-flow nasal cannula (HFNC) and noninvasive positive pressure ventilation (NIV), based on perceived ineffectiveness and dangers extrapolated from severe acute respiratory syndrome coronavirus (SARS-CoV) and Middle East respiratory syndrome coronavirus (MERS-CoV) patients.1,2 As COVID-19 progressed, early MV became associated with prolonged ventilator courses and high mortality.3-6 Simultaneously, data emerged that HFNC/NIV and self-proning, could successfully stabilize some COVID-19 patients.7-10 Based on evolving evidence, we implemented a noninvasive COVID-19 respiratory protocol (NCRP) that promoted the early use of HFNC, NIV, and self-proning for hypoxemia in patients with COVID-19, with the intention of avoiding MV in some patients. The protocol was implemented throughout our hospital system, from the Emergency Departments (EDs) to the medical floors and critical care units.
Although preliminary evidence supported the use of HFNC, NIV, and self-proning, the impact of a system-wide noninvasive COVID-19 respiratory protocol on safety has not been well described. The objective of this study was to evaluate patient safety outcomes after implementation of the NCRP, including intubation rate and mortality.
METHODS
Study Design and Setting
We performed a retrospective chart review, adhering to SQUIRE (Standards for Quality Improvement Reporting Excellence) Guidelines, to assess safety outcomes after implementation of the NCRP.11 Baystate Health is a not-for-profit, integrated healthcare system in western Massachusetts composed of four hospitals and one free-standing ED with 980 beds serving over 800,000 people. The Baystate Health IRB determined that this project did not meet criteria for Human Subjects Research.
Selection of Participants
A consecutive sample of adults (≥18 years old) admitted to the hospital with a positive nucleic acid test for SARS-CoV-2 (reverse transcriptase–polymerase chain reaction [RT-PCR]) test via nasopharyngeal swab (Cepheid or Roche Cobas 6800) between March 15, 2020, and April 15, 2020, were included. Participants were identified by either an order for the COVID-19 test with a positive result or a discharge diagnosis of COVID-19. Daily rapid response team (RRT), intensive care unit (ICU), and COVID-19 unit logs were reviewed to ensure all COVID-19 patients were included. Patients with positive tests admitted for reasons unrelated to COVID-19 infections, such as patients in labor, were excluded.
Interventions
At the start of the COVID-19 pandemic, the Baystate Health system adopted a conservative approach to the respiratory management of patients with COVID-19. This approach started with nasal cannula up to 6 L/min or nonrebreather up to 15 L/min. If the patient remained in respiratory distress, intubation was recommended.
Based on emerging evidence, the NCRP was created. The details of the NCRP implementation have been previously described.12 Briefly, over a 4-day period (April 3, 2020, to April 7, 2020), a multidisciplinary team developed, refined, and rapidly implemented a COVID-19 respiratory protocol that encouraged the early use of HFNC, NIV, and self-proning in clinically appropriate patients with hypoxemia and respiratory distress due to COVID-19 prior to intubation across all departments of the Baystate Health system (Appendix 1).
Measurements
A chart review was performed using a structured data collection form (Appendix 2). The data collection form was piloted by three physician-researchers. Data abstraction was performed by 16 clinicians. Abstractors were practicing emergency providers and hospitalists and were blinded to the study outcomes. Abstractors received a 1-hour training and abstracted data from at least five charts in parallel with investigators. An additional 10% of charts were double abstracted to calculate interrater reliability for five variables determined a priori.
To validate the capture of outcomes of interest, we triangulated data sources by cross-referencing the monthly RRT log, the ICU list, all orders for HFNC, and RRT activations. Data abstraction occurred from April 21, 2020, to April 30, 2020. Patients who were still hospitalized after April 30,2020, were followed until hospital discharge, ending July 1, 2020.
Outcomes and Analysis
The primary outcome was mortality, defined as the proportion of deaths by admissions during the post–NCRP implementation period (April 3, 2020, to April 15, 2020), compared with the preimplementation period (March 15, 2020, to April 2, 2020). Deaths were stratified by patient code status (do not resuscitate/do not intubate [DNR/DNI] established prior to admission vs Full Code or presumed Full Code). Mortality outcomes were evaluated using one-sided Fisher exact tests.
To assess whether the protocol led to an increase in the use of the interventions and a decrease in intubations, we compared the use of proning, HFNC, NIV, and intubation before the protocol was implemented and with use after. Intubation rates were analyzed using interrupted time series (piecemeal regression), without adjustments, using a cut point of April 2, 2020.
Secondary outcomes included unexpected cardiac arrests, ICU transfers and consultations, and RRT activations during the postimplementation period, compared with the preimplementation period. Secondary outcomes were evaluated using standard chi-square tests (χ2). Additional descriptive outcomes included use of the NCRP, overall and by components, and in-hospital rates of MV.
RESULTS
From March 15, 2020, through April 15, 2020, there were 469 patients with COVID-19 admitted to the four hospitals of the Baystate Health system. Patients had an average age of 70 years (SD, 16.4), 241 (52%) were female, and 336 (72%) spoke English as their primary language. Most patients, 405 (86.4%), required supplemental oxygen upon being admitted to the hospital (Table 1).
Postimplementation Mortality
Overall, 123 (26.2%) patients died during the study period. In the preimplementation cohort, 24% (61 of 254) of patients died, compared with 28.8% (62 of 215) in the postimplementation cohort (one-sided Fisher exact, P = .14). Excluding patients with an established DNR/DNI prior to admission, 21.8% (48 of 220) patients died in the preimplementation period vs 21.9% (35 of 160) patients after implementation of the NCRP (Table 2).
Secondary Safety Outcomes
There was no increase in RRT activations (preimplementation, 16.5% [42 of 254], vs postimplementation, 11.6% [25 of 215]; χ2P = 0.17) or ICU consultations (preimplementation, 18.1% [47 of 254], vs postimplementation, 16.3% [35 of 215]; χ2P = 0.52). ICU transfers decreased in the postimplementation period (preimplementation, 26.8% [68 of 254], vs postimplementation, 13.5% [29 of 215], χ2P < .001). There was one unexpected cardiac arrest documented in the postimplementation period, compared to none before implementation.
NCRP Protocol Implementation
After implementation, the proportion of patients using HFNC increased from 5.5% (14 of 254) to 24.7% (53 of 215), and self-proning increased from 7.5% (19 of 254) to 22.8% (49 of 215). The proportion of patients who were intubated (MV) decreased from 25.2% (64 of 254) to 10.7% (23 of 215) (χ2P < .01). Interrupted time series analysis demonstrated an immediate reduction in the proportion of patients intubated after the intervention (incident rate ratio, 0.44; 95% CI, 0.23-0.83; P = .012) (Figure). The median time from admission to MV was longer in the postimplementation period patients (postimplementation, 1.4 days; interquartile range, 0.21-2.9; vs preimplementation, 0.66 days; IQR 0.23-1.69).
Interrater Reliability
Interrater reliability for variables chosen a priori was k = 1.0 for self-proning, k = 1.0 for intubation, k = 0.95 for discharge disposition, k = 0.94 for nasal cannula, and k = 0.74 for HFNC.
DISCUSSION
The rapid spread of SARS-CoV-2 led to early recommendations based on minimal data. As evidence emerged, hospitals were forced to adapt to protect patients and medical providers. As a healthcare system, we incorporated emerging evidence to rapidly implement a noninvasive respiratory treatment protocol. Aware of the methodological problems in evaluating the NCRP itself, we integrated best practices of quality improvement to examine multiple patient safety outcomes after NCRP implementation. We found the rate of intubation decreased with no significant increase in mortality, ICU transfers, RRT activations, or unexpected deaths after the implementation of the NCRP.
Although we were unable to measure all confounders and changes that co-occurred during the study period, initial vital signs, age, BMI, past medical history, and use of oxygen were similar between the pre- and postimplementation cohorts. Further, there were many constants worth noting. First, COVID-19 respiratory protocols were highly regulated to ensure patient safety and minimize COVID-19 transmission. Second, there were no new nonrespiratory treatments or medications during the study. Third, although the COVID-19 hospital census rose during the study, it never overwhelmed resources; there was no rationing of clinical care.
The nonsignificant increase in mortality in the postimplementation period was limited to patients with an established DNR/DNI prior to admission. Established DNR/DNI patients were largely from skilled nursing facilities that were disproportionally impacted in the postimplementation period through clustered outbreaks of COVID-19 in our region, which likely contributed to the increased mortality.13
Additionally, despite decreased MV rates in the postimplementation period, we did not find a concurrent decrease in mortality. We do not believe this is a failure of noninvasive treatments. Rather, the increased proportion of DNR/DNI patients, combined with increased nursing home outbreaks in the postimplementation period likely influenced mortality. The postimplementation decreases in ICU transfers and RRT activations supports this hypothesis.
Finally, it is worth nothing that, although the goal of decreasing intubations was to improve patient care and decrease mortality, a decrease in intubations alone, without a change in mortality, may be important because mechanical ventilation has been associated with increased morbidity, such as posttraumatic stress disorder.14
Taken together, the post–NCRP implementation period appears to have been safe for patients, compared to the preimplementation period’s protocol. Future research may help understand the impact of specific noninvasive interventions on COVID-19–related MV and mortality.
Limitations
Given the urgency of COVID-19 treatment, the NCRP was designed as a quality improvement initiative rather than a prospective trial. Issues of selection bias and confounding limit our ability to evaluate the effect of the NCRP itself. Additionally, unmeasured patient and provider factors may have influenced outcomes. For example, increased provider knowledge and experience treating COVID-19 may have improved outcomes over time, and unmeasured patient characteristics may have been different in the pre- and postimplementation groups. Finally, our study was limited to a single healthcare system, which may limit generalizability
That said, the objective of our study was to evaluate patient safety outcomes of the NCRP, an important first step while other hospital systems continue to confront increasing rates of COVID-19 and must decide on appropriate respiratory management. To that end, our enrollment captured 469 COVID-19 admissions across four diverse hospitals without obvious differences in initial measured covariates. Further, the strict protocolization of respiratory treatments, the evaluation of multiple safety outcomes, and the complete patient follow-up all support the conclusion that NCRP in the postimplementation period did not increase adverse patient outcomes. Further studies are needed to determine the efficacy of the NCRP protocol itself.
CONCLUSION
In our health system, patients with COVID-19 did not experience a significant increase in mortality, RRT activations, or ICU admissions despite decreased rates of MV after implementation of a respiratory protocol that encouraged early noninvasive management of COVID-19 respiratory distress.
ACKNOWLEDGEMENTS
The authors would like to acknowledge Elizabeth Coray, Joseph Lahey, Richard Gabor, Cheryl Greenstein, Sarah Badach, Marie Boutin, Adrienne Wurl, Anthony Kitchen, Michelle Holton, Matthew Shapiro, Eleanor Ragone, Nageshwar Jonnalagadda, Ryan Flynn, Raghuveer Rakasi, and Jasmine Paadam.
1. Brown CA 3rd, Mosier JM, Carlson JN, Gibbs MA. Pragmatic recommendations for intubating critically ill patients with suspected COVID-19. J Am Coll Emerg Physicians Open. 2020;1(2):80-84. https://doi.org/10.1002/emp2.12063
2. Arabi YM, Arifi AA, Balkhy HH, et al. Clinical course and outcomes of critically ill patients with middle east respiratory syndrome coronavirus infection. Ann Intern Med. 2014;160(6):389-397. https://doi.org/10.7326/m13-2486
3. Ziehr DR, Alladina J, Petri CR, et al. Respiratory pathophysiology of mechanically ventilated patients with COVID-19: a cohort study. Am J Respir Crit Care Med. 2020;201(12):1560-1564. https://doi.org/10.1164/rccm.202004-1163le
4. Richardson S, Hirsch JS, Narasimhan M, et al. Presenting characteristics, comorbidities, and outcomes among 5700 patients hospitalized with COVID-19 in the New York City area. JAMA. 2020;323(20):2052-2059. https://doi.org/10.1001/jama.2020.6775
5. Cummings MJ, Baldwin MR, Abrams D, et al. Epidemiology, clinical course, and outcomes of critically ill adults with COVID-19 in New York City: a prospective cohort study. Lancet. 2020;395(10239):1763-1770. https://doi.org/10.1016/s0140-6736(20)31189-2
6. Farfel JM, Franca SA, Sitta Mdo C, Filho WJ, Carvalho CR. Age, invasive ventilatory support and outcomes in elderly patients admitted to intensive care units. Age Ageing. 2009;38(5):515-520. https://doi.org/10.1093/ageing/afp119
7. Caputo ND, Strayer RJ, Levitan R. Early self-proning in awake, non-intubated patients in the emergency department: a single ED’s experience during the COVID-19 pandemic. Acad Emerg Med. 2020;27(5):375-378. https://doi.org/10.1111/acem.13994
8. Sun Q, Qiu H, Huang M, Yang Y. Lower mortality of COVID-19 by early recognition and intervention: experience from Jiangsu Province. Ann Intensive Care. 2020;10(1):33. https://doi.org/10.1186/s13613-020-00650-2
9. Wang K, Zhao W, Li J, Shu W, Duan J. The experience of high-flow nasal cannula in hospitalized patients with 2019 novel coronavirus-infected pneumonia in two hospitals of Chongqing, China. Ann Intensive Care. 2020;10(1):37. https://doi.org/10.1186/s13613-020-00653-z
10. Alhazzani W, Møller MH, Arabi YM, et al. Surviving Sepsis Campaign: guidelines on the management of critically ill adults with coronavirus disease 2019 (COVID-19). Intensive Care Med. 2020;46(5):854-887 https://doi.org/10.1007/s00134-020-06022-5
11. Ogrinc G, Davies L, Goodman D, Batalden P, Davidoff F, Stevens D. SQUIRE 2.0 (standards for quality improvement reporting excellence): revised publication guidelines from a detailed consensus process. BMJ Qual Saf. 2016;25(12):986-992. https://doi.org/10.1136/bmjqs-2015-004411
12. Westafer LM, Elia T, Medarametla V, Lagu T. A transdiciplinary COVID-19 early respiratory intervention protocol: an implementation story. J Hosp Med. 2020;15(6):372-374. https://doi.org/10.12788/jhm.3456
13. COVID-19 Response Reporting. Mass.gov. Accessed July 20, 2020. https://www.mass.gov/info-details/covid-19-response-reporting#covid-19-daily-dashboard-
14. Shaw RJ, Harvey JE, Bernard R, Gunary R, Tiley M, Steiner H. Comparison of short-term psychological outcomes of respiratory failure treated by either invasive or non-invasive ventilation. Psychosomatics. 2009;50(6):586-591. https://doi.org/10.1176/appi.psy.50.6.586
© 2020 Society of Hospital Medicine
Impact of MC Intervention on QIs
Decompensated cirrhosis (DC) is defined as cirrhosis with at least 1 of the following complications: ascites, hepatocellular carcinoma, bleeding from portal hypertension, or hepatic encephalopathy. Patients with DC have a median survival estimated at 2 years compared to the 12‐year median survival of compensated cirrhotics.[1] In an era where quality of hospital care is being measured, and where progress is being made in the management of several conditions including congestive heart failure and nosocomial infections, little attention has been paid to DC. The burden of chronic liver failure is clear in the United States, where DC leads to more than 150,000 annual admissions to the hospital and accounts for 40,000 deaths annually.[2]
This burden of disease spurred quality improvement efforts in 2010, when a team of experts identified a set of literature‐based parameters or quality indicators (QI) for patients with cirrhosis.[3] We have demonstrated that adherence to these indicators fell far short of desired targets.[4] A year before their publication, an overall compliance of <50% with these metrics was measured at a single medical center.
We sought to improve the quality of care for patients with DC through implementation of mandatory consultation (MC) with a gastroenterologist for all patients admitted with DC. We assessed whether MC was associated with better care and improved outcomes (hospitalization length of stay [LOS], 30‐day readmission, and inpatient mortality) when compared to usual care (UC).[4]
MATERIALS AND METHODS
Design, Setting, and Patients
We conducted a cohort study comparing adherence to QI and outcomes of patients admitted with DC after the institution of an MC to a historical cohort of patients managed with UC (ie, before MC, adherence to QI for this group has been reported elsewhere).[4] Both cohorts included all patients aged >18 years with DC admitted to Baystate Medical Center, a tertiary care medical center in western Massachusetts. The UC cohort was collected between January 1, 2009 and December 31, 2009, and the MC cohort was assembled between June 1, 2011 and June 30, 2012.
As previously reported,[4] patients were considered for inclusion in the historical cohort if their International Classification of DiseasesNinth Revision discharge code pertained to chronic liver disease (see Supporting Information, Appendix 1, in the online version of this article). This list was broad by design to identify all patients with decompensated cirrhosis. A gastroenterologist (R.G.) then manually extracted charts from electronic medical records (EMRs) using a set of predefined clinical criteria, the same in both cohorts, to identify the patients with DC: cirrhosis with concomitant ascites, hepatic encephalopathy, or gastrointestinal (GI) bleeding secondary to portal hypertension. Other types of decompensated states, such as hepatocellular carcinoma, were not included as their management was not detailed in the QI.[3]
We included patients with suspected or established cirrhosis who had ascites confirmed radiographically or by exam, noting shifting dullness or fluid wave. However, patients were excluded if they lacked sufficient peritoneal fluid for bedside or image‐guided paracentesis. Cirrhotic patients were defined as having hepatic encephalopathy if the patient had altered mental status not secondary to seizures, cerebrovascular accident, or alcohol withdrawal. Finally, gastrointestinal bleeding in cirrhotic patients was defined as any upper or lower bleeding prompting hospital admission, or identified in the medical record as clinically significant by the attending physician.
The same QIs were measured in both cohorts. From the QI set,[3] we selected the 16 QIs that would apply to the management of inpatients (see Supporting Information, Appendix 2, in the online version of this article). Indicators developed for outpatient settings were not included. A quality score was calculated for each admission, defined as the proportion of QIs met divided by the number of QIs for which the patient was eligible. For example, a patient with hepatic encephalopathy but without GI bleeding or ascites would have a score calculated as the number of QIs met for hepatic encephalopathy and documentation of transplant evaluation divided by 3 (2 QIs for hepatic encephalopathy and 1 QI for transplant evaluation). If the patient met both QIs for hepatic encephalopathy, but the consultant failed to address liver transplant eligibility, the score would be 2/3=0.666.
After the institution of the MC, all inpatients with DC were identified within 24 hours of admission by a gastroenterologist (R.G., D.D.), who manually reviewed on a daily basis all admissions from EMRs. An author (R.G.) would then contact the admitting team (hospitalist or resident) to make sure that a gastroenterology consult was called and would then obtain the QI by manual extraction from the EMRs.
Of the 16 gastroenterologists who work at the hospital, 12 of them belong to several private practice groups, whereas 4 are employed by the hospital. As part of the intervention, all gastroenterologists were made aware of the intervention 1 month before the starting date, were provided with a checklist of the QIs of interest, and were encouraged to work with the hospitalist attendings to achieve compliance with the QIs. We reminded the gastroenterologists of the ongoing study during routine division meetings and regularly sought feedback from the hospitalists
The MC consisted of a systematic consultation by a gastroenterologist: any identified patient with DC would generate a mandatory GI consultation and would be assigned to a specialist depending on the roster coverage for that day. A close monitoring of the process allowed us to confirm that all patients admitted with DC were seen by a gastroenterologist. Patients were followed until their discharge, death, or readmission to our institution during the study period.
Outcomes
The primary outcome was defined as the rate of adherence to the QIs and overall QI score expressed as a proportion as noted above. Secondary outcomes included in‐hospital mortality, LOS, and 30‐day readmission rate. These parameters were abstracted from the medical record.
Covariates
The hospital EMR (Cerner Corporation, North Kansas City, MO) was used to extract patient demographic parameters such as gender, race, language, and age at time of admission. Other admission‐level details were extracted from the EMR including Model for End‐Stage Liver Disease (MELD) scores, documented comorbidities (including substance abuse, psychiatric diagnosis, diabetes mellitus, renal failure, congestive heart failure, coronary artery disease, and cancer), underlying etiology for cirrhosis, and reason for admission.
The study was approved by Baystate Medical Center's institutional review board.
Statistical Analysis
Summary statistics for outcomes and covariates were calculated as means/standard deviations (SDs), medians/emnterquartile range, and proportions. Univariable statistics (unpaired t tests, 1‐way analysis of variance, Fisher exact test, Spearman correlation) were used to identify possible demographic (eg, age, race) and clinical (eg, admission complaint) predictors of quality score and with 30‐day outcomes. For each admission, a composite quality score, also known as an opportunity model score,[5, 6] was calculated as a fraction (ie, the number of QIs met divided by the total number of possible QIs indicated by the patient's presentation). This fraction was then multiplied by 100 so as to express the QI score as a percent. Possible scores, therefore, ranged from 0 to 100%.
Calculation of the 30‐day incidence proportion of readmission after the first admission was restricted to patients whose readmission occurred in this hospital, and occurring up to 30‐days before study closure (June 1, 2012). In‐hospital death was examined as a function of QI score during that admission. To derive an unbiased, risk‐adjusted estimate of the association between quality score and outcomes, multiple linear regression (opportunity model score [OMS], LOS) or multiple Poisson regression models (30‐day readmission, in‐hospital death) were built. These included a dummy variable for the study period, as well as any potential confounder that was associated at P0.10, with both study period and the outcome in univariable analyses. Robust standard errors were specified to account for multiple admissions within patients. Marginal means or proportions were then estimated with 95% confidence intervals derived using the delta method. All analyses were performed using Stata 12.1 for Windows (StataCorp, College Station, TX).
RESULTS
A total of 303 patients were observed in 695 hospitalizations;149 patients in 379 admissions were observed in the UC cohort, and 154 patients in 316 admissions were observed in the MC cohort. Baseline demographics of all study admissions appear in Table 1. Patients seen in the MC cohort were younger, more likely to speak English, and less likely to be male or have comorbid diabetes mellitus. Most admissions (n=217, 57.2%; 95% confidence interval: 52.3%‐62.3%) were not evaluated by a gastroenterologist in the UC cohort but all were in the MC cohort.
| UC, N=379, N (%) or Mean/SD | MC, N=316, N (%) or Mean/SD | P Value* | |
|---|---|---|---|
| |||
| Age, y | 55.3/12.1 | 53.3/13.6 | 0.05 |
| English speaking | 261 (68.9%) | 261 (82.6%) | <0.001 |
| Male | 251 (66.2%) | 163 (53.5%) | 0.001 |
| Race | <0.001 | ||
| White | 301 (79.4%) | 262 (82.9%) | |
| Black | 31 (8.2%) | 40 (12.7%) | |
| Asian | 16 (4.2%) | 0 (0.0%) | |
| Other | 31 (8.2%) | 14 (4.4%) | |
| Comorbidities | |||
| Substance | 75 (19.8%) | 58 (18.4%) | 0.70 |
| abuse | |||
| Psychiatric | 123 (32.5%) | 103 (32.9%) | 0.94 |
| Diabetes mellitus | 175 (45.4%) | 115 (36.5%) | 0.02 |
| Renal failure | 74 (19.3%) | 55 (17.4%) | 0.50 |
| CHF | 38 (10.0%) | 24 (7.6%) | 0.35 |
| CAD | 26 (6.9%) | 17 (5.4%) | 0.43 |
| Cancer | 48 (12.7%) | 40 (12.7%) | 1.00 |
| Admission MELD | 15.6/6.9 | 17.0/7.0 | 0.006 |
| Serum creatinine | 1.43/1.94 | 1.42/1.30 | 0.91 |
| Reason for admission | |||
| Hepatology/GI | 318 (83.9%) | 257 (81.3%) | 0.42 |
| Renal failure | 85 (22.4%) | 90 (28.5%) | 0.08 |
| Encephalopathy | 151 (39.3%) | 113 (34.9%) | 0.24 |
| GI bleed | 78 (20.5%) | 57 (18.0%) | 1.00 |
| Abdominal pain | 116 (30.7%) | 114 (36.2%) | 0.15 |
| Ascites | 246 (64.9%) | 185 (58.5%) | 0.10 |
Admission Characteristics
The baseline clinical measures of all study admissions appear in Table 1. The UC and MC cohorts had similar characteristics, with the majority of patients with DC admitted for a gastrointestinal/hepatology‐related reason specifically for the management of ascites and hepatic encephalopathy. The patients in the MC cohort had a statistically higher MELD score on admission, which was not clinically relevant.
Quality Measures
Adherence to individual quality indices is shown in Table 2.
| Condition (Denominator) | Quality Indicator (Numerator) | UC (n=379), Met/Indicated | MC (n=316), Met/Indicated | P Value | |
|---|---|---|---|---|---|
| |||||
| Admissions with ascites | |||||
| 1 | Admissions to the hospital because of ascites or encephalopathy. | Diagnostic paracentesis during admission. | 77/193, 39.9%, (32.9%, 46.9%) | 111/135, 82.2% (75.7%, 88.8%) | <0.001 |
| 2 | No fibrinolysis or disseminated intravascular coagulation before paracentesis INR <2.5, >100,000 platelets. | No fresh frozen plasma or platelet replacement given. | 36/37, 97.3% (91.8%, 103.0%) | 41/42, 97.6% (92.8%, 102.4%) | 1.00 |
| 3 | All admissions with diagnostic paracentesis (not limited to admissions for ascites or hepatic encephalopathy). | Cell count differential, total protein, albumin, and culture/sensitivity all performed. | 31/49, 63.3% (49.3%‐77.3%) | 46/72 63.9% (52.7%, 75.0%) | 1.00 |
| 4 | Admissions with known portal hypertension‐related ascites receiving a paracentesis. | Ascitic fluid cell count and differential performed. | 15/104, 14.4% (7.6%‐ 21.3%) | 47/62, 75.8% (63.2%, 88.4%) | <0.001 |
| 5 | Serum sodium 110 mEq/L. | Fluid restriction and discontinuation of diuretics. | NA | NA | NA |
| 6 | Polymorphonuclear count of 250/mm3 in ascites. | Empiric antibiotics, 6 hours of results. | 10/13, 76.9% (50.4%‐ 103.4%) | 16/20, 80.0% (60.8%, 99.2%) | 1.00 |
| 7 | Ascitic fluid, total protein 1.1 gm/dL, serum bilirubin 2.5 mg/dL. | Prophylactic antibiotics. | 4/12, 33.3% (2.0%‐ 64.6%) | 18/30, 60.0%, (41.4%, 78.6%) | 0.18 |
| 8 | Normal renal function. | Salt restriction and diuretics (spironolactone and loop diuretics). | 57/186, 30.6%, (24.0%‐ 37.3%) | 81/122, 66.4%, (57.9%, 74.9%) | <0.001 |
| Total ascites subscore, mean/SD | 30%/36% | 67%/34% | <0.001 | ||
| GI bleeding | |||||
| 9 | Admissions with GI bleeding: variceal and nonvariceal, hematemesis and melena. | Upper endoscopy 24 hours of presentation. | 60/78, 76.9% (67.4%, 86.4%) | 52/57, 91.2% (83.7%, 98.8%) | 0.04 |
| 10 | Esophageal varices (active, stigmata of recent bleeding, or no other causes to explain bleeding). | Endoscopic variceal ligation/sublerotherapy. | 40/46, 87.0% (76.8%‐97.1%) | 30/32, 93.8% (84.9%, 100.0%) | 0.46 |
| 11 | Admissions with established/suspected upper GI bleeding. | Antibiotics within 24 hours of admission. | 27/69, 39.1% (27.3%‐ 50.9%) | 26/58, 44.8% (31.6%, 58.0%) | 0.59 |
| 12 | Admissions with established/suspected variceal bleeding. | Somatostatin/octreotide given within 12 hours of presentation. | 53/69, 76.8%, (66.6%‐ 87.0%) | 49/58, 84.5% (73.8%, 95.2%) | 0.37 |
| 13 | Recurrent bleeding within 72 hours of initial endoscopic hemostasis. | Repeat endoscopy or transjugular intrahepatic portosystemic shunt. | 5/5 100% | 2/3, 66.7% (76.8%, 210.0%) | 0.38 |
| Total GI subscore, mean/SD | 61%/38% | 74%/28% | 0.04 | ||
| Liver transplantation | |||||
| 14 | Admissions with MELD 15 or MELD 15 and decompensated status (ie, all admissions in our study). | Documented evaluation for liver transplantation. | 112/379, 29.6% (24.9%‐ 34.2%) | 231/316, 73.6% (68.7%, 78.5%) | <0.001 |
| Hepatic encephalopathy | |||||
| 15 | Admissions with hepatic encephalopathy. | Search for reversible factors documented. | 81/151, 53.6% (45.6%‐ 61.7 %) | 97/113, 85.8% (79.4%, 92.3%) | <0.001 |
| 16 | Admissions with hepatic encephalopathy. | Oral disaccharides/ rifaximin. | 144/151, 95.3% (91.9 %‐ 98.7 %) | 107/113, 94.7% (90.7%. 98.69%) | 1.00 |
| Total encephalopathy subscore, mean/SD | 75%/28% | 90%/24% | <0.001 | ||
Ascites
The management of ascites yielded 3 main differences between the 2 cohorts. Following the implementation of the MC, 82.2 % (111/135) of ascites‐related admissions led to a diagnostic paracentesis as compared to 39.9% (77/193) in the UC group (P<0.001).
In the MC cohort, 75.8% (47/62) of admissions with known portal hypertensionrelated ascites who received a paracentesis had an ascites cell count checked. In contrast, only 14.4% (15/104) in the UC group receiving paracentesis had a fluid cell count (P<0.001). The management of ascites in patients with normal renal function was optimal, with sodium restriction and diuretics combination in 66.4% (81/122) of the MC cohort, whereas this parameter in the UC cohort was only 30.6% (57/186) (P<0.001). There were no significant differences between the groups for the other QIs.
Variceal Bleeding
The MC group had a higher frequency of endoscopy within 24 hours of admissions than the UC group (91.2% [52/57] vs 76.9% [60/78], respectively; P<0.04). The rest had endoscopy later in the admission. Among admissions with bleeding from varices, banding was done 93.8% of the time for patients in the MC group (30/32), which was not statistically different than 87.0% (40/46) for patients seen in the UC group. In the remaining admissions, endoscopy only revealed nonbleeding large esophageal varices, and the endoscopist opted not to proceed with therapy. There were no statistically significant differences in the rest of the management.
Hepatic Encephalopathy
For hepatic encephalopathy, an empirical treatment was given to 95.3 % (144/151) patients in the UC group and 94.7% (107/113) of the patients in the MC group. We found better documentation of a search for underlying etiologies leading to hepatic encephalopathy in the MC cohort 85.8% (97/113) versus the UC cohort, which was only 53.6% (81/151) (P<0.001).
Evaluation for Liver Transplantation
Better documentation of evaluation for liver transplantation was seen in the MC group 73.6% (231/316) in comparison to the UC group 29.4% (111/379) (P<0.001).
Opportunity Score and Clinical Outcomes
As detailed above, care provided during the MC achieved a higher compliance with the QI shown with the QI score or OMS (Table 3). These improvements were not associated with statistically significant differences in in‐hospital death, LOS, or 30‐day readmission. To explore this further we also examined the direct association between the OMS and outcomes in the MC group by dividing patients into 2 groups: patients whose OMS was 80% and those whose OMS was <80% (see Supporting Information, Appendix 4, in the online version of this article). Although there were trends toward decreased in‐hospital death (6.4% vs 8.6%, P=0.26), increased 30‐day readmission (33.8% vs 23.0%, P=0.27), and decreased LOS (6.2 days vs 6.6 days, P=0.77), none of these differences achieved statistical significance.
| Unadjusted | Adjusted* | |||||
|---|---|---|---|---|---|---|
| UC | MC | Difference | UC | MC | Difference | |
| ||||||
| Opportunity model score | 0.46 | 0.77 | +0.31 (0.24, 0.39) | 0.46 | 0.77 | +0.30(0.23, 0.37) |
| In‐hospital death | 7.1% | 8.5% | +1.4 (0.3, +5.6) | 7.5% | 7.9% | +0.4% (4.0%, +4.5%) |
| Readmission within 30 days | 39.6% | 32.6% | 7.0% (16.4%, +2.5%) | 40.0% | 31.8% | 8.2%(18.0%, +1.5%) |
| Length of stay | 6.1d | 6.2d | +0.1d (1.0 d, +1.2 d) | 6.1d | 6.2d | +0.1d (1.0 d, +1.2d) |
Mandatory Consultation Subgroups: Employed Versus Private Physicians
The type of employment of the gastroenterologist on consultation (employed by the hospital vs private practice) affected the management of the patients admitted with DC (see Supporting Information, Appendix 3, in the online version of this article). Patients seen by a hospital‐employed gastroenterologist were more likely to have a better documentation in regard to evaluation for liver transplantation and better management of ascites. Except for the prescription of antibiotics in patients presenting with GI bleeding, which were more often given by the employed physician (63% vs 23%, P=0.004), the management of hepatic encephalopathy and GI bleeding was similar between employed and private‐practice physicians.
DISCUSSION
In this evaluation of an MC intervention for patients with DC cared for at a large tertiary academic medical center, we found that the implementation of a routine consultation by a gastroenterologist led to greater adherence to recommended care processes when compared to UC. Overall, the management of ascites and the documentation of evaluation for liver transplantation were statistically superior in the intervention (MC) group. UC and MC were similar with respect to treatment of variceal bleeding and hepatic encephalopathy. Although we did not demonstrate changes in mortality, readmission, or LOS as a result of the MC intervention, our study was underpowered to detect clinically meaningful effects.
The gaps in care of patients with cirrhosis were reported before and after the publication of the formal QIs.[7, 8, 9, 10] These gaps remain relevant in the face of an increasing prevalence of DC along with a recent publication suggesting an underestimation of the burden of liver disease in the United States.[11] Ours is the first study to evaluate the impact on inpatients with DC of a liver service with a systematic, mandatory, specialist consultation. A previous study[12] had shown that a GI consultation would improve the care of patients with DC, but excluded patients with variceal bleeding, did not specifically measure the compliance with QIs, and more important, the GI consult was not mandatory.
Our study has several limitations that must be considered while weighing its findings. The patients were not randomly assigned but followed a pre‐established distribution depending on the call schedule. Some of the improvement we noted might be the result of secular trends; however, this remains unlikely given the lack of national initiatives or pay for performance programs. In the UC cohort, patients who were nonEnglish‐speaking were associated with a lower QI score, which could account for part of the improvement seen in the MC group that has a more prominent English‐speaking cohort. Readmissions could have occurred at other hospitals, and patients were not monitored in an outpatient setting. We did not observe a change in the secondary outcomes (30‐day readmission, LOS, in‐hospital death); however, our study was underpowered for that purpose. Given the complexity of the billing process we did not collect the costs of the MC, which is another limitation of our work. Future studies are needed to determine the cost‐effectiveness of the intervention.
This study shows that a dedicated team of physicians focused on compliance with QIs can achieve a rapid improvement, over a year, in providing higher‐quality care. This may be relevant at other institutions. The strength of our study is that our large tertiary academic medical center serves a large catchment area, with a mix of patients from both rural and urban communities. It is located in Massachusetts, where most of the population has had access to healthcare since 2006. Therefore, although this is a single‐center study, we expect our findings to be more generalizable and less subject to selection bias than other single‐center studies.
Importantly, the compliance with QIs was often far from being perfect in the MC group and was different across type of employment of providers, reflecting the challenges in changing practice among physicians.[13] In fact the QI scores of the private practice group did not change, and mirror the compliance observed at our institution in the previous study, before the implementation of the MC.[4] The difference in performance according to the type of employment of providers stems from 2 factors. First, a better documentation of the need of formal evaluation for liver transplantation by the employed gastroenterologists resulted in better compliance with this QI. Second, and more important, among the employed physicians, there was a readiness to assist the hospitalist with diagnostic/therapeutic paracentesis without relying on, for example, an interventional radiologist. This is reflected by the higher score in the management of ascites. Although our study was not designed to answer this directly, employed physicians may have been more engaged in the project and showed a greater willingness to change practice. In the future, linking reimbursement to quality of care will lead to improved accountability of consultants.
In this study we show that a direct involvement of a gastroenterologist improves the care of inpatients as measured by QIs. We theorize that a better coordination of the transition to outpatient care involving the specialist should lead to better outcomes, specifically a reduction in the 22% observed readmission rate within 30 days of patients with DC.[14, 15] As we move forward, a broader definition of outcomes should be addressed, taking into account patient‐related outcomes and preferences.[16] Future studies should define the relationship between the gastroenterologist and the hospitalist service, the role of physician assistants and nurse practitioners in implementing and monitoring compliance with QIs, and define how physicians and patients can be made accountable in the transition to the outpatient setting.
Disclosures
R.G.: Conception, data collection and interpretation, manuscript. J.F.: Data management, data analysis, manuscript. P.V.: Conception, data analysis, manuscript. P.L.: Conception, data interpretation, manuscript. T.L.: Dr. Lagu is supported by the National Heart, Lung, and Blood Institute of the National Institutes of Health under award number K01HL114745. Conception, data interpretation, manuscript. D.D.: Conception, data collection and interpretation, manuscript. A.B.: Data collection. J.S.: Data collection. Source of funding: internal. The authors report no conflicts of interest.
- , , . Natural history and prognostic indicators of survival in cirrhosis: a systematic review of 118 studies. J Hepatol. 2006;44:217–231.
- , , , . Efficacy of a chronic disease management model for patients with chronic liver failure. Clin Gastroenterol Hepatol. 2013;11:850–858.
- , , , et al. An Explicit Quality Indicator Set for Measurement of Quality of Care in Patients with Cirrhosis. Clin Gastroenterol Hepatol. 2010;8:709–717.
- , , , , , Desilets D. Measurement of the quality of care of patients admitted with decompensated cirrhosis. Liver Int. 2014:34:204–210.
- , . All‐or‐none measurement raises the bar on performance. JAMA. 2006;295:1168–1170.
- Joint Commission on Accreditation of Healthcare Organizations. Quality report user guide. Available at: http://www.jointcommission.org. Accessed May 30, 2011.
- , , , et al. Management of patients with cirrhosis in Southern California: results of a practitioner survey. J Clin Gastroenterol. 2006;40:156–161.
- , , , et al. Spanish Collaborative Study Group on Therapeutic Management In Liver Disease. Multicenter hospital study on prescribing patterns for prophylaxis and treatment of complications of cirrhosis. Eur J Clin Pharmacol. 2002;58:435–440.
- , , , et al. The quality of care provided to patients with cirrhosis and ascites in the Department of Veterans Affairs. Gastroenterology. 2012 143(1):70–77.
- , , , et al. Improved patient survival after acute variceal bleeding: a multicenter, cohort study. Am J Gastroenterol. 2003;98:653–659.
- , , , , . Underestimation of liver‐related mortality in the United States. Gastroenterology. 2013;145:375–382.
- , , , et al. Impact of gastroenterology consultation on the outcomes of patients admitted to the hospital with decompensated cirrhosis. Hepatology. 2001;34:1089–1095.
- , , , et al. Why don't physicians follow clinical practice guidelines? A framework for improvement. JAMA. 1999;282:1458–1465.
- , , , et al. Incidence and predictors of 30‐day readmission among patients hospitalized with advanced liver disease. Clin Gastroenterol Hepatol. 2011;9:254–259.
- , , , et al. Hospital Readmissions among patients with decompensated cirrhosis. Am J Gastroenterol. 2012;107:247–252.
- . Patient‐reported outcomes of cirrhosis. Clin Gastroenterol Hepatol. 2013;11:1043–1045.
Decompensated cirrhosis (DC) is defined as cirrhosis with at least 1 of the following complications: ascites, hepatocellular carcinoma, bleeding from portal hypertension, or hepatic encephalopathy. Patients with DC have a median survival estimated at 2 years compared to the 12‐year median survival of compensated cirrhotics.[1] In an era where quality of hospital care is being measured, and where progress is being made in the management of several conditions including congestive heart failure and nosocomial infections, little attention has been paid to DC. The burden of chronic liver failure is clear in the United States, where DC leads to more than 150,000 annual admissions to the hospital and accounts for 40,000 deaths annually.[2]
This burden of disease spurred quality improvement efforts in 2010, when a team of experts identified a set of literature‐based parameters or quality indicators (QI) for patients with cirrhosis.[3] We have demonstrated that adherence to these indicators fell far short of desired targets.[4] A year before their publication, an overall compliance of <50% with these metrics was measured at a single medical center.
We sought to improve the quality of care for patients with DC through implementation of mandatory consultation (MC) with a gastroenterologist for all patients admitted with DC. We assessed whether MC was associated with better care and improved outcomes (hospitalization length of stay [LOS], 30‐day readmission, and inpatient mortality) when compared to usual care (UC).[4]
MATERIALS AND METHODS
Design, Setting, and Patients
We conducted a cohort study comparing adherence to QI and outcomes of patients admitted with DC after the institution of an MC to a historical cohort of patients managed with UC (ie, before MC, adherence to QI for this group has been reported elsewhere).[4] Both cohorts included all patients aged >18 years with DC admitted to Baystate Medical Center, a tertiary care medical center in western Massachusetts. The UC cohort was collected between January 1, 2009 and December 31, 2009, and the MC cohort was assembled between June 1, 2011 and June 30, 2012.
As previously reported,[4] patients were considered for inclusion in the historical cohort if their International Classification of DiseasesNinth Revision discharge code pertained to chronic liver disease (see Supporting Information, Appendix 1, in the online version of this article). This list was broad by design to identify all patients with decompensated cirrhosis. A gastroenterologist (R.G.) then manually extracted charts from electronic medical records (EMRs) using a set of predefined clinical criteria, the same in both cohorts, to identify the patients with DC: cirrhosis with concomitant ascites, hepatic encephalopathy, or gastrointestinal (GI) bleeding secondary to portal hypertension. Other types of decompensated states, such as hepatocellular carcinoma, were not included as their management was not detailed in the QI.[3]
We included patients with suspected or established cirrhosis who had ascites confirmed radiographically or by exam, noting shifting dullness or fluid wave. However, patients were excluded if they lacked sufficient peritoneal fluid for bedside or image‐guided paracentesis. Cirrhotic patients were defined as having hepatic encephalopathy if the patient had altered mental status not secondary to seizures, cerebrovascular accident, or alcohol withdrawal. Finally, gastrointestinal bleeding in cirrhotic patients was defined as any upper or lower bleeding prompting hospital admission, or identified in the medical record as clinically significant by the attending physician.
The same QIs were measured in both cohorts. From the QI set,[3] we selected the 16 QIs that would apply to the management of inpatients (see Supporting Information, Appendix 2, in the online version of this article). Indicators developed for outpatient settings were not included. A quality score was calculated for each admission, defined as the proportion of QIs met divided by the number of QIs for which the patient was eligible. For example, a patient with hepatic encephalopathy but without GI bleeding or ascites would have a score calculated as the number of QIs met for hepatic encephalopathy and documentation of transplant evaluation divided by 3 (2 QIs for hepatic encephalopathy and 1 QI for transplant evaluation). If the patient met both QIs for hepatic encephalopathy, but the consultant failed to address liver transplant eligibility, the score would be 2/3=0.666.
After the institution of the MC, all inpatients with DC were identified within 24 hours of admission by a gastroenterologist (R.G., D.D.), who manually reviewed on a daily basis all admissions from EMRs. An author (R.G.) would then contact the admitting team (hospitalist or resident) to make sure that a gastroenterology consult was called and would then obtain the QI by manual extraction from the EMRs.
Of the 16 gastroenterologists who work at the hospital, 12 of them belong to several private practice groups, whereas 4 are employed by the hospital. As part of the intervention, all gastroenterologists were made aware of the intervention 1 month before the starting date, were provided with a checklist of the QIs of interest, and were encouraged to work with the hospitalist attendings to achieve compliance with the QIs. We reminded the gastroenterologists of the ongoing study during routine division meetings and regularly sought feedback from the hospitalists
The MC consisted of a systematic consultation by a gastroenterologist: any identified patient with DC would generate a mandatory GI consultation and would be assigned to a specialist depending on the roster coverage for that day. A close monitoring of the process allowed us to confirm that all patients admitted with DC were seen by a gastroenterologist. Patients were followed until their discharge, death, or readmission to our institution during the study period.
Outcomes
The primary outcome was defined as the rate of adherence to the QIs and overall QI score expressed as a proportion as noted above. Secondary outcomes included in‐hospital mortality, LOS, and 30‐day readmission rate. These parameters were abstracted from the medical record.
Covariates
The hospital EMR (Cerner Corporation, North Kansas City, MO) was used to extract patient demographic parameters such as gender, race, language, and age at time of admission. Other admission‐level details were extracted from the EMR including Model for End‐Stage Liver Disease (MELD) scores, documented comorbidities (including substance abuse, psychiatric diagnosis, diabetes mellitus, renal failure, congestive heart failure, coronary artery disease, and cancer), underlying etiology for cirrhosis, and reason for admission.
The study was approved by Baystate Medical Center's institutional review board.
Statistical Analysis
Summary statistics for outcomes and covariates were calculated as means/standard deviations (SDs), medians/emnterquartile range, and proportions. Univariable statistics (unpaired t tests, 1‐way analysis of variance, Fisher exact test, Spearman correlation) were used to identify possible demographic (eg, age, race) and clinical (eg, admission complaint) predictors of quality score and with 30‐day outcomes. For each admission, a composite quality score, also known as an opportunity model score,[5, 6] was calculated as a fraction (ie, the number of QIs met divided by the total number of possible QIs indicated by the patient's presentation). This fraction was then multiplied by 100 so as to express the QI score as a percent. Possible scores, therefore, ranged from 0 to 100%.
Calculation of the 30‐day incidence proportion of readmission after the first admission was restricted to patients whose readmission occurred in this hospital, and occurring up to 30‐days before study closure (June 1, 2012). In‐hospital death was examined as a function of QI score during that admission. To derive an unbiased, risk‐adjusted estimate of the association between quality score and outcomes, multiple linear regression (opportunity model score [OMS], LOS) or multiple Poisson regression models (30‐day readmission, in‐hospital death) were built. These included a dummy variable for the study period, as well as any potential confounder that was associated at P0.10, with both study period and the outcome in univariable analyses. Robust standard errors were specified to account for multiple admissions within patients. Marginal means or proportions were then estimated with 95% confidence intervals derived using the delta method. All analyses were performed using Stata 12.1 for Windows (StataCorp, College Station, TX).
RESULTS
A total of 303 patients were observed in 695 hospitalizations;149 patients in 379 admissions were observed in the UC cohort, and 154 patients in 316 admissions were observed in the MC cohort. Baseline demographics of all study admissions appear in Table 1. Patients seen in the MC cohort were younger, more likely to speak English, and less likely to be male or have comorbid diabetes mellitus. Most admissions (n=217, 57.2%; 95% confidence interval: 52.3%‐62.3%) were not evaluated by a gastroenterologist in the UC cohort but all were in the MC cohort.
| UC, N=379, N (%) or Mean/SD | MC, N=316, N (%) or Mean/SD | P Value* | |
|---|---|---|---|
| |||
| Age, y | 55.3/12.1 | 53.3/13.6 | 0.05 |
| English speaking | 261 (68.9%) | 261 (82.6%) | <0.001 |
| Male | 251 (66.2%) | 163 (53.5%) | 0.001 |
| Race | <0.001 | ||
| White | 301 (79.4%) | 262 (82.9%) | |
| Black | 31 (8.2%) | 40 (12.7%) | |
| Asian | 16 (4.2%) | 0 (0.0%) | |
| Other | 31 (8.2%) | 14 (4.4%) | |
| Comorbidities | |||
| Substance | 75 (19.8%) | 58 (18.4%) | 0.70 |
| abuse | |||
| Psychiatric | 123 (32.5%) | 103 (32.9%) | 0.94 |
| Diabetes mellitus | 175 (45.4%) | 115 (36.5%) | 0.02 |
| Renal failure | 74 (19.3%) | 55 (17.4%) | 0.50 |
| CHF | 38 (10.0%) | 24 (7.6%) | 0.35 |
| CAD | 26 (6.9%) | 17 (5.4%) | 0.43 |
| Cancer | 48 (12.7%) | 40 (12.7%) | 1.00 |
| Admission MELD | 15.6/6.9 | 17.0/7.0 | 0.006 |
| Serum creatinine | 1.43/1.94 | 1.42/1.30 | 0.91 |
| Reason for admission | |||
| Hepatology/GI | 318 (83.9%) | 257 (81.3%) | 0.42 |
| Renal failure | 85 (22.4%) | 90 (28.5%) | 0.08 |
| Encephalopathy | 151 (39.3%) | 113 (34.9%) | 0.24 |
| GI bleed | 78 (20.5%) | 57 (18.0%) | 1.00 |
| Abdominal pain | 116 (30.7%) | 114 (36.2%) | 0.15 |
| Ascites | 246 (64.9%) | 185 (58.5%) | 0.10 |
Admission Characteristics
The baseline clinical measures of all study admissions appear in Table 1. The UC and MC cohorts had similar characteristics, with the majority of patients with DC admitted for a gastrointestinal/hepatology‐related reason specifically for the management of ascites and hepatic encephalopathy. The patients in the MC cohort had a statistically higher MELD score on admission, which was not clinically relevant.
Quality Measures
Adherence to individual quality indices is shown in Table 2.
| Condition (Denominator) | Quality Indicator (Numerator) | UC (n=379), Met/Indicated | MC (n=316), Met/Indicated | P Value | |
|---|---|---|---|---|---|
| |||||
| Admissions with ascites | |||||
| 1 | Admissions to the hospital because of ascites or encephalopathy. | Diagnostic paracentesis during admission. | 77/193, 39.9%, (32.9%, 46.9%) | 111/135, 82.2% (75.7%, 88.8%) | <0.001 |
| 2 | No fibrinolysis or disseminated intravascular coagulation before paracentesis INR <2.5, >100,000 platelets. | No fresh frozen plasma or platelet replacement given. | 36/37, 97.3% (91.8%, 103.0%) | 41/42, 97.6% (92.8%, 102.4%) | 1.00 |
| 3 | All admissions with diagnostic paracentesis (not limited to admissions for ascites or hepatic encephalopathy). | Cell count differential, total protein, albumin, and culture/sensitivity all performed. | 31/49, 63.3% (49.3%‐77.3%) | 46/72 63.9% (52.7%, 75.0%) | 1.00 |
| 4 | Admissions with known portal hypertension‐related ascites receiving a paracentesis. | Ascitic fluid cell count and differential performed. | 15/104, 14.4% (7.6%‐ 21.3%) | 47/62, 75.8% (63.2%, 88.4%) | <0.001 |
| 5 | Serum sodium 110 mEq/L. | Fluid restriction and discontinuation of diuretics. | NA | NA | NA |
| 6 | Polymorphonuclear count of 250/mm3 in ascites. | Empiric antibiotics, 6 hours of results. | 10/13, 76.9% (50.4%‐ 103.4%) | 16/20, 80.0% (60.8%, 99.2%) | 1.00 |
| 7 | Ascitic fluid, total protein 1.1 gm/dL, serum bilirubin 2.5 mg/dL. | Prophylactic antibiotics. | 4/12, 33.3% (2.0%‐ 64.6%) | 18/30, 60.0%, (41.4%, 78.6%) | 0.18 |
| 8 | Normal renal function. | Salt restriction and diuretics (spironolactone and loop diuretics). | 57/186, 30.6%, (24.0%‐ 37.3%) | 81/122, 66.4%, (57.9%, 74.9%) | <0.001 |
| Total ascites subscore, mean/SD | 30%/36% | 67%/34% | <0.001 | ||
| GI bleeding | |||||
| 9 | Admissions with GI bleeding: variceal and nonvariceal, hematemesis and melena. | Upper endoscopy 24 hours of presentation. | 60/78, 76.9% (67.4%, 86.4%) | 52/57, 91.2% (83.7%, 98.8%) | 0.04 |
| 10 | Esophageal varices (active, stigmata of recent bleeding, or no other causes to explain bleeding). | Endoscopic variceal ligation/sublerotherapy. | 40/46, 87.0% (76.8%‐97.1%) | 30/32, 93.8% (84.9%, 100.0%) | 0.46 |
| 11 | Admissions with established/suspected upper GI bleeding. | Antibiotics within 24 hours of admission. | 27/69, 39.1% (27.3%‐ 50.9%) | 26/58, 44.8% (31.6%, 58.0%) | 0.59 |
| 12 | Admissions with established/suspected variceal bleeding. | Somatostatin/octreotide given within 12 hours of presentation. | 53/69, 76.8%, (66.6%‐ 87.0%) | 49/58, 84.5% (73.8%, 95.2%) | 0.37 |
| 13 | Recurrent bleeding within 72 hours of initial endoscopic hemostasis. | Repeat endoscopy or transjugular intrahepatic portosystemic shunt. | 5/5 100% | 2/3, 66.7% (76.8%, 210.0%) | 0.38 |
| Total GI subscore, mean/SD | 61%/38% | 74%/28% | 0.04 | ||
| Liver transplantation | |||||
| 14 | Admissions with MELD 15 or MELD 15 and decompensated status (ie, all admissions in our study). | Documented evaluation for liver transplantation. | 112/379, 29.6% (24.9%‐ 34.2%) | 231/316, 73.6% (68.7%, 78.5%) | <0.001 |
| Hepatic encephalopathy | |||||
| 15 | Admissions with hepatic encephalopathy. | Search for reversible factors documented. | 81/151, 53.6% (45.6%‐ 61.7 %) | 97/113, 85.8% (79.4%, 92.3%) | <0.001 |
| 16 | Admissions with hepatic encephalopathy. | Oral disaccharides/ rifaximin. | 144/151, 95.3% (91.9 %‐ 98.7 %) | 107/113, 94.7% (90.7%. 98.69%) | 1.00 |
| Total encephalopathy subscore, mean/SD | 75%/28% | 90%/24% | <0.001 | ||
Ascites
The management of ascites yielded 3 main differences between the 2 cohorts. Following the implementation of the MC, 82.2 % (111/135) of ascites‐related admissions led to a diagnostic paracentesis as compared to 39.9% (77/193) in the UC group (P<0.001).
In the MC cohort, 75.8% (47/62) of admissions with known portal hypertensionrelated ascites who received a paracentesis had an ascites cell count checked. In contrast, only 14.4% (15/104) in the UC group receiving paracentesis had a fluid cell count (P<0.001). The management of ascites in patients with normal renal function was optimal, with sodium restriction and diuretics combination in 66.4% (81/122) of the MC cohort, whereas this parameter in the UC cohort was only 30.6% (57/186) (P<0.001). There were no significant differences between the groups for the other QIs.
Variceal Bleeding
The MC group had a higher frequency of endoscopy within 24 hours of admissions than the UC group (91.2% [52/57] vs 76.9% [60/78], respectively; P<0.04). The rest had endoscopy later in the admission. Among admissions with bleeding from varices, banding was done 93.8% of the time for patients in the MC group (30/32), which was not statistically different than 87.0% (40/46) for patients seen in the UC group. In the remaining admissions, endoscopy only revealed nonbleeding large esophageal varices, and the endoscopist opted not to proceed with therapy. There were no statistically significant differences in the rest of the management.
Hepatic Encephalopathy
For hepatic encephalopathy, an empirical treatment was given to 95.3 % (144/151) patients in the UC group and 94.7% (107/113) of the patients in the MC group. We found better documentation of a search for underlying etiologies leading to hepatic encephalopathy in the MC cohort 85.8% (97/113) versus the UC cohort, which was only 53.6% (81/151) (P<0.001).
Evaluation for Liver Transplantation
Better documentation of evaluation for liver transplantation was seen in the MC group 73.6% (231/316) in comparison to the UC group 29.4% (111/379) (P<0.001).
Opportunity Score and Clinical Outcomes
As detailed above, care provided during the MC achieved a higher compliance with the QI shown with the QI score or OMS (Table 3). These improvements were not associated with statistically significant differences in in‐hospital death, LOS, or 30‐day readmission. To explore this further we also examined the direct association between the OMS and outcomes in the MC group by dividing patients into 2 groups: patients whose OMS was 80% and those whose OMS was <80% (see Supporting Information, Appendix 4, in the online version of this article). Although there were trends toward decreased in‐hospital death (6.4% vs 8.6%, P=0.26), increased 30‐day readmission (33.8% vs 23.0%, P=0.27), and decreased LOS (6.2 days vs 6.6 days, P=0.77), none of these differences achieved statistical significance.
| Unadjusted | Adjusted* | |||||
|---|---|---|---|---|---|---|
| UC | MC | Difference | UC | MC | Difference | |
| ||||||
| Opportunity model score | 0.46 | 0.77 | +0.31 (0.24, 0.39) | 0.46 | 0.77 | +0.30(0.23, 0.37) |
| In‐hospital death | 7.1% | 8.5% | +1.4 (0.3, +5.6) | 7.5% | 7.9% | +0.4% (4.0%, +4.5%) |
| Readmission within 30 days | 39.6% | 32.6% | 7.0% (16.4%, +2.5%) | 40.0% | 31.8% | 8.2%(18.0%, +1.5%) |
| Length of stay | 6.1d | 6.2d | +0.1d (1.0 d, +1.2 d) | 6.1d | 6.2d | +0.1d (1.0 d, +1.2d) |
Mandatory Consultation Subgroups: Employed Versus Private Physicians
The type of employment of the gastroenterologist on consultation (employed by the hospital vs private practice) affected the management of the patients admitted with DC (see Supporting Information, Appendix 3, in the online version of this article). Patients seen by a hospital‐employed gastroenterologist were more likely to have a better documentation in regard to evaluation for liver transplantation and better management of ascites. Except for the prescription of antibiotics in patients presenting with GI bleeding, which were more often given by the employed physician (63% vs 23%, P=0.004), the management of hepatic encephalopathy and GI bleeding was similar between employed and private‐practice physicians.
DISCUSSION
In this evaluation of an MC intervention for patients with DC cared for at a large tertiary academic medical center, we found that the implementation of a routine consultation by a gastroenterologist led to greater adherence to recommended care processes when compared to UC. Overall, the management of ascites and the documentation of evaluation for liver transplantation were statistically superior in the intervention (MC) group. UC and MC were similar with respect to treatment of variceal bleeding and hepatic encephalopathy. Although we did not demonstrate changes in mortality, readmission, or LOS as a result of the MC intervention, our study was underpowered to detect clinically meaningful effects.
The gaps in care of patients with cirrhosis were reported before and after the publication of the formal QIs.[7, 8, 9, 10] These gaps remain relevant in the face of an increasing prevalence of DC along with a recent publication suggesting an underestimation of the burden of liver disease in the United States.[11] Ours is the first study to evaluate the impact on inpatients with DC of a liver service with a systematic, mandatory, specialist consultation. A previous study[12] had shown that a GI consultation would improve the care of patients with DC, but excluded patients with variceal bleeding, did not specifically measure the compliance with QIs, and more important, the GI consult was not mandatory.
Our study has several limitations that must be considered while weighing its findings. The patients were not randomly assigned but followed a pre‐established distribution depending on the call schedule. Some of the improvement we noted might be the result of secular trends; however, this remains unlikely given the lack of national initiatives or pay for performance programs. In the UC cohort, patients who were nonEnglish‐speaking were associated with a lower QI score, which could account for part of the improvement seen in the MC group that has a more prominent English‐speaking cohort. Readmissions could have occurred at other hospitals, and patients were not monitored in an outpatient setting. We did not observe a change in the secondary outcomes (30‐day readmission, LOS, in‐hospital death); however, our study was underpowered for that purpose. Given the complexity of the billing process we did not collect the costs of the MC, which is another limitation of our work. Future studies are needed to determine the cost‐effectiveness of the intervention.
This study shows that a dedicated team of physicians focused on compliance with QIs can achieve a rapid improvement, over a year, in providing higher‐quality care. This may be relevant at other institutions. The strength of our study is that our large tertiary academic medical center serves a large catchment area, with a mix of patients from both rural and urban communities. It is located in Massachusetts, where most of the population has had access to healthcare since 2006. Therefore, although this is a single‐center study, we expect our findings to be more generalizable and less subject to selection bias than other single‐center studies.
Importantly, the compliance with QIs was often far from being perfect in the MC group and was different across type of employment of providers, reflecting the challenges in changing practice among physicians.[13] In fact the QI scores of the private practice group did not change, and mirror the compliance observed at our institution in the previous study, before the implementation of the MC.[4] The difference in performance according to the type of employment of providers stems from 2 factors. First, a better documentation of the need of formal evaluation for liver transplantation by the employed gastroenterologists resulted in better compliance with this QI. Second, and more important, among the employed physicians, there was a readiness to assist the hospitalist with diagnostic/therapeutic paracentesis without relying on, for example, an interventional radiologist. This is reflected by the higher score in the management of ascites. Although our study was not designed to answer this directly, employed physicians may have been more engaged in the project and showed a greater willingness to change practice. In the future, linking reimbursement to quality of care will lead to improved accountability of consultants.
In this study we show that a direct involvement of a gastroenterologist improves the care of inpatients as measured by QIs. We theorize that a better coordination of the transition to outpatient care involving the specialist should lead to better outcomes, specifically a reduction in the 22% observed readmission rate within 30 days of patients with DC.[14, 15] As we move forward, a broader definition of outcomes should be addressed, taking into account patient‐related outcomes and preferences.[16] Future studies should define the relationship between the gastroenterologist and the hospitalist service, the role of physician assistants and nurse practitioners in implementing and monitoring compliance with QIs, and define how physicians and patients can be made accountable in the transition to the outpatient setting.
Disclosures
R.G.: Conception, data collection and interpretation, manuscript. J.F.: Data management, data analysis, manuscript. P.V.: Conception, data analysis, manuscript. P.L.: Conception, data interpretation, manuscript. T.L.: Dr. Lagu is supported by the National Heart, Lung, and Blood Institute of the National Institutes of Health under award number K01HL114745. Conception, data interpretation, manuscript. D.D.: Conception, data collection and interpretation, manuscript. A.B.: Data collection. J.S.: Data collection. Source of funding: internal. The authors report no conflicts of interest.
- , , . Natural history and prognostic indicators of survival in cirrhosis: a systematic review of 118 studies. J Hepatol. 2006;44:217–231.
- , , , . Efficacy of a chronic disease management model for patients with chronic liver failure. Clin Gastroenterol Hepatol. 2013;11:850–858.
- , , , et al. An Explicit Quality Indicator Set for Measurement of Quality of Care in Patients with Cirrhosis. Clin Gastroenterol Hepatol. 2010;8:709–717.
- , , , , , Desilets D. Measurement of the quality of care of patients admitted with decompensated cirrhosis. Liver Int. 2014:34:204–210.
- , . All‐or‐none measurement raises the bar on performance. JAMA. 2006;295:1168–1170.
- Joint Commission on Accreditation of Healthcare Organizations. Quality report user guide. Available at: http://www.jointcommission.org. Accessed May 30, 2011.
- , , , et al. Management of patients with cirrhosis in Southern California: results of a practitioner survey. J Clin Gastroenterol. 2006;40:156–161.
- , , , et al. Spanish Collaborative Study Group on Therapeutic Management In Liver Disease. Multicenter hospital study on prescribing patterns for prophylaxis and treatment of complications of cirrhosis. Eur J Clin Pharmacol. 2002;58:435–440.
- , , , et al. The quality of care provided to patients with cirrhosis and ascites in the Department of Veterans Affairs. Gastroenterology. 2012 143(1):70–77.
- , , , et al. Improved patient survival after acute variceal bleeding: a multicenter, cohort study. Am J Gastroenterol. 2003;98:653–659.
- , , , , . Underestimation of liver‐related mortality in the United States. Gastroenterology. 2013;145:375–382.
- , , , et al. Impact of gastroenterology consultation on the outcomes of patients admitted to the hospital with decompensated cirrhosis. Hepatology. 2001;34:1089–1095.
- , , , et al. Why don't physicians follow clinical practice guidelines? A framework for improvement. JAMA. 1999;282:1458–1465.
- , , , et al. Incidence and predictors of 30‐day readmission among patients hospitalized with advanced liver disease. Clin Gastroenterol Hepatol. 2011;9:254–259.
- , , , et al. Hospital Readmissions among patients with decompensated cirrhosis. Am J Gastroenterol. 2012;107:247–252.
- . Patient‐reported outcomes of cirrhosis. Clin Gastroenterol Hepatol. 2013;11:1043–1045.
© 2014 Society of Hospital Medicine
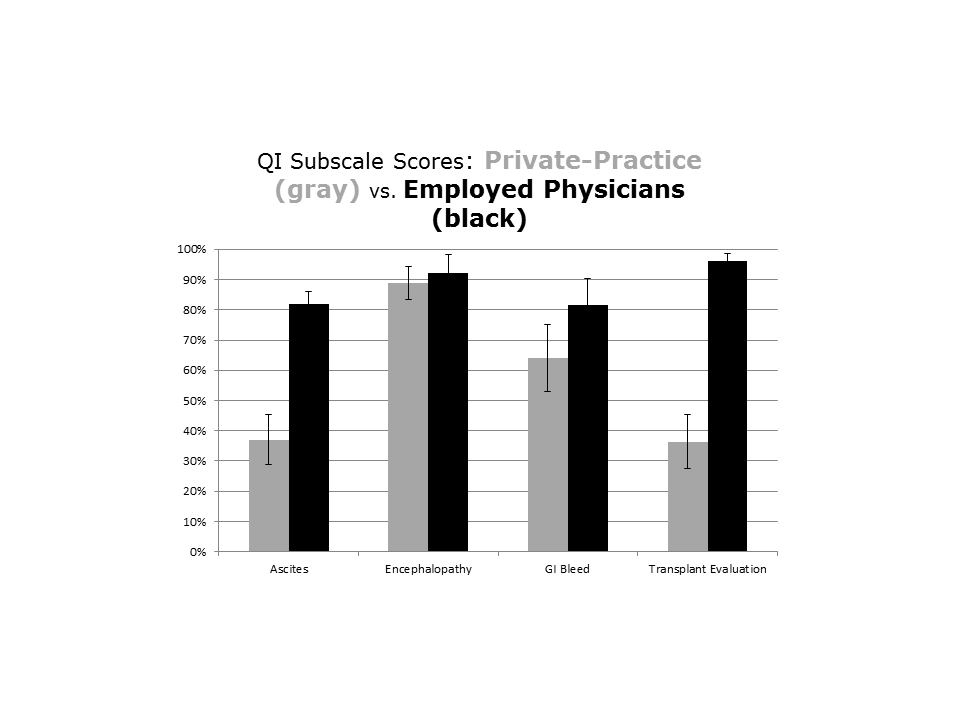
Patient Satisfaction with Hospital Care
Over the past decade, hospital medicine has been the nation's fastest‐growing medical specialty. According to the American Hospital Association's (AHA) 2009 survey, 58% of United States (US) hospitals now have hospital medicine programs, and for hospitals with 200 or more beds, this figure is 89%.1 In 2009, the AHA estimated that the number of US hospitalists would increase to over 34,000 by 2011, over double that of the 16,000 present in 2005.1 Studies demonstrate that, compared to a system where primary care physicians provide inpatient care, the hospitalist model improves efficiency while maintaining at least equal patient outcomes.211 However, scant data exist as to the effects of hospitalists on patient satisfaction.12 Understanding how care models affect patient experience is vital in the current environment of healthcare reform and performance reporting, especially in light of the Centers for Medicare and Medicaid Services' (CMS) efforts to link the patient experience to reimbursement through value‐based purchasing.13 Value‐based purchasing is a strategy to encourage and reward excellence in healthcare delivery through differential reimbursement based on defined performance measures. As one part of value‐based purchasing, hospital reimbursement will be linked to patient‐experience measures, including patient ratings of their doctor's ability to communicate with them and other questions assessing patient satisfaction with their hospital stay.14
In the outpatient setting, trust is the variable most strongly associated with patient satisfaction.1518 In contrast to PCPs, who may develop relationships with patients over years, hospitalists often first meet a patient in the hospital and must engender trust quickly. In addition, hospitalists work in shifts and may not be responsible for the same patients each day. Since continuity is positively related to trust,19, 20 there is reason to believe satisfaction with hospitalist care might be lower than satisfaction with care provided by PCPs. We report on 8295 patients and 6 years experience with hospitalist programs at 3 hospitals. Based on the known link between continuity and patient satisfaction, we hypothesized that patient satisfaction would be lower with hospitalists than with primary care internists.
METHODS
Setting
Our study was conducted at 3 Western Massachusetts hospitals affiliated with Baystate Health, an integrated healthcare delivery system. These included 2 small community hospitals (<100 beds) and a 653‐bed tertiary care, academic teaching hospital. Hospitalist services were established at the tertiary care center in 2001 and at the community hospitals in 2004 and 2005; the programs have evolved over time. In addition, the tertiary care center has 3 different hospitalist groups: an academic group that is employed by the hospital and works with house staff, a hospitalist service that is owned by the hospital and cares for patients from specific outpatient practices, and one that is privately owned caring for patients from another group of practices. The community hospitals each have a single, hospital‐owned service. Primary care physicians also provide inpatient care at all 3 institutions, although their number has decreased over time as the hospitalist programs have grown. All hospitalist services varied in the number of consecutive days in a rounding cycle (degree of continuity), and which services had an admitting team (single initial physician encounter with a different rounding physician) versus a single physician being both the admitting and rounding physician. Consequently, continuity, as measured by the number of different physicians caring for an individual patient during 1 hospitalization, would be expected to vary depending on the type of hospitalist service and the length of stay. Likewise, patients admitted by their primary care physician's office may have been cared for by either their PCP or a practice colleague. All hospitalists and PCPs care for inpatients having similar hospital experiences, as all aspects of a patient's care (including the medical wards, nursing staff, discharge planners, and information systems) are identical, regardless of physician designation. The study was approved by Baystate Health System's Institutional Review Board.
Data Collection
Since February 2001, Baystate Health, in conjunction with Professional Research Consultants, Inc (PRC), has conducted scripted postdischarge patient satisfaction telephone interviews of random discharged adult medicine patients, with Hospital Consumer Assessment of Healthcare Providers and Systems (HCAHPS) questions added in January 2007. Approximately 50 surveys per quarter, per hospital floor, were conducted. Trained PRC staff assessed up to 115 variables encompassing the inpatient experience. We limited our analysis to those domains that reflected satisfaction with physician care, including satisfaction with physician care quality, physician communication, physician behavior, and pain management. The survey responses were scored, depending on question type, with: never, sometimes, usually, always (HCAHPS); or excellent, very good, good, fair, poor (PRC). Each score was converted to a numeric equivalent, with the highest score (4 or 5, depending on scale used) being best and 1 being worst. The specific questions are included in Supporting Appendix A in the online version of this article.
Additional patient information for respondents was extracted from the hospitals' billing database, using medical record numbers, and included age, gender, admission year, education level, language, illness severity, emergency room (ER) admission status, institution, and attending physician type (academic hospitalist [AH], hospital‐owned hospitalist [HOH], private hospitalist [PH], or primary care physician [PCP]). It was not possible to distinguish whether PCP patients were cared for by their own PCP or a colleague from the same practice.
Statistical Analysis
Patient satisfaction data were derived from survey responses of adult inpatients cared for by hospitalists or PCPs between January 1, 2003 and March 31, 2009. The primary outcome was patient‐reported satisfaction with physician care quality measured on a 5‐point Likert scale. In a secondary analysis, physician groups were compared on the proportion of responses that were excellent (a score of 5 on the Likert scale) and the proportion that were poor (a score of 1). Other secondary outcomes included patient satisfaction ratings of physician behavior, pain management, and communication. Averages and percent ranking excellent and poor were calculated for each hospitalist group and for PCPs. Other outcomes analyzed included average patient satisfaction with physician care quality, both over time and stratified by the presence or absence of having an established PCP prior to admission.
In view of the large sample size, Likert‐scale responses were analyzed as continuous outcomes. For unadjusted comparisons among hospitalist groups, t tests and 1‐way ANOVAs were conducted for the scales scores, while chi‐square tests were used for dichotomous outcomes. For multivariable analyses, multiple linear regression was used for continuous outcomes. For dichotomous outcomes, adjusted prevalence ratios were estimated using Poisson regression with robust standard errors.21 All multivariable models controlled for sex, marital status, illness severity, age group, ethnicity, length of stay, and emergency room admission. Observations with missing data were excluded from analyses. Differences in bivariable and multivariable analyses were considered significant at a critical test level of 5%. Prevalence ratios are reported with 95% confidence intervals. All analyses were conducted in Stata, version 11 (StataCorp, College Station, TX).
RESULTS
Of patients who were reached by telephone, 87% agreed to participate in the hospital survey. However, most patients could not be reached by phone; thus our estimated response rate, including those who could not be reached, was 27%. For the subset of patients interviewed using the HCAHPS protocol, the response rate was 40%. Our final sample included 8295 patients (3597 cared for by 59 hospitalists and 4698 by 288 PCPs) interviewed between 2003 and 2009. Three‐quarters of the patients were from the tertiary care center, whereas 17% and 8% were from each of the community hospitals (see Supporting Appendix B in the online version of this article). Patient characteristics appear in Table 1. Patients cared for by hospitalists were similar to those cared for by PCPs in terms of age, sex, marital status, education, and language, but hospitalist patients were more likely to have been admitted through the emergency department (93% vs 84%, P < 0.001) and less likely to be white (83% vs 85%, P = 0.01). Patients cared for by hospitalists also had higher average illness severity score (2.2 0.8 vs 2.0 0.8, P < 0.001), longer average LOS (4.3 4.3 vs 4.0 3.6, P < 0.001), and lower mean perceived health score (2.8 1.2 vs 3.0 1.2, P = 0.01).
| Characteristic | PCP N = 4698 | Hospitalist N = 3597 | P Value |
|---|---|---|---|
| |||
| Age (mean, SD) | 63.5 (16.6) | 63.7 (16.3) | 0.53 |
| Male sex (%) | 44.9 | 46.2 | 0.28 |
| White race (%) | 85.3 | 83.2 | 0.01 |
| Married (%) | 49.1 | 48.7 | 0.69 |
| English spoken at home (%) | 96.0 | 97.0 | 0.09 |
| At least some college education (%) | 47.1 | 43.7 | 0.22 |
| Admitted through the emergency department (%) | 84.3 | 92.5 | <0.001 |
| Average illness severity rating (mean, SD) | 2.0 (0.8) | 2.2 (0.8) | <0.001 |
| Average perceived health score (mean, SD) | 3.0 (1.2) | 2.8 (1.2) | 0.01 |
| Average length of stay (days) (mean, SD) | 4.0 (3.6) | 4.3 (4.3) | <0.001 |
| Discharged home (%) | 87.9 | 88.5 | 0.73 |
Unadjusted patient reported satisfaction with physician care quality was slightly greater for PCPs than hospitalists (4.25 vs 4.19, P = 0.009). After multivariable adjustment, the difference was attenuated but persisted (4.24 vs 4.20, P = 0.04). We found no statistical difference among the hospitals or the specific hospitalist groups in terms of satisfaction with overall physician care quality (Figure 1). There were no statistical differences in patient satisfaction ratings of hospitalist and PCPs for the subdomains of behavior, pain, and communication (Table 2). There were also no differences in the proportion of patients cared for by hospitalists or PCPs who rated their physicians in the highest satisfaction category (79% vs 81%, P = 0.17) or the lowest (5% vs 5%, P = 0.19). Among patients cared for by academic hospitalists, there was no difference in satisfaction rating between those patients who had a designated primary care physician in the outpatient setting and those who did not (4.22 0.94 vs 4.19 0.94, P = 0.97). Finally, satisfaction with both hospitalists and PCPs showed equivalent rates of improvement over time (Figure 2).

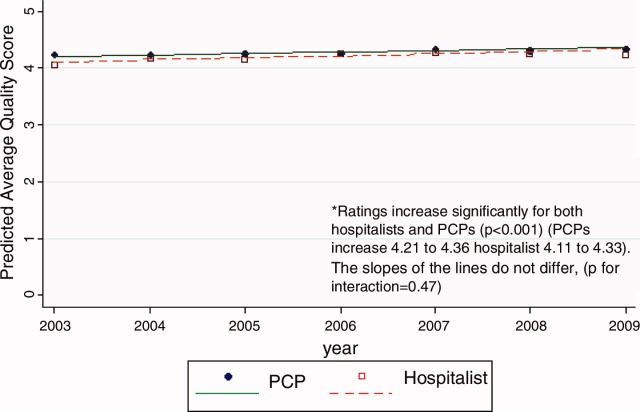
| PCP | Hospitalist | P Value | ||
|---|---|---|---|---|
| ||||
| Satisfaction | Overall, you would rate the quality of doctor care as:* | 4.24 [4.21, 4.27] | 4.20 [4.17, 4.23] | 0.04 |
| Behavior | Doctors treated you with courtesy/respect | 3.77 [3.73, 3.82] | 3.78 [3.73, 3.82] | 0.88 |
| Pain control | Pain management by hospital staff* | 4.11 [4.08, 4.14] | 4.09 [4.05, 4.12] | 0.35 |
| Pain well controlled | 3.55 [3.47, 3.63] | 3.48 [3.41, 3.55] | 0.23 | |
| Staff did everything to help with pain | 3.73 [3.66, 3.80] | 3.68 [3.62, 3.75] | 0.33 | |
| Communication skills | Doctors listened carefully to you | 3.66 [3.61, 3.72] | 3.67 [3.62, 3.72] | 0.83 |
| Doctors explained things in an understandable way | 3.60 [3.54, 3.66] | 3.61 [3.56, 3.67] | 0.73 | |
| Doctor's communication* | 4.02 [3.97, 4.07] | 3.98 [3.93, 4.03] | 0.27 | |
| Doctor discussed your anxiety/fears* | 4.00 [3.96, 4.03] | 3.97 [3.93, 4.01] | 0.26 | |
| Doctor involved you in decisions* | 4.00 [3.95, 4.06] | 3.98 [3.93, 4.03] | 0.49 | |
DISCUSSION
In this observational study of over 8200 patients cared for over 6 years by 347 physicians at 3 hospitals, we found that patient satisfaction with inpatient care provided by hospitalists and primary care doctors was almost identical. As we hypothesized, overall satisfaction with physician care quality, our primary outcome, was slightly greater with primary care doctors; however, the observed difference, 0.04 on a scale of 1 to 5, cannot be considered clinically significant. All patients were generally satisfied (4.2‐4.3 rating on 5‐point scale) with their inpatient care, and satisfaction scores increased over time. We also found no differences among the specific domains of satisfaction, including communication skills, pain control, and physician behavior. Finally, we found no significant difference in patient satisfaction with physician care quality among the different hospitalist services.
Previous studies of patient satisfaction conducted in the outpatient setting found that continuity of care was an important determinant of trust and, consequently, overall satisfaction.15, 16, 19, 20, 22 Because hospitalist models introduce discontinuity, they might be expected to undermine satisfaction. Surprisingly, few studies have addressed this issue. In a review of the hospitalist studies through 2002, Wachter and Goldman found 19 studies, 5 of which measured patient satisfaction.23 Three of these were conducted on teaching services and compared designated faculty hospitalists to traditional ward attendings, who rotated onto the inpatient services 1 to 2 months per year. Primary care doctors were excluded.2426 A fourth study provided a descriptive narrative of the development of the first hospitalist program in Minneapolis, Minnesota, and anecdotally noted no difference in patient satisfaction between the hospitalist and traditional model, but presented no data because the satisfaction surveys were not designed with publication in mind.27 The only study to actually assess whether patient satisfaction was greater with hospitalists or PCPs was an observational study by Davis et al., conducted in 1 rural hospital during the first year of its hospitalist program. In that study, 2 hospitalists were compared to 17 PCPs, and patient satisfaction surveys were available for approximately 44 patients managed by hospitalists and 168 patients managed by PCPs. Specific data were not reported, but it was noted that there was no statistical difference in satisfaction between those cared for by hospitalists versus PCPs.28 On the basis of these studies, Wachter and Goldman concluded that surveys of patients who were cared for by hospitalists show high levels of satisfaction, no lower than that of similar patients cared for by their own primary physicians.23 Wachter and Goldman's review has been highly cited, and we could find no subsequent studies addressing this issue. Our study provides the first real evidence to support this conclusion, including data from 59 hospitalists practicing in 5 separate hospitalist programs at 3 different hospitals.
Our finding that hospitalists maintain satisfaction despite a lack of continuity suggests that other aspects of care may be more important to patient satisfaction. Larson et al. found that physician ability to meet patient's information needs was positively associated with patient satisfaction.29 Similarly, Tarrant et al. found that patient's trust in a physician improved with increasing communication, interpersonal care, and knowledge of the patient. Interestingly, continuity, ie. the proportion of visits to the usual general practitioner (GP) or duration with the practice, did not correlate with trust.30 Finally, a systematic review of determinants of outpatient satisfaction found that continuity has a variable effect on satisfaction. Subjective continuity measures, such as whether patients saw their regular physician on the day they were surveyed, were consistently associated with patient satisfaction, however, quantitative measures including relationship duration were not.31
It is also possible that patients believe they value continuity more than they actually do. In 1 survey of inpatients with an established PCP yet cared for by a hospitalist, most agreed that patients receive better care and have more trust in physicians with whom they have long‐term relationships. Yet most also had positive opinions of their hospital care.32 Similarly, in a survey of over 2500 outpatients, 92% rated continuity as very important or important, but the majority was unwilling to expend substantial personal time (88%), defined as driving greater than 60 minutes, or money (82%), defined as spending an additional $20 to $40 a month, to maintain continuity with their PCP.33 Our study appears to confirm the lack of connection between continuity and satisfaction. Even those patients who valued continuity, as evidenced by having an established PCP, were as satisfied with hospitalist physician care as patients who had no established PCP.
Our study has several limitations. First, we report on outcomes of 3 institutions within a single healthcare system, within a limited geographic area. Although our sample included a wide range of patient demographics, hundreds of physicians, and multiple hospitalist models, it is possible that some hospitalist models may provide greater or lesser satisfaction than those we observed. Second, our study was observational, and thus subject to selection bias and confounding. Patients cared for by the hospitalists differed in a number of ways from those cared for by PCPs. We controlled for identifiable confounders such as illness severity, self‐perceived health, and admission through the emergency department, but the possibility exists that additional unidentified factors could have affected our results. It is possible other drivers of patient satisfaction, such as amenities, nursing, or food, could have influenced our findings. However, this is unlikely because all patient groups shared these components of hospital experience equally. Third, only a minority of patients could be reached for interview. This is typical for post‐hospitalization surveys, and our response rate of 40% for HCAHPS patients compared favorably to the 2010 HCAHPS national average of 33%.34 Still, the responses of those who could not be reached may have differed from those who were interviewed. Fourth, we identified hospitalists and PCPs by the attending of record, but we were unable to tell who provided care to the patient on any given day. Thus, we could not determine to what extent patients cared for by PCPs were actually seen by their own doctor, as opposed to an associated physician within the practice. Nevertheless, our results are representative of the care model provided by PCPs in the hospital. Similarly, we could not know or compare the number of different attending physicians each patient experienced during their hospitalization. Higher turnover of inpatient physicians may have affected patient satisfaction scores independent of attending physician designation. These are potentially important measures of relationship duration, yet whether duration affects patient satisfaction remains undecided.1618, 20, 28, 30, 32, 33 We assessed satisfaction using HCAHPS questions, in order to provide objective and meaningful comparisons across hospitals. The HCAHPS instrument, however, is intended to assess patient satisfaction with doctors in general, not with subgroups or individuals, and responses in our study were uniformly high. A more sensitive survey instrument may have yielded different results. Finally, it is possible that individual physicians may possess lower satisfaction scores than others, making the results not representative of hospitalist models as much as specific doctors' care quality. We think this is unlikely since surveys reached over 8000 patients, over 6 years, representing the care of 347 individual physicians. However, hospital medicine is a rapidly evolving field with many divergent organizational structures, and patient satisfaction is bound to fluctuate while there exists high variability in how care is provided.
Over the past decade, the hospitalist model has become one of the dominant models for care of medical inpatients. Compared to the traditional model in which PCPs provide inpatient care, the hospitalist model has a number of advantages, including continuous on‐site coverage for increasingly acute patients, specialization, and incentives aligned with the hospital to provide efficient, high‐quality care. One concern that remains, however, is that patients may not trust doctors they first meet in the hospital or may be dissatisfied with the lack of continuity from day to day. Our findings are reassuring in this regard. Although patients cared for by hospitalists were slightly less satisfied, the differences could not be considered clinically meaningful and should be outweighed by gains in quality and efficiency. Furthermore, hospitalists can expect to fare well under value‐based purchasing. Given the rapid ascension of hospital medicine programs, prospective comparisons of hospitalists and PCPs may no longer be feasible. Future research might employ survey instruments designed specifically to measure patient experience under hospitalist care in order to identify methods to maximize patient satisfaction within the hospitalist model.
Acknowledgements
Jane Garb, MS, Academic Affairs, Baystate Medical Center, contributed to the initial database management and statistical analysis. She received no financial compensation. Dr Adrianne Seiler has received written permission for acknowledgement from Ms Garb.
Dr Adrianne Seiler made substantial contributions to our manuscript's conception and design, data acquisition, analysis, and interpretation, manuscript drafting and critical revision, and administrative support. Dr Paul Visintainer made substantial contributions to our manuscript's data analysis and interpretation, manuscript critical revision, and statistical analysis. Michael Ehresman and Richard Brzostek made substantial contributions to our manuscript's data acquisition, manuscript critical revision, and administrative support. Dr Evan Benjamin made substantial contributions to our manuscript's conception and design, analysis and interpretation of data, manuscript drafting, and administrative support. Dr Winthrop Whitcomb made substantial contributions to our manuscript's data analysis and interpretation, and manuscript critical revision. Dr Michael Rothberg made substantial contributions to our manuscript's conception and design, data analysis and interpretation, manuscript critical revision, and supervision.
- American Hospital Association Annual Survey Database.Fiscal Year2009.
- ,,,,.Quality of care for patients hospitalized with heart failure: assessing the impact of hospitalists.Arch Intern Med.2002;162:1251–1256.
- ,,,,,.Outcomes of care by hospitalists, general internists, and family physicians.N Engl J Med.2007;357:2589–2600.
- ,,,.Comparison of hospitalists and nonhospitalists regarding core measures of pneumonia care.Am J Manag Care.2007;13:129–132.
- ,,,.Comparison of processes and outcomes of pneumonia care between hospitalists and community‐based primary care physicians.Mayo Clin Proc.2002;77:1053–1058.
- ,,,.Comparison of hospitalists and nonhospitalists in inpatient length of stay adjusting for patient and physician characteristics.J Gen Intern Med.2004;19:1127–1132.
- ,,.Comparison of practice patterns of hospitalists and community physicians in the care of patients with congestive heart failure.J Hosp Med.2008;3:35–41.
- ,,, et al.Effects of physician experience on costs and outcomes on an academic general medicine service: results of a trial of hospitalists.Ann Intern Med.2002;137:866–874.
- ,,,,,.The value of a hospitalist service: efficient care for the aging population?Chest.2001;119:580–589.
- ,,,,.Comparison of hospital costs and length of stay associated with general internists and hospitalist physicians at a community hospital.Am J Manag Care.2004;10:626–630.
- ,,,,.Hospitalist care and length of stay in patients requiring complex discharge planning and close clinical monitoring.Arch Intern Med.2007;167:1869–1874.
- ,.The impact of hospitalists on the cost and quality of inpatient care in the United States: a research synthesis.Med Care Res Rev.2005;62(4):379–406.
- US Department of Health and Human Services Medicare Hospital Value‐Based Purchasing Plan Development Issues Paper. 1st Public Listening Session January 17, 2007. Available at: https://www.cms. gov/AcuteInpatientPPS/downloads/hospital_VBP_plan_issues_paper. pdf. Accessed on May 26, 2011.
- Hospital Value‐Based Purchasing: Measure Explanations. Available at: http://www.healthcare.gov/news/factsheets/valuebasedpurchasing 04292011b.html. Accessed on May 26, 2011.
- ,,,,,.Linking primary care performance to outcomes of care.J Fam Pract.1998;47:213–220.
- ,.Interpersonal continuity of care and patient satisfaction: a critical review.Ann Fam Med.2004;2:445–451.
- ,.Does continuity of care improve patient outcomes?J Fam Pract.2004;53:974–980.
- ,,,.Continuity of care and other determinants of patient satisfaction with primary care.J Gen Intern Med.2005;20:226–233.
- ,,,,.Continuity of care and trust in one's physician: evidence from primary care in the United States and the United Kingdom.Fam Med.2001;33:22–27.
- ,,,,.Patients' trust in their physicians: effects of choice, continuity, and payment method.J Gen Intern Med.1998;13:681–686.
- ,.Alternatives for logistic regression in cross‐sectional studies: an empirical comparison of models that directly estimate the prevalence ratio.BMC Med Res Methodol.2003;3:21.
- ,,, et al.Continuity of outpatient medical care in elderly men. A randomized trial.JAMA.1984;252:2413–2417.
- ,.The hospitalist movement 5 years later.JAMA.2002;287:487–494.
- ,,, et al.The effect of a hospitalist service with nurse discharge planner on patient care in an academic teaching hospital.Am J Med.2001;111(8):627–632.
- ,,, et al.Decreased length of stay, costs and mortality in a randomized trial of academic hospitalists.J Gen Intern Med.2001;16(suppl):S208.
- ,,,,.Reorganizing an academic medical service: impact on cost, quality, patient satisfaction, and education.JAMA.1998;279(19):1560–1565.
- .The Park Nicollet experience in establishing a hospitalist system.Ann Intern Med.1999;130:350–354.
- ,,,,,.Effects of hospitalists on cost, outcomes, and patient satisfaction in a rural health system.Am J Med.2000;108:621–626.
- ,,,.The relationship between meeting patients' information needs and their satisfaction with hospital care and general health status outcomes.Int J Qual Health Care.1996;8:447–456.
- ,,.Factors associated with patients' trust in their general practitioner: a cross‐sectional survey.Br J Gen Pract.2003;53:798–800.
- ,,.The relationship between continuity and patient satisfaction: a systematic review.Fam Pract.2010;27:171–178.
- ,,.How do patients view the role of the primary care physician in inpatient care?Dis Mon.2002;48:230–238.
- ,.Patient attitudes toward continuity of care.Arch Intern Med.2003;163:909–912.
- Summary of HCAHPS Survey Results. Available at: http://www. hcahpsonline.org/files/12–13‐10_Summary_of_HCAHPS_Survey_ Results_December_2010.pdf. Accessed on May 27,2011.
Over the past decade, hospital medicine has been the nation's fastest‐growing medical specialty. According to the American Hospital Association's (AHA) 2009 survey, 58% of United States (US) hospitals now have hospital medicine programs, and for hospitals with 200 or more beds, this figure is 89%.1 In 2009, the AHA estimated that the number of US hospitalists would increase to over 34,000 by 2011, over double that of the 16,000 present in 2005.1 Studies demonstrate that, compared to a system where primary care physicians provide inpatient care, the hospitalist model improves efficiency while maintaining at least equal patient outcomes.211 However, scant data exist as to the effects of hospitalists on patient satisfaction.12 Understanding how care models affect patient experience is vital in the current environment of healthcare reform and performance reporting, especially in light of the Centers for Medicare and Medicaid Services' (CMS) efforts to link the patient experience to reimbursement through value‐based purchasing.13 Value‐based purchasing is a strategy to encourage and reward excellence in healthcare delivery through differential reimbursement based on defined performance measures. As one part of value‐based purchasing, hospital reimbursement will be linked to patient‐experience measures, including patient ratings of their doctor's ability to communicate with them and other questions assessing patient satisfaction with their hospital stay.14
In the outpatient setting, trust is the variable most strongly associated with patient satisfaction.1518 In contrast to PCPs, who may develop relationships with patients over years, hospitalists often first meet a patient in the hospital and must engender trust quickly. In addition, hospitalists work in shifts and may not be responsible for the same patients each day. Since continuity is positively related to trust,19, 20 there is reason to believe satisfaction with hospitalist care might be lower than satisfaction with care provided by PCPs. We report on 8295 patients and 6 years experience with hospitalist programs at 3 hospitals. Based on the known link between continuity and patient satisfaction, we hypothesized that patient satisfaction would be lower with hospitalists than with primary care internists.
METHODS
Setting
Our study was conducted at 3 Western Massachusetts hospitals affiliated with Baystate Health, an integrated healthcare delivery system. These included 2 small community hospitals (<100 beds) and a 653‐bed tertiary care, academic teaching hospital. Hospitalist services were established at the tertiary care center in 2001 and at the community hospitals in 2004 and 2005; the programs have evolved over time. In addition, the tertiary care center has 3 different hospitalist groups: an academic group that is employed by the hospital and works with house staff, a hospitalist service that is owned by the hospital and cares for patients from specific outpatient practices, and one that is privately owned caring for patients from another group of practices. The community hospitals each have a single, hospital‐owned service. Primary care physicians also provide inpatient care at all 3 institutions, although their number has decreased over time as the hospitalist programs have grown. All hospitalist services varied in the number of consecutive days in a rounding cycle (degree of continuity), and which services had an admitting team (single initial physician encounter with a different rounding physician) versus a single physician being both the admitting and rounding physician. Consequently, continuity, as measured by the number of different physicians caring for an individual patient during 1 hospitalization, would be expected to vary depending on the type of hospitalist service and the length of stay. Likewise, patients admitted by their primary care physician's office may have been cared for by either their PCP or a practice colleague. All hospitalists and PCPs care for inpatients having similar hospital experiences, as all aspects of a patient's care (including the medical wards, nursing staff, discharge planners, and information systems) are identical, regardless of physician designation. The study was approved by Baystate Health System's Institutional Review Board.
Data Collection
Since February 2001, Baystate Health, in conjunction with Professional Research Consultants, Inc (PRC), has conducted scripted postdischarge patient satisfaction telephone interviews of random discharged adult medicine patients, with Hospital Consumer Assessment of Healthcare Providers and Systems (HCAHPS) questions added in January 2007. Approximately 50 surveys per quarter, per hospital floor, were conducted. Trained PRC staff assessed up to 115 variables encompassing the inpatient experience. We limited our analysis to those domains that reflected satisfaction with physician care, including satisfaction with physician care quality, physician communication, physician behavior, and pain management. The survey responses were scored, depending on question type, with: never, sometimes, usually, always (HCAHPS); or excellent, very good, good, fair, poor (PRC). Each score was converted to a numeric equivalent, with the highest score (4 or 5, depending on scale used) being best and 1 being worst. The specific questions are included in Supporting Appendix A in the online version of this article.
Additional patient information for respondents was extracted from the hospitals' billing database, using medical record numbers, and included age, gender, admission year, education level, language, illness severity, emergency room (ER) admission status, institution, and attending physician type (academic hospitalist [AH], hospital‐owned hospitalist [HOH], private hospitalist [PH], or primary care physician [PCP]). It was not possible to distinguish whether PCP patients were cared for by their own PCP or a colleague from the same practice.
Statistical Analysis
Patient satisfaction data were derived from survey responses of adult inpatients cared for by hospitalists or PCPs between January 1, 2003 and March 31, 2009. The primary outcome was patient‐reported satisfaction with physician care quality measured on a 5‐point Likert scale. In a secondary analysis, physician groups were compared on the proportion of responses that were excellent (a score of 5 on the Likert scale) and the proportion that were poor (a score of 1). Other secondary outcomes included patient satisfaction ratings of physician behavior, pain management, and communication. Averages and percent ranking excellent and poor were calculated for each hospitalist group and for PCPs. Other outcomes analyzed included average patient satisfaction with physician care quality, both over time and stratified by the presence or absence of having an established PCP prior to admission.
In view of the large sample size, Likert‐scale responses were analyzed as continuous outcomes. For unadjusted comparisons among hospitalist groups, t tests and 1‐way ANOVAs were conducted for the scales scores, while chi‐square tests were used for dichotomous outcomes. For multivariable analyses, multiple linear regression was used for continuous outcomes. For dichotomous outcomes, adjusted prevalence ratios were estimated using Poisson regression with robust standard errors.21 All multivariable models controlled for sex, marital status, illness severity, age group, ethnicity, length of stay, and emergency room admission. Observations with missing data were excluded from analyses. Differences in bivariable and multivariable analyses were considered significant at a critical test level of 5%. Prevalence ratios are reported with 95% confidence intervals. All analyses were conducted in Stata, version 11 (StataCorp, College Station, TX).
RESULTS
Of patients who were reached by telephone, 87% agreed to participate in the hospital survey. However, most patients could not be reached by phone; thus our estimated response rate, including those who could not be reached, was 27%. For the subset of patients interviewed using the HCAHPS protocol, the response rate was 40%. Our final sample included 8295 patients (3597 cared for by 59 hospitalists and 4698 by 288 PCPs) interviewed between 2003 and 2009. Three‐quarters of the patients were from the tertiary care center, whereas 17% and 8% were from each of the community hospitals (see Supporting Appendix B in the online version of this article). Patient characteristics appear in Table 1. Patients cared for by hospitalists were similar to those cared for by PCPs in terms of age, sex, marital status, education, and language, but hospitalist patients were more likely to have been admitted through the emergency department (93% vs 84%, P < 0.001) and less likely to be white (83% vs 85%, P = 0.01). Patients cared for by hospitalists also had higher average illness severity score (2.2 0.8 vs 2.0 0.8, P < 0.001), longer average LOS (4.3 4.3 vs 4.0 3.6, P < 0.001), and lower mean perceived health score (2.8 1.2 vs 3.0 1.2, P = 0.01).
| Characteristic | PCP N = 4698 | Hospitalist N = 3597 | P Value |
|---|---|---|---|
| |||
| Age (mean, SD) | 63.5 (16.6) | 63.7 (16.3) | 0.53 |
| Male sex (%) | 44.9 | 46.2 | 0.28 |
| White race (%) | 85.3 | 83.2 | 0.01 |
| Married (%) | 49.1 | 48.7 | 0.69 |
| English spoken at home (%) | 96.0 | 97.0 | 0.09 |
| At least some college education (%) | 47.1 | 43.7 | 0.22 |
| Admitted through the emergency department (%) | 84.3 | 92.5 | <0.001 |
| Average illness severity rating (mean, SD) | 2.0 (0.8) | 2.2 (0.8) | <0.001 |
| Average perceived health score (mean, SD) | 3.0 (1.2) | 2.8 (1.2) | 0.01 |
| Average length of stay (days) (mean, SD) | 4.0 (3.6) | 4.3 (4.3) | <0.001 |
| Discharged home (%) | 87.9 | 88.5 | 0.73 |
Unadjusted patient reported satisfaction with physician care quality was slightly greater for PCPs than hospitalists (4.25 vs 4.19, P = 0.009). After multivariable adjustment, the difference was attenuated but persisted (4.24 vs 4.20, P = 0.04). We found no statistical difference among the hospitals or the specific hospitalist groups in terms of satisfaction with overall physician care quality (Figure 1). There were no statistical differences in patient satisfaction ratings of hospitalist and PCPs for the subdomains of behavior, pain, and communication (Table 2). There were also no differences in the proportion of patients cared for by hospitalists or PCPs who rated their physicians in the highest satisfaction category (79% vs 81%, P = 0.17) or the lowest (5% vs 5%, P = 0.19). Among patients cared for by academic hospitalists, there was no difference in satisfaction rating between those patients who had a designated primary care physician in the outpatient setting and those who did not (4.22 0.94 vs 4.19 0.94, P = 0.97). Finally, satisfaction with both hospitalists and PCPs showed equivalent rates of improvement over time (Figure 2).
| PCP | Hospitalist | P Value | ||
|---|---|---|---|---|
| ||||
| Satisfaction | Overall, you would rate the quality of doctor care as:* | 4.24 [4.21, 4.27] | 4.20 [4.17, 4.23] | 0.04 |
| Behavior | Doctors treated you with courtesy/respect | 3.77 [3.73, 3.82] | 3.78 [3.73, 3.82] | 0.88 |
| Pain control | Pain management by hospital staff* | 4.11 [4.08, 4.14] | 4.09 [4.05, 4.12] | 0.35 |
| Pain well controlled | 3.55 [3.47, 3.63] | 3.48 [3.41, 3.55] | 0.23 | |
| Staff did everything to help with pain | 3.73 [3.66, 3.80] | 3.68 [3.62, 3.75] | 0.33 | |
| Communication skills | Doctors listened carefully to you | 3.66 [3.61, 3.72] | 3.67 [3.62, 3.72] | 0.83 |
| Doctors explained things in an understandable way | 3.60 [3.54, 3.66] | 3.61 [3.56, 3.67] | 0.73 | |
| Doctor's communication* | 4.02 [3.97, 4.07] | 3.98 [3.93, 4.03] | 0.27 | |
| Doctor discussed your anxiety/fears* | 4.00 [3.96, 4.03] | 3.97 [3.93, 4.01] | 0.26 | |
| Doctor involved you in decisions* | 4.00 [3.95, 4.06] | 3.98 [3.93, 4.03] | 0.49 | |
DISCUSSION
In this observational study of over 8200 patients cared for over 6 years by 347 physicians at 3 hospitals, we found that patient satisfaction with inpatient care provided by hospitalists and primary care doctors was almost identical. As we hypothesized, overall satisfaction with physician care quality, our primary outcome, was slightly greater with primary care doctors; however, the observed difference, 0.04 on a scale of 1 to 5, cannot be considered clinically significant. All patients were generally satisfied (4.2‐4.3 rating on 5‐point scale) with their inpatient care, and satisfaction scores increased over time. We also found no differences among the specific domains of satisfaction, including communication skills, pain control, and physician behavior. Finally, we found no significant difference in patient satisfaction with physician care quality among the different hospitalist services.
Previous studies of patient satisfaction conducted in the outpatient setting found that continuity of care was an important determinant of trust and, consequently, overall satisfaction.15, 16, 19, 20, 22 Because hospitalist models introduce discontinuity, they might be expected to undermine satisfaction. Surprisingly, few studies have addressed this issue. In a review of the hospitalist studies through 2002, Wachter and Goldman found 19 studies, 5 of which measured patient satisfaction.23 Three of these were conducted on teaching services and compared designated faculty hospitalists to traditional ward attendings, who rotated onto the inpatient services 1 to 2 months per year. Primary care doctors were excluded.2426 A fourth study provided a descriptive narrative of the development of the first hospitalist program in Minneapolis, Minnesota, and anecdotally noted no difference in patient satisfaction between the hospitalist and traditional model, but presented no data because the satisfaction surveys were not designed with publication in mind.27 The only study to actually assess whether patient satisfaction was greater with hospitalists or PCPs was an observational study by Davis et al., conducted in 1 rural hospital during the first year of its hospitalist program. In that study, 2 hospitalists were compared to 17 PCPs, and patient satisfaction surveys were available for approximately 44 patients managed by hospitalists and 168 patients managed by PCPs. Specific data were not reported, but it was noted that there was no statistical difference in satisfaction between those cared for by hospitalists versus PCPs.28 On the basis of these studies, Wachter and Goldman concluded that surveys of patients who were cared for by hospitalists show high levels of satisfaction, no lower than that of similar patients cared for by their own primary physicians.23 Wachter and Goldman's review has been highly cited, and we could find no subsequent studies addressing this issue. Our study provides the first real evidence to support this conclusion, including data from 59 hospitalists practicing in 5 separate hospitalist programs at 3 different hospitals.
Our finding that hospitalists maintain satisfaction despite a lack of continuity suggests that other aspects of care may be more important to patient satisfaction. Larson et al. found that physician ability to meet patient's information needs was positively associated with patient satisfaction.29 Similarly, Tarrant et al. found that patient's trust in a physician improved with increasing communication, interpersonal care, and knowledge of the patient. Interestingly, continuity, ie. the proportion of visits to the usual general practitioner (GP) or duration with the practice, did not correlate with trust.30 Finally, a systematic review of determinants of outpatient satisfaction found that continuity has a variable effect on satisfaction. Subjective continuity measures, such as whether patients saw their regular physician on the day they were surveyed, were consistently associated with patient satisfaction, however, quantitative measures including relationship duration were not.31
It is also possible that patients believe they value continuity more than they actually do. In 1 survey of inpatients with an established PCP yet cared for by a hospitalist, most agreed that patients receive better care and have more trust in physicians with whom they have long‐term relationships. Yet most also had positive opinions of their hospital care.32 Similarly, in a survey of over 2500 outpatients, 92% rated continuity as very important or important, but the majority was unwilling to expend substantial personal time (88%), defined as driving greater than 60 minutes, or money (82%), defined as spending an additional $20 to $40 a month, to maintain continuity with their PCP.33 Our study appears to confirm the lack of connection between continuity and satisfaction. Even those patients who valued continuity, as evidenced by having an established PCP, were as satisfied with hospitalist physician care as patients who had no established PCP.
Our study has several limitations. First, we report on outcomes of 3 institutions within a single healthcare system, within a limited geographic area. Although our sample included a wide range of patient demographics, hundreds of physicians, and multiple hospitalist models, it is possible that some hospitalist models may provide greater or lesser satisfaction than those we observed. Second, our study was observational, and thus subject to selection bias and confounding. Patients cared for by the hospitalists differed in a number of ways from those cared for by PCPs. We controlled for identifiable confounders such as illness severity, self‐perceived health, and admission through the emergency department, but the possibility exists that additional unidentified factors could have affected our results. It is possible other drivers of patient satisfaction, such as amenities, nursing, or food, could have influenced our findings. However, this is unlikely because all patient groups shared these components of hospital experience equally. Third, only a minority of patients could be reached for interview. This is typical for post‐hospitalization surveys, and our response rate of 40% for HCAHPS patients compared favorably to the 2010 HCAHPS national average of 33%.34 Still, the responses of those who could not be reached may have differed from those who were interviewed. Fourth, we identified hospitalists and PCPs by the attending of record, but we were unable to tell who provided care to the patient on any given day. Thus, we could not determine to what extent patients cared for by PCPs were actually seen by their own doctor, as opposed to an associated physician within the practice. Nevertheless, our results are representative of the care model provided by PCPs in the hospital. Similarly, we could not know or compare the number of different attending physicians each patient experienced during their hospitalization. Higher turnover of inpatient physicians may have affected patient satisfaction scores independent of attending physician designation. These are potentially important measures of relationship duration, yet whether duration affects patient satisfaction remains undecided.1618, 20, 28, 30, 32, 33 We assessed satisfaction using HCAHPS questions, in order to provide objective and meaningful comparisons across hospitals. The HCAHPS instrument, however, is intended to assess patient satisfaction with doctors in general, not with subgroups or individuals, and responses in our study were uniformly high. A more sensitive survey instrument may have yielded different results. Finally, it is possible that individual physicians may possess lower satisfaction scores than others, making the results not representative of hospitalist models as much as specific doctors' care quality. We think this is unlikely since surveys reached over 8000 patients, over 6 years, representing the care of 347 individual physicians. However, hospital medicine is a rapidly evolving field with many divergent organizational structures, and patient satisfaction is bound to fluctuate while there exists high variability in how care is provided.
Over the past decade, the hospitalist model has become one of the dominant models for care of medical inpatients. Compared to the traditional model in which PCPs provide inpatient care, the hospitalist model has a number of advantages, including continuous on‐site coverage for increasingly acute patients, specialization, and incentives aligned with the hospital to provide efficient, high‐quality care. One concern that remains, however, is that patients may not trust doctors they first meet in the hospital or may be dissatisfied with the lack of continuity from day to day. Our findings are reassuring in this regard. Although patients cared for by hospitalists were slightly less satisfied, the differences could not be considered clinically meaningful and should be outweighed by gains in quality and efficiency. Furthermore, hospitalists can expect to fare well under value‐based purchasing. Given the rapid ascension of hospital medicine programs, prospective comparisons of hospitalists and PCPs may no longer be feasible. Future research might employ survey instruments designed specifically to measure patient experience under hospitalist care in order to identify methods to maximize patient satisfaction within the hospitalist model.
Acknowledgements
Jane Garb, MS, Academic Affairs, Baystate Medical Center, contributed to the initial database management and statistical analysis. She received no financial compensation. Dr Adrianne Seiler has received written permission for acknowledgement from Ms Garb.
Dr Adrianne Seiler made substantial contributions to our manuscript's conception and design, data acquisition, analysis, and interpretation, manuscript drafting and critical revision, and administrative support. Dr Paul Visintainer made substantial contributions to our manuscript's data analysis and interpretation, manuscript critical revision, and statistical analysis. Michael Ehresman and Richard Brzostek made substantial contributions to our manuscript's data acquisition, manuscript critical revision, and administrative support. Dr Evan Benjamin made substantial contributions to our manuscript's conception and design, analysis and interpretation of data, manuscript drafting, and administrative support. Dr Winthrop Whitcomb made substantial contributions to our manuscript's data analysis and interpretation, and manuscript critical revision. Dr Michael Rothberg made substantial contributions to our manuscript's conception and design, data analysis and interpretation, manuscript critical revision, and supervision.
- American Hospital Association Annual Survey Database.Fiscal Year2009.
- ,,,,.Quality of care for patients hospitalized with heart failure: assessing the impact of hospitalists.Arch Intern Med.2002;162:1251–1256.
- ,,,,,.Outcomes of care by hospitalists, general internists, and family physicians.N Engl J Med.2007;357:2589–2600.
- ,,,.Comparison of hospitalists and nonhospitalists regarding core measures of pneumonia care.Am J Manag Care.2007;13:129–132.
- ,,,.Comparison of processes and outcomes of pneumonia care between hospitalists and community‐based primary care physicians.Mayo Clin Proc.2002;77:1053–1058.
- ,,,.Comparison of hospitalists and nonhospitalists in inpatient length of stay adjusting for patient and physician characteristics.J Gen Intern Med.2004;19:1127–1132.
- ,,.Comparison of practice patterns of hospitalists and community physicians in the care of patients with congestive heart failure.J Hosp Med.2008;3:35–41.
- ,,, et al.Effects of physician experience on costs and outcomes on an academic general medicine service: results of a trial of hospitalists.Ann Intern Med.2002;137:866–874.
- ,,,,,.The value of a hospitalist service: efficient care for the aging population?Chest.2001;119:580–589.
- ,,,,.Comparison of hospital costs and length of stay associated with general internists and hospitalist physicians at a community hospital.Am J Manag Care.2004;10:626–630.
- ,,,,.Hospitalist care and length of stay in patients requiring complex discharge planning and close clinical monitoring.Arch Intern Med.2007;167:1869–1874.
- ,.The impact of hospitalists on the cost and quality of inpatient care in the United States: a research synthesis.Med Care Res Rev.2005;62(4):379–406.
- US Department of Health and Human Services Medicare Hospital Value‐Based Purchasing Plan Development Issues Paper. 1st Public Listening Session January 17, 2007. Available at: https://www.cms. gov/AcuteInpatientPPS/downloads/hospital_VBP_plan_issues_paper. pdf. Accessed on May 26, 2011.
- Hospital Value‐Based Purchasing: Measure Explanations. Available at: http://www.healthcare.gov/news/factsheets/valuebasedpurchasing 04292011b.html. Accessed on May 26, 2011.
- ,,,,,.Linking primary care performance to outcomes of care.J Fam Pract.1998;47:213–220.
- ,.Interpersonal continuity of care and patient satisfaction: a critical review.Ann Fam Med.2004;2:445–451.
- ,.Does continuity of care improve patient outcomes?J Fam Pract.2004;53:974–980.
- ,,,.Continuity of care and other determinants of patient satisfaction with primary care.J Gen Intern Med.2005;20:226–233.
- ,,,,.Continuity of care and trust in one's physician: evidence from primary care in the United States and the United Kingdom.Fam Med.2001;33:22–27.
- ,,,,.Patients' trust in their physicians: effects of choice, continuity, and payment method.J Gen Intern Med.1998;13:681–686.
- ,.Alternatives for logistic regression in cross‐sectional studies: an empirical comparison of models that directly estimate the prevalence ratio.BMC Med Res Methodol.2003;3:21.
- ,,, et al.Continuity of outpatient medical care in elderly men. A randomized trial.JAMA.1984;252:2413–2417.
- ,.The hospitalist movement 5 years later.JAMA.2002;287:487–494.
- ,,, et al.The effect of a hospitalist service with nurse discharge planner on patient care in an academic teaching hospital.Am J Med.2001;111(8):627–632.
- ,,, et al.Decreased length of stay, costs and mortality in a randomized trial of academic hospitalists.J Gen Intern Med.2001;16(suppl):S208.
- ,,,,.Reorganizing an academic medical service: impact on cost, quality, patient satisfaction, and education.JAMA.1998;279(19):1560–1565.
- .The Park Nicollet experience in establishing a hospitalist system.Ann Intern Med.1999;130:350–354.
- ,,,,,.Effects of hospitalists on cost, outcomes, and patient satisfaction in a rural health system.Am J Med.2000;108:621–626.
- ,,,.The relationship between meeting patients' information needs and their satisfaction with hospital care and general health status outcomes.Int J Qual Health Care.1996;8:447–456.
- ,,.Factors associated with patients' trust in their general practitioner: a cross‐sectional survey.Br J Gen Pract.2003;53:798–800.
- ,,.The relationship between continuity and patient satisfaction: a systematic review.Fam Pract.2010;27:171–178.
- ,,.How do patients view the role of the primary care physician in inpatient care?Dis Mon.2002;48:230–238.
- ,.Patient attitudes toward continuity of care.Arch Intern Med.2003;163:909–912.
- Summary of HCAHPS Survey Results. Available at: http://www. hcahpsonline.org/files/12–13‐10_Summary_of_HCAHPS_Survey_ Results_December_2010.pdf. Accessed on May 27,2011.
Copyright © 2011 Society of Hospital Medicine