Alarm fatigue is a patient safety hazard in hospitals1 that occurs when exposure to high rates of alarms leads clinicians to ignore or delay their responses to the alarms.2,3 To date, most studies of physiologic monitor alarms in hospitalized children have used data from single institutions and often only a few units within each institution.4 These limited studies have found that alarms in pediatric units are rarely actionable.2 They have also shown that physiologic monitor alarms occur frequently in children’s hospitals and that alarm rates can vary widely within a single institution,5 but the extent of variation between children’s hospitals is unknown. In this study, we aimed to describe and compare physiologic monitor alarm characteristics and the proportion of patients monitored in the inpatient units of 5 children’s hospitals.
METHODS
We performed a cross-sectional study using a point-prevalence design of physiologic monitor alarms and monitoring during a 24-hour period at 5 large, freestanding tertiary-care children’s hospitals. At the time of the study, each hospital had an alarm management committee in place and was working to address alarm fatigue. Each hospital’s institutional review board reviewed and approved the study.
We collected 24 consecutive hours of data from the inpatient units of each hospital between March 24, 2015, and May 1, 2015. Each hospital selected the data collection date within that window based on the availability of staff to perform data collection.6 We excluded emergency departments, procedural areas, and inpatient psychiatry and rehabilitation units. By using existing central alarm-collection software that interfaced with bedside physiologic monitors, we collected data on audible alarms generated for apnea, arrhythmia, low and high oxygen saturation, heart rate, respiratory rate, blood pressure, and exhaled carbon dioxide. Bedside alarm systems and alarm collection software differed between centers; therefore, alarm types that were not consistently collected at every institution (eg, alarms for electrode and device malfunction, ventilators, intracranial and central venous pressure monitors, and temperatures probes) were excluded. To estimate alarm rates and to account for fluctuations in hospital census throughout the day,7 we collected census (to calculate the number of alarms per patient day) and the number of monitored patients (to calculate the number of alarms per monitored-patient day, including only monitored patients in the denominator) on each unit at 3 time points, 8 hours apart. Patients were considered continuously monitored if they had presence of a waveform and data for pulse oximetry, respiratory rate, and/or heart rate at the time of data collection. We then determined the rate of alarms by unit type—medical-surgical unit (MSU), neonatal intensive care unit (NICU), or pediatric intensive care unit (PICU)—and the alarm types. Based on prior literature demonstrating up to 95% of alarms contributed by a minority of patients on a single unit,8 we also calculated the percentage of alarms contributed by beds in the highest quartile of alarms. We also assessed the percentage of patients monitored by unit type. The Supplementary Appendix shows the alarm parameter thresholds in use at the time of the study.
RESULTS
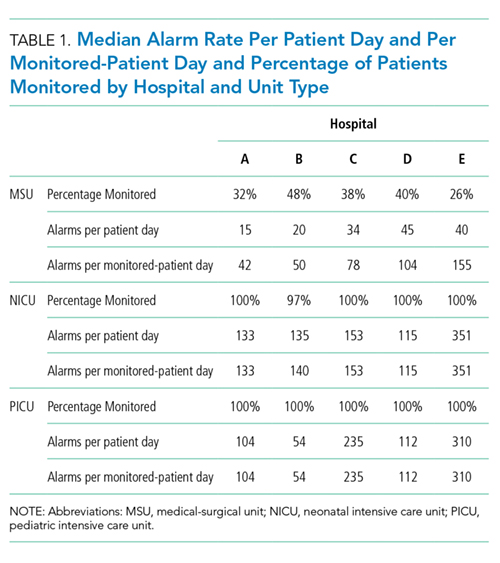
A total of 147,213 eligible clinical alarms occurred during the 24-hour data collection periods in the 5 hospitals. Alarm rates differed across the 5 hospitals, with the highest alarm hospitals having up to 3-fold higher alarm rates than the lowest alarm hospitals (Table 1). Rates also varied by unit type within and across hospitals (Table 1). The highest alarm rates overall during the study occurred in the NICUs, with a range of 115 to 351 alarms per monitored patient per day, followed by the PICUs (range 54-310) and MSUs (range 42-155).
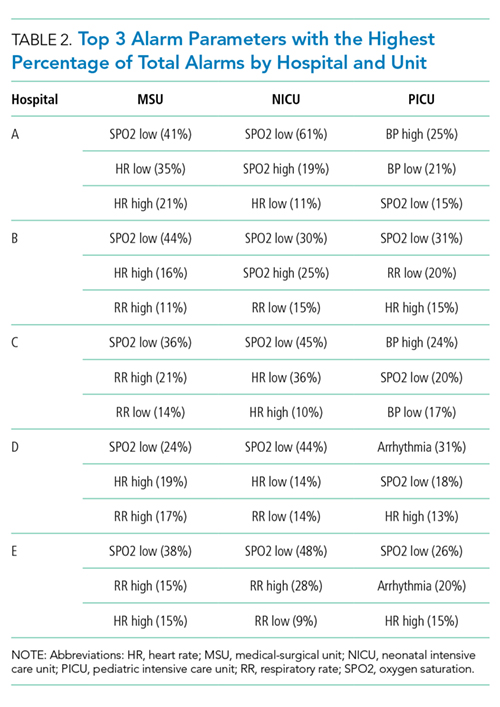
While patient monitoring in the NICUs and PICUs was nearly universal (97%-100%) at institutions during the study period, a range of 26% to 48% of beds were continuously monitored in MSUs. Of the 12 alarm parameters assessed, low oxygen saturation had the highest percentage of total alarms in both the MSUs and NICUs for all hospitals, whereas the alarm parameter with the highest percentage of total alarms in the PICUs varied by hospital. The most common alarm types in 2 of the 5 PICUs were high blood pressure alarms and low pulse oximetry, but otherwise, this varied across the remainder of the units (Table 2).
Averaged across study hospitals, one-quarter of the monitored beds were responsible for 71% of alarms in MSUs, 61% of alarms in NICUs, and 63% of alarms in PICUs.
DISCUSSION
Physiologic monitor alarm rates and the proportion of patients monitored varied widely between unit types and among the tertiary-care children’s hospitals in our study. We found that among MSUs, the hospital with the lowest proportion of beds monitored had the highest alarm rate, with over triple the rate seen at the hospital with the lowest alarm rate. Regardless of unit type, a small subgroup of patients at each hospital contributed a disproportionate share of alarms. These findings are concerning because of the patient morbidity and mortality associated with alarm fatigue1 and the studies suggesting that higher alarm rates may lead to delays in response to potentially critical alarms.2
We previously described alarm rates at a single children’s hospital and found that alarm rates were high both in and outside of the ICU areas.5 This study supports those findings and goes further to show that alarm rates on some MSUs approached rates seen in the ICU areas at other centers.4 However, our results should be considered in the context of several limitations. First, the 5 study hospitals utilized different bedside monitors, equipment, and software to collect alarm data. It is possible that this impacted how alarms were counted, though there were no technical specifications to suggest that results should have been biased in a specific way. Second, our data did not reflect alarm validity (ie, whether an alarm accurately reflected the physiologic state of the patient) or factors outside of the number of patients monitored—such as practices around ICU admission and transfer as well as monitor practices such as lead changes, the type of leads employed, and the degree to which alarm parameter thresholds could be customized, which may have also affected alarm rates. Finally, we excluded alarm types that were not consistently collected at all hospitals. We were also unable to capture alarms from other alarm-generating devices, including ventilators and infusion pumps, which have also been identified as sources of alarm-related safety issues in hospitals.9-11 This suggests that the alarm rates reported here underestimate the total number of audible alarms experienced by staff and by hospitalized patients and families.
While our data collection was limited in scope, the striking differences in alarm rates between hospitals and between similar units in the same hospitals suggest that unit- and hospital-level factors—including default alarm parameter threshold settings, types of monitors used, and monitoring practices such as the degree to which alarm parameters are customized to the patient’s physiologic state—likely contribute to the variability. It is also important to note that while there were clear outlier hospitals, no single hospital had the lowest alarm rate across all unit types. And while we found that a small number of patients contributed disproportionately to alarms, monitoring fewer patients overall was not consistently associated with lower alarm rates. While it is difficult to draw conclusions based on a limited study, these findings suggest that solutions to meaningfully lower alarm rates may be multifaceted. Standardization of care in multiple areas of medicine has shown the potential to decrease unnecessary utilization of testing and therapies while maintaining good patient outcomes.12-15 Our findings suggest that the concept of positive deviance,16 by which some organizations produce better outcomes than others despite similar limitations, may help identify successful alarm reduction strategies for further testing. Larger quantitative studies of alarm rates and ethnographic or qualitative studies of monitoring practices may reveal practices and policies that are associated with lower alarm rates with similar or improved monitoring outcomes.
CONCLUSION
We found wide variability in physiologic monitor alarm rates and the proportion of patients monitored across 5 children’s hospitals. Because alarm fatigue remains a pressing patient safety concern, further study of the features of high-performing (low-alarm) hospital systems may help identify barriers and facilitators of safe, effective monitoring and develop targeted interventions to reduce alarms.
ACKNOWLEDGEMENTS
The authors thank Melinda Egan, Matt MacMurchy, and Shannon Stemler for their assistance with data collection.
Disclosure
Dr. Bonafide is supported by the National Heart, Lung, and Blood Institute of the National Institutes of Health under Award Number K23HL116427. Dr. Brady is supported by the Agency for Healthcare Research and Quality under Award Number K08HS23827. The content is solely the responsibility of the authors and does not necessarily represent the official views of the National Institutes of Health or the Agency for Healthcare Research and Quality. There was no external funding obtained for this study. The authors have no conflicts of interest to disclose.
1. Sentinel Event Alert Issue 50: Medical device alarm safety in hospitals. The Joint Commission. April 8, 2013. www.jointcommission.org/sea_issue_50. Accessed December 16, 2017. 2. Bonafide CP, Lin R, Zander M, et al. Association between exposure to nonactionable physiologic monitor alarms and response time in a children’s hospital. J Hosp Med. 2015;10(6):345-351. PubMed 3. Voepel-Lewis T, Parker ML, Burke CN, et al. Pulse oximetry desaturation alarms on a general postoperative adult unit: A prospective observational study of nurse response time. Int J Nurs Stud. 2013;50(10):1351-1358. PubMed 4. Paine CW, Goel VV, Ely E, et al. Systematic review of physiologic monitor alarm characteristics and pragmatic interventions to reduce alarm frequency. J Hosp Med. 2016;11(2):136-144. PubMed 5. Schondelmeyer AC, Bonafide CP, Goel VV, et al. The frequency of physiologic monitor alarms in a children’s hospital. J Hosp Med. 2016;11(11):796-798. PubMed 6. Zingg W, Hopkins S, Gayet-Ageron A, et al. Health-care-associated infections in neonates, children, and adolescents: An analysis of paediatric data from the European Centre for Disease Prevention and Control point-prevalence survey. Lancet Infect Dis. 2017;17(4):381-389. PubMed 7. Fieldston E, Ragavan M, Jayaraman B, Metlay J, Pati S. Traditional measures of hospital utilization may not accurately reflect dynamic patient demand: Findings from a children’s hospital. Hosp Pediatr. 2012;2(1):10-18. PubMed 8. Cvach M, Kitchens M, Smith K, Harris P, Flack MN. Customizing alarm limits based on specific needs of patients. Biomed Instrum Technol. 2017;51(3):227-234. PubMed 9. Pham JC, Williams TL, Sparnon EM, Cillie TK, Scharen HF, Marella WM. Ventilator-related adverse events: A taxonomy and findings from 3 incident reporting systems. Respir Care. 2016;61(5):621-631. PubMed 10. Cho OM, Kim H, Lee YW, Cho I. Clinical alarms in intensive care units: Perceived obstacles of alarm management and alarm fatigue in nurses. Healthc Inform Res. 2016;22(1):46-53. PubMed 11. Edworthy J, Hellier E. Alarms and human behaviour: Implications for medical alarms. Br J Anaesth. 2006;97(1):12-17. PubMed 12. Fisher ES, Wennberg DE, Stukel TA, Gottlieb DJ, Lucas FL, Pinder EL. The implications of regional variations in medicare spending. Part 1: The content, quality, and accessibility of care. Ann Intern Med. 2003;138(4):273-287. PubMed 13. Fisher ES, Wennberg DE, Stukel TA, Gottlieb DJ, Lucas FL, Pinder EL. The implications of regional variations in medicare spending. Part 2: Health outcomes and satisfaction with care. Ann Intern Med. 2003;138(4):288-298. PubMed 14. Lion KC, Wright DR, Spencer S, Zhou C, Del Beccaro M, Mangione-Smith R. Standardized clinical pathways for hospitalized children and outcomes. Pediatrics. 2016;137(4) e20151202. PubMed 15. Goodman DC. Unwarranted variation in pediatric medical care. Pediatr Clin North Am. 2009;56(4):745-755. PubMed 16. Baxter R, Taylor N, Kellar I, Lawton R. What methods are used to apply positive deviance within healthcare organisations? A systematic review. BMJ Qual Saf. 2016;25(3):190-201. PubMed
Alarm fatigue is a patient safety hazard in hospitals1 that occurs when exposure to high rates of alarms leads clinicians to ignore or delay their responses to the alarms.2,3 To date, most studies of physiologic monitor alarms in hospitalized children have used data from single institutions and often only a few units within each institution.4 These limited studies have found that alarms in pediatric units are rarely actionable.2 They have also shown that physiologic monitor alarms occur frequently in children’s hospitals and that alarm rates can vary widely within a single institution,5 but the extent of variation between children’s hospitals is unknown. In this study, we aimed to describe and compare physiologic monitor alarm characteristics and the proportion of patients monitored in the inpatient units of 5 children’s hospitals.
METHODS
We performed a cross-sectional study using a point-prevalence design of physiologic monitor alarms and monitoring during a 24-hour period at 5 large, freestanding tertiary-care children’s hospitals. At the time of the study, each hospital had an alarm management committee in place and was working to address alarm fatigue. Each hospital’s institutional review board reviewed and approved the study.
We collected 24 consecutive hours of data from the inpatient units of each hospital between March 24, 2015, and May 1, 2015. Each hospital selected the data collection date within that window based on the availability of staff to perform data collection.6 We excluded emergency departments, procedural areas, and inpatient psychiatry and rehabilitation units. By using existing central alarm-collection software that interfaced with bedside physiologic monitors, we collected data on audible alarms generated for apnea, arrhythmia, low and high oxygen saturation, heart rate, respiratory rate, blood pressure, and exhaled carbon dioxide. Bedside alarm systems and alarm collection software differed between centers; therefore, alarm types that were not consistently collected at every institution (eg, alarms for electrode and device malfunction, ventilators, intracranial and central venous pressure monitors, and temperatures probes) were excluded. To estimate alarm rates and to account for fluctuations in hospital census throughout the day,7 we collected census (to calculate the number of alarms per patient day) and the number of monitored patients (to calculate the number of alarms per monitored-patient day, including only monitored patients in the denominator) on each unit at 3 time points, 8 hours apart. Patients were considered continuously monitored if they had presence of a waveform and data for pulse oximetry, respiratory rate, and/or heart rate at the time of data collection. We then determined the rate of alarms by unit type—medical-surgical unit (MSU), neonatal intensive care unit (NICU), or pediatric intensive care unit (PICU)—and the alarm types. Based on prior literature demonstrating up to 95% of alarms contributed by a minority of patients on a single unit,8 we also calculated the percentage of alarms contributed by beds in the highest quartile of alarms. We also assessed the percentage of patients monitored by unit type. The Supplementary Appendix shows the alarm parameter thresholds in use at the time of the study.
RESULTS
A total of 147,213 eligible clinical alarms occurred during the 24-hour data collection periods in the 5 hospitals. Alarm rates differed across the 5 hospitals, with the highest alarm hospitals having up to 3-fold higher alarm rates than the lowest alarm hospitals (Table 1). Rates also varied by unit type within and across hospitals (Table 1). The highest alarm rates overall during the study occurred in the NICUs, with a range of 115 to 351 alarms per monitored patient per day, followed by the PICUs (range 54-310) and MSUs (range 42-155).
While patient monitoring in the NICUs and PICUs was nearly universal (97%-100%) at institutions during the study period, a range of 26% to 48% of beds were continuously monitored in MSUs. Of the 12 alarm parameters assessed, low oxygen saturation had the highest percentage of total alarms in both the MSUs and NICUs for all hospitals, whereas the alarm parameter with the highest percentage of total alarms in the PICUs varied by hospital. The most common alarm types in 2 of the 5 PICUs were high blood pressure alarms and low pulse oximetry, but otherwise, this varied across the remainder of the units (Table 2).
Averaged across study hospitals, one-quarter of the monitored beds were responsible for 71% of alarms in MSUs, 61% of alarms in NICUs, and 63% of alarms in PICUs.
DISCUSSION
Physiologic monitor alarm rates and the proportion of patients monitored varied widely between unit types and among the tertiary-care children’s hospitals in our study. We found that among MSUs, the hospital with the lowest proportion of beds monitored had the highest alarm rate, with over triple the rate seen at the hospital with the lowest alarm rate. Regardless of unit type, a small subgroup of patients at each hospital contributed a disproportionate share of alarms. These findings are concerning because of the patient morbidity and mortality associated with alarm fatigue1 and the studies suggesting that higher alarm rates may lead to delays in response to potentially critical alarms.2
We previously described alarm rates at a single children’s hospital and found that alarm rates were high both in and outside of the ICU areas.5 This study supports those findings and goes further to show that alarm rates on some MSUs approached rates seen in the ICU areas at other centers.4 However, our results should be considered in the context of several limitations. First, the 5 study hospitals utilized different bedside monitors, equipment, and software to collect alarm data. It is possible that this impacted how alarms were counted, though there were no technical specifications to suggest that results should have been biased in a specific way. Second, our data did not reflect alarm validity (ie, whether an alarm accurately reflected the physiologic state of the patient) or factors outside of the number of patients monitored—such as practices around ICU admission and transfer as well as monitor practices such as lead changes, the type of leads employed, and the degree to which alarm parameter thresholds could be customized, which may have also affected alarm rates. Finally, we excluded alarm types that were not consistently collected at all hospitals. We were also unable to capture alarms from other alarm-generating devices, including ventilators and infusion pumps, which have also been identified as sources of alarm-related safety issues in hospitals.9-11 This suggests that the alarm rates reported here underestimate the total number of audible alarms experienced by staff and by hospitalized patients and families.
While our data collection was limited in scope, the striking differences in alarm rates between hospitals and between similar units in the same hospitals suggest that unit- and hospital-level factors—including default alarm parameter threshold settings, types of monitors used, and monitoring practices such as the degree to which alarm parameters are customized to the patient’s physiologic state—likely contribute to the variability. It is also important to note that while there were clear outlier hospitals, no single hospital had the lowest alarm rate across all unit types. And while we found that a small number of patients contributed disproportionately to alarms, monitoring fewer patients overall was not consistently associated with lower alarm rates. While it is difficult to draw conclusions based on a limited study, these findings suggest that solutions to meaningfully lower alarm rates may be multifaceted. Standardization of care in multiple areas of medicine has shown the potential to decrease unnecessary utilization of testing and therapies while maintaining good patient outcomes.12-15 Our findings suggest that the concept of positive deviance,16 by which some organizations produce better outcomes than others despite similar limitations, may help identify successful alarm reduction strategies for further testing. Larger quantitative studies of alarm rates and ethnographic or qualitative studies of monitoring practices may reveal practices and policies that are associated with lower alarm rates with similar or improved monitoring outcomes.
CONCLUSION
We found wide variability in physiologic monitor alarm rates and the proportion of patients monitored across 5 children’s hospitals. Because alarm fatigue remains a pressing patient safety concern, further study of the features of high-performing (low-alarm) hospital systems may help identify barriers and facilitators of safe, effective monitoring and develop targeted interventions to reduce alarms.
ACKNOWLEDGEMENTS
The authors thank Melinda Egan, Matt MacMurchy, and Shannon Stemler for their assistance with data collection.
Disclosure
Dr. Bonafide is supported by the National Heart, Lung, and Blood Institute of the National Institutes of Health under Award Number K23HL116427. Dr. Brady is supported by the Agency for Healthcare Research and Quality under Award Number K08HS23827. The content is solely the responsibility of the authors and does not necessarily represent the official views of the National Institutes of Health or the Agency for Healthcare Research and Quality. There was no external funding obtained for this study. The authors have no conflicts of interest to disclose.
References
1. Sentinel Event Alert Issue 50: Medical device alarm safety in hospitals. The Joint Commission. April 8, 2013. www.jointcommission.org/sea_issue_50. Accessed December 16, 2017. 2. Bonafide CP, Lin R, Zander M, et al. Association between exposure to nonactionable physiologic monitor alarms and response time in a children’s hospital. J Hosp Med. 2015;10(6):345-351. PubMed 3. Voepel-Lewis T, Parker ML, Burke CN, et al. Pulse oximetry desaturation alarms on a general postoperative adult unit: A prospective observational study of nurse response time. Int J Nurs Stud. 2013;50(10):1351-1358. PubMed 4. Paine CW, Goel VV, Ely E, et al. Systematic review of physiologic monitor alarm characteristics and pragmatic interventions to reduce alarm frequency. J Hosp Med. 2016;11(2):136-144. PubMed 5. Schondelmeyer AC, Bonafide CP, Goel VV, et al. The frequency of physiologic monitor alarms in a children’s hospital. J Hosp Med. 2016;11(11):796-798. PubMed 6. Zingg W, Hopkins S, Gayet-Ageron A, et al. Health-care-associated infections in neonates, children, and adolescents: An analysis of paediatric data from the European Centre for Disease Prevention and Control point-prevalence survey. Lancet Infect Dis. 2017;17(4):381-389. PubMed 7. Fieldston E, Ragavan M, Jayaraman B, Metlay J, Pati S. Traditional measures of hospital utilization may not accurately reflect dynamic patient demand: Findings from a children’s hospital. Hosp Pediatr. 2012;2(1):10-18. PubMed 8. Cvach M, Kitchens M, Smith K, Harris P, Flack MN. Customizing alarm limits based on specific needs of patients. Biomed Instrum Technol. 2017;51(3):227-234. PubMed 9. Pham JC, Williams TL, Sparnon EM, Cillie TK, Scharen HF, Marella WM. Ventilator-related adverse events: A taxonomy and findings from 3 incident reporting systems. Respir Care. 2016;61(5):621-631. PubMed 10. Cho OM, Kim H, Lee YW, Cho I. Clinical alarms in intensive care units: Perceived obstacles of alarm management and alarm fatigue in nurses. Healthc Inform Res. 2016;22(1):46-53. PubMed 11. Edworthy J, Hellier E. Alarms and human behaviour: Implications for medical alarms. Br J Anaesth. 2006;97(1):12-17. PubMed 12. Fisher ES, Wennberg DE, Stukel TA, Gottlieb DJ, Lucas FL, Pinder EL. The implications of regional variations in medicare spending. Part 1: The content, quality, and accessibility of care. Ann Intern Med. 2003;138(4):273-287. PubMed 13. Fisher ES, Wennberg DE, Stukel TA, Gottlieb DJ, Lucas FL, Pinder EL. The implications of regional variations in medicare spending. Part 2: Health outcomes and satisfaction with care. Ann Intern Med. 2003;138(4):288-298. PubMed 14. Lion KC, Wright DR, Spencer S, Zhou C, Del Beccaro M, Mangione-Smith R. Standardized clinical pathways for hospitalized children and outcomes. Pediatrics. 2016;137(4) e20151202. PubMed 15. Goodman DC. Unwarranted variation in pediatric medical care. Pediatr Clin North Am. 2009;56(4):745-755. PubMed 16. Baxter R, Taylor N, Kellar I, Lawton R. What methods are used to apply positive deviance within healthcare organisations? A systematic review. BMJ Qual Saf. 2016;25(3):190-201. PubMed
Physicians, researchers, and policymakers aspire to improve the value of healthcare, with reduced overall costs of care and improved outcomes. An important component of increasing healthcare costs in the United States is the rising cost of prescription medications, accounting for an estimated 17% of all spending in healthcare services.1 One potentially modifiable driver of low-value prescribing is poor awareness of medication cost.2 While displaying price to the ordering physician has reduced laboratory order volume and associated testing costs,3,4 applying cost transparency to medication ordering has produced variable results, perhaps reflecting conceptual differences in decision making regarding diagnosis and treatment.4-6
In this issue of the Journal of Hospital Medicine, Conway et al.7 performed a retrospective analysis applying interrupted times series models to measure the impact of passive cost display on the ordering frequency of 9 high-cost intravenous (IV) or inhaled medications that were identified as likely overused. For 7 of the IV medications, lower-cost oral alternatives were available; 2 study medications had no clear therapeutic alternatives. It was expected that lower-cost oral alternatives would have a concomitant increase in ordering rate as the order rate of the study medications decreased (eg, oral linezolid use would increase as IV linezolid use decreased). Order rate was the primary outcome, reported each week as treatment orders per 10,000 patient days, and was compared for both the pre- and postimplementation time periods. The particular methodology of segmented regressions allowed the research team to control for preintervention trends in medication ordering, as well as to analyze both immediate and delayed effects of the cost-display intervention. The research team framed the cost display as a passive approach. The intervention displayed average wholesale cost data and lower-cost oral alternatives on the ordering screen, which did not significantly reduce the ordering rate. Over the course of the study, outside influences led to 2 more active approaches to higher-cost medications, and Conway et al. wisely measured their effect as well. Specifically, the IV pantoprazole ordering rate decreased after restrictions secondary to a national medication shortage, and the oral voriconazole ordering rate decreased following an oncology order set change from oral voriconazole to oral posaconazole. These ordering-rate decreases were not temporally related to the implementation of the cost display intervention.
It is important to note several limitations of this study, some of which the authors discuss in the manuscript. Because 2 of the medications studied (eculizumab and calcitonin) do not have direct therapeutic alternatives, it is not surprising that price display alone would have no effect. The ordering providers who received this cost information had a more complex decision to make than they would in a scenario with a lower-cost alternative, essentially requiring them to ask “Does this patient need this class of medications at all?” rather than simply, “Is a lower-cost alternative appropriate?” Similarly, choosing medication alternatives that would require different routes of administration (ie, IV and oral) may have limited the effectiveness of a price intervention, given that factors such as illness severity also may influence the decision between IV and oral agents. Thus, the lack of an effect for the price display intervention for these specific medications may not be generalizable to all other medication decisions. Additionally, this manuscript offers limited data on the context in which the intervention was implemented and what adaptations, if any, were made based on early findings. The results may have varied greatly based on the visual design and how the cost display was presented within the electronic medical record. The wider organizational context may also have affected the intervention’s impact. A cost-display intervention appearing in isolation could understandably have a different impact, compared with an intervention within the context of a broader cost/value curriculum directed at house staff and faculty.
In summary, Conway et al. found that just displaying cost data did little to change prescribing patterns, but that more active approaches were quite efficacious. So where does this leave value-minded hospitalists looking to reduce overuse? Relatedly, what are the next steps for research and improvement science? We think there are 3 key strategic areas on which to focus. First, behavioral economics offers a critically important middle ground between the passive approaches studied here and more heavy-handed approaches that may limit provider autonomy, such as restricting drug use at the formulary.8 An improved choice architecture that presents the preferred higher-value option as the default selection may result in improved adoption of the high-value choice while also preserving provider autonomy and expertise required when clinical circumstances make the higher-cost drug the better choice.9,10 The second consideration is to minimize ethical tensions between cost displays that discourage use and a provider’s belief that a treatment is beneficial. Using available ethical frameworks for high-value care that engage both patient and societal concerns may help us choose and design interventions with more successful outcomes.11 Finally, research has shown that providers have poor knowledge of both cost and the relative benefits and harms of treatments and testing.12 Thus, the third opportunity for improvement is to provide appropriate clinical information (ie, relative therapeutic equivalency or adverse effects in alternative therapies) to support decision making at the point of order entry. Encouraging data already exists regarding how drug facts boxes can help patients understand benefits and side effects.13 A similar approach may aid physicians and may prove an easier task than improving patient understanding, given physicians’ substantial existing knowledge. These strategies may help guide providers to make a more informed value determination and obviate some ethical concerns related to clinical decisions based on cost alone. Despite their negative results, Conway et al.7 provided additional evidence that influencing complex decision making is not easy. However, we believe that continuing research into the factors that lead to successful value interventions has incredible potential for supporting high-value decision making in the future.
Disclosure
Nothing to report.
References
1. Kesselheim AS, Avorn J, Sarpatwari A. The high cost of prescription drugs in the United States: origins and prospects for reform. JAMA. 2016;316(8):858-871. PubMed 2. Allan GM, Lexchin J, Wiebe N. Physician awareness of drug cost: a systematic review. PLoS Med. 2007;4(9):e283. PubMed 3. Feldman LS, Shihab HM, Thiemann D, et al. Impact of providing fee data on laboratory test ordering: a controlled clinical trial. JAMA Intern Med. 2013;173(10):903-908. PubMed 4. Silvestri MT, Bongiovanni TR, Glover JG, Gross CP. Impact of price display on provider ordering: a systematic review. J Hosp Med. 2016;11(1):65-76. PubMed 5. Guterman JJ, Chernof BA, Mares B, Gross-Schulman SG, Gan PG, Thomas D. Modifying provider behavior: a low-tech approach to pharmaceutical ordering. J Gen Intern Med. 2002;17(10):792-796. PubMed 6. Goetz C, Rotman SR, Hartoularos G, Bishop TF. The effect of charge display on cost of care and physician practice behaviors: a systematic review. J Gen Intern Med. 2015;30(6):835-842. PubMed 7. Conway SJ, Brotman DJ, Merola D, et al. Impact of displaying inpatient pharmaceutical costs at the time of order entry: lessons from a tertiary care center. J Hosp Med. 2017;12(8):639-645. PubMed 8. Thaler RH, Sunstein CR. Nudge: improving decisions about health, wealth, and happiness. New Haven: Yale University Press: 2008. 9. Halpern SD, Ubel PA, Asch DA. Harnessing the power of default options to improve health care. N Engl J Med. 2007;357(13):1340-1344. PubMed 10. Dexter PR, Perkins S, Overhage JM, Maharry K, Kohler RB, McDonald CJ. A computerized reminder system to increase the use of preventive care for hospitalized patients. N Engl J Med. 2001;345(13):965-970. PubMed 11. DeCamp M, Tilburt JC. Ethics and high-value care. J Med Ethics. 2017;43(5):307-309. PubMed 12. Hoffmann TC, Del Mar C. Clinicians’ expectations of the benefits and harms of treatments, screening, and tests: a systematic review. JAMA Intern Med. 2017;177(3):407-419. PubMed 13. Schwartz LM, Woloshin S, Welch HG. Using a drug facts box to communicate drug benefits and harms: two randomized trials. Ann Intern Med. 2009;150(8):516-527. PubMed
Physicians, researchers, and policymakers aspire to improve the value of healthcare, with reduced overall costs of care and improved outcomes. An important component of increasing healthcare costs in the United States is the rising cost of prescription medications, accounting for an estimated 17% of all spending in healthcare services.1 One potentially modifiable driver of low-value prescribing is poor awareness of medication cost.2 While displaying price to the ordering physician has reduced laboratory order volume and associated testing costs,3,4 applying cost transparency to medication ordering has produced variable results, perhaps reflecting conceptual differences in decision making regarding diagnosis and treatment.4-6
In this issue of the Journal of Hospital Medicine, Conway et al.7 performed a retrospective analysis applying interrupted times series models to measure the impact of passive cost display on the ordering frequency of 9 high-cost intravenous (IV) or inhaled medications that were identified as likely overused. For 7 of the IV medications, lower-cost oral alternatives were available; 2 study medications had no clear therapeutic alternatives. It was expected that lower-cost oral alternatives would have a concomitant increase in ordering rate as the order rate of the study medications decreased (eg, oral linezolid use would increase as IV linezolid use decreased). Order rate was the primary outcome, reported each week as treatment orders per 10,000 patient days, and was compared for both the pre- and postimplementation time periods. The particular methodology of segmented regressions allowed the research team to control for preintervention trends in medication ordering, as well as to analyze both immediate and delayed effects of the cost-display intervention. The research team framed the cost display as a passive approach. The intervention displayed average wholesale cost data and lower-cost oral alternatives on the ordering screen, which did not significantly reduce the ordering rate. Over the course of the study, outside influences led to 2 more active approaches to higher-cost medications, and Conway et al. wisely measured their effect as well. Specifically, the IV pantoprazole ordering rate decreased after restrictions secondary to a national medication shortage, and the oral voriconazole ordering rate decreased following an oncology order set change from oral voriconazole to oral posaconazole. These ordering-rate decreases were not temporally related to the implementation of the cost display intervention.
It is important to note several limitations of this study, some of which the authors discuss in the manuscript. Because 2 of the medications studied (eculizumab and calcitonin) do not have direct therapeutic alternatives, it is not surprising that price display alone would have no effect. The ordering providers who received this cost information had a more complex decision to make than they would in a scenario with a lower-cost alternative, essentially requiring them to ask “Does this patient need this class of medications at all?” rather than simply, “Is a lower-cost alternative appropriate?” Similarly, choosing medication alternatives that would require different routes of administration (ie, IV and oral) may have limited the effectiveness of a price intervention, given that factors such as illness severity also may influence the decision between IV and oral agents. Thus, the lack of an effect for the price display intervention for these specific medications may not be generalizable to all other medication decisions. Additionally, this manuscript offers limited data on the context in which the intervention was implemented and what adaptations, if any, were made based on early findings. The results may have varied greatly based on the visual design and how the cost display was presented within the electronic medical record. The wider organizational context may also have affected the intervention’s impact. A cost-display intervention appearing in isolation could understandably have a different impact, compared with an intervention within the context of a broader cost/value curriculum directed at house staff and faculty.
In summary, Conway et al. found that just displaying cost data did little to change prescribing patterns, but that more active approaches were quite efficacious. So where does this leave value-minded hospitalists looking to reduce overuse? Relatedly, what are the next steps for research and improvement science? We think there are 3 key strategic areas on which to focus. First, behavioral economics offers a critically important middle ground between the passive approaches studied here and more heavy-handed approaches that may limit provider autonomy, such as restricting drug use at the formulary.8 An improved choice architecture that presents the preferred higher-value option as the default selection may result in improved adoption of the high-value choice while also preserving provider autonomy and expertise required when clinical circumstances make the higher-cost drug the better choice.9,10 The second consideration is to minimize ethical tensions between cost displays that discourage use and a provider’s belief that a treatment is beneficial. Using available ethical frameworks for high-value care that engage both patient and societal concerns may help us choose and design interventions with more successful outcomes.11 Finally, research has shown that providers have poor knowledge of both cost and the relative benefits and harms of treatments and testing.12 Thus, the third opportunity for improvement is to provide appropriate clinical information (ie, relative therapeutic equivalency or adverse effects in alternative therapies) to support decision making at the point of order entry. Encouraging data already exists regarding how drug facts boxes can help patients understand benefits and side effects.13 A similar approach may aid physicians and may prove an easier task than improving patient understanding, given physicians’ substantial existing knowledge. These strategies may help guide providers to make a more informed value determination and obviate some ethical concerns related to clinical decisions based on cost alone. Despite their negative results, Conway et al.7 provided additional evidence that influencing complex decision making is not easy. However, we believe that continuing research into the factors that lead to successful value interventions has incredible potential for supporting high-value decision making in the future.
Disclosure
Nothing to report.
References
1. Kesselheim AS, Avorn J, Sarpatwari A. The high cost of prescription drugs in the United States: origins and prospects for reform. JAMA. 2016;316(8):858-871. PubMed 2. Allan GM, Lexchin J, Wiebe N. Physician awareness of drug cost: a systematic review. PLoS Med. 2007;4(9):e283. PubMed 3. Feldman LS, Shihab HM, Thiemann D, et al. Impact of providing fee data on laboratory test ordering: a controlled clinical trial. JAMA Intern Med. 2013;173(10):903-908. PubMed 4. Silvestri MT, Bongiovanni TR, Glover JG, Gross CP. Impact of price display on provider ordering: a systematic review. J Hosp Med. 2016;11(1):65-76. PubMed 5. Guterman JJ, Chernof BA, Mares B, Gross-Schulman SG, Gan PG, Thomas D. Modifying provider behavior: a low-tech approach to pharmaceutical ordering. J Gen Intern Med. 2002;17(10):792-796. PubMed 6. Goetz C, Rotman SR, Hartoularos G, Bishop TF. The effect of charge display on cost of care and physician practice behaviors: a systematic review. J Gen Intern Med. 2015;30(6):835-842. PubMed 7. Conway SJ, Brotman DJ, Merola D, et al. Impact of displaying inpatient pharmaceutical costs at the time of order entry: lessons from a tertiary care center. J Hosp Med. 2017;12(8):639-645. PubMed 8. Thaler RH, Sunstein CR. Nudge: improving decisions about health, wealth, and happiness. New Haven: Yale University Press: 2008. 9. Halpern SD, Ubel PA, Asch DA. Harnessing the power of default options to improve health care. N Engl J Med. 2007;357(13):1340-1344. PubMed 10. Dexter PR, Perkins S, Overhage JM, Maharry K, Kohler RB, McDonald CJ. A computerized reminder system to increase the use of preventive care for hospitalized patients. N Engl J Med. 2001;345(13):965-970. PubMed 11. DeCamp M, Tilburt JC. Ethics and high-value care. J Med Ethics. 2017;43(5):307-309. PubMed 12. Hoffmann TC, Del Mar C. Clinicians’ expectations of the benefits and harms of treatments, screening, and tests: a systematic review. JAMA Intern Med. 2017;177(3):407-419. PubMed 13. Schwartz LM, Woloshin S, Welch HG. Using a drug facts box to communicate drug benefits and harms: two randomized trials. Ann Intern Med. 2009;150(8):516-527. PubMed
Erik R. Hoefgen, MD, MS, Department of Pediatrics, Cincinnati Children’s Hospital Medical Center, 3333 Burnet Avenue, MLC 9016, Cincinnati, OH 45229. Telephone: 513-636-6596; Fax: 513-803-9244; E-mail: Erik.hoefgen@cchmc.org
Content Gating
Gated (full article locked unless allowed per User)
The transition from hospital to home can be overwhelming for caregivers.1 Stress of hospitalization coupled with the expectation of families to execute postdischarge care plans make understandable discharge communication critical. Communication failures, inadequate education, absence of caregiver confidence, and lack of clarity regarding care plans may prohibit smooth transitions and lead to adverse postdischarge outcomes.2-4
Health literacy plays a pivotal role in caregivers’ capacity to navigate the healthcare system, comprehend, and execute care plans. An estimated 90 million Americans have limited health literacy that may negatively impact the provision of safe and quality care5,6 and be a risk factor for poor outcomes, including increased emergency department (ED) utilization and readmission rates.7-9 Readability strongly influences the effectiveness of written materials.10 However, written medical information for patients and families are frequently between the 10th and 12th grade reading levels; more than 75% of all pediatric health information is written at or above 10th grade reading level.11 Government agencies recommend between a 6th and 8th grade reading level, for written material;5,12,13 written discharge instructions have been identified as an important quality metric for hospital-to-home transitions.14-16
At our center, we found that discharge instructions were commonly written at high reading levels and often incomplete.17 Poor discharge instructions may contribute to increased readmission rates and unnecessary ED visits.9,18 Our global aim targeted improved health-literate written information, including understandability and completeness.
Our specific aim was to increase the percentage of discharge instructions written at or below the 7th grade level for hospital medicine (HM) patients on a community hospital pediatric unit from 13% to 80% in 6 months.
METHODS
Context
The improvement work took place at a 42-bed inpatient pediatric unit at a community satellite of our large, urban, academic hospital. The unit is staffed by medical providers including attendings, fellows, nurse practitioners (NPs), and senior pediatric residents, and had more than 1000 HM discharges in fiscal year 2016. Children with common general pediatric diagnoses are admitted to this service; postsurgical patients are not admitted primarily to the HM service. In Cincinnati, the neighborhood-level high school drop-out rates are as high as 64%.19 Discharge instructions are written by medical providers in the electronic health record (EHR). A printed copy is given to families and verbally reviewed by a bedside nurse prior to discharge. Quality improvement (QI) efforts focused on discharge instructions were ignited by a prior review of 200 discharge instructions that showed they were difficult to read (median reading level of 10th grade), poorly understandable (36% of instructions met the threshold of understandability as measured by the Patient Education Materials Assessment Tool20) and were missing key elements of information.17
Improvement Team
The improvement team consisted of 4 pediatric hospitalists, 2 NPs, 1 nurse educator with health literacy expertise, 1 pediatric resident, 1 fourth-year medical student, 1 QI consultant, and 2 parents who had first-hand experience on the HM service. The improvement team observed the discharge process, including roles of the provider, nurse and family, outlined a process map, and created a modified failure mode and effect analysis.21 Prior to our work, discharge instructions written by providers often occurred as a last step, and the content was created as free text or from nonstandardized templates. Key drivers that informed interventions were determined and revised over time (Figure 1). The study was reviewed by our institutional review board and deemed not human subjects research.
Figure 1Improvement Activities
Key drivers were identified, and interventions were executed using Plan-Do Study-Act cycles.22 The key drivers thought to be critical for the success of the QI efforts were family engagement; standardization of discharge instructions; medical staff engagement; and audit and feedback of data. The corresponding interventions were as follows:
Family Engagement
Understanding the discharge information families desired. Prior to testing, 10 families admitted to the HM service were asked about the discharge experience. We asked families about information they wanted in written discharge instructions: 1) reasons to call your primary doctor or return to the hospital; 2) when to see your primary doctor for a follow-up visit; 3) the phone number to reach your child’s doctor; 4) more information about why your child was admitted; 5) information about new medications; and 6) what to do to help your child continue to recover at home.
Development of templates. We engaged families throughout the process of creating general and disease-specific discharge templates. After a specific template was created and reviewed by the parents on our team, it was sent to members of the institutional Patient Education Committee, which includes parents and local health literacy experts, to review and critique. Feedback from the reviewers was incorporated into the templates prior to use in the EHR.
Postdischarge phone calls.A convenience sample of families discharged from the satellite campus was called 24 to 48 hours after discharge over a 2-week period in January, 2016. A member of our improvement team solicited feedback from families about the quality of the discharge instructions. Families were asked if discharge instructions were reviewed with them prior to going home, if they were given a copy of the instructions, how they would rate the ability to read and use the information, and if there were additional pieces of information that would have improved the instructions.
Standardization of Instructions
Education. A presentation was created and shared with medical providers; it was re-disseminated monthly to new residents rotating onto the service and to the attendings, fellows, and NPs scheduled for shifts during the month. This education continued for the duration of the study. The presentation included the definition of health literacy, scope of the problem, examples of poorly written discharge instructions, and tips on how to write readable and understandable instructions. Laminated cards that included tips on how to write instructions were also placed on work stations.
Figure 2Creation of discharge instruction templates in the EHR.A general discharge instruction template that was initially created and tested in the EHR (Figure 2) included text written below the 7th grade and employed 14 point font, bolded words for emphasis, and lists with bullet points. Asterisks were used to indicate where providers needed to include patient-specific information. The sections included in the general template were informed by feedback from providers and parents prior to testing, parents on the improvement team, and parents of patients admitted to our satellite campus. The sections reflect components critical to successful postdischarge care: discharge diagnosis and its brief description, postdischarge care information, new medications, signs and symptoms that would warrant escalation of care to the patient’s primary care provider or the ED, and follow-up instructions and contact information for the patent’s primary care doctor.
While the general template was an important first step, the content relied heavily on free text by providers, which could still lead to instructions written at a high reading level. Thus, disease-specific discharge instruction templates were created with prepopulated information that was written at a reading level at or below 7th grade level (Figure 2). The diseases were prioritized based on the most common diagnoses on our HM service. Each template included information under each of the subheadings noted in the general template. Twelve disease-specific templates were tested and ultimately embedded in the EHR; the general template remained for use when the discharge diagnosis was not covered by a disease-specific template.
Medical Staff Engagement
Previously described tests of change also aimed to enhance staff engagement. These included frequent e-mails, discussion of the QI efforts at specific team meetings, and the creation of visual cues posted at computer work stations, which prompted staff to begin to work on discharge instructions soon after admission.
Audit and Feedback of Data
Weekly phone calls. One team updated clinicians through a regularly scheduled bi-weekly phone conference. The phone conference was established prior to our work and was designed to relay pertinent information to attendings and NPs who work at the satellite hospital. During the phone conferences, clinicians were notified of current performance on discharge instruction readability and specific tests of change for the week. Additionally, providers gave feedback about the improvement efforts. These updates continued for the first 6 months of the project until sustained improvements were observed.
E-mails. Weekly e-mails were sent to all providers scheduled for clinical time at the satellite campus. The e-mail contained information on current tests of change, a list of discharge instruction templates that were available in the EHR, and the annotated run chart illustrating readability levels over time.
Additionally, individual e-mails were sent to each provider after review of the written discharge instructions for the week. Providers were given information on the number of discharge instructions they personally composed, the percentage of those instructions that were written at or below 7th grade level, and specific feedback on how their written instructions could be improved. We also encouraged feedback from each provider to better identify barriers to achieving our goal.
Study of the Interventions
Baseline data included a review of all instructions for patients discharged from the satellite campus from the end of April 2015 through mid-September 2015. The time period for testing of interventions during the fall and winter months allowed for rapid cycle learning due to higher patient census and predictability of admissions for specific diagnosis (ie, asthma and bronchiolitis). An automated report was generated from the EHR weekly with specific demographics and identifiers for patient discharged over the past 7 days, including patient age, gender, length of stay, discharge diagnosis, and insurance classification. Data was collected during the intervention period via structured review of the discharge instructions in the EHR by the principal investigator or a trained research coordinator. Discharge instructions for medically cleared mental health patients admitted to hospital medicine while awaiting psychiatric bed availability and patients and parents who were non-English speaking were excluded from review. All other instructions for patients discharged from the HM service at our Liberty Campus were included for review.
Measures
Readability, our primary measure of interest, was calculated using the mean score from the following formulas: Flesch Kincaid Grade Level,23 Simple Measure of Gobbledygook Index,24 Coleman-Liau Index,25 Gunning-Fog Index,26 and Automated Readability Index27 by means of an online platform (https://readability-score.com).28 This platform was chosen because it incorporated a variety of formulas, was user-friendly, and required minimal data cleaning. Each of the readability formulas have been used to assesses readability of health information given to patients and families.29,30 The threshold of 7th grade is in alignment with our institutional policy for educational materials and with recommendations from several government agencies.5,12
Analysis
A statistical process control p-chart was used to analyze our primary measure of readability, dichotomized as percent discharge instructions written at or below 7th grade level. Run charts were used to follow mean reading level of discharge instructions and our process measure of percent of discharge instruction written with a general or disease-specific standardized template. Run chart and control chart rules for identifying special cause were used for midline shifts.31
Table
RESULTS
The Table includes the demographic and clinical information of patients included in our analyses. Through sequential interventions, the percentage of discharge instructions written at or below 7th grade readability level increased from a mean of 13% to more than 80% in 3 months (Figure 3). Furthermore, the mean was sustained above 90% for 10 months and at 98% for the last 4 months. The use of 1 of the 13 EHR templates increased from 0% to 96% and was associated with the largest impact on the overall improvements (Supplemental Figure 1). Additionally, the average reading level of the discharge instructions decreased from 10th grade to 6th grade level (Supplemental Figure 2).
Figure 3
Qualitative comments from providers about the discharge instructions included:
“Are these [discharge instructions] available at base?? Great resource for interns.” “These [discharge] instructions make the [discharge] process so easy!!! Love these...” “Also feel like they have helped my discharge teaching in the room!”
Qualitative comments from families postdischarge included: “I thought the instructions were very clear and easy to read. I especially thought that highlighting the important areas really helped.” “I think this form looks great, and I really like the idea of having your child’s name on it.”
DISCUSSION
Through sequential Plan-Do Study-Act cycles, we increased the percentage of discharge instructions written at or below 7th grade reading level from 13% to 98%. Our most impactful intervention was the creation and dissemination of standardized disease-specific discharge instruction templates. Our findings complement evidence in the adult and pediatric literature that the use of standardized, disease-specific discharge instruction templates may improve readability of instructions.32,33 And, while quality improvement efforts have been employed to improve the discharge process for patients,34-36 this is the first study in the inpatient setting that, to our knowledge, specifically addresses discharge instructions using quality improvement methods.
Our work targeted the critical intersection between individual health literacy, an individual’s capacity to acquire, interpret, and use health information, and the necessary changes needed within our healthcare system to ensure that appropriately written instructions are given to patients and families.17,37 Our efforts focused on improving discharge instructions answer the call to consider health literacy a modifiable clinical risk factor.37 Furthermore, we address the 6 aims for quality healthcare delivery: 1) safe, timely, efficient and equitable delivery of care through the creation and dissemination of standardized instructions that are written at the appropriate reading level for families to ease hospital-to-home transitions and streamline the workflow of medical providers; 2) effective education of medical providers on health literacy concepts; and 3) family-centeredness through the involvement of families in our QI efforts. While previous QI efforts to improve hospital-to-home transitions have focused on medication reconciliation, communication with primary care physicians, follow-up appointments, and timely discharges of patients, none have specifically focused on the quality of discharge instructions.34-36
Most physicians do not receive education about how to write information that is readable and understandable; more than half of providers desired more education in this area.38 Furthermore, pediatric providers may overestimate parental health literacy levels,39 which may contribute to variability in the readability of written health materials. While education alone can contribute to a provider’s ability to create readable instructions, we note the improvement after the introduction of disease templates to demonstrate the importance of workflow-integrated higher reliability interventions to sustain improvements.
Our baseline poor readability rates were due to limited knowledge by frontline providers composing the instructions and a system in which an important element for successful hospital-to-home transitions was not tackled until patients were ready for discharge. Streamlining of the discharge process, including the creation of discharge instructions, may lead to improved efficiency, fewer discrepancies, more effective communication, and an enhanced family experience. Moreover, the success of our improvement work was due to key stakeholders, including parents, being a part of the team and the notable buy-in from providers.
Our work was not without limitations. We excluded non-English speaking families from the study. We were unable to measure reading level of our population directly and instead based our goals on national estimates. Our primary measure was readability, which is only 1 piece contributing to quality discharge instructions. Understandability and actionability are also important considerations; 17,20,29,40 however, improvements in these areas were limited by our design options within the EHR. Our efforts focused on children with common general pediatric diagnoses, and it is unclear how our interventions would generalize to medically complex patients with more volume of information to communicate at discharge and with uncommon diagnoses that are less readily incorporated into standardized templates. Relatedly, our work occurred at the satellite campus of our tertiary care center and may not represent generalizable material or methods to implement templates at our main campus location or at other hospitals. To begin to better understand this, we have spread to HM patients at our main campus, including medically complex patients with technology dependence and/or neurological impairments. Standardized, disease-specific templates most relevant to this population as well as several patient specific templates, for those with frequent readmissions due to medical complexity, have been created and are actively being tested.
CONCLUSION
In conclusion, in using interventions targeted at standardization of discharge instructions and timely feedback to staff, we saw rapid, dramatic, and sustained improvement in the readability of discharge instructions. Next steps include adaptation and spread to other patient populations and care teams, collaborations with other centers, and assessing the impact of effectively written discharge instructions on patient outcomes, such as adverse drug events, readmission rates, and family experience.
Disclosure
No external funding was secured for this study. Dr. Brady is supported by a Patient-Centered Outcomes Research Mentored Clinical Investigator Award from the Agency for Healthcare Research and Quality, Award Number K08HS023827. The content is solely the responsibility of the authors and does not necessarily represent the official views of the funding organizations. The funding organization had no role in the design, preparation, review, or approval of this paper; nor the decision to submit the manuscript for publication. The authors have no financial relationships relevant to this article to disclose.
1. Solan LG, Beck AF, Brunswick SA, et al. The family perspective on hospital to home transitions: a qualitative study. Pediatrics. 2015;136:e1539-e1549. PubMed 2. Engel KG, Buckley BA, Forth VE, et al. Patient understanding of emergency department discharge instructions: where are knowledge deficits greatest? Acad Emerg Med. 2012;19:E1035-E1044. PubMed 3. Ashbrook L, Mourad M, Sehgal N. Communicating discharge instructions to patients: a survey of nurse, intern, and hospitalist practices. J Hosp Med. 2013;8: 36-41. PubMed 4. Kripalani S, Jacobson TA, Mugalla IC, Cawthon CR, Niesner KJ, Vaccarino V. Health literacy and the quality of physician-patient communication during hospitalization. J Hosp Med. 2010;5:269-275. PubMed 5. Institute of Medicine Committee on Health Literacy. Kindig D, Alfonso D, Chudler E, et al, eds. Health Literacy: A Prescription to End Confusion. Washington, DC: National Academies Press; 2004. 6. Yin HS, Johnson M, Mendelsohn AL, Abrams MA, Sanders LM, Dreyer BP. The health literacy of parents in the United States: a nationally representative study. Pediatrics. 2009;124(suppl 3):S289-S298. PubMed 7. Rak EC, Hooper SR, Belsante MJ, et al. Caregiver word reading literacy and health outcomes among children treated in a pediatric nephrology practice. Clin Kid J. 2016;9:510-515. PubMed 8. Morrison AK, Schapira MM, Gorelick MH, Hoffmann RG, Brousseau DC. Low caregiver health literacy is associated with higher pediatric emergency department use and nonurgent visits. Acad Pediatr. 2014;14:309-314. PubMed 9. Howard-Anderson J, Busuttil A, Lonowski S, Vangala S, Afsar-Manesh N. From discharge to readmission: Understanding the process from the patient perspective. J Hosp Med. 2016;11:407-412. PubMed 10. Doak CC, Doak LG, Root JH. Teaching Patients with Low Literacy Skills. 2nd ed. Philadelphia PA: J.B. Lippincott; 1996. PubMed 11. Berkman ND, Sheridan SL, Donahue KE, et al. Health literacy interventions and outcomes: an updated systematic review. Evid Rep/Technol Assess. 2011;199:1-941. PubMed 12. Prevention CfDCa. Health Literacy for Public Health Professionals. In: Prevention CfDCa, ed. Atlanta, GA2009. 13. “What Did the Doctor Say?” Improving Health Literacy to Protect Patient Safety. Oakbrook Terrace, IL: The Joint Commission, 2007. 14. Desai AD, Burkhart Q, Parast L, et al. Development and pilot testing of caregiver- reported pediatric quality measures for transitions between sites of care. Acad Pediatr. 2016;16:760-769. PubMed 15. Leyenaar JK, Desai AD, Burkhart Q, et al. Quality measures to assess care transitions for hospitalized children. Pediatrics. 2016;138(2). PubMed 16. Akinsola B, Cheng J, Zmitrovich A, Khan N, Jain S. Improving discharge instructions in a pediatric emergency department: impact of a quality initiative. Pediatr Emerg Care. 2017;33:10-13. PubMed 17. Unaka NI, Statile AM, Haney J, Beck AF, Brady PW, Jerardi K. Assessment of the readability, understandability and completeness of pediatric hospital medicine discharge instructions J Hosp Med. In press. PubMed 18. Stella SA, Allyn R, Keniston A, et al. Postdischarge problems identified by telephone calls to an advice line. J Hosp Med. 2014;9:695-699. PubMed 19. Maloney M, Auffrey C. The social areas of Cincinnati. 20. The Patient Education Materials Assessment Tool (PEMAT) and User’s Guide: An Instrument To Assess the Understandability and Actionability of Print and Audiovisual Patient Education Materials. Available at: http://www.ahrq.gov/ professionals/prevention-chronic-care/improve/self-mgmt/pemat/index.html. Accessed November 27, 2013. 21. Cohen MR, Senders J, Davis NM. Failure mode and effects analysis: a novel approach to avoiding dangerous medication errors and accidents. Hosp Pharm. 1994;29:319-30. PubMed 22. Langley GJ, Moen R, Nolan KM, Nolan TW, Norman CL, Provost LP. The Improvement Guide: A Practical Approach to Enhancing Organizational Performance. San Franciso, CA: John Wiley & Sons; 2009. 23. Flesch R. A new readability yardstick. J Appl Psychol. 1948;32:221-233. PubMed 24. McLaughlin GH. SMOG grading-a new readability formula. J Reading. 1969;12:639-646. 25. Coleman M, Liau TL. A computer readability formula designed for machine scoring. J Appl Psych. 1975;60:283. 26. Gunning R. {The Technique of Clear Writing}. 1952. 27. Smith EA, Senter R. Automated readability index. AMRL-TR Aerospace Medical Research Laboratories (6570th) 1967:1. PubMed 28. How readable is your writing. 2011. https://readability-score.com. Accessed September 23, 2016. An Official Publication of the Society of Hospital Medicine Journal of Hospital Medicine Vol 12 | No 7 | July 2017 557 Improving Readability of Discharge Instructions | Unaka et al 29. Yin HS, Gupta RS, Tomopoulos S, et al. Readability, suitability, and characteristics of asthma action plans: examination of factors that may impair understanding. Pediatrics. 2013;131:e116-E126. PubMed 30. Brigo F, Otte WM, Igwe SC, Tezzon F, Nardone R. Clearly written, easily comprehended? The readability of websites providing information on epilepsy. Epilepsy Behav. 2015;44:35-39. PubMed 31. Benneyan JC. Use and interpretation of statistical quality control charts. Int J Qual Health Care. 1998;10:69-73. PubMed 32. Mueller SK, Giannelli K, Boxer R, Schnipper JL. Readability of patient discharge instructions with and without the use of electronically available disease-specific templates. J Am Med Inform Assoc. 2015;22:857-863. PubMed 33. Lauster CD, Gibson JM, DiNella JV, DiNardo M, Korytkowski MT, Donihi AC. Implementation of standardized instructions for insulin at hospital discharge. J Hosp Med. 2009;4:E41-E42. PubMed 34. Tuso P, Huynh DN, Garofalo L, et al. The readmission reduction program of Kaiser Permanente Southern California-knowledge transfer and performance improvement. Perm J. 2013;17:58-63. PubMed 35. White CM, Statile AM, White DL, et al. Using quality improvement to optimise paediatric discharge efficiency. BMJ Qual Saf. 2014;23:428-436. PubMed 36. Mussman GM, Vossmeyer MT, Brady PW, Warrick DM, Simmons JM, White CM. Improving the reliability of verbal communication between primary care physicians and pediatric hospitalists at hospital discharge. J Hosp Med. 2015;10:574- 580. PubMed 37. Rothman RL, Yin HS, Mulvaney S, Co JP, Homer C, Lannon C. Health literacy and quality: focus on chronic illness care and patient safety. Pediatrics 2009;124(suppl 3):S315-S326. PubMed 38. Turner T, Cull WL, Bayldon B, et al. Pediatricians and health literacy: descriptive results from a national survey. Pediatrics. 2009;124(suppl 3):S299-S305. PubMed 39. Harrington KF, Haven KM, Bailey WC, Gerald LB. Provider perceptions of parent health literacy and effect on asthma treatment: recommendations and instructions. Pediatr Allergy immunol Pulmonol. 2013;26:69-75. PubMed 40. Yin HS, Parker RM, Wolf MS, et al. Health literacy assessment of labeling of pediatric nonprescription medications: examination of characteristics that may impair parent understanding. Acad Pediatr. 2012;12:288-296. PubMed
The transition from hospital to home can be overwhelming for caregivers.1 Stress of hospitalization coupled with the expectation of families to execute postdischarge care plans make understandable discharge communication critical. Communication failures, inadequate education, absence of caregiver confidence, and lack of clarity regarding care plans may prohibit smooth transitions and lead to adverse postdischarge outcomes.2-4
Health literacy plays a pivotal role in caregivers’ capacity to navigate the healthcare system, comprehend, and execute care plans. An estimated 90 million Americans have limited health literacy that may negatively impact the provision of safe and quality care5,6 and be a risk factor for poor outcomes, including increased emergency department (ED) utilization and readmission rates.7-9 Readability strongly influences the effectiveness of written materials.10 However, written medical information for patients and families are frequently between the 10th and 12th grade reading levels; more than 75% of all pediatric health information is written at or above 10th grade reading level.11 Government agencies recommend between a 6th and 8th grade reading level, for written material;5,12,13 written discharge instructions have been identified as an important quality metric for hospital-to-home transitions.14-16
At our center, we found that discharge instructions were commonly written at high reading levels and often incomplete.17 Poor discharge instructions may contribute to increased readmission rates and unnecessary ED visits.9,18 Our global aim targeted improved health-literate written information, including understandability and completeness.
Our specific aim was to increase the percentage of discharge instructions written at or below the 7th grade level for hospital medicine (HM) patients on a community hospital pediatric unit from 13% to 80% in 6 months.
METHODS
Context
The improvement work took place at a 42-bed inpatient pediatric unit at a community satellite of our large, urban, academic hospital. The unit is staffed by medical providers including attendings, fellows, nurse practitioners (NPs), and senior pediatric residents, and had more than 1000 HM discharges in fiscal year 2016. Children with common general pediatric diagnoses are admitted to this service; postsurgical patients are not admitted primarily to the HM service. In Cincinnati, the neighborhood-level high school drop-out rates are as high as 64%.19 Discharge instructions are written by medical providers in the electronic health record (EHR). A printed copy is given to families and verbally reviewed by a bedside nurse prior to discharge. Quality improvement (QI) efforts focused on discharge instructions were ignited by a prior review of 200 discharge instructions that showed they were difficult to read (median reading level of 10th grade), poorly understandable (36% of instructions met the threshold of understandability as measured by the Patient Education Materials Assessment Tool20) and were missing key elements of information.17
Improvement Team
The improvement team consisted of 4 pediatric hospitalists, 2 NPs, 1 nurse educator with health literacy expertise, 1 pediatric resident, 1 fourth-year medical student, 1 QI consultant, and 2 parents who had first-hand experience on the HM service. The improvement team observed the discharge process, including roles of the provider, nurse and family, outlined a process map, and created a modified failure mode and effect analysis.21 Prior to our work, discharge instructions written by providers often occurred as a last step, and the content was created as free text or from nonstandardized templates. Key drivers that informed interventions were determined and revised over time (Figure 1). The study was reviewed by our institutional review board and deemed not human subjects research.
Figure 1Improvement Activities
Key drivers were identified, and interventions were executed using Plan-Do Study-Act cycles.22 The key drivers thought to be critical for the success of the QI efforts were family engagement; standardization of discharge instructions; medical staff engagement; and audit and feedback of data. The corresponding interventions were as follows:
Family Engagement
Understanding the discharge information families desired. Prior to testing, 10 families admitted to the HM service were asked about the discharge experience. We asked families about information they wanted in written discharge instructions: 1) reasons to call your primary doctor or return to the hospital; 2) when to see your primary doctor for a follow-up visit; 3) the phone number to reach your child’s doctor; 4) more information about why your child was admitted; 5) information about new medications; and 6) what to do to help your child continue to recover at home.
Development of templates. We engaged families throughout the process of creating general and disease-specific discharge templates. After a specific template was created and reviewed by the parents on our team, it was sent to members of the institutional Patient Education Committee, which includes parents and local health literacy experts, to review and critique. Feedback from the reviewers was incorporated into the templates prior to use in the EHR.
Postdischarge phone calls.A convenience sample of families discharged from the satellite campus was called 24 to 48 hours after discharge over a 2-week period in January, 2016. A member of our improvement team solicited feedback from families about the quality of the discharge instructions. Families were asked if discharge instructions were reviewed with them prior to going home, if they were given a copy of the instructions, how they would rate the ability to read and use the information, and if there were additional pieces of information that would have improved the instructions.
Standardization of Instructions
Education. A presentation was created and shared with medical providers; it was re-disseminated monthly to new residents rotating onto the service and to the attendings, fellows, and NPs scheduled for shifts during the month. This education continued for the duration of the study. The presentation included the definition of health literacy, scope of the problem, examples of poorly written discharge instructions, and tips on how to write readable and understandable instructions. Laminated cards that included tips on how to write instructions were also placed on work stations.
Figure 2Creation of discharge instruction templates in the EHR.A general discharge instruction template that was initially created and tested in the EHR (Figure 2) included text written below the 7th grade and employed 14 point font, bolded words for emphasis, and lists with bullet points. Asterisks were used to indicate where providers needed to include patient-specific information. The sections included in the general template were informed by feedback from providers and parents prior to testing, parents on the improvement team, and parents of patients admitted to our satellite campus. The sections reflect components critical to successful postdischarge care: discharge diagnosis and its brief description, postdischarge care information, new medications, signs and symptoms that would warrant escalation of care to the patient’s primary care provider or the ED, and follow-up instructions and contact information for the patent’s primary care doctor.
While the general template was an important first step, the content relied heavily on free text by providers, which could still lead to instructions written at a high reading level. Thus, disease-specific discharge instruction templates were created with prepopulated information that was written at a reading level at or below 7th grade level (Figure 2). The diseases were prioritized based on the most common diagnoses on our HM service. Each template included information under each of the subheadings noted in the general template. Twelve disease-specific templates were tested and ultimately embedded in the EHR; the general template remained for use when the discharge diagnosis was not covered by a disease-specific template.
Medical Staff Engagement
Previously described tests of change also aimed to enhance staff engagement. These included frequent e-mails, discussion of the QI efforts at specific team meetings, and the creation of visual cues posted at computer work stations, which prompted staff to begin to work on discharge instructions soon after admission.
Audit and Feedback of Data
Weekly phone calls. One team updated clinicians through a regularly scheduled bi-weekly phone conference. The phone conference was established prior to our work and was designed to relay pertinent information to attendings and NPs who work at the satellite hospital. During the phone conferences, clinicians were notified of current performance on discharge instruction readability and specific tests of change for the week. Additionally, providers gave feedback about the improvement efforts. These updates continued for the first 6 months of the project until sustained improvements were observed.
E-mails. Weekly e-mails were sent to all providers scheduled for clinical time at the satellite campus. The e-mail contained information on current tests of change, a list of discharge instruction templates that were available in the EHR, and the annotated run chart illustrating readability levels over time.
Additionally, individual e-mails were sent to each provider after review of the written discharge instructions for the week. Providers were given information on the number of discharge instructions they personally composed, the percentage of those instructions that were written at or below 7th grade level, and specific feedback on how their written instructions could be improved. We also encouraged feedback from each provider to better identify barriers to achieving our goal.
Study of the Interventions
Baseline data included a review of all instructions for patients discharged from the satellite campus from the end of April 2015 through mid-September 2015. The time period for testing of interventions during the fall and winter months allowed for rapid cycle learning due to higher patient census and predictability of admissions for specific diagnosis (ie, asthma and bronchiolitis). An automated report was generated from the EHR weekly with specific demographics and identifiers for patient discharged over the past 7 days, including patient age, gender, length of stay, discharge diagnosis, and insurance classification. Data was collected during the intervention period via structured review of the discharge instructions in the EHR by the principal investigator or a trained research coordinator. Discharge instructions for medically cleared mental health patients admitted to hospital medicine while awaiting psychiatric bed availability and patients and parents who were non-English speaking were excluded from review. All other instructions for patients discharged from the HM service at our Liberty Campus were included for review.
Measures
Readability, our primary measure of interest, was calculated using the mean score from the following formulas: Flesch Kincaid Grade Level,23 Simple Measure of Gobbledygook Index,24 Coleman-Liau Index,25 Gunning-Fog Index,26 and Automated Readability Index27 by means of an online platform (https://readability-score.com).28 This platform was chosen because it incorporated a variety of formulas, was user-friendly, and required minimal data cleaning. Each of the readability formulas have been used to assesses readability of health information given to patients and families.29,30 The threshold of 7th grade is in alignment with our institutional policy for educational materials and with recommendations from several government agencies.5,12
Analysis
A statistical process control p-chart was used to analyze our primary measure of readability, dichotomized as percent discharge instructions written at or below 7th grade level. Run charts were used to follow mean reading level of discharge instructions and our process measure of percent of discharge instruction written with a general or disease-specific standardized template. Run chart and control chart rules for identifying special cause were used for midline shifts.31
Table
RESULTS
The Table includes the demographic and clinical information of patients included in our analyses. Through sequential interventions, the percentage of discharge instructions written at or below 7th grade readability level increased from a mean of 13% to more than 80% in 3 months (Figure 3). Furthermore, the mean was sustained above 90% for 10 months and at 98% for the last 4 months. The use of 1 of the 13 EHR templates increased from 0% to 96% and was associated with the largest impact on the overall improvements (Supplemental Figure 1). Additionally, the average reading level of the discharge instructions decreased from 10th grade to 6th grade level (Supplemental Figure 2).
Figure 3
Qualitative comments from providers about the discharge instructions included:
“Are these [discharge instructions] available at base?? Great resource for interns.” “These [discharge] instructions make the [discharge] process so easy!!! Love these...” “Also feel like they have helped my discharge teaching in the room!”
Qualitative comments from families postdischarge included: “I thought the instructions were very clear and easy to read. I especially thought that highlighting the important areas really helped.” “I think this form looks great, and I really like the idea of having your child’s name on it.”
DISCUSSION
Through sequential Plan-Do Study-Act cycles, we increased the percentage of discharge instructions written at or below 7th grade reading level from 13% to 98%. Our most impactful intervention was the creation and dissemination of standardized disease-specific discharge instruction templates. Our findings complement evidence in the adult and pediatric literature that the use of standardized, disease-specific discharge instruction templates may improve readability of instructions.32,33 And, while quality improvement efforts have been employed to improve the discharge process for patients,34-36 this is the first study in the inpatient setting that, to our knowledge, specifically addresses discharge instructions using quality improvement methods.
Our work targeted the critical intersection between individual health literacy, an individual’s capacity to acquire, interpret, and use health information, and the necessary changes needed within our healthcare system to ensure that appropriately written instructions are given to patients and families.17,37 Our efforts focused on improving discharge instructions answer the call to consider health literacy a modifiable clinical risk factor.37 Furthermore, we address the 6 aims for quality healthcare delivery: 1) safe, timely, efficient and equitable delivery of care through the creation and dissemination of standardized instructions that are written at the appropriate reading level for families to ease hospital-to-home transitions and streamline the workflow of medical providers; 2) effective education of medical providers on health literacy concepts; and 3) family-centeredness through the involvement of families in our QI efforts. While previous QI efforts to improve hospital-to-home transitions have focused on medication reconciliation, communication with primary care physicians, follow-up appointments, and timely discharges of patients, none have specifically focused on the quality of discharge instructions.34-36
Most physicians do not receive education about how to write information that is readable and understandable; more than half of providers desired more education in this area.38 Furthermore, pediatric providers may overestimate parental health literacy levels,39 which may contribute to variability in the readability of written health materials. While education alone can contribute to a provider’s ability to create readable instructions, we note the improvement after the introduction of disease templates to demonstrate the importance of workflow-integrated higher reliability interventions to sustain improvements.
Our baseline poor readability rates were due to limited knowledge by frontline providers composing the instructions and a system in which an important element for successful hospital-to-home transitions was not tackled until patients were ready for discharge. Streamlining of the discharge process, including the creation of discharge instructions, may lead to improved efficiency, fewer discrepancies, more effective communication, and an enhanced family experience. Moreover, the success of our improvement work was due to key stakeholders, including parents, being a part of the team and the notable buy-in from providers.
Our work was not without limitations. We excluded non-English speaking families from the study. We were unable to measure reading level of our population directly and instead based our goals on national estimates. Our primary measure was readability, which is only 1 piece contributing to quality discharge instructions. Understandability and actionability are also important considerations; 17,20,29,40 however, improvements in these areas were limited by our design options within the EHR. Our efforts focused on children with common general pediatric diagnoses, and it is unclear how our interventions would generalize to medically complex patients with more volume of information to communicate at discharge and with uncommon diagnoses that are less readily incorporated into standardized templates. Relatedly, our work occurred at the satellite campus of our tertiary care center and may not represent generalizable material or methods to implement templates at our main campus location or at other hospitals. To begin to better understand this, we have spread to HM patients at our main campus, including medically complex patients with technology dependence and/or neurological impairments. Standardized, disease-specific templates most relevant to this population as well as several patient specific templates, for those with frequent readmissions due to medical complexity, have been created and are actively being tested.
CONCLUSION
In conclusion, in using interventions targeted at standardization of discharge instructions and timely feedback to staff, we saw rapid, dramatic, and sustained improvement in the readability of discharge instructions. Next steps include adaptation and spread to other patient populations and care teams, collaborations with other centers, and assessing the impact of effectively written discharge instructions on patient outcomes, such as adverse drug events, readmission rates, and family experience.
Disclosure
No external funding was secured for this study. Dr. Brady is supported by a Patient-Centered Outcomes Research Mentored Clinical Investigator Award from the Agency for Healthcare Research and Quality, Award Number K08HS023827. The content is solely the responsibility of the authors and does not necessarily represent the official views of the funding organizations. The funding organization had no role in the design, preparation, review, or approval of this paper; nor the decision to submit the manuscript for publication. The authors have no financial relationships relevant to this article to disclose.
References
1. Solan LG, Beck AF, Brunswick SA, et al. The family perspective on hospital to home transitions: a qualitative study. Pediatrics. 2015;136:e1539-e1549. PubMed 2. Engel KG, Buckley BA, Forth VE, et al. Patient understanding of emergency department discharge instructions: where are knowledge deficits greatest? Acad Emerg Med. 2012;19:E1035-E1044. PubMed 3. Ashbrook L, Mourad M, Sehgal N. Communicating discharge instructions to patients: a survey of nurse, intern, and hospitalist practices. J Hosp Med. 2013;8: 36-41. PubMed 4. Kripalani S, Jacobson TA, Mugalla IC, Cawthon CR, Niesner KJ, Vaccarino V. Health literacy and the quality of physician-patient communication during hospitalization. J Hosp Med. 2010;5:269-275. PubMed 5. Institute of Medicine Committee on Health Literacy. Kindig D, Alfonso D, Chudler E, et al, eds. Health Literacy: A Prescription to End Confusion. Washington, DC: National Academies Press; 2004. 6. Yin HS, Johnson M, Mendelsohn AL, Abrams MA, Sanders LM, Dreyer BP. The health literacy of parents in the United States: a nationally representative study. Pediatrics. 2009;124(suppl 3):S289-S298. PubMed 7. Rak EC, Hooper SR, Belsante MJ, et al. Caregiver word reading literacy and health outcomes among children treated in a pediatric nephrology practice. Clin Kid J. 2016;9:510-515. PubMed 8. Morrison AK, Schapira MM, Gorelick MH, Hoffmann RG, Brousseau DC. Low caregiver health literacy is associated with higher pediatric emergency department use and nonurgent visits. Acad Pediatr. 2014;14:309-314. PubMed 9. Howard-Anderson J, Busuttil A, Lonowski S, Vangala S, Afsar-Manesh N. From discharge to readmission: Understanding the process from the patient perspective. J Hosp Med. 2016;11:407-412. PubMed 10. Doak CC, Doak LG, Root JH. Teaching Patients with Low Literacy Skills. 2nd ed. Philadelphia PA: J.B. Lippincott; 1996. PubMed 11. Berkman ND, Sheridan SL, Donahue KE, et al. Health literacy interventions and outcomes: an updated systematic review. Evid Rep/Technol Assess. 2011;199:1-941. PubMed 12. Prevention CfDCa. Health Literacy for Public Health Professionals. In: Prevention CfDCa, ed. Atlanta, GA2009. 13. “What Did the Doctor Say?” Improving Health Literacy to Protect Patient Safety. Oakbrook Terrace, IL: The Joint Commission, 2007. 14. Desai AD, Burkhart Q, Parast L, et al. Development and pilot testing of caregiver- reported pediatric quality measures for transitions between sites of care. Acad Pediatr. 2016;16:760-769. PubMed 15. Leyenaar JK, Desai AD, Burkhart Q, et al. Quality measures to assess care transitions for hospitalized children. Pediatrics. 2016;138(2). PubMed 16. Akinsola B, Cheng J, Zmitrovich A, Khan N, Jain S. Improving discharge instructions in a pediatric emergency department: impact of a quality initiative. Pediatr Emerg Care. 2017;33:10-13. PubMed 17. Unaka NI, Statile AM, Haney J, Beck AF, Brady PW, Jerardi K. Assessment of the readability, understandability and completeness of pediatric hospital medicine discharge instructions J Hosp Med. In press. PubMed 18. Stella SA, Allyn R, Keniston A, et al. Postdischarge problems identified by telephone calls to an advice line. J Hosp Med. 2014;9:695-699. PubMed 19. Maloney M, Auffrey C. The social areas of Cincinnati. 20. The Patient Education Materials Assessment Tool (PEMAT) and User’s Guide: An Instrument To Assess the Understandability and Actionability of Print and Audiovisual Patient Education Materials. Available at: http://www.ahrq.gov/ professionals/prevention-chronic-care/improve/self-mgmt/pemat/index.html. Accessed November 27, 2013. 21. Cohen MR, Senders J, Davis NM. Failure mode and effects analysis: a novel approach to avoiding dangerous medication errors and accidents. Hosp Pharm. 1994;29:319-30. PubMed 22. Langley GJ, Moen R, Nolan KM, Nolan TW, Norman CL, Provost LP. The Improvement Guide: A Practical Approach to Enhancing Organizational Performance. San Franciso, CA: John Wiley & Sons; 2009. 23. Flesch R. A new readability yardstick. J Appl Psychol. 1948;32:221-233. PubMed 24. McLaughlin GH. SMOG grading-a new readability formula. J Reading. 1969;12:639-646. 25. Coleman M, Liau TL. A computer readability formula designed for machine scoring. J Appl Psych. 1975;60:283. 26. Gunning R. {The Technique of Clear Writing}. 1952. 27. Smith EA, Senter R. Automated readability index. AMRL-TR Aerospace Medical Research Laboratories (6570th) 1967:1. PubMed 28. How readable is your writing. 2011. https://readability-score.com. Accessed September 23, 2016. An Official Publication of the Society of Hospital Medicine Journal of Hospital Medicine Vol 12 | No 7 | July 2017 557 Improving Readability of Discharge Instructions | Unaka et al 29. Yin HS, Gupta RS, Tomopoulos S, et al. Readability, suitability, and characteristics of asthma action plans: examination of factors that may impair understanding. Pediatrics. 2013;131:e116-E126. PubMed 30. Brigo F, Otte WM, Igwe SC, Tezzon F, Nardone R. Clearly written, easily comprehended? The readability of websites providing information on epilepsy. Epilepsy Behav. 2015;44:35-39. PubMed 31. Benneyan JC. Use and interpretation of statistical quality control charts. Int J Qual Health Care. 1998;10:69-73. PubMed 32. Mueller SK, Giannelli K, Boxer R, Schnipper JL. Readability of patient discharge instructions with and without the use of electronically available disease-specific templates. J Am Med Inform Assoc. 2015;22:857-863. PubMed 33. Lauster CD, Gibson JM, DiNella JV, DiNardo M, Korytkowski MT, Donihi AC. Implementation of standardized instructions for insulin at hospital discharge. J Hosp Med. 2009;4:E41-E42. PubMed 34. Tuso P, Huynh DN, Garofalo L, et al. The readmission reduction program of Kaiser Permanente Southern California-knowledge transfer and performance improvement. Perm J. 2013;17:58-63. PubMed 35. White CM, Statile AM, White DL, et al. Using quality improvement to optimise paediatric discharge efficiency. BMJ Qual Saf. 2014;23:428-436. PubMed 36. Mussman GM, Vossmeyer MT, Brady PW, Warrick DM, Simmons JM, White CM. Improving the reliability of verbal communication between primary care physicians and pediatric hospitalists at hospital discharge. J Hosp Med. 2015;10:574- 580. PubMed 37. Rothman RL, Yin HS, Mulvaney S, Co JP, Homer C, Lannon C. Health literacy and quality: focus on chronic illness care and patient safety. Pediatrics 2009;124(suppl 3):S315-S326. PubMed 38. Turner T, Cull WL, Bayldon B, et al. Pediatricians and health literacy: descriptive results from a national survey. Pediatrics. 2009;124(suppl 3):S299-S305. PubMed 39. Harrington KF, Haven KM, Bailey WC, Gerald LB. Provider perceptions of parent health literacy and effect on asthma treatment: recommendations and instructions. Pediatr Allergy immunol Pulmonol. 2013;26:69-75. PubMed 40. Yin HS, Parker RM, Wolf MS, et al. Health literacy assessment of labeling of pediatric nonprescription medications: examination of characteristics that may impair parent understanding. Acad Pediatr. 2012;12:288-296. PubMed
*Address for correspondence and reprint requests: Ndidi I. Unaka, Division of Hospital Medicine, Cincinnati Children’s Hospital Medical Center, 3333 Burnet Ave., ML 5018, Cincinnati, OH 45229; Telephone: 513-636-8354; Fax: 513-636-7905; E-mail: ndidi.unaka@cchmc.org
Content Gating
Open Access (article Unlocked/Open Access)
Alternative CME
Disqus Comments
Default
Consolidated Pubs: Do Not Show Source Publication Logo
The average American adult reads at an 8th-grade level.1 Limited general literacy can affect health literacy, which is defined as the “degree to which individuals have the capacity to obtain, process and understand basic health information and services needed to make appropriate health decisions.”2,3 Adults with limited health literacy are at risk for poorer outcomes, including overuse of the emergency department and lower adherence to preventive care recommendations.4
Children transitioning from hospital to home depend on their adult caregivers (and their caregivers’ health literacy) to carry out discharge instructions. During the immediate postdischarge period, complex care needs can involve new or changed medications, follow-up instructions, home care instructions, and suggestions regarding when and why to seek additional care.
The discharge education provided to patients in the hospital is often subpar because of lack of standardization and divided responsibility among providers.5 Communication of vital information to patients with low health literacy has been noted to be particularly poor,6 as many patient education materials are written at 10th-, 11th-, and 12th-grade reading levels.4 Evidence supports providing materials written at 6th-grade level or lower to increase comprehension.7 Several studies have evaluated the quality and readability of discharge instructions for hospitalized adults,8,9 and one study found a link between poorly written instructions for adult patients and readmission risk.10 Less is known about readability in pediatrics, in which education may be more important for families of children most commonly hospitalized for acute illness.
We conducted a study to describe readability levels, understandability scores, and completeness of written instructions given to families at hospital discharge.
METHODS
Study Design and Setting
In this study, we performed a cross-sectional review of discharge instructions within electronic health records at Cincinnati Children’s Hospital Medical Center (CCHMC). The study was reviewed and approved by CCHMC’s Institutional Review Board. Charts were randomly selected from all hospital medicine service discharges during two 3-month periods of high patient volume: January-March 2014 and January-March 2015.
CCHMC is a large urban academic referral center that is the sole provider of general, subspecialty, and critical pediatric inpatient care for a large geographical area. CCHMC, which has 600 beds, provides cares for many children who live in impoverished settings. Its hospital medicine service consists of 4 teams that care for approximately 7000 children hospitalized with general pediatric illnesses each year. Each team consists of 5 or 6 pediatric residents supervised by a hospital medicine attending.
Providers, most commonly pediatric interns, generate discharge instructions in electronic health records. In this nonautomated process, they use free-text or nonstandardized templates to create content. At discharge, instructions are printed as part of the postvisit summary, which includes updates on medications and scheduled follow-up appointments. Bedside nurses verbally review the instructions with families and provide printed copies for home use.
Data Collection and Analysis
A random sequence generator was used to select charts for review. Instructions written in a language other than English were excluded. Written discharge instructions and clinical information, including age, sex, primary diagnosis, insurance type, number of discharge medications, number of scheduled appointments at discharge, and hospital length of stay, were abstracted from electronic health records and anonymized before analysis. The primary outcomes assessed were discharge instruction readability, understandability, and completeness. Readability was calculated with Fry Readability Scale (FRS) scores,11 which range from 1 to 17 and correspond to reading levels (score 1 = 1st-grade reading level). Health literacy experts have used the FRS to assess readability in health care environments.12
Understandability was measured with the Patient Education Materials Assessment Tool (PEMAT), a validated scoring system provided by the Agency for Healthcare Research and Quality.13 The PEMAT measures the understandability of print materials on a scale ranging from 0% to 100%. Higher scores indicate increased understandability, and scores under 70% indicate instructions are difficult to understand.
Although recent efforts have focused on the development of quality metrics for hospital-to-home transitions of pediatric patients,14 during our study there were no standard items to include in pediatric discharge instructions. Five criteria for completeness were determined by consensus of 3 pediatric hospital medicine faculty and were informed by qualitative results of work performed at our institution—work in which families noted challenges with information overload and a desire for pertinent and usable information that would enhance caregiver confidence and discharge preparedness.15 The criteria included statement of diagnosis, description of diagnosis, signs and symptoms indicative of the need for escalation of care (warning signs), the person caregivers should call if worried, and contact information for the primary care provider, subspecialist, and/or emergency department. Each set of discharge instructions was manually evaluated for completeness (presence of each individual component, number of components present, presence of all components). All charts were scored by the same investigator. A convenience sample of 20 charts was evaluated by a different investigator to ensure rating parameters were clear and classification was consistent (defined as perfect agreement). If the primary rater was undecided on a discharge instruction score, the secondary rater rated the instruction, and consensus was reached.
Means, medians, and ranges were calculated to enumerate the distribution of readability levels, understandability scores, and completeness of discharge instructions. Instructions were classified as readable if the FRS score was 6 or under, as understandable if the PEMAT score was under 70%, and as complete if all 5 criteria were satisfied. Descriptive statistics were generated for all demographic and clinical variables.
Table 1
RESULTS
Of the study period’s 3819 discharges, 200 were randomly selected for review. Table 1 lists the demographic and clinical information of patients included in the analyses. Median FRS score was 10, indicating a 10th-grade reading level (interquartile range, 8-12; range, 1-13) (Table 2). Only 14 (7%) of 200 discharge instructions had a score of 6 or under. Median PEMAT understandability score was 73% (interquartile range, 64%-82%), and 36% of instructions had a PEMAT score under 70%. No instruction satisfied all 5 of the defined characteristics of complete discharge instructions (Table 2).
Table 2
DISCUSSION
To our knowledge, this is the first study of the readability, understandability, and completeness of discharge instructions in a pediatric population. We found that the majority of discharge instruction readability levels were 10th grade or higher, that many instructions were difficult to understand, and that important information was missing from many instructions.
Discharge instruction readability levels were higher than the literacy level of many families in surrounding communities. The high school dropout rates in Cincinnati are staggering; they range from 22% to 64% in the 10 neighborhoods with the largest proportion of residents not completing high school.16 However, such findings are not unique to Cincinnati; low literacy is prevalent throughout the United States. Caregivers with limited literacy skills may struggle to navigate complex health systems, understand medical instructions and anticipatory guidance, perform child care and self-care tasks, and understand issues related to consent, medical authorization, and risk communication.17
Although readability is important, other factors also correlate with comprehension and execution of discharge tasks.18 Information must be understandable, or presented in a way that makes sense and can inform appropriate action. In many cases in our study, instructions were incomplete, despite previous investigators’ emphasizing caregivers’ desire and need for written instructions that are complete, informative, and inclusive of clearly outlined contingency plans.15,19 In addition, families may differ in the level of support needed after discharge; standardizing elements and including families in the development of discharge instructions may improve communication.8
This study had several limitations. First, the discharge instructions randomly selected for review were all written during the winter months. As the census on the hospital medicine teams is particularly high during that time, authors with competing responsibilities may not have had enough time to write effective discharge instructions then. We selected the winter period in order to capture real-world instructions written during a busy clinical time, when providers care for a high volume of patients. Second, caregiver health literacy and English-language proficiency were not assessed, and information regarding caregivers’ race/ethnicity, educational attainment, and socioeconomic status was unavailable. Third, interrater agreement was not formally evaluated. Fourth, this was a single-center study with results that may not be generalizable.
In conclusion, discharge instructions for pediatric patients are often difficult to read and understand, and incomplete. Efforts to address these communication gaps—including educational initiatives for physician trainees focused on health literacy, and quality improvement work directed at standardization and creation of readable, understandable, and complete discharge instructions—are crucial in providing safe, high-value care. Researchers need to evaluate the relationship between discharge instruction quality and outcomes, including unplanned office visits, emergency department visits, and readmissions.
Disclosure
Nothing to report.
References
1. Kutner MA, Greenberg E, Jin Y, Paulsen C. The Health Literacy of America’s Adults: Results From the 2003 National Assessment of Adult Literacy. Washington, DC: US Dept of Education, National Center for Education Statistics; 2006. NCES publication 2006-483. https://nces.ed.gov/pubs2006/2006483.pdf. Published September 2006. Accessed December 21, 2016. 2. Ratzan SC, Parker RM. Introduction. In: Selden CR, Zorn M, Ratzan S, Parker RM, eds. National Library of Medicine Current Bibliographies in Medicine: Health Literacy. Bethesda, MD: US Dept of Health and Human Services, National Institutes of Health; 2000:v-vi. NLM publication CBM 2000-1. https://www.nlm.nih.gov/archive//20061214/pubs/cbm/hliteracy.pdf. Published February 2000. Accessed December 21, 2016. 3. Arora VM, Schaninger C, D’Arcy M, et al. Improving inpatients’ identification of their doctors: use of FACE cards. Jt Comm J Qual Patient Saf. 2009;35(12):613-619. PubMed 4. Berkman ND, Sheridan SL, Donahue KE, et al. Health literacy interventions and outcomes: an updated systematic review. Evid Rep Technol Assess (Full Rep). 2011;(199):1-941. PubMed 5. Ashbrook L, Mourad M, Sehgal N. Communicating discharge instructions to patients: a survey of nurse, intern, and hospitalist practices. J Hosp Med. 2013;8(1):36-41. PubMed 6. Kripalani S, Jacobson TA, Mugalla IC, Cawthon CR, Niesner KJ, Vaccarino V. Health literacy and the quality of physician–patient communication during hospitalization. J Hosp Med. 2010;5(5):269-275. PubMed 7. Nielsen-Bohlman L, Panzer AM, Kindig DA, eds; Committee on Health Literacy, Board on Neuroscience and Behavioral Health, Institute of Medicine. Health Literacy: A Prescription to End Confusion. Washington, DC: National Academies Press; 2004. 8. Hahn-Goldberg S, Okrainec K, Huynh T, Zahr N, Abrams H. Co-creating patient-oriented discharge instructions with patients, caregivers, and healthcare providers. J Hosp Med. 2015;10(12):804-807. PubMed 9. Lauster CD, Gibson JM, DiNella JV, DiNardo M, Korytkowski MT, Donihi AC. Implementation of standardized instructions for insulin at hospital discharge. J Hosp Med. 2009;4(8):E41-E42. PubMed 10. Howard-Anderson J, Busuttil A, Lonowski S, Vangala S, Afsar-Manesh N. From discharge to readmission: understanding the process from the patient perspective. J Hosp Med. 2016;11(6):407-412. PubMed 11. Fry E. A readability formula that saves time. J Reading. 1968;11:513-516, 575-578. 12. D’Alessandro DM, Kingsley P, Johnson-West J. The readability of pediatric patient education materials on the World Wide Web. Arch Pediatr Adolesc Med. 2001;155(7):807-812. PubMed 13. Shoemaker SJ, Wolf MS, Brach C. The Patient Education Materials Assessment Tool (PEMAT) and User’s Guide: An Instrument to Assess the Understandability and Actionability of Print and Audiovisual Patient Education Materials. Rockville, MD: US Dept of Health and Human Services, Agency for Healthcare Research and Quality; 2013. http://www.ahrq.gov/professionals/prevention-chronic-care/improve/self-mgmt/pemat/index.html. Published October 2013. Accessed November 27, 2013. 14. Leyenaar JK, Desai AD, Burkhart Q, et al. Quality measures to assess care transitions for hospitalized children. Pediatrics. 2016;138(2). PubMed 15. Solan LG, Beck AF, Brunswick SA, et al; H2O Study Group. The family perspective on hospital to home transitions: a qualitative study. Pediatrics. 2015;136(6):e1539-e1549. PubMed 16. Maloney M, Auffrey C. The Social Areas of Cincinnati: An Analysis of Social Needs: Patterns for Five Census Decades. 5th ed. Cincinnati, OH: University of Cincinnati School of Planning/United Way/University of Cincinnati Community Research Collaborative; 2013. http://www.socialareasofcincinnati.org/files/FifthEdition/SASBook.pdf. Published April 2013. Accessed December 21, 2016. 17. Rothman RL, Yin HS, Mulvaney S, Co JP, Homer C, Lannon C. Health literacy and quality: focus on chronic illness care and patient safety. Pediatrics. 2009;124(suppl 3):S315-S326. PubMed 18. Moon RY, Cheng TL, Patel KM, Baumhaft K, Scheidt PC. Parental literacy level and understanding of medical information. Pediatrics. 1998;102(2):e25. PubMed 19. Desai AD, Durkin LK, Jacob-Files EA, Mangione-Smith R. Caregiver perceptions of hospital to home transitions according to medical complexity: a qualitative study. Acad Pediatr. 2016;16(2):136-144. PubMed
The average American adult reads at an 8th-grade level.1 Limited general literacy can affect health literacy, which is defined as the “degree to which individuals have the capacity to obtain, process and understand basic health information and services needed to make appropriate health decisions.”2,3 Adults with limited health literacy are at risk for poorer outcomes, including overuse of the emergency department and lower adherence to preventive care recommendations.4
Children transitioning from hospital to home depend on their adult caregivers (and their caregivers’ health literacy) to carry out discharge instructions. During the immediate postdischarge period, complex care needs can involve new or changed medications, follow-up instructions, home care instructions, and suggestions regarding when and why to seek additional care.
The discharge education provided to patients in the hospital is often subpar because of lack of standardization and divided responsibility among providers.5 Communication of vital information to patients with low health literacy has been noted to be particularly poor,6 as many patient education materials are written at 10th-, 11th-, and 12th-grade reading levels.4 Evidence supports providing materials written at 6th-grade level or lower to increase comprehension.7 Several studies have evaluated the quality and readability of discharge instructions for hospitalized adults,8,9 and one study found a link between poorly written instructions for adult patients and readmission risk.10 Less is known about readability in pediatrics, in which education may be more important for families of children most commonly hospitalized for acute illness.
We conducted a study to describe readability levels, understandability scores, and completeness of written instructions given to families at hospital discharge.
METHODS
Study Design and Setting
In this study, we performed a cross-sectional review of discharge instructions within electronic health records at Cincinnati Children’s Hospital Medical Center (CCHMC). The study was reviewed and approved by CCHMC’s Institutional Review Board. Charts were randomly selected from all hospital medicine service discharges during two 3-month periods of high patient volume: January-March 2014 and January-March 2015.
CCHMC is a large urban academic referral center that is the sole provider of general, subspecialty, and critical pediatric inpatient care for a large geographical area. CCHMC, which has 600 beds, provides cares for many children who live in impoverished settings. Its hospital medicine service consists of 4 teams that care for approximately 7000 children hospitalized with general pediatric illnesses each year. Each team consists of 5 or 6 pediatric residents supervised by a hospital medicine attending.
Providers, most commonly pediatric interns, generate discharge instructions in electronic health records. In this nonautomated process, they use free-text or nonstandardized templates to create content. At discharge, instructions are printed as part of the postvisit summary, which includes updates on medications and scheduled follow-up appointments. Bedside nurses verbally review the instructions with families and provide printed copies for home use.
Data Collection and Analysis
A random sequence generator was used to select charts for review. Instructions written in a language other than English were excluded. Written discharge instructions and clinical information, including age, sex, primary diagnosis, insurance type, number of discharge medications, number of scheduled appointments at discharge, and hospital length of stay, were abstracted from electronic health records and anonymized before analysis. The primary outcomes assessed were discharge instruction readability, understandability, and completeness. Readability was calculated with Fry Readability Scale (FRS) scores,11 which range from 1 to 17 and correspond to reading levels (score 1 = 1st-grade reading level). Health literacy experts have used the FRS to assess readability in health care environments.12
Understandability was measured with the Patient Education Materials Assessment Tool (PEMAT), a validated scoring system provided by the Agency for Healthcare Research and Quality.13 The PEMAT measures the understandability of print materials on a scale ranging from 0% to 100%. Higher scores indicate increased understandability, and scores under 70% indicate instructions are difficult to understand.
Although recent efforts have focused on the development of quality metrics for hospital-to-home transitions of pediatric patients,14 during our study there were no standard items to include in pediatric discharge instructions. Five criteria for completeness were determined by consensus of 3 pediatric hospital medicine faculty and were informed by qualitative results of work performed at our institution—work in which families noted challenges with information overload and a desire for pertinent and usable information that would enhance caregiver confidence and discharge preparedness.15 The criteria included statement of diagnosis, description of diagnosis, signs and symptoms indicative of the need for escalation of care (warning signs), the person caregivers should call if worried, and contact information for the primary care provider, subspecialist, and/or emergency department. Each set of discharge instructions was manually evaluated for completeness (presence of each individual component, number of components present, presence of all components). All charts were scored by the same investigator. A convenience sample of 20 charts was evaluated by a different investigator to ensure rating parameters were clear and classification was consistent (defined as perfect agreement). If the primary rater was undecided on a discharge instruction score, the secondary rater rated the instruction, and consensus was reached.
Means, medians, and ranges were calculated to enumerate the distribution of readability levels, understandability scores, and completeness of discharge instructions. Instructions were classified as readable if the FRS score was 6 or under, as understandable if the PEMAT score was under 70%, and as complete if all 5 criteria were satisfied. Descriptive statistics were generated for all demographic and clinical variables.
Table 1
RESULTS
Of the study period’s 3819 discharges, 200 were randomly selected for review. Table 1 lists the demographic and clinical information of patients included in the analyses. Median FRS score was 10, indicating a 10th-grade reading level (interquartile range, 8-12; range, 1-13) (Table 2). Only 14 (7%) of 200 discharge instructions had a score of 6 or under. Median PEMAT understandability score was 73% (interquartile range, 64%-82%), and 36% of instructions had a PEMAT score under 70%. No instruction satisfied all 5 of the defined characteristics of complete discharge instructions (Table 2).
Table 2
DISCUSSION
To our knowledge, this is the first study of the readability, understandability, and completeness of discharge instructions in a pediatric population. We found that the majority of discharge instruction readability levels were 10th grade or higher, that many instructions were difficult to understand, and that important information was missing from many instructions.
Discharge instruction readability levels were higher than the literacy level of many families in surrounding communities. The high school dropout rates in Cincinnati are staggering; they range from 22% to 64% in the 10 neighborhoods with the largest proportion of residents not completing high school.16 However, such findings are not unique to Cincinnati; low literacy is prevalent throughout the United States. Caregivers with limited literacy skills may struggle to navigate complex health systems, understand medical instructions and anticipatory guidance, perform child care and self-care tasks, and understand issues related to consent, medical authorization, and risk communication.17
Although readability is important, other factors also correlate with comprehension and execution of discharge tasks.18 Information must be understandable, or presented in a way that makes sense and can inform appropriate action. In many cases in our study, instructions were incomplete, despite previous investigators’ emphasizing caregivers’ desire and need for written instructions that are complete, informative, and inclusive of clearly outlined contingency plans.15,19 In addition, families may differ in the level of support needed after discharge; standardizing elements and including families in the development of discharge instructions may improve communication.8
This study had several limitations. First, the discharge instructions randomly selected for review were all written during the winter months. As the census on the hospital medicine teams is particularly high during that time, authors with competing responsibilities may not have had enough time to write effective discharge instructions then. We selected the winter period in order to capture real-world instructions written during a busy clinical time, when providers care for a high volume of patients. Second, caregiver health literacy and English-language proficiency were not assessed, and information regarding caregivers’ race/ethnicity, educational attainment, and socioeconomic status was unavailable. Third, interrater agreement was not formally evaluated. Fourth, this was a single-center study with results that may not be generalizable.
In conclusion, discharge instructions for pediatric patients are often difficult to read and understand, and incomplete. Efforts to address these communication gaps—including educational initiatives for physician trainees focused on health literacy, and quality improvement work directed at standardization and creation of readable, understandable, and complete discharge instructions—are crucial in providing safe, high-value care. Researchers need to evaluate the relationship between discharge instruction quality and outcomes, including unplanned office visits, emergency department visits, and readmissions.
Disclosure
Nothing to report.
References
1. Kutner MA, Greenberg E, Jin Y, Paulsen C. The Health Literacy of America’s Adults: Results From the 2003 National Assessment of Adult Literacy. Washington, DC: US Dept of Education, National Center for Education Statistics; 2006. NCES publication 2006-483. https://nces.ed.gov/pubs2006/2006483.pdf. Published September 2006. Accessed December 21, 2016. 2. Ratzan SC, Parker RM. Introduction. In: Selden CR, Zorn M, Ratzan S, Parker RM, eds. National Library of Medicine Current Bibliographies in Medicine: Health Literacy. Bethesda, MD: US Dept of Health and Human Services, National Institutes of Health; 2000:v-vi. NLM publication CBM 2000-1. https://www.nlm.nih.gov/archive//20061214/pubs/cbm/hliteracy.pdf. Published February 2000. Accessed December 21, 2016. 3. Arora VM, Schaninger C, D’Arcy M, et al. Improving inpatients’ identification of their doctors: use of FACE cards. Jt Comm J Qual Patient Saf. 2009;35(12):613-619. PubMed 4. Berkman ND, Sheridan SL, Donahue KE, et al. Health literacy interventions and outcomes: an updated systematic review. Evid Rep Technol Assess (Full Rep). 2011;(199):1-941. PubMed 5. Ashbrook L, Mourad M, Sehgal N. Communicating discharge instructions to patients: a survey of nurse, intern, and hospitalist practices. J Hosp Med. 2013;8(1):36-41. PubMed 6. Kripalani S, Jacobson TA, Mugalla IC, Cawthon CR, Niesner KJ, Vaccarino V. Health literacy and the quality of physician–patient communication during hospitalization. J Hosp Med. 2010;5(5):269-275. PubMed 7. Nielsen-Bohlman L, Panzer AM, Kindig DA, eds; Committee on Health Literacy, Board on Neuroscience and Behavioral Health, Institute of Medicine. Health Literacy: A Prescription to End Confusion. Washington, DC: National Academies Press; 2004. 8. Hahn-Goldberg S, Okrainec K, Huynh T, Zahr N, Abrams H. Co-creating patient-oriented discharge instructions with patients, caregivers, and healthcare providers. J Hosp Med. 2015;10(12):804-807. PubMed 9. Lauster CD, Gibson JM, DiNella JV, DiNardo M, Korytkowski MT, Donihi AC. Implementation of standardized instructions for insulin at hospital discharge. J Hosp Med. 2009;4(8):E41-E42. PubMed 10. Howard-Anderson J, Busuttil A, Lonowski S, Vangala S, Afsar-Manesh N. From discharge to readmission: understanding the process from the patient perspective. J Hosp Med. 2016;11(6):407-412. PubMed 11. Fry E. A readability formula that saves time. J Reading. 1968;11:513-516, 575-578. 12. D’Alessandro DM, Kingsley P, Johnson-West J. The readability of pediatric patient education materials on the World Wide Web. Arch Pediatr Adolesc Med. 2001;155(7):807-812. PubMed 13. Shoemaker SJ, Wolf MS, Brach C. The Patient Education Materials Assessment Tool (PEMAT) and User’s Guide: An Instrument to Assess the Understandability and Actionability of Print and Audiovisual Patient Education Materials. Rockville, MD: US Dept of Health and Human Services, Agency for Healthcare Research and Quality; 2013. http://www.ahrq.gov/professionals/prevention-chronic-care/improve/self-mgmt/pemat/index.html. Published October 2013. Accessed November 27, 2013. 14. Leyenaar JK, Desai AD, Burkhart Q, et al. Quality measures to assess care transitions for hospitalized children. Pediatrics. 2016;138(2). PubMed 15. Solan LG, Beck AF, Brunswick SA, et al; H2O Study Group. The family perspective on hospital to home transitions: a qualitative study. Pediatrics. 2015;136(6):e1539-e1549. PubMed 16. Maloney M, Auffrey C. The Social Areas of Cincinnati: An Analysis of Social Needs: Patterns for Five Census Decades. 5th ed. Cincinnati, OH: University of Cincinnati School of Planning/United Way/University of Cincinnati Community Research Collaborative; 2013. http://www.socialareasofcincinnati.org/files/FifthEdition/SASBook.pdf. Published April 2013. Accessed December 21, 2016. 17. Rothman RL, Yin HS, Mulvaney S, Co JP, Homer C, Lannon C. Health literacy and quality: focus on chronic illness care and patient safety. Pediatrics. 2009;124(suppl 3):S315-S326. PubMed 18. Moon RY, Cheng TL, Patel KM, Baumhaft K, Scheidt PC. Parental literacy level and understanding of medical information. Pediatrics. 1998;102(2):e25. PubMed 19. Desai AD, Durkin LK, Jacob-Files EA, Mangione-Smith R. Caregiver perceptions of hospital to home transitions according to medical complexity: a qualitative study. Acad Pediatr. 2016;16(2):136-144. PubMed
Address for correspondence and reprint requests: Ndidi I. Unaka, MD, MEd, Division of Hospital Medicine, Cincinnati Children’s Hospital Medical Center, 3333 Burnet Ave, ML 5018, Cincinnati, OH 45229; Telephone: 513-636-8354; Fax: 513-636-7905; E-mail: ndidi.unaka@cchmc.org
Content Gating
Gated (full article locked unless allowed per User)
Deciding when a hospitalized child's vital signs are acceptably within range and when they should generate alerts, alarms, and escalations of care is critically important yet surprisingly complicated. Many patients in the hospital who are recovering appropriately exhibit vital signs that fall outside normal ranges for well children. In a technology‐focused hospital environment, these out‐of‐range vital signs often generate alerts in the electronic health record (EHR) and alarms on physiologic monitors that can disrupt patients' sleep, generate concern in parents, lead to unnecessary testing and treatment by physicians, interrupt nurses during important patient care tasks, and lead to alarm fatigue. It is this last area, the problem of alarm fatigue, that Goel and colleagues[1] have used to frame the rationale and results of their study reported in this issue of the Journal of Hospital Medicine.
Goel and colleagues correctly point out that physiologic monitor alarm rates are high in children's hospitals, and alarms warranting intervention or action are rare.[2, 3, 4, 5, 6] Few studies have rigorously examined interventions to reduce unnecessary hospital physiologic monitor alarms, especially in pediatric settings. Of all the potential interventions, widening parameters has the most face validity: if you set wide enough alarm parameters, fewer alarms will be triggered. However, it comes with a potential safety tradeoff of missed actionable alarms.
Before EHR data became widely available for research, normal (or perhaps more appropriate for the hospital setting, expected) vital sign ranges were defined using expert opinion. The first publication describing the distribution of EHR‐documented vital signs in hospitalized children was published in 2013.[7] Goel and colleagues have built upon this prior work in their article, in which they present percentiles of EHR‐documented heart rate (HR) and respiratory rate (RR) developed using data from more than 7000 children hospitalized at an academic children's hospital. In a separate validation dataset, they then compared the performance of their proposed physiologic monitor alarm parametersthe 5th and 95th percentiles for HR and RR from this studyto the 2004 National Institutes of Health (NIH) vital sign reference ranges[8] that were the basis of default alarm parameters at their hospital. They also compared their percentiles to the 2013 study.[7]
The 2 main findings of Goel and colleagues' study were: (1) using their separate validation dataset, 55.6% fewer HR and RR observations were out of range based on their newly developed percentiles as compared to the NIH vital sign reference ranges; and (2) the HR and RR percentiles they developed were very similar to those reported in the 2013 study,[7] which used data from 2 other institutions, externally validating their findings.
The team then pushed the data a step further in a safety analysis and evaluated the sensitivity of the 5th and 95th percentiles for HR and RR from this study for detecting deterioration in 148 patients in the 12 hours before either a rapid response team activation or a cardiorespiratory arrest. The overall sensitivity for having either a HR or RR value out of range was 93% for Goel and colleagues' percentiles and 97% for the NIH ranges. Goel and colleagues concluded that using the 5th and 95th HR and RR percentiles provides a potentially safe means by which to modify physiologic bedside monitor alarm limits.
There are 2 important limitations to this work. The first is that the study uses EHR‐documented data to estimate the performance of new physiologic monitor settings. Although there are few published reports of differences between nurse‐charted vital signs and monitor data, those that do exist suggest that nurse charting favors more stable vital signs,[9, 10] even when charting oxygen saturation in patients with true, prolonged desaturation.[9] We agree with the authors of 1 report, who speculated that nurses recognize that temporary changes in vital signs are untypical for that patient and might choose to ignore them and either await a period of stability or make an educated estimate for that hour.[9] When using Goel and colleagues' 5th and 95th percentiles as alarm parameters, the expected scenario is that monitors will generate alarms for 10% of HR values and 10% of RR values. Because of the differences between nurse‐charted vital signs and monitor data, the monitors will probably generate many more alarms.
The second limitation is the approach Goel and colleagues took in performing a safety analysis using chart review. Unfortunately, it is nearly impossible for a retrospective chart review to form the basis of a convincing scientific argument for the safety of different alarm parameters. It requires balancing the complex and sometimes competing nurse‐level, patient‐level, and alarm‐level factors that determine nurse response time to alarms. It is possible to do prospectively, and we hope Goel's team will follow up this article with a description of the implementation and safety of these parameters in clinical practice.
In addition, the clinical implications of HR and RR at the 95th percentile might be considered less immediately life threatening than HR and RR at the 5th percentile, even though statistically they are equally abnormal. When choosing percentile‐based alarm parameters, statistical symmetry might be less important than the potential immediate consequences of missing bradycardia or bradypnea. It would be reasonable to consider setting high HR and RR at the 99th percentile or higher, because elevated HR or RR alone is rarely immediately actionable, and set the low HR and RR at the 5th or 10th percentile.
Despite these caveats, should the percentiles proposed by Goel and colleagues be used to inform pediatric vital sign clinical decision support throughout the world? When faced with the alternative of using vital sign parameters that are not based on data from hospitalized children, these percentiles offer a clear advantage, especially for hospitals similar to Goel's. The most obvious immediate use for these percentiles is to improve noninterruptive[11] vital sign clinical decision support in the EHR, the actual source of the data in this study.
The question of whether to implement Goel's 5th and 95th percentiles as physiologic monitor alarm parameters is more complex. In contrast to EHR decision support, there are much clearer downstream consequences of sounding unnecessary alarms as well as failing to sound important alarms for a child in extremis. Because their percentiles are not based on monitor data, the projected number of alarms generated at different percentile thresholds cannot be accurately estimated, although using their 5th and 95th percentiles should result in fewer alarms than the NIH parameters.
In conclusion, the work by Goel and colleagues represents an important contribution to knowledge about the ranges of expected vital signs in hospitalized children. Their findings can be immediately used to guide EHR decision support. Their percentiles are also relevant to physiologic monitor alarm parameters, although the performance and safety of using the 5th and 95th percentiles remain in question. Hospitals aiming to implement these data‐driven parameters should first evaluate the performance of different percentiles from this article using data obtained from their own monitor system and, if proceeding with clinical implementation, pilot the parameters to accurately gauge alarm rates and assess safety before spreading hospital wide.
Disclosures
Dr. Bonafide is supported by a Mentored Patient‐Oriented Research Career Development Award from the National Heart, Lung, and Blood Institute of the National Institutes of Health under award number K23HL116427. Dr. Brady is supported by a Patient‐Centered Outcomes Research Mentored Clinical Investigator Award from the Agency for Healthcare Research and Quality under award number K08HS023827. The content is solely the responsibility of the authors and does not necessarily represent the official views of the funding organizations. The funding organizations had no role in the design, preparation, review, or approval of this article; nor the decision to submit the article for publication. The authors have no financial relationships relevant to this article or conflicts of interest to disclose.
References
Goel VV, Poole SF, Longhurst CA, et al. Safety analysis of proposed data‐driven physiologic alarm parameters for hospitalized children. J Hosp Med.2016;11(12):817–823.
Bonafide CP, Lin R, Zander M, et al. Association between exposure to nonactionable physiologic monitor alarms and response time in a children's hospital. J Hosp Med.2015;10(6):345–351.
Lawless ST. Crying wolf: false alarms in a pediatric intensive care unit. Crit Care Med.1994;22(6):981–985.
Rosman EC, Blaufox AD, Menco A, Trope R, Seiden HS. What are we missing? Arrhythmia detection in the pediatric intensive care unit. J Pediatr.2013;163(2):511–514.
Talley LB, Hooper J, Jacobs B, et al. Cardiopulmonary monitors and clinically significant events in critically ill children. Biomed Instrum Technol.2011;(suppl):38–45.
Tsien CL, Fackler JC. Poor prognosis for existing monitors in the intensive care unit. Crit Care Med.1997;25(4):614–619.
Bonafide CP, Brady PW, Keren R, Conway PH, Marsolo K, Daymont C. Development of heart and respiratory rate percentile curves for hospitalized children. Pediatrics.2013;131:e1150–e1157.
NIH Clinical Center. Pediatric services: age‐appropriate vital signs. Available at: https://web.archive.org/web/20041101222327/http://www.cc. nih.gov/ccc/pedweb/pedsstaff/age.html. Published November 1, 2004. Accessed June 9, 2016.
Taenzer AH, Pyke J, Herrick MD, Dodds TM, McGrath SP. A comparison of oxygen saturation data in inpatients with low oxygen saturation using automated continuous monitoring and intermittent manual data charting. Anesth Analg.2014;118(2):326–331.
Cunningham S, Deere S, Elton RA, McIntosh N. Comparison of nurse and computer charting of physiological variables in an intensive care unit. Int J Clin Monit Comput.1996;13(4):235–241.
Phansalkar S, Sijs H, Tucker AD, et al. Drug‐drug interactions that should be non‐interruptive in order to reduce alert fatigue in electronic health records. J Am Med Inform Assoc.2013;20(3):489–493.
Deciding when a hospitalized child's vital signs are acceptably within range and when they should generate alerts, alarms, and escalations of care is critically important yet surprisingly complicated. Many patients in the hospital who are recovering appropriately exhibit vital signs that fall outside normal ranges for well children. In a technology‐focused hospital environment, these out‐of‐range vital signs often generate alerts in the electronic health record (EHR) and alarms on physiologic monitors that can disrupt patients' sleep, generate concern in parents, lead to unnecessary testing and treatment by physicians, interrupt nurses during important patient care tasks, and lead to alarm fatigue. It is this last area, the problem of alarm fatigue, that Goel and colleagues[1] have used to frame the rationale and results of their study reported in this issue of the Journal of Hospital Medicine.
Goel and colleagues correctly point out that physiologic monitor alarm rates are high in children's hospitals, and alarms warranting intervention or action are rare.[2, 3, 4, 5, 6] Few studies have rigorously examined interventions to reduce unnecessary hospital physiologic monitor alarms, especially in pediatric settings. Of all the potential interventions, widening parameters has the most face validity: if you set wide enough alarm parameters, fewer alarms will be triggered. However, it comes with a potential safety tradeoff of missed actionable alarms.
Before EHR data became widely available for research, normal (or perhaps more appropriate for the hospital setting, expected) vital sign ranges were defined using expert opinion. The first publication describing the distribution of EHR‐documented vital signs in hospitalized children was published in 2013.[7] Goel and colleagues have built upon this prior work in their article, in which they present percentiles of EHR‐documented heart rate (HR) and respiratory rate (RR) developed using data from more than 7000 children hospitalized at an academic children's hospital. In a separate validation dataset, they then compared the performance of their proposed physiologic monitor alarm parametersthe 5th and 95th percentiles for HR and RR from this studyto the 2004 National Institutes of Health (NIH) vital sign reference ranges[8] that were the basis of default alarm parameters at their hospital. They also compared their percentiles to the 2013 study.[7]
The 2 main findings of Goel and colleagues' study were: (1) using their separate validation dataset, 55.6% fewer HR and RR observations were out of range based on their newly developed percentiles as compared to the NIH vital sign reference ranges; and (2) the HR and RR percentiles they developed were very similar to those reported in the 2013 study,[7] which used data from 2 other institutions, externally validating their findings.
The team then pushed the data a step further in a safety analysis and evaluated the sensitivity of the 5th and 95th percentiles for HR and RR from this study for detecting deterioration in 148 patients in the 12 hours before either a rapid response team activation or a cardiorespiratory arrest. The overall sensitivity for having either a HR or RR value out of range was 93% for Goel and colleagues' percentiles and 97% for the NIH ranges. Goel and colleagues concluded that using the 5th and 95th HR and RR percentiles provides a potentially safe means by which to modify physiologic bedside monitor alarm limits.
There are 2 important limitations to this work. The first is that the study uses EHR‐documented data to estimate the performance of new physiologic monitor settings. Although there are few published reports of differences between nurse‐charted vital signs and monitor data, those that do exist suggest that nurse charting favors more stable vital signs,[9, 10] even when charting oxygen saturation in patients with true, prolonged desaturation.[9] We agree with the authors of 1 report, who speculated that nurses recognize that temporary changes in vital signs are untypical for that patient and might choose to ignore them and either await a period of stability or make an educated estimate for that hour.[9] When using Goel and colleagues' 5th and 95th percentiles as alarm parameters, the expected scenario is that monitors will generate alarms for 10% of HR values and 10% of RR values. Because of the differences between nurse‐charted vital signs and monitor data, the monitors will probably generate many more alarms.
The second limitation is the approach Goel and colleagues took in performing a safety analysis using chart review. Unfortunately, it is nearly impossible for a retrospective chart review to form the basis of a convincing scientific argument for the safety of different alarm parameters. It requires balancing the complex and sometimes competing nurse‐level, patient‐level, and alarm‐level factors that determine nurse response time to alarms. It is possible to do prospectively, and we hope Goel's team will follow up this article with a description of the implementation and safety of these parameters in clinical practice.
In addition, the clinical implications of HR and RR at the 95th percentile might be considered less immediately life threatening than HR and RR at the 5th percentile, even though statistically they are equally abnormal. When choosing percentile‐based alarm parameters, statistical symmetry might be less important than the potential immediate consequences of missing bradycardia or bradypnea. It would be reasonable to consider setting high HR and RR at the 99th percentile or higher, because elevated HR or RR alone is rarely immediately actionable, and set the low HR and RR at the 5th or 10th percentile.
Despite these caveats, should the percentiles proposed by Goel and colleagues be used to inform pediatric vital sign clinical decision support throughout the world? When faced with the alternative of using vital sign parameters that are not based on data from hospitalized children, these percentiles offer a clear advantage, especially for hospitals similar to Goel's. The most obvious immediate use for these percentiles is to improve noninterruptive[11] vital sign clinical decision support in the EHR, the actual source of the data in this study.
The question of whether to implement Goel's 5th and 95th percentiles as physiologic monitor alarm parameters is more complex. In contrast to EHR decision support, there are much clearer downstream consequences of sounding unnecessary alarms as well as failing to sound important alarms for a child in extremis. Because their percentiles are not based on monitor data, the projected number of alarms generated at different percentile thresholds cannot be accurately estimated, although using their 5th and 95th percentiles should result in fewer alarms than the NIH parameters.
In conclusion, the work by Goel and colleagues represents an important contribution to knowledge about the ranges of expected vital signs in hospitalized children. Their findings can be immediately used to guide EHR decision support. Their percentiles are also relevant to physiologic monitor alarm parameters, although the performance and safety of using the 5th and 95th percentiles remain in question. Hospitals aiming to implement these data‐driven parameters should first evaluate the performance of different percentiles from this article using data obtained from their own monitor system and, if proceeding with clinical implementation, pilot the parameters to accurately gauge alarm rates and assess safety before spreading hospital wide.
Disclosures
Dr. Bonafide is supported by a Mentored Patient‐Oriented Research Career Development Award from the National Heart, Lung, and Blood Institute of the National Institutes of Health under award number K23HL116427. Dr. Brady is supported by a Patient‐Centered Outcomes Research Mentored Clinical Investigator Award from the Agency for Healthcare Research and Quality under award number K08HS023827. The content is solely the responsibility of the authors and does not necessarily represent the official views of the funding organizations. The funding organizations had no role in the design, preparation, review, or approval of this article; nor the decision to submit the article for publication. The authors have no financial relationships relevant to this article or conflicts of interest to disclose.
References
Goel VV, Poole SF, Longhurst CA, et al. Safety analysis of proposed data‐driven physiologic alarm parameters for hospitalized children. J Hosp Med.2016;11(12):817–823.
Bonafide CP, Lin R, Zander M, et al. Association between exposure to nonactionable physiologic monitor alarms and response time in a children's hospital. J Hosp Med.2015;10(6):345–351.
Lawless ST. Crying wolf: false alarms in a pediatric intensive care unit. Crit Care Med.1994;22(6):981–985.
Rosman EC, Blaufox AD, Menco A, Trope R, Seiden HS. What are we missing? Arrhythmia detection in the pediatric intensive care unit. J Pediatr.2013;163(2):511–514.
Talley LB, Hooper J, Jacobs B, et al. Cardiopulmonary monitors and clinically significant events in critically ill children. Biomed Instrum Technol.2011;(suppl):38–45.
Tsien CL, Fackler JC. Poor prognosis for existing monitors in the intensive care unit. Crit Care Med.1997;25(4):614–619.
Bonafide CP, Brady PW, Keren R, Conway PH, Marsolo K, Daymont C. Development of heart and respiratory rate percentile curves for hospitalized children. Pediatrics.2013;131:e1150–e1157.
NIH Clinical Center. Pediatric services: age‐appropriate vital signs. Available at: https://web.archive.org/web/20041101222327/http://www.cc. nih.gov/ccc/pedweb/pedsstaff/age.html. Published November 1, 2004. Accessed June 9, 2016.
Taenzer AH, Pyke J, Herrick MD, Dodds TM, McGrath SP. A comparison of oxygen saturation data in inpatients with low oxygen saturation using automated continuous monitoring and intermittent manual data charting. Anesth Analg.2014;118(2):326–331.
Cunningham S, Deere S, Elton RA, McIntosh N. Comparison of nurse and computer charting of physiological variables in an intensive care unit. Int J Clin Monit Comput.1996;13(4):235–241.
Phansalkar S, Sijs H, Tucker AD, et al. Drug‐drug interactions that should be non‐interruptive in order to reduce alert fatigue in electronic health records. J Am Med Inform Assoc.2013;20(3):489–493.
Address for correspondence and reprint requests: Christopher P. Bonafide, MD, MSCE, Division of General Pediatrics, The Children's Hospital of Philadelphia, 3401 Civic Center Blvd., Philadelphia, PA 19104; Telephone: 267‐426‐2901; E‐mail: bonafide@email.chop.edu
Content Gating
Gated (full article locked unless allowed per User)
Physiologic monitor alarms are an inescapable part of the soundtrack for hospitals. Data from primarily adult hospitals have shown that alarms occur at high rates, and most alarms are not actionable.[1] Small studies have suggested that high alarm rates can lead to alarm fatigue.[2, 3] To prioritize alarm types to target in future intervention studies, in this study we aimed to investigate the alarm rates on all inpatient units and the most common causes of alarms at a children's hospital.
METHODS
This was a cross‐sectional study of audible physiologic monitor alarms at Cincinnati Children's Hospital Medical Center (CCHMC) over 7 consecutive days during August 2014. CCHMC is a 522‐bed free‐standing children's hospital. Inpatient beds are equipped with GE Healthcare (Little Chalfont, United Kingdom) bedside monitors (models Dash 3000, 4000, and 5000, and Solar 8000). Age‐specific vital sign parameters were employed for monitors on all units.
We obtained date, time, and type of alarm from bedside physiologic monitors using Connexall middleware (GlobeStar Systems, Toronto, Ontario, Canada).
We determined unit census using the electronic health records for the time period concurrent with the alarm data collection. Given previously described variation in hospital census over the day,[4] we used 4 daily census measurements (6:00 am, 12:00 pm, 6:00 pm, and 11:00 pm) rather than 1 single measurement to more accurately reflect the hospital census.
The CCHMC Institutional Review Board determined this work to be not human subjects research.
Statistical Analysis
For each unit and each census time interval, we generated a rate based on the number of occupied beds (alarms per patient‐day) resulting in a total of 28 rates (4 census measurement periods per/day 7 days) for each unit over the study period. We used descriptive statistics to summarize alarms per patient‐day by unit. Analysis of variance was used to compare alarm rates between units. For significant main effects, we used Tukey's multiple comparisons tests for all pairwise comparisons to control the type I experiment‐wise error rate. Alarms were then classified by alarm cause (eg, high heart rate). We summarized the cause for all alarms using counts and percentages.
RESULTS
There were a total of 220,813 audible alarms over 1 week. Median alarm rate per patient‐day by unit ranged from 30.4 to 228.5; the highest alarm rates occurred in the cardiac intensive care unit, with a median of 228.5 (interquartile range [IQR], 193275) followed by the pediatric intensive care unit (172.4; IQR, 141188) (Figure 1). The average alarm rate was significantly different among the units (P < 0.01).
Figure 1
Alarm rates by unit over 28 study observation periods.
Technical alarms (eg, alarms for artifact, lead failure), comprised 33% of the total number of alarms. The remaining 67% of alarms were for clinical conditions, the most common of which was low oxygen saturation (30% of clinical alarms) (Figure 2).
Figure 2
Causes of clinical alarms as a percentage of all clinical alarms. Technical alarms, not included in this figure, comprised 33% of all alarms.
DISCUSSION
We described alarm rates and causes over multiple units at a large children's hospital. To our knowledge, this is the first description of alarm rates across multiple pediatric inpatient units. Alarm counts were high even for the general units, indicating that a nurse taking care of 4 monitored patients would need to process a physiologic monitor alarm every 4 minutes on average, in addition to other sources of alarms such as infusion pumps.
Alarm rates were highest in the intensive care unit areas, which may be attributable to both higher rates of monitoring and sicker patients. Importantly, however, alarms were quite high and variable on the acute care units. This suggests that factors other than patient acuity may have substantial influence on alarm rates.
Technical alarms, alarms that do not indicate a change in patient condition, accounted for the largest percentage of alarms during the study period. This is consistent with prior literature that has suggested that regular electrode replacement, which decreases technical alarms, can be effective in reducing alarm rates.[5, 6] The most common vital sign change to cause alarms was low oxygen saturation, followed by elevated heart rate and elevated respiratory rate. Whereas in most healthy patients, certain low oxygen levels would prompt initiation of supplemental oxygen, there are many conditions in which elevated heart rate and respiratory rate may not require titration of any particular therapy. These may be potential intervention targets for hospitals trying to improve alarm rates.
Limitations
There are several limitations to our study. First, our results are not necessarily generalizable to other types of hospitals or those utilizing monitors from other vendors. Second, we were unable to include other sources of alarms such as infusion pumps and ventilators. However, given the high alarm rates from physiologic monitors alone, these data add urgency to the need for further investigation in the pediatric setting.
CONCLUSION
Alarm rates at a single children's hospital varied depending on the unit. Strategies targeted at reducing technical alarms and reducing nonactionable clinical alarms for low oxygen saturation, high heart rate, and high respiratory rate may offer the greatest opportunity to reduce alarm rates.
Acknowledgements
The authors acknowledge Melinda Egan for her assistance in obtaining data for this study and Ting Sa for her assistance with data management.
Disclosures: Dr. Bonafide is supported by the National Heart, Lung, and Blood Institute of the National Institutes of Health under award number K23HL116427. Dr. Bonafide also holds a Young Investigator Award grant from the Academic Pediatric Association evaluating the impact of a data‐driven monitor alarm reduction strategy implemented in safety huddles. Dr. Brady is supported by the Agency for Healthcare Research and Quality under award number K08HS23827. The content is solely the responsibility of the authors and does not necessarily represent the official views of the National Institutes of Health or the Agency for Healthcare Research and Quality. This study was funded by the Arnold W. Strauss Fellow Grant, Cincinnati Children's Hospital Medical Center. The authors have no conflicts of interest to disclose.
References
Paine CW, Goel VV, Ely E, et al. Systematic review of physiologic monitor alarm characteristics and pragmatic interventions to reduce alarm frequency. J Hosp Med.2016;11(2):136–144.
Bonafide CP, Lin R, Zander M, et al. Association between exposure to nonactionable physiologic monitor alarms and response time in a children's hospital. J Hosp Med.2015;10(6):345–351.
Voepel‐Lewis T, Parker ML, Burke CN, et al. Pulse oximetry desaturation alarms on a general postoperative adult unit: a prospective observational study of nurse response time. Int J Nurs Stud.2013;50(10):1351–1358.
Fieldston E, Ragavan M, Jayaraman B, Metlay J, Pati S. Traditional measures of hospital utilization may not accurately reflect dynamic patient demand: findings from a children's hospital. Hosp Pediatr.2012;2(1):10–18.
Dandoy CE, Davies SM, Flesch L, et al. A team‐based approach to reducing cardiac monitor alarms. Pediatrics.2014;134(6):e1686–e1694.
Cvach MM, Biggs M, Rothwell KJ, Charles‐Hudson C. Daily electrode change and effect on cardiac monitor alarms: an evidence‐based practice approach. J Nurs Care Qual.2013;28(3):265–271.
Physiologic monitor alarms are an inescapable part of the soundtrack for hospitals. Data from primarily adult hospitals have shown that alarms occur at high rates, and most alarms are not actionable.[1] Small studies have suggested that high alarm rates can lead to alarm fatigue.[2, 3] To prioritize alarm types to target in future intervention studies, in this study we aimed to investigate the alarm rates on all inpatient units and the most common causes of alarms at a children's hospital.
METHODS
This was a cross‐sectional study of audible physiologic monitor alarms at Cincinnati Children's Hospital Medical Center (CCHMC) over 7 consecutive days during August 2014. CCHMC is a 522‐bed free‐standing children's hospital. Inpatient beds are equipped with GE Healthcare (Little Chalfont, United Kingdom) bedside monitors (models Dash 3000, 4000, and 5000, and Solar 8000). Age‐specific vital sign parameters were employed for monitors on all units.
We obtained date, time, and type of alarm from bedside physiologic monitors using Connexall middleware (GlobeStar Systems, Toronto, Ontario, Canada).
We determined unit census using the electronic health records for the time period concurrent with the alarm data collection. Given previously described variation in hospital census over the day,[4] we used 4 daily census measurements (6:00 am, 12:00 pm, 6:00 pm, and 11:00 pm) rather than 1 single measurement to more accurately reflect the hospital census.
The CCHMC Institutional Review Board determined this work to be not human subjects research.
Statistical Analysis
For each unit and each census time interval, we generated a rate based on the number of occupied beds (alarms per patient‐day) resulting in a total of 28 rates (4 census measurement periods per/day 7 days) for each unit over the study period. We used descriptive statistics to summarize alarms per patient‐day by unit. Analysis of variance was used to compare alarm rates between units. For significant main effects, we used Tukey's multiple comparisons tests for all pairwise comparisons to control the type I experiment‐wise error rate. Alarms were then classified by alarm cause (eg, high heart rate). We summarized the cause for all alarms using counts and percentages.
RESULTS
There were a total of 220,813 audible alarms over 1 week. Median alarm rate per patient‐day by unit ranged from 30.4 to 228.5; the highest alarm rates occurred in the cardiac intensive care unit, with a median of 228.5 (interquartile range [IQR], 193275) followed by the pediatric intensive care unit (172.4; IQR, 141188) (Figure 1). The average alarm rate was significantly different among the units (P < 0.01).
Figure 1
Alarm rates by unit over 28 study observation periods.
Technical alarms (eg, alarms for artifact, lead failure), comprised 33% of the total number of alarms. The remaining 67% of alarms were for clinical conditions, the most common of which was low oxygen saturation (30% of clinical alarms) (Figure 2).
Figure 2
Causes of clinical alarms as a percentage of all clinical alarms. Technical alarms, not included in this figure, comprised 33% of all alarms.
DISCUSSION
We described alarm rates and causes over multiple units at a large children's hospital. To our knowledge, this is the first description of alarm rates across multiple pediatric inpatient units. Alarm counts were high even for the general units, indicating that a nurse taking care of 4 monitored patients would need to process a physiologic monitor alarm every 4 minutes on average, in addition to other sources of alarms such as infusion pumps.
Alarm rates were highest in the intensive care unit areas, which may be attributable to both higher rates of monitoring and sicker patients. Importantly, however, alarms were quite high and variable on the acute care units. This suggests that factors other than patient acuity may have substantial influence on alarm rates.
Technical alarms, alarms that do not indicate a change in patient condition, accounted for the largest percentage of alarms during the study period. This is consistent with prior literature that has suggested that regular electrode replacement, which decreases technical alarms, can be effective in reducing alarm rates.[5, 6] The most common vital sign change to cause alarms was low oxygen saturation, followed by elevated heart rate and elevated respiratory rate. Whereas in most healthy patients, certain low oxygen levels would prompt initiation of supplemental oxygen, there are many conditions in which elevated heart rate and respiratory rate may not require titration of any particular therapy. These may be potential intervention targets for hospitals trying to improve alarm rates.
Limitations
There are several limitations to our study. First, our results are not necessarily generalizable to other types of hospitals or those utilizing monitors from other vendors. Second, we were unable to include other sources of alarms such as infusion pumps and ventilators. However, given the high alarm rates from physiologic monitors alone, these data add urgency to the need for further investigation in the pediatric setting.
CONCLUSION
Alarm rates at a single children's hospital varied depending on the unit. Strategies targeted at reducing technical alarms and reducing nonactionable clinical alarms for low oxygen saturation, high heart rate, and high respiratory rate may offer the greatest opportunity to reduce alarm rates.
Acknowledgements
The authors acknowledge Melinda Egan for her assistance in obtaining data for this study and Ting Sa for her assistance with data management.
Disclosures: Dr. Bonafide is supported by the National Heart, Lung, and Blood Institute of the National Institutes of Health under award number K23HL116427. Dr. Bonafide also holds a Young Investigator Award grant from the Academic Pediatric Association evaluating the impact of a data‐driven monitor alarm reduction strategy implemented in safety huddles. Dr. Brady is supported by the Agency for Healthcare Research and Quality under award number K08HS23827. The content is solely the responsibility of the authors and does not necessarily represent the official views of the National Institutes of Health or the Agency for Healthcare Research and Quality. This study was funded by the Arnold W. Strauss Fellow Grant, Cincinnati Children's Hospital Medical Center. The authors have no conflicts of interest to disclose.
References
Paine CW, Goel VV, Ely E, et al. Systematic review of physiologic monitor alarm characteristics and pragmatic interventions to reduce alarm frequency. J Hosp Med.2016;11(2):136–144.
Bonafide CP, Lin R, Zander M, et al. Association between exposure to nonactionable physiologic monitor alarms and response time in a children's hospital. J Hosp Med.2015;10(6):345–351.
Voepel‐Lewis T, Parker ML, Burke CN, et al. Pulse oximetry desaturation alarms on a general postoperative adult unit: a prospective observational study of nurse response time. Int J Nurs Stud.2013;50(10):1351–1358.
Fieldston E, Ragavan M, Jayaraman B, Metlay J, Pati S. Traditional measures of hospital utilization may not accurately reflect dynamic patient demand: findings from a children's hospital. Hosp Pediatr.2012;2(1):10–18.
Dandoy CE, Davies SM, Flesch L, et al. A team‐based approach to reducing cardiac monitor alarms. Pediatrics.2014;134(6):e1686–e1694.
Cvach MM, Biggs M, Rothwell KJ, Charles‐Hudson C. Daily electrode change and effect on cardiac monitor alarms: an evidence‐based practice approach. J Nurs Care Qual.2013;28(3):265–271.
Address for correspondence and reprint requests: Amanda C. Schondelmeyer, MD, Cincinnati Children's Hospital Medical Center, 3333 Burnet Avenue ML 9016, Cincinnati, OH 45229; Telephone: 513‐803‐9158; Fax: 513‐803‐9224; E‐mail: amanda.schondelmeyer@cchmc.org
Content Gating
Gated (full article locked unless allowed per User)
Alarm fatigue is not a new issue for hospitals. In a commentary written over 3 decades ago, Kerr and Hayes described what they saw as an alarming issue developing in intensive care units.[1] Recently multiple organizations, including The Joint Commission and the Emergency Care Research Institute have called out alarm fatigue as a patient safety problem,[2, 3, 4] and organizations such as the American Academy of Pediatrics and the American Heart Association are backing away from recommendations for continuous monitoring.[5, 6] Hospitals are in a scramble to set up alarm committees and address alarms locally as recommended by The Joint Commission.[2] In this issue of the Journal of Hospital Medicine, Paine and colleagues set out to review the small but growing body of literature addressing physiologic monitor alarms and interventions that have tried to address alarm fatigue.[7]
After searching through 4629 titles, the authors found 32 articles addressing their key questions: What proportion of alarms are actionable? What is the relationship between clinicians' alarm exposure and response time? Which interventions are effective for reducing alarm rates? The majority of studies identified were observational, with only 8 studies addressing interventions to reduce alarms. Many of the identified studies occurred in units taking care of adults, though 10 descriptive studies and 1 intervention study occurred in pediatric settings. Perhaps the most concerning finding of all, though not surprising to those who work in the hospital setting, was that somewhere between <1% and 26% of alarms across all studies were considered actionable. Although only specifically addressed in 2 studies, the issue of alarm fatigue (i.e., more alarms leading to slower and sometimes absent clinician response) was supported in both, with nurses having slower responses when exposed to a higher numbers of alarms.[8, 9]
The authors note several limitations of their work, one of which is the modest body of literature on the topic. Although several interventions, including widening alarm parameters, increasing alarm delays, and using disposable leads or daily lead changes, have early evidence of success in safely reducing unnecessary alarms, the heterogeneity of this literature precluded a meta‐analysis. Further, the lack of standard definitions and the variety of methods of determining alarm validity make comparison across studies challenging. For this reason, the authors note that they did not distinguish nuisance alarms (i.e., alarms that accurately reflect the patient condition but do not require any intervention) from invalid alarms (i.e., alarms that do not correctly reflect the patient condition). This is relevant because it is likely that interventions to reduce invalid alarms (e.g., frequent lead changes) may be distinct from those that will successfully address nuisance alarms (e.g., widening alarm limits). It is also important to note that although patient safety is of paramount importance, there were other negative consequences of alarms that the authors did not address in this systemic review. Moreover, although avoiding unrecognized deterioration should be a primary goal of any program to reduce alarm fatigue, death remains uncommon compared to the number of patients, families, and healthcare workers exposed to high numbers of alarms during hospitalization. The high number of nonactionable alarms suggests that part of the burden of this problem may lie in more difficult to quantify outcomes such as sleep quality,[10, 11, 12] patient and parent quality of life during hospitalization,[13, 14] and interrupted tasks and cognitive work of healthcare providers.[15]
Paine and colleagues' review has some certain and some less certain implications for the future of alarm research. First, there is an imminent need for researchers and improvers to develop a consensus around terminology and metrics. We need to agree on what is and is not an actionable alarm, and we need valid and sensitive metrics to better understand the consequences of not monitoring a patient who should be on monitors. Second, hospitals addressing alarm fatigue need benchmarks. As hospitals rush to comply with The Joint Commission National Patient Safety Goals for alarm management,[2] it is safe to say that our goal should not be zero alarms, but how low do you go? What can we consider a safe number of alarms in our hospitals? Smart alarms hold tremendous potential to improve the sensitivity and positive predictive value of alarms. However, their ultimate success is dependent on engineers in industry to develop the technology as well as researchers in the hospital setting to validate the technology's performance in clinical care. Additionally, hospitals need to know which interventions are most effective to implement and how to reliably implement these in daily practice. What seems less certain is what type of research is best suited to address this need. The authors recommend randomized trials as an immediate next step, and certainly trials are the gold standard in determining efficacy. However, trials may overstate effectiveness as complex bundled interventions play out in complex and dynamic hospital systems. Quasiexperimental study designs, including time series and step‐wedge designs, would allow for further scientific discovery, such as which interventions are most effective in certain patient populations, while describing reliable implementation of effective methods that lead to lower alarms rates. In both classical randomized controlled trials and quasiexperiments, factorial designs[16, 17] could give us a better understanding of both the comparative effect and any interaction between interventions.
Alarm fatigue is a widespread problem that has negative effects for patients, families, nurses, and physicians. This review demonstrates that the great majority of alarms do not help clinicians and likely contribute to alarm fatigue. The opportunity to improve care is unquestionably vast, and attention from The Joint Commission and the lay press ensures change will occur. What is critical now is for hospitalists, intensivists, nurses, researchers, and hospital administrators to find the right combination of scientific discovery, thoughtful collaboration with industry, and quality improvement that will inform the literature on which interventions worked, how, and in what setting, and ultimately lead to safer (and quieter) hospitals.
Disclosures
Dr. Brady is supported by the Agency for Healthcare Research and Quality under award number K08HS023827. The content is solely the responsibility of the authors and does not necessarily represent the official views of the Agency for Healthcare Research and Quality. Dr. Landrigan is supported in part by the Children's Hospital Association for his work as an executive council member of the Pediatric Research in Inpatient Settings network. Dr. Landrigan serves as a consultant to Virgin Pulse regarding sleep, safety, and health. In addition, Dr. Landrigan has received monetary awards, honoraria, and travel reimbursement from multiple academic and professional organizations for delivering lectures on sleep deprivation, physician performance, handoffs, and patient safety, and has served as an expert witness in cases regarding patient safety. The authors report no other funding, financial relationships, or conflicts of interest.
References
Kerr JH, Hayes B. An “alarming” situation in the intensive therapy unit. Intensive Care Med.1983;9(3):103–104.
The Joint Commission. National Patient Safety Goal on Alarm Management. Available at: http://www.jointcommission.org/assets/1/18/JCP0713_Announce_New_NSPG.pdf. Accessed October 23, 2015.
Joint Commission. Medical device alarm safety in hospitals. Sentinel Event Alert.2013;(50):1–3.
Top 10 health technology hazards for 2014. Health Devices.2013;42(11):354–380.
Ralston SL, Lieberthal AS, Meissner HC, et al. Clinical practice guideline: the diagnosis, management, and prevention of bronchiolitis. Pediatrics.2014;134(5):e1474–e1502.
Drew BJ, Califf RM, Funk M, et al. Practice standards for electrocardiographic monitoring in hospital settings: an American Heart Association scientific statement from the Councils on Cardiovascular Nursing, Clinical Cardiology, and Cardiovascular Disease in the Young: endorsed by the International Society of Computerized Electrocardiology and the American Association of Critical‐Care Nurses. Circulation.2004;110(17):2721–2746.
Paine CW, Goel VV, Ely E, Stave CD, Stemler S, Zander M, Bonafide CP. Systematic review of physiologic monitor alarm characteristics and pragmatic interventions to reduce alarm frequency. J Hosp Med.2016;11(2):136–144.
Voepel‐Lewis T, Parker ML, Burke CN, et al. Pulse oximetry desaturation alarms on a general postoperative adult unit: a prospective observational study of nurse response time. Int J Nurs Stud.2013;50(10):1351–1358.
Bonafide CP, Lin R, Zander M, et al. Association between exposure to nonactionable physiologic monitor alarms and response time in a children's hospital. J Hosp Med.2015;10(6):345–351.
McCann D. Sleep deprivation is an additional stress for parents staying in hospital. J Spec Pediatr Nurs.2008;13(2):111–122.
Yamanaka H, Haruna J, Mashimo T, Akita T, Kinouchi K. The sound intensity and characteristics of variable‐pitch pulse oximeters. J Clin Monit Comput.2008;22(3):199–207.
Stremler R, Dhukai Z, Wong L, Parshuram C. Factors influencing sleep for parents of critically ill hospitalised children: a qualitative analysis. Intensive Crit Care Nurs.2011;27(1):37–45.
Miles MS, Burchinal P, Holditch‐Davis D, Brunssen S, Wilson SM. Perceptions of stress, worry, and support in Black and White mothers of hospitalized, medically fragile infants. J Pediatr Nurs.2002;17(2):82–88.
Busse M, Stromgren K, Thorngate L, Thomas KA. Parents' responses to stress in the neonatal intensive care unit. Crit Care Nurs.2013;33(4):52–59; quiz 60.
Deb S, Claudio D. Alarm fatigue and its influence on staff performance. IIE Trans Healthc Syst Eng.2015;5(3):183–196.
Moen RD, Nolan TW, Provost LP. Quality Improvement Through Planned Experimentation. 3rd ed. New York, NY: McGraw‐Hill; 1991.
Provost LP, Murray SK. The Health Care Data Guide: Learning From Data for Improvement. San Francisco, CA: Jossey‐Bass; 2011.
Alarm fatigue is not a new issue for hospitals. In a commentary written over 3 decades ago, Kerr and Hayes described what they saw as an alarming issue developing in intensive care units.[1] Recently multiple organizations, including The Joint Commission and the Emergency Care Research Institute have called out alarm fatigue as a patient safety problem,[2, 3, 4] and organizations such as the American Academy of Pediatrics and the American Heart Association are backing away from recommendations for continuous monitoring.[5, 6] Hospitals are in a scramble to set up alarm committees and address alarms locally as recommended by The Joint Commission.[2] In this issue of the Journal of Hospital Medicine, Paine and colleagues set out to review the small but growing body of literature addressing physiologic monitor alarms and interventions that have tried to address alarm fatigue.[7]
After searching through 4629 titles, the authors found 32 articles addressing their key questions: What proportion of alarms are actionable? What is the relationship between clinicians' alarm exposure and response time? Which interventions are effective for reducing alarm rates? The majority of studies identified were observational, with only 8 studies addressing interventions to reduce alarms. Many of the identified studies occurred in units taking care of adults, though 10 descriptive studies and 1 intervention study occurred in pediatric settings. Perhaps the most concerning finding of all, though not surprising to those who work in the hospital setting, was that somewhere between <1% and 26% of alarms across all studies were considered actionable. Although only specifically addressed in 2 studies, the issue of alarm fatigue (i.e., more alarms leading to slower and sometimes absent clinician response) was supported in both, with nurses having slower responses when exposed to a higher numbers of alarms.[8, 9]
The authors note several limitations of their work, one of which is the modest body of literature on the topic. Although several interventions, including widening alarm parameters, increasing alarm delays, and using disposable leads or daily lead changes, have early evidence of success in safely reducing unnecessary alarms, the heterogeneity of this literature precluded a meta‐analysis. Further, the lack of standard definitions and the variety of methods of determining alarm validity make comparison across studies challenging. For this reason, the authors note that they did not distinguish nuisance alarms (i.e., alarms that accurately reflect the patient condition but do not require any intervention) from invalid alarms (i.e., alarms that do not correctly reflect the patient condition). This is relevant because it is likely that interventions to reduce invalid alarms (e.g., frequent lead changes) may be distinct from those that will successfully address nuisance alarms (e.g., widening alarm limits). It is also important to note that although patient safety is of paramount importance, there were other negative consequences of alarms that the authors did not address in this systemic review. Moreover, although avoiding unrecognized deterioration should be a primary goal of any program to reduce alarm fatigue, death remains uncommon compared to the number of patients, families, and healthcare workers exposed to high numbers of alarms during hospitalization. The high number of nonactionable alarms suggests that part of the burden of this problem may lie in more difficult to quantify outcomes such as sleep quality,[10, 11, 12] patient and parent quality of life during hospitalization,[13, 14] and interrupted tasks and cognitive work of healthcare providers.[15]
Paine and colleagues' review has some certain and some less certain implications for the future of alarm research. First, there is an imminent need for researchers and improvers to develop a consensus around terminology and metrics. We need to agree on what is and is not an actionable alarm, and we need valid and sensitive metrics to better understand the consequences of not monitoring a patient who should be on monitors. Second, hospitals addressing alarm fatigue need benchmarks. As hospitals rush to comply with The Joint Commission National Patient Safety Goals for alarm management,[2] it is safe to say that our goal should not be zero alarms, but how low do you go? What can we consider a safe number of alarms in our hospitals? Smart alarms hold tremendous potential to improve the sensitivity and positive predictive value of alarms. However, their ultimate success is dependent on engineers in industry to develop the technology as well as researchers in the hospital setting to validate the technology's performance in clinical care. Additionally, hospitals need to know which interventions are most effective to implement and how to reliably implement these in daily practice. What seems less certain is what type of research is best suited to address this need. The authors recommend randomized trials as an immediate next step, and certainly trials are the gold standard in determining efficacy. However, trials may overstate effectiveness as complex bundled interventions play out in complex and dynamic hospital systems. Quasiexperimental study designs, including time series and step‐wedge designs, would allow for further scientific discovery, such as which interventions are most effective in certain patient populations, while describing reliable implementation of effective methods that lead to lower alarms rates. In both classical randomized controlled trials and quasiexperiments, factorial designs[16, 17] could give us a better understanding of both the comparative effect and any interaction between interventions.
Alarm fatigue is a widespread problem that has negative effects for patients, families, nurses, and physicians. This review demonstrates that the great majority of alarms do not help clinicians and likely contribute to alarm fatigue. The opportunity to improve care is unquestionably vast, and attention from The Joint Commission and the lay press ensures change will occur. What is critical now is for hospitalists, intensivists, nurses, researchers, and hospital administrators to find the right combination of scientific discovery, thoughtful collaboration with industry, and quality improvement that will inform the literature on which interventions worked, how, and in what setting, and ultimately lead to safer (and quieter) hospitals.
Disclosures
Dr. Brady is supported by the Agency for Healthcare Research and Quality under award number K08HS023827. The content is solely the responsibility of the authors and does not necessarily represent the official views of the Agency for Healthcare Research and Quality. Dr. Landrigan is supported in part by the Children's Hospital Association for his work as an executive council member of the Pediatric Research in Inpatient Settings network. Dr. Landrigan serves as a consultant to Virgin Pulse regarding sleep, safety, and health. In addition, Dr. Landrigan has received monetary awards, honoraria, and travel reimbursement from multiple academic and professional organizations for delivering lectures on sleep deprivation, physician performance, handoffs, and patient safety, and has served as an expert witness in cases regarding patient safety. The authors report no other funding, financial relationships, or conflicts of interest.
References
Kerr JH, Hayes B. An “alarming” situation in the intensive therapy unit. Intensive Care Med.1983;9(3):103–104.
The Joint Commission. National Patient Safety Goal on Alarm Management. Available at: http://www.jointcommission.org/assets/1/18/JCP0713_Announce_New_NSPG.pdf. Accessed October 23, 2015.
Joint Commission. Medical device alarm safety in hospitals. Sentinel Event Alert.2013;(50):1–3.
Top 10 health technology hazards for 2014. Health Devices.2013;42(11):354–380.
Ralston SL, Lieberthal AS, Meissner HC, et al. Clinical practice guideline: the diagnosis, management, and prevention of bronchiolitis. Pediatrics.2014;134(5):e1474–e1502.
Drew BJ, Califf RM, Funk M, et al. Practice standards for electrocardiographic monitoring in hospital settings: an American Heart Association scientific statement from the Councils on Cardiovascular Nursing, Clinical Cardiology, and Cardiovascular Disease in the Young: endorsed by the International Society of Computerized Electrocardiology and the American Association of Critical‐Care Nurses. Circulation.2004;110(17):2721–2746.
Paine CW, Goel VV, Ely E, Stave CD, Stemler S, Zander M, Bonafide CP. Systematic review of physiologic monitor alarm characteristics and pragmatic interventions to reduce alarm frequency. J Hosp Med.2016;11(2):136–144.
Voepel‐Lewis T, Parker ML, Burke CN, et al. Pulse oximetry desaturation alarms on a general postoperative adult unit: a prospective observational study of nurse response time. Int J Nurs Stud.2013;50(10):1351–1358.
Bonafide CP, Lin R, Zander M, et al. Association between exposure to nonactionable physiologic monitor alarms and response time in a children's hospital. J Hosp Med.2015;10(6):345–351.
McCann D. Sleep deprivation is an additional stress for parents staying in hospital. J Spec Pediatr Nurs.2008;13(2):111–122.
Yamanaka H, Haruna J, Mashimo T, Akita T, Kinouchi K. The sound intensity and characteristics of variable‐pitch pulse oximeters. J Clin Monit Comput.2008;22(3):199–207.
Stremler R, Dhukai Z, Wong L, Parshuram C. Factors influencing sleep for parents of critically ill hospitalised children: a qualitative analysis. Intensive Crit Care Nurs.2011;27(1):37–45.
Miles MS, Burchinal P, Holditch‐Davis D, Brunssen S, Wilson SM. Perceptions of stress, worry, and support in Black and White mothers of hospitalized, medically fragile infants. J Pediatr Nurs.2002;17(2):82–88.
Busse M, Stromgren K, Thorngate L, Thomas KA. Parents' responses to stress in the neonatal intensive care unit. Crit Care Nurs.2013;33(4):52–59; quiz 60.
Deb S, Claudio D. Alarm fatigue and its influence on staff performance. IIE Trans Healthc Syst Eng.2015;5(3):183–196.
Moen RD, Nolan TW, Provost LP. Quality Improvement Through Planned Experimentation. 3rd ed. New York, NY: McGraw‐Hill; 1991.
Provost LP, Murray SK. The Health Care Data Guide: Learning From Data for Improvement. San Francisco, CA: Jossey‐Bass; 2011.
Address for correspondence and reprint requests: Amanda C. Schondelmeyer, MD, Cincinnati Children's Hospital Medical Center, 3333 Burnet Ave. ML 9016, Cincinnati, OH, 45229; Telephone: 513‐803‐9158; Fax: 513‐803‐9224; E‐mail: amanda.schondelmeyer@cchmc.org
Content Gating
Gated (full article locked unless allowed per User)
Timely and reliable communication of important data between hospital‐based physicians and primary care physicians is critical for prevention of medical adverse events.[1, 2] Extrapolation from high‐performance organizations outside of medicine suggests that verbal communication is an important component of patient handoffs.[3, 4] Though the Joint Commission does not mandate verbal communication during handoffs per se, stipulating instead that handoff participants have an opportunity to ask and respond to questions,[5] there is some evidence that primary care providers prefer verbal handoffs at least for certain patients such as those with medical complexity.[6] Verbal communication offers the receiver the opportunity to ask questions, but in practice, 2‐way verbal communication is often difficult to achieve at hospital discharge.
At our institution, hospital medicine (HM) physicians serve as the primary inpatient providers for nearly 90% of all general pediatric admissions. When the HM service was established, primary care physicians (PCPs) and HM physicians together agreed upon an expectation for verbal, physician‐to‐physician communication at the time of discharge. Discharge communication is provided by either residents or attendings depending on the facility. A telephone operator service called Physician Priority Link (PPL) was made available to facilitate this communication. The PPL service is staffed 24/7 by operators whose only responsibilities are to connect providers inside and outside the institution. By utilizing this service, PCPs could respond in a nonemergent fashion to discharge phone calls.
Over the last several years, PCPs have observed high variation in the reliability of discharge communication phone calls. A review of PPL phone records in 2009 showed that only 52% of HM discharges had a record of a call initiated to the PCP on the day of discharge. The overall goal of this improvement project was to improve the completion of verbal handoffs from HM physicians (residents or attendings) to PCPs. The specific aim of the project was to increase the proportion of completed verbal handoffs from on‐call residents or attendings to PCPs within 24 hours of discharge to more than 90% within 18 months.
METHODS
Human Subjects Protection
Our project was undertaken in accordance with institutional review board (IRB) policy on systems improvement work and did not require formal IRB review.
Setting
This study included all patients admitted to the HM service at an academic children's hospital and its satellite campus.
Planning the Intervention
The project was championed by physicians on the HM service and supported by a chief resident, PPL administrators, and 2 information technology analysts.
At the onset of the project, the team mapped the process for completing a discharge call to the PCPs, conducted a modified failure mode and effects analysis,[7, 8] and examined the key drivers used to prioritize interventions (Figure 1). Through the modified failure modes effect analysis, the team was able to identify system issues that led to unsuccessful communication: failure of call initiation, absence of an identified PCP, long wait times on hold, failure of PCP to call back, and failure of the call to be documented. These failure modes informed the key drivers to achieving the study aim. Figure 2 depicts the final key drivers, which were revised through testing and learning.
Figure 1
Preintervention processes and failure modes for discharge communication with PCPs.
Figure 2
Key driver diagram for verbal communication at hospital discharge.
Interventions Targeting Key Stakeholder Buy‐in
To improve resident buy‐in and participation, the purpose and goals of the projects were discussed at resident morning report and during monthly team meetings by the pediatric chief resident on our improvement team. Resident physicians were interested in participating to reduce interruptions during daily rounds and to improve interactions with PCPs. The PPL staff was interested in standardizing the discharge call process to reduce confusion in identifying the appropriate contact when PCPs called residents back to discuss discharges. PCPs were interested in ensuring good communication at discharge, and individual PCPs were engaged through person‐to‐person contact by 1 of the HM physician champions.
Interventions to Standardization the Communication Process
To facilitate initiation of calls to PCPs at hospital discharge, the improvement team created a standard process using the PPL service (Figure 3). All patients discharged from the HM service were included in the process. Discharging physicians (who were usually but not always residents, depending on the facility), were instructed to call the PPL operator at the time of discharge. The PPL operator would then page the patient's PCP. It was the responsibility of the discharging physician to identify a PCP prior to discharge. Instances where no PCP was identified were counted as process failures because no phone call could be made. The expectation for the PCPs was that they would return the page within 20 minutes. PPL operators would then page back to the discharging physician to connect the 2 parties with the expectation that the discharging physician respond within 2 to 4 minutes to the PPL operator's page. Standardization of all calls through PPL allowed efficient tracking of incomplete calls and operators to reattempt calls that were not completed. This process also shifted the burden of following up on incomplete calls to PPL. The use of PPL to make the connection also allowed the physician to complete other work while awaiting a call back from the PCP.
Figure 3
Final process map for verbal communication at discharge.
Leveraging the Electronic Health Record for Process Initiation
To ensure reliable initiation of the discharge communication pathway, the improvement team introduced changes to the electronic health record (HER) (EpicCare Inpatient; Epic Systems Corp., Verona, WI), which generated a message to PPL operators whenever a discharge order was entered for an HM patient. The message contained the patient's name, medical record number, discharge date, discharging physician, and PCP name and phone number. A checklist was implemented by PPL to ensure that duplicate phone calls were not made. To initiate communication, the operator contacted the resident via text page to ensure they were ready to initiate the call. If the resident was ready to place a call, the operator then generated a phone call to the PCP. When the PCP returned the call, the operator connected the HM resident with the PCP for the handoff.
As the project progressed, several adaptations were made to address newly identified failure modes. To address confusion among PPL operators about which resident physicians should take discharge phone calls after the discharging resident was no longer available (for example, after a shift change), primary responsibility for discharge phone calls was reassigned to the daily on‐call resident rather than the resident who wrote the discharge order. Because the on‐call residents carry a single pager, the pager number listed on the automated discharge notification to PPL would never change and would always reach the appropriate team member. Second, to address the anticipated increase in interruption of resident workflow by calls back from PCPs, particularly during rounds, operators accessed information on pending discharge phone calls in batches at times of increased resident availability to minimize hold times for PCPs and work interruptions for the discharging physicians. Batch times were 1 pm and 4 pm to allow for completion of morning rounds, resident conference at noon, and patient‐care activities during the afternoon. Calls initiated after 4 pm were dispatched at the time of the discharge, and calls initiated after 10 pm were deferred to the following day.
Transparency of Data
Throughout the study, weekly failure data were generated from the EHR and emailed to improvement team members, enabling them to focus on near real‐time feedback of data to create a visible and more reliable system. With the standardization of all discharge calls directed to the PPL operators, the team was able to create a call record linked to the patient's medical record number. Team‐specific and overall results for the 5 HM resident teams were displayed weekly on a run chart in the resident conference room. As improvements in call initiation were demonstrated, completion rate data were also shared every several months with the attending hospitalists during a regularly scheduled divisional conference. This transparency of data gave the improvement team the opportunity to provide individual feedback to residents and attendings about failures. The weekly review of failure data allowed team leaders to learn from failures, identify knowledge gaps, and ensure accountability with the HM physicians.
Planning the Study of the Intervention
Data were collected prospectively from July 2011 to March 2014. A weekly list of patients discharged from the HM service was extracted from the EHR and compared to electronic call logs collected by PPL on the day of discharge. A standard sample size of 30 calls was audited separately by PPL and 1 of the physician leads to verify that the patients were discharged from the HM service and validate the percentage of completed and initiated calls.
The percentage of calls initiated within 24 hours of discharge was tracked as a process measure and served as the initial focus of improvement efforts. Our primary outcome measure was the percentage of calls completed to the PCP by the HM physician within 24 hours of discharge.
Methods of Evaluation and Analysis
We used improvement science methods and run charts to determine the percentage of patients discharged from the HM service with a call initiated to the PCP and completed within 24 hours of discharge. Data on calls initiated within 24 hours of discharge were plotted on a run chart to examine the impact of interventions over time. Once interventions targeted at call initiation had been implemented, we began tracking our primary outcome measure. A new run chart was created documenting the percentage of calls completed. For both metrics, the centerline was adjusted using established rules for special cause variation in run charts.[9, 10, 11, 12, 13]
RESULTS
From July 2011 to March 2014, there were 6313 discharges from the HM service. The process measure (percentage of calls initiated) improved from 50% to 97% after 4 interventions (Figure 4). Data for the outcome measure (percentage of calls completed) were collected starting in August 2012, shortly after linking the EHR discharge order to the discharge call. Over the first 8 weeks, our median was 80%, which increased to a median of 93% (Figure 5). These results were sustained for 18 months.
Figure 4
Percent of calls made to primary care physicians within 24 hours of hospital discharge.
Figure 5
Percent of calls to primary care physicians completed within 24 hours of discharge.
Several key interventions were identified that were critical to achievement of our goal. Standardization of the communication process through PPL was temporally associated with a shift in the median rate of call initiation from 52% to 72%. Use of the discharge order to initiate discharge communication was associated with an increase from 72% to 97%. Finally, the percentage of completed verbal handoffs increased to more than 93% following batching of phone calls to PCPs at specific times during the day.
DISCUSSION
We used improvement and reliability science methods to implement a successful process for improving verbal handoffs from HM physicians to PCPs within 24 hours of discharge to 93%. This result has been sustained for 18 months.
Utilization of the PPL call center for flexible call facilitation along with support for data analysis and leveraging the EHR to automate the process increased reliability, leading to rapid improvement. Prior to mandating the use of PPL to connect discharging physicians with PCPs, the exact rate of successful handoffs in our institution was not known. We do know, however, that only 52% of calls were initiated, so clearly a large gap was present prior to our improvement work. Data collection from the PPL system was automated so that accurate, timely, and sustainable data could be provided, greatly aiding improvement efforts. Flexibility in call‐back timing was also crucial, because coordinating the availability of PCPs and discharging physicians is often challenging. The EHR‐initiated process for discharge communication was a key intervention, and improvement of our process measure to 97% performance was associated with this implementation. Two final interventions: (1) assignment of responsibility for communication to a team pager held by a designated resident and (2) batching of calls to specific times streamlined the EHR‐initiated process and were associated with achievement of our main outcome goal of >90% completed verbal communication.
There are several reports of successful interventions to improve receipt or content of discharge summaries by PCPs following hospital discharge available in the literature.[14, 15, 16, 17, 18, 19, 20] Recently, Shen et al. reported on the success of a multisite improvement collaborative involving pediatric hospitalist programs at community hospitals whose aim was to improve the timely documentation of communication directed at PCPs.[21] In their report, all 7 hospital sites that participated in the collaborative for more than 4 months were able to demonstrate substantial improvement in documentation of some form of communication directed at PCPs (whether by e‐mail, fax, or telephone call), from a baseline of approximately 50% to more than 90%. A limitation of their study was that they were unable to document whether PCPs had received any information or by what method. A recent survey of PCPs by Sheu et al. indicated that for many discharges, information in addition to that present in the EHR was desirable to ensure a safe transition of care.[6] Two‐way communication, such as with a phone call, allows for senders to verify information receipt and for receivers to ask questions to ensure complete information. To our knowledge, there have been no previous reports describing processes for improving verbal communication between hospitalist services and PCPs at discharge.
It may be that use of the call system allowed PCPs to return phone calls regarding discharges at convenient stopping points in their day while allowing discharging physicians to initiate a call without having to wait on hold. Interestingly, though we anticipated the need for additional PPL resources during the course of this improvement, the final process was efficient enough that PPL did not require additional staffing to accommodate the higher call volume.
A key insight during our implementation was that relying on the EHR to initiate every discharge communication created disruption of resident workflow due to disregard of patient, resident, and PCP factors. This was reflected by the improvement in call initiation (our process measure) following this intervention, whereas at the same time call completion (our outcome measure) remained below goal. To achieve our goal of completing verbal communication required a process that was highly reliable yet flexible enough to allow discharging physicians to complete the call in the unpredictable environment of inpatient care. Ultimately, this was achieved by allowing discharging physicians to initiate the process when convenient, and allowing for the EHR‐initiated process to function as a backup strategy to identify and mitigate failures of initiation.
An important limitation of our study was the lack of PCPs on the improvement team, likely making the success of the project more difficult than it might have been. For example, during the study we did not measure the time PCPs spent on hold or how many reattempts were needed to complete the communication loop. Immediately following the completion of our study, it became apparent that physicians returning calls for our own institution's primary care clinic were experiencing regular workflow interruptions and occasional hold times more than 20 minutes, necessitating ongoing further work to determine the root causes and solutions to these problems. Though this work is ongoing, average PCP hold times measured from a sample of call reviews in 2013 to 2014 was 3 minutes and 15 seconds.
This study has several other limitations. We were unable to account for phone calls to PCPs initiated outside of the new process. It may be that PCPs were called more than 52% of the time at baseline due to noncompliance with the new protocol. Also, we only have data for call completion starting after implementation of the link between the discharge order and the discharge phone call, making the baseline appear artificially high and precluding any analysis of how earlier interventions affected our outcome metric. Communication with PCPs should ideally occur prior to discharge. An important limitation of our process is that calls could occur several hours after discharge between an on‐call resident and an on‐call outpatient physician rather than between the PCP and the discharging resident, limiting appropriate information exchange. Though verbal discharge communication is a desirable goal for many reasons, the current project did not focus on the quality of the call or the information that was transmitted to the PCP. Additionally, direct attending‐to‐attending communication may be valuable with medically or socially complex discharges, but we did not have a process to facilitate this. We also did not measure what effect our new process had on outcomes such as quality of patient and family transition from hospital or physician satisfaction. The existence of programs similar to our PPL subspecialty referral line may be limited to large institutions. However, it should be noted that although some internal resource reallocation was necessary within PPL, no actual staffing increases were required despite a large increase in call volume. It may be that any hospital operator system could be adapted for this purpose with modest additional resources. Finally, although our EHR system is widely utilized, there are many competing systems in the market, and our intervention required utilization of EHR capabilities that may not be present in all systems. However, our EHR intervention utilized existing functionality and did not require modification of the system.
This project focused on discharge phone calls to primary care physicians for patients hospitalized on the hospital medicine service. Because communication with the PCP should ideally occur prior to discharge, future work will include identifying a more proximal trigger than the discharge order to which to link the EHR trigger for discharge communication. Other next steps to improve handoff effectiveness and optimize the efficiency of our process include identifying essential information that should be transmitted to the primary care physician at the time of the phone call, developing processes to ensure communication of this information, measuring PCP satisfaction with this communication, and measuring the impact on patient outcomes. Finally, though expert opinion indicates that verbal handoffs may have safety advantages over nonverbal handoffs, studies comparing the safety and efficacy of verbal versus nonverbal handoffs at patient discharge are lacking. Studies establishing the relative efficacy and safety of verbal versus nonverbal handoffs at hospital discharge are needed. Knowledge gained from these activities could inform future projects centered on the spread of the process to other hospital services and/or other hospitals.
CONCLUSION
We increased the percentage of calls initiated to PCPs at patient discharge from 52% to 97% and the percentage of calls completed between HM physicians and PCPs to 93% through the use of a standardized discharge communication process coupled with a basic EHR messaging functionality. The results of this study may be of interest for further testing and adaptation for any institution with an electronic healthcare system.
Goldman L, Pantilat SZ, Whitcomb WF. Passing the clinical baton: 6 principles to guide the hospitalist. Am J Med. 2001;111(9B):36S–39S.
Ruth JL, Geskey JM, Shaffer ML, Bramley HP, Paul IM. Evaluating communication between pediatric primary care physicians and hospitalists. Clin Pediatr. 2011;50(10):923–928.
Arora VM, Manjarrez E, Dressler DD, Basaviah P, Halasyamani L, Kripalani S. Hospitalist handoffs: a systematic review and task force recommendations. J Hosp Med. 2009;4(7):433–440.
Patterson ES, Roth EM, Woods DD, Chow R, Gomes JO. Handoff strategies in settings with high consequences for failure: lessons for health care operations. Int J Qual Health Care. 2004;16(2):125–132.
Agency for Healthcare Research and Quality. Patient safety primers: handoffs and signouts. Available at: http://www.psnet.ahrq.gov/primer.aspx?primerID=9. Accessed March 19, 2014.
Sheu L, Fung K, Mourad M, Ranji S, Wu E. We need to talk: primary care provider communication at discharge in the era of a shared electronic medical record. J Hosp Med. 2015;10(5):307–310.
Cohen M, Senders J, Davis N. Failure mode and effects analysis: a novel approach to avoiding dangerous medication errors and accidents. Hosp Pharm.1994;29:319–330.
DeRosier J, Stalhandske E, Bagian J, Nudell T. Using health care Failure Mode and Effect Analysis: the VA National Center for Patient Safety's prospective risk analysis system. Jt Comm J Qual Improv.2002;28:248–267, 209.
Benneyan JC. Statistical quality control methods in infection control and hospital epidemiology, Part II: Chart use, statistical properties, and research issues. Infect Control Hosp Epidemiol. 1998;19(4):265–283.
Benneyan JC. Statistical quality control methods in infection control and hospital epidemiology, part I: Introduction and basic theory. Infect Control Hosp Epidemiol. 1998;19(3):194–214.
Benneyan JC, Lloyd RC, Plsek PE. Statistical process control as a tool for research and healthcare improvement. Qual Saf Health Care. 2003;12(6):458–464.
Langley GJ. The Improvement Guide: A Practical Approach to Enhancing Organizational +Performance. 2nd ed.San Francisco, CA: Jossey‐Bass; 2009.
Provost LP, Murray SK. The Health Care Data Guide: Learning From Data for Improvement. 1st ed.San Francisco, CA: Jossey‐Bass; 2011.
Dover SB, Low‐Beer TS. The initial hospital discharge note: send out with the patient or post?Health Trends. 1984;16(2):48.
Kendrick AR, Hindmarsh DJ. Which type of hospital discharge report reaches general practitioners most quickly?BMJ. 1989;298(6670):362–363.
Smith RP, Holzman GB. The application of a computer data base system to the generation of hospital discharge summaries. Obstet Gynecol. 1989;73(5 pt 1):803–807.
Kenny C. Hospital discharge medication: is seven days supply sufficient?Public Health. 1991;105(3):243–247.
Branger PJ, Wouden JC, Schudel BR, et al. Electronic communication between providers of primary and secondary care. BMJ. 1992;305(6861):1068–1070.
Curran P, Gilmore DH, Beringer TR. Communication of discharge information for elderly patients in hospital. Ulster Med J. 1992;61(1):56–58.
Mant A, Kehoe L, Cockayne NL, Kaye KI, Rotem WC. A quality use of medicines program for continuity of care in therapeutics from hospital to community. Med J Aust. 2002;177(1):32–34.
Shen MW, Hershey D, Bergert L, Mallory L, Fisher ES, Cooperberg D. Pediatric hospitalists collaborate to improve timeliness of discharge communication. Hosp Pediatr. 2013;3(3):258–265.
Timely and reliable communication of important data between hospital‐based physicians and primary care physicians is critical for prevention of medical adverse events.[1, 2] Extrapolation from high‐performance organizations outside of medicine suggests that verbal communication is an important component of patient handoffs.[3, 4] Though the Joint Commission does not mandate verbal communication during handoffs per se, stipulating instead that handoff participants have an opportunity to ask and respond to questions,[5] there is some evidence that primary care providers prefer verbal handoffs at least for certain patients such as those with medical complexity.[6] Verbal communication offers the receiver the opportunity to ask questions, but in practice, 2‐way verbal communication is often difficult to achieve at hospital discharge.
At our institution, hospital medicine (HM) physicians serve as the primary inpatient providers for nearly 90% of all general pediatric admissions. When the HM service was established, primary care physicians (PCPs) and HM physicians together agreed upon an expectation for verbal, physician‐to‐physician communication at the time of discharge. Discharge communication is provided by either residents or attendings depending on the facility. A telephone operator service called Physician Priority Link (PPL) was made available to facilitate this communication. The PPL service is staffed 24/7 by operators whose only responsibilities are to connect providers inside and outside the institution. By utilizing this service, PCPs could respond in a nonemergent fashion to discharge phone calls.
Over the last several years, PCPs have observed high variation in the reliability of discharge communication phone calls. A review of PPL phone records in 2009 showed that only 52% of HM discharges had a record of a call initiated to the PCP on the day of discharge. The overall goal of this improvement project was to improve the completion of verbal handoffs from HM physicians (residents or attendings) to PCPs. The specific aim of the project was to increase the proportion of completed verbal handoffs from on‐call residents or attendings to PCPs within 24 hours of discharge to more than 90% within 18 months.
METHODS
Human Subjects Protection
Our project was undertaken in accordance with institutional review board (IRB) policy on systems improvement work and did not require formal IRB review.
Setting
This study included all patients admitted to the HM service at an academic children's hospital and its satellite campus.
Planning the Intervention
The project was championed by physicians on the HM service and supported by a chief resident, PPL administrators, and 2 information technology analysts.
At the onset of the project, the team mapped the process for completing a discharge call to the PCPs, conducted a modified failure mode and effects analysis,[7, 8] and examined the key drivers used to prioritize interventions (Figure 1). Through the modified failure modes effect analysis, the team was able to identify system issues that led to unsuccessful communication: failure of call initiation, absence of an identified PCP, long wait times on hold, failure of PCP to call back, and failure of the call to be documented. These failure modes informed the key drivers to achieving the study aim. Figure 2 depicts the final key drivers, which were revised through testing and learning.
Figure 1
Preintervention processes and failure modes for discharge communication with PCPs.
Figure 2
Key driver diagram for verbal communication at hospital discharge.
Interventions Targeting Key Stakeholder Buy‐in
To improve resident buy‐in and participation, the purpose and goals of the projects were discussed at resident morning report and during monthly team meetings by the pediatric chief resident on our improvement team. Resident physicians were interested in participating to reduce interruptions during daily rounds and to improve interactions with PCPs. The PPL staff was interested in standardizing the discharge call process to reduce confusion in identifying the appropriate contact when PCPs called residents back to discuss discharges. PCPs were interested in ensuring good communication at discharge, and individual PCPs were engaged through person‐to‐person contact by 1 of the HM physician champions.
Interventions to Standardization the Communication Process
To facilitate initiation of calls to PCPs at hospital discharge, the improvement team created a standard process using the PPL service (Figure 3). All patients discharged from the HM service were included in the process. Discharging physicians (who were usually but not always residents, depending on the facility), were instructed to call the PPL operator at the time of discharge. The PPL operator would then page the patient's PCP. It was the responsibility of the discharging physician to identify a PCP prior to discharge. Instances where no PCP was identified were counted as process failures because no phone call could be made. The expectation for the PCPs was that they would return the page within 20 minutes. PPL operators would then page back to the discharging physician to connect the 2 parties with the expectation that the discharging physician respond within 2 to 4 minutes to the PPL operator's page. Standardization of all calls through PPL allowed efficient tracking of incomplete calls and operators to reattempt calls that were not completed. This process also shifted the burden of following up on incomplete calls to PPL. The use of PPL to make the connection also allowed the physician to complete other work while awaiting a call back from the PCP.
Figure 3
Final process map for verbal communication at discharge.
Leveraging the Electronic Health Record for Process Initiation
To ensure reliable initiation of the discharge communication pathway, the improvement team introduced changes to the electronic health record (HER) (EpicCare Inpatient; Epic Systems Corp., Verona, WI), which generated a message to PPL operators whenever a discharge order was entered for an HM patient. The message contained the patient's name, medical record number, discharge date, discharging physician, and PCP name and phone number. A checklist was implemented by PPL to ensure that duplicate phone calls were not made. To initiate communication, the operator contacted the resident via text page to ensure they were ready to initiate the call. If the resident was ready to place a call, the operator then generated a phone call to the PCP. When the PCP returned the call, the operator connected the HM resident with the PCP for the handoff.
As the project progressed, several adaptations were made to address newly identified failure modes. To address confusion among PPL operators about which resident physicians should take discharge phone calls after the discharging resident was no longer available (for example, after a shift change), primary responsibility for discharge phone calls was reassigned to the daily on‐call resident rather than the resident who wrote the discharge order. Because the on‐call residents carry a single pager, the pager number listed on the automated discharge notification to PPL would never change and would always reach the appropriate team member. Second, to address the anticipated increase in interruption of resident workflow by calls back from PCPs, particularly during rounds, operators accessed information on pending discharge phone calls in batches at times of increased resident availability to minimize hold times for PCPs and work interruptions for the discharging physicians. Batch times were 1 pm and 4 pm to allow for completion of morning rounds, resident conference at noon, and patient‐care activities during the afternoon. Calls initiated after 4 pm were dispatched at the time of the discharge, and calls initiated after 10 pm were deferred to the following day.
Transparency of Data
Throughout the study, weekly failure data were generated from the EHR and emailed to improvement team members, enabling them to focus on near real‐time feedback of data to create a visible and more reliable system. With the standardization of all discharge calls directed to the PPL operators, the team was able to create a call record linked to the patient's medical record number. Team‐specific and overall results for the 5 HM resident teams were displayed weekly on a run chart in the resident conference room. As improvements in call initiation were demonstrated, completion rate data were also shared every several months with the attending hospitalists during a regularly scheduled divisional conference. This transparency of data gave the improvement team the opportunity to provide individual feedback to residents and attendings about failures. The weekly review of failure data allowed team leaders to learn from failures, identify knowledge gaps, and ensure accountability with the HM physicians.
Planning the Study of the Intervention
Data were collected prospectively from July 2011 to March 2014. A weekly list of patients discharged from the HM service was extracted from the EHR and compared to electronic call logs collected by PPL on the day of discharge. A standard sample size of 30 calls was audited separately by PPL and 1 of the physician leads to verify that the patients were discharged from the HM service and validate the percentage of completed and initiated calls.
The percentage of calls initiated within 24 hours of discharge was tracked as a process measure and served as the initial focus of improvement efforts. Our primary outcome measure was the percentage of calls completed to the PCP by the HM physician within 24 hours of discharge.
Methods of Evaluation and Analysis
We used improvement science methods and run charts to determine the percentage of patients discharged from the HM service with a call initiated to the PCP and completed within 24 hours of discharge. Data on calls initiated within 24 hours of discharge were plotted on a run chart to examine the impact of interventions over time. Once interventions targeted at call initiation had been implemented, we began tracking our primary outcome measure. A new run chart was created documenting the percentage of calls completed. For both metrics, the centerline was adjusted using established rules for special cause variation in run charts.[9, 10, 11, 12, 13]
RESULTS
From July 2011 to March 2014, there were 6313 discharges from the HM service. The process measure (percentage of calls initiated) improved from 50% to 97% after 4 interventions (Figure 4). Data for the outcome measure (percentage of calls completed) were collected starting in August 2012, shortly after linking the EHR discharge order to the discharge call. Over the first 8 weeks, our median was 80%, which increased to a median of 93% (Figure 5). These results were sustained for 18 months.
Figure 4
Percent of calls made to primary care physicians within 24 hours of hospital discharge.
Figure 5
Percent of calls to primary care physicians completed within 24 hours of discharge.
Several key interventions were identified that were critical to achievement of our goal. Standardization of the communication process through PPL was temporally associated with a shift in the median rate of call initiation from 52% to 72%. Use of the discharge order to initiate discharge communication was associated with an increase from 72% to 97%. Finally, the percentage of completed verbal handoffs increased to more than 93% following batching of phone calls to PCPs at specific times during the day.
DISCUSSION
We used improvement and reliability science methods to implement a successful process for improving verbal handoffs from HM physicians to PCPs within 24 hours of discharge to 93%. This result has been sustained for 18 months.
Utilization of the PPL call center for flexible call facilitation along with support for data analysis and leveraging the EHR to automate the process increased reliability, leading to rapid improvement. Prior to mandating the use of PPL to connect discharging physicians with PCPs, the exact rate of successful handoffs in our institution was not known. We do know, however, that only 52% of calls were initiated, so clearly a large gap was present prior to our improvement work. Data collection from the PPL system was automated so that accurate, timely, and sustainable data could be provided, greatly aiding improvement efforts. Flexibility in call‐back timing was also crucial, because coordinating the availability of PCPs and discharging physicians is often challenging. The EHR‐initiated process for discharge communication was a key intervention, and improvement of our process measure to 97% performance was associated with this implementation. Two final interventions: (1) assignment of responsibility for communication to a team pager held by a designated resident and (2) batching of calls to specific times streamlined the EHR‐initiated process and were associated with achievement of our main outcome goal of >90% completed verbal communication.
There are several reports of successful interventions to improve receipt or content of discharge summaries by PCPs following hospital discharge available in the literature.[14, 15, 16, 17, 18, 19, 20] Recently, Shen et al. reported on the success of a multisite improvement collaborative involving pediatric hospitalist programs at community hospitals whose aim was to improve the timely documentation of communication directed at PCPs.[21] In their report, all 7 hospital sites that participated in the collaborative for more than 4 months were able to demonstrate substantial improvement in documentation of some form of communication directed at PCPs (whether by e‐mail, fax, or telephone call), from a baseline of approximately 50% to more than 90%. A limitation of their study was that they were unable to document whether PCPs had received any information or by what method. A recent survey of PCPs by Sheu et al. indicated that for many discharges, information in addition to that present in the EHR was desirable to ensure a safe transition of care.[6] Two‐way communication, such as with a phone call, allows for senders to verify information receipt and for receivers to ask questions to ensure complete information. To our knowledge, there have been no previous reports describing processes for improving verbal communication between hospitalist services and PCPs at discharge.
It may be that use of the call system allowed PCPs to return phone calls regarding discharges at convenient stopping points in their day while allowing discharging physicians to initiate a call without having to wait on hold. Interestingly, though we anticipated the need for additional PPL resources during the course of this improvement, the final process was efficient enough that PPL did not require additional staffing to accommodate the higher call volume.
A key insight during our implementation was that relying on the EHR to initiate every discharge communication created disruption of resident workflow due to disregard of patient, resident, and PCP factors. This was reflected by the improvement in call initiation (our process measure) following this intervention, whereas at the same time call completion (our outcome measure) remained below goal. To achieve our goal of completing verbal communication required a process that was highly reliable yet flexible enough to allow discharging physicians to complete the call in the unpredictable environment of inpatient care. Ultimately, this was achieved by allowing discharging physicians to initiate the process when convenient, and allowing for the EHR‐initiated process to function as a backup strategy to identify and mitigate failures of initiation.
An important limitation of our study was the lack of PCPs on the improvement team, likely making the success of the project more difficult than it might have been. For example, during the study we did not measure the time PCPs spent on hold or how many reattempts were needed to complete the communication loop. Immediately following the completion of our study, it became apparent that physicians returning calls for our own institution's primary care clinic were experiencing regular workflow interruptions and occasional hold times more than 20 minutes, necessitating ongoing further work to determine the root causes and solutions to these problems. Though this work is ongoing, average PCP hold times measured from a sample of call reviews in 2013 to 2014 was 3 minutes and 15 seconds.
This study has several other limitations. We were unable to account for phone calls to PCPs initiated outside of the new process. It may be that PCPs were called more than 52% of the time at baseline due to noncompliance with the new protocol. Also, we only have data for call completion starting after implementation of the link between the discharge order and the discharge phone call, making the baseline appear artificially high and precluding any analysis of how earlier interventions affected our outcome metric. Communication with PCPs should ideally occur prior to discharge. An important limitation of our process is that calls could occur several hours after discharge between an on‐call resident and an on‐call outpatient physician rather than between the PCP and the discharging resident, limiting appropriate information exchange. Though verbal discharge communication is a desirable goal for many reasons, the current project did not focus on the quality of the call or the information that was transmitted to the PCP. Additionally, direct attending‐to‐attending communication may be valuable with medically or socially complex discharges, but we did not have a process to facilitate this. We also did not measure what effect our new process had on outcomes such as quality of patient and family transition from hospital or physician satisfaction. The existence of programs similar to our PPL subspecialty referral line may be limited to large institutions. However, it should be noted that although some internal resource reallocation was necessary within PPL, no actual staffing increases were required despite a large increase in call volume. It may be that any hospital operator system could be adapted for this purpose with modest additional resources. Finally, although our EHR system is widely utilized, there are many competing systems in the market, and our intervention required utilization of EHR capabilities that may not be present in all systems. However, our EHR intervention utilized existing functionality and did not require modification of the system.
This project focused on discharge phone calls to primary care physicians for patients hospitalized on the hospital medicine service. Because communication with the PCP should ideally occur prior to discharge, future work will include identifying a more proximal trigger than the discharge order to which to link the EHR trigger for discharge communication. Other next steps to improve handoff effectiveness and optimize the efficiency of our process include identifying essential information that should be transmitted to the primary care physician at the time of the phone call, developing processes to ensure communication of this information, measuring PCP satisfaction with this communication, and measuring the impact on patient outcomes. Finally, though expert opinion indicates that verbal handoffs may have safety advantages over nonverbal handoffs, studies comparing the safety and efficacy of verbal versus nonverbal handoffs at patient discharge are lacking. Studies establishing the relative efficacy and safety of verbal versus nonverbal handoffs at hospital discharge are needed. Knowledge gained from these activities could inform future projects centered on the spread of the process to other hospital services and/or other hospitals.
CONCLUSION
We increased the percentage of calls initiated to PCPs at patient discharge from 52% to 97% and the percentage of calls completed between HM physicians and PCPs to 93% through the use of a standardized discharge communication process coupled with a basic EHR messaging functionality. The results of this study may be of interest for further testing and adaptation for any institution with an electronic healthcare system.
Disclosure: Nothing to report.
References
Goldman L, Pantilat SZ, Whitcomb WF. Passing the clinical baton: 6 principles to guide the hospitalist. Am J Med. 2001;111(9B):36S–39S.
Ruth JL, Geskey JM, Shaffer ML, Bramley HP, Paul IM. Evaluating communication between pediatric primary care physicians and hospitalists. Clin Pediatr. 2011;50(10):923–928.
Arora VM, Manjarrez E, Dressler DD, Basaviah P, Halasyamani L, Kripalani S. Hospitalist handoffs: a systematic review and task force recommendations. J Hosp Med. 2009;4(7):433–440.
Patterson ES, Roth EM, Woods DD, Chow R, Gomes JO. Handoff strategies in settings with high consequences for failure: lessons for health care operations. Int J Qual Health Care. 2004;16(2):125–132.
Agency for Healthcare Research and Quality. Patient safety primers: handoffs and signouts. Available at: http://www.psnet.ahrq.gov/primer.aspx?primerID=9. Accessed March 19, 2014.
Sheu L, Fung K, Mourad M, Ranji S, Wu E. We need to talk: primary care provider communication at discharge in the era of a shared electronic medical record. J Hosp Med. 2015;10(5):307–310.
Cohen M, Senders J, Davis N. Failure mode and effects analysis: a novel approach to avoiding dangerous medication errors and accidents. Hosp Pharm.1994;29:319–330.
DeRosier J, Stalhandske E, Bagian J, Nudell T. Using health care Failure Mode and Effect Analysis: the VA National Center for Patient Safety's prospective risk analysis system. Jt Comm J Qual Improv.2002;28:248–267, 209.
Benneyan JC. Statistical quality control methods in infection control and hospital epidemiology, Part II: Chart use, statistical properties, and research issues. Infect Control Hosp Epidemiol. 1998;19(4):265–283.
Benneyan JC. Statistical quality control methods in infection control and hospital epidemiology, part I: Introduction and basic theory. Infect Control Hosp Epidemiol. 1998;19(3):194–214.
Benneyan JC, Lloyd RC, Plsek PE. Statistical process control as a tool for research and healthcare improvement. Qual Saf Health Care. 2003;12(6):458–464.
Langley GJ. The Improvement Guide: A Practical Approach to Enhancing Organizational +Performance. 2nd ed.San Francisco, CA: Jossey‐Bass; 2009.
Provost LP, Murray SK. The Health Care Data Guide: Learning From Data for Improvement. 1st ed.San Francisco, CA: Jossey‐Bass; 2011.
Dover SB, Low‐Beer TS. The initial hospital discharge note: send out with the patient or post?Health Trends. 1984;16(2):48.
Kendrick AR, Hindmarsh DJ. Which type of hospital discharge report reaches general practitioners most quickly?BMJ. 1989;298(6670):362–363.
Smith RP, Holzman GB. The application of a computer data base system to the generation of hospital discharge summaries. Obstet Gynecol. 1989;73(5 pt 1):803–807.
Kenny C. Hospital discharge medication: is seven days supply sufficient?Public Health. 1991;105(3):243–247.
Branger PJ, Wouden JC, Schudel BR, et al. Electronic communication between providers of primary and secondary care. BMJ. 1992;305(6861):1068–1070.
Curran P, Gilmore DH, Beringer TR. Communication of discharge information for elderly patients in hospital. Ulster Med J. 1992;61(1):56–58.
Mant A, Kehoe L, Cockayne NL, Kaye KI, Rotem WC. A quality use of medicines program for continuity of care in therapeutics from hospital to community. Med J Aust. 2002;177(1):32–34.
Shen MW, Hershey D, Bergert L, Mallory L, Fisher ES, Cooperberg D. Pediatric hospitalists collaborate to improve timeliness of discharge communication. Hosp Pediatr. 2013;3(3):258–265.
Address for correspondence and reprint requests: Grant Mussman, MD, MLC 3024, Division of Hospital Medicine, Cincinnati Children's Hospital Medical Center, Cincinnati, Ohio 45229; E‐mail: grant.mussman@cchmc.org
Bronchiolitis is the most common cause of hospitalization in infancy, with estimated annual US costs of over $1.7 billion.[1] The last 2 decades have seen numerous thoughtful and well‐designed research studies but little improvement in the value of care.[1, 2, 3, 4] The diagnosis and treatment section of the recently released 2014 American Academy of Pediatrics (AAP) Clinical Practice Guideline for bronchiolitis contains 7 should not's and 3 should's,[3] with the only clear affirmative recommendations related to the history and physical and to the use of supplemental fluids. As supported by several systematic reviews and randomized controlled trials, the use of respiratory treatments, including ‐agonists, racemic epinephrine, and hypertonic saline, was discouraged. There continues to be significant variation in care for patients with bronchiolitis[5, 6] and rigorous evidence was lacking on when a child could be safely discharged home.
Mansbach and colleagues in the Multicenter Airway Research Collaboration (MARC‐30) provide the best evidence to date on the clinical course of bronchiolitis and present multicenter data upon which to build evidence‐based discharge criteria.[7] In their prospective cohort study of 16 US children's hospitals, Mansbach et al. sought to answer 3 research questions: (1) In infants hospitalized with bronchiolitis, what is the time to clinical improvement? (2) What is the risk of clinical worsening after standardized improvement criteria are met? (3) What discharge criteria might balance both timely discharge and very low readmission risk? In an analytic cohort of 1916 children <2 years of age with a physician diagnosis of bronchiolitis, the time from onset of difficulty breathing until clinical improvement was a median of 4 days, with a 75th percentile of 7.5 days. Of the 1702 children who clinically improved before discharge, only 76 (4%) then worsened. Although there are some limitations to how these criteria were assessed, the authors' work supports discharge criteria of (1) no or mild and stable or improving retractions, (2) stable or improving respiratory rate that is below the 90th percentile for age, (3) estimated room air saturation of 90% without any points <88%, and (4) clinician assessment of the child maintaining adequate oral hydration, regardless of use of intravenous fluids.
Three limitations warrant consideration when interpreting the study results. First, the MARC‐30 investigators oversampled from the intensive care unit and excluded 109 children with a hospital length of stay (LOS) <1 day. Although it is uncertain what effect these decisions would have on worsening after improving, both would overestimate the LOS in the sampled population at study hospitals. It is likely that the median LOS and 75th percentile of 4 and 7.5 days, respectively, are higher than what hospital medicine physicians saw at these hospitals. Second, the study team did not use a scoring tool. The authors note that the holistic assessments clinicians used to estimate respiratory rate and oxygen saturation may be more similar to standard clinical practice more than a calculated mean. This raises an important question: If less numerous data might lead to more information and knowledge, might they also lead to reliability and validity concerns? Given an absence of a structured, validated assessment of these severity indicators, it seems possible clinicians worked backward from the holistic assessment of this child is ready to go home and then entered data to support their larger assessment. This would tend to bias toward lower proportions of worsening after clinical improvement. Third, the once‐daily review of the medical record led to less precise estimates of each event including time from difficulty breathing to improvement and LOS. In addition to the absence of a scoring tool, this likely adds a modest bias toward underdetection of clinical worsening after improvement, because observations from discharged children were effectively censored from analysis. Importantly the low readmission rates suggest neither of those biases is substantial.
Several of the findings in this article support recent changes to the recommendations in the 2014 AAP Bronchiolitis Clinical Practice Guideline.[3] Although there is no recommendation on discharge readiness, Mansbach and colleagues found that an operationalization of the core criteria outlined in the 2006 version of the AAP Bronchiolitis Clinical Practice Guideline would result in a low proportion of subsequent clinical worsening.[8] This study also informs and supports an additional change to the AAP's 2006 guideline recommendation on continuous pulse oximetry. Key Action Statement 6b in the 2014 guideline notes Clinicians may choose not to use continuous pulse oximetry for infants and children with a diagnosis of bronchiolitis, expanding the recommendation from the 2006 guideline discouraging continuous pulse oximetry as the child's clinical course improves.[3, 8] Mansbach and colleagues found that removing the lower desaturation threshold of 88% improved the percentage of children who met criteria, with no changes in proportion subsequently worsening. With an improvement criterion of average oxygen saturation threshold of 95%, less than half of the children met this criteria before discharge, and an increased percentage (5%) clinically worsened, presumably due to clinically inconsequential desaturations to 94%. The less stringent the pulse oximetry criteria, the better their improvement criteria performed. This study adds to the modest literature on how overuse of continuous pulse oximetry may prolong hospitalization, leading to nonvalue‐added care and potentially increasing the risk of iatrogenic harm.[9, 10, 11]
Another strength of this study is the extensive viral testing on nasal aspirates. The absence of an association between individual viral pathogen or coinfection on the risk of worsening after improving further supports the recommendation against viral testing. The authors also identified a large group of children with a very low risk of worsening after an improving course: children 2 months, born at term, and who did not present with severe retractions. This finding, which will resonate with clinicians who care for patients with bronchiolitis, provides additional data on a group likely to have short hospitalization and unlikely to benefit from therapies. It also identifies a group of children with increased risk of worsening, which could be targeted for future research efforts on therapies such as hypertonic saline and high‐flow nasal cannula, where the evidence is mixed and inconclusive.
Both the MARC‐30 study and the 2014 AAP guidelines are tremendous contributions to the scientific literature on this common, costly, and often frustrating disease for clinicians and families alike. More important, however, will be implementation and dissemination efforts to ensure children benefit from this new knowledge. After the 2006 AAP guidelines, there was some evidence of improved care[12] but remaining profound hospital‐level variation.[5] Immediate next steps to improve bronchiolitis care should include interventions to standardize evidence‐based discharge criteria and reduce the overuse of nonevidence‐based care. Local clinical practice guidelines aid in the early phases of standardization, but without work and willpower in the implementation and sustain phase, their effect may be modest.[13] This study and the new guideline raise several important T3[14] or how questions for pediatric hospital medicine clinicians, researchers, and improvers. First, how can evidence‐based discharge criteria, such as those presented here, be applied reliably and broadly at the point of care? White and colleagues at Cincinnati shared a strategy that will benefit from further testing and adaptation.[15] Second, how can continuous pulse oximetry be either greatly reduced or have its data put in a broader context to inform decision making? Relatedly, which strategy is more effective and for whom? Finally, what incentives at the hospital and policy level are most effective in helping physicians to choose wisely[16] and do less?
Answering these questions will be crucial to ensure the knowledge produced from Mansbach and colleagues benefits the hundreds of thousands of children hospitalized with bronchiolitis each year.
Hasegawa K, Tsugawa Y, Brown DF, Mansbach JM, Camargo CA. Trends in bronchiolitis hospitalizations in the United States, 2000–2009. Pediatrics. 2013;132(1):28–36.
Shay DK, Holman RC, Newman RD, Liu LL, Stout JW, Anderson LJ. Bronchiolitis‐associated hospitalizations among US children, 1980–1996. JAMA. 1999;282(15):1440–1446.
Ralston SL, Lieberthal AS, Meissner HC, et al. Clinical practice guideline: the diagnosis, management, and prevention of bronchiolitis. Pediatrics. 2014;134(5):e1474–e1502.
Shay DK, Holman RC, Roosevelt GE, Clarke MJ, Anderson LJ. Bronchiolitis‐associated mortality and estimates of respiratory syncytial virus‐associated deaths among US children, 1979–1997. J Infect Dis. 2001;183(1):16–22.
Florin TA, Byczkowski T, Ruddy RM, Zorc JJ, Test M, Shah SS. Variation in the management of infants hospitalized for bronchiolitis persists after the 2006 American Academy of Pediatrics bronchiolitis guidelines. J Pediatr. 2014;165(4):786–792.e781.
Cheung CR, Smith H, Thurland K, Duncan H, Semple MG. Population variation in admission rates and duration of inpatient stay for bronchiolitis in England. Arch Dis Child. 2013;98(1):57–59.
Mansbach JM, Clark S, Piedra PA, et al.; MARC‐30 Investigators. Hospital course and discharge criteria for children hospitalized with bronchiolitis. J Hosp Med.2015;10(4):205–211.
American Academy of Pediatrics Subcommittee on Diagnosis and Management of Bronchiolitis. Diagnosis and management of bronchiolitis. Pediatrics. 2006;118(4):1774–1793.
Schroeder AR, Marmor AK, Pantell RH, Newman TB. Impact of pulse oximetry and oxygen therapy on length of stay in bronchiolitis hospitalizations. Arch Pediatr Adolesc Med. 2004;158(6):527–530.
Cunningham S, McMurray A. Observational study of two oxygen saturation targets for discharge in bronchiolitis. Arch Dis Child. 2012;97(4):361–363.
McBride SC, Chiang VW, Goldmann DA, Landrigan CP. Preventable adverse events in infants hospitalized with bronchiolitis. Pediatrics. 2005;116(3):603–608.
Parikh K, Hall M, Teach SJ. Bronchiolitis management before and after the AAP guidelines. Pediatrics. 2014;133(1):e1–e7.
Mittal V, Hall M, Morse R, et al. Impact of inpatient bronchiolitis clinical practice guideline implementation on testing and treatment. J Pediatr. 2014;165(3):570–576.e573.
Dougherty D, Conway PH. The "3T's" road map to transform US health care: the "how" of high‐quality care. JAMA. 2008;299(19):2319–2321.
White CM, Statile AM, White DL, et al. Using quality improvement to optimise paediatric discharge efficiency. BMJ Qual Saf. 2014;23(5):428–436.
Quinonez RA, Garber MD, Schroeder AR, et al. Choosing wisely in pediatric hospital medicine: five opportunities for improved healthcare value. J Hosp Med. 2013;8(9):479–485.
Bronchiolitis is the most common cause of hospitalization in infancy, with estimated annual US costs of over $1.7 billion.[1] The last 2 decades have seen numerous thoughtful and well‐designed research studies but little improvement in the value of care.[1, 2, 3, 4] The diagnosis and treatment section of the recently released 2014 American Academy of Pediatrics (AAP) Clinical Practice Guideline for bronchiolitis contains 7 should not's and 3 should's,[3] with the only clear affirmative recommendations related to the history and physical and to the use of supplemental fluids. As supported by several systematic reviews and randomized controlled trials, the use of respiratory treatments, including ‐agonists, racemic epinephrine, and hypertonic saline, was discouraged. There continues to be significant variation in care for patients with bronchiolitis[5, 6] and rigorous evidence was lacking on when a child could be safely discharged home.
Mansbach and colleagues in the Multicenter Airway Research Collaboration (MARC‐30) provide the best evidence to date on the clinical course of bronchiolitis and present multicenter data upon which to build evidence‐based discharge criteria.[7] In their prospective cohort study of 16 US children's hospitals, Mansbach et al. sought to answer 3 research questions: (1) In infants hospitalized with bronchiolitis, what is the time to clinical improvement? (2) What is the risk of clinical worsening after standardized improvement criteria are met? (3) What discharge criteria might balance both timely discharge and very low readmission risk? In an analytic cohort of 1916 children <2 years of age with a physician diagnosis of bronchiolitis, the time from onset of difficulty breathing until clinical improvement was a median of 4 days, with a 75th percentile of 7.5 days. Of the 1702 children who clinically improved before discharge, only 76 (4%) then worsened. Although there are some limitations to how these criteria were assessed, the authors' work supports discharge criteria of (1) no or mild and stable or improving retractions, (2) stable or improving respiratory rate that is below the 90th percentile for age, (3) estimated room air saturation of 90% without any points <88%, and (4) clinician assessment of the child maintaining adequate oral hydration, regardless of use of intravenous fluids.
Three limitations warrant consideration when interpreting the study results. First, the MARC‐30 investigators oversampled from the intensive care unit and excluded 109 children with a hospital length of stay (LOS) <1 day. Although it is uncertain what effect these decisions would have on worsening after improving, both would overestimate the LOS in the sampled population at study hospitals. It is likely that the median LOS and 75th percentile of 4 and 7.5 days, respectively, are higher than what hospital medicine physicians saw at these hospitals. Second, the study team did not use a scoring tool. The authors note that the holistic assessments clinicians used to estimate respiratory rate and oxygen saturation may be more similar to standard clinical practice more than a calculated mean. This raises an important question: If less numerous data might lead to more information and knowledge, might they also lead to reliability and validity concerns? Given an absence of a structured, validated assessment of these severity indicators, it seems possible clinicians worked backward from the holistic assessment of this child is ready to go home and then entered data to support their larger assessment. This would tend to bias toward lower proportions of worsening after clinical improvement. Third, the once‐daily review of the medical record led to less precise estimates of each event including time from difficulty breathing to improvement and LOS. In addition to the absence of a scoring tool, this likely adds a modest bias toward underdetection of clinical worsening after improvement, because observations from discharged children were effectively censored from analysis. Importantly the low readmission rates suggest neither of those biases is substantial.
Several of the findings in this article support recent changes to the recommendations in the 2014 AAP Bronchiolitis Clinical Practice Guideline.[3] Although there is no recommendation on discharge readiness, Mansbach and colleagues found that an operationalization of the core criteria outlined in the 2006 version of the AAP Bronchiolitis Clinical Practice Guideline would result in a low proportion of subsequent clinical worsening.[8] This study also informs and supports an additional change to the AAP's 2006 guideline recommendation on continuous pulse oximetry. Key Action Statement 6b in the 2014 guideline notes Clinicians may choose not to use continuous pulse oximetry for infants and children with a diagnosis of bronchiolitis, expanding the recommendation from the 2006 guideline discouraging continuous pulse oximetry as the child's clinical course improves.[3, 8] Mansbach and colleagues found that removing the lower desaturation threshold of 88% improved the percentage of children who met criteria, with no changes in proportion subsequently worsening. With an improvement criterion of average oxygen saturation threshold of 95%, less than half of the children met this criteria before discharge, and an increased percentage (5%) clinically worsened, presumably due to clinically inconsequential desaturations to 94%. The less stringent the pulse oximetry criteria, the better their improvement criteria performed. This study adds to the modest literature on how overuse of continuous pulse oximetry may prolong hospitalization, leading to nonvalue‐added care and potentially increasing the risk of iatrogenic harm.[9, 10, 11]
Another strength of this study is the extensive viral testing on nasal aspirates. The absence of an association between individual viral pathogen or coinfection on the risk of worsening after improving further supports the recommendation against viral testing. The authors also identified a large group of children with a very low risk of worsening after an improving course: children 2 months, born at term, and who did not present with severe retractions. This finding, which will resonate with clinicians who care for patients with bronchiolitis, provides additional data on a group likely to have short hospitalization and unlikely to benefit from therapies. It also identifies a group of children with increased risk of worsening, which could be targeted for future research efforts on therapies such as hypertonic saline and high‐flow nasal cannula, where the evidence is mixed and inconclusive.
Both the MARC‐30 study and the 2014 AAP guidelines are tremendous contributions to the scientific literature on this common, costly, and often frustrating disease for clinicians and families alike. More important, however, will be implementation and dissemination efforts to ensure children benefit from this new knowledge. After the 2006 AAP guidelines, there was some evidence of improved care[12] but remaining profound hospital‐level variation.[5] Immediate next steps to improve bronchiolitis care should include interventions to standardize evidence‐based discharge criteria and reduce the overuse of nonevidence‐based care. Local clinical practice guidelines aid in the early phases of standardization, but without work and willpower in the implementation and sustain phase, their effect may be modest.[13] This study and the new guideline raise several important T3[14] or how questions for pediatric hospital medicine clinicians, researchers, and improvers. First, how can evidence‐based discharge criteria, such as those presented here, be applied reliably and broadly at the point of care? White and colleagues at Cincinnati shared a strategy that will benefit from further testing and adaptation.[15] Second, how can continuous pulse oximetry be either greatly reduced or have its data put in a broader context to inform decision making? Relatedly, which strategy is more effective and for whom? Finally, what incentives at the hospital and policy level are most effective in helping physicians to choose wisely[16] and do less?
Answering these questions will be crucial to ensure the knowledge produced from Mansbach and colleagues benefits the hundreds of thousands of children hospitalized with bronchiolitis each year.
Disclosure
Nothing to report.
References
Hasegawa K, Tsugawa Y, Brown DF, Mansbach JM, Camargo CA. Trends in bronchiolitis hospitalizations in the United States, 2000–2009. Pediatrics. 2013;132(1):28–36.
Shay DK, Holman RC, Newman RD, Liu LL, Stout JW, Anderson LJ. Bronchiolitis‐associated hospitalizations among US children, 1980–1996. JAMA. 1999;282(15):1440–1446.
Ralston SL, Lieberthal AS, Meissner HC, et al. Clinical practice guideline: the diagnosis, management, and prevention of bronchiolitis. Pediatrics. 2014;134(5):e1474–e1502.
Shay DK, Holman RC, Roosevelt GE, Clarke MJ, Anderson LJ. Bronchiolitis‐associated mortality and estimates of respiratory syncytial virus‐associated deaths among US children, 1979–1997. J Infect Dis. 2001;183(1):16–22.
Florin TA, Byczkowski T, Ruddy RM, Zorc JJ, Test M, Shah SS. Variation in the management of infants hospitalized for bronchiolitis persists after the 2006 American Academy of Pediatrics bronchiolitis guidelines. J Pediatr. 2014;165(4):786–792.e781.
Cheung CR, Smith H, Thurland K, Duncan H, Semple MG. Population variation in admission rates and duration of inpatient stay for bronchiolitis in England. Arch Dis Child. 2013;98(1):57–59.
Mansbach JM, Clark S, Piedra PA, et al.; MARC‐30 Investigators. Hospital course and discharge criteria for children hospitalized with bronchiolitis. J Hosp Med.2015;10(4):205–211.
American Academy of Pediatrics Subcommittee on Diagnosis and Management of Bronchiolitis. Diagnosis and management of bronchiolitis. Pediatrics. 2006;118(4):1774–1793.
Schroeder AR, Marmor AK, Pantell RH, Newman TB. Impact of pulse oximetry and oxygen therapy on length of stay in bronchiolitis hospitalizations. Arch Pediatr Adolesc Med. 2004;158(6):527–530.
Cunningham S, McMurray A. Observational study of two oxygen saturation targets for discharge in bronchiolitis. Arch Dis Child. 2012;97(4):361–363.
McBride SC, Chiang VW, Goldmann DA, Landrigan CP. Preventable adverse events in infants hospitalized with bronchiolitis. Pediatrics. 2005;116(3):603–608.
Parikh K, Hall M, Teach SJ. Bronchiolitis management before and after the AAP guidelines. Pediatrics. 2014;133(1):e1–e7.
Mittal V, Hall M, Morse R, et al. Impact of inpatient bronchiolitis clinical practice guideline implementation on testing and treatment. J Pediatr. 2014;165(3):570–576.e573.
Dougherty D, Conway PH. The "3T's" road map to transform US health care: the "how" of high‐quality care. JAMA. 2008;299(19):2319–2321.
White CM, Statile AM, White DL, et al. Using quality improvement to optimise paediatric discharge efficiency. BMJ Qual Saf. 2014;23(5):428–436.
Quinonez RA, Garber MD, Schroeder AR, et al. Choosing wisely in pediatric hospital medicine: five opportunities for improved healthcare value. J Hosp Med. 2013;8(9):479–485.
Acute illness requiring hospitalization can be overwhelming for children and their families who are coping with illness and the synthesis of information from a variety of healthcare providers.[1] Patient and family centeredness is endorsed by the Institute of Medicine and the American Academy of Pediatrics[2, 3] as central to quality healthcare. In academic institutions, the presence of medical students and residents adds to the number of providers families encounter. In July 2011, the Accreditation Council for Graduate Medical Education implemented new duty hour restrictions, limiting first year residents to a maximum of 16 hour shifts.[4] Consequently, caregivers and patients may be in contact with more healthcare providers; this fractured care may confuse patients and caregivers, and increase dissatisfaction with care.[5]
The primary objective of our study was to determine the effect of a face sheet tool on the percentage of medical team members correctly identified by caregivers. The secondary objective was to determine the effect of a face sheet tool on the evaluation and satisfaction rating of the medical team by caregivers. We hypothesized that caregivers who receive the face sheet tool will correctly identify a greater percentage of team members by name and role and have higher overall satisfaction with their hospital stay.
METHODS
We performed a prospective controlled study on 2 general pediatric units at Cincinnati Children's Hospital Medical Center (CCHMC). Patients on the intervention unit received the face sheet tool, whereas the concurrent control unit maintained usual procedures. Both units have 24 beds and care for general pediatric patients primarily covered by 4 resident teams and the hospital medicine faculty. Two paired resident teams composed of 2 senior residents, 3 to 4 interns, and 4 medical students primarily admit to each general pediatric unit. Team members rotate through day and night shifts. All employees and rotating students are required to wear the hospital issued identification badge that includes their names, photos, credentials, and role. The study was conducted from November 1, 2011 to November 30, 2011.
Included patients were admitted to the study units by the usual protocol at our hospital, in which nurse patient‐flow coordinators determine bed assignments. We excluded families whose children had an inpatient hospital stay of <12 hours and families who did not speak English. All patient families scheduled to be discharged later in the day on weekday mornings from the 2 study units were approached for study participation. Families were not compensated for their participation.
A face sheet tool, which is a sheet of paper with pictures and names of the intervention team attendings, senior residents, interns, and medical students as well as a description of team member roles, was distributed to patients and their caregivers. The face sheet tools were created using Microsoft Publisher (Microsoft Corp., Redmond, WA). Neither families nor providers were blinded to the intervention, and the residents assumed responsibility for introducing the face sheet tool to families.
For our primary outcome measure, the research coordinator asked participating caregivers to match provider photographs with names and roles by placing laminated pictures backed with Velcro tape in the appropriate position on a laminated poster sheet. Initially, we collected overall accuracy of identification by name and role. In the second week, we began collecting specific data on the attending physician.
The satisfaction survey consisted of the American Board of Internal Medicine (ABIM) patient satisfaction questionnaire, composed of 10, 5‐point Likert scale questions,[6, 7] and an overall rating of hospital question, On a scale from 1 to 10, with 1 being the worst possible hospital and 10 being the best possible hospital, what number would you rate this hospital? from the Hospital Consumer Assessment of Health Plans Survey.[8] Questions were asked aloud and families responded to the questions orally. A written list was also provided to families. We collected data on length of stay (LOS) at the time of outcome assessment as well as previous hospitalizations.
Data Analysis
Differences between the intervention and control groups for relationship of survey respondent to child, prior hospitalization, and LOS were evaluated using the Fisher exact, 2, and 2‐sample t test, respectively. Hospital LOS was log‐transformed prior to analysis. The effect of the face sheet tool was evaluated by analyzing the differences between the intervention and control groups in the proportion of correctly identified names and roles using the Wilcoxon rank sum test and using the Fisher exact test for attending identification. Skewed Likert scale satisfaction ratings and overall hospital ratings were dichotomized at the highest score possible and analyzed using the 2 test. An analysis adjusting for prior hospitalization and LOS was done using generalized linear models, with a Poisson link for the number of correctly identified names/roles and an offset for the number of names/roles given.
Our research was reviewed by the CCHMC institutional review board and deemed exempt.
RESULTS
A total of 96 families were approached for enrollment (50 in the intervention and 46 in the control). Of these, 86 families agreed to participate. Three families in the intervention group did not receive the face sheet tool and were excluded from analysis, leaving an analytic cohort of 83 (41 in intervention and 42 in control). Attending recognition by role was collected from 54 families (28 in intervention group and 26 in control group) and by name from 34 families (15 in intervention group and 19 in control group). Table 1 displays characteristics of each group. Among the 83 study participants, LOS at time of outcome assessment ranged from 0.4 to 12.0 days, and the number of medical team members that cared for these patients ranged from 3 to 14.
NOTE: Data are expressed as n (%) or geometric mean (95% confidence interval).
P values for the difference between groups are from 2 test or Fisher exact test for categorical variables and 2‐sample t test for log length of stay.
Relationship to patient
0.67
Mother
33 (80%)
35 (83%)
Father
5 (12%)
6 (14%)
Grandmother/legal guardian
3 (7%)
1 (2%)
Prior hospitalization, yes
12 (29%)
24 (57%)
0.01
Length of stay (days)
1.07 (0.861.34)
1.32 (1.051.67)
0.20
Families in the intervention group had a higher percentage of correctly identified members of the medical team by name and role as compared to the control group (Table 2). These findings remained significant after adjusting for LOS and prior hospitalization. In addition, in a subset of families with attending data available, more families accurately identified attending name and attending role in the intervention as compared to control group.
Team Member Identification and Satisfaction Rating by Group
No significant differences were noted between the groups when comparing all individual ABIM survey question scores or the overall hospital satisfaction rating (Table 2). Scores in both intervention and control groups were high in all categories.
DISCUSSION
Caregivers given the face sheet tool were better able to identify medical team members by name and role than caregivers in the control group. Previous studies have shown similar results.[9, 10] Families encountered a large number of providers (median of 8) during stays that were on average quite brief (median LOS of 23.6 hours). Despite the significant increase in caregivers' ability to identify providers, the effect was modest.
Our findings add to prior work on face sheet tools in pediatrics and internal medicine.[9, 10, 11] Our study occurred after the residency duty hour restrictions. We described the high number of providers that families encounter in this context. It is the first study to our knowledge to quantify the number of providers that families encounter after these changes and to report on how well families can identify these clinicians by name and role. Unlike other studies, satisfaction scores were not improved.[9] Potential reasons for this include: (1) caregiver knowledge of 2 to 4 key members of the team and not the whole team may be the primary driver of satisfaction, (2) caregiver activation or empowerment may be a more responsive measure than overall satisfaction, and (3) our satisfaction measures may have ceiling effects and/or be elevated in both groups by social desirability bias.
Our study highlights the need for further investigation of quality outcomes associated with residency work hour changes.[12, 13, 14] Specifically, exposure to large numbers of providers may hinder families from accurately identifying those entrusted with the care of their loved one. Of note, our research coordinator needed to present as many as 14 provider pictures to 1 family with a hospital stay of <24 hours. Large numbers of providers may create challenges in building rapport, ensuring effective communication and developing trust with families. We chose to evaluate identification of each team member by caregivers; our findings are suggestive of the need for alternative strategies. A more valuable intervention might target identification of key team members (eg, attending, primary intern, primary senior resident). A policy statement regarding transitions of care recommended the establishment of mechanisms to ensure patients and their families know who is responsible for their care.[15] Efforts toward achieving this goal are essential.
This study has several limitations. The study was completed at a single institution, and thus generalizability may be limited. Although the intervention and control units have similar characteristics, randomization did not occur at the patient level. The control group had significantly more patients who had greater than 1 admission compared to the intervention group. Patients enrolled in the study were from a weekday convenience sample; therefore, potential differences in results based on weekend admissions were unable to be assessed. The exclusion of nonEnglish‐speaking families could limit generalizability to this population. Social desirability bias may have elevated the scores in both groups. Providers tasked with the responsibility of introducing the face sheet tool to families did so in a nonstandardized way and may have interacted differently with families compared to the control team. Finally, our project's aim was focused on the effect of a face sheet tool on the identification and satisfaction rating of the medical team by caregivers. Truly family‐centered care would include efforts to improve families' knowledge of and satisfaction with all members of the healthcare team.
A photo‐based face sheet tool helped caregivers better identify their child's care providers by name and role in the hospital. Satisfaction scores were similar in both groups.
Acknowledgements
The authors thank the Pediatric Research in Inpatient Settings network, and specifically Drs. Karen Wilson and Samir Shah, for their assistance during a workshop at the Pediatric Hospital Medicine 2012 meeting in July 2012, during which a first draft of this manuscript was produced.
Diaz‐Caneja A, Gledhill J, Weaver T, Nadel S, Garralda E. A child's admission to hospital: a qualitative study examining the experiences of parents. Intensive Care Med. 2005;31(9):1248–1254.
Committee on Quality of Health Care in America. Institute of Medicine. Crossing the Quality Chasm: A New Health System for the 21st Century. Washington, DC: National Academy Press; 2001.
Committee on Hospital Care and Institute for Patient‐ and Family‐Centered Care. Patient‐ and family‐centered care and the pediatrician's role. Pediatrics. 2012;129(2):394–404.
Nasca TJ, Day SH, Amis ES. The new recommendations on duty hours from the ACGME Task Force. N Engl J Med. 2010;363(2):e3.
Latta LC, Dick R, Parry C, Tamura GS. Parental responses to involvement in rounds on a pediatric inpatient unit at a teaching hospital: a qualitative study. Acad Med. 2008;83(3):292–297.
PSQ Project Co‐Investigators. Final Report on the Patient Satisfaction Questionnaire Project. Philadelphia, PA: American Board of Internal Medicine; 1989.
Brinkman WB, Geraghty SR, Lanphear BP, et al. Effect of multisource feedback on resident communication skills and professionalism: a randomized controlled trial. Arch Pediatr Adolesc Med. 2007;161(1):44–49.
Giordano LA, Elliott MN, Goldstein E, Lehrman WG, Spencer PA. Development, implementation, and public reporting of the HCAHPS survey. Med Care Res Rev. 2010;67(1):27–37.
Dudas RA, Lemerman H, Barone M, Serwint JR. PHACES (Photographs of Academic Clinicians and Their Educational Status): a tool to improve delivery of family‐centered care. Acad Pediatr. 2010;10(2):138–145.
Arora VM, Schaninger C, D'Arcy M, et al. Improving inpatients' identification of their doctors: use of FACE cards. Jt Comm J Qual Patient Saf. 2009;35(12):613–619.
Amer A, Fischer H. “Don't call me ‘mom’: how parents want to be greeted by their pediatrician. Clin Pediatr. 2009;48(7):720–722.
Auger KA, Landrigan CP, Gonzalez Del Rey JA, Sieplinga KR, Sucharew HJ, Simmons JM. Better rested, but more stressed? Evidence of the effects of resident work hour restrictions. Acad Pediatr. 2012;12(4):335–343.
Gordon MB, Sectish TC, Elliott MN, et al. Pediatric residents' perspectives on reducing work hours and lengthening residency: a national survey. Pediatrics. 2012;130(1):99–107.
Oshimura J, Sperring J, Bauer BD, Rauch DA. Inpatient staffing within pediatric residency programs: work hour restrictions and the evolving role of the pediatric hospitalist. J Hosp Med. 2012;7(4):299–303.
Snow V, Beck D, Budnitz T, et al. Transitions of Care Consensus policy statement: American College of Physicians, Society of General Internal Medicine, Society of Hospital Medicine, American Geriatrics Society, American College of Emergency Physicians, and Society for Academic Emergency Medicine. J Hosp Med. 2009;4(6):364–370.
Acute illness requiring hospitalization can be overwhelming for children and their families who are coping with illness and the synthesis of information from a variety of healthcare providers.[1] Patient and family centeredness is endorsed by the Institute of Medicine and the American Academy of Pediatrics[2, 3] as central to quality healthcare. In academic institutions, the presence of medical students and residents adds to the number of providers families encounter. In July 2011, the Accreditation Council for Graduate Medical Education implemented new duty hour restrictions, limiting first year residents to a maximum of 16 hour shifts.[4] Consequently, caregivers and patients may be in contact with more healthcare providers; this fractured care may confuse patients and caregivers, and increase dissatisfaction with care.[5]
The primary objective of our study was to determine the effect of a face sheet tool on the percentage of medical team members correctly identified by caregivers. The secondary objective was to determine the effect of a face sheet tool on the evaluation and satisfaction rating of the medical team by caregivers. We hypothesized that caregivers who receive the face sheet tool will correctly identify a greater percentage of team members by name and role and have higher overall satisfaction with their hospital stay.
METHODS
We performed a prospective controlled study on 2 general pediatric units at Cincinnati Children's Hospital Medical Center (CCHMC). Patients on the intervention unit received the face sheet tool, whereas the concurrent control unit maintained usual procedures. Both units have 24 beds and care for general pediatric patients primarily covered by 4 resident teams and the hospital medicine faculty. Two paired resident teams composed of 2 senior residents, 3 to 4 interns, and 4 medical students primarily admit to each general pediatric unit. Team members rotate through day and night shifts. All employees and rotating students are required to wear the hospital issued identification badge that includes their names, photos, credentials, and role. The study was conducted from November 1, 2011 to November 30, 2011.
Included patients were admitted to the study units by the usual protocol at our hospital, in which nurse patient‐flow coordinators determine bed assignments. We excluded families whose children had an inpatient hospital stay of <12 hours and families who did not speak English. All patient families scheduled to be discharged later in the day on weekday mornings from the 2 study units were approached for study participation. Families were not compensated for their participation.
A face sheet tool, which is a sheet of paper with pictures and names of the intervention team attendings, senior residents, interns, and medical students as well as a description of team member roles, was distributed to patients and their caregivers. The face sheet tools were created using Microsoft Publisher (Microsoft Corp., Redmond, WA). Neither families nor providers were blinded to the intervention, and the residents assumed responsibility for introducing the face sheet tool to families.
For our primary outcome measure, the research coordinator asked participating caregivers to match provider photographs with names and roles by placing laminated pictures backed with Velcro tape in the appropriate position on a laminated poster sheet. Initially, we collected overall accuracy of identification by name and role. In the second week, we began collecting specific data on the attending physician.
The satisfaction survey consisted of the American Board of Internal Medicine (ABIM) patient satisfaction questionnaire, composed of 10, 5‐point Likert scale questions,[6, 7] and an overall rating of hospital question, On a scale from 1 to 10, with 1 being the worst possible hospital and 10 being the best possible hospital, what number would you rate this hospital? from the Hospital Consumer Assessment of Health Plans Survey.[8] Questions were asked aloud and families responded to the questions orally. A written list was also provided to families. We collected data on length of stay (LOS) at the time of outcome assessment as well as previous hospitalizations.
Data Analysis
Differences between the intervention and control groups for relationship of survey respondent to child, prior hospitalization, and LOS were evaluated using the Fisher exact, 2, and 2‐sample t test, respectively. Hospital LOS was log‐transformed prior to analysis. The effect of the face sheet tool was evaluated by analyzing the differences between the intervention and control groups in the proportion of correctly identified names and roles using the Wilcoxon rank sum test and using the Fisher exact test for attending identification. Skewed Likert scale satisfaction ratings and overall hospital ratings were dichotomized at the highest score possible and analyzed using the 2 test. An analysis adjusting for prior hospitalization and LOS was done using generalized linear models, with a Poisson link for the number of correctly identified names/roles and an offset for the number of names/roles given.
Our research was reviewed by the CCHMC institutional review board and deemed exempt.
RESULTS
A total of 96 families were approached for enrollment (50 in the intervention and 46 in the control). Of these, 86 families agreed to participate. Three families in the intervention group did not receive the face sheet tool and were excluded from analysis, leaving an analytic cohort of 83 (41 in intervention and 42 in control). Attending recognition by role was collected from 54 families (28 in intervention group and 26 in control group) and by name from 34 families (15 in intervention group and 19 in control group). Table 1 displays characteristics of each group. Among the 83 study participants, LOS at time of outcome assessment ranged from 0.4 to 12.0 days, and the number of medical team members that cared for these patients ranged from 3 to 14.
NOTE: Data are expressed as n (%) or geometric mean (95% confidence interval).
P values for the difference between groups are from 2 test or Fisher exact test for categorical variables and 2‐sample t test for log length of stay.
Relationship to patient
0.67
Mother
33 (80%)
35 (83%)
Father
5 (12%)
6 (14%)
Grandmother/legal guardian
3 (7%)
1 (2%)
Prior hospitalization, yes
12 (29%)
24 (57%)
0.01
Length of stay (days)
1.07 (0.861.34)
1.32 (1.051.67)
0.20
Families in the intervention group had a higher percentage of correctly identified members of the medical team by name and role as compared to the control group (Table 2). These findings remained significant after adjusting for LOS and prior hospitalization. In addition, in a subset of families with attending data available, more families accurately identified attending name and attending role in the intervention as compared to control group.
Team Member Identification and Satisfaction Rating by Group
No significant differences were noted between the groups when comparing all individual ABIM survey question scores or the overall hospital satisfaction rating (Table 2). Scores in both intervention and control groups were high in all categories.
DISCUSSION
Caregivers given the face sheet tool were better able to identify medical team members by name and role than caregivers in the control group. Previous studies have shown similar results.[9, 10] Families encountered a large number of providers (median of 8) during stays that were on average quite brief (median LOS of 23.6 hours). Despite the significant increase in caregivers' ability to identify providers, the effect was modest.
Our findings add to prior work on face sheet tools in pediatrics and internal medicine.[9, 10, 11] Our study occurred after the residency duty hour restrictions. We described the high number of providers that families encounter in this context. It is the first study to our knowledge to quantify the number of providers that families encounter after these changes and to report on how well families can identify these clinicians by name and role. Unlike other studies, satisfaction scores were not improved.[9] Potential reasons for this include: (1) caregiver knowledge of 2 to 4 key members of the team and not the whole team may be the primary driver of satisfaction, (2) caregiver activation or empowerment may be a more responsive measure than overall satisfaction, and (3) our satisfaction measures may have ceiling effects and/or be elevated in both groups by social desirability bias.
Our study highlights the need for further investigation of quality outcomes associated with residency work hour changes.[12, 13, 14] Specifically, exposure to large numbers of providers may hinder families from accurately identifying those entrusted with the care of their loved one. Of note, our research coordinator needed to present as many as 14 provider pictures to 1 family with a hospital stay of <24 hours. Large numbers of providers may create challenges in building rapport, ensuring effective communication and developing trust with families. We chose to evaluate identification of each team member by caregivers; our findings are suggestive of the need for alternative strategies. A more valuable intervention might target identification of key team members (eg, attending, primary intern, primary senior resident). A policy statement regarding transitions of care recommended the establishment of mechanisms to ensure patients and their families know who is responsible for their care.[15] Efforts toward achieving this goal are essential.
This study has several limitations. The study was completed at a single institution, and thus generalizability may be limited. Although the intervention and control units have similar characteristics, randomization did not occur at the patient level. The control group had significantly more patients who had greater than 1 admission compared to the intervention group. Patients enrolled in the study were from a weekday convenience sample; therefore, potential differences in results based on weekend admissions were unable to be assessed. The exclusion of nonEnglish‐speaking families could limit generalizability to this population. Social desirability bias may have elevated the scores in both groups. Providers tasked with the responsibility of introducing the face sheet tool to families did so in a nonstandardized way and may have interacted differently with families compared to the control team. Finally, our project's aim was focused on the effect of a face sheet tool on the identification and satisfaction rating of the medical team by caregivers. Truly family‐centered care would include efforts to improve families' knowledge of and satisfaction with all members of the healthcare team.
A photo‐based face sheet tool helped caregivers better identify their child's care providers by name and role in the hospital. Satisfaction scores were similar in both groups.
Acknowledgements
The authors thank the Pediatric Research in Inpatient Settings network, and specifically Drs. Karen Wilson and Samir Shah, for their assistance during a workshop at the Pediatric Hospital Medicine 2012 meeting in July 2012, during which a first draft of this manuscript was produced.
Disclosure: Nothing to report.
References
Diaz‐Caneja A, Gledhill J, Weaver T, Nadel S, Garralda E. A child's admission to hospital: a qualitative study examining the experiences of parents. Intensive Care Med. 2005;31(9):1248–1254.
Committee on Quality of Health Care in America. Institute of Medicine. Crossing the Quality Chasm: A New Health System for the 21st Century. Washington, DC: National Academy Press; 2001.
Committee on Hospital Care and Institute for Patient‐ and Family‐Centered Care. Patient‐ and family‐centered care and the pediatrician's role. Pediatrics. 2012;129(2):394–404.
Nasca TJ, Day SH, Amis ES. The new recommendations on duty hours from the ACGME Task Force. N Engl J Med. 2010;363(2):e3.
Latta LC, Dick R, Parry C, Tamura GS. Parental responses to involvement in rounds on a pediatric inpatient unit at a teaching hospital: a qualitative study. Acad Med. 2008;83(3):292–297.
PSQ Project Co‐Investigators. Final Report on the Patient Satisfaction Questionnaire Project. Philadelphia, PA: American Board of Internal Medicine; 1989.
Brinkman WB, Geraghty SR, Lanphear BP, et al. Effect of multisource feedback on resident communication skills and professionalism: a randomized controlled trial. Arch Pediatr Adolesc Med. 2007;161(1):44–49.
Giordano LA, Elliott MN, Goldstein E, Lehrman WG, Spencer PA. Development, implementation, and public reporting of the HCAHPS survey. Med Care Res Rev. 2010;67(1):27–37.
Dudas RA, Lemerman H, Barone M, Serwint JR. PHACES (Photographs of Academic Clinicians and Their Educational Status): a tool to improve delivery of family‐centered care. Acad Pediatr. 2010;10(2):138–145.
Arora VM, Schaninger C, D'Arcy M, et al. Improving inpatients' identification of their doctors: use of FACE cards. Jt Comm J Qual Patient Saf. 2009;35(12):613–619.
Amer A, Fischer H. “Don't call me ‘mom’: how parents want to be greeted by their pediatrician. Clin Pediatr. 2009;48(7):720–722.
Auger KA, Landrigan CP, Gonzalez Del Rey JA, Sieplinga KR, Sucharew HJ, Simmons JM. Better rested, but more stressed? Evidence of the effects of resident work hour restrictions. Acad Pediatr. 2012;12(4):335–343.
Gordon MB, Sectish TC, Elliott MN, et al. Pediatric residents' perspectives on reducing work hours and lengthening residency: a national survey. Pediatrics. 2012;130(1):99–107.
Oshimura J, Sperring J, Bauer BD, Rauch DA. Inpatient staffing within pediatric residency programs: work hour restrictions and the evolving role of the pediatric hospitalist. J Hosp Med. 2012;7(4):299–303.
Snow V, Beck D, Budnitz T, et al. Transitions of Care Consensus policy statement: American College of Physicians, Society of General Internal Medicine, Society of Hospital Medicine, American Geriatrics Society, American College of Emergency Physicians, and Society for Academic Emergency Medicine. J Hosp Med. 2009;4(6):364–370.
Address for correspondence and reprint requests: Ndidi I. Unaka, MD, Cincinnati Children's Hospital Medical Center, 3333 Burnet Ave. ML 5018, Cincinnati, OH 45229; Telephone: 513‐636‐8354; Fax: 513‐636‐7905; E‐mail: ndidi.unaka@cchmc.org
Content Gating
Gated (full article locked unless allowed per User)