User login
When Reducing Low-Value Care in Hospital Medicine Saves Money, Who Benefits?
Physicians face growing pressure to reduce their use of “low value” care—services that provide either little to no benefit, little benefit relative to cost, or outsized potential harm compared to benefit. One emerging policy solution for deterring such services is to financially penalize physicians who prescribe them.1,2
Physicians’ willingness to support such policies may depend on who they believe benefits from reductions in low-value care. In previous studies of cancer screening, the more that primary care physicians felt that the money saved from cost-containment efforts went to insurance company profits rather than to patients, the less willing they were to use less expensive cancer screening approaches.3
Similarly, physicians may be more likely to support financial penalty policies if they perceive that the benefits from reducing low-value care accrue to patients (eg, lower out-of-pocket costs) rather than insurers or hospitals (eg, profits and salaries of their leaders). If present, such perceptions could inform incentive design. We explored the hypothesis that support of financial penalties
METHODS
Study Sample
By using a panel of internists maintained by the American College of Physicians, we conducted a randomized, web-based survey among 484 physicians who were either internal medicine residents or internal medicine physicians practicing hospital medicine.
Survey Instrument
Respondents used a 5-point scale (“strongly disagree” to “strongly agree”) to indicate their agreement with a policy that financially penalizes physicians for prescribing services that provide few benefits to patients. Respondents were asked to simultaneously consider the following hospital medicine services, deemed to be low value based on medical evidence and consensus guidelines4: (1) placing, and leaving in, urinary catheters for urine output monitoring in noncritically ill patients, (2) ordering continuous telemetry monitoring for nonintensive care unit patients without a protocol governing continuation, and (3) prescribing stress ulcer prophylaxis for medical patients not at a high risk for gastrointestinal complications. Policy support was defined as “somewhat” or “strongly” agreeing with the policy. As part of another study of this physician cohort, this question varied in how the harm of low-value services was framed: either as harm to patients, to society, or to hospitals and insurers as institutions. Respondent characteristics were balanced across survey versions, and for the current analysis, we pooled responses across all versions.
All other questions in the survey, described in detail elsewhere,5 were identical for all respondents. For this analysis, we focused on a question that asked physicians to assume that reducing these services saves money without harming the quality of care and to rate on a 4-point scale (“none” to “a lot”) how much of the money saved would ultimately go to the following 6 nonmutually exclusive areas: (a) other healthcare services for patients, (b) reduced charges to patients’ employers or insurers, (c) reduced out-of-pocket costs for patients, (d) salaries and bonuses for physicians, (e) salaries and profits for insurance companies and their leaders, and (f) salaries and profits for hospitals and/or health systems and their leaders.
Based on the positive correlation identified between the first 4 items (a to d) and negative correlation with the other 2 items (e and f), we reverse-coded the latter 2 and summed all 6 into a single-outcome scale, effectively representing the degree to which the money saved from reducing low-value services accrues generally to patients or physicians instead of to hospitals, insurance companies, and their leaders. The Cronbach alpha for the scale was 0.74, indicating acceptable reliability. Based on scale responses, we dichotomized respondents at the median into those who believe that the money saved from reducing low-value services would accrue as benefits to patients or physicians and those who believe benefits accrue to insurance companies or hospitals and/or health systems and their leaders. The protocol was exempted by the University of Pennsylvania Institutional Review Board.
Statistical Analysis
We used a χ2 test and multivariable logistic regression analysis to evaluate the association between policy support and physician beliefs about who benefits from reductions in low-value care. A χ2 test and a Kruskal-Wallis test were also used to evaluate the association between other respondent characteristics and beliefs about who benefits from reductions in low-value care. Analyses were performed by using Stata version 14.1 (StataCorp, College Station, TX). Tests of significance were 2-tailed at an alpha of .05.
RESULTS
Compared with nonrespondents, the 187 physicians who responded (39% response rate) were more likely to be female (30% vs 26%, P = 0.001), older (mean age 41 vs 36 years old, P < 0.001), and practicing clinicians rather than internal medicine residents (87% vs 69%, P < 0.001). Twenty-one percent reported that their personal compensation was tied to cost incentives.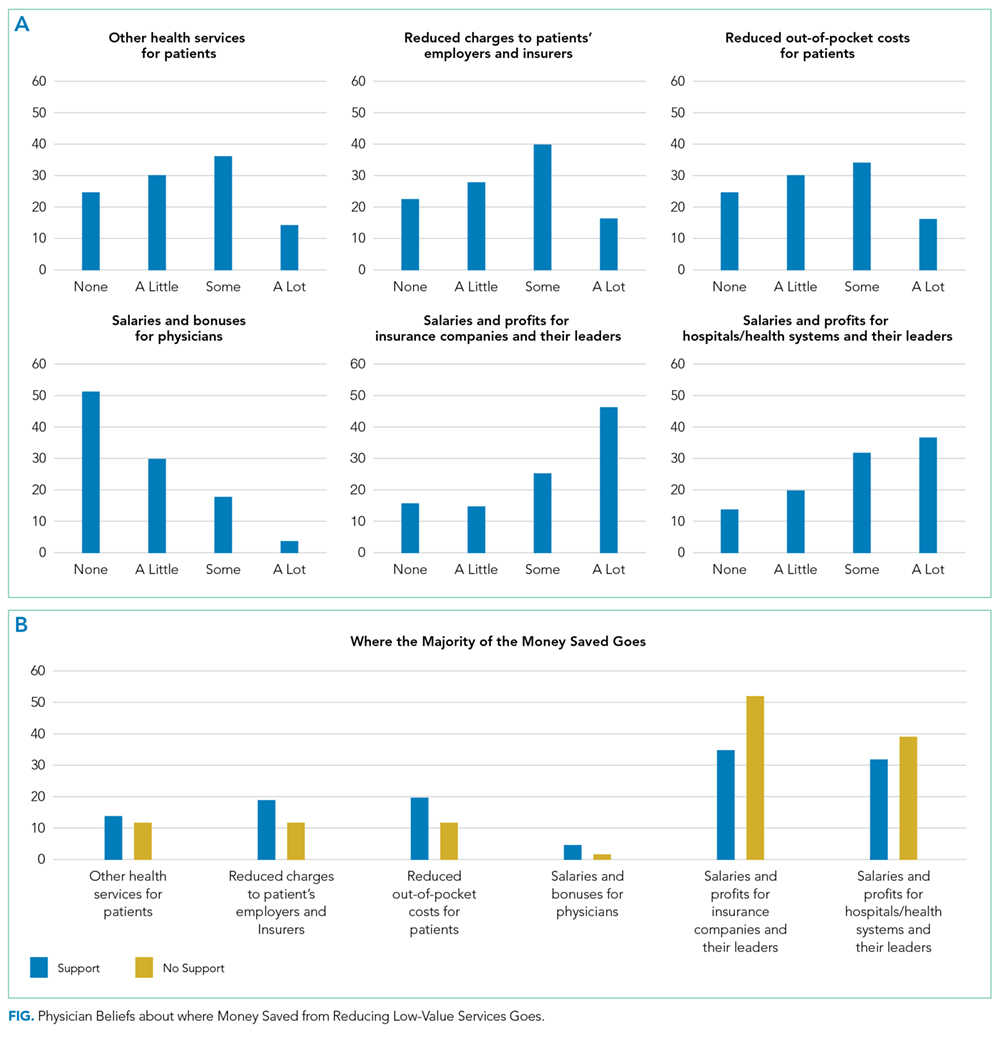
Overall, respondents believed that more of any money saved from reducing low-value services would go to profits and leadership salaries for insurance companies and hospitals and/or health systems rather than to patients (panel A of Figure). Few respondents felt that the money saved would ultimately go toward physician compensation.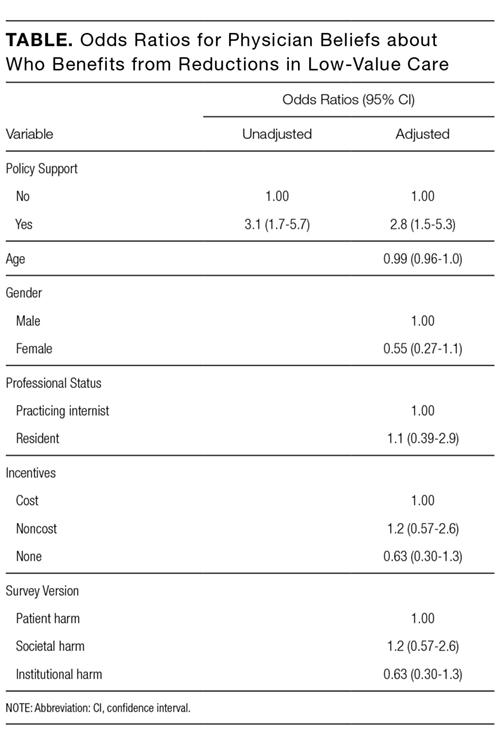
Sixty-six percent of physicians who supported penalties believed that benefits from reducing low-value care accrue to patients or physicians, compared to 39% among those not supporting penalties (P < 0.001). In multivariable analyses, policy support was associated with the belief that the money saved from reducing low-value services would accrue as benefits to patients or physicians rather than as salaries and profits for insurance companies or hospitals and/or health systems and their leaders (Table). There were no statistically significant associations between respondent age, gender, or professional status and beliefs about who benefits from reductions in low-value care.
DISCUSSION
Despite ongoing efforts to highlight how reducing low-value care benefits patients, physicians in our sample did not believe that much of the money saved would benefit patients.
This result may reflect that while some care patterns are considered low value because they provide little benefit at a high cost, others yield potential harm, regardless of cost. For example, limiting stress ulcer prophylaxis largely aims to avoid clinical harm (eg, adverse drug effects and nosocomial infections). Limiting telemetric monitoring largely aims to reduce costly care that provides only limited benefit. Therefore, the nature of potential benefit to patients is very different—improved clinical outcomes in the former and potential cost savings in the latter. Future studies could separately assess physician attitudes about these 2 different definitions of low-value services.
Our study also demonstrates that the more physicians believe that much of any money saved goes to the profits and salaries of insurance companies, hospitals and/or health systems, and their leaders rather than to patients, the less likely they are to support policies financially penalizing physicians for prescribing low-value services.
Our study does not address why physicians have the beliefs that they have, but a likely explanation, at least in part, is that financial flows in healthcare are complex and tangled. Indeed, a clear understanding of who actually benefits is so hard to determine that these stated beliefs may really derive from views of power or justice rather than from some understanding of funds flow. Whether or not ideological attitudes underlie these expressed beliefs, policymakers and healthcare institutions might be advised to increase transparency about how cost savings are realized and whom they benefit.
Our analysis has limitations. Although it provides insight into where physicians believe relative amounts of money saved go with respect to 6 common options, the study did not include an exhaustive list of possibilities. The response rate also limits the representativeness of our results. Additionally, the study design prevents conclusions about causality; we cannot determine whether the belief that savings go to insurance companies and their executives is what reduces physicians’ enthusiasm for penalties, whether the causal association is in the opposite direction, or whether the 2 factors are linked in another way.
Nonetheless, our findings are consistent with a sense of healthcare justice in which physicians support penalties imposed on themselves only if the resulting benefits accrue to patients rather than to corporate or organizational interests. Effective physician penalties will likely need to address the belief that insurers and provider organizations stand to gain more than patients when low-value care services are reduced.
Disclosure
Drs. Liao, Schapira, Mitra, and Weissman have no conflicts to disclose. Dr. Navathe serves as advisor to Navvis and Company, Navigant Inc., Lynx Medical, Indegene Inc., and Sutherland Global Services and receives an honorarium from Elsevier Press, none of which have relationship to this manuscript. Dr. Asch is a partner and partial owner of VAL Health, which has no relationship to this manuscript.
Funding
This work was supported by The Leonard Davis Institute of Health Economics at the University of Pennsylvania, which had no role in the study design, data collection, analysis, or interpretation of results.
1. Berwick DM. Avoiding overuse – the next quality frontier. Lancet. 2017;390(10090):102-104. PubMed
2. Centers for Medicare and Medicaid Services. CMS response to Public Comments on Non-Recommended PSA-Based Screening Measure. https://www.cms.gov/Medicare/Quality-Initiatives-Patient-Assessment-Instruments/MMS/Downloads/eCQM-Development-and-Maintenance-for-Eligible-Professionals_CMS_PSA_Response_Public-Comment.pdf. Accessed September 18, 2017.
3. Asch DA, Jepson C, Hershey JC, Baron J, Ubel PA. When Money is Saved by Reducing Healthcare Costs, Where Do US Primary Care Physicians Think the Money Goes? Am J Manag Care. 2003;9(6):438-442. PubMed
4. Society of Hospital Medicine. Choosing Wisely. https://www.hospitalmedicine.org/choosingwisely. Accessed September 18, 2017.
5. Liao JM, Navathe AS, Schapira MS, Weissman A, Mitra N, Asch DAA. Penalizing Physicians for Low Value Care in Hospital Medicine: A Randomized Survey. J Hosp Med. 2017. (In press). PubMed
Physicians face growing pressure to reduce their use of “low value” care—services that provide either little to no benefit, little benefit relative to cost, or outsized potential harm compared to benefit. One emerging policy solution for deterring such services is to financially penalize physicians who prescribe them.1,2
Physicians’ willingness to support such policies may depend on who they believe benefits from reductions in low-value care. In previous studies of cancer screening, the more that primary care physicians felt that the money saved from cost-containment efforts went to insurance company profits rather than to patients, the less willing they were to use less expensive cancer screening approaches.3
Similarly, physicians may be more likely to support financial penalty policies if they perceive that the benefits from reducing low-value care accrue to patients (eg, lower out-of-pocket costs) rather than insurers or hospitals (eg, profits and salaries of their leaders). If present, such perceptions could inform incentive design. We explored the hypothesis that support of financial penalties
METHODS
Study Sample
By using a panel of internists maintained by the American College of Physicians, we conducted a randomized, web-based survey among 484 physicians who were either internal medicine residents or internal medicine physicians practicing hospital medicine.
Survey Instrument
Respondents used a 5-point scale (“strongly disagree” to “strongly agree”) to indicate their agreement with a policy that financially penalizes physicians for prescribing services that provide few benefits to patients. Respondents were asked to simultaneously consider the following hospital medicine services, deemed to be low value based on medical evidence and consensus guidelines4: (1) placing, and leaving in, urinary catheters for urine output monitoring in noncritically ill patients, (2) ordering continuous telemetry monitoring for nonintensive care unit patients without a protocol governing continuation, and (3) prescribing stress ulcer prophylaxis for medical patients not at a high risk for gastrointestinal complications. Policy support was defined as “somewhat” or “strongly” agreeing with the policy. As part of another study of this physician cohort, this question varied in how the harm of low-value services was framed: either as harm to patients, to society, or to hospitals and insurers as institutions. Respondent characteristics were balanced across survey versions, and for the current analysis, we pooled responses across all versions.
All other questions in the survey, described in detail elsewhere,5 were identical for all respondents. For this analysis, we focused on a question that asked physicians to assume that reducing these services saves money without harming the quality of care and to rate on a 4-point scale (“none” to “a lot”) how much of the money saved would ultimately go to the following 6 nonmutually exclusive areas: (a) other healthcare services for patients, (b) reduced charges to patients’ employers or insurers, (c) reduced out-of-pocket costs for patients, (d) salaries and bonuses for physicians, (e) salaries and profits for insurance companies and their leaders, and (f) salaries and profits for hospitals and/or health systems and their leaders.
Based on the positive correlation identified between the first 4 items (a to d) and negative correlation with the other 2 items (e and f), we reverse-coded the latter 2 and summed all 6 into a single-outcome scale, effectively representing the degree to which the money saved from reducing low-value services accrues generally to patients or physicians instead of to hospitals, insurance companies, and their leaders. The Cronbach alpha for the scale was 0.74, indicating acceptable reliability. Based on scale responses, we dichotomized respondents at the median into those who believe that the money saved from reducing low-value services would accrue as benefits to patients or physicians and those who believe benefits accrue to insurance companies or hospitals and/or health systems and their leaders. The protocol was exempted by the University of Pennsylvania Institutional Review Board.
Statistical Analysis
We used a χ2 test and multivariable logistic regression analysis to evaluate the association between policy support and physician beliefs about who benefits from reductions in low-value care. A χ2 test and a Kruskal-Wallis test were also used to evaluate the association between other respondent characteristics and beliefs about who benefits from reductions in low-value care. Analyses were performed by using Stata version 14.1 (StataCorp, College Station, TX). Tests of significance were 2-tailed at an alpha of .05.
RESULTS
Compared with nonrespondents, the 187 physicians who responded (39% response rate) were more likely to be female (30% vs 26%, P = 0.001), older (mean age 41 vs 36 years old, P < 0.001), and practicing clinicians rather than internal medicine residents (87% vs 69%, P < 0.001). Twenty-one percent reported that their personal compensation was tied to cost incentives.
Overall, respondents believed that more of any money saved from reducing low-value services would go to profits and leadership salaries for insurance companies and hospitals and/or health systems rather than to patients (panel A of Figure). Few respondents felt that the money saved would ultimately go toward physician compensation.
Sixty-six percent of physicians who supported penalties believed that benefits from reducing low-value care accrue to patients or physicians, compared to 39% among those not supporting penalties (P < 0.001). In multivariable analyses, policy support was associated with the belief that the money saved from reducing low-value services would accrue as benefits to patients or physicians rather than as salaries and profits for insurance companies or hospitals and/or health systems and their leaders (Table). There were no statistically significant associations between respondent age, gender, or professional status and beliefs about who benefits from reductions in low-value care.
DISCUSSION
Despite ongoing efforts to highlight how reducing low-value care benefits patients, physicians in our sample did not believe that much of the money saved would benefit patients.
This result may reflect that while some care patterns are considered low value because they provide little benefit at a high cost, others yield potential harm, regardless of cost. For example, limiting stress ulcer prophylaxis largely aims to avoid clinical harm (eg, adverse drug effects and nosocomial infections). Limiting telemetric monitoring largely aims to reduce costly care that provides only limited benefit. Therefore, the nature of potential benefit to patients is very different—improved clinical outcomes in the former and potential cost savings in the latter. Future studies could separately assess physician attitudes about these 2 different definitions of low-value services.
Our study also demonstrates that the more physicians believe that much of any money saved goes to the profits and salaries of insurance companies, hospitals and/or health systems, and their leaders rather than to patients, the less likely they are to support policies financially penalizing physicians for prescribing low-value services.
Our study does not address why physicians have the beliefs that they have, but a likely explanation, at least in part, is that financial flows in healthcare are complex and tangled. Indeed, a clear understanding of who actually benefits is so hard to determine that these stated beliefs may really derive from views of power or justice rather than from some understanding of funds flow. Whether or not ideological attitudes underlie these expressed beliefs, policymakers and healthcare institutions might be advised to increase transparency about how cost savings are realized and whom they benefit.
Our analysis has limitations. Although it provides insight into where physicians believe relative amounts of money saved go with respect to 6 common options, the study did not include an exhaustive list of possibilities. The response rate also limits the representativeness of our results. Additionally, the study design prevents conclusions about causality; we cannot determine whether the belief that savings go to insurance companies and their executives is what reduces physicians’ enthusiasm for penalties, whether the causal association is in the opposite direction, or whether the 2 factors are linked in another way.
Nonetheless, our findings are consistent with a sense of healthcare justice in which physicians support penalties imposed on themselves only if the resulting benefits accrue to patients rather than to corporate or organizational interests. Effective physician penalties will likely need to address the belief that insurers and provider organizations stand to gain more than patients when low-value care services are reduced.
Disclosure
Drs. Liao, Schapira, Mitra, and Weissman have no conflicts to disclose. Dr. Navathe serves as advisor to Navvis and Company, Navigant Inc., Lynx Medical, Indegene Inc., and Sutherland Global Services and receives an honorarium from Elsevier Press, none of which have relationship to this manuscript. Dr. Asch is a partner and partial owner of VAL Health, which has no relationship to this manuscript.
Funding
This work was supported by The Leonard Davis Institute of Health Economics at the University of Pennsylvania, which had no role in the study design, data collection, analysis, or interpretation of results.
1. Berwick DM. Avoiding overuse – the next quality frontier. Lancet. 2017;390(10090):102-104. PubMed
2. Centers for Medicare and Medicaid Services. CMS response to Public Comments on Non-Recommended PSA-Based Screening Measure. https://www.cms.gov/Medicare/Quality-Initiatives-Patient-Assessment-Instruments/MMS/Downloads/eCQM-Development-and-Maintenance-for-Eligible-Professionals_CMS_PSA_Response_Public-Comment.pdf. Accessed September 18, 2017.
3. Asch DA, Jepson C, Hershey JC, Baron J, Ubel PA. When Money is Saved by Reducing Healthcare Costs, Where Do US Primary Care Physicians Think the Money Goes? Am J Manag Care. 2003;9(6):438-442. PubMed
4. Society of Hospital Medicine. Choosing Wisely. https://www.hospitalmedicine.org/choosingwisely. Accessed September 18, 2017.
5. Liao JM, Navathe AS, Schapira MS, Weissman A, Mitra N, Asch DAA. Penalizing Physicians for Low Value Care in Hospital Medicine: A Randomized Survey. J Hosp Med. 2017. (In press). PubMed
© 2018 Society of Hospital Medicine
If You Book It, Will They Come? Attendance at Postdischarge Follow-Up Visits Scheduled by Inpatient Providers
Given growing incentives to reduce readmission rates, predischarge checklists and bundles have recommended that inpatient providers schedule postdischarge follow-up visits (PDFVs) for their hospitalized patients.1-4 PDFVs have been linked to lower readmission rates in patients with chronic conditions, including congestive heart failure, psychiatric illnesses, and chronic obstructive pulmonary disease.5-8 In contrast, the impact of PDFVs on readmissions in hospitalized general medicine populations has been mixed.9-12 Beyond the presence or absence of PDFVs, it may be a patient’s inability to keep scheduled PDFVs that contributes more strongly to preventable readmissions.11
This challenge, dealing with the 12% to 37% of patients who miss their visits (“no-shows”), is not new.13-17 In high-risk patient populations, such as those with substance abuse, diabetes, or human immunodeficiency virus, no-shows (NSs) have been linked to poorer short-term and long-term clinical outcomes.16,18-20 Additionally, NSs pose a challenge for outpatient clinics and the healthcare system at large. The financial cost of NSs ranges from approximately $200 per patient in 2 analyses to $7 million in cumulative lost revenue per year at 1 large academic health system.13,17,21 As such, increasing attendance at PDFVs is a potential target for improving both patient outcomes and clinic productivity.
Most prior PDFV research has focused on readmission risk rather than PDFV attendance as the primary outcome.5-12 However, given the patient-oriented benefits of attending PDFVs and the clinic-oriented benefits of avoiding vacant time slots, NS PDFVs represent an important missed opportunity for our healthcare delivery system. To our knowledge, risk factors for PDFV nonattendance have not yet been systematically studied. The aim of our study was to analyze PDFV nonattendance, particularly NSs and same-day cancellations (SDCs), for hospitalizations and clinics within our healthcare system.
METHODS
Study Design
We conducted an observational cohort study of adult patients from 10 medical units at the Hospital of the University of Pennsylvania (a 789-bed quaternary-care hospital within an urban, academic medical system) who were scheduled with at least 1 PDFV. Specifically, the patients included in our analysis were hospitalized on general internal medicine services or medical subspecialty services with discharge dates between April 1, 2014, and March 31, 2015. Hospitalizations included in our study had at least 1 PDFV scheduled with an outpatient provider affiliated with the University of Pennsylvania Health System (UPHS). PDFVs scheduled with unaffiliated providers were not examined.
Each PDFV was requested by a patient’s inpatient care team. Once the care team had determined that a PDFV was clinically warranted, a member of the team (generally a resident, advanced practice provider, medical student, or designee) either called the UPHS clinic to schedule an appointment time or e-mailed the outpatient UPHS provider directly to facilitate a more urgent PDFV appointment time. Once a PDFV time was confirmed, PDFV details (ie, date, time, location, and phone number) were electronically entered into the patient’s discharge instructions by the inpatient care team. At the time of discharge, nurses reviewed these instructions with their patients. All patients left the hospital with a physical copy of these instructions. As part of routine care at our institution, patients then received automated telephone reminders from their UPHS-affiliated outpatient clinic 48 hours prior to each PDFV.
Data Collection
Our study was determined to meet criteria for quality improvement by the University of Pennsylvania’s Institutional Review Board. We used our healthcare system’s integrated electronic medical record system to track the dates of initial PDFV requests, the dates of hospitalization, and actual PDFV dates. PDFVs were included if the appointment request was made while a patient was hospitalized, including the day of discharge. Our study methodology only allowed us to investigate PDFVs scheduled with UPHS outpatient providers. We did not review discharge instructions or survey non-UPHS clinics to quantify visits scheduled with other providers, for example, community health centers or external private practices.
Exclusion criteria included the following: (1) office visits with nonproviders, for example, scheduled diagnostic procedures or pharmacist appointments for warfarin dosing; (2) visits cancelled by inpatient providers prior to discharge; (3) visits for patients not otherwise eligible for UPHS outpatient care because of insurance reasons; and (4) visits scheduled for dates after a patient’s death. Our motivation for the third exclusion criterion was the infrequent and irregular process by which PDFVs were authorized for these patients. These patients and their characteristics are described in Supplementary Table 1 in more detail.
For each PDFV, we recorded age, gender, race, insurance status, driving distance, length of stay for index hospitalization, discharging service (general internal medicine vs subspecialty), postdischarge disposition (home, home with home care services such as nursing or physical therapy, or facility), the number of PDFVs scheduled per index hospitalization, PDFV specialty type (oncologic subspecialty, nononcologic medical subspecialty, nononcologic surgical subspecialty, primary care, or other specialty), PDFV season, and PDFV lead time (the number of days between the discharge date and PDFV). We consolidated oncologic specialties into 1 group given the integrated nature of our healthcare system’s comprehensive cancer center. “Other” PDFV specialty subtypes are described in Supplementary Table 2. Driving distances between patient postal codes and our hospital were calculated using Excel VBA Master (Salt Lake City, Utah) and were subsequently categorized into patient-level quartiles for further analysis. For cancelled PDFVs, we collected dates of cancellation relative to the date of the appointment itself.
Study Outcomes
The primary study outcome was PDFV attendance. Each PDFV’s status was categorized by outpatient clinic staff as attended, cancelled, or NS. For cancelled appointments, cancellation dates and reasons (if entered by clinic representatives) were collected. In keeping with prior studies investigating outpatient nonattendance,we calculated collective NS/SDC rates for the variables listed above.17,22-25 We additionally calculated NS/SDC and attendance-as-scheduled rates stratified by the number of PDFVs per patient to assess for a “high-utilizer” effect with regard to PDFV attendance.
Statistical Analysis
We used multivariable mixed-effects regression with a logit link to assess associations between age, gender, race, insurance, driving distance quartile, length of stay, discharging service, postdischarge disposition, the number of PDFVs per hospitalization, PDFV specialty type, PDFV season, PDFV lead time, and our NS/SDC outcome. The mixed-effects approach was used to account for correlation structures induced by patients who had multiple visits and for patients with multiple hospitalizations. Specifically, our model specified 2 levels of nesting (PDFVs nested within each hospitalization, which were nested within each patient) to obtain appropriate standard error estimates for our adjusted odds ratios (ORs). Correlation matrices and multivariable variance inflation factors were used to assess collinearity among the predictor variables. These assessments did not indicate strong collinearity; hence, all predictors were included in the model. Only driving distance had a small amount of missing data (0.18% of driving distances were unavailable), so multiple imputation was not undertaken. Analyses were performed using R version 3.3.1 (R Foundation for Statistical Computing, Vienna, Austria).
RESULTS
Baseline Characteristics
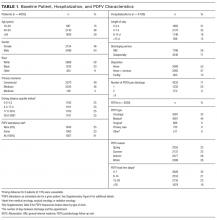

During the 1-year study period, there were 11,829 discrete hospitalizations in medical units at our hospital. Of these hospitalizations, 6136 (52%) had at least 1 UPHS-affiliated PDFV meeting our inclusion and exclusion criteria, as detailed in the Figure. Across these hospitalizations, 9258 PDFVs were scheduled on behalf of 4653 patients. Demographic characteristics for these patients, hospitalizations, and visits are detailed in Table 1. The median age of patients in our cohort was 61 years old (interquartile range [IQR] 49-70, range 18-101). The median driving distance was 17 miles (IQR 4.3-38.8, range 0-2891). For hospitalizations, the median length of stay was 5 days (IQR 3-10, range 0-97). The median PDFV lead time, which is defined as the number of days between discharge and PDFV, was 12 days (IQR 6-23, range 1-60). Overall, 41% of patients (n = 1927) attended all of their PDFVs as scheduled; Supplementary Figure 1 lists patient-level PDFV attendance-as-scheduled percentages in more detail.
Incidence of NSs and SDCs
Twenty-five percent of PDFVs (n = 2303) were ultimately NS/SDCs; this included 1658 NSs (18% of all appointments) and 645 SDCs (7% of all appointments). Fifty-two percent of PDFVs (n = 4847) were kept as scheduled, while 23% (n = 2108) were cancelled before the day of the visit. Of the 2558 cancellations with valid cancellation dates, 49% (n = 1252) were cancelled 2 or fewer days beforehand, as shown in Supplementary Figure 2.
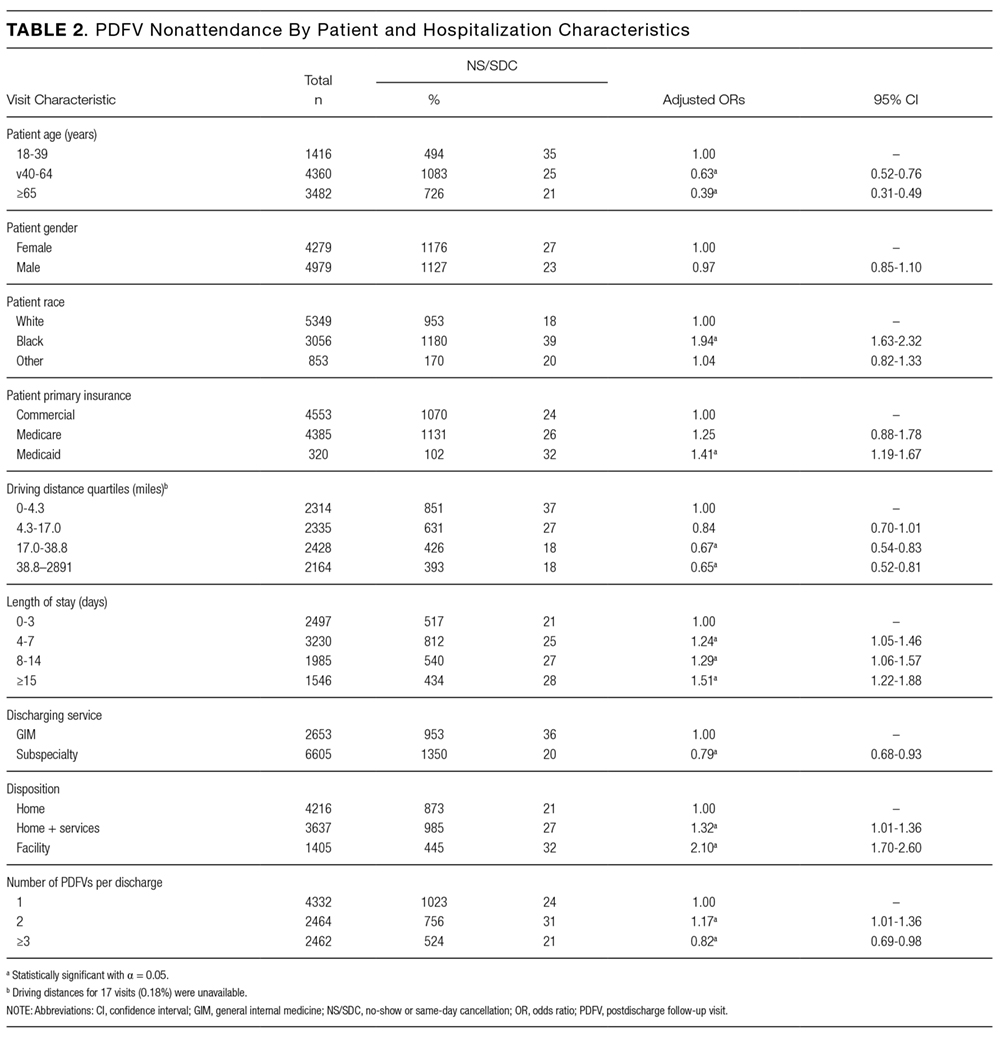
The presence of exactly 2 PDFVs per hospitalization was also associated with higher NS/SDC rates (OR 1.17, 95% CI, 1.01-1.36), compared to a single PDFV per hospitalization; however, the presence of more than 2 PDFVs per hospitalization was associated with lower NS/SDC rates (OR 0.82, 95% CI, 0.69-0.98). A separate analysis (data not shown) of potential high utilizers revealed a 15% NS/SDC rate for the top 0.5% of patients (median: 18 PDFVs each) and an 18% NS/SDC rate for the top 1% of patients (median: 14 PDFVs each) with regard to the numbers of PDFVs scheduled, compared to the 25% overall NS/SDC rate for all patients.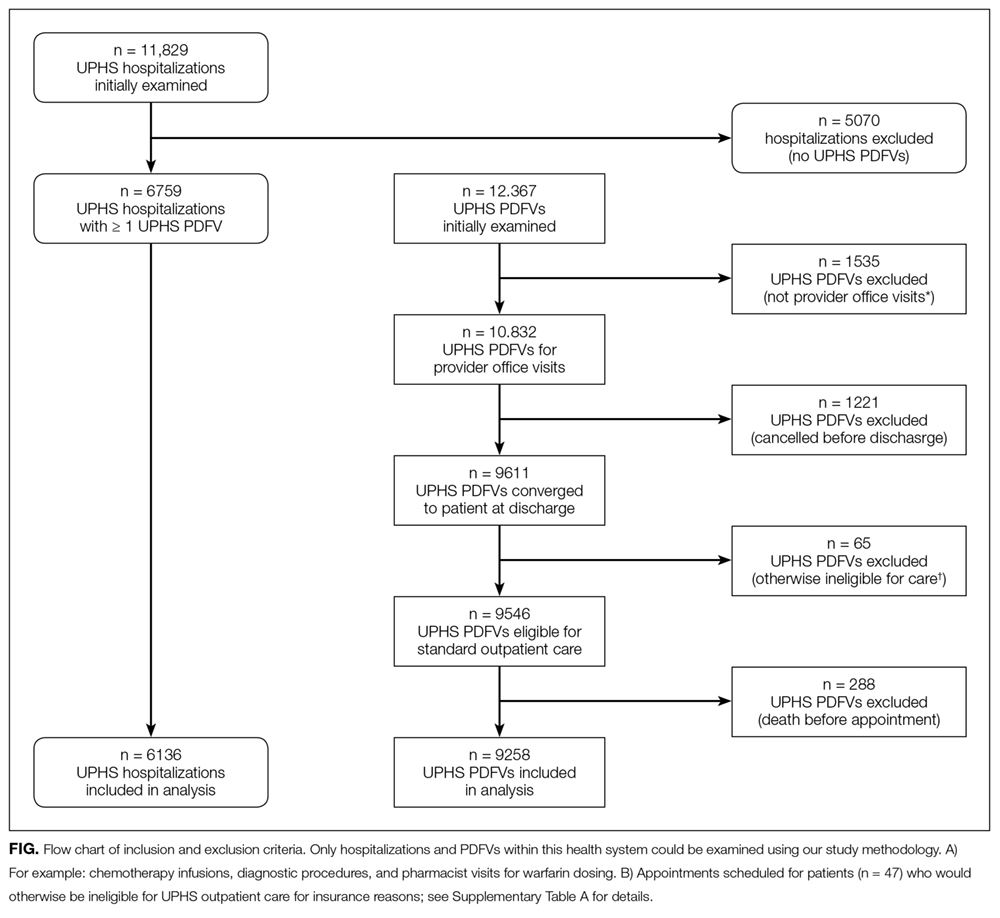
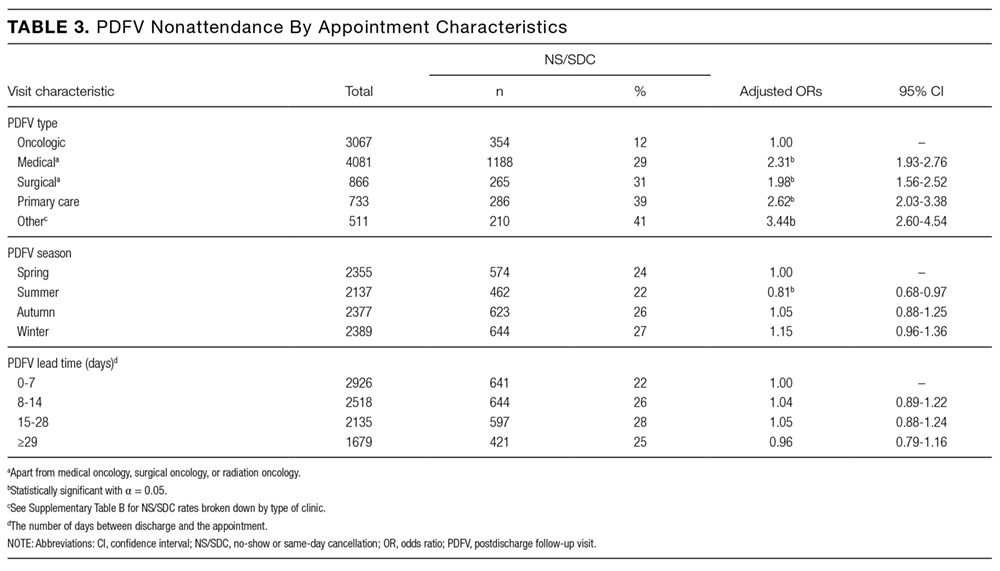
NS/SDC rates and adjusted ORs with regard to individual PDFV characteristics are displayed in Table 3. Nononcologic visits had higher NS/SDC rates than oncologic visits; for example, the NS/SDC rate for primary care visits was 39% (OR 2.62, 95% CI, 2.03-3.38), compared to 12% for oncologic visits. Appointments in the “other” specialty category also had high nonattendance rates, as further described in Supplementary Table B. Summertime appointments were more likely to be attended (OR 0.81, 95% CI, 0.68-0.97) compared to those in the spring. PDFV lead time (the time interval between the discharge date and appointment date) was not associated with changes in visit attendance.
DISCUSSION
When comparing PDFV characteristics themselves, oncologic visits had the lowest NS/SDC incidence of any group analyzed in our study. This may be related to the inherent life-altering nature of a cancer diagnosis or our cancer center’s use of patient navigators.23,30 In contrast, primary care clinics suffered from NS/SDC rates approaching 40%, which is a concerning finding given the importance of primary care coordination in the posthospitalization period.9,31 Why are primary care appointments so commonly missed? Some studies suggest that forgetting about a primary care appointment is a leading reason.15,32,33 For PDFVs, this phenomenon may be augmented because the visits are not scheduled by patients themselves. Additionally, patients may paradoxically undervalue the benefit of an all-encompassing primary care visit, compared to a PDFV focused on a specific problem, (eg, a cardiology follow-up appointment for a patient with congestive heart failure). In particular, patients with limited health literacy may potentially undervalue the capabilities of their primary care clinics.34,35
The low absolute number of primary care PDFVs (only 8% of all visits) scheduled for patients at our hospital was an unexpected finding. This low percentage is likely a function of the patient population hospitalized at our large, urban quaternary-care facility. First, an unknown number of patients may have had PDFVs manually scheduled with primary care providers external to our health system; these PDFVs were not captured within our study. Second, 71% of the hospitalizations in our study occurred in subspecialty services, for which specific primary care follow-up may not be as urgent. Supporting this fact, further analysis of the 6136 hospitalizations in our study (data not shown) revealed that 28% of the hospitalizations in general internal medicine were scheduled with at least 1 primary care PDFV as opposed to only 5% of subspecialty-service hospitalizations.
In contrast to several previous studies of outpatient nonattendance,we did not find that visits scheduled for time points further in the future were more likely to be missed.14,24,25,36,37 Unlike other appointments, it may be that PDFV lead time does not affect attendance because of the unique manner in which PDFV times are scheduled and conveyed to patients. Unlike other appointments, patients do not schedule PDFVs themselves but instead learn about their PDFV dates as part of a large set of discharge instructions. This practice may result in poor recall of PDFV dates in recently hospitalized patients38, regardless of the lead time between discharge and the visit itself.
Supplementary Table 1 details a 51% NS/SDC rate for the small number of PDFVs (n = 65) that were excluded a priori from our analysis because of general ineligibility for UPHS outpatient care. We specifically chose to exclude this population because of the infrequent and irregular process by which these PDFVs were authorized on a case-by-case basis, typically via active engagement by our hospital’s social work department. We did not study this population further but postulate that the 51% NS/SDC rate may reflect other social determinants of health that contribute to appointment nonadherence in a predominantly uninsured population.
Beyond their effect on patient outcomes, improving PDFV-related processes has the potential to boost both inpatient and outpatient provider satisfaction. From the standpoint of frontline inpatient providers (often resident physicians), calling outpatient clinics to request PDFVs is viewed as 1 of the top 5 administrative tasks that interfere with house staff education.39 Future interventions that involve patients in the PDFV scheduling process may improve inpatient workflow while simultaneously engaging patients in their own care. For example, asking clinic representatives to directly schedule PDFVs with hospitalized patients, either by phone or in person, has been shown in pilot studies to improve PDFV attendance and decrease readmissions.40-42 Conversely, NS/SDC visits harm outpatient provider productivity and decrease provider availability for other patients.13,17,43 Strategies to mitigate the impact of unfilled appointment slots (eg, deliberately overbooking time slots in advance) carry their own risks, including provider burnout.44 As such, preventing NSs may be superior to curing their adverse impacts. Many such strategies exist in the ambulatory setting,13,43,45 for example, better communication with patients through texting or goal-directed, personalized phone reminders.46-48Our study methodology has several limitations. Most importantly, we were unable to measure PDFVs made with providers unaffiliated with UPHS. As previously noted, our low proportion of primary care PDFVs may specifically reflect patients with primary care providers outside of our health system. Similarly, our low percentage of Medicaid patients receiving PDFVs may be related to follow-up visits with nonaffiliated community health centers. We were unable to measure patient acuity and health literacy as potential predictors of NS/SDC rates. Driving distances were calculated from patient postal codes to our hospital, not to individual outpatient clinics. However, the majority of our hospital-affiliated clinics are located adjacent to our hospital; additionally, we grouped driving distances into quartiles for our analysis. We had initially attempted to differentiate between clinic-initiated and patient-initiated cancellations, but unfortunately, we found that the data were too unreliable to be used for further analysis (outlined in Supplementary Table 3). Lastly, because we studied patients in medical units at a single large, urban, academic center, our results are not generalizable to other settings (eg, community hospitals, hospitals with smaller networks of outpatient providers, or patients being discharged from surgical services or observation units).
CONCLUSION
Given national efforts to enhance postdischarge transitions of care, we aimed to analyze attendance at provider-scheduled PDFV appointments. Our finding that 25% of PDFVs resulted in NS/SDCs raises both questions and opportunities for inpatient and outpatient providers. Further research is needed to understand why so many patients miss their PDFVs, and we should work as a field to develop creative solutions to improve PDFV scheduling and attendance.
Acknowledgments
The authors acknowledge Marie Synnestvedt, PhD, and Manik Chhabra, MD, for their assistance with data gathering and statistical analysis. They also acknowledge Allison DeKosky, MD, Michael Serpa, BS, Michael McFall, and Scott Schlegel, MBA, for their assistance with researching this topic. They did not receive external compensation for their assistance outside of their usual salary support.
DISCLOSURE
Nothing to report.
1. Halasyamani L, Kripalani S, Coleman E, et al. Transition of care for hospitalized elderly patients - development of a discharge checklist for hospitalists. J Hosp Med. 2006;1(6):354-360. PubMed
2. Koehler BE, Richter KM, Youngblood L, et al. Reduction of 30-day postdischarge hospital readmission or emergency department (ED) visit rates in high-risk elderly medical patients through delivery of a targeted care bundle. J Hosp Med. 2009;4(4):211-218. PubMed
3. Soong C, Daub S, Lee JG, et al. Development of a checklist of safe discharge practices for hospital patients. J Hosp Med. 2013;8(8):444-449. PubMed
4. Rice YB, Barnes CA, Rastogi R, Hillstrom TJ, Steinkeler CN. Tackling 30-day, all-cause readmissions with a patient-centered transitional care bundle. Popul Health Manag. 2016;19(1):56-62. PubMed
5. Nelson EA, Maruish MM, Axler JL. Effects of discharge planning and compliance with outpatient appointments on readmission rates. Psych Serv. 2000;51(7):885-889. PubMed
6. Gavish R, Levy A, Dekel OK, Karp E, Maimon N. The association between hospital readmission and pulmonologist follow-up visits in patients with chronic obstructive pulmonary disease. Chest. 2015;148(2):375-381. PubMed
7. Jackson C, Shahsahebi M, Wedlake T, DuBard CA. Timeliness of outpatient follow-up: an evidence-based approach for planning after hospital discharge. Ann Fam Med. 2015;13(2):115-122. PubMed
8. Donaho EK, Hall AC, Gass JA, et al. Protocol-driven allied health post-discharge transition clinic to reduce hospital readmissions in heart failure. J Am Heart Assoc. 2015;4(12):e002296. PubMed
9. Misky GJ, Wald HL, Coleman EA. Post-hospitalization transitions: Examining the effects of timing of primary care provider follow-up. J Hosp Med. 2010;5(7):392-397. PubMed
10. Grafft CA, McDonald FS, Ruud KL, Liesinger JT, Johnson MG, Naessens JM. Effect of hospital follow-up appointment on clinical event outcomes and mortality. Arch Intern Med. 2010;171(11):955-960. PubMed
11. Auerbach AD, Kripalani S, Vasilevskis EE, et al. Preventability and causes of readmissions in a national cohort of general medicine patients. JAMA Intern Med. 2016;176(4):484-493. PubMed
12. Field TS, Ogarek J, Garber L, Reed G, Gurwitz JH. Association of early post-discharge follow-up by a primary care physician and 30-day rehospitalization among older adults. J Gen Intern Med. 2015;30(5):565-571. PubMed
13. Quinn K. It’s no-show time! Med Group Manage Assoc Connexion. 2007;7(6):44-49. PubMed
14. Whittle J, Schectman G, Lu N, Baar B, Mayo-Smith MF. Relationship of scheduling interval to missed and cancelled clinic appointments. J Ambulatory Care Manage. 2008;31(4):290-302. PubMed
15. Kaplan-Lewis E, Percac-Lima S. No-show to primary care appointments: Why patients do not come. J Prim Care Community Health. 2013;4(4):251-255. PubMed
16. Molfenter T. Reducing appointment no-shows: Going from theory to practice. Subst Use Misuse. 2013;48(9):743-749. PubMed
17. Kheirkhah P, Feng Q, Travis LM, Tavakoli-Tabasi S, Sharafkhaneh A. Prevalence, predictors and economic consequences of no-shows. BMC Health Serv Res. 2016;16(1):13. PubMed
18. Colubi MM, Perez-Elias MJ, Elias L, et al. Missing scheduled visits in the outpatient clinic as a marker of short-term admissions and death. HIV Clin Trials. 2012;13(5):289-295. PubMed
19. Obialo CI, Hunt WC, Bashir K, Zager PG. Relationship of missed and shortened hemodialysis treatments to hospitalization and mortality: Observations from a US dialysis network. Clin Kidney J. 2012;5(4):315-319. PubMed
20. Hwang AS, Atlas SJ, Cronin P, et al. Appointment “no-shows” are an independent predictor of subsequent quality of care and resource utilization outcomes. J Gen Intern Med. 2015;30(10):1426-1433. PubMed
21. Perez FD, Xie J, Sin A, et al. Characteristics and direct costs of academic pediatric subspecialty outpatient no-show events. J Healthc Qual. 2014;36(4):32-42. PubMed
22. Huang Y, Zuniga P. Effective cancellation policy to reduce the negative impact of patient no-show. Journal of the Operational Research Society. 2013;65(5):605-615.
23. Percac-Lima S, Cronin PR, Ryan DP, Chabner BA, Daly EA, Kimball AB. Patient navigation based on predictive modeling decreases no-show rates in cancer care. Cancer. 2015;121(10):1662-1670. PubMed
24. Torres O, Rothberg MB, Garb J, Ogunneye O, Onyema J, Higgins T. Risk factor model to predict a missed clinic appointment in an urban, academic, and underserved setting. Popul Health Manag. 2015;18(2):131-136. PubMed
25. Eid WE, Shehata SF, Cole DA, Doerman KL. Predictors of nonattendance at an endocrinology outpatient clinic. Endocr Pract. 2016;22(8):983-989. PubMed
26. Kashiwagi DT, Burton MC, Kirkland LL, Cha S, Varkey P. Do timely outpatient follow-up visits decrease hospital readmission rates? Am J Med Qual. 2012;27(1):11-15. PubMed
27. Miller AJ, Chae E, Peterson E, Ko AB. Predictors of repeated “no-showing” to clinic appointments. Am J Otolaryngol. 2015;36(3):411-414. PubMed
28. ASCO. Billing challenges for residents of Skilled Nursing Facilities. J Oncol Pract. 2008;4(5):245-248. PubMed
29. Centers for Medicare & Medicaid Services (2013). “SE0433: Skilled Nursing Facility consolidated billing as it relates to ambulance services.” Medicare Learning Network Matters. https://www.cms.gov/Outreach-and-Education/Medicare-Learning-Network-MLN/MLNMattersArticles/downloads/se0433.pdf. Accessed on February 14, 2017.
30. Luckett R, Pena N, Vitonis A, Bernstein MR, Feldman S. Effect of patient navigator program on no-show rates at an academic referral colposcopy clinic. J Womens Health (Larchmt). 2015;24(7):608-615. PubMed
31. Jones CD, Vu MB, O’Donnell CM, et al. A failure to communicate: A qualitative exploration of care coordination between hospitalists and primary care providers around patient hospitalizations. J Gen Intern Med. 2015;30(4):417-424. PubMed
32. George A, Rubin G. Non-attendance in general practice: a systematic review and its implications for access to primary health care. Fam Pract. 2003;20(2):178-184. 2016;31(12):1460-1466.J Gen Intern Med. PubMed
48. Shah SJ, Cronin P, Hong CS, et al. Targeted reminder phone calls to patients at high risk of no-show for primary care appointment: A randomized trial. 2010;123(6):542-548.Am J Med. PubMed
47. Parikh A, Gupta K, Wilson AC, Fields K, Cosgrove NM, Kostis JB. The effectiveness of outpatient appointment reminder systems in reducing no-show rates. 2009;20:142-144.Int J STD AIDS. PubMed
46. Price H, Waters AM, Mighty D, et al. Texting appointment reminders reduces ‘Did not attend’ rates, is popular with patients and is cost-effective. 2009;25(3):166-170.J Med Practice Management. PubMed
45. Hills LS. How to handle patients who miss appointments or show up late.
2009;39(3):271-287.Interfaces. PubMed
44. Kros J, Dellana S, West D. Overbooking Increases Patient Access at East Carolina University’s Student Health Services Clinic. 2012;344(3):211-219.Am J Med Sci.
43. Stubbs ND, Geraci SA, Stephenson PL, Jones DB, Sanders S. Methods to reduce outpatient non-attendance. PubMed
42. Haftka A, Cerasale MT, Paje D. Direct patient participation in discharge follow-up appointment scheduling. Paper presented at: Society of Hospital Medicine, Annual Meeting 2015; National Harbor, MD. 2012;5(1):27-32.Patient.
41. Chang R, Spahlinger D, Kim CS. Re-engineering the post-discharge appointment process for general medicine patients. PubMed
40. Coffey C, Kufta J. Patient-centered post-discharge appointment scheduling improves readmission rates. Paper presented at: Society of Hospital Medicine, Annual Meeting 2011; Grapevine, Texas. 2006;81(1):76-81.Acad Med.
39. Vidyarthi AR, Katz PP, Wall SD, Wachter RM, Auerbach AD. Impact of reduced duty hours on residents’ education satistfaction at the University of California, San Francisco.
2013;173(18):1715-1722.JAMA Intern Med. PubMed
38. Horwitz LI, Moriarty JP, Chen C, et al. Quality of discharge practices and patient understanding at an academic medical center. 2010;16(4):246-259.Health Informatics J. PubMed
37. Daggy J, Lawley M, Willis D, et al. Using no-show modeling to improve clinic performance. 2005;5:51.BMC Health Serv Res. PubMed
36. Lee VJ, Earnest A, Chen MI, Krishnan B. Predictors of failed attendances in a multi-specialty outpatient centre using electronic databases. 2013;3(9):e003212.BMJ Open. PubMed
35. Long T, Genao I, Horwitz LI. Reasons for readmission in an underserved high-risk population: A qualitative analysis of a series of inpatient interviews. 2013;32(7):1196-1203.Health Aff (Millwood). PubMed
34. Kangovi S, Barg FK, Carter T, Long JA, Shannon R, Grande D. Understanding why patients of low socioeconomic status prefer hospitals over ambulatory care. 2015;54(10):976-982.Clin Pediatr (Phila). PubMed
33. Samuels RC, Ward VL, Melvin P, et al. Missed Appointments: Factors Contributing to High No-Show Rates in an Urban Pediatrics Primary Care Clinic. PubMed
Given growing incentives to reduce readmission rates, predischarge checklists and bundles have recommended that inpatient providers schedule postdischarge follow-up visits (PDFVs) for their hospitalized patients.1-4 PDFVs have been linked to lower readmission rates in patients with chronic conditions, including congestive heart failure, psychiatric illnesses, and chronic obstructive pulmonary disease.5-8 In contrast, the impact of PDFVs on readmissions in hospitalized general medicine populations has been mixed.9-12 Beyond the presence or absence of PDFVs, it may be a patient’s inability to keep scheduled PDFVs that contributes more strongly to preventable readmissions.11
This challenge, dealing with the 12% to 37% of patients who miss their visits (“no-shows”), is not new.13-17 In high-risk patient populations, such as those with substance abuse, diabetes, or human immunodeficiency virus, no-shows (NSs) have been linked to poorer short-term and long-term clinical outcomes.16,18-20 Additionally, NSs pose a challenge for outpatient clinics and the healthcare system at large. The financial cost of NSs ranges from approximately $200 per patient in 2 analyses to $7 million in cumulative lost revenue per year at 1 large academic health system.13,17,21 As such, increasing attendance at PDFVs is a potential target for improving both patient outcomes and clinic productivity.
Most prior PDFV research has focused on readmission risk rather than PDFV attendance as the primary outcome.5-12 However, given the patient-oriented benefits of attending PDFVs and the clinic-oriented benefits of avoiding vacant time slots, NS PDFVs represent an important missed opportunity for our healthcare delivery system. To our knowledge, risk factors for PDFV nonattendance have not yet been systematically studied. The aim of our study was to analyze PDFV nonattendance, particularly NSs and same-day cancellations (SDCs), for hospitalizations and clinics within our healthcare system.
METHODS
Study Design
We conducted an observational cohort study of adult patients from 10 medical units at the Hospital of the University of Pennsylvania (a 789-bed quaternary-care hospital within an urban, academic medical system) who were scheduled with at least 1 PDFV. Specifically, the patients included in our analysis were hospitalized on general internal medicine services or medical subspecialty services with discharge dates between April 1, 2014, and March 31, 2015. Hospitalizations included in our study had at least 1 PDFV scheduled with an outpatient provider affiliated with the University of Pennsylvania Health System (UPHS). PDFVs scheduled with unaffiliated providers were not examined.
Each PDFV was requested by a patient’s inpatient care team. Once the care team had determined that a PDFV was clinically warranted, a member of the team (generally a resident, advanced practice provider, medical student, or designee) either called the UPHS clinic to schedule an appointment time or e-mailed the outpatient UPHS provider directly to facilitate a more urgent PDFV appointment time. Once a PDFV time was confirmed, PDFV details (ie, date, time, location, and phone number) were electronically entered into the patient’s discharge instructions by the inpatient care team. At the time of discharge, nurses reviewed these instructions with their patients. All patients left the hospital with a physical copy of these instructions. As part of routine care at our institution, patients then received automated telephone reminders from their UPHS-affiliated outpatient clinic 48 hours prior to each PDFV.
Data Collection
Our study was determined to meet criteria for quality improvement by the University of Pennsylvania’s Institutional Review Board. We used our healthcare system’s integrated electronic medical record system to track the dates of initial PDFV requests, the dates of hospitalization, and actual PDFV dates. PDFVs were included if the appointment request was made while a patient was hospitalized, including the day of discharge. Our study methodology only allowed us to investigate PDFVs scheduled with UPHS outpatient providers. We did not review discharge instructions or survey non-UPHS clinics to quantify visits scheduled with other providers, for example, community health centers or external private practices.
Exclusion criteria included the following: (1) office visits with nonproviders, for example, scheduled diagnostic procedures or pharmacist appointments for warfarin dosing; (2) visits cancelled by inpatient providers prior to discharge; (3) visits for patients not otherwise eligible for UPHS outpatient care because of insurance reasons; and (4) visits scheduled for dates after a patient’s death. Our motivation for the third exclusion criterion was the infrequent and irregular process by which PDFVs were authorized for these patients. These patients and their characteristics are described in Supplementary Table 1 in more detail.
For each PDFV, we recorded age, gender, race, insurance status, driving distance, length of stay for index hospitalization, discharging service (general internal medicine vs subspecialty), postdischarge disposition (home, home with home care services such as nursing or physical therapy, or facility), the number of PDFVs scheduled per index hospitalization, PDFV specialty type (oncologic subspecialty, nononcologic medical subspecialty, nononcologic surgical subspecialty, primary care, or other specialty), PDFV season, and PDFV lead time (the number of days between the discharge date and PDFV). We consolidated oncologic specialties into 1 group given the integrated nature of our healthcare system’s comprehensive cancer center. “Other” PDFV specialty subtypes are described in Supplementary Table 2. Driving distances between patient postal codes and our hospital were calculated using Excel VBA Master (Salt Lake City, Utah) and were subsequently categorized into patient-level quartiles for further analysis. For cancelled PDFVs, we collected dates of cancellation relative to the date of the appointment itself.
Study Outcomes
The primary study outcome was PDFV attendance. Each PDFV’s status was categorized by outpatient clinic staff as attended, cancelled, or NS. For cancelled appointments, cancellation dates and reasons (if entered by clinic representatives) were collected. In keeping with prior studies investigating outpatient nonattendance,we calculated collective NS/SDC rates for the variables listed above.17,22-25 We additionally calculated NS/SDC and attendance-as-scheduled rates stratified by the number of PDFVs per patient to assess for a “high-utilizer” effect with regard to PDFV attendance.
Statistical Analysis
We used multivariable mixed-effects regression with a logit link to assess associations between age, gender, race, insurance, driving distance quartile, length of stay, discharging service, postdischarge disposition, the number of PDFVs per hospitalization, PDFV specialty type, PDFV season, PDFV lead time, and our NS/SDC outcome. The mixed-effects approach was used to account for correlation structures induced by patients who had multiple visits and for patients with multiple hospitalizations. Specifically, our model specified 2 levels of nesting (PDFVs nested within each hospitalization, which were nested within each patient) to obtain appropriate standard error estimates for our adjusted odds ratios (ORs). Correlation matrices and multivariable variance inflation factors were used to assess collinearity among the predictor variables. These assessments did not indicate strong collinearity; hence, all predictors were included in the model. Only driving distance had a small amount of missing data (0.18% of driving distances were unavailable), so multiple imputation was not undertaken. Analyses were performed using R version 3.3.1 (R Foundation for Statistical Computing, Vienna, Austria).
RESULTS
Baseline Characteristics
During the 1-year study period, there were 11,829 discrete hospitalizations in medical units at our hospital. Of these hospitalizations, 6136 (52%) had at least 1 UPHS-affiliated PDFV meeting our inclusion and exclusion criteria, as detailed in the Figure. Across these hospitalizations, 9258 PDFVs were scheduled on behalf of 4653 patients. Demographic characteristics for these patients, hospitalizations, and visits are detailed in Table 1. The median age of patients in our cohort was 61 years old (interquartile range [IQR] 49-70, range 18-101). The median driving distance was 17 miles (IQR 4.3-38.8, range 0-2891). For hospitalizations, the median length of stay was 5 days (IQR 3-10, range 0-97). The median PDFV lead time, which is defined as the number of days between discharge and PDFV, was 12 days (IQR 6-23, range 1-60). Overall, 41% of patients (n = 1927) attended all of their PDFVs as scheduled; Supplementary Figure 1 lists patient-level PDFV attendance-as-scheduled percentages in more detail.
Incidence of NSs and SDCs
Twenty-five percent of PDFVs (n = 2303) were ultimately NS/SDCs; this included 1658 NSs (18% of all appointments) and 645 SDCs (7% of all appointments). Fifty-two percent of PDFVs (n = 4847) were kept as scheduled, while 23% (n = 2108) were cancelled before the day of the visit. Of the 2558 cancellations with valid cancellation dates, 49% (n = 1252) were cancelled 2 or fewer days beforehand, as shown in Supplementary Figure 2.
The presence of exactly 2 PDFVs per hospitalization was also associated with higher NS/SDC rates (OR 1.17, 95% CI, 1.01-1.36), compared to a single PDFV per hospitalization; however, the presence of more than 2 PDFVs per hospitalization was associated with lower NS/SDC rates (OR 0.82, 95% CI, 0.69-0.98). A separate analysis (data not shown) of potential high utilizers revealed a 15% NS/SDC rate for the top 0.5% of patients (median: 18 PDFVs each) and an 18% NS/SDC rate for the top 1% of patients (median: 14 PDFVs each) with regard to the numbers of PDFVs scheduled, compared to the 25% overall NS/SDC rate for all patients.
NS/SDC rates and adjusted ORs with regard to individual PDFV characteristics are displayed in Table 3. Nononcologic visits had higher NS/SDC rates than oncologic visits; for example, the NS/SDC rate for primary care visits was 39% (OR 2.62, 95% CI, 2.03-3.38), compared to 12% for oncologic visits. Appointments in the “other” specialty category also had high nonattendance rates, as further described in Supplementary Table B. Summertime appointments were more likely to be attended (OR 0.81, 95% CI, 0.68-0.97) compared to those in the spring. PDFV lead time (the time interval between the discharge date and appointment date) was not associated with changes in visit attendance.
DISCUSSION
When comparing PDFV characteristics themselves, oncologic visits had the lowest NS/SDC incidence of any group analyzed in our study. This may be related to the inherent life-altering nature of a cancer diagnosis or our cancer center’s use of patient navigators.23,30 In contrast, primary care clinics suffered from NS/SDC rates approaching 40%, which is a concerning finding given the importance of primary care coordination in the posthospitalization period.9,31 Why are primary care appointments so commonly missed? Some studies suggest that forgetting about a primary care appointment is a leading reason.15,32,33 For PDFVs, this phenomenon may be augmented because the visits are not scheduled by patients themselves. Additionally, patients may paradoxically undervalue the benefit of an all-encompassing primary care visit, compared to a PDFV focused on a specific problem, (eg, a cardiology follow-up appointment for a patient with congestive heart failure). In particular, patients with limited health literacy may potentially undervalue the capabilities of their primary care clinics.34,35
The low absolute number of primary care PDFVs (only 8% of all visits) scheduled for patients at our hospital was an unexpected finding. This low percentage is likely a function of the patient population hospitalized at our large, urban quaternary-care facility. First, an unknown number of patients may have had PDFVs manually scheduled with primary care providers external to our health system; these PDFVs were not captured within our study. Second, 71% of the hospitalizations in our study occurred in subspecialty services, for which specific primary care follow-up may not be as urgent. Supporting this fact, further analysis of the 6136 hospitalizations in our study (data not shown) revealed that 28% of the hospitalizations in general internal medicine were scheduled with at least 1 primary care PDFV as opposed to only 5% of subspecialty-service hospitalizations.
In contrast to several previous studies of outpatient nonattendance,we did not find that visits scheduled for time points further in the future were more likely to be missed.14,24,25,36,37 Unlike other appointments, it may be that PDFV lead time does not affect attendance because of the unique manner in which PDFV times are scheduled and conveyed to patients. Unlike other appointments, patients do not schedule PDFVs themselves but instead learn about their PDFV dates as part of a large set of discharge instructions. This practice may result in poor recall of PDFV dates in recently hospitalized patients38, regardless of the lead time between discharge and the visit itself.
Supplementary Table 1 details a 51% NS/SDC rate for the small number of PDFVs (n = 65) that were excluded a priori from our analysis because of general ineligibility for UPHS outpatient care. We specifically chose to exclude this population because of the infrequent and irregular process by which these PDFVs were authorized on a case-by-case basis, typically via active engagement by our hospital’s social work department. We did not study this population further but postulate that the 51% NS/SDC rate may reflect other social determinants of health that contribute to appointment nonadherence in a predominantly uninsured population.
Beyond their effect on patient outcomes, improving PDFV-related processes has the potential to boost both inpatient and outpatient provider satisfaction. From the standpoint of frontline inpatient providers (often resident physicians), calling outpatient clinics to request PDFVs is viewed as 1 of the top 5 administrative tasks that interfere with house staff education.39 Future interventions that involve patients in the PDFV scheduling process may improve inpatient workflow while simultaneously engaging patients in their own care. For example, asking clinic representatives to directly schedule PDFVs with hospitalized patients, either by phone or in person, has been shown in pilot studies to improve PDFV attendance and decrease readmissions.40-42 Conversely, NS/SDC visits harm outpatient provider productivity and decrease provider availability for other patients.13,17,43 Strategies to mitigate the impact of unfilled appointment slots (eg, deliberately overbooking time slots in advance) carry their own risks, including provider burnout.44 As such, preventing NSs may be superior to curing their adverse impacts. Many such strategies exist in the ambulatory setting,13,43,45 for example, better communication with patients through texting or goal-directed, personalized phone reminders.46-48Our study methodology has several limitations. Most importantly, we were unable to measure PDFVs made with providers unaffiliated with UPHS. As previously noted, our low proportion of primary care PDFVs may specifically reflect patients with primary care providers outside of our health system. Similarly, our low percentage of Medicaid patients receiving PDFVs may be related to follow-up visits with nonaffiliated community health centers. We were unable to measure patient acuity and health literacy as potential predictors of NS/SDC rates. Driving distances were calculated from patient postal codes to our hospital, not to individual outpatient clinics. However, the majority of our hospital-affiliated clinics are located adjacent to our hospital; additionally, we grouped driving distances into quartiles for our analysis. We had initially attempted to differentiate between clinic-initiated and patient-initiated cancellations, but unfortunately, we found that the data were too unreliable to be used for further analysis (outlined in Supplementary Table 3). Lastly, because we studied patients in medical units at a single large, urban, academic center, our results are not generalizable to other settings (eg, community hospitals, hospitals with smaller networks of outpatient providers, or patients being discharged from surgical services or observation units).
CONCLUSION
Given national efforts to enhance postdischarge transitions of care, we aimed to analyze attendance at provider-scheduled PDFV appointments. Our finding that 25% of PDFVs resulted in NS/SDCs raises both questions and opportunities for inpatient and outpatient providers. Further research is needed to understand why so many patients miss their PDFVs, and we should work as a field to develop creative solutions to improve PDFV scheduling and attendance.
Acknowledgments
The authors acknowledge Marie Synnestvedt, PhD, and Manik Chhabra, MD, for their assistance with data gathering and statistical analysis. They also acknowledge Allison DeKosky, MD, Michael Serpa, BS, Michael McFall, and Scott Schlegel, MBA, for their assistance with researching this topic. They did not receive external compensation for their assistance outside of their usual salary support.
DISCLOSURE
Nothing to report.
1. Halasyamani L, Kripalani S, Coleman E, et al. Transition of care for hospitalized elderly patients - development of a discharge checklist for hospitalists. J Hosp Med. 2006;1(6):354-360. PubMed
2. Koehler BE, Richter KM, Youngblood L, et al. Reduction of 30-day postdischarge hospital readmission or emergency department (ED) visit rates in high-risk elderly medical patients through delivery of a targeted care bundle. J Hosp Med. 2009;4(4):211-218. PubMed
3. Soong C, Daub S, Lee JG, et al. Development of a checklist of safe discharge practices for hospital patients. J Hosp Med. 2013;8(8):444-449. PubMed
4. Rice YB, Barnes CA, Rastogi R, Hillstrom TJ, Steinkeler CN. Tackling 30-day, all-cause readmissions with a patient-centered transitional care bundle. Popul Health Manag. 2016;19(1):56-62. PubMed
5. Nelson EA, Maruish MM, Axler JL. Effects of discharge planning and compliance with outpatient appointments on readmission rates. Psych Serv. 2000;51(7):885-889. PubMed
6. Gavish R, Levy A, Dekel OK, Karp E, Maimon N. The association between hospital readmission and pulmonologist follow-up visits in patients with chronic obstructive pulmonary disease. Chest. 2015;148(2):375-381. PubMed
7. Jackson C, Shahsahebi M, Wedlake T, DuBard CA. Timeliness of outpatient follow-up: an evidence-based approach for planning after hospital discharge. Ann Fam Med. 2015;13(2):115-122. PubMed
8. Donaho EK, Hall AC, Gass JA, et al. Protocol-driven allied health post-discharge transition clinic to reduce hospital readmissions in heart failure. J Am Heart Assoc. 2015;4(12):e002296. PubMed
9. Misky GJ, Wald HL, Coleman EA. Post-hospitalization transitions: Examining the effects of timing of primary care provider follow-up. J Hosp Med. 2010;5(7):392-397. PubMed
10. Grafft CA, McDonald FS, Ruud KL, Liesinger JT, Johnson MG, Naessens JM. Effect of hospital follow-up appointment on clinical event outcomes and mortality. Arch Intern Med. 2010;171(11):955-960. PubMed
11. Auerbach AD, Kripalani S, Vasilevskis EE, et al. Preventability and causes of readmissions in a national cohort of general medicine patients. JAMA Intern Med. 2016;176(4):484-493. PubMed
12. Field TS, Ogarek J, Garber L, Reed G, Gurwitz JH. Association of early post-discharge follow-up by a primary care physician and 30-day rehospitalization among older adults. J Gen Intern Med. 2015;30(5):565-571. PubMed
13. Quinn K. It’s no-show time! Med Group Manage Assoc Connexion. 2007;7(6):44-49. PubMed
14. Whittle J, Schectman G, Lu N, Baar B, Mayo-Smith MF. Relationship of scheduling interval to missed and cancelled clinic appointments. J Ambulatory Care Manage. 2008;31(4):290-302. PubMed
15. Kaplan-Lewis E, Percac-Lima S. No-show to primary care appointments: Why patients do not come. J Prim Care Community Health. 2013;4(4):251-255. PubMed
16. Molfenter T. Reducing appointment no-shows: Going from theory to practice. Subst Use Misuse. 2013;48(9):743-749. PubMed
17. Kheirkhah P, Feng Q, Travis LM, Tavakoli-Tabasi S, Sharafkhaneh A. Prevalence, predictors and economic consequences of no-shows. BMC Health Serv Res. 2016;16(1):13. PubMed
18. Colubi MM, Perez-Elias MJ, Elias L, et al. Missing scheduled visits in the outpatient clinic as a marker of short-term admissions and death. HIV Clin Trials. 2012;13(5):289-295. PubMed
19. Obialo CI, Hunt WC, Bashir K, Zager PG. Relationship of missed and shortened hemodialysis treatments to hospitalization and mortality: Observations from a US dialysis network. Clin Kidney J. 2012;5(4):315-319. PubMed
20. Hwang AS, Atlas SJ, Cronin P, et al. Appointment “no-shows” are an independent predictor of subsequent quality of care and resource utilization outcomes. J Gen Intern Med. 2015;30(10):1426-1433. PubMed
21. Perez FD, Xie J, Sin A, et al. Characteristics and direct costs of academic pediatric subspecialty outpatient no-show events. J Healthc Qual. 2014;36(4):32-42. PubMed
22. Huang Y, Zuniga P. Effective cancellation policy to reduce the negative impact of patient no-show. Journal of the Operational Research Society. 2013;65(5):605-615.
23. Percac-Lima S, Cronin PR, Ryan DP, Chabner BA, Daly EA, Kimball AB. Patient navigation based on predictive modeling decreases no-show rates in cancer care. Cancer. 2015;121(10):1662-1670. PubMed
24. Torres O, Rothberg MB, Garb J, Ogunneye O, Onyema J, Higgins T. Risk factor model to predict a missed clinic appointment in an urban, academic, and underserved setting. Popul Health Manag. 2015;18(2):131-136. PubMed
25. Eid WE, Shehata SF, Cole DA, Doerman KL. Predictors of nonattendance at an endocrinology outpatient clinic. Endocr Pract. 2016;22(8):983-989. PubMed
26. Kashiwagi DT, Burton MC, Kirkland LL, Cha S, Varkey P. Do timely outpatient follow-up visits decrease hospital readmission rates? Am J Med Qual. 2012;27(1):11-15. PubMed
27. Miller AJ, Chae E, Peterson E, Ko AB. Predictors of repeated “no-showing” to clinic appointments. Am J Otolaryngol. 2015;36(3):411-414. PubMed
28. ASCO. Billing challenges for residents of Skilled Nursing Facilities. J Oncol Pract. 2008;4(5):245-248. PubMed
29. Centers for Medicare & Medicaid Services (2013). “SE0433: Skilled Nursing Facility consolidated billing as it relates to ambulance services.” Medicare Learning Network Matters. https://www.cms.gov/Outreach-and-Education/Medicare-Learning-Network-MLN/MLNMattersArticles/downloads/se0433.pdf. Accessed on February 14, 2017.
30. Luckett R, Pena N, Vitonis A, Bernstein MR, Feldman S. Effect of patient navigator program on no-show rates at an academic referral colposcopy clinic. J Womens Health (Larchmt). 2015;24(7):608-615. PubMed
31. Jones CD, Vu MB, O’Donnell CM, et al. A failure to communicate: A qualitative exploration of care coordination between hospitalists and primary care providers around patient hospitalizations. J Gen Intern Med. 2015;30(4):417-424. PubMed
32. George A, Rubin G. Non-attendance in general practice: a systematic review and its implications for access to primary health care. Fam Pract. 2003;20(2):178-184. 2016;31(12):1460-1466.J Gen Intern Med. PubMed
48. Shah SJ, Cronin P, Hong CS, et al. Targeted reminder phone calls to patients at high risk of no-show for primary care appointment: A randomized trial. 2010;123(6):542-548.Am J Med. PubMed
47. Parikh A, Gupta K, Wilson AC, Fields K, Cosgrove NM, Kostis JB. The effectiveness of outpatient appointment reminder systems in reducing no-show rates. 2009;20:142-144.Int J STD AIDS. PubMed
46. Price H, Waters AM, Mighty D, et al. Texting appointment reminders reduces ‘Did not attend’ rates, is popular with patients and is cost-effective. 2009;25(3):166-170.J Med Practice Management. PubMed
45. Hills LS. How to handle patients who miss appointments or show up late.
2009;39(3):271-287.Interfaces. PubMed
44. Kros J, Dellana S, West D. Overbooking Increases Patient Access at East Carolina University’s Student Health Services Clinic. 2012;344(3):211-219.Am J Med Sci.
43. Stubbs ND, Geraci SA, Stephenson PL, Jones DB, Sanders S. Methods to reduce outpatient non-attendance. PubMed
42. Haftka A, Cerasale MT, Paje D. Direct patient participation in discharge follow-up appointment scheduling. Paper presented at: Society of Hospital Medicine, Annual Meeting 2015; National Harbor, MD. 2012;5(1):27-32.Patient.
41. Chang R, Spahlinger D, Kim CS. Re-engineering the post-discharge appointment process for general medicine patients. PubMed
40. Coffey C, Kufta J. Patient-centered post-discharge appointment scheduling improves readmission rates. Paper presented at: Society of Hospital Medicine, Annual Meeting 2011; Grapevine, Texas. 2006;81(1):76-81.Acad Med.
39. Vidyarthi AR, Katz PP, Wall SD, Wachter RM, Auerbach AD. Impact of reduced duty hours on residents’ education satistfaction at the University of California, San Francisco.
2013;173(18):1715-1722.JAMA Intern Med. PubMed
38. Horwitz LI, Moriarty JP, Chen C, et al. Quality of discharge practices and patient understanding at an academic medical center. 2010;16(4):246-259.Health Informatics J. PubMed
37. Daggy J, Lawley M, Willis D, et al. Using no-show modeling to improve clinic performance. 2005;5:51.BMC Health Serv Res. PubMed
36. Lee VJ, Earnest A, Chen MI, Krishnan B. Predictors of failed attendances in a multi-specialty outpatient centre using electronic databases. 2013;3(9):e003212.BMJ Open. PubMed
35. Long T, Genao I, Horwitz LI. Reasons for readmission in an underserved high-risk population: A qualitative analysis of a series of inpatient interviews. 2013;32(7):1196-1203.Health Aff (Millwood). PubMed
34. Kangovi S, Barg FK, Carter T, Long JA, Shannon R, Grande D. Understanding why patients of low socioeconomic status prefer hospitals over ambulatory care. 2015;54(10):976-982.Clin Pediatr (Phila). PubMed
33. Samuels RC, Ward VL, Melvin P, et al. Missed Appointments: Factors Contributing to High No-Show Rates in an Urban Pediatrics Primary Care Clinic. PubMed
662-7919; E-mail: rahul.banerjee.md@gmail.com
Perceptions of Readmitted Patients
Over 14% of all patients hospitalized in the United States are readmitted within 30 days of discharge.1 Numerous studies have used administrative data in order to identify clinical and operational predictors of readmission. However, few studies have explored patients' perspectives on readmission.27 As a result, we know little about potentially modifiable challenges which patients face during the transition from hospital to home. Lack of understanding of the patient perspective has hampered the ability of hospitals to create interventions which address these underlying causes of readmissions.
Patients with low socioeconomic status (SES) are up to 43% more likely to require readmission than their higher‐SES counterparts,8, 9 and qualitative data has described unique challenges faced by low‐SES patients during transition.2 Our objectives were to understand the transition experiences of readmitted patients and to compare these experiences across SES and diagnostic categories.
METHODS
Development of a Survey Instrument
A collaborative team of physicians, nurses, and social workers used a previously defined conceptual framework,10 literature search, and expert interviews to construct a 36‐item survey that addressed the following domains: preparedness for prior discharge; delays in care‐seeking; medication adherence; follow‐up with a primary care provider (PCP); and overarching challenges faced during transition which contributed to readmission. Each question had multiple answer choices including Other which allowed patients to provide open‐ended answers; patients could select all answer choices that applied. Prior to administration, the survey was pretested with 15 random patients and revised to improve reliability and comprehensibility. (See Supporting Information, Survey Script Versions 1.0 and 2.0, in the online version of this article.)
Sampling Strategy and Patient Enrollment
Patients were eligible to participate if they: 1) had capacity to complete an interview; and 2) were readmitted within 30 days of a prior discharge from the Hospital of the University of Pennsylvania (HUP), a 695‐bed academic medical center, or Penn Presbyterian Medical Center (PPMC), a 317‐bed affiliated community hospital. Both hospitals are located in Philadelphia and serve a population which is 45.4% privately insured, 33.5% insured by Medicare, and 21.2% uninsured or insured by Medicaid. We excluded readmissions that were planned or from another facility because these were less sensitive to patient domains such as adherence, access, and social support.
Eligible participants were identified by survey administrators (bedside nurses, social workers, or clinical resource managers) on the day of hospital readmission. Because data were being used immediately for quality improvement, the Institutional Review Board (IRB) waived the need for consent. Administrators typically took 10 minutes to conduct the survey in‐person and record responses directly into patients' electronic medical record (EMR). Inpatient care teams could view responses in real time and work to resolve identified challenges prior to patients' discharge.
Between November 10, 2010 and July 5, 2011, 3881 patients were readmitted to study hospitals. Five hundred eighty‐four readmissions were ineligible for the study because they lacked capacity, were planned readmissions, or were readmitted from another facility. This left 3297 eligible individuals. We surveyed 1084 individuals yielding a response rate of 32.9%11; the remainder either refused the survey, or were not approached for the survey due to time restraints of administrators. Characteristics of responders and nonresponders are displayed in Table 1, and were similar in all measured categories with the exception of age (58.0 vs 55.7, P < 0.01) and the number of 60‐day readmissions (2.0 vs 1.3, P < 0.01).
| Characteristics of Patients | Survey Sample (n = 1084) | Not in Survey Sample (n = 2797) | P Value* |
|---|---|---|---|
| |||
| Age mean (SD) | 55.7 (16.6) | 58.0 (18.2) | <0.01 |
| Gender, n (%) | 0.88 | ||
| Male | 546 (50.4%) | 1428 (51.1%) | |
| Race, n (%) | 0.96 | ||
| Black | 502 (46.4%) | 1146 (41.3%) | |
| White | 504 (46.6%) | 1362 (49.1%) | |
| Principal discharge diagnosis, n (%) | 0.98 | ||
| Medical | |||
| Acute on chronic systolic heart failure | 44 (4.6%) | 23 (1.3%) | |
| Acute renal failure | 24 (2.5%) | 29 (1.7%) | |
| Surgical | |||
| Postoperative infection | 48 (14.8%) | 53 (5.2%) | |
| Digestive system problems | 17 (5.2%) | 23 (2.2%) | |
| APR‐DRG score, n (%) | 0.13 | ||
| 0 (Not assigned) | 9 (0.7%) | 28 (1.0%) | |
| 1 (Minor) | 113 (10.1%) | 628 (22.7%) | |
| 2 (Moderate) | 338 (31.4%) | 881 (31.8%) | |
| 3 (Major) | 470 (43.7%) | 883 (31.9%) | |
| 4 (Extreme) | 154 (14.3%) | 369 (13.3%) | |
| Length of stay mean (SD) | 6.2 (6.9) | 6.5 (10.1) | 0.33 |
| Insurance payer, n (%) | 0.77 | ||
| Uninsured/Medicaid | 234 (21.6%) | 489 (17.5%) | |
| Medicaid + Medicare | 85 (7.84%) | 172 (6.2%) | |
| Medicare | 345 (31.8%) | 878 (31.5%) | |
| Private | 420 (38.8%) | 1253 (44.9%) | |
| No. of 60‐d readmissions mean (SD) | 1.3 (0.02) | 2.0 (0.02) | <0.01 |
Statistical Analysis
Survey responses were extracted from the EMR and linked with patient clinical and demographic data. Variables pertaining to hospitalization, such as admitting service and principal diagnosis, were associated with patients' index hospitalization rather than the readmission. A trained research assistant extracted open‐ended free‐text answers to any survey questions marked, Other and coded them using a grounded theory approach.12
In our primary analysis, we described challenges reported by readmitted patients. In a secondary analysis, we tested for differences in transition challenges by SES using lack of insurance or Medicaid as a proxy for low SES. Using insurance status as a marker for material aspects of SES is well‐described in health services research.1316 In addition, income data from our institution demonstrated that 86.5% of uninsured and Medicaid patients have a median household income below $15,000. We tested for differences by diagnostic category using the index admitting service (medical vs surgical) as a proxy for diagnostic category (Table 2).
| Low vs High SES (ref) OR (95% CI) | Medical vs Surgical (ref) OR (95% CI) | |
|---|---|---|
| ||
| Unprepared for DC | 1.3 (0.9, 1.9) | 1.0 (0.7, 1.6) |
| Understanding DC instructions | 2.7 (1.1, 6.6) | 1.7 (0.5, 5.8) |
| Executing DC instructions | 2.2 (1.1, 4.4) | 1.6 (0.6, 3.7) |
| Activities of daily living | 1.0 (0.6, 1.5) | 1.1 (0.7, 1.7) |
| Medication access | 1.6 (0.9, 2.8) | 2.3 (1.0, 4.9) |
| Medication adherence | 1.8 (1.2, 3.0) | 2.6 (1.2, 5.4) |
| Lack of social support | 2.0 (1.2, 3.6) | 2.3 (1.0, 5.2) |
| Lack of food, transportation, telephone | 2.6 (1.1, 6.1) | 7.1 (0.9, 53.2) |
| Substance abuse | 6.7 (2.3, 19.2) | 1.5 (0.4, 5.2) |
We compared continuous variables using the two‐sample t test and categorical variables using Pearson's chi‐square test. The Cuzick nonparametric test was used to test for trends across ordered groups. We used multivariable logistic regression models to estimate the association between each binary transition challenge outcome and predictors: SES and diagnostic group. These models were adjusted for potential confounders: age, gender, length of stay, and severity of illness, as determined by All Patient Refined‐Diagnosis Related Groups (APR‐DRGs). We did not adjust for race because it was strongly correlated with SES in our dataset (P < 0.0001). Confounders were included in final models if their association with outcomes had a P value less than 0.10. Analyses were performed using the STATA software package, version 11.0 (StataCorp LP, College Station, TX). The survey was approved by the University of Pennsylvania IRB.
RESULTS
Patient Characteristics
We surveyed 1084 unique individuals; 50.4% of participants were male, 46.4% were black. The most common index principal diagnosis in the medical group was systolic heart failure (4.6%), while the most common index principal diagnosis in the surgical group was postoperative infection (14.8%) (Table 1).
Discharge Preparedness, Medication Adherence, and PCP Follow‐up
At the time of prior discharge, 86.4% of respondents felt that they had been prepared for self‐care. 80.3% reported being able to take all discharge medications as prescribed. The most common reasons for not being able to take medications included: 1) side effects or worry about side effects (13.1%); 2) trouble paying for medications (10.7%); and 3) lack of transportation to the pharmacy (8.4%). Since their prior discharge, 52.9% of participants reported that they had visited a PCP; 28.7% of participants report being referred by their PCP to the emergency room for readmission.
Transition Challenges in Overall Survey Sample
During the transition from hospital to home, 45.5% of readmitted patients reported experiencing challenges which contributed to readmission. The most commonly reported issues contributing to readmission were: 1) feeling unprepared for discharge (11.8%); 2) difficulty performing activities of daily living (ADLs) (10.6%); 3) trouble adhering to discharge medications (5.7%); 4) difficulty accessing discharge medications (5.0%); and 5) lack of social support (4.7%).
Transition Challenges by Subgroup
Low‐SES patients were more likely than high‐SES patients to report difficulty understanding (odds ratio [OR] 2.7; 95% confidence interval [CI] 1.1, 6.6) and executing (OR 2.2; 95% CI 1.1, 4.4) discharge instructions, difficulty adhering to medications (OR 1.8; 95% CI 1.2, 3.0), lack of social support (OR 2.0; 95% CI 1.2, 3.6), lack of basic resources (OR 2.6; 95% CI 1.1, 6.1), and substance abuse (OR 6.7; 95% CI 2.3, 19.2) as perceived reasons for readmission. Of the patients who described Other issues contributing to readmission, low‐SES patients most commonly described stress or depression (49.0%), while high‐SES patients most commonly reported a recurrence of symptoms (74.8%). Medical and surgical patients had similar odds of facing each transition challenge with one exception: medical patients were more likely to report difficulty adhering to medications (OR 2.6; 95% CI 1.2, 5.4).
DISCUSSION
Several findings from this study are of interest to practicing hospitalists or hospital administrators. First, of the issues to which patients most commonly attributed readmission, lack of discharge preparedness is the only one which occurs during index hospitalization; in order to address most transition challenges, hospitals must think beyond their walls. By penalizing hospitals for excess rates of readmission, The Hospital Readmission Reduction Program (HRRP) will effectively hold hospitals accountable for addressing issues which occur in patients' homes and communities.17 Hospitals that have robust partnerships with community pharmacies, social service agencies, and PCPs may have the most influence on these issues and the most success in reducing readmissions. Second, consistent with other literature describing increased rates of readmission with enhanced PCP follow‐up,18 our findings demonstrate that PCPs often refer their patients to the emergency room for readmission. This suggests that PCP follow‐up, while perhaps essential for patient care, may not necessarily reduce readmissions and may actually facilitate readmission. Third, this study describes underlying reasons for patient nonadherence with discharge medications: side effects, cost, and transportation. Targeted interventions to improve adherence may include floor‐based pharmacists who counsel on side effects, determine co‐pays prior to discharge, and encourage patients to fill prescriptions from the hospital pharmacy to avoid transportation barriers.
Finally, and perhaps most importantly, these data suggest that one transition experience does not fit all. Patients with low SES appear to have a distinct and challenging transition experience. Currently, there is an emphasis on tailoring transition interventions to specific disease populations, such as patients with congestive heart failure. Our study suggests that it may be more effective to tailor interventions for low‐SES patients across diagnostic category, helping these patients gain access to outpatient medical resources and address competing issues, such as food insecurity or substance abuse.
Our study has several limitations. First, the low survey response rate makes it susceptible to nonresponse bias. Second, survey administration by a member of the care team may have increased social desirability bias. Third, because it was important to the study team to incorporate our survey into hospital workflow, survey responses were recorded directly into the EMR which limited administrators to recording a yes response for each answer choice which the participant endorsed. Therefore, in our dataset, we are unable to distinguish a definite no from a missing response; however, the survey was short, making it unlikely that questions were skipped. Fourth, closed‐ended questions may have failed to capture the range of participant responses, although the inclusion of an open‐ended answer choice ameliorates this issue. Finally, we are unable to draw conclusions regarding association of survey responses with the risk of readmission, because this study was administered only to readmitted patients.
CONCLUSIONS
This report of patients' perspectives challenges many commonly held assumptions regarding readmission. Readmission reflects not only the quality of hospital care, but a variety of factors in patients' homes and communities. PCP follow‐up, while perhaps critical for patient care, may not be a panacea for reducing hospital readmissions. Targeted medication counseling focused on side effects, co‐pay, and medication delivery may address patients' underlying reasons for nonadherence. And most importantly, one transition experience does not fit all. Hospitalists and administrators must tailor interventions to address challenges reported by their patients, particularly those of low SES.
Acknowledgements
The authors are grateful to the Society of General Internal Medicine (SGIM) for selecting our abstract Perceptions of Readmitted Patients on the Transition From Hospital to Home as a Lipkin Award Finalist during the 2012 SGIM National Meeting.
Disclosures: Support for this study was provided by a grant from the Leonard Davis Institute of Health Economics. Dr Grande has received honoraria from the Johns Hopkins University CME Program; has a consultancy with the National Nursing Centers Consortium; and has received grant support from, or has grants pending with, the HealthWell Foundation, the National Human Genome Research Institute, and the Agency for Healthcare Research and Quality. Dr Shannon is the founder of a biotech company, Ventrigen, LLC; is a senior fellow at IHI; is on the scientific advisory boards for Glasgow Smith Klein, Pfizer, Merck, and Value Capture; and is a member of the Board of Directors of the ABIM.
- ,,,.All‐Cause Readmissions by Payer and Age, 2008: Statistical Brief #115. Healthcare Cost and Utilization Project (HCUP) Statistical Briefs.Rockville, MD:Agency for Health Care Policy and Research; February 2006–June2011.
- ,,.Understanding rehospitalization risk: can hospital discharge be modified to reduce recurrent hospitalization?J Hosp Med.2007;2(5):297–304.
- ,,.Patients' and caregivers' transition from hospital to home: needs and recommendations.Home Health Care Serv Q.1999;17(3):27–48.
- ,,.Reasons for readmission in heart failure: perspectives of patients, caregivers, cardiologists, and heart failure nurses.Heart Lung.2009;38(5):427–434.
- ,.Psychiatric rehospitalization of the severely mentally ill: patient and staff perspectives.Nurs Res.1992;41(5):301–305.
- ,,,,,.Continuity of care and monitoring pain after discharge: patient perspective.J Adv Nurs.2010;66(1):40–48.
- ,,,.Going home from hospital: the carer/patient dyad.J Adv Nurs.2001;35(2):206–217.
- ,,.The impact of patient socioeconomic status and other social factors on readmission. A prospective study in 4 Massachusetts hospitals.Inquiry.1994;31(2):163–172.
- ,,,.Redefining readmission risk factors for general medicine patients.J Hosp Med.2011;6(2):54–60.
- ,.Hospital readmissions—not just a measure of quality.JAMA.2011;306(16):1796–1797.
- American Association for Public Opinion Research (AAPOR).Standard Definitions: Final Dispositions of Case Codes and Outcome Rates for Surveys.7th ed.Deerfield, IL:AAPOR;2011.
- ,.The Discovery of Grounded Theory: Strategies for Qualitative Research.New York:Aldine;1967.
- ,,,.The relation between health insurance coverage and clinical outcomes among women with breast cancer.N Engl J Med.1993;329(5):326–331.
- ,,,,,.Neighborhood socioeconomic status, Medicaid coverage and medical management of myocardial infarction: atherosclerosis risk in communities (ARIC) community surveillance.BMC Public Health.2010;10:632.
- ,,,,.Effects of practice setting on quality of lipid‐lowering management in patients with coronary artery disease.Am J Cardiol.1998;81(12):1416–1420.
- .Income Data by Insurance Category.2012.
- ,.Hospital readmissions and the Affordable Care Act: paying for coordinated quality care.JAMA.2011;306(16):1794–1795.
- ,,.Does increased access to primary care reduce hospital readmissions?N Engl J Med.1996;334(22):1441–1447.
Over 14% of all patients hospitalized in the United States are readmitted within 30 days of discharge.1 Numerous studies have used administrative data in order to identify clinical and operational predictors of readmission. However, few studies have explored patients' perspectives on readmission.27 As a result, we know little about potentially modifiable challenges which patients face during the transition from hospital to home. Lack of understanding of the patient perspective has hampered the ability of hospitals to create interventions which address these underlying causes of readmissions.
Patients with low socioeconomic status (SES) are up to 43% more likely to require readmission than their higher‐SES counterparts,8, 9 and qualitative data has described unique challenges faced by low‐SES patients during transition.2 Our objectives were to understand the transition experiences of readmitted patients and to compare these experiences across SES and diagnostic categories.
METHODS
Development of a Survey Instrument
A collaborative team of physicians, nurses, and social workers used a previously defined conceptual framework,10 literature search, and expert interviews to construct a 36‐item survey that addressed the following domains: preparedness for prior discharge; delays in care‐seeking; medication adherence; follow‐up with a primary care provider (PCP); and overarching challenges faced during transition which contributed to readmission. Each question had multiple answer choices including Other which allowed patients to provide open‐ended answers; patients could select all answer choices that applied. Prior to administration, the survey was pretested with 15 random patients and revised to improve reliability and comprehensibility. (See Supporting Information, Survey Script Versions 1.0 and 2.0, in the online version of this article.)
Sampling Strategy and Patient Enrollment
Patients were eligible to participate if they: 1) had capacity to complete an interview; and 2) were readmitted within 30 days of a prior discharge from the Hospital of the University of Pennsylvania (HUP), a 695‐bed academic medical center, or Penn Presbyterian Medical Center (PPMC), a 317‐bed affiliated community hospital. Both hospitals are located in Philadelphia and serve a population which is 45.4% privately insured, 33.5% insured by Medicare, and 21.2% uninsured or insured by Medicaid. We excluded readmissions that were planned or from another facility because these were less sensitive to patient domains such as adherence, access, and social support.
Eligible participants were identified by survey administrators (bedside nurses, social workers, or clinical resource managers) on the day of hospital readmission. Because data were being used immediately for quality improvement, the Institutional Review Board (IRB) waived the need for consent. Administrators typically took 10 minutes to conduct the survey in‐person and record responses directly into patients' electronic medical record (EMR). Inpatient care teams could view responses in real time and work to resolve identified challenges prior to patients' discharge.
Between November 10, 2010 and July 5, 2011, 3881 patients were readmitted to study hospitals. Five hundred eighty‐four readmissions were ineligible for the study because they lacked capacity, were planned readmissions, or were readmitted from another facility. This left 3297 eligible individuals. We surveyed 1084 individuals yielding a response rate of 32.9%11; the remainder either refused the survey, or were not approached for the survey due to time restraints of administrators. Characteristics of responders and nonresponders are displayed in Table 1, and were similar in all measured categories with the exception of age (58.0 vs 55.7, P < 0.01) and the number of 60‐day readmissions (2.0 vs 1.3, P < 0.01).
| Characteristics of Patients | Survey Sample (n = 1084) | Not in Survey Sample (n = 2797) | P Value* |
|---|---|---|---|
| |||
| Age mean (SD) | 55.7 (16.6) | 58.0 (18.2) | <0.01 |
| Gender, n (%) | 0.88 | ||
| Male | 546 (50.4%) | 1428 (51.1%) | |
| Race, n (%) | 0.96 | ||
| Black | 502 (46.4%) | 1146 (41.3%) | |
| White | 504 (46.6%) | 1362 (49.1%) | |
| Principal discharge diagnosis, n (%) | 0.98 | ||
| Medical | |||
| Acute on chronic systolic heart failure | 44 (4.6%) | 23 (1.3%) | |
| Acute renal failure | 24 (2.5%) | 29 (1.7%) | |
| Surgical | |||
| Postoperative infection | 48 (14.8%) | 53 (5.2%) | |
| Digestive system problems | 17 (5.2%) | 23 (2.2%) | |
| APR‐DRG score, n (%) | 0.13 | ||
| 0 (Not assigned) | 9 (0.7%) | 28 (1.0%) | |
| 1 (Minor) | 113 (10.1%) | 628 (22.7%) | |
| 2 (Moderate) | 338 (31.4%) | 881 (31.8%) | |
| 3 (Major) | 470 (43.7%) | 883 (31.9%) | |
| 4 (Extreme) | 154 (14.3%) | 369 (13.3%) | |
| Length of stay mean (SD) | 6.2 (6.9) | 6.5 (10.1) | 0.33 |
| Insurance payer, n (%) | 0.77 | ||
| Uninsured/Medicaid | 234 (21.6%) | 489 (17.5%) | |
| Medicaid + Medicare | 85 (7.84%) | 172 (6.2%) | |
| Medicare | 345 (31.8%) | 878 (31.5%) | |
| Private | 420 (38.8%) | 1253 (44.9%) | |
| No. of 60‐d readmissions mean (SD) | 1.3 (0.02) | 2.0 (0.02) | <0.01 |
Statistical Analysis
Survey responses were extracted from the EMR and linked with patient clinical and demographic data. Variables pertaining to hospitalization, such as admitting service and principal diagnosis, were associated with patients' index hospitalization rather than the readmission. A trained research assistant extracted open‐ended free‐text answers to any survey questions marked, Other and coded them using a grounded theory approach.12
In our primary analysis, we described challenges reported by readmitted patients. In a secondary analysis, we tested for differences in transition challenges by SES using lack of insurance or Medicaid as a proxy for low SES. Using insurance status as a marker for material aspects of SES is well‐described in health services research.1316 In addition, income data from our institution demonstrated that 86.5% of uninsured and Medicaid patients have a median household income below $15,000. We tested for differences by diagnostic category using the index admitting service (medical vs surgical) as a proxy for diagnostic category (Table 2).
| Low vs High SES (ref) OR (95% CI) | Medical vs Surgical (ref) OR (95% CI) | |
|---|---|---|
| ||
| Unprepared for DC | 1.3 (0.9, 1.9) | 1.0 (0.7, 1.6) |
| Understanding DC instructions | 2.7 (1.1, 6.6) | 1.7 (0.5, 5.8) |
| Executing DC instructions | 2.2 (1.1, 4.4) | 1.6 (0.6, 3.7) |
| Activities of daily living | 1.0 (0.6, 1.5) | 1.1 (0.7, 1.7) |
| Medication access | 1.6 (0.9, 2.8) | 2.3 (1.0, 4.9) |
| Medication adherence | 1.8 (1.2, 3.0) | 2.6 (1.2, 5.4) |
| Lack of social support | 2.0 (1.2, 3.6) | 2.3 (1.0, 5.2) |
| Lack of food, transportation, telephone | 2.6 (1.1, 6.1) | 7.1 (0.9, 53.2) |
| Substance abuse | 6.7 (2.3, 19.2) | 1.5 (0.4, 5.2) |
We compared continuous variables using the two‐sample t test and categorical variables using Pearson's chi‐square test. The Cuzick nonparametric test was used to test for trends across ordered groups. We used multivariable logistic regression models to estimate the association between each binary transition challenge outcome and predictors: SES and diagnostic group. These models were adjusted for potential confounders: age, gender, length of stay, and severity of illness, as determined by All Patient Refined‐Diagnosis Related Groups (APR‐DRGs). We did not adjust for race because it was strongly correlated with SES in our dataset (P < 0.0001). Confounders were included in final models if their association with outcomes had a P value less than 0.10. Analyses were performed using the STATA software package, version 11.0 (StataCorp LP, College Station, TX). The survey was approved by the University of Pennsylvania IRB.
RESULTS
Patient Characteristics
We surveyed 1084 unique individuals; 50.4% of participants were male, 46.4% were black. The most common index principal diagnosis in the medical group was systolic heart failure (4.6%), while the most common index principal diagnosis in the surgical group was postoperative infection (14.8%) (Table 1).
Discharge Preparedness, Medication Adherence, and PCP Follow‐up
At the time of prior discharge, 86.4% of respondents felt that they had been prepared for self‐care. 80.3% reported being able to take all discharge medications as prescribed. The most common reasons for not being able to take medications included: 1) side effects or worry about side effects (13.1%); 2) trouble paying for medications (10.7%); and 3) lack of transportation to the pharmacy (8.4%). Since their prior discharge, 52.9% of participants reported that they had visited a PCP; 28.7% of participants report being referred by their PCP to the emergency room for readmission.
Transition Challenges in Overall Survey Sample
During the transition from hospital to home, 45.5% of readmitted patients reported experiencing challenges which contributed to readmission. The most commonly reported issues contributing to readmission were: 1) feeling unprepared for discharge (11.8%); 2) difficulty performing activities of daily living (ADLs) (10.6%); 3) trouble adhering to discharge medications (5.7%); 4) difficulty accessing discharge medications (5.0%); and 5) lack of social support (4.7%).
Transition Challenges by Subgroup
Low‐SES patients were more likely than high‐SES patients to report difficulty understanding (odds ratio [OR] 2.7; 95% confidence interval [CI] 1.1, 6.6) and executing (OR 2.2; 95% CI 1.1, 4.4) discharge instructions, difficulty adhering to medications (OR 1.8; 95% CI 1.2, 3.0), lack of social support (OR 2.0; 95% CI 1.2, 3.6), lack of basic resources (OR 2.6; 95% CI 1.1, 6.1), and substance abuse (OR 6.7; 95% CI 2.3, 19.2) as perceived reasons for readmission. Of the patients who described Other issues contributing to readmission, low‐SES patients most commonly described stress or depression (49.0%), while high‐SES patients most commonly reported a recurrence of symptoms (74.8%). Medical and surgical patients had similar odds of facing each transition challenge with one exception: medical patients were more likely to report difficulty adhering to medications (OR 2.6; 95% CI 1.2, 5.4).
DISCUSSION
Several findings from this study are of interest to practicing hospitalists or hospital administrators. First, of the issues to which patients most commonly attributed readmission, lack of discharge preparedness is the only one which occurs during index hospitalization; in order to address most transition challenges, hospitals must think beyond their walls. By penalizing hospitals for excess rates of readmission, The Hospital Readmission Reduction Program (HRRP) will effectively hold hospitals accountable for addressing issues which occur in patients' homes and communities.17 Hospitals that have robust partnerships with community pharmacies, social service agencies, and PCPs may have the most influence on these issues and the most success in reducing readmissions. Second, consistent with other literature describing increased rates of readmission with enhanced PCP follow‐up,18 our findings demonstrate that PCPs often refer their patients to the emergency room for readmission. This suggests that PCP follow‐up, while perhaps essential for patient care, may not necessarily reduce readmissions and may actually facilitate readmission. Third, this study describes underlying reasons for patient nonadherence with discharge medications: side effects, cost, and transportation. Targeted interventions to improve adherence may include floor‐based pharmacists who counsel on side effects, determine co‐pays prior to discharge, and encourage patients to fill prescriptions from the hospital pharmacy to avoid transportation barriers.
Finally, and perhaps most importantly, these data suggest that one transition experience does not fit all. Patients with low SES appear to have a distinct and challenging transition experience. Currently, there is an emphasis on tailoring transition interventions to specific disease populations, such as patients with congestive heart failure. Our study suggests that it may be more effective to tailor interventions for low‐SES patients across diagnostic category, helping these patients gain access to outpatient medical resources and address competing issues, such as food insecurity or substance abuse.
Our study has several limitations. First, the low survey response rate makes it susceptible to nonresponse bias. Second, survey administration by a member of the care team may have increased social desirability bias. Third, because it was important to the study team to incorporate our survey into hospital workflow, survey responses were recorded directly into the EMR which limited administrators to recording a yes response for each answer choice which the participant endorsed. Therefore, in our dataset, we are unable to distinguish a definite no from a missing response; however, the survey was short, making it unlikely that questions were skipped. Fourth, closed‐ended questions may have failed to capture the range of participant responses, although the inclusion of an open‐ended answer choice ameliorates this issue. Finally, we are unable to draw conclusions regarding association of survey responses with the risk of readmission, because this study was administered only to readmitted patients.
CONCLUSIONS
This report of patients' perspectives challenges many commonly held assumptions regarding readmission. Readmission reflects not only the quality of hospital care, but a variety of factors in patients' homes and communities. PCP follow‐up, while perhaps critical for patient care, may not be a panacea for reducing hospital readmissions. Targeted medication counseling focused on side effects, co‐pay, and medication delivery may address patients' underlying reasons for nonadherence. And most importantly, one transition experience does not fit all. Hospitalists and administrators must tailor interventions to address challenges reported by their patients, particularly those of low SES.
Acknowledgements
The authors are grateful to the Society of General Internal Medicine (SGIM) for selecting our abstract Perceptions of Readmitted Patients on the Transition From Hospital to Home as a Lipkin Award Finalist during the 2012 SGIM National Meeting.
Disclosures: Support for this study was provided by a grant from the Leonard Davis Institute of Health Economics. Dr Grande has received honoraria from the Johns Hopkins University CME Program; has a consultancy with the National Nursing Centers Consortium; and has received grant support from, or has grants pending with, the HealthWell Foundation, the National Human Genome Research Institute, and the Agency for Healthcare Research and Quality. Dr Shannon is the founder of a biotech company, Ventrigen, LLC; is a senior fellow at IHI; is on the scientific advisory boards for Glasgow Smith Klein, Pfizer, Merck, and Value Capture; and is a member of the Board of Directors of the ABIM.
- ,,,.All‐Cause Readmissions by Payer and Age, 2008: Statistical Brief #115. Healthcare Cost and Utilization Project (HCUP) Statistical Briefs.Rockville, MD:Agency for Health Care Policy and Research; February 2006–June2011.
- ,,.Understanding rehospitalization risk: can hospital discharge be modified to reduce recurrent hospitalization?J Hosp Med.2007;2(5):297–304.
- ,,.Patients' and caregivers' transition from hospital to home: needs and recommendations.Home Health Care Serv Q.1999;17(3):27–48.
- ,,.Reasons for readmission in heart failure: perspectives of patients, caregivers, cardiologists, and heart failure nurses.Heart Lung.2009;38(5):427–434.
- ,.Psychiatric rehospitalization of the severely mentally ill: patient and staff perspectives.Nurs Res.1992;41(5):301–305.
- ,,,,,.Continuity of care and monitoring pain after discharge: patient perspective.J Adv Nurs.2010;66(1):40–48.
- ,,,.Going home from hospital: the carer/patient dyad.J Adv Nurs.2001;35(2):206–217.
- ,,.The impact of patient socioeconomic status and other social factors on readmission. A prospective study in 4 Massachusetts hospitals.Inquiry.1994;31(2):163–172.
- ,,,.Redefining readmission risk factors for general medicine patients.J Hosp Med.2011;6(2):54–60.
- ,.Hospital readmissions—not just a measure of quality.JAMA.2011;306(16):1796–1797.
- American Association for Public Opinion Research (AAPOR).Standard Definitions: Final Dispositions of Case Codes and Outcome Rates for Surveys.7th ed.Deerfield, IL:AAPOR;2011.
- ,.The Discovery of Grounded Theory: Strategies for Qualitative Research.New York:Aldine;1967.
- ,,,.The relation between health insurance coverage and clinical outcomes among women with breast cancer.N Engl J Med.1993;329(5):326–331.
- ,,,,,.Neighborhood socioeconomic status, Medicaid coverage and medical management of myocardial infarction: atherosclerosis risk in communities (ARIC) community surveillance.BMC Public Health.2010;10:632.
- ,,,,.Effects of practice setting on quality of lipid‐lowering management in patients with coronary artery disease.Am J Cardiol.1998;81(12):1416–1420.
- .Income Data by Insurance Category.2012.
- ,.Hospital readmissions and the Affordable Care Act: paying for coordinated quality care.JAMA.2011;306(16):1794–1795.
- ,,.Does increased access to primary care reduce hospital readmissions?N Engl J Med.1996;334(22):1441–1447.