User login
Patient Costs for Observation Care/
When Medicare beneficiaries seek healthcare, they are increasingly likely to have that care delivered under observation status. From 2006 to 2010, the annual number of observation hours for Medicare beneficiaries rose by nearly 70%.[1] In 2012, the number of observation stays for Medicare beneficiaries reached 1.5 million.[2] One consequence of this trend is a potential change in patient financial liabilitythe amount patients are expected to pay out of pocket for care. Although observation care is usually delivered in a hospital, Medicare classifies it as an outpatient service, covered through Part B rather than inpatient Part A. In two‐thirds of US hospitals, observation care is largely an administrative classification, delivered in the same units and beds as admitted patients rather than in a protocol‐driven observation care unit.[3] Therefore, patients are often unaware of their outpatient observation status and its financial implications until they receive their hospital bill.
Observation has the potential to impact patient financial liability through 4 mechanisms.[4] First, instead of a fixed cost for an inpatient admission (eg, a fixed deductible for a hospital admission), patients pay a percentage of the cost of each service provided. Therefore, patients who have long observation stays or receive expensive services could have higher than expected liability. A recent study using all‐payer data demonstrated that patients with longer observation stays (greater than 24 hours) paid 21% more than for those with shorter stays.[5]
A second consideration is that Medicare does not cover the same hospital services for observation care as it does for inpatient care. For example, self‐administered medications are generally not covered for beneficiaries receiving observation care. However, the Office of the Inspector General (OIG)[2] recently found that the average patient cost per observation stay in 2012even including the cost of self‐administered medicationswas $528. This was significantly lower than the inpatient deductible ($1156 in 2012) that patients would have paid had they been admitted. Although on average patients paid less for observation care, the OIG report found that 6% of observation stays were more costly to patients than inpatient admissions.
Third, there are certain benefits that Medicare beneficiaries are not eligible for unless they are admitted to the hospital. For a beneficiary to receive skilled nursing facility (SNF) benefits, they must be admitted to the hospital for 3 or more days. This was the basis for Bagnall v Sebelius, a class action lawsuit against the Centers for Medicare & Medicaid Services (CMS) filed in 2009 by the Center for Medicare Advocacy.[6] The OIG estimated that in 2012, Medicare beneficiaries had 600,000 observation stays longer than 3 days that failed to qualify them for SNF services. Since then, CMS created the 2‐midnight rule,[7] stating that CMS will assign inpatient status to all medically necessary stays of 2 midnights or longer. This rule was intended, in part, to curb the use of observation stays greater than 48 hours and was a key factor in Judge Michael Shea's decision to dismiss Bagnall v Sebelius.[6]
Finally, Medicare beneficiaries who must revisit the hospital may have greater cumulative costs under observation care versus inpatient care. Medicare beneficiaries are partially protected from accumulating high costs over multiple inpatient admissions by a benefit design known as the benefit period. A benefit period begins the day a beneficiary is admitted to a hospital or SNF, and ends when he or she has not received any inpatient hospital or SNF care for 60 days in a row. Beneficiaries pay the inpatient deductible only once per benefit period, even if they have multiple readmissions during this time. So, for example, if a beneficiary was readmitted to the hospital 59 days after discharge, he or she would not have to pay the inpatient deductible again. In addition, the benefit period would be extended for an additional 60 days. In contrast, beneficiaries who receive observation care are subject to coinsurance at every subsequent visit; therefore, these beneficiaries could accrue high cumulative costs over multiple observation stays.
To our knowledge, there have been no published studies focusing on the potentially vulnerable population of Medicare beneficiaries who frequently use observation care. Our objectives were to determine the financial liability for patients who have multiple observation stays within a 60‐day period, and then compare this to the inpatient deductible they would have paid as inpatients.
METHODS
Data Sources
We used a 20% sample of the Medicare Outpatient Standard Analytic File (SAF) to identify hospital observation stays among beneficiaries over the 3‐year period 2010 to 2012. The Outpatient SAF contains all institutional outpatient claims filed on the UB‐04 form. We also used publicly available data (American Association of Medical Colleges Council of Teaching Hospitals status,[8] US Department of Agriculture rural/urban continuum codes,[9] CMS Hospital Cost Reports,[10] and census bureau region) to link hospital Medicare provider number to hospital characteristics.
Measures
Our primary measure was beneficiary financial responsibility for facilities fees. For observation care patients, this amount is the sum of the Part B coinsurance liability amount, the Part B deductible amount, and the blood deductible liability amount.[11]
Observation care claims also include information on claim date, hospital Medicare provider number, principal diagnosis (International Classification of Diseases, Ninth Revision codes), services provided, and total hours for which observation services were provided (service units). Finally, claims include unique individual identifiers, which allowed us to construct our study population and obtain beneficiary characteristics including beneficiary age, race, gender, dual eligibility for Medicare/Medicaid, and severity of illness as measured by the CMS Hierarchical Condition Category (CMS‐HCC).[12] We obtained publicly available data on hospital characteristics, including academic hospital status,[8] urban versus rural,[9] nonprofit versus for profit,[10] and census bureau region, and linked these to the hospital Medicare provider number.
Study Sample and Statistical Analysis
We first created a denominator file that included all fee‐for‐service Medicare beneficiaries who had Part A and Part B coverage for a full calendar year (or until death) during the study period 2010 to 2012. We included dually eligible individuals, provided they had fee‐for‐service Medicare rather than a Medicare Advantage Plan.
We then constructed our study sample of unique beneficiaries who had an observation stay (lasting 8 hours, which is the criteria for Medicare payment) during the study period. We identified observation stays using revenue center codes and the Healthcare Common Procedure Coding System classification, and according to coding instructions found in the Medicare Claims Processing Manual.[13] Beneficiaries were excluded if their stay was converted from observation to inpatient status, because these claims may not be reliably tracked. After creating this study sample, we calculated the mean financial liability for the first observation stay for each beneficiary.
Next, within our study sample, we divided beneficiaries receiving observation care into 2 groups: those with multiple visits (defined as 2 observation stays in any 60‐day interval over the study period) and those without multiple visits. For each beneficiary with multiple visits, we calculated the mean cumulative financial liability for all stays within the 60‐day interval. We then compared this mean cumulative financial liability to the 2010 inpatient deductible of $1100.
We compared baseline characteristics of Medicare beneficiaries not receiving observation care, those with multiple observation visits, and those without multiple visits. We did this by using 2 tests for categorical variables, 2‐tailed unpaired t tests for 2‐way comparisons of means, and analysis of variance for 3‐way comparisons of means. We compared our primary outcome, mean beneficiary financial liability with the inpatient deductible of $1100 using a 1‐sample z test. As an exploratory analysis, we compared characteristics of beneficiaries with multiple observation visits with high cumulative liability (>$1100) versus low liability using bivariate analyses. We then created a multivariable logistic regression model for high liability. All analyses were performed using SAS version 9.1 (SAS Institute, Inc., Cary, NC). This study was reviewed by the institutional review board of the University of Pennsylvania.
RESULTS
Of the 7,470,676 unique Medicare beneficiaries in the 20% denominator file, 691,760 (9.3%) had at least 1 observation visit during the 3‐year study period (Table 1). The proportion of beneficiaries using observation care rose in each year of the study; 4.1% of beneficiaries used observation care in 2010, 4.4% in 2011, and 5.0% in 2012.
| Medicare FFS Beneficiaries Not Receiving Observation Care | Observation Care (n = 691,760) | P Value | ||
|---|---|---|---|---|
| No Multiple Observation Stays in 60 Days | Multiple (2) Observation Stays in 60 Days | |||
| ||||
| No. | 6,778,916 | 650,375 | 41,385 | N/A |
| Age, y, mean (SD) | 70.5 (12.9) | 72.2 (13.1) | 70.3 (14.9) | <0.01 |
| Gender, no. (%) | <0.01 | |||
| Male | 3,720,428 (54.9) | 387,333 (59.6) | 24,462 (59.1) | |
| Female | 3,058,488 (45.1) | 263,042 (40.4) | 16,923 (40.9) | |
| Race, no. (%) | <0.01 | |||
| White | 5,673,580 (83.7) | 545,165 (83.8) | 33,586 (81.2) | |
| Black | 674,420 (10.0) | 74,367 (11.4) | 5,913 (14.3) | |
| Other | 430,916 (6.4) | 30,843 (4.7) | 1,886 (4.6) | |
| Average no. of chronic conditions, mean (SD) | 1.7 (1.7) | 2.8 (2.0) | 3.6 (2.1) | <0.01 |
| Length of stay, h, mean (SD) | N/A | 29.9 (53.7) | 32.1 (16.9) | <0.01 |
| Most common hospital diagnoses, no. (%)* | N/A | |||
| Other chest pain (786.59) | N/A | 82,550 (12.7) | 9,995 (11.5) | |
| Chest pain, unspecified (786.50) | N/A | 56,416 (8.7) | 7,578 (8.7) | |
| Syncope and collapse (780.2) | N/A | 34,183 (5.3) | 3,291 (3.8) | |
| Coronary atherosclerosis (414.01) | N/A | 16,348 (2.5) | 2,763 (3.1) | |
Of the beneficiaries receiving observation care over the entire study period, 41,385 (6.0%) had multiple visits (2 observation visits in any 60‐day interval). The number of beneficiaries with multiple visits grew by 21.9% from 2010 to 2012. There were racial differences in the use of observation care; patients with multiple visits were more likely to be black than those without multiple visits or those not receiving observation care (14.3% vs 11.4% vs 10.0, P < 0.01). Multiple observation visits were also associated with a higher number of chronic conditions (3.6 vs 2.8 vs 1.7, P < 0.01) (Table 1).
The mean financial liability for the first observation stay for each beneficiary in our study sample was $469.42 (442.43) (Table 2). This is significantly lower than the standard inpatient deductible of $1100 (p<0.01). For 9.2% of beneficiaries, the financial liability was greater than the inpatient deductible.
| Mean (SD) | 25th Percentile | 50th Percentile | 75th Percentile | 90th Percentile | 99th Percentile | |
|---|---|---|---|---|---|---|
| ||||||
| First observation stay, n = 691,760 | $469.43 (442.43) | $216.20 | $333.77 | $529.87 | $1,045.85 | $2,088.66 |
| Cumulative 60 days for beneficiaries with multiple visits, n = 41,385 | $947.40 (803.62) | $471.01 | $681.40 | $1,152.66 | $1,904.54 | $3,902.50 |
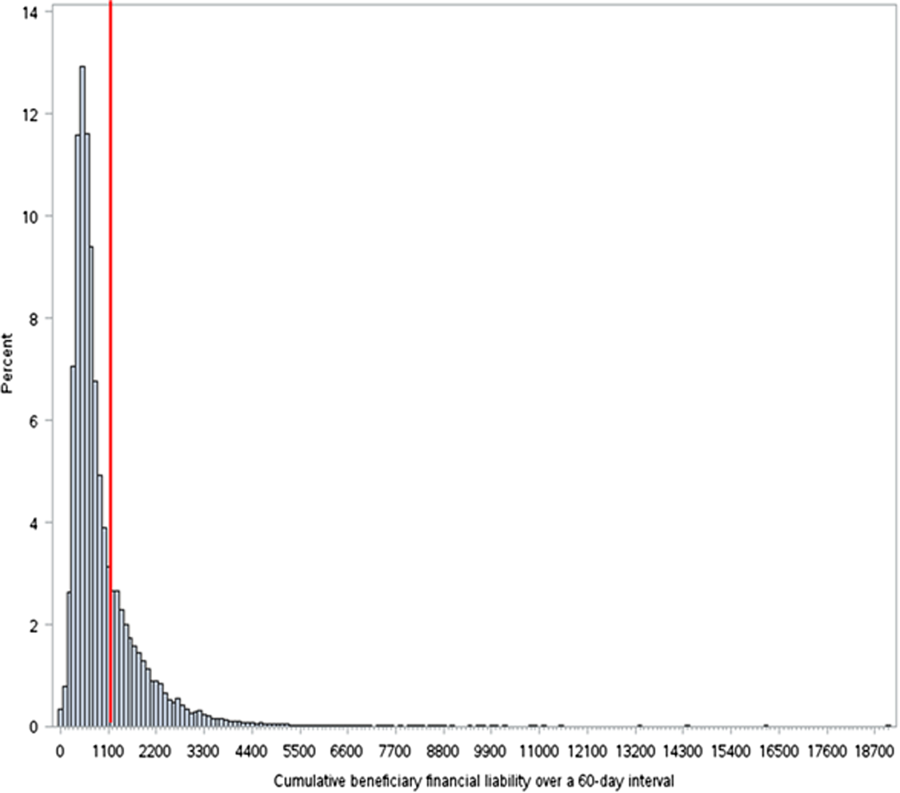
The cumulative mean financial liability for beneficiaries with 2 stays in a 60‐day interval was $947.40 (803.62) (Table 2). This is significantly lower than the standard inpatient deductible of $1100 (P < 0.01). However, for 26.6% of beneficiaries, cumulative financial liability was greater than the $1100 inpatient deductible, which is what they would have paid had these hospital visits been inpatient admissions (Figure 1).
There were several factors associated with having this excess cumulative liability (Table 3). Higher frequency of observation visits within a 60‐day period was associated with high liability (odds ratio [OR]: 2.0, 95% confidence interval [CI]: 1.9‐2.1). In addition, having an index hospitalization in the Northeast region of the country was associated with lower odds of being in the high‐liability group (OR: 0.51, 95% CI: 0.47‐0.55). High liability was weakly associated with lower CMS‐HCC risk scores, nondual eligibility, nonblack race, and index hospital stay at an academic, urban, or nonprofit hospital.
| Unadjusted | Adjusted | |||
|---|---|---|---|---|
| Low, n = 30,416 | High, n = 10,969 | P Value | OR (95% CI) | |
| ||||
| No. of observation visits in a 60‐day period, mean (SD) | 2.08 (0.30) | 2.18 (0.52) | <0.001 | 2.0 (1.92.1) |
| HCC risk score, mean (SD) | 2.40 (2.50) | 2.10 (2.50) | <0.001 | 0.97 (0.960.98) |
| Most common hospital diagnoses, no. (%) | Chest pain (other or unspecified); 13,381 (21.1%) | Chest pain (other or unspecified); 4,165 (17.4%) | N/A | |
| Syncope and collapse; 2,602 (4.1%) | Coronary atherosclerosis; 2,228 (9.3%) | N/A | ||
| Dehydration; 1,264 (2.0%) | Syncope and collapse; 686 (2.9%) | N/A | ||
| Altered mental status; 1,140 (1.8%) | Atrial fibrillation; 390 (1.6%) | N/A | ||
| Obstructive bronchitis with exacerbation; 1,032 (1.6%) | CHF; 350 (1.5%) | N/A | ||
| Dual eligibility, no. (%) | 10,895 (35.8%) | 3,162 (28.8%) | <0.001 | 0.76 (0.730.80) |
| Race, no. (%) | <0.001 | |||
| White | 24,283 (79.8%) | 9,303 (84.8%) | 1 | |
| Black | 4,704 (15.5%) | 1,209 (11.0%) | 0.79 (0.730.85) | |
| Other | 1,429 (4.7%) | 457 (4.2%) | 0.95 (0.851.1) | |
| Hospital census bureau region, no. (%) | <0.001 | |||
| South | 14,076 (46.3%) | 5,059 (46.1%) | 1 | |
| Midwest | 8,431 (27.7%) | 3,365 (30.7%) | 1.08 (1.021.14) | |
| West | 3,426 (11.3%) | 1,709 (15.6%) | 1.34 (1.251.44) | |
| Northeast | 4,483 (14.7%) | 832 (7.6%) | 0.51 (0.470.55) | |
| Academic hospital | 5,038 (16.9%) | 1,362 (12.9%) | <0.001 | 0.90 (0.840.96) |
| Urban hospital | 13,260 (44.4%) | 3,926 (37.1%) | <0.001 | 0.79 (0.760.83) |
| Nonprofit hospital | 20,665 (69.2%) | 7,143 (67.4%) | 0.001 | 0.89 (0.830.94) |
DISCUSSION
Our findings suggest that for 91% of Medicare beneficiaries, a single observation stay was less costly than an inpatient admission. However, when beneficiaries had to return to observation care within 60 days of a prior stay, on average, their cumulative costs went up to $947. For more than a quarter of beneficiaries with multiple observation visits, the cumulative costs of these observation visits exceeded the inpatient deductible.
The results of this study are consistent with prior studies of observation care. We found that in 2010, 4.1% of Medicare beneficiaries used observation care, consistent with the estimated 4.0% in 2009 reported by the AARP Public Policy Institute.[14] Also, consistent with the growth rate from the AARP report, we found growth in use of observation care from 4.1% in 2010 to 5.0% in 2012. We found that the mean length of stay for observation care was 30 hours, consistent with recent studies estimating mean length of stay in 2009 as 25.9 hours.[15] We found that beneficiaries paid an average of $468.50 per observation care stay, very close to the $401 estimated by the 2013 OIG report (when self‐administered drugs were excluded).[2] The difference may be explained by the fact that OIG included observation stays of <8 hours in their sample; we excluded these stays because they did not meet criteria for Medicare payment. Like the OIG report, we also found that the vast majority (91%) of beneficiaries pay less for any given observation stay than for an inpatient stay.
However, our findings raise the concern that for a significant proportion of beneficiaries who are likely to return to the hospital, cumulative costs of multiple observation stays may be greater than the inpatient deductible. Therefore, although observation care is, on average, less expensive for beneficiaries than inpatient admission, beneficiaries lack the protection from escalating financial liability over multiple visits.
This finding is worrisome for 3 reasons. First, compared with the general beneficiary population, Medicare beneficiaries who return to the hospital frequently are also typically of lower socioeconomic status[16, 17, 18] and may be disproportionately affected by any increased financial liability. Interestingly, our analysis showed that patients with high financial liability incurred from multiple observation stays actually had a lower comorbidity burden than patients in the multiple observation stay group with lower liability, and were less likely to be black or dual eligible. This finding perhaps reflects the fact that very high‐risk patients who returned to the hospital were readmitted rather than being placed under observation status again, potentially depleting the high‐liability group of patients with these high‐risk characteristics. Second, patients have little control over their classification as observation versus inpatients. In many hospitals, observation is simply an administrative classification for care thatfrom the patients' perspectiveis identical to inpatient care.[4] It is problematic to expose patients to varying financial liability based on differences in administrative classification. Finally, we found that the number of patients with multiple observation visits within a 60‐day period rose by 22% between 2010 and 2012. This means that the problem of excess cumulative financial liability is likely to be increasingly common over the coming years. The increased incidence of multiple observation visits may be simply related to overall increases in use of observation care. Alternatively, some authors worry that this trend may be driven by hospital use of observation care for patients who are likely to be readmitted.[14, 19] A recent analysis by Gerhardt et al.[20] did not find evidence of direct substitution of observation care in the 30‐day window after an index admission. This suggests that physicians are not explicitly shifting patients to observation care in order to avert a readmission and the readmissions penalty.[21] However, it does not exclude the possibility of general shifts toward observation care for patients likely to return.
Experts have suggested capping the total out‐of‐pocket expense for observation care at the inpatient‐deductible amount.[4] This deductible cap would prevent the relatively rare case in which a single observation stay costs more than an inpatient admission. Our findings suggest that a benefit period (as in Part A) during which such a deductible would serve as a cap would also protect a small but significantly impacted population from higher than expected cumulative costs for multiple observation care visits.
This study has several limitations. First, we are only able to measure beneficiary financial responsibility and not the amount actually paid. This can differ from financial responsibility when patients do not pay their bill, when patients accrue additional charges (such as self‐administered medications) that are not reflected on outpatient claims, or when patients have additional third‐party payers who cover part or all of the financial responsibility (as with dually eligible patients). For such beneficiaries with supplemental coverage, out‐of‐pocket cost in both scenarios (inpatient or observation care) may be low or zero. However, the use of financial responsibility as an approximation of actual payment amounts is recommended by the Research Data Assistance Center and is consistent with other studies of cost in observation care.[2] Second, our data source only allowed us to assess facilities fees and not professional expenses. Our comparator of the inpatient deductible also only reflects facilities fees, making this a valid comparison. Third, we selected 60 days as the time interval for defining multiple visits. This interval is intended to approximate a Medicare benefit period, which is the time interval following a discharge from a hospital or an SNF until the time when the deductible resets. However, Medicare actually extends the benefit period another 60 days if a patient is readmitted during that 60‐day period. Thus, 60 days is actually the shortest possible benefit period. By conservatively defining the interval for recurrent observation stays in this way, we are likely underestimating the number and cost of observation stays in a true benefit period, and biasing our results toward the null.
In conclusion, our findings suggest that a significant proportion of Medicare beneficiaries who revisit observation care pay more than they would have had they been readmitted. As CMS policies on observation care continue to evolve, it may be helpful to consider measures to cap total out‐of‐pocket expenses within a benefit period to protect beneficiaries from higher than expected costs.
Disclosure
Disclosure: Nothing to report.
- June 2012 Data Book: Health Care Spending and the Medicare Program. Washington, DC: Medicare Payment Advisory Commission; 2012.
- . Hospitals' use of observation stays and short inpatient stays for Medicare beneficiaries, OEI‐02‐12‐00040. Washington, DC: Department of Health and Human Services, Office of the Inspector General; 2013.
- , , . National study of emergency department observation services. Acad Emerg Med. 2011;18(9):959–965.
- , . Observation care—high‐value care or a cost‐shifting loophole? N Engl J Med. 2013;369(4):302–305.
- , , , , . Factors associated with prolonged observation services stays and the impact of long stays on patient cost. Health Serv Res. 2014;49(3):893–909.
- Bagnall v Sebelius. No. 3:11cv1703 (MPS). September 23, 2013.
- Centers for Medicare 2 Midnight Benchmark for Inpatient Hospital Admissions. CMS‐1599‐F2013.2013. Available at: http://www.cms.gov/Outreach‐and‐Education/Outreach/OpenDoorForums/Downloads/02042014SODF.pdf. Accessed June 16, 2015
- Council of Teaching Hospitals and Health Systems (COTH). Association of American Medical Colleges website. Available at: https://www.aamc.org/members/coth/. Accessed May 5, 2006.
- United States Department of Agriculture Economic Research Service. Rural‐urban continuity codes. Available at: http://www.ers.usda.gov/data‐products/rural‐urban‐continuum‐codes.aspx. Accessed June 16, 2015.
- Centers for Medicare
When Medicare beneficiaries seek healthcare, they are increasingly likely to have that care delivered under observation status. From 2006 to 2010, the annual number of observation hours for Medicare beneficiaries rose by nearly 70%.[1] In 2012, the number of observation stays for Medicare beneficiaries reached 1.5 million.[2] One consequence of this trend is a potential change in patient financial liabilitythe amount patients are expected to pay out of pocket for care. Although observation care is usually delivered in a hospital, Medicare classifies it as an outpatient service, covered through Part B rather than inpatient Part A. In two‐thirds of US hospitals, observation care is largely an administrative classification, delivered in the same units and beds as admitted patients rather than in a protocol‐driven observation care unit.[3] Therefore, patients are often unaware of their outpatient observation status and its financial implications until they receive their hospital bill.
Observation has the potential to impact patient financial liability through 4 mechanisms.[4] First, instead of a fixed cost for an inpatient admission (eg, a fixed deductible for a hospital admission), patients pay a percentage of the cost of each service provided. Therefore, patients who have long observation stays or receive expensive services could have higher than expected liability. A recent study using all‐payer data demonstrated that patients with longer observation stays (greater than 24 hours) paid 21% more than for those with shorter stays.[5]
A second consideration is that Medicare does not cover the same hospital services for observation care as it does for inpatient care. For example, self‐administered medications are generally not covered for beneficiaries receiving observation care. However, the Office of the Inspector General (OIG)[2] recently found that the average patient cost per observation stay in 2012even including the cost of self‐administered medicationswas $528. This was significantly lower than the inpatient deductible ($1156 in 2012) that patients would have paid had they been admitted. Although on average patients paid less for observation care, the OIG report found that 6% of observation stays were more costly to patients than inpatient admissions.
Third, there are certain benefits that Medicare beneficiaries are not eligible for unless they are admitted to the hospital. For a beneficiary to receive skilled nursing facility (SNF) benefits, they must be admitted to the hospital for 3 or more days. This was the basis for Bagnall v Sebelius, a class action lawsuit against the Centers for Medicare & Medicaid Services (CMS) filed in 2009 by the Center for Medicare Advocacy.[6] The OIG estimated that in 2012, Medicare beneficiaries had 600,000 observation stays longer than 3 days that failed to qualify them for SNF services. Since then, CMS created the 2‐midnight rule,[7] stating that CMS will assign inpatient status to all medically necessary stays of 2 midnights or longer. This rule was intended, in part, to curb the use of observation stays greater than 48 hours and was a key factor in Judge Michael Shea's decision to dismiss Bagnall v Sebelius.[6]
Finally, Medicare beneficiaries who must revisit the hospital may have greater cumulative costs under observation care versus inpatient care. Medicare beneficiaries are partially protected from accumulating high costs over multiple inpatient admissions by a benefit design known as the benefit period. A benefit period begins the day a beneficiary is admitted to a hospital or SNF, and ends when he or she has not received any inpatient hospital or SNF care for 60 days in a row. Beneficiaries pay the inpatient deductible only once per benefit period, even if they have multiple readmissions during this time. So, for example, if a beneficiary was readmitted to the hospital 59 days after discharge, he or she would not have to pay the inpatient deductible again. In addition, the benefit period would be extended for an additional 60 days. In contrast, beneficiaries who receive observation care are subject to coinsurance at every subsequent visit; therefore, these beneficiaries could accrue high cumulative costs over multiple observation stays.
To our knowledge, there have been no published studies focusing on the potentially vulnerable population of Medicare beneficiaries who frequently use observation care. Our objectives were to determine the financial liability for patients who have multiple observation stays within a 60‐day period, and then compare this to the inpatient deductible they would have paid as inpatients.
METHODS
Data Sources
We used a 20% sample of the Medicare Outpatient Standard Analytic File (SAF) to identify hospital observation stays among beneficiaries over the 3‐year period 2010 to 2012. The Outpatient SAF contains all institutional outpatient claims filed on the UB‐04 form. We also used publicly available data (American Association of Medical Colleges Council of Teaching Hospitals status,[8] US Department of Agriculture rural/urban continuum codes,[9] CMS Hospital Cost Reports,[10] and census bureau region) to link hospital Medicare provider number to hospital characteristics.
Measures
Our primary measure was beneficiary financial responsibility for facilities fees. For observation care patients, this amount is the sum of the Part B coinsurance liability amount, the Part B deductible amount, and the blood deductible liability amount.[11]
Observation care claims also include information on claim date, hospital Medicare provider number, principal diagnosis (International Classification of Diseases, Ninth Revision codes), services provided, and total hours for which observation services were provided (service units). Finally, claims include unique individual identifiers, which allowed us to construct our study population and obtain beneficiary characteristics including beneficiary age, race, gender, dual eligibility for Medicare/Medicaid, and severity of illness as measured by the CMS Hierarchical Condition Category (CMS‐HCC).[12] We obtained publicly available data on hospital characteristics, including academic hospital status,[8] urban versus rural,[9] nonprofit versus for profit,[10] and census bureau region, and linked these to the hospital Medicare provider number.
Study Sample and Statistical Analysis
We first created a denominator file that included all fee‐for‐service Medicare beneficiaries who had Part A and Part B coverage for a full calendar year (or until death) during the study period 2010 to 2012. We included dually eligible individuals, provided they had fee‐for‐service Medicare rather than a Medicare Advantage Plan.
We then constructed our study sample of unique beneficiaries who had an observation stay (lasting 8 hours, which is the criteria for Medicare payment) during the study period. We identified observation stays using revenue center codes and the Healthcare Common Procedure Coding System classification, and according to coding instructions found in the Medicare Claims Processing Manual.[13] Beneficiaries were excluded if their stay was converted from observation to inpatient status, because these claims may not be reliably tracked. After creating this study sample, we calculated the mean financial liability for the first observation stay for each beneficiary.
Next, within our study sample, we divided beneficiaries receiving observation care into 2 groups: those with multiple visits (defined as 2 observation stays in any 60‐day interval over the study period) and those without multiple visits. For each beneficiary with multiple visits, we calculated the mean cumulative financial liability for all stays within the 60‐day interval. We then compared this mean cumulative financial liability to the 2010 inpatient deductible of $1100.
We compared baseline characteristics of Medicare beneficiaries not receiving observation care, those with multiple observation visits, and those without multiple visits. We did this by using 2 tests for categorical variables, 2‐tailed unpaired t tests for 2‐way comparisons of means, and analysis of variance for 3‐way comparisons of means. We compared our primary outcome, mean beneficiary financial liability with the inpatient deductible of $1100 using a 1‐sample z test. As an exploratory analysis, we compared characteristics of beneficiaries with multiple observation visits with high cumulative liability (>$1100) versus low liability using bivariate analyses. We then created a multivariable logistic regression model for high liability. All analyses were performed using SAS version 9.1 (SAS Institute, Inc., Cary, NC). This study was reviewed by the institutional review board of the University of Pennsylvania.
RESULTS
Of the 7,470,676 unique Medicare beneficiaries in the 20% denominator file, 691,760 (9.3%) had at least 1 observation visit during the 3‐year study period (Table 1). The proportion of beneficiaries using observation care rose in each year of the study; 4.1% of beneficiaries used observation care in 2010, 4.4% in 2011, and 5.0% in 2012.
| Medicare FFS Beneficiaries Not Receiving Observation Care | Observation Care (n = 691,760) | P Value | ||
|---|---|---|---|---|
| No Multiple Observation Stays in 60 Days | Multiple (2) Observation Stays in 60 Days | |||
| ||||
| No. | 6,778,916 | 650,375 | 41,385 | N/A |
| Age, y, mean (SD) | 70.5 (12.9) | 72.2 (13.1) | 70.3 (14.9) | <0.01 |
| Gender, no. (%) | <0.01 | |||
| Male | 3,720,428 (54.9) | 387,333 (59.6) | 24,462 (59.1) | |
| Female | 3,058,488 (45.1) | 263,042 (40.4) | 16,923 (40.9) | |
| Race, no. (%) | <0.01 | |||
| White | 5,673,580 (83.7) | 545,165 (83.8) | 33,586 (81.2) | |
| Black | 674,420 (10.0) | 74,367 (11.4) | 5,913 (14.3) | |
| Other | 430,916 (6.4) | 30,843 (4.7) | 1,886 (4.6) | |
| Average no. of chronic conditions, mean (SD) | 1.7 (1.7) | 2.8 (2.0) | 3.6 (2.1) | <0.01 |
| Length of stay, h, mean (SD) | N/A | 29.9 (53.7) | 32.1 (16.9) | <0.01 |
| Most common hospital diagnoses, no. (%)* | N/A | |||
| Other chest pain (786.59) | N/A | 82,550 (12.7) | 9,995 (11.5) | |
| Chest pain, unspecified (786.50) | N/A | 56,416 (8.7) | 7,578 (8.7) | |
| Syncope and collapse (780.2) | N/A | 34,183 (5.3) | 3,291 (3.8) | |
| Coronary atherosclerosis (414.01) | N/A | 16,348 (2.5) | 2,763 (3.1) | |
Of the beneficiaries receiving observation care over the entire study period, 41,385 (6.0%) had multiple visits (2 observation visits in any 60‐day interval). The number of beneficiaries with multiple visits grew by 21.9% from 2010 to 2012. There were racial differences in the use of observation care; patients with multiple visits were more likely to be black than those without multiple visits or those not receiving observation care (14.3% vs 11.4% vs 10.0, P < 0.01). Multiple observation visits were also associated with a higher number of chronic conditions (3.6 vs 2.8 vs 1.7, P < 0.01) (Table 1).
The mean financial liability for the first observation stay for each beneficiary in our study sample was $469.42 (442.43) (Table 2). This is significantly lower than the standard inpatient deductible of $1100 (p<0.01). For 9.2% of beneficiaries, the financial liability was greater than the inpatient deductible.
| Mean (SD) | 25th Percentile | 50th Percentile | 75th Percentile | 90th Percentile | 99th Percentile | |
|---|---|---|---|---|---|---|
| ||||||
| First observation stay, n = 691,760 | $469.43 (442.43) | $216.20 | $333.77 | $529.87 | $1,045.85 | $2,088.66 |
| Cumulative 60 days for beneficiaries with multiple visits, n = 41,385 | $947.40 (803.62) | $471.01 | $681.40 | $1,152.66 | $1,904.54 | $3,902.50 |
The cumulative mean financial liability for beneficiaries with 2 stays in a 60‐day interval was $947.40 (803.62) (Table 2). This is significantly lower than the standard inpatient deductible of $1100 (P < 0.01). However, for 26.6% of beneficiaries, cumulative financial liability was greater than the $1100 inpatient deductible, which is what they would have paid had these hospital visits been inpatient admissions (Figure 1).
There were several factors associated with having this excess cumulative liability (Table 3). Higher frequency of observation visits within a 60‐day period was associated with high liability (odds ratio [OR]: 2.0, 95% confidence interval [CI]: 1.9‐2.1). In addition, having an index hospitalization in the Northeast region of the country was associated with lower odds of being in the high‐liability group (OR: 0.51, 95% CI: 0.47‐0.55). High liability was weakly associated with lower CMS‐HCC risk scores, nondual eligibility, nonblack race, and index hospital stay at an academic, urban, or nonprofit hospital.
| Unadjusted | Adjusted | |||
|---|---|---|---|---|
| Low, n = 30,416 | High, n = 10,969 | P Value | OR (95% CI) | |
| ||||
| No. of observation visits in a 60‐day period, mean (SD) | 2.08 (0.30) | 2.18 (0.52) | <0.001 | 2.0 (1.92.1) |
| HCC risk score, mean (SD) | 2.40 (2.50) | 2.10 (2.50) | <0.001 | 0.97 (0.960.98) |
| Most common hospital diagnoses, no. (%) | Chest pain (other or unspecified); 13,381 (21.1%) | Chest pain (other or unspecified); 4,165 (17.4%) | N/A | |
| Syncope and collapse; 2,602 (4.1%) | Coronary atherosclerosis; 2,228 (9.3%) | N/A | ||
| Dehydration; 1,264 (2.0%) | Syncope and collapse; 686 (2.9%) | N/A | ||
| Altered mental status; 1,140 (1.8%) | Atrial fibrillation; 390 (1.6%) | N/A | ||
| Obstructive bronchitis with exacerbation; 1,032 (1.6%) | CHF; 350 (1.5%) | N/A | ||
| Dual eligibility, no. (%) | 10,895 (35.8%) | 3,162 (28.8%) | <0.001 | 0.76 (0.730.80) |
| Race, no. (%) | <0.001 | |||
| White | 24,283 (79.8%) | 9,303 (84.8%) | 1 | |
| Black | 4,704 (15.5%) | 1,209 (11.0%) | 0.79 (0.730.85) | |
| Other | 1,429 (4.7%) | 457 (4.2%) | 0.95 (0.851.1) | |
| Hospital census bureau region, no. (%) | <0.001 | |||
| South | 14,076 (46.3%) | 5,059 (46.1%) | 1 | |
| Midwest | 8,431 (27.7%) | 3,365 (30.7%) | 1.08 (1.021.14) | |
| West | 3,426 (11.3%) | 1,709 (15.6%) | 1.34 (1.251.44) | |
| Northeast | 4,483 (14.7%) | 832 (7.6%) | 0.51 (0.470.55) | |
| Academic hospital | 5,038 (16.9%) | 1,362 (12.9%) | <0.001 | 0.90 (0.840.96) |
| Urban hospital | 13,260 (44.4%) | 3,926 (37.1%) | <0.001 | 0.79 (0.760.83) |
| Nonprofit hospital | 20,665 (69.2%) | 7,143 (67.4%) | 0.001 | 0.89 (0.830.94) |
DISCUSSION
Our findings suggest that for 91% of Medicare beneficiaries, a single observation stay was less costly than an inpatient admission. However, when beneficiaries had to return to observation care within 60 days of a prior stay, on average, their cumulative costs went up to $947. For more than a quarter of beneficiaries with multiple observation visits, the cumulative costs of these observation visits exceeded the inpatient deductible.
The results of this study are consistent with prior studies of observation care. We found that in 2010, 4.1% of Medicare beneficiaries used observation care, consistent with the estimated 4.0% in 2009 reported by the AARP Public Policy Institute.[14] Also, consistent with the growth rate from the AARP report, we found growth in use of observation care from 4.1% in 2010 to 5.0% in 2012. We found that the mean length of stay for observation care was 30 hours, consistent with recent studies estimating mean length of stay in 2009 as 25.9 hours.[15] We found that beneficiaries paid an average of $468.50 per observation care stay, very close to the $401 estimated by the 2013 OIG report (when self‐administered drugs were excluded).[2] The difference may be explained by the fact that OIG included observation stays of <8 hours in their sample; we excluded these stays because they did not meet criteria for Medicare payment. Like the OIG report, we also found that the vast majority (91%) of beneficiaries pay less for any given observation stay than for an inpatient stay.
However, our findings raise the concern that for a significant proportion of beneficiaries who are likely to return to the hospital, cumulative costs of multiple observation stays may be greater than the inpatient deductible. Therefore, although observation care is, on average, less expensive for beneficiaries than inpatient admission, beneficiaries lack the protection from escalating financial liability over multiple visits.
This finding is worrisome for 3 reasons. First, compared with the general beneficiary population, Medicare beneficiaries who return to the hospital frequently are also typically of lower socioeconomic status[16, 17, 18] and may be disproportionately affected by any increased financial liability. Interestingly, our analysis showed that patients with high financial liability incurred from multiple observation stays actually had a lower comorbidity burden than patients in the multiple observation stay group with lower liability, and were less likely to be black or dual eligible. This finding perhaps reflects the fact that very high‐risk patients who returned to the hospital were readmitted rather than being placed under observation status again, potentially depleting the high‐liability group of patients with these high‐risk characteristics. Second, patients have little control over their classification as observation versus inpatients. In many hospitals, observation is simply an administrative classification for care thatfrom the patients' perspectiveis identical to inpatient care.[4] It is problematic to expose patients to varying financial liability based on differences in administrative classification. Finally, we found that the number of patients with multiple observation visits within a 60‐day period rose by 22% between 2010 and 2012. This means that the problem of excess cumulative financial liability is likely to be increasingly common over the coming years. The increased incidence of multiple observation visits may be simply related to overall increases in use of observation care. Alternatively, some authors worry that this trend may be driven by hospital use of observation care for patients who are likely to be readmitted.[14, 19] A recent analysis by Gerhardt et al.[20] did not find evidence of direct substitution of observation care in the 30‐day window after an index admission. This suggests that physicians are not explicitly shifting patients to observation care in order to avert a readmission and the readmissions penalty.[21] However, it does not exclude the possibility of general shifts toward observation care for patients likely to return.
Experts have suggested capping the total out‐of‐pocket expense for observation care at the inpatient‐deductible amount.[4] This deductible cap would prevent the relatively rare case in which a single observation stay costs more than an inpatient admission. Our findings suggest that a benefit period (as in Part A) during which such a deductible would serve as a cap would also protect a small but significantly impacted population from higher than expected cumulative costs for multiple observation care visits.
This study has several limitations. First, we are only able to measure beneficiary financial responsibility and not the amount actually paid. This can differ from financial responsibility when patients do not pay their bill, when patients accrue additional charges (such as self‐administered medications) that are not reflected on outpatient claims, or when patients have additional third‐party payers who cover part or all of the financial responsibility (as with dually eligible patients). For such beneficiaries with supplemental coverage, out‐of‐pocket cost in both scenarios (inpatient or observation care) may be low or zero. However, the use of financial responsibility as an approximation of actual payment amounts is recommended by the Research Data Assistance Center and is consistent with other studies of cost in observation care.[2] Second, our data source only allowed us to assess facilities fees and not professional expenses. Our comparator of the inpatient deductible also only reflects facilities fees, making this a valid comparison. Third, we selected 60 days as the time interval for defining multiple visits. This interval is intended to approximate a Medicare benefit period, which is the time interval following a discharge from a hospital or an SNF until the time when the deductible resets. However, Medicare actually extends the benefit period another 60 days if a patient is readmitted during that 60‐day period. Thus, 60 days is actually the shortest possible benefit period. By conservatively defining the interval for recurrent observation stays in this way, we are likely underestimating the number and cost of observation stays in a true benefit period, and biasing our results toward the null.
In conclusion, our findings suggest that a significant proportion of Medicare beneficiaries who revisit observation care pay more than they would have had they been readmitted. As CMS policies on observation care continue to evolve, it may be helpful to consider measures to cap total out‐of‐pocket expenses within a benefit period to protect beneficiaries from higher than expected costs.
Disclosure
Disclosure: Nothing to report.
- June 2012 Data Book: Health Care Spending and the Medicare Program. Washington, DC: Medicare Payment Advisory Commission; 2012.
- . Hospitals' use of observation stays and short inpatient stays for Medicare beneficiaries, OEI‐02‐12‐00040. Washington, DC: Department of Health and Human Services, Office of the Inspector General; 2013.
- , , . National study of emergency department observation services. Acad Emerg Med. 2011;18(9):959–965.
- , . Observation care—high‐value care or a cost‐shifting loophole? N Engl J Med. 2013;369(4):302–305.
- , , , , . Factors associated with prolonged observation services stays and the impact of long stays on patient cost. Health Serv Res. 2014;49(3):893–909.
- Bagnall v Sebelius. No. 3:11cv1703 (MPS). September 23, 2013.
- Centers for Medicare 2 Midnight Benchmark for Inpatient Hospital Admissions. CMS‐1599‐F2013.2013. Available at: http://www.cms.gov/Outreach‐and‐Education/Outreach/OpenDoorForums/Downloads/02042014SODF.pdf. Accessed June 16, 2015
- Council of Teaching Hospitals and Health Systems (COTH). Association of American Medical Colleges website. Available at: https://www.aamc.org/members/coth/. Accessed May 5, 2006.
- United States Department of Agriculture Economic Research Service. Rural‐urban continuity codes. Available at: http://www.ers.usda.gov/data‐products/rural‐urban‐continuum‐codes.aspx. Accessed June 16, 2015.
- Centers for Medicare
© 2015 Society of Hospital Medicine

Perceptions of Readmitted Patients
Over 14% of all patients hospitalized in the United States are readmitted within 30 days of discharge.1 Numerous studies have used administrative data in order to identify clinical and operational predictors of readmission. However, few studies have explored patients' perspectives on readmission.27 As a result, we know little about potentially modifiable challenges which patients face during the transition from hospital to home. Lack of understanding of the patient perspective has hampered the ability of hospitals to create interventions which address these underlying causes of readmissions.
Patients with low socioeconomic status (SES) are up to 43% more likely to require readmission than their higher‐SES counterparts,8, 9 and qualitative data has described unique challenges faced by low‐SES patients during transition.2 Our objectives were to understand the transition experiences of readmitted patients and to compare these experiences across SES and diagnostic categories.
METHODS
Development of a Survey Instrument
A collaborative team of physicians, nurses, and social workers used a previously defined conceptual framework,10 literature search, and expert interviews to construct a 36‐item survey that addressed the following domains: preparedness for prior discharge; delays in care‐seeking; medication adherence; follow‐up with a primary care provider (PCP); and overarching challenges faced during transition which contributed to readmission. Each question had multiple answer choices including Other which allowed patients to provide open‐ended answers; patients could select all answer choices that applied. Prior to administration, the survey was pretested with 15 random patients and revised to improve reliability and comprehensibility. (See Supporting Information, Survey Script Versions 1.0 and 2.0, in the online version of this article.)
Sampling Strategy and Patient Enrollment
Patients were eligible to participate if they: 1) had capacity to complete an interview; and 2) were readmitted within 30 days of a prior discharge from the Hospital of the University of Pennsylvania (HUP), a 695‐bed academic medical center, or Penn Presbyterian Medical Center (PPMC), a 317‐bed affiliated community hospital. Both hospitals are located in Philadelphia and serve a population which is 45.4% privately insured, 33.5% insured by Medicare, and 21.2% uninsured or insured by Medicaid. We excluded readmissions that were planned or from another facility because these were less sensitive to patient domains such as adherence, access, and social support.
Eligible participants were identified by survey administrators (bedside nurses, social workers, or clinical resource managers) on the day of hospital readmission. Because data were being used immediately for quality improvement, the Institutional Review Board (IRB) waived the need for consent. Administrators typically took 10 minutes to conduct the survey in‐person and record responses directly into patients' electronic medical record (EMR). Inpatient care teams could view responses in real time and work to resolve identified challenges prior to patients' discharge.
Between November 10, 2010 and July 5, 2011, 3881 patients were readmitted to study hospitals. Five hundred eighty‐four readmissions were ineligible for the study because they lacked capacity, were planned readmissions, or were readmitted from another facility. This left 3297 eligible individuals. We surveyed 1084 individuals yielding a response rate of 32.9%11; the remainder either refused the survey, or were not approached for the survey due to time restraints of administrators. Characteristics of responders and nonresponders are displayed in Table 1, and were similar in all measured categories with the exception of age (58.0 vs 55.7, P < 0.01) and the number of 60‐day readmissions (2.0 vs 1.3, P < 0.01).
| Characteristics of Patients | Survey Sample (n = 1084) | Not in Survey Sample (n = 2797) | P Value* |
|---|---|---|---|
| |||
| Age mean (SD) | 55.7 (16.6) | 58.0 (18.2) | <0.01 |
| Gender, n (%) | 0.88 | ||
| Male | 546 (50.4%) | 1428 (51.1%) | |
| Race, n (%) | 0.96 | ||
| Black | 502 (46.4%) | 1146 (41.3%) | |
| White | 504 (46.6%) | 1362 (49.1%) | |
| Principal discharge diagnosis, n (%) | 0.98 | ||
| Medical | |||
| Acute on chronic systolic heart failure | 44 (4.6%) | 23 (1.3%) | |
| Acute renal failure | 24 (2.5%) | 29 (1.7%) | |
| Surgical | |||
| Postoperative infection | 48 (14.8%) | 53 (5.2%) | |
| Digestive system problems | 17 (5.2%) | 23 (2.2%) | |
| APR‐DRG score, n (%) | 0.13 | ||
| 0 (Not assigned) | 9 (0.7%) | 28 (1.0%) | |
| 1 (Minor) | 113 (10.1%) | 628 (22.7%) | |
| 2 (Moderate) | 338 (31.4%) | 881 (31.8%) | |
| 3 (Major) | 470 (43.7%) | 883 (31.9%) | |
| 4 (Extreme) | 154 (14.3%) | 369 (13.3%) | |
| Length of stay mean (SD) | 6.2 (6.9) | 6.5 (10.1) | 0.33 |
| Insurance payer, n (%) | 0.77 | ||
| Uninsured/Medicaid | 234 (21.6%) | 489 (17.5%) | |
| Medicaid + Medicare | 85 (7.84%) | 172 (6.2%) | |
| Medicare | 345 (31.8%) | 878 (31.5%) | |
| Private | 420 (38.8%) | 1253 (44.9%) | |
| No. of 60‐d readmissions mean (SD) | 1.3 (0.02) | 2.0 (0.02) | <0.01 |
Statistical Analysis
Survey responses were extracted from the EMR and linked with patient clinical and demographic data. Variables pertaining to hospitalization, such as admitting service and principal diagnosis, were associated with patients' index hospitalization rather than the readmission. A trained research assistant extracted open‐ended free‐text answers to any survey questions marked, Other and coded them using a grounded theory approach.12
In our primary analysis, we described challenges reported by readmitted patients. In a secondary analysis, we tested for differences in transition challenges by SES using lack of insurance or Medicaid as a proxy for low SES. Using insurance status as a marker for material aspects of SES is well‐described in health services research.1316 In addition, income data from our institution demonstrated that 86.5% of uninsured and Medicaid patients have a median household income below $15,000. We tested for differences by diagnostic category using the index admitting service (medical vs surgical) as a proxy for diagnostic category (Table 2).
| Low vs High SES (ref) OR (95% CI) | Medical vs Surgical (ref) OR (95% CI) | |
|---|---|---|
| ||
| Unprepared for DC | 1.3 (0.9, 1.9) | 1.0 (0.7, 1.6) |
| Understanding DC instructions | 2.7 (1.1, 6.6) | 1.7 (0.5, 5.8) |
| Executing DC instructions | 2.2 (1.1, 4.4) | 1.6 (0.6, 3.7) |
| Activities of daily living | 1.0 (0.6, 1.5) | 1.1 (0.7, 1.7) |
| Medication access | 1.6 (0.9, 2.8) | 2.3 (1.0, 4.9) |
| Medication adherence | 1.8 (1.2, 3.0) | 2.6 (1.2, 5.4) |
| Lack of social support | 2.0 (1.2, 3.6) | 2.3 (1.0, 5.2) |
| Lack of food, transportation, telephone | 2.6 (1.1, 6.1) | 7.1 (0.9, 53.2) |
| Substance abuse | 6.7 (2.3, 19.2) | 1.5 (0.4, 5.2) |
We compared continuous variables using the two‐sample t test and categorical variables using Pearson's chi‐square test. The Cuzick nonparametric test was used to test for trends across ordered groups. We used multivariable logistic regression models to estimate the association between each binary transition challenge outcome and predictors: SES and diagnostic group. These models were adjusted for potential confounders: age, gender, length of stay, and severity of illness, as determined by All Patient Refined‐Diagnosis Related Groups (APR‐DRGs). We did not adjust for race because it was strongly correlated with SES in our dataset (P < 0.0001). Confounders were included in final models if their association with outcomes had a P value less than 0.10. Analyses were performed using the STATA software package, version 11.0 (StataCorp LP, College Station, TX). The survey was approved by the University of Pennsylvania IRB.
RESULTS
Patient Characteristics
We surveyed 1084 unique individuals; 50.4% of participants were male, 46.4% were black. The most common index principal diagnosis in the medical group was systolic heart failure (4.6%), while the most common index principal diagnosis in the surgical group was postoperative infection (14.8%) (Table 1).
Discharge Preparedness, Medication Adherence, and PCP Follow‐up
At the time of prior discharge, 86.4% of respondents felt that they had been prepared for self‐care. 80.3% reported being able to take all discharge medications as prescribed. The most common reasons for not being able to take medications included: 1) side effects or worry about side effects (13.1%); 2) trouble paying for medications (10.7%); and 3) lack of transportation to the pharmacy (8.4%). Since their prior discharge, 52.9% of participants reported that they had visited a PCP; 28.7% of participants report being referred by their PCP to the emergency room for readmission.
Transition Challenges in Overall Survey Sample
During the transition from hospital to home, 45.5% of readmitted patients reported experiencing challenges which contributed to readmission. The most commonly reported issues contributing to readmission were: 1) feeling unprepared for discharge (11.8%); 2) difficulty performing activities of daily living (ADLs) (10.6%); 3) trouble adhering to discharge medications (5.7%); 4) difficulty accessing discharge medications (5.0%); and 5) lack of social support (4.7%).
Transition Challenges by Subgroup
Low‐SES patients were more likely than high‐SES patients to report difficulty understanding (odds ratio [OR] 2.7; 95% confidence interval [CI] 1.1, 6.6) and executing (OR 2.2; 95% CI 1.1, 4.4) discharge instructions, difficulty adhering to medications (OR 1.8; 95% CI 1.2, 3.0), lack of social support (OR 2.0; 95% CI 1.2, 3.6), lack of basic resources (OR 2.6; 95% CI 1.1, 6.1), and substance abuse (OR 6.7; 95% CI 2.3, 19.2) as perceived reasons for readmission. Of the patients who described Other issues contributing to readmission, low‐SES patients most commonly described stress or depression (49.0%), while high‐SES patients most commonly reported a recurrence of symptoms (74.8%). Medical and surgical patients had similar odds of facing each transition challenge with one exception: medical patients were more likely to report difficulty adhering to medications (OR 2.6; 95% CI 1.2, 5.4).
DISCUSSION
Several findings from this study are of interest to practicing hospitalists or hospital administrators. First, of the issues to which patients most commonly attributed readmission, lack of discharge preparedness is the only one which occurs during index hospitalization; in order to address most transition challenges, hospitals must think beyond their walls. By penalizing hospitals for excess rates of readmission, The Hospital Readmission Reduction Program (HRRP) will effectively hold hospitals accountable for addressing issues which occur in patients' homes and communities.17 Hospitals that have robust partnerships with community pharmacies, social service agencies, and PCPs may have the most influence on these issues and the most success in reducing readmissions. Second, consistent with other literature describing increased rates of readmission with enhanced PCP follow‐up,18 our findings demonstrate that PCPs often refer their patients to the emergency room for readmission. This suggests that PCP follow‐up, while perhaps essential for patient care, may not necessarily reduce readmissions and may actually facilitate readmission. Third, this study describes underlying reasons for patient nonadherence with discharge medications: side effects, cost, and transportation. Targeted interventions to improve adherence may include floor‐based pharmacists who counsel on side effects, determine co‐pays prior to discharge, and encourage patients to fill prescriptions from the hospital pharmacy to avoid transportation barriers.
Finally, and perhaps most importantly, these data suggest that one transition experience does not fit all. Patients with low SES appear to have a distinct and challenging transition experience. Currently, there is an emphasis on tailoring transition interventions to specific disease populations, such as patients with congestive heart failure. Our study suggests that it may be more effective to tailor interventions for low‐SES patients across diagnostic category, helping these patients gain access to outpatient medical resources and address competing issues, such as food insecurity or substance abuse.
Our study has several limitations. First, the low survey response rate makes it susceptible to nonresponse bias. Second, survey administration by a member of the care team may have increased social desirability bias. Third, because it was important to the study team to incorporate our survey into hospital workflow, survey responses were recorded directly into the EMR which limited administrators to recording a yes response for each answer choice which the participant endorsed. Therefore, in our dataset, we are unable to distinguish a definite no from a missing response; however, the survey was short, making it unlikely that questions were skipped. Fourth, closed‐ended questions may have failed to capture the range of participant responses, although the inclusion of an open‐ended answer choice ameliorates this issue. Finally, we are unable to draw conclusions regarding association of survey responses with the risk of readmission, because this study was administered only to readmitted patients.
CONCLUSIONS
This report of patients' perspectives challenges many commonly held assumptions regarding readmission. Readmission reflects not only the quality of hospital care, but a variety of factors in patients' homes and communities. PCP follow‐up, while perhaps critical for patient care, may not be a panacea for reducing hospital readmissions. Targeted medication counseling focused on side effects, co‐pay, and medication delivery may address patients' underlying reasons for nonadherence. And most importantly, one transition experience does not fit all. Hospitalists and administrators must tailor interventions to address challenges reported by their patients, particularly those of low SES.
Acknowledgements
The authors are grateful to the Society of General Internal Medicine (SGIM) for selecting our abstract Perceptions of Readmitted Patients on the Transition From Hospital to Home as a Lipkin Award Finalist during the 2012 SGIM National Meeting.
Disclosures: Support for this study was provided by a grant from the Leonard Davis Institute of Health Economics. Dr Grande has received honoraria from the Johns Hopkins University CME Program; has a consultancy with the National Nursing Centers Consortium; and has received grant support from, or has grants pending with, the HealthWell Foundation, the National Human Genome Research Institute, and the Agency for Healthcare Research and Quality. Dr Shannon is the founder of a biotech company, Ventrigen, LLC; is a senior fellow at IHI; is on the scientific advisory boards for Glasgow Smith Klein, Pfizer, Merck, and Value Capture; and is a member of the Board of Directors of the ABIM.
- ,,,.All‐Cause Readmissions by Payer and Age, 2008: Statistical Brief #115. Healthcare Cost and Utilization Project (HCUP) Statistical Briefs.Rockville, MD:Agency for Health Care Policy and Research; February 2006–June2011.
- ,,.Understanding rehospitalization risk: can hospital discharge be modified to reduce recurrent hospitalization?J Hosp Med.2007;2(5):297–304.
- ,,.Patients' and caregivers' transition from hospital to home: needs and recommendations.Home Health Care Serv Q.1999;17(3):27–48.
- ,,.Reasons for readmission in heart failure: perspectives of patients, caregivers, cardiologists, and heart failure nurses.Heart Lung.2009;38(5):427–434.
- ,.Psychiatric rehospitalization of the severely mentally ill: patient and staff perspectives.Nurs Res.1992;41(5):301–305.
- ,,,,,.Continuity of care and monitoring pain after discharge: patient perspective.J Adv Nurs.2010;66(1):40–48.
- ,,,.Going home from hospital: the carer/patient dyad.J Adv Nurs.2001;35(2):206–217.
- ,,.The impact of patient socioeconomic status and other social factors on readmission. A prospective study in 4 Massachusetts hospitals.Inquiry.1994;31(2):163–172.
- ,,,.Redefining readmission risk factors for general medicine patients.J Hosp Med.2011;6(2):54–60.
- ,.Hospital readmissions—not just a measure of quality.JAMA.2011;306(16):1796–1797.
- American Association for Public Opinion Research (AAPOR).Standard Definitions: Final Dispositions of Case Codes and Outcome Rates for Surveys.7th ed.Deerfield, IL:AAPOR;2011.
- ,.The Discovery of Grounded Theory: Strategies for Qualitative Research.New York:Aldine;1967.
- ,,,.The relation between health insurance coverage and clinical outcomes among women with breast cancer.N Engl J Med.1993;329(5):326–331.
- ,,,,,.Neighborhood socioeconomic status, Medicaid coverage and medical management of myocardial infarction: atherosclerosis risk in communities (ARIC) community surveillance.BMC Public Health.2010;10:632.
- ,,,,.Effects of practice setting on quality of lipid‐lowering management in patients with coronary artery disease.Am J Cardiol.1998;81(12):1416–1420.
- .Income Data by Insurance Category.2012.
- ,.Hospital readmissions and the Affordable Care Act: paying for coordinated quality care.JAMA.2011;306(16):1794–1795.
- ,,.Does increased access to primary care reduce hospital readmissions?N Engl J Med.1996;334(22):1441–1447.
Over 14% of all patients hospitalized in the United States are readmitted within 30 days of discharge.1 Numerous studies have used administrative data in order to identify clinical and operational predictors of readmission. However, few studies have explored patients' perspectives on readmission.27 As a result, we know little about potentially modifiable challenges which patients face during the transition from hospital to home. Lack of understanding of the patient perspective has hampered the ability of hospitals to create interventions which address these underlying causes of readmissions.
Patients with low socioeconomic status (SES) are up to 43% more likely to require readmission than their higher‐SES counterparts,8, 9 and qualitative data has described unique challenges faced by low‐SES patients during transition.2 Our objectives were to understand the transition experiences of readmitted patients and to compare these experiences across SES and diagnostic categories.
METHODS
Development of a Survey Instrument
A collaborative team of physicians, nurses, and social workers used a previously defined conceptual framework,10 literature search, and expert interviews to construct a 36‐item survey that addressed the following domains: preparedness for prior discharge; delays in care‐seeking; medication adherence; follow‐up with a primary care provider (PCP); and overarching challenges faced during transition which contributed to readmission. Each question had multiple answer choices including Other which allowed patients to provide open‐ended answers; patients could select all answer choices that applied. Prior to administration, the survey was pretested with 15 random patients and revised to improve reliability and comprehensibility. (See Supporting Information, Survey Script Versions 1.0 and 2.0, in the online version of this article.)
Sampling Strategy and Patient Enrollment
Patients were eligible to participate if they: 1) had capacity to complete an interview; and 2) were readmitted within 30 days of a prior discharge from the Hospital of the University of Pennsylvania (HUP), a 695‐bed academic medical center, or Penn Presbyterian Medical Center (PPMC), a 317‐bed affiliated community hospital. Both hospitals are located in Philadelphia and serve a population which is 45.4% privately insured, 33.5% insured by Medicare, and 21.2% uninsured or insured by Medicaid. We excluded readmissions that were planned or from another facility because these were less sensitive to patient domains such as adherence, access, and social support.
Eligible participants were identified by survey administrators (bedside nurses, social workers, or clinical resource managers) on the day of hospital readmission. Because data were being used immediately for quality improvement, the Institutional Review Board (IRB) waived the need for consent. Administrators typically took 10 minutes to conduct the survey in‐person and record responses directly into patients' electronic medical record (EMR). Inpatient care teams could view responses in real time and work to resolve identified challenges prior to patients' discharge.
Between November 10, 2010 and July 5, 2011, 3881 patients were readmitted to study hospitals. Five hundred eighty‐four readmissions were ineligible for the study because they lacked capacity, were planned readmissions, or were readmitted from another facility. This left 3297 eligible individuals. We surveyed 1084 individuals yielding a response rate of 32.9%11; the remainder either refused the survey, or were not approached for the survey due to time restraints of administrators. Characteristics of responders and nonresponders are displayed in Table 1, and were similar in all measured categories with the exception of age (58.0 vs 55.7, P < 0.01) and the number of 60‐day readmissions (2.0 vs 1.3, P < 0.01).
| Characteristics of Patients | Survey Sample (n = 1084) | Not in Survey Sample (n = 2797) | P Value* |
|---|---|---|---|
| |||
| Age mean (SD) | 55.7 (16.6) | 58.0 (18.2) | <0.01 |
| Gender, n (%) | 0.88 | ||
| Male | 546 (50.4%) | 1428 (51.1%) | |
| Race, n (%) | 0.96 | ||
| Black | 502 (46.4%) | 1146 (41.3%) | |
| White | 504 (46.6%) | 1362 (49.1%) | |
| Principal discharge diagnosis, n (%) | 0.98 | ||
| Medical | |||
| Acute on chronic systolic heart failure | 44 (4.6%) | 23 (1.3%) | |
| Acute renal failure | 24 (2.5%) | 29 (1.7%) | |
| Surgical | |||
| Postoperative infection | 48 (14.8%) | 53 (5.2%) | |
| Digestive system problems | 17 (5.2%) | 23 (2.2%) | |
| APR‐DRG score, n (%) | 0.13 | ||
| 0 (Not assigned) | 9 (0.7%) | 28 (1.0%) | |
| 1 (Minor) | 113 (10.1%) | 628 (22.7%) | |
| 2 (Moderate) | 338 (31.4%) | 881 (31.8%) | |
| 3 (Major) | 470 (43.7%) | 883 (31.9%) | |
| 4 (Extreme) | 154 (14.3%) | 369 (13.3%) | |
| Length of stay mean (SD) | 6.2 (6.9) | 6.5 (10.1) | 0.33 |
| Insurance payer, n (%) | 0.77 | ||
| Uninsured/Medicaid | 234 (21.6%) | 489 (17.5%) | |
| Medicaid + Medicare | 85 (7.84%) | 172 (6.2%) | |
| Medicare | 345 (31.8%) | 878 (31.5%) | |
| Private | 420 (38.8%) | 1253 (44.9%) | |
| No. of 60‐d readmissions mean (SD) | 1.3 (0.02) | 2.0 (0.02) | <0.01 |
Statistical Analysis
Survey responses were extracted from the EMR and linked with patient clinical and demographic data. Variables pertaining to hospitalization, such as admitting service and principal diagnosis, were associated with patients' index hospitalization rather than the readmission. A trained research assistant extracted open‐ended free‐text answers to any survey questions marked, Other and coded them using a grounded theory approach.12
In our primary analysis, we described challenges reported by readmitted patients. In a secondary analysis, we tested for differences in transition challenges by SES using lack of insurance or Medicaid as a proxy for low SES. Using insurance status as a marker for material aspects of SES is well‐described in health services research.1316 In addition, income data from our institution demonstrated that 86.5% of uninsured and Medicaid patients have a median household income below $15,000. We tested for differences by diagnostic category using the index admitting service (medical vs surgical) as a proxy for diagnostic category (Table 2).
| Low vs High SES (ref) OR (95% CI) | Medical vs Surgical (ref) OR (95% CI) | |
|---|---|---|
| ||
| Unprepared for DC | 1.3 (0.9, 1.9) | 1.0 (0.7, 1.6) |
| Understanding DC instructions | 2.7 (1.1, 6.6) | 1.7 (0.5, 5.8) |
| Executing DC instructions | 2.2 (1.1, 4.4) | 1.6 (0.6, 3.7) |
| Activities of daily living | 1.0 (0.6, 1.5) | 1.1 (0.7, 1.7) |
| Medication access | 1.6 (0.9, 2.8) | 2.3 (1.0, 4.9) |
| Medication adherence | 1.8 (1.2, 3.0) | 2.6 (1.2, 5.4) |
| Lack of social support | 2.0 (1.2, 3.6) | 2.3 (1.0, 5.2) |
| Lack of food, transportation, telephone | 2.6 (1.1, 6.1) | 7.1 (0.9, 53.2) |
| Substance abuse | 6.7 (2.3, 19.2) | 1.5 (0.4, 5.2) |
We compared continuous variables using the two‐sample t test and categorical variables using Pearson's chi‐square test. The Cuzick nonparametric test was used to test for trends across ordered groups. We used multivariable logistic regression models to estimate the association between each binary transition challenge outcome and predictors: SES and diagnostic group. These models were adjusted for potential confounders: age, gender, length of stay, and severity of illness, as determined by All Patient Refined‐Diagnosis Related Groups (APR‐DRGs). We did not adjust for race because it was strongly correlated with SES in our dataset (P < 0.0001). Confounders were included in final models if their association with outcomes had a P value less than 0.10. Analyses were performed using the STATA software package, version 11.0 (StataCorp LP, College Station, TX). The survey was approved by the University of Pennsylvania IRB.
RESULTS
Patient Characteristics
We surveyed 1084 unique individuals; 50.4% of participants were male, 46.4% were black. The most common index principal diagnosis in the medical group was systolic heart failure (4.6%), while the most common index principal diagnosis in the surgical group was postoperative infection (14.8%) (Table 1).
Discharge Preparedness, Medication Adherence, and PCP Follow‐up
At the time of prior discharge, 86.4% of respondents felt that they had been prepared for self‐care. 80.3% reported being able to take all discharge medications as prescribed. The most common reasons for not being able to take medications included: 1) side effects or worry about side effects (13.1%); 2) trouble paying for medications (10.7%); and 3) lack of transportation to the pharmacy (8.4%). Since their prior discharge, 52.9% of participants reported that they had visited a PCP; 28.7% of participants report being referred by their PCP to the emergency room for readmission.
Transition Challenges in Overall Survey Sample
During the transition from hospital to home, 45.5% of readmitted patients reported experiencing challenges which contributed to readmission. The most commonly reported issues contributing to readmission were: 1) feeling unprepared for discharge (11.8%); 2) difficulty performing activities of daily living (ADLs) (10.6%); 3) trouble adhering to discharge medications (5.7%); 4) difficulty accessing discharge medications (5.0%); and 5) lack of social support (4.7%).
Transition Challenges by Subgroup
Low‐SES patients were more likely than high‐SES patients to report difficulty understanding (odds ratio [OR] 2.7; 95% confidence interval [CI] 1.1, 6.6) and executing (OR 2.2; 95% CI 1.1, 4.4) discharge instructions, difficulty adhering to medications (OR 1.8; 95% CI 1.2, 3.0), lack of social support (OR 2.0; 95% CI 1.2, 3.6), lack of basic resources (OR 2.6; 95% CI 1.1, 6.1), and substance abuse (OR 6.7; 95% CI 2.3, 19.2) as perceived reasons for readmission. Of the patients who described Other issues contributing to readmission, low‐SES patients most commonly described stress or depression (49.0%), while high‐SES patients most commonly reported a recurrence of symptoms (74.8%). Medical and surgical patients had similar odds of facing each transition challenge with one exception: medical patients were more likely to report difficulty adhering to medications (OR 2.6; 95% CI 1.2, 5.4).
DISCUSSION
Several findings from this study are of interest to practicing hospitalists or hospital administrators. First, of the issues to which patients most commonly attributed readmission, lack of discharge preparedness is the only one which occurs during index hospitalization; in order to address most transition challenges, hospitals must think beyond their walls. By penalizing hospitals for excess rates of readmission, The Hospital Readmission Reduction Program (HRRP) will effectively hold hospitals accountable for addressing issues which occur in patients' homes and communities.17 Hospitals that have robust partnerships with community pharmacies, social service agencies, and PCPs may have the most influence on these issues and the most success in reducing readmissions. Second, consistent with other literature describing increased rates of readmission with enhanced PCP follow‐up,18 our findings demonstrate that PCPs often refer their patients to the emergency room for readmission. This suggests that PCP follow‐up, while perhaps essential for patient care, may not necessarily reduce readmissions and may actually facilitate readmission. Third, this study describes underlying reasons for patient nonadherence with discharge medications: side effects, cost, and transportation. Targeted interventions to improve adherence may include floor‐based pharmacists who counsel on side effects, determine co‐pays prior to discharge, and encourage patients to fill prescriptions from the hospital pharmacy to avoid transportation barriers.
Finally, and perhaps most importantly, these data suggest that one transition experience does not fit all. Patients with low SES appear to have a distinct and challenging transition experience. Currently, there is an emphasis on tailoring transition interventions to specific disease populations, such as patients with congestive heart failure. Our study suggests that it may be more effective to tailor interventions for low‐SES patients across diagnostic category, helping these patients gain access to outpatient medical resources and address competing issues, such as food insecurity or substance abuse.
Our study has several limitations. First, the low survey response rate makes it susceptible to nonresponse bias. Second, survey administration by a member of the care team may have increased social desirability bias. Third, because it was important to the study team to incorporate our survey into hospital workflow, survey responses were recorded directly into the EMR which limited administrators to recording a yes response for each answer choice which the participant endorsed. Therefore, in our dataset, we are unable to distinguish a definite no from a missing response; however, the survey was short, making it unlikely that questions were skipped. Fourth, closed‐ended questions may have failed to capture the range of participant responses, although the inclusion of an open‐ended answer choice ameliorates this issue. Finally, we are unable to draw conclusions regarding association of survey responses with the risk of readmission, because this study was administered only to readmitted patients.
CONCLUSIONS
This report of patients' perspectives challenges many commonly held assumptions regarding readmission. Readmission reflects not only the quality of hospital care, but a variety of factors in patients' homes and communities. PCP follow‐up, while perhaps critical for patient care, may not be a panacea for reducing hospital readmissions. Targeted medication counseling focused on side effects, co‐pay, and medication delivery may address patients' underlying reasons for nonadherence. And most importantly, one transition experience does not fit all. Hospitalists and administrators must tailor interventions to address challenges reported by their patients, particularly those of low SES.
Acknowledgements
The authors are grateful to the Society of General Internal Medicine (SGIM) for selecting our abstract Perceptions of Readmitted Patients on the Transition From Hospital to Home as a Lipkin Award Finalist during the 2012 SGIM National Meeting.
Disclosures: Support for this study was provided by a grant from the Leonard Davis Institute of Health Economics. Dr Grande has received honoraria from the Johns Hopkins University CME Program; has a consultancy with the National Nursing Centers Consortium; and has received grant support from, or has grants pending with, the HealthWell Foundation, the National Human Genome Research Institute, and the Agency for Healthcare Research and Quality. Dr Shannon is the founder of a biotech company, Ventrigen, LLC; is a senior fellow at IHI; is on the scientific advisory boards for Glasgow Smith Klein, Pfizer, Merck, and Value Capture; and is a member of the Board of Directors of the ABIM.
- ,,,.All‐Cause Readmissions by Payer and Age, 2008: Statistical Brief #115. Healthcare Cost and Utilization Project (HCUP) Statistical Briefs.Rockville, MD:Agency for Health Care Policy and Research; February 2006–June2011.
- ,,.Understanding rehospitalization risk: can hospital discharge be modified to reduce recurrent hospitalization?J Hosp Med.2007;2(5):297–304.
- ,,.Patients' and caregivers' transition from hospital to home: needs and recommendations.Home Health Care Serv Q.1999;17(3):27–48.
- ,,.Reasons for readmission in heart failure: perspectives of patients, caregivers, cardiologists, and heart failure nurses.Heart Lung.2009;38(5):427–434.
- ,.Psychiatric rehospitalization of the severely mentally ill: patient and staff perspectives.Nurs Res.1992;41(5):301–305.
- ,,,,,.Continuity of care and monitoring pain after discharge: patient perspective.J Adv Nurs.2010;66(1):40–48.
- ,,,.Going home from hospital: the carer/patient dyad.J Adv Nurs.2001;35(2):206–217.
- ,,.The impact of patient socioeconomic status and other social factors on readmission. A prospective study in 4 Massachusetts hospitals.Inquiry.1994;31(2):163–172.
- ,,,.Redefining readmission risk factors for general medicine patients.J Hosp Med.2011;6(2):54–60.
- ,.Hospital readmissions—not just a measure of quality.JAMA.2011;306(16):1796–1797.
- American Association for Public Opinion Research (AAPOR).Standard Definitions: Final Dispositions of Case Codes and Outcome Rates for Surveys.7th ed.Deerfield, IL:AAPOR;2011.
- ,.The Discovery of Grounded Theory: Strategies for Qualitative Research.New York:Aldine;1967.
- ,,,.The relation between health insurance coverage and clinical outcomes among women with breast cancer.N Engl J Med.1993;329(5):326–331.
- ,,,,,.Neighborhood socioeconomic status, Medicaid coverage and medical management of myocardial infarction: atherosclerosis risk in communities (ARIC) community surveillance.BMC Public Health.2010;10:632.
- ,,,,.Effects of practice setting on quality of lipid‐lowering management in patients with coronary artery disease.Am J Cardiol.1998;81(12):1416–1420.
- .Income Data by Insurance Category.2012.
- ,.Hospital readmissions and the Affordable Care Act: paying for coordinated quality care.JAMA.2011;306(16):1794–1795.
- ,,.Does increased access to primary care reduce hospital readmissions?N Engl J Med.1996;334(22):1441–1447.