User login
Immunotherapy-Induced Colitis: An Emerging Problem for the Hospitalist
Immune checkpoint inhibitors (ICIs), a form of immunotherapy, have changed the management of cancer since their introduction in 2011.1 They were initially tested on melanoma.2 Their use in the advanced stages of the disease demonstrated a 2-year survival of 18% compared with 5% by using other therapies.3 Similar results were observed in nonsmall cell lung carcinoma (NSCLC); the overall survival benefit was 3 months with the use of ICIs compared with traditional chemotherapy (42% and 24% at 1 year, respectively).4 Antitumor activity has also been seen in the treatment of other malignancies, including renal cell carcinoma,5 bladder carcinoma,6,7 head and neck carcinoma,8 colorectal cancer,9 Hodgkin lymphoma,10 and, more recently, hepatocellular carcinoma.11 The use of ICIs has also been linked to serious complications.12 Although the skin, kidneys, lungs, and endocrine and nervous systems may be affected, complications of the gastrointestinal (GI) tract are frequent and can be life-threatening.12-16 We performed a thorough review of the literature to familiarize hospitalists with the mechanism of action and uses of ICIs, the clinical presentation of their GI toxicity, and the current recommendations regarding diagnosis and treatment.
CASE PRESENTATION
A 66-year-old man was admitted to our institution with a 1-week history of severe, diffuse abdominal pain and profuse watery diarrhea. He reported having more than 8 watery bowel movements per day and denied fever, recent travel, ill contacts, or ingestion of undercooked food. He had a history of metastatic melanoma and was undergoing treatment with both nivolumab and ipilimumab; the drugs were started 6 weeks prior to presentation. Physical examination revealed a heart rate of 110 beats/minute while supine and 123 beats/minute while standing, blood pressure of 112/69 mm Hg while supine and 92/62 mm Hg while standing, and a temperature of 37.2°C. He was in mild distress and had dry oral mucosa. Abdominal examination revealed hyperactive bowel sounds and mild diffuse abdominal tenderness with no guarding or rebound. His extremities were cool, but peripheral pulses were present. Initial laboratory results included a hemoglobin level of 15.3 g/dL (range 12.0-16.0 mg/dL), white blood cell count 14.2 × 10⁹/L (range 4.5-11.0 × 10⁹/L), and platelet count 236 × 109/L (range 150-400 × 109/L); other test results included a sodium level of 130 mmol/L (range 135-145 mmol/L), potassium 2.3 mmol/L (range 3.5-5.5 mmol/L), serum creatinine 2.2 mg/dL (range 0.8-1.3 mg/dL), blood urea nitrogen 72 mg/dL (range 8-21 mg/dL), and serum venous lactate 5.9 mmol/L (range 0.9-1.7 mmol/L).
MECHANISM OF ACTION AND USES OF ICIS
T-cell lymphocytes play a pivotal role in acquired immunity, but their function requires an appropriate balance between stimulatory and inhibitory signals to prevent autoimmunity.17 Immune checkpoint molecules are used by the immune system to assist with this balance.18 Although several of these molecules exist, the cytotoxic T-lymphocyte antigen-4 (CTLA-4) and programmed cell death-1 (PD-1) are among the most widely studied.12
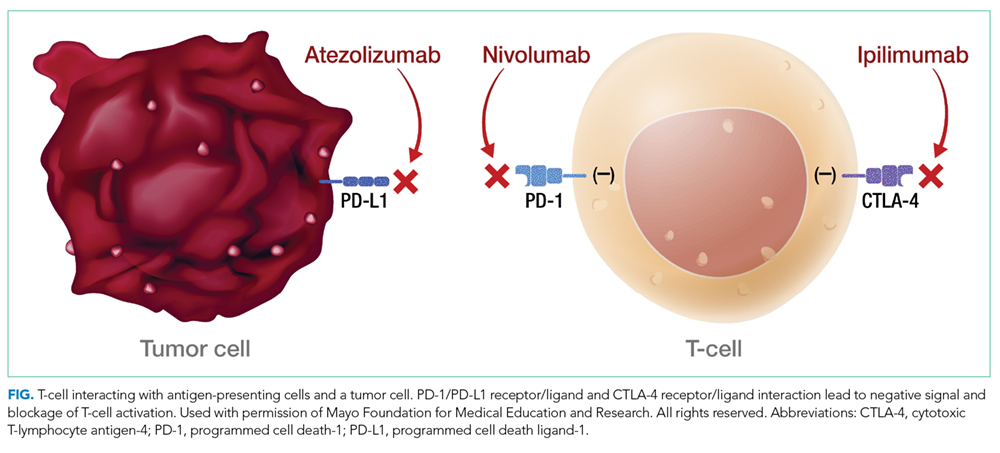
Ipilimumab is a monoclonal antibody directed against CTLA-4.24 After demonstrating survival benefits in patients with unresectable and metastatic melanoma, ipilimumab was the first ICI approved for use by the US Food and Drug Administration (FDA).1,3 Another monoclonal antibody directed against CTLA-4, tremelimumab, is not currently approved for use by the FDA.
TOXIC PROFILE
Because of the sustained T-cell activation, ICIs have been associated with autoimmune-like toxicities known as immune-related adverse events (irAEs).19,31 Because the PD-1/PD-L1 pathway is more tumor-specific than the CTLA-4 pathway,21-23 there is a higher incidence of serious irAEs seen with ipilimumab, reported to be around 27%.18,22 Furthermore, the risk of developing irAEs is dose-dependent and can increase up to 55% when anti-CTLA-4 are used with other ICIs such as nivolumab.13,32-34
The skin and GI tract are the most commonly involved organs.14-16 Skin is affected in 50% of patients receiving ipilimumab and 40% of patients on nivolumab or pembrolizumab, often in the form of a rash or pruritus.12,35-37 The rash is often described as faintly erythematous, reticular, and maculopapular and typically affects the trunk and extremities.38 Importantly, these events usually occur within the first 2 weeks of treatment, and fewer than 5% are severe.12,36,39 A higher percentage of severe adverse events occurs in the GI tract, with a reported incidence of 12%.3,14,36,39
CLINICAL PRESENTATION
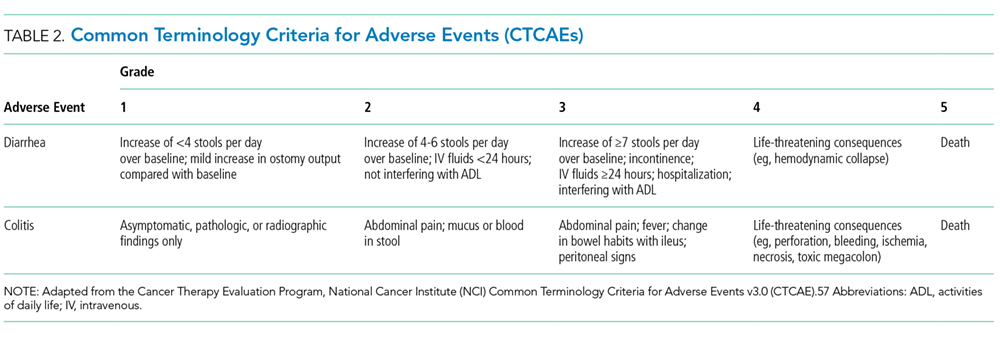
Colitis, defined by either the presence of symptoms or radiologic findings suggestive of inflammation, occurs less often than diarrhea alone, with a reported incidence of 2.3%.37,43 This incidence increases to almost 12% when anti-CTLA-4 and anti-PD-1/PD-L1 are combined.32 Colitis symptoms include abdominal pain (20%), nausea and vomiting (15%), fever (12%), and, less often, bloody diarrhea or rectal bleeding.19,20 Colitis severity is graded according to the CTCAE (Table 2).42 Most patients have mild colitis (grade 1 or 2).19 The risk for developing severe colitis (grade 3 or higher) is almost 10 times higher with the use of anti-CTLA-4 compared with anti-PD-1/PD-L1 agents.43 Patients with severe disease are at risk of developing life-threatening complications, such as ileus, toxic megacolon, bowel ischemia, necrosis, or even perforation, which has been reported in up to 5% of patients with colitis because of ipilimumab.13,17
CASE APPROACH STRATEGY
Based on the patient’s symptoms, physical findings, and temporal relationship to ICI therapy, he was believed to have immune-mediated colitis. Stool studies, including those looking for ova and parasites, C
DIAGNOSIS
In a patient undergoing ICI treatment who has diarrhea, the initial assessment should exclude C. difficile and Salmonella by stool culture, PCR, or pathogenic antigens.19 Cytomegalovirus reactivation should also be considered. Immune-mediated colitis and infection can coexist; thus, a positive infectious etiology does not rule out the presence of immune colitis or vice versa.44 Fecal calprotectin, a marker of neutrophil-associated inflammation, is nonspecific for ICI-induced colitis; however, it may help to distinguish inflammatory from noninflammatory diarrhea.33,45
No clear guideline exists for the use of abdominal imaging. Some experts suggest using computed tomography in patients with severe, persistent, or progressive symptoms in order to exclude bowel obstruction, toxic megacolon, or perforation.19,46
In patients with typical symptoms, and after infectious etiologies are ruled out, empiric use of corticosteroids can be initiated without an endoscopic evaluation, which is not necessary to establish a diagnosis and rarely changes management.12,37,47 In patients with atypical presentations or for whom the diagnosis remains in question, endoscopic evaluation with biopsies may be required. Macroscopic findings may be similar to those seen with inflammatory bowel disease (IBD), including erythema, edema, ulceration, granularity, or loss of vascular pattern. Although immune-mediated colitis affects the descending colon more often than IBD, this feature and any macroscopic findings are insufficient to make this distinction.20,36 Furthermore, the lack of macroscopic abnormalities does not rule out immune-mediated colitis.20
When endoscopic biopsies are obtained, histologic findings for anti-CTLA-4 medications (eg, ipilimumab) usually follow 3 patterns: neutrophilic infiltrate (46%), lymphocytic infiltrate (15%), and mixed infiltrate (38%).41 Other findings include crypt abscesses and tissue destruction.20 No biopsy-specific pattern has been described with anti-PD-1/PD-L1 medications, such as nivolumab or pembrolizumab.18 A normal colonic tissue does not exclude the presence of an irAE, as cases of isolated ileitis48 or enteritis49 without colitis can also occur.
CASE MANAGEMENT STRATEGY
The patient was started on intravenous (IV) methylprednisolone 2 mg/kg twice a day. After 48 hours, he still had more than 7 episodes of diarrhea per day, so he was treated with 1 dose of infliximab 5 mg/kg without stopping corticosteroids. Within 72 hours, the patient’s abdominal pain improved and his diarrhea stopped. He was discharged on an 8-week taper of prednisone starting at 1 mg/kg/day, pneumocystis pneumonia (PCP) prophylaxis was started, and ICI therapy was discontinued indefinitely.
MANAGEMENT OF COLITIS
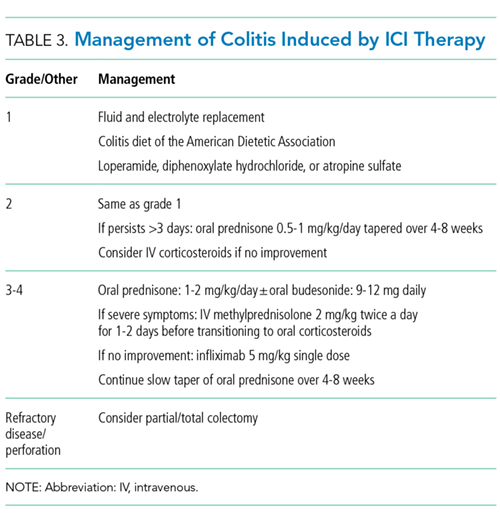
Management of grade 1 and 2 colitis is mainly supportive, consisting of fluid and electrolyte replacement, the American Dietetic Association colitis diet, and antimotility agents, such as loperamide, oral diphenoxylate hydrochloride, or atropine sulfate.36,37 Persistent grade 2 symptoms (lasting >3 days), should prompt initiation of 0.5 to 1 mg/kg/day of oral prednisone or an equivalent.19 If symptoms do not improve with oral corticosteroids, patient hospitalization for IV corticosteroids should be considered.37 Importantly, opioids and antidiarrheals may mask the pain and severity of symptoms and, therefore, should be used cautiously.19
Patients with grade 3 and 4 colitis (≥7 stools per day, severe abdominal pain, or complications) require the use of systemic corticosteroids at a dose of 1 to 2 mg/kg/day of prednisone or an equivalent.15 Patients who fail to respond to prednisone alone may benefit from the addition of oral budesonide at a dose of 9 to 12 mg/day.50 In severe cases of colitis, hospitalization may be necessary for IV hydration, electrolyte replacement, and IV methylprednisolone at a starting dose of 2 mg/kg twice a day for 1 to 2 days before transitioning to oral corticosteroids.12,15 Though improvement is usually noted within the first 2 weeks of treatment, prednisone should be slowly tapered over a period of 4 to 8 weeks to ensure complete healing and prevent relapse.20,36 Patients who receive an equivalent dose of prednisone 20 mg daily during a period of 4 weeks or more should receive PCP prophylaxis.51 Some patients fail to respond to IV corticosteroids despite adequate dosing. Many of these patients have severe disease, possibly because of delayed recognition and initiation of treatment.19 As with IBD, the addition of infliximab to corticosteroids at 5 mg/kg as a single dose is usually successful for this population subset.52-54 Although a response is seen within 1 to 3 days,41 some patients benefit from an additional dose of infliximab 2 weeks after the initial dose.19 If sepsis or perforation is suspected at any point, corticosteroids or infliximab should be avoided and antibiotics should be started immediately.15,19 Patients with a medically unresponsive disease may require partial or complete colectomy.20 The use of prophylactic budesonide to prevent diarrhea or colitis has not been proven effective and should not be used.55 Despite complications, mortality from colitis has markedly decreased given the increased awareness of this adverse event, reduction in the time to recognition and treatment, and increased adherence to corticosteroids.12
Treating physicians may be delayed in starting appropriate therapy because patients are concerned that using corticosteroids will negatively impact immunotherapy efficacy. Current evidence shows that the use of temporary immunosuppression to treat irAEs does not affect overall survival, efficacy, or time to treatment failure of the ICI.12,56 Restarting ICI therapy is a complex decision and should always be individualized. In grade 1 and 2 colitis, ICI therapy is typically restarted after symptoms have improved.5 In grade 3 and 4 colitis, ICI therapy is often permanently discontinued.20
CONCLUSION
ICIs have not only increased our understanding of the biology of cancer, but they have also improved survival in advanced stages of malignancies like melanoma, NSCLC, and renal cell carcinoma. The expanding use of these medications increases the likelihood that healthcare providers will encounter patients experiencing their adverse events.
Immune-mediated GI adverse events include a wide range of symptoms, from mild diarrhea to severe colitis complicated by perforation and death. Diagnosis requires exclusion of an infectious process. Early recognition and treatment with corticosteroids or another immunosuppressant such as infliximab hastens recovery and decreases complications and mortality. Treatment should be started within 5 days of symptom onset. Corticosteroids should be slowly tapered for no less than 4 weeks to prevent relapse and PCP prophylaxis administered in appropriate patients. Restarting ICI therapy may be considered in cases of mild colitis, but in severe cases, ICI therapy is usually discontinued.
Disclosure
Julian Marin-Acevedo, Dana Harris, and M. Caroline Burton have no conflicts of interest or funding sources to declare.
1. Ledford H. Melanoma drug wins US approval. Nature. 2011;471(7340):561. PubMed
2. Ribas A. Clinical development of the anti-CTLA-4 antibody tremelimumab. Semin Oncol. 2010;37(5):450-454. PubMed
3. Hodi FS, O’Day SJ, McDermott DF, et al. Improved survival with ipilimumab in patients with metastatic melanoma. N Engl J Med. 2010;363(8):711-723. PubMed
4. Brahmer J, Reckamp KL, Baas P, et al. Nivolumab versus Docetaxel in Advanced Squamous-Cell Non-Small-Cell Lung Cancer. N Engl J Med. 2015;373(2):123-135. PubMed
5. Motzer RJ, Rini BI, McDermott DF, et al. Nivolumab for Metastatic Renal Cell Carcinoma: Results of a Randomized Phase II Trial. J Clin Oncol. 2015;33(13):1430-1437. PubMed
6. Powles T, Eder JP, Fine GD, et al. MPDL3280A (anti-PD-L1) treatment leads to clinical activity in metastatic bladder cancer. Nature. 2014;515(7528):558-562. PubMed
7. Massard C, Gordon MS, Sharma S, et al. Safety and Efficacy of Durvalumab (MEDI4736), an Anti-Programmed Cell Death Ligand-1 Immune Checkpoint Inhibitor, in Patients With Advanced Urothelial Bladder Cancer. J Clin Oncol. 2016;34(26):3119-3125. PubMed
8. Ferris RL, Blumenschein G Jr, Fayette J, et al. Nivolumab for Recurrent Squamous-Cell Carcinoma of the Head and Neck. N Engl J Med. 2016;375(19):1856-1867. PubMed
9. Le DT, Uram JN, Wang H, et al. PD-1 Blockade in Tumors with Mismatch-Repair Deficiency. N Engl J Med. 2015;372(26):2509-2520. PubMed
10. Ansell SM, Lesokhin AM, Borrello I, et al. PD-1 blockade with nivolumab in relapsed or refractory Hodgkin’s lymphoma. N Engl J Med. 2015;372(4):311-319. PubMed
11. El-Khoueiry AB, Sangro B, Yau T, et al. Nivolumab in patients with advanced hepatocellular carcinoma (CheckMate 040): an open-label, non-comparative, phase 1/2 dose escalation and expansion trial. Lancet. 2017;389(10088)2492-2502. PubMed
12. Friedman CF, Proverbs-Singh TA, Postow MA. Treatment of the Immune-Related Adverse Effects of Immune Checkpoint Inhibitors: A Review. JAMA Oncol. 2016;2(10):1346-1353. PubMed
13. Heinzerling L, Goldinger SM. A review of serious adverse effects under treatment with checkpoint inhibitors. Curr Opin Oncol. 2017;29(2):136-144. PubMed
14. Kahler KC, Hauschild A. Treatment and side effect management of CTLA-4 antibody therapy in metastatic melanoma. J Dtsch Dermatol Ges. 2011;9(4):277-286. PubMed
15. Weber JS, Postow M, Lao CD, Schadendorf D. Management of Adverse Events Following Treatment With Anti-Programmed Death-1 Agents. Oncologist. 2016;21(10):1230-1240. PubMed
16. Bertrand A, Kostine M, Barnetche T, Truchetet ME, Schaeverbeke T. Immune related adverse events associated with anti-CTLA-4 antibodies: systematic review and meta-analysis. BMC Med. 2015;13:211-224. PubMed
17. Abdel-Wahab N, Shah M, Suarez-Almazor ME. Adverse Events Associated with Immune Checkpoint Blockade in Patients with Cancer: A Systematic Review of Case Reports. PLoS One. 2016;11(7):e0160221. doi:10.1371/journal.pone.0160221 PubMed
18. Naidoo J, Page DB, Li BT, et al. Toxicities of the anti-PD-1 and anti-PD-L1 immune checkpoint antibodies. Ann Oncol. 2015;26(12):2375-2391. PubMed
19. Gupta A, De Felice KM, Loftus EV Jr, Khanna S. Systematic review: colitis associated with anti-CTLA-4 therapy. Aliment Pharmacol Ther. 2015;42(4):406-417. PubMed
20. Pernot S, Ramtohul T, Taieb J. Checkpoint inhibitors and gastrointestinal immune-related adverse events. Curr Opin Oncol. 2016;28(4):264-268. PubMed
21. Kamata T, Suzuki A, Mise N, et al. Blockade of programmed death-1/programmed death ligand pathway enhances the antitumor immunity of human invariant natural killer T cells. Cancer Immunol Immunother. 2016;65(12):1477-1489. PubMed
22. Pardoll DM. The blockade of immune checkpoints in cancer immunotherapy. Nat Rev Cancer. 2012;12(4):252-264. PubMed
23. Velu V, Titanji K, Zhu B, et al. Enhancing SIV-specific immunity in vivo by PD-1 blockade. Nature. 2009;458(7235):206-210. PubMed
24. Phan GQ, Yang JC, Sherry RM, et al. Cancer regression and autoimmunity induced by cytotoxic T lymphocyte-associated antigen 4 blockade in patients with metastatic melanoma. Proc Natl Acad Sci U S A. 2003;100(14):8372-8377. PubMed
25. U.S. Food and Drug Administration, Center for Drug Evaluation and Research. Atezolizumab BLA 761041 approval letter (urothelial carcinoma). https://www.genentech-access.com/content/dam/gene/accesssolutions/brands/tecentriq/Appeals%20Tips/TECENTRIQ-FDA-Approval-Letter-Metastatic-Urothelial-Carcinoma-First-Line-Therapy.pdf. Accessed September 30, 2017.
26. U.S. Food and Drug Administration, Center for Drug Evaluation and Research. Imfinzi (durvalumab) approval letter. https://www.accessdata.fda.gov/drugsatfda_docs/appletter/2017/761069Orig1s000ltr.pdf. Accessed September 30, 2017.
27. U.S. Food and Drug Administration, Center for Drug Evaluation and Research. Bavencio (avelumab) accelerated approval letter - urothelial carcinoma. https://www.accessdata.fda.gov/drugsatfda_docs/appletter/2017/761078Orig1s000ltr.pdf. Accessed May 16, 2017.
28. U.S. Food and Drug Administration, Center for Drug Evaluation and Research. Atezolizumab BLA 761041 approval letter (NSCLC).
29. U.S. Food and Drug Administration, Center for Drug Evaluation and Research. Bavencio (avelumab) approval letter - Merkel cell carcinoma. https://www.accessdata.fda.gov/drugsatfda_docs/appletter/2017/761049Orig1s000ltr.pdf. Accessed April 27, 2017.
30. U.S. Food and Drug Administration, Center for Drug Evaluation and Research. Atezolizumab BLA 761041 approval letter. https://www.accessdata.fda.gov/drugsatfda_docs/nda/2016/761034Orig1s000Approv.pdf. Accessed April 6, 2017.
31. Voskens CJ, Goldinger SM, Loquai C, et al. The price of tumor control: an analysis of rare side effects of anti-CTLA-4 therapy in metastatic melanoma from the ipilimumab network. PLoS One. 2013;8(1):e53745. doi:10.1371/journal.pone.0053745. PubMed
32. Larkin J, Chiarion-Sileni V, Gonzalez R, et al. Combined Nivolumab and Ipilimumab or Monotherapy in Untreated Melanoma. N Engl J Med. 2015;373(1):23-34. PubMed
33. Michot JM, Bigenwald C, Champiat S, et al. Immune-related adverse events with immune checkpoint blockade: a comprehensive review. Eur J Cancer. 2016;54:139-148. PubMed
34. Villadolid J, Amin A. Immune checkpoint inhibitors in clinical practice: update on management of immune-related toxicities. Transl Lung Cancer Res. 2015;4(5):560-575. PubMed
35. Weber JS, Kahler KC, Hauschild A. Management of immune-related adverse events and kinetics of response with ipilimumab. J Clin Oncol. 2012;30(21):2691-2697. PubMed
36. Kahler KC, Hassel JC, Heinzerling L, et al. Management of side effects of immune checkpoint blockade by anti-CTLA-4 and anti-PD-1 antibodies in metastatic melanoma. J Dtsch Dermatol Ges. 2016;14(7):662-681. PubMed
37. Postow MA. Managing immune checkpoint-blocking antibody side effects. Am Soc Clin Oncol Educ Book. 2015:76-83. PubMed
38. Lacouture ME, Wolchok JD, Yosipovitch G, Kahler KC, Busam KJ, Hauschild A. Ipilimumab in patients with cancer and the management of dermatologic adverse events. J Am Acad Dermatol. 2014;71(1):161-169. PubMed
39. Robert C, Schachter J, Long GV, et al. Pembrolizumab versus Ipilimumab in Advanced Melanoma. N Engl J Med. 2015;372(26):2521-2532. PubMed
40. Weber J. Ipilimumab: controversies in its development, utility and autoimmune adverse events. Cancer Immunol Immunother. 2009;58(5):823-830. PubMed
41. Beck KE, Blansfield JA, Tran KQ, et al. Enterocolitis in patients with cancer after antibody blockade of cytotoxic T-lymphocyte-associated antigen 4. J Clin Oncol. 2006;24(15):2283-2289. PubMed
42. Cancer Therapy Evaluation Program, National Cancer Institute (NCI). Common terminology criteria for adverse events v3.0 (CTCAE). https://ctep.cancer.gov/protocoldevelopment/electronic_applications/docs/ctcaev3.pdf. Accessed April 9, 2017.
43. De Velasco G, Je Y, Bosse D, et al. Comprehensive Meta-analysis of Key Immune-Related Adverse Events from CTLA-4 and PD-1/PD-L1 Inhibitors in Cancer Patients. Cancer Immunol Res. 2017;5(4):312-318. PubMed
44. McCutcheon JL, McClain CM, Puzanov I, Smith TA. Infectious Colitis Associated With Ipilimumab Therapy. Gastroenterology Res. 2014;7(1):28-31. PubMed
45. Berman D, Parker SM, Siegel J, et al. Blockade of cytotoxic T-lymphocyte antigen-4 by ipilimumab results in dysregulation of gastrointestinal immunity in patients with advanced melanoma. Cancer Immun. 2010;10:11-20. PubMed
46. Reynolds K, Ananthakrishnan A, Dougan M, Bardia A. Immune-Related Adverse Events (irAEs) in Cancer Patients. In: McKean SC, Ross JJ, Dressler DD, Scheurer DB, eds. Principles and Practice of Hospital Medicine. 2nd ed. New York: McGraw-Hill Education; 2017.
47. Garcia-Neuer M, Marmarelis ME, Jangi SR, et al. Diagnostic Comparison of CT Scans and Colonoscopy for Immune-Related Colitis in Ipilimumab-Treated Advanced Melanoma Patients. Cancer Immunol Res. 2017;5(4):286-291. PubMed
48. Venditti O, De Lisi D, Caricato M, et al. Ipilimumab and immune-mediated adverse events: a case report of anti-CTLA4 induced ileitis. BMC Cancer. 2015;15:87-91. PubMed
49. Messmer M, Upreti S, Tarabishy Y, et al. Ipilimumab-Induced Enteritis without Colitis: A New Challenge. Case Rep Oncol. 2016;9(3):705-713. PubMed
50. De Felice KM, Gupta A, Rakshit S, et al. Ipilimumab-induced colitis in patients with metastatic melanoma. Melanoma Res. 2015;25(4):321-327. PubMed
51. Baden LR, Swaminathan S, Angarone M, et al. Prevention and Treatment of Cancer-Related Infections, Version 2.2017, NCCN Clinical Practice Guidelines in Oncology. J Natl Compr Canc Newt. 2017;14(7):882-913. PubMed
52. Minor DR, Chin K, Kashani-Sabet M. Infliximab in the treatment of anti-CTLA4 antibody (ipilimumab) induced immune-related colitis. Cancer Biother Radiopharm. 2009;24(3):321-325. PubMed
53. Merrill SP, Reynolds P, Kalra A, Biehl J, Vandivier RW, Mueller SW. Early administration of infliximab for severe ipilimumab-related diarrhea in a critically ill patient. Ann Pharmacother. 2014;48(6):806-810. PubMed
54. Pages C, Gornet JM, Monsel G, et al. Ipilimumab-induced acute severe colitis treated by infliximab. Melanoma Res. 2013;23(3):227-230. PubMed
55. Weber J, Thompson JA, Hamid O, et al. A randomized, double-blind, placebo-controlled, phase II study comparing the tolerability and efficacy of ipilimumab administered with or without prophylactic budesonide in patients with unresectable stage III or IV melanoma. Clin Cancer Res. 2009;15(17):5591-5598. PubMed
56. Horvat TZ, Adel NG, Dung TO, et al. Immune-Related Adverse Events, Need for Systemic Immunosuppression, and Effects on Survival and Time to Treatment Failure in Patients With Melanoma Treated With Ipilimumab at Memorial Sloan Kettering Cancer Center. J Clin Oncol. 2015;33(28):3193-3198. PubMed
57. Cancer Therapy Evaluation Program, National Cancer Institute (NCI). Common terminology criteria for adverse events v3.0 (CTCAE). https://ctep.cancer.gov/protocoldevelopment/electronic_applications/docs/ctcaev3.pdf. Accessed April 9, 2017.
Immune checkpoint inhibitors (ICIs), a form of immunotherapy, have changed the management of cancer since their introduction in 2011.1 They were initially tested on melanoma.2 Their use in the advanced stages of the disease demonstrated a 2-year survival of 18% compared with 5% by using other therapies.3 Similar results were observed in nonsmall cell lung carcinoma (NSCLC); the overall survival benefit was 3 months with the use of ICIs compared with traditional chemotherapy (42% and 24% at 1 year, respectively).4 Antitumor activity has also been seen in the treatment of other malignancies, including renal cell carcinoma,5 bladder carcinoma,6,7 head and neck carcinoma,8 colorectal cancer,9 Hodgkin lymphoma,10 and, more recently, hepatocellular carcinoma.11 The use of ICIs has also been linked to serious complications.12 Although the skin, kidneys, lungs, and endocrine and nervous systems may be affected, complications of the gastrointestinal (GI) tract are frequent and can be life-threatening.12-16 We performed a thorough review of the literature to familiarize hospitalists with the mechanism of action and uses of ICIs, the clinical presentation of their GI toxicity, and the current recommendations regarding diagnosis and treatment.
CASE PRESENTATION
A 66-year-old man was admitted to our institution with a 1-week history of severe, diffuse abdominal pain and profuse watery diarrhea. He reported having more than 8 watery bowel movements per day and denied fever, recent travel, ill contacts, or ingestion of undercooked food. He had a history of metastatic melanoma and was undergoing treatment with both nivolumab and ipilimumab; the drugs were started 6 weeks prior to presentation. Physical examination revealed a heart rate of 110 beats/minute while supine and 123 beats/minute while standing, blood pressure of 112/69 mm Hg while supine and 92/62 mm Hg while standing, and a temperature of 37.2°C. He was in mild distress and had dry oral mucosa. Abdominal examination revealed hyperactive bowel sounds and mild diffuse abdominal tenderness with no guarding or rebound. His extremities were cool, but peripheral pulses were present. Initial laboratory results included a hemoglobin level of 15.3 g/dL (range 12.0-16.0 mg/dL), white blood cell count 14.2 × 10⁹/L (range 4.5-11.0 × 10⁹/L), and platelet count 236 × 109/L (range 150-400 × 109/L); other test results included a sodium level of 130 mmol/L (range 135-145 mmol/L), potassium 2.3 mmol/L (range 3.5-5.5 mmol/L), serum creatinine 2.2 mg/dL (range 0.8-1.3 mg/dL), blood urea nitrogen 72 mg/dL (range 8-21 mg/dL), and serum venous lactate 5.9 mmol/L (range 0.9-1.7 mmol/L).
MECHANISM OF ACTION AND USES OF ICIS
T-cell lymphocytes play a pivotal role in acquired immunity, but their function requires an appropriate balance between stimulatory and inhibitory signals to prevent autoimmunity.17 Immune checkpoint molecules are used by the immune system to assist with this balance.18 Although several of these molecules exist, the cytotoxic T-lymphocyte antigen-4 (CTLA-4) and programmed cell death-1 (PD-1) are among the most widely studied.12
Ipilimumab is a monoclonal antibody directed against CTLA-4.24 After demonstrating survival benefits in patients with unresectable and metastatic melanoma, ipilimumab was the first ICI approved for use by the US Food and Drug Administration (FDA).1,3 Another monoclonal antibody directed against CTLA-4, tremelimumab, is not currently approved for use by the FDA.
TOXIC PROFILE
Because of the sustained T-cell activation, ICIs have been associated with autoimmune-like toxicities known as immune-related adverse events (irAEs).19,31 Because the PD-1/PD-L1 pathway is more tumor-specific than the CTLA-4 pathway,21-23 there is a higher incidence of serious irAEs seen with ipilimumab, reported to be around 27%.18,22 Furthermore, the risk of developing irAEs is dose-dependent and can increase up to 55% when anti-CTLA-4 are used with other ICIs such as nivolumab.13,32-34
The skin and GI tract are the most commonly involved organs.14-16 Skin is affected in 50% of patients receiving ipilimumab and 40% of patients on nivolumab or pembrolizumab, often in the form of a rash or pruritus.12,35-37 The rash is often described as faintly erythematous, reticular, and maculopapular and typically affects the trunk and extremities.38 Importantly, these events usually occur within the first 2 weeks of treatment, and fewer than 5% are severe.12,36,39 A higher percentage of severe adverse events occurs in the GI tract, with a reported incidence of 12%.3,14,36,39
CLINICAL PRESENTATION
Colitis, defined by either the presence of symptoms or radiologic findings suggestive of inflammation, occurs less often than diarrhea alone, with a reported incidence of 2.3%.37,43 This incidence increases to almost 12% when anti-CTLA-4 and anti-PD-1/PD-L1 are combined.32 Colitis symptoms include abdominal pain (20%), nausea and vomiting (15%), fever (12%), and, less often, bloody diarrhea or rectal bleeding.19,20 Colitis severity is graded according to the CTCAE (Table 2).42 Most patients have mild colitis (grade 1 or 2).19 The risk for developing severe colitis (grade 3 or higher) is almost 10 times higher with the use of anti-CTLA-4 compared with anti-PD-1/PD-L1 agents.43 Patients with severe disease are at risk of developing life-threatening complications, such as ileus, toxic megacolon, bowel ischemia, necrosis, or even perforation, which has been reported in up to 5% of patients with colitis because of ipilimumab.13,17
CASE APPROACH STRATEGY
Based on the patient’s symptoms, physical findings, and temporal relationship to ICI therapy, he was believed to have immune-mediated colitis. Stool studies, including those looking for ova and parasites, C
DIAGNOSIS
In a patient undergoing ICI treatment who has diarrhea, the initial assessment should exclude C. difficile and Salmonella by stool culture, PCR, or pathogenic antigens.19 Cytomegalovirus reactivation should also be considered. Immune-mediated colitis and infection can coexist; thus, a positive infectious etiology does not rule out the presence of immune colitis or vice versa.44 Fecal calprotectin, a marker of neutrophil-associated inflammation, is nonspecific for ICI-induced colitis; however, it may help to distinguish inflammatory from noninflammatory diarrhea.33,45
No clear guideline exists for the use of abdominal imaging. Some experts suggest using computed tomography in patients with severe, persistent, or progressive symptoms in order to exclude bowel obstruction, toxic megacolon, or perforation.19,46
In patients with typical symptoms, and after infectious etiologies are ruled out, empiric use of corticosteroids can be initiated without an endoscopic evaluation, which is not necessary to establish a diagnosis and rarely changes management.12,37,47 In patients with atypical presentations or for whom the diagnosis remains in question, endoscopic evaluation with biopsies may be required. Macroscopic findings may be similar to those seen with inflammatory bowel disease (IBD), including erythema, edema, ulceration, granularity, or loss of vascular pattern. Although immune-mediated colitis affects the descending colon more often than IBD, this feature and any macroscopic findings are insufficient to make this distinction.20,36 Furthermore, the lack of macroscopic abnormalities does not rule out immune-mediated colitis.20
When endoscopic biopsies are obtained, histologic findings for anti-CTLA-4 medications (eg, ipilimumab) usually follow 3 patterns: neutrophilic infiltrate (46%), lymphocytic infiltrate (15%), and mixed infiltrate (38%).41 Other findings include crypt abscesses and tissue destruction.20 No biopsy-specific pattern has been described with anti-PD-1/PD-L1 medications, such as nivolumab or pembrolizumab.18 A normal colonic tissue does not exclude the presence of an irAE, as cases of isolated ileitis48 or enteritis49 without colitis can also occur.
CASE MANAGEMENT STRATEGY
The patient was started on intravenous (IV) methylprednisolone 2 mg/kg twice a day. After 48 hours, he still had more than 7 episodes of diarrhea per day, so he was treated with 1 dose of infliximab 5 mg/kg without stopping corticosteroids. Within 72 hours, the patient’s abdominal pain improved and his diarrhea stopped. He was discharged on an 8-week taper of prednisone starting at 1 mg/kg/day, pneumocystis pneumonia (PCP) prophylaxis was started, and ICI therapy was discontinued indefinitely.
MANAGEMENT OF COLITIS
Management of grade 1 and 2 colitis is mainly supportive, consisting of fluid and electrolyte replacement, the American Dietetic Association colitis diet, and antimotility agents, such as loperamide, oral diphenoxylate hydrochloride, or atropine sulfate.36,37 Persistent grade 2 symptoms (lasting >3 days), should prompt initiation of 0.5 to 1 mg/kg/day of oral prednisone or an equivalent.19 If symptoms do not improve with oral corticosteroids, patient hospitalization for IV corticosteroids should be considered.37 Importantly, opioids and antidiarrheals may mask the pain and severity of symptoms and, therefore, should be used cautiously.19
Patients with grade 3 and 4 colitis (≥7 stools per day, severe abdominal pain, or complications) require the use of systemic corticosteroids at a dose of 1 to 2 mg/kg/day of prednisone or an equivalent.15 Patients who fail to respond to prednisone alone may benefit from the addition of oral budesonide at a dose of 9 to 12 mg/day.50 In severe cases of colitis, hospitalization may be necessary for IV hydration, electrolyte replacement, and IV methylprednisolone at a starting dose of 2 mg/kg twice a day for 1 to 2 days before transitioning to oral corticosteroids.12,15 Though improvement is usually noted within the first 2 weeks of treatment, prednisone should be slowly tapered over a period of 4 to 8 weeks to ensure complete healing and prevent relapse.20,36 Patients who receive an equivalent dose of prednisone 20 mg daily during a period of 4 weeks or more should receive PCP prophylaxis.51 Some patients fail to respond to IV corticosteroids despite adequate dosing. Many of these patients have severe disease, possibly because of delayed recognition and initiation of treatment.19 As with IBD, the addition of infliximab to corticosteroids at 5 mg/kg as a single dose is usually successful for this population subset.52-54 Although a response is seen within 1 to 3 days,41 some patients benefit from an additional dose of infliximab 2 weeks after the initial dose.19 If sepsis or perforation is suspected at any point, corticosteroids or infliximab should be avoided and antibiotics should be started immediately.15,19 Patients with a medically unresponsive disease may require partial or complete colectomy.20 The use of prophylactic budesonide to prevent diarrhea or colitis has not been proven effective and should not be used.55 Despite complications, mortality from colitis has markedly decreased given the increased awareness of this adverse event, reduction in the time to recognition and treatment, and increased adherence to corticosteroids.12
Treating physicians may be delayed in starting appropriate therapy because patients are concerned that using corticosteroids will negatively impact immunotherapy efficacy. Current evidence shows that the use of temporary immunosuppression to treat irAEs does not affect overall survival, efficacy, or time to treatment failure of the ICI.12,56 Restarting ICI therapy is a complex decision and should always be individualized. In grade 1 and 2 colitis, ICI therapy is typically restarted after symptoms have improved.5 In grade 3 and 4 colitis, ICI therapy is often permanently discontinued.20
CONCLUSION
ICIs have not only increased our understanding of the biology of cancer, but they have also improved survival in advanced stages of malignancies like melanoma, NSCLC, and renal cell carcinoma. The expanding use of these medications increases the likelihood that healthcare providers will encounter patients experiencing their adverse events.
Immune-mediated GI adverse events include a wide range of symptoms, from mild diarrhea to severe colitis complicated by perforation and death. Diagnosis requires exclusion of an infectious process. Early recognition and treatment with corticosteroids or another immunosuppressant such as infliximab hastens recovery and decreases complications and mortality. Treatment should be started within 5 days of symptom onset. Corticosteroids should be slowly tapered for no less than 4 weeks to prevent relapse and PCP prophylaxis administered in appropriate patients. Restarting ICI therapy may be considered in cases of mild colitis, but in severe cases, ICI therapy is usually discontinued.
Disclosure
Julian Marin-Acevedo, Dana Harris, and M. Caroline Burton have no conflicts of interest or funding sources to declare.
1. Ledford H. Melanoma drug wins US approval. Nature. 2011;471(7340):561. PubMed
2. Ribas A. Clinical development of the anti-CTLA-4 antibody tremelimumab. Semin Oncol. 2010;37(5):450-454. PubMed
3. Hodi FS, O’Day SJ, McDermott DF, et al. Improved survival with ipilimumab in patients with metastatic melanoma. N Engl J Med. 2010;363(8):711-723. PubMed
4. Brahmer J, Reckamp KL, Baas P, et al. Nivolumab versus Docetaxel in Advanced Squamous-Cell Non-Small-Cell Lung Cancer. N Engl J Med. 2015;373(2):123-135. PubMed
5. Motzer RJ, Rini BI, McDermott DF, et al. Nivolumab for Metastatic Renal Cell Carcinoma: Results of a Randomized Phase II Trial. J Clin Oncol. 2015;33(13):1430-1437. PubMed
6. Powles T, Eder JP, Fine GD, et al. MPDL3280A (anti-PD-L1) treatment leads to clinical activity in metastatic bladder cancer. Nature. 2014;515(7528):558-562. PubMed
7. Massard C, Gordon MS, Sharma S, et al. Safety and Efficacy of Durvalumab (MEDI4736), an Anti-Programmed Cell Death Ligand-1 Immune Checkpoint Inhibitor, in Patients With Advanced Urothelial Bladder Cancer. J Clin Oncol. 2016;34(26):3119-3125. PubMed
8. Ferris RL, Blumenschein G Jr, Fayette J, et al. Nivolumab for Recurrent Squamous-Cell Carcinoma of the Head and Neck. N Engl J Med. 2016;375(19):1856-1867. PubMed
9. Le DT, Uram JN, Wang H, et al. PD-1 Blockade in Tumors with Mismatch-Repair Deficiency. N Engl J Med. 2015;372(26):2509-2520. PubMed
10. Ansell SM, Lesokhin AM, Borrello I, et al. PD-1 blockade with nivolumab in relapsed or refractory Hodgkin’s lymphoma. N Engl J Med. 2015;372(4):311-319. PubMed
11. El-Khoueiry AB, Sangro B, Yau T, et al. Nivolumab in patients with advanced hepatocellular carcinoma (CheckMate 040): an open-label, non-comparative, phase 1/2 dose escalation and expansion trial. Lancet. 2017;389(10088)2492-2502. PubMed
12. Friedman CF, Proverbs-Singh TA, Postow MA. Treatment of the Immune-Related Adverse Effects of Immune Checkpoint Inhibitors: A Review. JAMA Oncol. 2016;2(10):1346-1353. PubMed
13. Heinzerling L, Goldinger SM. A review of serious adverse effects under treatment with checkpoint inhibitors. Curr Opin Oncol. 2017;29(2):136-144. PubMed
14. Kahler KC, Hauschild A. Treatment and side effect management of CTLA-4 antibody therapy in metastatic melanoma. J Dtsch Dermatol Ges. 2011;9(4):277-286. PubMed
15. Weber JS, Postow M, Lao CD, Schadendorf D. Management of Adverse Events Following Treatment With Anti-Programmed Death-1 Agents. Oncologist. 2016;21(10):1230-1240. PubMed
16. Bertrand A, Kostine M, Barnetche T, Truchetet ME, Schaeverbeke T. Immune related adverse events associated with anti-CTLA-4 antibodies: systematic review and meta-analysis. BMC Med. 2015;13:211-224. PubMed
17. Abdel-Wahab N, Shah M, Suarez-Almazor ME. Adverse Events Associated with Immune Checkpoint Blockade in Patients with Cancer: A Systematic Review of Case Reports. PLoS One. 2016;11(7):e0160221. doi:10.1371/journal.pone.0160221 PubMed
18. Naidoo J, Page DB, Li BT, et al. Toxicities of the anti-PD-1 and anti-PD-L1 immune checkpoint antibodies. Ann Oncol. 2015;26(12):2375-2391. PubMed
19. Gupta A, De Felice KM, Loftus EV Jr, Khanna S. Systematic review: colitis associated with anti-CTLA-4 therapy. Aliment Pharmacol Ther. 2015;42(4):406-417. PubMed
20. Pernot S, Ramtohul T, Taieb J. Checkpoint inhibitors and gastrointestinal immune-related adverse events. Curr Opin Oncol. 2016;28(4):264-268. PubMed
21. Kamata T, Suzuki A, Mise N, et al. Blockade of programmed death-1/programmed death ligand pathway enhances the antitumor immunity of human invariant natural killer T cells. Cancer Immunol Immunother. 2016;65(12):1477-1489. PubMed
22. Pardoll DM. The blockade of immune checkpoints in cancer immunotherapy. Nat Rev Cancer. 2012;12(4):252-264. PubMed
23. Velu V, Titanji K, Zhu B, et al. Enhancing SIV-specific immunity in vivo by PD-1 blockade. Nature. 2009;458(7235):206-210. PubMed
24. Phan GQ, Yang JC, Sherry RM, et al. Cancer regression and autoimmunity induced by cytotoxic T lymphocyte-associated antigen 4 blockade in patients with metastatic melanoma. Proc Natl Acad Sci U S A. 2003;100(14):8372-8377. PubMed
25. U.S. Food and Drug Administration, Center for Drug Evaluation and Research. Atezolizumab BLA 761041 approval letter (urothelial carcinoma). https://www.genentech-access.com/content/dam/gene/accesssolutions/brands/tecentriq/Appeals%20Tips/TECENTRIQ-FDA-Approval-Letter-Metastatic-Urothelial-Carcinoma-First-Line-Therapy.pdf. Accessed September 30, 2017.
26. U.S. Food and Drug Administration, Center for Drug Evaluation and Research. Imfinzi (durvalumab) approval letter. https://www.accessdata.fda.gov/drugsatfda_docs/appletter/2017/761069Orig1s000ltr.pdf. Accessed September 30, 2017.
27. U.S. Food and Drug Administration, Center for Drug Evaluation and Research. Bavencio (avelumab) accelerated approval letter - urothelial carcinoma. https://www.accessdata.fda.gov/drugsatfda_docs/appletter/2017/761078Orig1s000ltr.pdf. Accessed May 16, 2017.
28. U.S. Food and Drug Administration, Center for Drug Evaluation and Research. Atezolizumab BLA 761041 approval letter (NSCLC).
29. U.S. Food and Drug Administration, Center for Drug Evaluation and Research. Bavencio (avelumab) approval letter - Merkel cell carcinoma. https://www.accessdata.fda.gov/drugsatfda_docs/appletter/2017/761049Orig1s000ltr.pdf. Accessed April 27, 2017.
30. U.S. Food and Drug Administration, Center for Drug Evaluation and Research. Atezolizumab BLA 761041 approval letter. https://www.accessdata.fda.gov/drugsatfda_docs/nda/2016/761034Orig1s000Approv.pdf. Accessed April 6, 2017.
31. Voskens CJ, Goldinger SM, Loquai C, et al. The price of tumor control: an analysis of rare side effects of anti-CTLA-4 therapy in metastatic melanoma from the ipilimumab network. PLoS One. 2013;8(1):e53745. doi:10.1371/journal.pone.0053745. PubMed
32. Larkin J, Chiarion-Sileni V, Gonzalez R, et al. Combined Nivolumab and Ipilimumab or Monotherapy in Untreated Melanoma. N Engl J Med. 2015;373(1):23-34. PubMed
33. Michot JM, Bigenwald C, Champiat S, et al. Immune-related adverse events with immune checkpoint blockade: a comprehensive review. Eur J Cancer. 2016;54:139-148. PubMed
34. Villadolid J, Amin A. Immune checkpoint inhibitors in clinical practice: update on management of immune-related toxicities. Transl Lung Cancer Res. 2015;4(5):560-575. PubMed
35. Weber JS, Kahler KC, Hauschild A. Management of immune-related adverse events and kinetics of response with ipilimumab. J Clin Oncol. 2012;30(21):2691-2697. PubMed
36. Kahler KC, Hassel JC, Heinzerling L, et al. Management of side effects of immune checkpoint blockade by anti-CTLA-4 and anti-PD-1 antibodies in metastatic melanoma. J Dtsch Dermatol Ges. 2016;14(7):662-681. PubMed
37. Postow MA. Managing immune checkpoint-blocking antibody side effects. Am Soc Clin Oncol Educ Book. 2015:76-83. PubMed
38. Lacouture ME, Wolchok JD, Yosipovitch G, Kahler KC, Busam KJ, Hauschild A. Ipilimumab in patients with cancer and the management of dermatologic adverse events. J Am Acad Dermatol. 2014;71(1):161-169. PubMed
39. Robert C, Schachter J, Long GV, et al. Pembrolizumab versus Ipilimumab in Advanced Melanoma. N Engl J Med. 2015;372(26):2521-2532. PubMed
40. Weber J. Ipilimumab: controversies in its development, utility and autoimmune adverse events. Cancer Immunol Immunother. 2009;58(5):823-830. PubMed
41. Beck KE, Blansfield JA, Tran KQ, et al. Enterocolitis in patients with cancer after antibody blockade of cytotoxic T-lymphocyte-associated antigen 4. J Clin Oncol. 2006;24(15):2283-2289. PubMed
42. Cancer Therapy Evaluation Program, National Cancer Institute (NCI). Common terminology criteria for adverse events v3.0 (CTCAE). https://ctep.cancer.gov/protocoldevelopment/electronic_applications/docs/ctcaev3.pdf. Accessed April 9, 2017.
43. De Velasco G, Je Y, Bosse D, et al. Comprehensive Meta-analysis of Key Immune-Related Adverse Events from CTLA-4 and PD-1/PD-L1 Inhibitors in Cancer Patients. Cancer Immunol Res. 2017;5(4):312-318. PubMed
44. McCutcheon JL, McClain CM, Puzanov I, Smith TA. Infectious Colitis Associated With Ipilimumab Therapy. Gastroenterology Res. 2014;7(1):28-31. PubMed
45. Berman D, Parker SM, Siegel J, et al. Blockade of cytotoxic T-lymphocyte antigen-4 by ipilimumab results in dysregulation of gastrointestinal immunity in patients with advanced melanoma. Cancer Immun. 2010;10:11-20. PubMed
46. Reynolds K, Ananthakrishnan A, Dougan M, Bardia A. Immune-Related Adverse Events (irAEs) in Cancer Patients. In: McKean SC, Ross JJ, Dressler DD, Scheurer DB, eds. Principles and Practice of Hospital Medicine. 2nd ed. New York: McGraw-Hill Education; 2017.
47. Garcia-Neuer M, Marmarelis ME, Jangi SR, et al. Diagnostic Comparison of CT Scans and Colonoscopy for Immune-Related Colitis in Ipilimumab-Treated Advanced Melanoma Patients. Cancer Immunol Res. 2017;5(4):286-291. PubMed
48. Venditti O, De Lisi D, Caricato M, et al. Ipilimumab and immune-mediated adverse events: a case report of anti-CTLA4 induced ileitis. BMC Cancer. 2015;15:87-91. PubMed
49. Messmer M, Upreti S, Tarabishy Y, et al. Ipilimumab-Induced Enteritis without Colitis: A New Challenge. Case Rep Oncol. 2016;9(3):705-713. PubMed
50. De Felice KM, Gupta A, Rakshit S, et al. Ipilimumab-induced colitis in patients with metastatic melanoma. Melanoma Res. 2015;25(4):321-327. PubMed
51. Baden LR, Swaminathan S, Angarone M, et al. Prevention and Treatment of Cancer-Related Infections, Version 2.2017, NCCN Clinical Practice Guidelines in Oncology. J Natl Compr Canc Newt. 2017;14(7):882-913. PubMed
52. Minor DR, Chin K, Kashani-Sabet M. Infliximab in the treatment of anti-CTLA4 antibody (ipilimumab) induced immune-related colitis. Cancer Biother Radiopharm. 2009;24(3):321-325. PubMed
53. Merrill SP, Reynolds P, Kalra A, Biehl J, Vandivier RW, Mueller SW. Early administration of infliximab for severe ipilimumab-related diarrhea in a critically ill patient. Ann Pharmacother. 2014;48(6):806-810. PubMed
54. Pages C, Gornet JM, Monsel G, et al. Ipilimumab-induced acute severe colitis treated by infliximab. Melanoma Res. 2013;23(3):227-230. PubMed
55. Weber J, Thompson JA, Hamid O, et al. A randomized, double-blind, placebo-controlled, phase II study comparing the tolerability and efficacy of ipilimumab administered with or without prophylactic budesonide in patients with unresectable stage III or IV melanoma. Clin Cancer Res. 2009;15(17):5591-5598. PubMed
56. Horvat TZ, Adel NG, Dung TO, et al. Immune-Related Adverse Events, Need for Systemic Immunosuppression, and Effects on Survival and Time to Treatment Failure in Patients With Melanoma Treated With Ipilimumab at Memorial Sloan Kettering Cancer Center. J Clin Oncol. 2015;33(28):3193-3198. PubMed
57. Cancer Therapy Evaluation Program, National Cancer Institute (NCI). Common terminology criteria for adverse events v3.0 (CTCAE). https://ctep.cancer.gov/protocoldevelopment/electronic_applications/docs/ctcaev3.pdf. Accessed April 9, 2017.
© 2018 Society of Hospital Medicine
Rendered speechless
The approach to clinical conundrums by an expert clinician is revealed through the presentation of an actual patient’s case in an approach typical of a morning report. Similarly to patient care, sequential pieces of information are provided to the clinician, who is unfamiliar with the case. The focus is on the thought processes of both the clinical team caring for the patient and the discussant. The bolded text represents the patient’s case. Each paragraph that follows represents the discussant’s thoughts.
A 63-year-old man at an inpatient rehabilitation center was transferred to an academic tertiary care center for evaluation of slurred speech and episodic confusion. He was accompanied by his wife, who provided the history. Three weeks earlier, the patient had fallen, sustaining a right femur fracture. He underwent surgery and was discharged to rehabilitation on postoperative day 3. During the second week of rehabilitation, he developed a cough and low-grade fevers, which prompted treatment with cefpodoxime for 5 days for presumed pneumonia. The day after completing antimicrobial therapy, he became confused and began to slur his words.
Confusion is a nonspecific symptom that typically has a diffuse or multifocal localization within the cerebral hemispheres and is unlikely to be caused by a single lesion. Slurred speech may accompany global metabolic dysfunction. However, slurred speech typically localizes to the brainstem, the cerebellum in the posterior fossa, the nuclei, or the course of cranial nerves VII, X, or XII, including where these nerves pass through the subarachnoid space.
It seems this patient’s new neurologic symptoms have some relationship to his fall. Long-bone fractures and altered mental status (AMS) lead to consideration of fat emboli, but this syndrome typically presents in the acute period after the fracture. The patient is at risk for a number of complications, related to recent surgery and hospitalization, that could affect the central nervous system (CNS), including systemic infection (possibly with associated meningeal involvement) and venous thromboembolism with concomitant stroke by paradoxical emboli. The episodic nature of the confusion leads to consideration of seizures from structural lesions in the brain. Finally, the circumstances of the fall itself should be explored to determine whether an underlying neurologic dysfunction led to imbalance and gait difficulty.
Over the next 3 days at the inpatient rehabilitation center, the patient’s slurred speech became unintelligible, and he experienced intermittent disorientation to person, place, and time. There was no concomitant fever, dizziness, headache, neck pain, weakness, dyspnea, diarrhea, dysuria, or change in hearing or vision.
Progressive dysarthria argues for an expanding lesion in the posterior fossa, worsening metabolic disturbance, or a problem affecting the cranial nerves (eg, Guillain-Barré syndrome) or neuromuscular junctions (eg, myasthenia gravis). Lack of headache makes a CNS localization less likely, though disorientation must localize to the brain itself. The transient nature of the AMS could signal an ictal phenomenon or a fluctuating toxic or metabolic condition, such as hyperammonemia, drug reaction, or healthcare–acquired delirium.
His past medical history included end-stage liver disease secondary to nonalcoholic steatohepatitis status post transjugular intrahepatic portosystemic shunt (TIPS) procedure three years prior, hepatic encephalopathy, diabetes mellitus type 2, hypertension, previous melanoma excision on his back, and recurrent Clostridium difficile colitis. Two years prior to admission he had been started on an indefinite course of metronidazole 500 mg twice daily without any recurrence. The patient’s other medications were aspirin, furosemide, insulin, lactulose, mirtazapine, pantoprazole, propranolol, spironolactone, and zinc. At the rehabilitation center, he was prescribed oral oxycodone 5 mg as needed every 4 hours for pain. He denied use of tobacco, alcohol, and recreational drugs. He previously worked as a funeral home director and embalmer.
Hyperammonemia and hepatic encephalopathy can present with a fluctuating mental state that often correlates to dietary protein intake or the frequency of bowel movements; the previous TIPS history places the patient at further risk. Use of oxycodone or another narcotic commonly leads to confusion, , especially in patients who are older, have preexisting cognitive decline, or have concomitant medical comorbidities. Mirtazapine and propranolol have been associated more rarely with encephalopathy, and therefore a careful history of adherence, drug interactions, and appropriate dosing should be obtained. Metronidazole is most often associated neurologically with a peripheral neuropathy; however, it is increasingly recognized that some patients can develop a CNS syndrome that features an AMS, which can be severe and accompanied by ataxia, dysarthria, and characteristic brain magnetic resonance imaging (MRI) findings, including hyperintensity surrounding the fourth ventricle on T2-weighted images.
Embalming fluid has a high concentration of formaldehyde, and a recent epidemiologic study suggested a link between formaldehyde exposure and increased risk for amyotrophic lateral sclerosis (ALS). ALS uncommonly presents with isolated dysarthria, but its bulbar form can, usually over a much longer course than is demonstrated here. Finally, the patient’s history of melanoma places him at risk for stroke from hypercoagulability as well as potential brain metastases or carcinomatous meningitis.
Evaluation was initiated at the rehabilitation facility at the onset of the patient’s slurred speech and confusion. Physical examination were negative for focal neurologic deficits, asterixis, and jaundice. Ammonia level was 41 µmol/L (reference range, 11-35 µmol/L). Noncontrast computed tomography (CT) of the head showed no signs of acute infarct or hemorrhage. Symptoms were attributed to hepatic encephalopathy; lactulose was up-titrated to ensure 2 or 3 bowel movements per day, and rifaximin was started.
Hyperammonemia is a cause of non-inflammatory relapsing encephalopathy, but an elevated level is neither a sensitive nor specific indicator of hepatic encephalopathy. Levels of ammonia can fluctuate widely during the day based on the frequency of bowel movements as well as dietary protein intake. In addition, proper handling of samples with prompt delivery to the laboratory is essential to minimize errors.
The ammonia level of 41 µmol/L discovered here is only modestly elevated, but given the patient’s history of TIPS as well as the clinical picture, it is reasonable to aggressively treat hepatic encephalopathy with lactulose to reduce ammonia levels. If he does not improve, an MRI of the brain to exclude a structural lesion and spinal fluid examination looking for inflammatory or infectious conditions would be important next steps. Although CT excludes a large hemorrhage or mass, this screening examination does not visualize many of the findings of the metabolic etiology and the other etiologies under consideration here.
Despite 3 days of therapy for presumed hepatic encephalopathy, the patient’s slurred speech worsened, and he was transferred to an academic tertiary care center for further evaluation. On admission, his temperature was 36.9°C, heart rate was 80 beats per minute, blood pressure was 139/67 mm Hg, respiratory rate was 10 breaths per minute, and oxygen saturation was 99% on room air. He was alert, awake, and oriented to person, place, and time. He was not jaundiced. He exhibited a moderate dysarthria characterized by monotone speech, decreased volume, decreased breath support, and a hoarse vocal quality with intact language function. Motor control of the lips, tongue, and mandible were normal. Motor strength was 5/5 bilaterally in the upper and lower extremities with the exception of right hip flexion, which was 4/5. The patient exhibited mild bilateral dysmetria on finger-to-nose examination, consistent with appendicular ataxia of the upper extremities. Reflexes were depressed throughout, and there was no asterixis. He had 2+ pulses in all extremities and 1+ pitting edema of the right lower extremity to the mid leg. Pulmonary examination revealed inspiratory crackles at the left base. The rest of the examination findings were normal.
The patient’s altered mental state appears to have resolved, and the neurological examination is now mainly characterized by signs that point to the cerebellum. The description of monotone speech typically refers to loss of prosody, the variable stress or intonation of speech, which is characteristic of a cerebellar speech pattern. The hoarseness should be explored to determine if it is a feature of the patient’s speech or is a separate process. Hoarseness may involve the vocal cord and therefore, potentially, cranial nerve X or its nuclei in the brainstem. The appendicular ataxia of the limbs points definitively to the cerebellar hemispheres or their pathways through the brainstem.
Unilateral lower extremity edema, especially in the context of a recent fracture, raises the possibility of deep vein thrombosis. If this patient has a right-to-left intracardiac or intrapulmonary shunt, embolization could lead to an ischemic stroke of the brainstem or cerebellum, potentially causing dysarthria.
Laboratory evaluation revealed hemoglobin level of 10.9 g/dL, white blood cell count of 5.3 × 10 9 /L, platelet count of 169 × 10 9 /L, glucose level of 177 mg/dL, corrected calcium level of 9.0 mg/dL, sodium level of 135 mmol/L, bicarbonate level of 30 mmol/L, creatinine level of 0.9 mg/dL, total bilirubin level of 1.3 mg/dL, direct bilirubin level of 0.4 mg/dL, alkaline phosphatase level of 503 U/L, alanine aminotransferase level of 12 U/L, aspartate aminotransferase level of 33 U/L, ammonia level of 49 µmol/L (range, 0-30 µ mol/L), international normalized ratio of 1.2, and troponin level of <0.01 ng/mL. Electrocardiogram showed normal sinus rhythm.
Some patients with bacterial meningitis do not have a leukocytosis, but patients with meningitis caused by seeding from a systemic infection nearly always do. In this patient’s case, lack of a leukocytosis makes bacterial meningitis very unlikely. The elevated alkaline phosphatase level is expected, as this level peaks about 3 weeks after a long-bone fracture and returns to normal over a few months.
Non-contrast CT scan of the head performed on admission demonstrated no large vessel cortical-based infarct, intracranial hemorrhage, hydrocephalus, mass effect, midline shift, or extra-axial fluid. There was mild cortical atrophy as well as very mild periventricular white matter hypodensity.
The atrophy and mild white-matter hypodensities seen on repeat noncontrast CT are nonspecific for any particular entity in this patient’s age group. MRI is more effective in evaluating toxic encephalopathies, including metronidazole toxicity or Wernicke encephalopathy, and in characterizing small infarcts or inflammatory conditions of the brainstem and cerebellum, which are poorly evaluated by CT due to the bone surrounded space of the posterior fossa. An urgent lumbar puncture is not necessary due to the slow pace of illness, lack of fever, nuchal rigidity, or serum elevated white blood cell count. Rather, performing MRI should be prioritized. If MRI is nondiagnostic, then spinal fluid should be evaluated for evidence of an infectious, autoimmune, paraneoplastic, or neoplastic process.
MRI was subsequently performed. It showed symmetric abnormal T2 hyperintensities involving dentate nuclei (Figure 1), left inferior olivary nuclei (Figure 2), restiform bodies, pontine tegmentum, superior cerebellar peduncles, oculomotor nuclei, and subthalamic nuclei. The most prominent hyperintensity was in the dentate nuclei.

The clinical and radiographic features confirm a diagnosis of metronidazole-associated CNS neurotoxicity. The reason for the predilection for edema in these specific areas of the brainstem and midline cerebellum is unclear but likely is related to selective neuronal vulnerability in these structures. The treatment is to stop metronidazole. In addition, the fluctuating mental status should be evaluated with electroencephalogram to ensure concomitant seizures are not occurring.
These MRI findings were consistent with metronidazole toxicity. Metronidazole was discontinued, and 2 days later the patient’s speech improved. Two weeks after medication discontinuation, his speech was normal. There were no more episodes of confusion.
DISCUSSION
Metronidazole was originally developed in France during the 1950s as an anti-parasitic medication to treat trichomonas infections. In 1962, its antibacterial properties were discovered after a patient with bacterial gingivitis improved while taking metronidazole for treatment of Trichomonas vaginalis.1 Since that time metronidazole has become a first-line treatment for anaerobic bacteria and is now recommended by the Infectious Diseases Society of America2 and the American College of Gastroenterology3 as a first-line therapy for mild and moderate C difficile infections.
Common side effects of metronidazole are nausea, vomiting, decreased appetite, diarrhea, headaches, peripheral neuropathy, and metallic taste; less common is CNS toxicity. Although the incidence of CNS toxicity is unknown, a systematic review of the literature found 64 cases reported between 1965 and 2011.4 CNS toxicity most often occurs between the fifth and sixth decades of life, and about two thirds of the people affected are men.4 CNS adverse effects characteristically fall into 4 categories: cerebellar dysfunction (eg, ataxia, dysarthria, dysmetria, nystagmus; 75%), AMS (33%), seizures (13%), and a combination of the first 3 categories.4
The exact mechanism of metronidazole CNS toxicity is unknown, but vasogenic or cytotoxic edema may be involved.5,6 Other potential etiologies are neural protein inhibition, reversible mitochondrial dysfunction, and modifications of the inhibitory neurotransmitter gamma-aminobutyric acid receptor in the cerebellum.7,8 There is no known genetic predisposition. Although the risk for CNS toxicity traditionally is thought to correlate with therapy duration and cumulative dose,7,9 in 2011 a systemic review found no significant correlation.4 In fact, 26% of patients with CNS toxicity were treated with metronidazole for less than 1 week at time of diagnosis.4
Brain CT is typically normal. On brain MRI, lesions most commonly appear as bilateral symmetric T2 hyperintensities, most often in the cerebellar dentate nuclei (85%) and less often in the midbrain (55%), the splenium of the corpus callosum (50%), the pons (35%), and the medulla (30%).4,10 Radiographic changes have been noted as early as 3 days after symptom onset. Based on damage severity and area affected (white or gray matter), vasogenic edema and cytotoxic edema may in combination be contributing to MRI abnormalities.6,10 Hyperintensities of the bilateral dentate nuclei can help in distinguishing metronidazole-induced encephalopathy from other potential disease processes, such as Wernicke encephalopathy.10
The prognosis for patients with metronidazole-induced neurotoxicity is favorable if metronidazole is discontinued. Approximately two-thirds of patients will have complete resolution of symptoms, which is more commonly observed when patients present with seizures or altered mental status. Approximately one-third will show partial improvement, particularly if the symptoms are due to cerebellar dysfunction. It is rare to experience permanent damage or death.4 Neurologic recovery usually begins within a week after medication discontinuation but may take months for complete recovery to occur.6,8,9,11 Follow-up imaging typically shows reversal of the original lesions, but this does not always correlate with symptom improvement.4,10
Despite its frequent use and long history, metronidazole can have potentially severe toxicity. When patients who are taking this medication present with new signs and symptoms of CNS dysfunction, hospitalists should include metronidazole CNS toxicity in the differential diagnosis and, if they suspect toxicity, have a brain MRI performed. Hospitalists often prescribe metronidazole because of the increasing number of patients being discharged from acute-care hospitals with a diagnosis of C difficile colitis.12 Brain MRI remains the imaging modality of choice for diagnosis. Discontinuation of metronidazole is usually salutary in reversing symptoms. Being keenly aware of this toxicity will help clinicians avoid being rendered speechless by a patient rendered speechless.
TEACHING POINTS
CNS toxicity is a rare but potentially devastating side effect of metronidazole exposure.
Metronidazole CNS adverse effects characteristically fall under 4 categories:
○ Cerebellar dysfunction, such as ataxia, dysarthria, dysmetria, or nystagmus (75%).
○ AMS (33%).
○ Seizures (13%).
○ A combination of the first 3 categories.
- Typically lesions indicating metronidazole toxicity on brain MRI are bilateral symmetric hyperintensities on T2-weighted imaging in the cerebellar dentate nuclei, corpus callosum, midbrain, pons, or medulla.
- Treatment of CNS toxicity is metronidazole discontinuation, which results in a high rate of symptom resolution.
Disclosure
Nothing to report.
1. Samuelson J. Why metronidazole is active against both bacteria and parasites. Antimicrob Agents Chemother. 1999;43(7):1533-1541. PubMed
2. Cohen SH, Gerding DN, Johnson S, et al; Society for Healthcare Epidemiology of America; Infectious Diseases Society of America. Clinical practice guidelines for Clostridium difficile infection in adults: 2010 update by the Society for Healthcare Epidemiology of America (SHEA) and the Infectious Diseases Society of America (IDSA). Infect Control Hosp Epidemiol. 2010;31(5):431-455. PubMed
3. Surawicz CM, Brandt LJ, Binion DG, et al. Guidelines for diagnosis, treatment, and prevention of Clostridium difficile infections. Am J Gastroenterol. 2013;108(4):478-498. PubMed
4. Kuriyama A, Jackson JL, Doi A, Kamiya T. Metronidazole-induced central nervous system toxicity: a systemic review. Clin Neuropharmacol. 2011;34(6):241-247. PubMed
5. Graves TD, Condon M, Loucaidou M, Perry RJ. Reversible metronidazole-induced cerebellar toxicity in a multiple transplant recipient. J Neurol Sci. 2009;285(1-2):238-240. PubMed
6. Kim DW, Park JM, Yoon BW, Baek MJ, Kim JE, Kim S. Metronidazole-induced encephalopathy. J Neurol Sci. 2004;224(1-2):107-111. PubMed
7. Park KI, Chung JM, Kim JY. Metronidazole neurotoxicity: sequential neuroaxis involvement. Neurol India. 2011;59(1):104-107. PubMed
8. Patel K, Green-Hopkins I, Lu S, Tunkel AR. Cerebellar ataxia following prolonged use of metronidazole: case report and literature review. Int J Infect Dis. 2008;12(6):e111-e114. PubMed
9. Chandak S, Agarwal A, Shukla A, Joon P. A case report of metronidazole induced neurotoxicity in liver abscess patient and the usefulness of MRI for its diagnosis. J Clin Diagn Res. 2016;10(1):TD06-TD07. PubMed
10. Kim E, Na DG, Kim EY, Kim JH, Son KR, Chang KH. MR imaging of metronidazole-induced encephalopathy: lesion distribution and diffusion-weighted imaging findings. AJNR Am J Neuroradiol. 2007;28(9):1652-1658. PubMed
11. Chacko J, Pramod K, Sinha S, et al. Clinical, neuroimaging and pathological features of 5-nitroimidazole-induced encephalo-neuropathy in two patients: insights into possible pathogenesis. Neurol India. 2011;59(5):743-747. PubMed
12. Peery AF, Dellon ES, Lund J, et al. Burden of gastrointestinal disease in the United States: 2012 update. Gastroenterology. 2012;143(5):1179-1187.e1-e3. PubMed
The approach to clinical conundrums by an expert clinician is revealed through the presentation of an actual patient’s case in an approach typical of a morning report. Similarly to patient care, sequential pieces of information are provided to the clinician, who is unfamiliar with the case. The focus is on the thought processes of both the clinical team caring for the patient and the discussant. The bolded text represents the patient’s case. Each paragraph that follows represents the discussant’s thoughts.
A 63-year-old man at an inpatient rehabilitation center was transferred to an academic tertiary care center for evaluation of slurred speech and episodic confusion. He was accompanied by his wife, who provided the history. Three weeks earlier, the patient had fallen, sustaining a right femur fracture. He underwent surgery and was discharged to rehabilitation on postoperative day 3. During the second week of rehabilitation, he developed a cough and low-grade fevers, which prompted treatment with cefpodoxime for 5 days for presumed pneumonia. The day after completing antimicrobial therapy, he became confused and began to slur his words.
Confusion is a nonspecific symptom that typically has a diffuse or multifocal localization within the cerebral hemispheres and is unlikely to be caused by a single lesion. Slurred speech may accompany global metabolic dysfunction. However, slurred speech typically localizes to the brainstem, the cerebellum in the posterior fossa, the nuclei, or the course of cranial nerves VII, X, or XII, including where these nerves pass through the subarachnoid space.
It seems this patient’s new neurologic symptoms have some relationship to his fall. Long-bone fractures and altered mental status (AMS) lead to consideration of fat emboli, but this syndrome typically presents in the acute period after the fracture. The patient is at risk for a number of complications, related to recent surgery and hospitalization, that could affect the central nervous system (CNS), including systemic infection (possibly with associated meningeal involvement) and venous thromboembolism with concomitant stroke by paradoxical emboli. The episodic nature of the confusion leads to consideration of seizures from structural lesions in the brain. Finally, the circumstances of the fall itself should be explored to determine whether an underlying neurologic dysfunction led to imbalance and gait difficulty.
Over the next 3 days at the inpatient rehabilitation center, the patient’s slurred speech became unintelligible, and he experienced intermittent disorientation to person, place, and time. There was no concomitant fever, dizziness, headache, neck pain, weakness, dyspnea, diarrhea, dysuria, or change in hearing or vision.
Progressive dysarthria argues for an expanding lesion in the posterior fossa, worsening metabolic disturbance, or a problem affecting the cranial nerves (eg, Guillain-Barré syndrome) or neuromuscular junctions (eg, myasthenia gravis). Lack of headache makes a CNS localization less likely, though disorientation must localize to the brain itself. The transient nature of the AMS could signal an ictal phenomenon or a fluctuating toxic or metabolic condition, such as hyperammonemia, drug reaction, or healthcare–acquired delirium.
His past medical history included end-stage liver disease secondary to nonalcoholic steatohepatitis status post transjugular intrahepatic portosystemic shunt (TIPS) procedure three years prior, hepatic encephalopathy, diabetes mellitus type 2, hypertension, previous melanoma excision on his back, and recurrent Clostridium difficile colitis. Two years prior to admission he had been started on an indefinite course of metronidazole 500 mg twice daily without any recurrence. The patient’s other medications were aspirin, furosemide, insulin, lactulose, mirtazapine, pantoprazole, propranolol, spironolactone, and zinc. At the rehabilitation center, he was prescribed oral oxycodone 5 mg as needed every 4 hours for pain. He denied use of tobacco, alcohol, and recreational drugs. He previously worked as a funeral home director and embalmer.
Hyperammonemia and hepatic encephalopathy can present with a fluctuating mental state that often correlates to dietary protein intake or the frequency of bowel movements; the previous TIPS history places the patient at further risk. Use of oxycodone or another narcotic commonly leads to confusion, , especially in patients who are older, have preexisting cognitive decline, or have concomitant medical comorbidities. Mirtazapine and propranolol have been associated more rarely with encephalopathy, and therefore a careful history of adherence, drug interactions, and appropriate dosing should be obtained. Metronidazole is most often associated neurologically with a peripheral neuropathy; however, it is increasingly recognized that some patients can develop a CNS syndrome that features an AMS, which can be severe and accompanied by ataxia, dysarthria, and characteristic brain magnetic resonance imaging (MRI) findings, including hyperintensity surrounding the fourth ventricle on T2-weighted images.
Embalming fluid has a high concentration of formaldehyde, and a recent epidemiologic study suggested a link between formaldehyde exposure and increased risk for amyotrophic lateral sclerosis (ALS). ALS uncommonly presents with isolated dysarthria, but its bulbar form can, usually over a much longer course than is demonstrated here. Finally, the patient’s history of melanoma places him at risk for stroke from hypercoagulability as well as potential brain metastases or carcinomatous meningitis.
Evaluation was initiated at the rehabilitation facility at the onset of the patient’s slurred speech and confusion. Physical examination were negative for focal neurologic deficits, asterixis, and jaundice. Ammonia level was 41 µmol/L (reference range, 11-35 µmol/L). Noncontrast computed tomography (CT) of the head showed no signs of acute infarct or hemorrhage. Symptoms were attributed to hepatic encephalopathy; lactulose was up-titrated to ensure 2 or 3 bowel movements per day, and rifaximin was started.
Hyperammonemia is a cause of non-inflammatory relapsing encephalopathy, but an elevated level is neither a sensitive nor specific indicator of hepatic encephalopathy. Levels of ammonia can fluctuate widely during the day based on the frequency of bowel movements as well as dietary protein intake. In addition, proper handling of samples with prompt delivery to the laboratory is essential to minimize errors.
The ammonia level of 41 µmol/L discovered here is only modestly elevated, but given the patient’s history of TIPS as well as the clinical picture, it is reasonable to aggressively treat hepatic encephalopathy with lactulose to reduce ammonia levels. If he does not improve, an MRI of the brain to exclude a structural lesion and spinal fluid examination looking for inflammatory or infectious conditions would be important next steps. Although CT excludes a large hemorrhage or mass, this screening examination does not visualize many of the findings of the metabolic etiology and the other etiologies under consideration here.
Despite 3 days of therapy for presumed hepatic encephalopathy, the patient’s slurred speech worsened, and he was transferred to an academic tertiary care center for further evaluation. On admission, his temperature was 36.9°C, heart rate was 80 beats per minute, blood pressure was 139/67 mm Hg, respiratory rate was 10 breaths per minute, and oxygen saturation was 99% on room air. He was alert, awake, and oriented to person, place, and time. He was not jaundiced. He exhibited a moderate dysarthria characterized by monotone speech, decreased volume, decreased breath support, and a hoarse vocal quality with intact language function. Motor control of the lips, tongue, and mandible were normal. Motor strength was 5/5 bilaterally in the upper and lower extremities with the exception of right hip flexion, which was 4/5. The patient exhibited mild bilateral dysmetria on finger-to-nose examination, consistent with appendicular ataxia of the upper extremities. Reflexes were depressed throughout, and there was no asterixis. He had 2+ pulses in all extremities and 1+ pitting edema of the right lower extremity to the mid leg. Pulmonary examination revealed inspiratory crackles at the left base. The rest of the examination findings were normal.
The patient’s altered mental state appears to have resolved, and the neurological examination is now mainly characterized by signs that point to the cerebellum. The description of monotone speech typically refers to loss of prosody, the variable stress or intonation of speech, which is characteristic of a cerebellar speech pattern. The hoarseness should be explored to determine if it is a feature of the patient’s speech or is a separate process. Hoarseness may involve the vocal cord and therefore, potentially, cranial nerve X or its nuclei in the brainstem. The appendicular ataxia of the limbs points definitively to the cerebellar hemispheres or their pathways through the brainstem.
Unilateral lower extremity edema, especially in the context of a recent fracture, raises the possibility of deep vein thrombosis. If this patient has a right-to-left intracardiac or intrapulmonary shunt, embolization could lead to an ischemic stroke of the brainstem or cerebellum, potentially causing dysarthria.
Laboratory evaluation revealed hemoglobin level of 10.9 g/dL, white blood cell count of 5.3 × 10 9 /L, platelet count of 169 × 10 9 /L, glucose level of 177 mg/dL, corrected calcium level of 9.0 mg/dL, sodium level of 135 mmol/L, bicarbonate level of 30 mmol/L, creatinine level of 0.9 mg/dL, total bilirubin level of 1.3 mg/dL, direct bilirubin level of 0.4 mg/dL, alkaline phosphatase level of 503 U/L, alanine aminotransferase level of 12 U/L, aspartate aminotransferase level of 33 U/L, ammonia level of 49 µmol/L (range, 0-30 µ mol/L), international normalized ratio of 1.2, and troponin level of <0.01 ng/mL. Electrocardiogram showed normal sinus rhythm.
Some patients with bacterial meningitis do not have a leukocytosis, but patients with meningitis caused by seeding from a systemic infection nearly always do. In this patient’s case, lack of a leukocytosis makes bacterial meningitis very unlikely. The elevated alkaline phosphatase level is expected, as this level peaks about 3 weeks after a long-bone fracture and returns to normal over a few months.
Non-contrast CT scan of the head performed on admission demonstrated no large vessel cortical-based infarct, intracranial hemorrhage, hydrocephalus, mass effect, midline shift, or extra-axial fluid. There was mild cortical atrophy as well as very mild periventricular white matter hypodensity.
The atrophy and mild white-matter hypodensities seen on repeat noncontrast CT are nonspecific for any particular entity in this patient’s age group. MRI is more effective in evaluating toxic encephalopathies, including metronidazole toxicity or Wernicke encephalopathy, and in characterizing small infarcts or inflammatory conditions of the brainstem and cerebellum, which are poorly evaluated by CT due to the bone surrounded space of the posterior fossa. An urgent lumbar puncture is not necessary due to the slow pace of illness, lack of fever, nuchal rigidity, or serum elevated white blood cell count. Rather, performing MRI should be prioritized. If MRI is nondiagnostic, then spinal fluid should be evaluated for evidence of an infectious, autoimmune, paraneoplastic, or neoplastic process.
MRI was subsequently performed. It showed symmetric abnormal T2 hyperintensities involving dentate nuclei (Figure 1), left inferior olivary nuclei (Figure 2), restiform bodies, pontine tegmentum, superior cerebellar peduncles, oculomotor nuclei, and subthalamic nuclei. The most prominent hyperintensity was in the dentate nuclei.
The clinical and radiographic features confirm a diagnosis of metronidazole-associated CNS neurotoxicity. The reason for the predilection for edema in these specific areas of the brainstem and midline cerebellum is unclear but likely is related to selective neuronal vulnerability in these structures. The treatment is to stop metronidazole. In addition, the fluctuating mental status should be evaluated with electroencephalogram to ensure concomitant seizures are not occurring.
These MRI findings were consistent with metronidazole toxicity. Metronidazole was discontinued, and 2 days later the patient’s speech improved. Two weeks after medication discontinuation, his speech was normal. There were no more episodes of confusion.
DISCUSSION
Metronidazole was originally developed in France during the 1950s as an anti-parasitic medication to treat trichomonas infections. In 1962, its antibacterial properties were discovered after a patient with bacterial gingivitis improved while taking metronidazole for treatment of Trichomonas vaginalis.1 Since that time metronidazole has become a first-line treatment for anaerobic bacteria and is now recommended by the Infectious Diseases Society of America2 and the American College of Gastroenterology3 as a first-line therapy for mild and moderate C difficile infections.
Common side effects of metronidazole are nausea, vomiting, decreased appetite, diarrhea, headaches, peripheral neuropathy, and metallic taste; less common is CNS toxicity. Although the incidence of CNS toxicity is unknown, a systematic review of the literature found 64 cases reported between 1965 and 2011.4 CNS toxicity most often occurs between the fifth and sixth decades of life, and about two thirds of the people affected are men.4 CNS adverse effects characteristically fall into 4 categories: cerebellar dysfunction (eg, ataxia, dysarthria, dysmetria, nystagmus; 75%), AMS (33%), seizures (13%), and a combination of the first 3 categories.4
The exact mechanism of metronidazole CNS toxicity is unknown, but vasogenic or cytotoxic edema may be involved.5,6 Other potential etiologies are neural protein inhibition, reversible mitochondrial dysfunction, and modifications of the inhibitory neurotransmitter gamma-aminobutyric acid receptor in the cerebellum.7,8 There is no known genetic predisposition. Although the risk for CNS toxicity traditionally is thought to correlate with therapy duration and cumulative dose,7,9 in 2011 a systemic review found no significant correlation.4 In fact, 26% of patients with CNS toxicity were treated with metronidazole for less than 1 week at time of diagnosis.4
Brain CT is typically normal. On brain MRI, lesions most commonly appear as bilateral symmetric T2 hyperintensities, most often in the cerebellar dentate nuclei (85%) and less often in the midbrain (55%), the splenium of the corpus callosum (50%), the pons (35%), and the medulla (30%).4,10 Radiographic changes have been noted as early as 3 days after symptom onset. Based on damage severity and area affected (white or gray matter), vasogenic edema and cytotoxic edema may in combination be contributing to MRI abnormalities.6,10 Hyperintensities of the bilateral dentate nuclei can help in distinguishing metronidazole-induced encephalopathy from other potential disease processes, such as Wernicke encephalopathy.10
The prognosis for patients with metronidazole-induced neurotoxicity is favorable if metronidazole is discontinued. Approximately two-thirds of patients will have complete resolution of symptoms, which is more commonly observed when patients present with seizures or altered mental status. Approximately one-third will show partial improvement, particularly if the symptoms are due to cerebellar dysfunction. It is rare to experience permanent damage or death.4 Neurologic recovery usually begins within a week after medication discontinuation but may take months for complete recovery to occur.6,8,9,11 Follow-up imaging typically shows reversal of the original lesions, but this does not always correlate with symptom improvement.4,10
Despite its frequent use and long history, metronidazole can have potentially severe toxicity. When patients who are taking this medication present with new signs and symptoms of CNS dysfunction, hospitalists should include metronidazole CNS toxicity in the differential diagnosis and, if they suspect toxicity, have a brain MRI performed. Hospitalists often prescribe metronidazole because of the increasing number of patients being discharged from acute-care hospitals with a diagnosis of C difficile colitis.12 Brain MRI remains the imaging modality of choice for diagnosis. Discontinuation of metronidazole is usually salutary in reversing symptoms. Being keenly aware of this toxicity will help clinicians avoid being rendered speechless by a patient rendered speechless.
TEACHING POINTS
CNS toxicity is a rare but potentially devastating side effect of metronidazole exposure.
Metronidazole CNS adverse effects characteristically fall under 4 categories:
○ Cerebellar dysfunction, such as ataxia, dysarthria, dysmetria, or nystagmus (75%).
○ AMS (33%).
○ Seizures (13%).
○ A combination of the first 3 categories.
- Typically lesions indicating metronidazole toxicity on brain MRI are bilateral symmetric hyperintensities on T2-weighted imaging in the cerebellar dentate nuclei, corpus callosum, midbrain, pons, or medulla.
- Treatment of CNS toxicity is metronidazole discontinuation, which results in a high rate of symptom resolution.
Disclosure
Nothing to report.
1. Samuelson J. Why metronidazole is active against both bacteria and parasites. Antimicrob Agents Chemother. 1999;43(7):1533-1541. PubMed
2. Cohen SH, Gerding DN, Johnson S, et al; Society for Healthcare Epidemiology of America; Infectious Diseases Society of America. Clinical practice guidelines for Clostridium difficile infection in adults: 2010 update by the Society for Healthcare Epidemiology of America (SHEA) and the Infectious Diseases Society of America (IDSA). Infect Control Hosp Epidemiol. 2010;31(5):431-455. PubMed
3. Surawicz CM, Brandt LJ, Binion DG, et al. Guidelines for diagnosis, treatment, and prevention of Clostridium difficile infections. Am J Gastroenterol. 2013;108(4):478-498. PubMed
4. Kuriyama A, Jackson JL, Doi A, Kamiya T. Metronidazole-induced central nervous system toxicity: a systemic review. Clin Neuropharmacol. 2011;34(6):241-247. PubMed
5. Graves TD, Condon M, Loucaidou M, Perry RJ. Reversible metronidazole-induced cerebellar toxicity in a multiple transplant recipient. J Neurol Sci. 2009;285(1-2):238-240. PubMed
6. Kim DW, Park JM, Yoon BW, Baek MJ, Kim JE, Kim S. Metronidazole-induced encephalopathy. J Neurol Sci. 2004;224(1-2):107-111. PubMed
7. Park KI, Chung JM, Kim JY. Metronidazole neurotoxicity: sequential neuroaxis involvement. Neurol India. 2011;59(1):104-107. PubMed
8. Patel K, Green-Hopkins I, Lu S, Tunkel AR. Cerebellar ataxia following prolonged use of metronidazole: case report and literature review. Int J Infect Dis. 2008;12(6):e111-e114. PubMed
9. Chandak S, Agarwal A, Shukla A, Joon P. A case report of metronidazole induced neurotoxicity in liver abscess patient and the usefulness of MRI for its diagnosis. J Clin Diagn Res. 2016;10(1):TD06-TD07. PubMed
10. Kim E, Na DG, Kim EY, Kim JH, Son KR, Chang KH. MR imaging of metronidazole-induced encephalopathy: lesion distribution and diffusion-weighted imaging findings. AJNR Am J Neuroradiol. 2007;28(9):1652-1658. PubMed
11. Chacko J, Pramod K, Sinha S, et al. Clinical, neuroimaging and pathological features of 5-nitroimidazole-induced encephalo-neuropathy in two patients: insights into possible pathogenesis. Neurol India. 2011;59(5):743-747. PubMed
12. Peery AF, Dellon ES, Lund J, et al. Burden of gastrointestinal disease in the United States: 2012 update. Gastroenterology. 2012;143(5):1179-1187.e1-e3. PubMed
© 2017 Society of Hospital Medicine
An Automated Electronic Tool to Assess the Risk of 30-Day Readmission: Validation of Predictive Performance
From the Divisions of Hospital Medicine (Drs. Dawson, Chirila, Bhide, and Burton) and Biomedical Statistics and Informatics (Ms. Thomas), Mayo Clinic, Jacksonville, FL, and the Division of Hospital Medicine, Mayo Clinic, Phoenix, AZ (Dr. Cannon).
Abstract
- Objective: To validate an electronic tool created to identify inpatients who are at risk of readmission within 30 days and quantify the predictive performance of the readmission risk score (RRS).
- Methods: Retrospective cohort study including inpa-tients who were discharged between 1 Nov 2012 and 31 Dec 2012. The ability of the RRS to discriminate between those who did and did not have a 30-day urgent readmission was quantified by the c statistic. Calibration was assessed by plotting the observed and predicted probability of 30-day urgent readmission. Predicted probabilities were obtained from generalized estimating equations, clustering on patient.
- Results: Of 1689 hospital inpatient discharges (1515 patients), 159 (9.4%) had a 30-day urgent readmission. The RRS had some discriminative ability (c statistic: 0.612; 95% confidence interval: 0.570–0.655) and good calibration.
- Conclusions: Our study shows that the RRS has some discriminative ability. The automated tool can be used to estimate the probability of a 30-day urgent readmission.
Hospital readmissions are increasingly scrutinized by the Center for Medicare and Medicaid Services and other payers due to their frequency and high cost. It is estimated that up to 25% of all patients discharged from acute care hospitals are readmitted within 30 days [1]. To address this problem, the Center for Medicare and Medicaid Services is using these rates as one of the benchmarks for quality for hospitals and health care organizations and has begun to assess penalties to those institutions with the highest rates. This scrutiny and the desire for better patient care transitions has resulted in most hospitals implementing various initiatives to reduce potentially avoidable readmissions.
Multiple interventions have been shown to reduce readmissions [2,3]. These interventions have varying effectiveness and are often labor intensive and thus costly to the institutions implementing them. In fact, no one intervention has been shown to be effective alone [4], and it may take several concurrent interventions targeting the highest risk patients to improve transitions of care at discharge that result in reduced readmissions. Many experts do recommend risk stratifying patients in order to target interventions to the highest risk patients for effective use of resources [5,6]. Several risk factor assessments have been proposed with varying success [7–13]. Multiple factors can limit the effectiveness of these risk stratification profiles. They may have low sensitivity and specificity, be based solely on retrospective data, be limited to certain populations, or be created from administrative data only without taking psychosocial factors into consideration [14].
An effective risk assessment ideally would encompass multiple known risk factors including certain comorbidities such as malignancy and heart failure, psychosocial factors such as health literacy and social support, and administrative data including payment source and demographics. All of these have been shown in prior studies to contribute to readmissions [7–13]. In addition, availability of the assessment early in the hospitalization would allow for interventions throughout the hospital stay to mitigate the effect of these factors where possible. To address these needs, our institution formed a readmission task force in January 2010 to review published literature on hospital 30-day readmissions and create a readmission risk score (RRS). The aim of this study was to quantify the predictive performance of the RRS after it was first implemented into the electronic medical record (EMR) in November 2012.
Methods
Study Design and Cohort
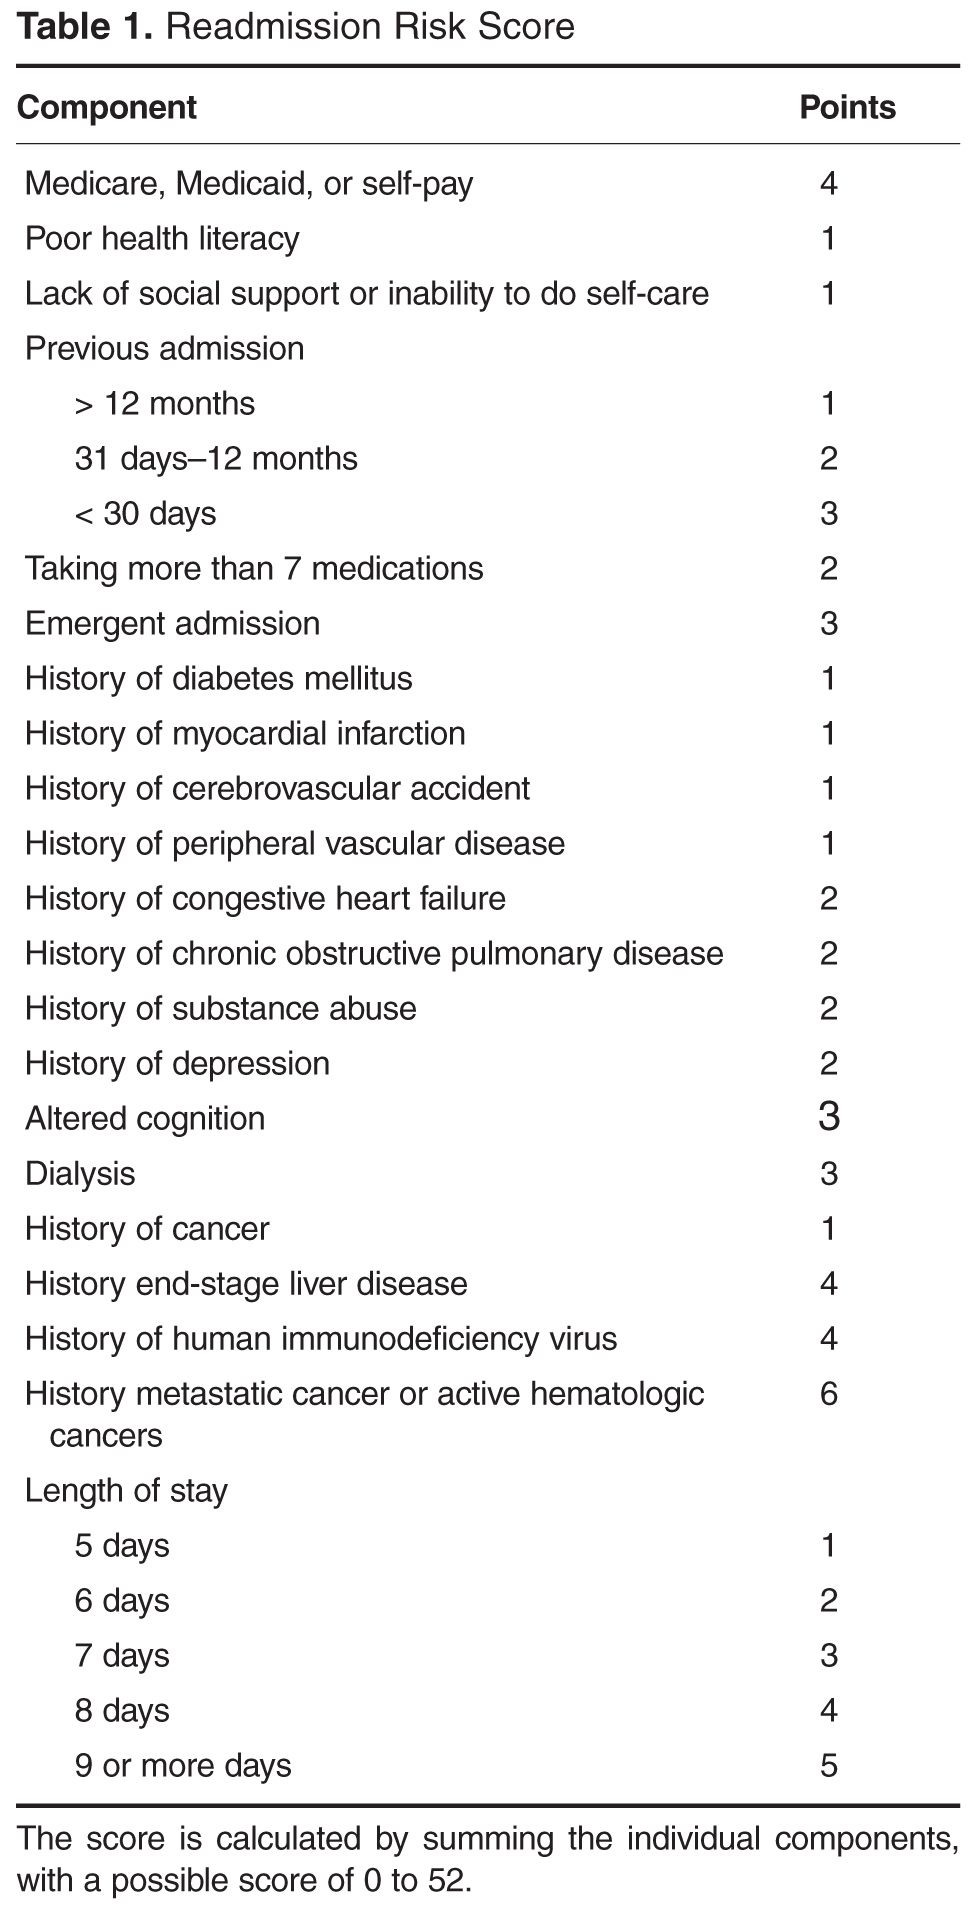
All consecutive adult inpatients who were discharged between 1 November 2012 and 31 December 2012 were included in this retrospective cohort study. This narrow time frame corresponded to the period from RRS tool implementation to the start of readmission interventions. We excluded hospitalizations if the patient died in the hospital.
Outcome Measures
The primary outcome was a 30-day urgent readmission, which included readmissions categorized as either emergency, urgent, or semi-urgent. Secondary outcomes included any 30-day readmission and 30-day death. Only readmissions to Mayo Clinic were examined.
Predictors
In collaboration with the information technology department, an algorithm was written to extract data from the EMR for each patient within 24 hours of admission to the hospital. This data was retrieved from existing repositories of patient information, such as demographic information, payer source, medication list, problem list, and past medical history. In addition, each patient was interviewed by a nurse at the time of admission, and the nurse completed an “admission profile” in the EMR that confirmed or entered past medical history, medications, social support at home, depression symptoms, and learning styles, among other information (Table 1). The algorithm was able to extract data from this evaluation also, so that each element of the risk score was correlated to at least one data source in the EMR. The algorithm then assigned the correct value to each element, and the total score was electronically calculated and placed in a discrete cell in each patient’s record. The algorithm was automatically run again 48 hours after the initial scoring in order to assure completeness of the information. If the patient had a length of stay greater than 5 days, an additional score was generated to include the length of stay component.
Statistical Analysis
The predictive performance of the RRS was assessed by evaluating the discrimination and calibration. Discrimination is the ability of the RRS to separate those who had a 30-day urgent readmission and those who did not. Discrimination was quantified by the c statistic, which is equivalent to the area under the receiver operating characteristic curve in this study owing to the use of binary endpoints. A c statistic of 1.0 would indicate that the RRS perfectly predicts 30-day urgent readmission while a c statistic of 0.5 would indicate the RRS has no apparent accuracy in predicting 30-day urgent readmission. Calibration assesses how closely predicted outcomes agree with observed outcomes. The predicted probability of 30-day urgent readmission was estimated utilizing a generalized estimating equation model, clustering on patient, with RRS as the only predictor variable. Inpatient discharges were divided into deciles of the predicted probabilities for 30-day urgent readmission. Agreement of the predicted and observed outcomes was displayed graphically according to decile of the predicted outcomes. All analyses were performed using SAS (version 9.3, SAS Institute, Cary, NC) and R statistical software (version 3.1.1, R Foundation for Statistical Computing, Vienna, Austria).
Results
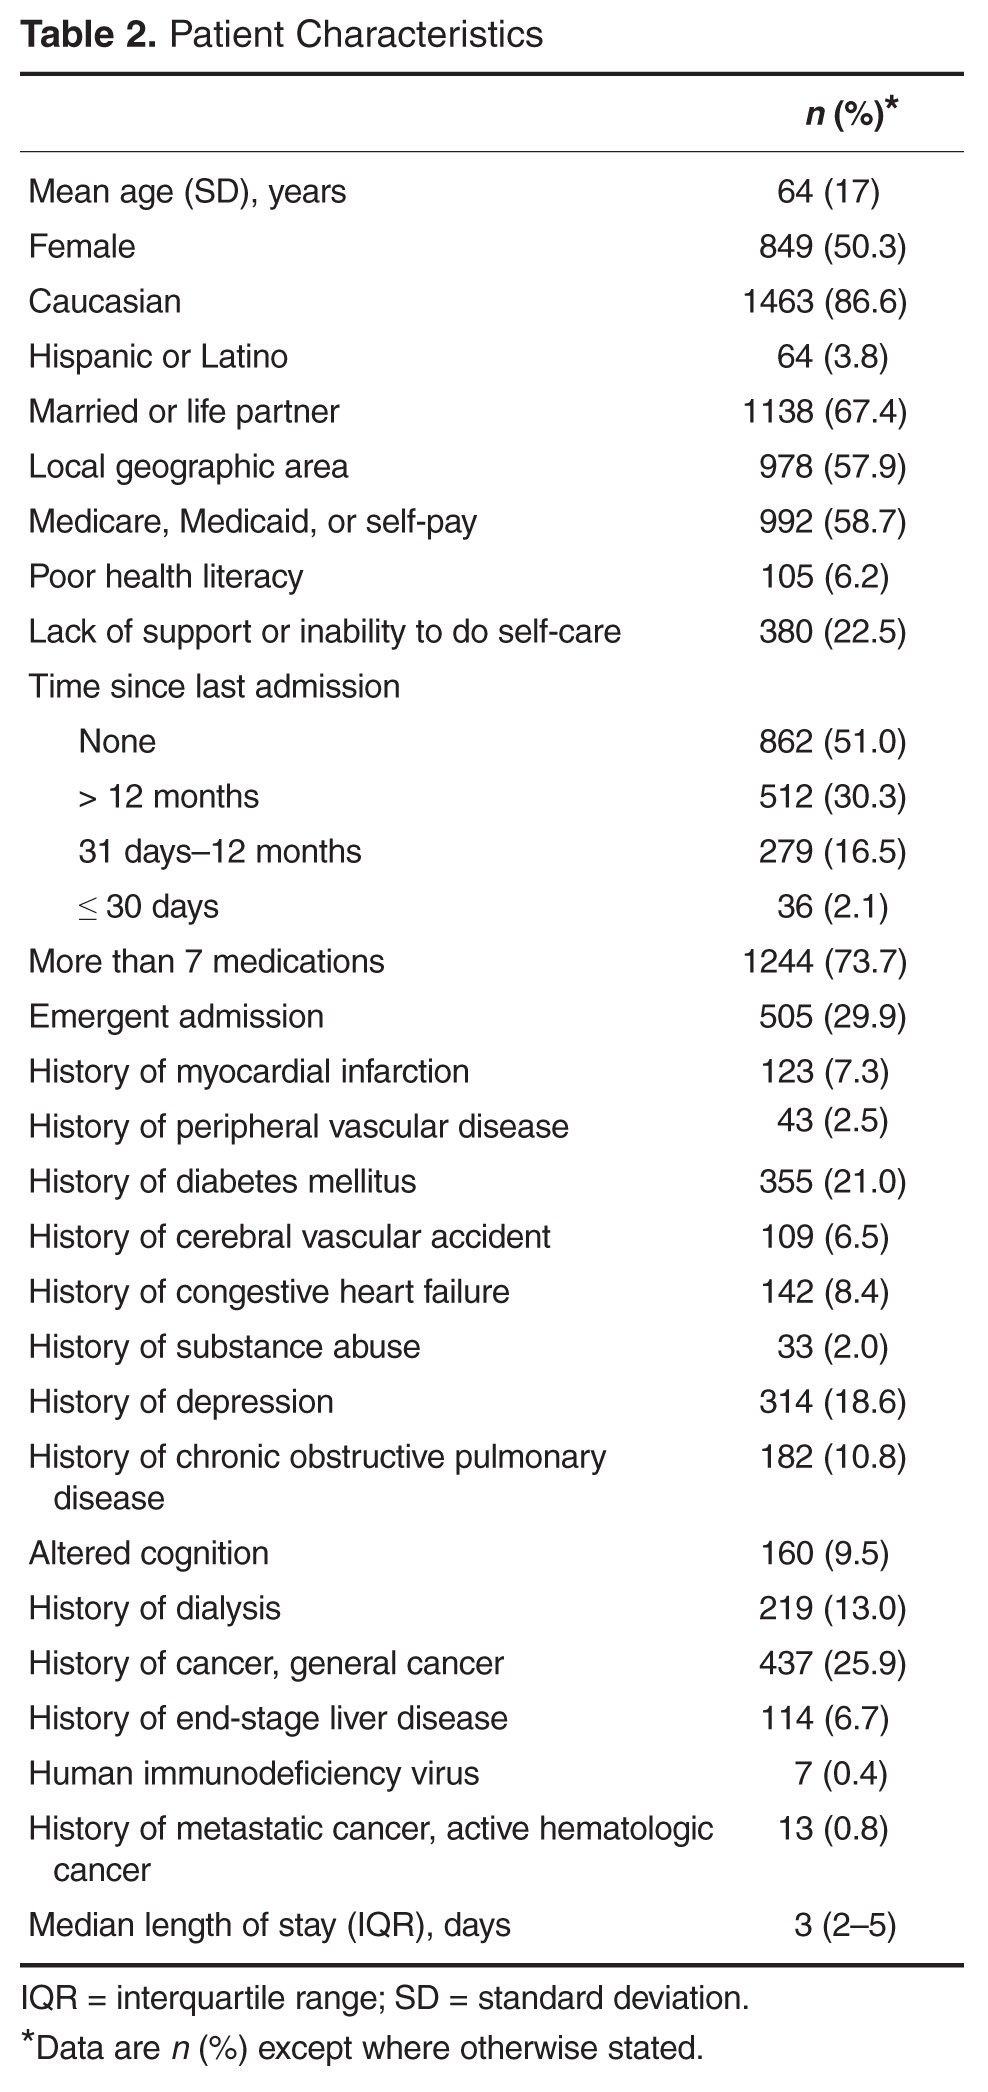
The RRS was significantly associated with 30-day urgent readmission (odds ratio [OR] for 1-point increase in the RRS, 1.07 [95% confidence interval {CI} 1.05–1.10]; P < 0.001). A c statistic of 0.612 (95% CI 0.570–0.655) indicates that the RRS has some ability to discriminate between those with and without a 30-day urgent readmission (Figure, Table 3). The expected and observed probabilities of 30-day urgent readmission were similar in each decile of the RRS. The calibration (Table 4) shows that although there is some deviation between the observed and expected probabilities, 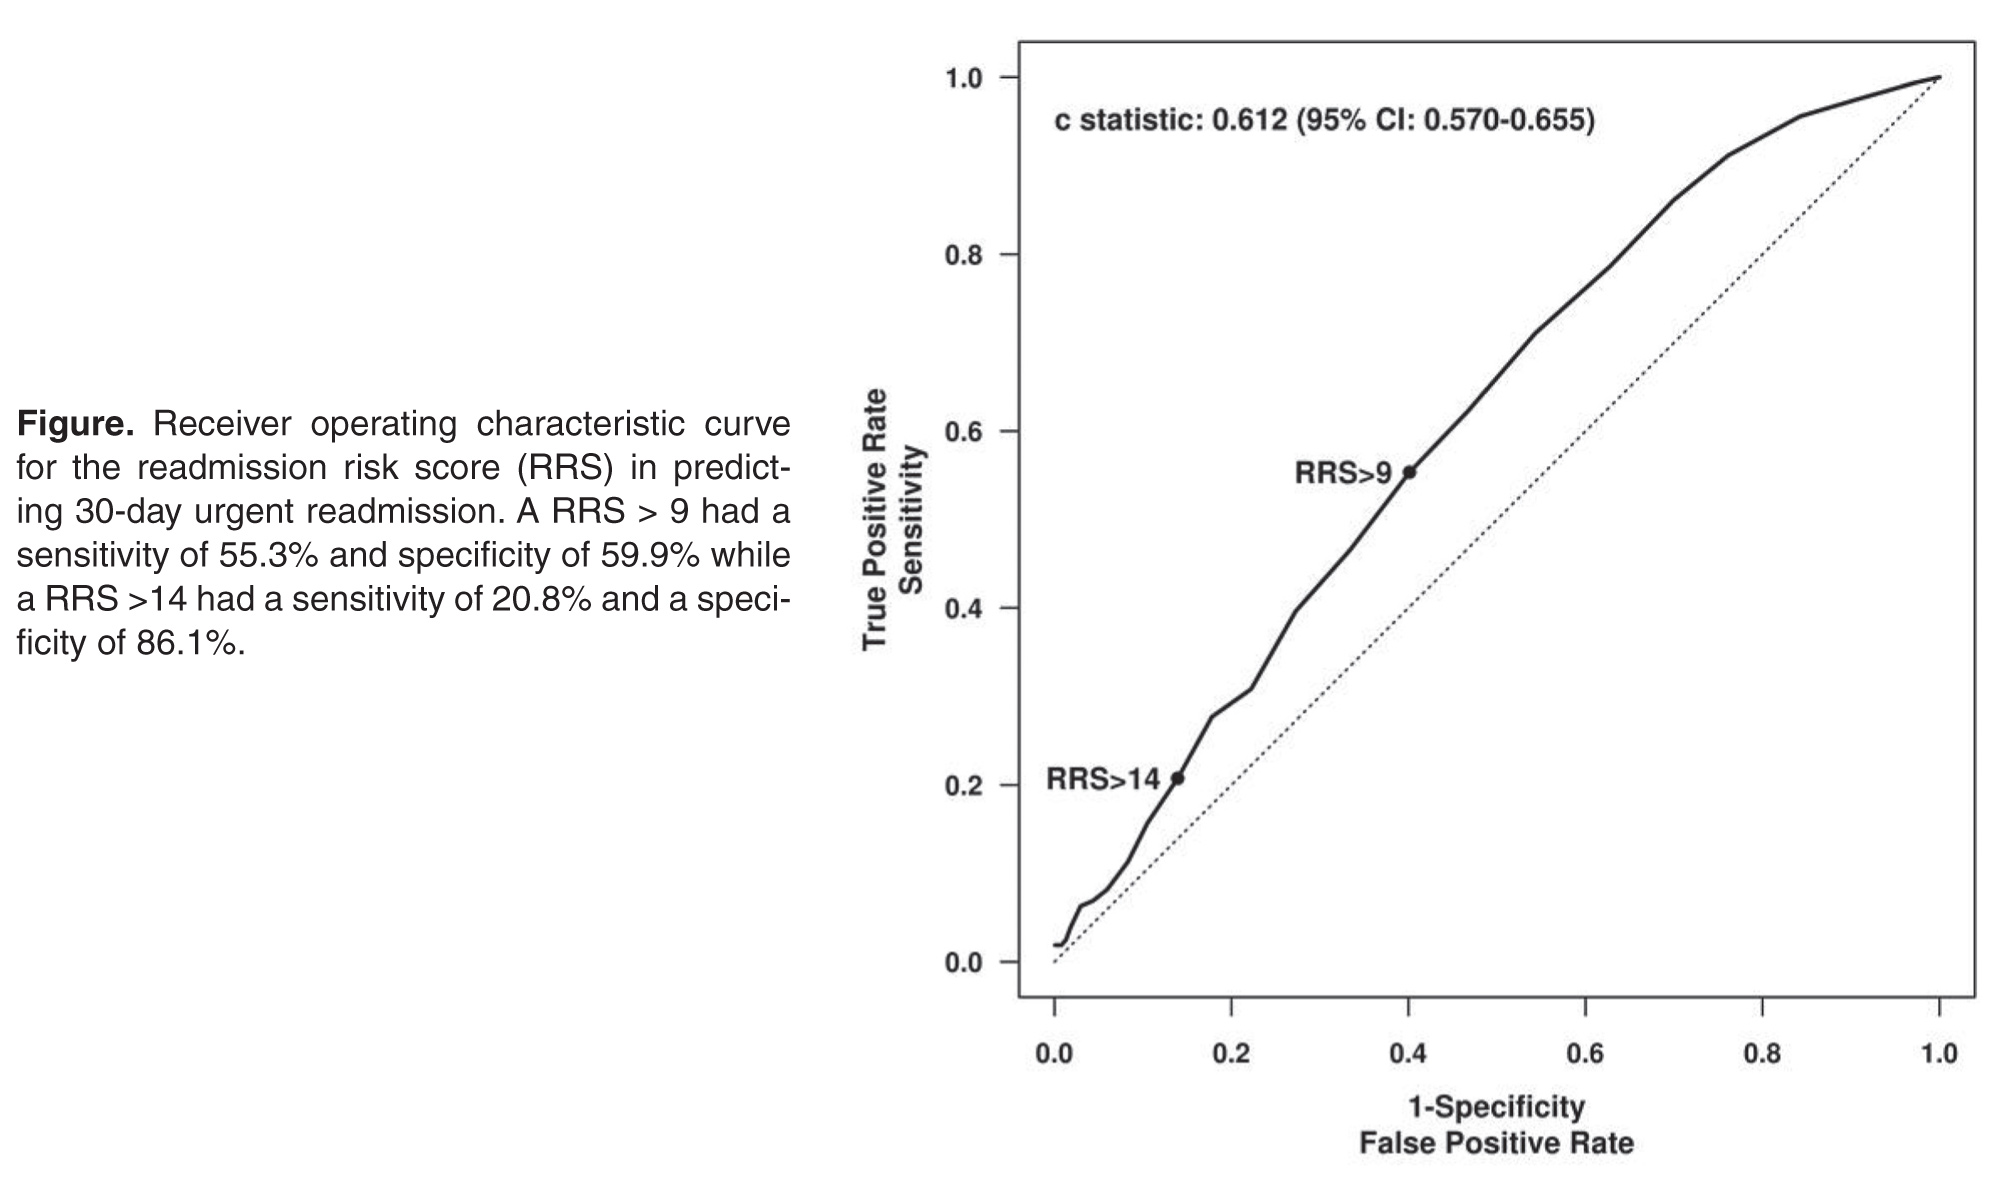
The RRS was also significantly associated with each of the secondary outcome measures. The odds ratios for a 1-point increase in the RRS for any 30-day readmission was 1.06 (95% CI 1.03–1.09, P < 0.001) and the c statistic was 0.591 (95% CI 0.551–0.631, Table 2). The odds ratios for a 1-point increase in the 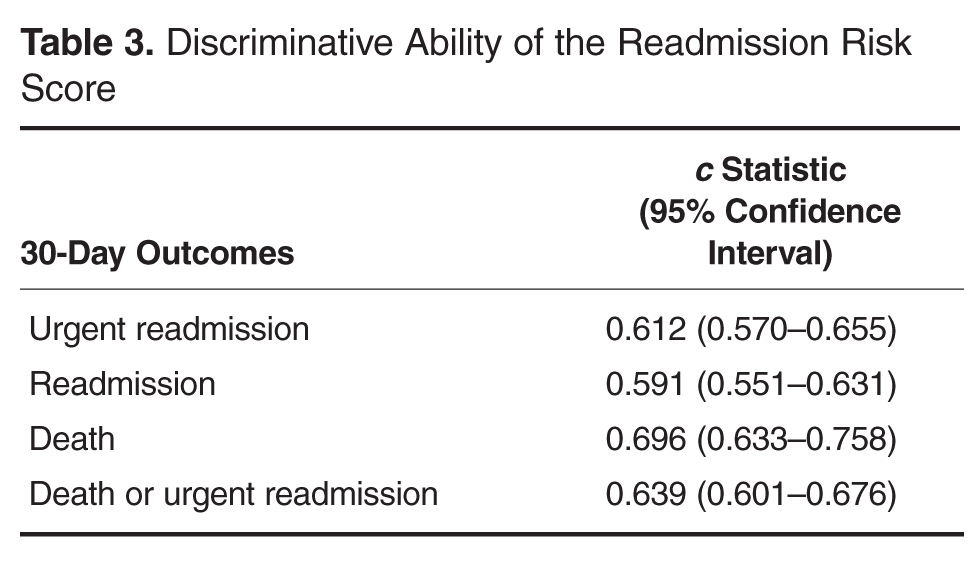
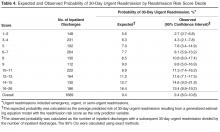
Discussion

Our study provides evidence that the RRS has some ability to discriminate between patients who did and did not have a 30-day urgent readmission (c statistic 0.612 [95% CI 0.570–0.655]). More importantly the calibration appears to be good particularly in the higher risk patients, which are the most crucial to identify in order to target interventions.
In addition to predicting the risk of readmission, our method of risk evaluation has several other advantages. First, the risk score is assigned to each patient within 24 to 48 hours of admission by using elements available at the time of, or soon after, admission. This early evaluation during the hospitalization identifies patients who could benefit from interventions throughout the stay that could help mitigate the risks and allow for a safer transition. Other studies have used elements available only at discharge, such as lab values and length of stay [7,11]. Donze et al used 7 elements in a validated scoring system, but several of the elements were discharge values and the risk assessment system had a fair discriminatory value with a c statistic of 0.71, similar to our results. The advantage to having the score available at admission is that several of the factors used to compose the RRS could be addressed during the hospitalization, including increased education for those with greater than 7 medications, intensive care management intervention for those with a lack of social support, and increased or modified education for those with low health literacy.
Second, the score is derived entirely from elements available in the EMR, thus the score is calculated automatically within 24 hours of admission and displayed in the chart for all providers to access. This eliminates any need for individual chart review or patient evaluation outside the normal admission process, making this system extremely efficient. Van Walraven et al [9] devised a scoring system using length of stay, acuity of admission, comorbidities and emergency department use (LACE index), with a validation c statistic of 0.684, which again is similar to our results. However, the LACE index uses the Charlson comorbidity index as a measure of patient comorbidity and this can be cumbersome to calculate in clinical practice. Having the score automatically available to all providers caring for the patient increases their awareness of the patient’s level of risk. Allaudeen and colleagues showed that providers are unable to intuitively predict those patients who are at high-risk for readmission [15]; therefore, an objective, readily available risk stratification is necessary to inform the providers.
Third, the risk scoring system uses elements from varied sources to include social, medical, and individual factors, all of which have been shown to increase risk of 30-day readmissions [9,15]. An accurate risk scoring system, ideally, should include elements from multiple sources, and use of the EMR allows for this varied compilation. The risk evaluation is done on every patient, regardless of admitting diagnosis, and in spite of this heterogeneous population, it was still found to be significantly accurate. Prior studies have looked at individual populations [7,10,12,13,16]; however, this can miss many patient populations that are also high-risk. Tailoring individual risk algorithms by diagnosis can also be labor intensive.
Our study has limitations. It is a retrospective study and included a relatively short study period of 2 months. This period was chosen because it represented the time from when the RRS was first implemented to when interventions to reduce readmission according to the RRS began, however, it still encompassed a significant number of discharges. We were only able to evaluate readmissions to our own facility; therefore, patients readmitted to other facilities were not included. Although readmission to any facility is undesirable, having a risk scoring system that can reliably predict readmission to the index admission hospital is still helpful. In addition, we only validated the risk score on patients in our own facility. A larger population from multiple facilities would be helpful for further validation. In spite of this limitation we would expect that most of our readmissions return to our own facility given our community setting. In fact, based on Medicare data for readmissions to all facilities, the difference in readmission rate between our facility and all facilities differs by less than 4%.
In summary, we developed a comprehensive risk scoring system that proved to be moderately predictive of readmission that encompasses multiple factors, is available to all providers early in a hospitalization, and is completely automated via the EMR. Further studies are ongoing to refine this score and improve the predictive performance.
Corresponding author: Nancy L. Dawson, MD, Division of Hospital Medicine, Mayo Clinic, 4500 San Pablo Road, Jacksonville, FL 32224, dawson.nancy11@mayo.edu.
Financial disclosures: None.
1. Elixhauser A, Steiner C. Statistical Brief #153: Readmissions to U.S. hospitals by diagnosis, 2010. Agency for Healthcare Research and Quality; 2013. Available at www.hcup-us.ahrq.gov/reports/statbriefs/sb153.pdf.
2. Jack BW, Chetty VK, Anthony D, et al. A reengineered hospital discharge program to decrease rehospitalization: a randomized trial. Ann Intern Med 2009;150:178–87.
3. Boutwell A, Hwu S. Effective interventions to reduce rehospitalizations: a survey of the published evidence. Cambridge, MA: Institute for Healthcare Improvement; 2009. Available at www.ihi.org/resources/Pages/Publications/EffectiveInterventionsReduceRehospitalizationsASurveyPublishedEvidence.aspx.
4. Hansen LO, Young RS, Hinami K, et al. Interventions to reduce 30-day rehospitalization: a systematic review. Ann Intern Med 2011;155:520–8.
5. Kripalani S, Theobald CN, Anctil B, Vasilevskis EE. Reducing hospital readmission rates: current strategies and future directions. Ann Rev Med 2014;65:471–85.
6. Osei-Anto A, Joshi M, Audet AM, et al. Health care leader action guide to reduce avoidable readmissions. Chicago: Health Research & Educational Trust; 2010. Available at www.hret.org/care/projects/resources/readmissions_cp.pdf.
7. Zaya M, Phan A, Schwarz ER. Predictors of re-hospitalization in patients with chronic heart failure. World J Cardiol 2012;4:23–30.
8. Hu J, Gonsahn MD, Nerenz DR. Socioeconomic status and readmissions: evidence from an urban teaching hospital. Health Aff (Millwood) 2014;33:778–85.
9. van Walraven C, Dhalla IA, Bell C, et al. Derivation and validation of an index to predict early death or unplanned readmission after discharge from hospital to the community. CMAJ 2010;182:551–7.
10. Rana S, Tran T, Luo W, et al. Predicting unplanned readmission after myocardial infarction from routinely collected administrative hospital data. Aust Health Rev 2014;38:377–82.
11. Donze J, Aujesky D, Williams D, Schnipper JL. Potentially avoidable 30-day hospital readmissions in medical patients: derivation and validation of a prediction model. JAMA Intern Med 2013;173:632–8.
12. Kogon B, Jain A, Oster M, et al. Risk factors associated with readmission after pediatric cardiothoracic surgery. Ann Thorac Surg 2012;94:865–73.
13. Harhay M, Lin E, Pai A, et al. Early rehospitalization after kidney transplantation: assessing preventability and prognosis. Am J Transplant 2013;13:3164–72.
14. Preventing unnecessary readmissions: transcending the hospital’s four walls to achieve collaborative care coordination. The Advisory Board Company; 2010. Available at www.advisory.com/research/physician-executive-council/studies/2010/preventing-unnecessary-readmissions.
15. Allaudeen N, Schnipper JL, Orav EJ, et al. Inability of providers to predict unplanned readmissions. J Gen Intern Med 2011;26:771–6.
16. Calvillo-King L, Arnold D, Eubank KJ, et al. Impact of social factors on risk of readmission or mortality in pneumonia and heart failure: systematic review. J Gen Intern Med 2013;28:269–82.
From the Divisions of Hospital Medicine (Drs. Dawson, Chirila, Bhide, and Burton) and Biomedical Statistics and Informatics (Ms. Thomas), Mayo Clinic, Jacksonville, FL, and the Division of Hospital Medicine, Mayo Clinic, Phoenix, AZ (Dr. Cannon).
Abstract
- Objective: To validate an electronic tool created to identify inpatients who are at risk of readmission within 30 days and quantify the predictive performance of the readmission risk score (RRS).
- Methods: Retrospective cohort study including inpa-tients who were discharged between 1 Nov 2012 and 31 Dec 2012. The ability of the RRS to discriminate between those who did and did not have a 30-day urgent readmission was quantified by the c statistic. Calibration was assessed by plotting the observed and predicted probability of 30-day urgent readmission. Predicted probabilities were obtained from generalized estimating equations, clustering on patient.
- Results: Of 1689 hospital inpatient discharges (1515 patients), 159 (9.4%) had a 30-day urgent readmission. The RRS had some discriminative ability (c statistic: 0.612; 95% confidence interval: 0.570–0.655) and good calibration.
- Conclusions: Our study shows that the RRS has some discriminative ability. The automated tool can be used to estimate the probability of a 30-day urgent readmission.
Hospital readmissions are increasingly scrutinized by the Center for Medicare and Medicaid Services and other payers due to their frequency and high cost. It is estimated that up to 25% of all patients discharged from acute care hospitals are readmitted within 30 days [1]. To address this problem, the Center for Medicare and Medicaid Services is using these rates as one of the benchmarks for quality for hospitals and health care organizations and has begun to assess penalties to those institutions with the highest rates. This scrutiny and the desire for better patient care transitions has resulted in most hospitals implementing various initiatives to reduce potentially avoidable readmissions.
Multiple interventions have been shown to reduce readmissions [2,3]. These interventions have varying effectiveness and are often labor intensive and thus costly to the institutions implementing them. In fact, no one intervention has been shown to be effective alone [4], and it may take several concurrent interventions targeting the highest risk patients to improve transitions of care at discharge that result in reduced readmissions. Many experts do recommend risk stratifying patients in order to target interventions to the highest risk patients for effective use of resources [5,6]. Several risk factor assessments have been proposed with varying success [7–13]. Multiple factors can limit the effectiveness of these risk stratification profiles. They may have low sensitivity and specificity, be based solely on retrospective data, be limited to certain populations, or be created from administrative data only without taking psychosocial factors into consideration [14].
An effective risk assessment ideally would encompass multiple known risk factors including certain comorbidities such as malignancy and heart failure, psychosocial factors such as health literacy and social support, and administrative data including payment source and demographics. All of these have been shown in prior studies to contribute to readmissions [7–13]. In addition, availability of the assessment early in the hospitalization would allow for interventions throughout the hospital stay to mitigate the effect of these factors where possible. To address these needs, our institution formed a readmission task force in January 2010 to review published literature on hospital 30-day readmissions and create a readmission risk score (RRS). The aim of this study was to quantify the predictive performance of the RRS after it was first implemented into the electronic medical record (EMR) in November 2012.
Methods
Study Design and Cohort
All consecutive adult inpatients who were discharged between 1 November 2012 and 31 December 2012 were included in this retrospective cohort study. This narrow time frame corresponded to the period from RRS tool implementation to the start of readmission interventions. We excluded hospitalizations if the patient died in the hospital.
Outcome Measures
The primary outcome was a 30-day urgent readmission, which included readmissions categorized as either emergency, urgent, or semi-urgent. Secondary outcomes included any 30-day readmission and 30-day death. Only readmissions to Mayo Clinic were examined.
Predictors
In collaboration with the information technology department, an algorithm was written to extract data from the EMR for each patient within 24 hours of admission to the hospital. This data was retrieved from existing repositories of patient information, such as demographic information, payer source, medication list, problem list, and past medical history. In addition, each patient was interviewed by a nurse at the time of admission, and the nurse completed an “admission profile” in the EMR that confirmed or entered past medical history, medications, social support at home, depression symptoms, and learning styles, among other information (Table 1). The algorithm was able to extract data from this evaluation also, so that each element of the risk score was correlated to at least one data source in the EMR. The algorithm then assigned the correct value to each element, and the total score was electronically calculated and placed in a discrete cell in each patient’s record. The algorithm was automatically run again 48 hours after the initial scoring in order to assure completeness of the information. If the patient had a length of stay greater than 5 days, an additional score was generated to include the length of stay component.
Statistical Analysis
The predictive performance of the RRS was assessed by evaluating the discrimination and calibration. Discrimination is the ability of the RRS to separate those who had a 30-day urgent readmission and those who did not. Discrimination was quantified by the c statistic, which is equivalent to the area under the receiver operating characteristic curve in this study owing to the use of binary endpoints. A c statistic of 1.0 would indicate that the RRS perfectly predicts 30-day urgent readmission while a c statistic of 0.5 would indicate the RRS has no apparent accuracy in predicting 30-day urgent readmission. Calibration assesses how closely predicted outcomes agree with observed outcomes. The predicted probability of 30-day urgent readmission was estimated utilizing a generalized estimating equation model, clustering on patient, with RRS as the only predictor variable. Inpatient discharges were divided into deciles of the predicted probabilities for 30-day urgent readmission. Agreement of the predicted and observed outcomes was displayed graphically according to decile of the predicted outcomes. All analyses were performed using SAS (version 9.3, SAS Institute, Cary, NC) and R statistical software (version 3.1.1, R Foundation for Statistical Computing, Vienna, Austria).
Results
The RRS was significantly associated with 30-day urgent readmission (odds ratio [OR] for 1-point increase in the RRS, 1.07 [95% confidence interval {CI} 1.05–1.10]; P < 0.001). A c statistic of 0.612 (95% CI 0.570–0.655) indicates that the RRS has some ability to discriminate between those with and without a 30-day urgent readmission (Figure, Table 3). The expected and observed probabilities of 30-day urgent readmission were similar in each decile of the RRS. The calibration (Table 4) shows that although there is some deviation between the observed and expected probabilities,
The RRS was also significantly associated with each of the secondary outcome measures. The odds ratios for a 1-point increase in the RRS for any 30-day readmission was 1.06 (95% CI 1.03–1.09, P < 0.001) and the c statistic was 0.591 (95% CI 0.551–0.631, Table 2). The odds ratios for a 1-point increase in the
Discussion
Our study provides evidence that the RRS has some ability to discriminate between patients who did and did not have a 30-day urgent readmission (c statistic 0.612 [95% CI 0.570–0.655]). More importantly the calibration appears to be good particularly in the higher risk patients, which are the most crucial to identify in order to target interventions.
In addition to predicting the risk of readmission, our method of risk evaluation has several other advantages. First, the risk score is assigned to each patient within 24 to 48 hours of admission by using elements available at the time of, or soon after, admission. This early evaluation during the hospitalization identifies patients who could benefit from interventions throughout the stay that could help mitigate the risks and allow for a safer transition. Other studies have used elements available only at discharge, such as lab values and length of stay [7,11]. Donze et al used 7 elements in a validated scoring system, but several of the elements were discharge values and the risk assessment system had a fair discriminatory value with a c statistic of 0.71, similar to our results. The advantage to having the score available at admission is that several of the factors used to compose the RRS could be addressed during the hospitalization, including increased education for those with greater than 7 medications, intensive care management intervention for those with a lack of social support, and increased or modified education for those with low health literacy.
Second, the score is derived entirely from elements available in the EMR, thus the score is calculated automatically within 24 hours of admission and displayed in the chart for all providers to access. This eliminates any need for individual chart review or patient evaluation outside the normal admission process, making this system extremely efficient. Van Walraven et al [9] devised a scoring system using length of stay, acuity of admission, comorbidities and emergency department use (LACE index), with a validation c statistic of 0.684, which again is similar to our results. However, the LACE index uses the Charlson comorbidity index as a measure of patient comorbidity and this can be cumbersome to calculate in clinical practice. Having the score automatically available to all providers caring for the patient increases their awareness of the patient’s level of risk. Allaudeen and colleagues showed that providers are unable to intuitively predict those patients who are at high-risk for readmission [15]; therefore, an objective, readily available risk stratification is necessary to inform the providers.
Third, the risk scoring system uses elements from varied sources to include social, medical, and individual factors, all of which have been shown to increase risk of 30-day readmissions [9,15]. An accurate risk scoring system, ideally, should include elements from multiple sources, and use of the EMR allows for this varied compilation. The risk evaluation is done on every patient, regardless of admitting diagnosis, and in spite of this heterogeneous population, it was still found to be significantly accurate. Prior studies have looked at individual populations [7,10,12,13,16]; however, this can miss many patient populations that are also high-risk. Tailoring individual risk algorithms by diagnosis can also be labor intensive.
Our study has limitations. It is a retrospective study and included a relatively short study period of 2 months. This period was chosen because it represented the time from when the RRS was first implemented to when interventions to reduce readmission according to the RRS began, however, it still encompassed a significant number of discharges. We were only able to evaluate readmissions to our own facility; therefore, patients readmitted to other facilities were not included. Although readmission to any facility is undesirable, having a risk scoring system that can reliably predict readmission to the index admission hospital is still helpful. In addition, we only validated the risk score on patients in our own facility. A larger population from multiple facilities would be helpful for further validation. In spite of this limitation we would expect that most of our readmissions return to our own facility given our community setting. In fact, based on Medicare data for readmissions to all facilities, the difference in readmission rate between our facility and all facilities differs by less than 4%.
In summary, we developed a comprehensive risk scoring system that proved to be moderately predictive of readmission that encompasses multiple factors, is available to all providers early in a hospitalization, and is completely automated via the EMR. Further studies are ongoing to refine this score and improve the predictive performance.
Corresponding author: Nancy L. Dawson, MD, Division of Hospital Medicine, Mayo Clinic, 4500 San Pablo Road, Jacksonville, FL 32224, dawson.nancy11@mayo.edu.
Financial disclosures: None.
1. Elixhauser A, Steiner C. Statistical Brief #153: Readmissions to U.S. hospitals by diagnosis, 2010. Agency for Healthcare Research and Quality; 2013. Available at www.hcup-us.ahrq.gov/reports/statbriefs/sb153.pdf.
2. Jack BW, Chetty VK, Anthony D, et al. A reengineered hospital discharge program to decrease rehospitalization: a randomized trial. Ann Intern Med 2009;150:178–87.
3. Boutwell A, Hwu S. Effective interventions to reduce rehospitalizations: a survey of the published evidence. Cambridge, MA: Institute for Healthcare Improvement; 2009. Available at www.ihi.org/resources/Pages/Publications/EffectiveInterventionsReduceRehospitalizationsASurveyPublishedEvidence.aspx.
4. Hansen LO, Young RS, Hinami K, et al. Interventions to reduce 30-day rehospitalization: a systematic review. Ann Intern Med 2011;155:520–8.
5. Kripalani S, Theobald CN, Anctil B, Vasilevskis EE. Reducing hospital readmission rates: current strategies and future directions. Ann Rev Med 2014;65:471–85.
6. Osei-Anto A, Joshi M, Audet AM, et al. Health care leader action guide to reduce avoidable readmissions. Chicago: Health Research & Educational Trust; 2010. Available at www.hret.org/care/projects/resources/readmissions_cp.pdf.
7. Zaya M, Phan A, Schwarz ER. Predictors of re-hospitalization in patients with chronic heart failure. World J Cardiol 2012;4:23–30.
8. Hu J, Gonsahn MD, Nerenz DR. Socioeconomic status and readmissions: evidence from an urban teaching hospital. Health Aff (Millwood) 2014;33:778–85.
9. van Walraven C, Dhalla IA, Bell C, et al. Derivation and validation of an index to predict early death or unplanned readmission after discharge from hospital to the community. CMAJ 2010;182:551–7.
10. Rana S, Tran T, Luo W, et al. Predicting unplanned readmission after myocardial infarction from routinely collected administrative hospital data. Aust Health Rev 2014;38:377–82.
11. Donze J, Aujesky D, Williams D, Schnipper JL. Potentially avoidable 30-day hospital readmissions in medical patients: derivation and validation of a prediction model. JAMA Intern Med 2013;173:632–8.
12. Kogon B, Jain A, Oster M, et al. Risk factors associated with readmission after pediatric cardiothoracic surgery. Ann Thorac Surg 2012;94:865–73.
13. Harhay M, Lin E, Pai A, et al. Early rehospitalization after kidney transplantation: assessing preventability and prognosis. Am J Transplant 2013;13:3164–72.
14. Preventing unnecessary readmissions: transcending the hospital’s four walls to achieve collaborative care coordination. The Advisory Board Company; 2010. Available at www.advisory.com/research/physician-executive-council/studies/2010/preventing-unnecessary-readmissions.
15. Allaudeen N, Schnipper JL, Orav EJ, et al. Inability of providers to predict unplanned readmissions. J Gen Intern Med 2011;26:771–6.
16. Calvillo-King L, Arnold D, Eubank KJ, et al. Impact of social factors on risk of readmission or mortality in pneumonia and heart failure: systematic review. J Gen Intern Med 2013;28:269–82.
Face‐to‐Face Handoffs and Outcomes
Handoffs are key events in the care of hospitalized patients whereby vital information is relayed between healthcare providers. Resident duty hour restrictions and the popularity of shift‐based work schedules have increased the frequency of inpatient handoffs.[1, 2] Failures in communication at the time of patient handoff have been implicated as contributing factors to preventable adverse events.[3, 4, 5, 6] With patient safety in mind, accreditation organizations and professional societies have made the standardization of hospital handoff procedures a priority.[7, 8] A variety of strategies have been utilized to standardize handoffs. Examples include the use of mnemonics,[9] electronic resources,[10, 11, 12] preformatted handoff sheets,[13, 14, 15, 16] and optimization of the handoff environment.[17] The primary outcomes for many of these studies center on the provider by measuring their retention of patient facts[18, 19] and completion of tasks[14, 16] after handoff, for example. Few studies examined patient‐centered outcomes such as transfer to a higher level of care,[20] length of stay,[11] mortality,[21] or readmission rate.[22] A study in the pediatric population found that implementation of a handoff bundle was associated with a decrease in medical errors and preventable adverse events.[23]
The Society of Hospital Medicine recommends that patient handoffs consist of both a written and verbal component.[8] Providers in our division work on 3 shifts: day, evening, and night. In 2009, we developed a face‐to‐face morning handoff, during which night‐shift providers hand off patient care to day‐shift providers incorporating an electronically generated service information list.[17] Given that the evening shift ends well before the day shift begins, the evening‐shift providers do not participate in this face‐to‐face handoff of care for patients they admit to day providers.
We wished to compare the clinical outcomes and adverse events of patients admitted by the night‐shift providers to those admitted by the evening‐shift providers. We hypothesized that transfer of care using a face‐to‐face handoff would be associated with fewer adverse events and improved clinical outcomes.
METHODS
The study was deemed exempt by the Mayo Clinic Institutional Review Board.
Study Population
Hospitalists at the study institution, a 1157‐bed academic tertiary referral hospital, admit general medical patients from the emergency department, as transfers from other institutions, and as direct admissions from outpatient offices. Patients included in the study were all adults admitted by evening‐ and night‐shift hospitalists from August 1, 2011 through August 1, 2012 between 6:45 pm and midnight. Our institution primarily uses 2 levels of care for adult inpatients on internal medicine services, including a general care floor for low‐acuity patients and an intensive care unit for high‐acuity patients. All of the patients in this study were triaged as low acuity at the time of admission and were initially admitted to general care units.
Setting
The division's shift schedule during the study period is depicted in Figure 1. Day‐shift providers included a physician and nurse practitioner (NP) or physician assistant (PA) on each of 7 teams. Each service had an average daily patient census between 10 and 15 patients with 3 to 4 new admissions every 24 hours, with 1 to 2 of these admissions occurring during the evening and night shifts, on average. The day shift started at 7:45 am and ended at 7:45 pm, at which time the day teams transitioned care of their patients to 1 of 2 overnight NP/PAs who provided cross‐cover for all teams through the night. The overnight NP/PAs then transitioned care back to the day teams at 7:45 am the following morning.
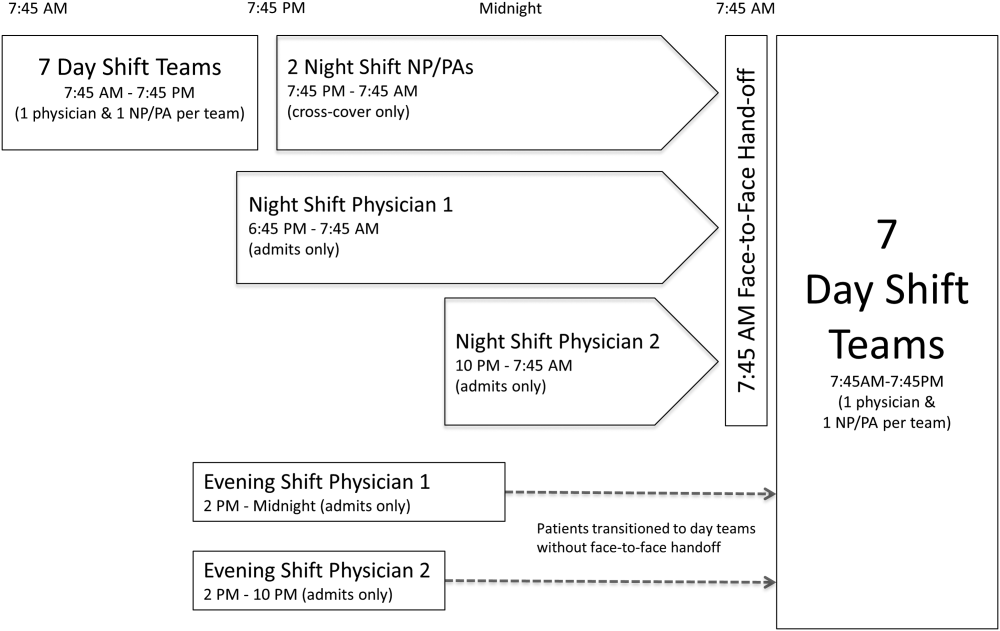
Two evening‐shift providers, both physicians, including a staff hospitalist and a hospital medicine fellowship trainee, admitted patients without any cross‐cover responsibility. Their shifts had the same start time, but staggered end times (2 pm10 pm and 2 pmmidnight). At the end of their shifts, the evening‐shift providers relayed concerns or items for follow‐up to the night cross‐cover NP/PAs; however, this handoff was nonstandardized and provider dependent. The cross‐cover providers could also choose to pass on any relevant information to day‐shift providers if thought to be necessary, but this, again, was not required or standardized. A printed electronic handoff tool (including the patient's problem list, medications, vital signs, laboratory results, and to do list as determined by the admitting provider) as well as all clinical notes generated since admission were made available to day‐shift providers who assumed care at 7:45 am; however, there was no face‐to‐face handoff between the evening‐ and day‐shift providers.
Two night‐shift physicians, including a moonlighting board‐eligible internal medicine physician and staff hospitalist, also started at staggered times, 6:45 pm and 10 pm, but their shifts both ended at 7:45 am. These physicians also admitted patients without cross‐cover responsibilities. At 7:45 am, in a face‐to‐face meeting, they transitioned care of patients admitted overnight to day‐shift providers. This handoff occurred at a predesignated place with assigned start times for each team. During the meeting, printed electronic documents, including the aforementioned electronic handoff tool as well as all clinical notes generated since admission, were made available to the oncoming day‐shift providers. The face‐to‐face interaction between night‐ and day‐shift providers lasted approximately 5 minutes and allowed for a brief presentation of the patient, review of the diagnostic testing and treatments performed so far, as well as anticipatory guidance regarding potential issues throughout the remainder of the hospitalization. Although inclusion of the above components was encouraged during the face‐to‐face handoff, the interaction was not scripted and topics discussed were at the providers' discretion.
Patients admitted during the evening and night shifts were assigned to day‐shift services primarily based on the current census of each team, so as to distribute the workload evenly.
Chart Review
Patients included in the study were admitted by evening‐ or night‐shift providers between 6:45 pm and midnight. This time period accounts for when the evening shift and night shift overlap, allowing for direct comparison of patients admitted during the same time of day, so as to avoid confounding factors. Patients were grouped by whether they were admitted by an evening‐shift provider or a night‐shift provider. Each study patient's chart was retrospectively reviewed and relevant demographic and clinical data were collected. Demographic information included age, gender, and race. Clinical information included medical comorbidities, Charlson Comorbidity Index score, rapid response team calls, code team calls, transfers to a higher level of care, death in hospital, 30‐day readmission rate, length of stay (LOS), and adverse events. The Charlson Comorbidity Index score[24] was determined from diagnoses in the institution's medical index database. The 30‐day readmission rate included observation stays and full hospital admissions that occurred at our institution in the 30 days following the patient's hospital discharge from the index admission. LOS was determined based on the time of admission and discharge, as reported in the hospital billing system, and is reported as the median and mean LOS in hours for all patients in each group.
The Global Trigger Tool (GTT) was used to identify adverse events, as defined within the GTT whitepaper to be unintended physical injury resulting from or contributed to by medical care that requires additional monitoring, treatment or hospitalization, or that results in death.[25] Developed by the Institute for Healthcare Improvement, the GTT uses triggers, clues in the medical record that suggest an adverse event may have occurred, to cue a more detailed chart review. Registered nurses trained in use of the GTT reviewed all of the included patients' electronic medical records. If a trigger was identified (such as a patient fall suffered in the hospital), further chart review was prompted to determine if patient harm occurred. If there was evidence of harm, an adverse event was determined to have occurred and was then categorized using the National Coordinating Council for Medication Error Reporting and Prevention Index for Categorizing Errors.[26] For example, in the case of a patient fall whereby the patient was determined to have fallen in the hospital and suffered a laceration requiring wound care, but the hospital stay was not prolonged, this adverse event was categorized as category E (an adverse event that caused the patient temporary harm necessitating intervention, without prolongation of the hospital stay).
Outcomes including rapid response team calls, code team calls, transfers to a higher level of care, death in the hospital, and adverse events, as identified using the GTT, were counted if they occurred between 7:45 am on the first morning of admission until 12 hours later at 7:45 pm, at the time of the first evening handoff of the admitted patients' care.
Statistical Methods
Study data were collected and managed using REDCap (Research Electronic Data Capture) electronic data capture tools hosted at Mayo Clinic.[27] When comparing outcomes between the 2 groups, Fisher exact test was used for categorical variables and Student t test was used for continuous variables. Global Trigger Tool data were analyzed using the SAS GENMOD procedure, assuming a negative binomial distribution. All the above analyses were performed using SAS version 9.3 software (SAS Institute Inc., Cary, NC). Rates of adverse events were compared using MedCalc version 13 software (MedCalc Software, Ostend, Belgium).[28] A P value <0.05 was considered significant.
RESULTS
Of 805 patients admitted between 6:45 pm and midnight during the study period, 305 (37.9%) patients were handed off to day‐shift providers without face‐to‐face handoff, and 500 (62.1%) patients were transferred to the care of day‐shift providers with the use of a face‐to‐face handoff.
Baseline characteristics of both groups are depicted in Table 1. Demographic characteristics, including age, gender, and race, were not significantly different between groups. The mean Charlson Comorbidity Index score was not significantly different between the groups without and with a face‐to‐face handoff. In addition, the presence of medical comorbidities including type 2 diabetes mellitus, hypertension, coronary artery disease, hyperlipidemia, heart failure, body mass index (BMI) <18, active cancer, and current cigarette smoking were not significantly different between the 2 groups. There was a trend to a significantly increased proportion of patients with a BMI >30 in the group without face‐to‐face handoff (P=0.05).
| Without Face‐to‐Face Handoff, N=305 | With Face‐to‐Face Handoff, N=500 | P Value | |
|---|---|---|---|
| |||
| Age, y, mean (SD) | 65.8 (19.0) | 64.2 (20.0) | 0.25 |
| Sex, n (%) | 0.69 | ||
| Female | 166 (54%) | 265 (53%) | |
| Male | 139 (46%) | 235 (47%) | |
| Race, n (%) | 0.94 | ||
| White | 287 (95%) | 466 (93%) | |
| African American | 5 (2%) | 9 (2%) | |
| Arab/Middle Eastern | 3 (1%) | 8 (2%) | |
| Asian | 1 (0%) | 3 (1%) | |
| Indian subcontinental | 1 (0%) | 1 (0%) | |
| American Indian/Alaskan | 1 (0%) | 1 (0%) | |
| Other | 3 (1%) | 8 (2%) | |
| Unknown | 1 (0%) | 4 (1%) | |
| Charlson Comorbidity Index, mean ( SD) | 2.98 ( 3.73) | 2.93 ( 3.72) | 0.85 |
| Comorbidities, n (%) | |||
| Type 2 diabetes | 82 (27%) | 143 (29%) | 0.60 |
| Hypertension | 195 (64%) | 303 (61%) | 0.34 |
| Coronary artery disease | 76 (25%) | 137 (27%) | 0.44 |
| Hyperlipidemia | 122 (40%) | 206 (41%) | 0.74 |
| Heart failure | 30 (10%) | 66 (13%) | 0.15 |
| BMI >30 | 109 (36%) | 146 (29%) | 0.05 |
| BMI <18 | 7 (2%) | 12 (2%) | 0.92 |
| Active cancer | 29 (10%) | 46 (9%) | 0.88 |
| Current smoker | 49 (16%) | 90 (18%) | 0.48 |
Results for the outcomes of this study are depicted in Table 2. The frequency of rapid response team calls, code team calls, transfers to a higher level of care, and death in the hospital in the 12 hours following the first morning handoff of the admission were not significantly different between the 2 groups. Both 30‐day readmission rate and LOS (median and mean) were not significantly different between groups.
| Without Face‐to‐Face Handoff, N=305 | With Face‐to‐Face Handoff, N=500 | P Value | |
|---|---|---|---|
| |||
| Rapid response team call, n (%) | 4 (1%) | 5 (1%) | 0.68 |
| Code team call, n (%) | 0 (0%) | 1 (0%) | 0.43 |
| Transfer to higher level of care, n (%) | 7 (2%) | 11 (2%) | 0.93 |
| Patient death, n (%) | 0 (0%) | 0 (0%) | 1.00 |
| 30‐day readmission, n (%) | 50 (16%) | 67 (13%) | 0.23 |
| Hospital length of stay | |||
| Median, h (IQR) | 66.5 (41.3115.6) | 70.3 (41.9131.2) | 0.30 |
| Mean, h ( SD) | 102.0 ( 110.0) | 102.9 ( 94.0) | 0.90 |
| Adverse events (Global Trigger Tool) | |||
| Temporary harm and required intervention (E) | 4 | 7 | 0.92 |
| Temporary harm and required initial or prolonged hospitalization (F) | 7 | 8 | 0.53 |
| Permanent harm (G) | 0 | 1 | 0.44 |
| Intervention required to sustain life (H) | 0 | 6 | 0.14 |
| Death (I) | 0 | 0 | 1.00 |
| Total adverse events per 100 admissions | 3.61 | 4.40 | 0.59 |
| % of admissions with an adverse event | 2.6% | 3.2% | 0.64 |
There was no significant difference between the 2 groups in the frequency of adverse events resulting in harm for any of the categories (categories EI). Total adverse events between groups were also compared. Adverse events per 100 admissions were not significantly different between the group without face‐to‐face handoff compared to the group with face‐to‐face handoff. The percentage of admissions with an adverse event was also similar between groups.
DISCUSSION
We found no significant difference in the rate of rapid response team calls, code team calls, transfers to a higher level of care, death in hospital, or adverse events when comparing patients transitioned to the care of day‐shift providers with or without a face‐to‐face handoff. We hypothesize that a reason adverse events were no different between the 2 groups may be that providers were more vigilant when they did not receive a face‐to‐face handoff from the previous provider. As a result, providers may have dedicated additional time reviewing the medical record, speaking with the patients, and communicating with other healthcare providers to ensure a safe care transition. Similarly, other studies found no significant reduction in adverse events when using a standardized handoff.[10, 13, 29] This may be because patient handoff is 1 of a multitude of factors that impact the rate of adverse events, and a handoff may play a less vital role in a system where documentation of care for a given patient is readily accessible, uniform, and detailed. A face‐to‐face interaction itself in a patient handoff may be less pertinent if key information can be communicated through other channels, such as an electronic handoff tool, email, or phone.
Another potential explanation for the lack of a significant difference in patient outcomes with and without a face‐to‐face handoff is related to the study design and inherent rate of the events measured. With the exception of 30‐day readmission rate and LOS, the outcomes of the study were recorded only if they occurred in the 12 hours following the first morning handoff of the admission. This was done in an attempt to isolate the effect of the nonface‐to‐face versus face‐to‐face handoff on the first morning of the admission, and to avoid confounding effects by subsequent transitions of care later in the hospitalization. The frequency of hospital admissions in which an adverse event occurred during this relatively short 12‐hour window was approximately 3% for all patients in the study. With 805 total patients in the study, there may have been insufficient statistical power to detect a difference in the rate of outcomes, if a difference did exist, considering the event rate for both groups and the sample size.
There are several additional limitations to our study. First, the GTT was designed to be applied across the entirety of a hospitalization. By screening for adverse events over the span of only 12 hours for each hospitalization, the sensitivity of the tool may have been diminished, with a proportion of adverse events not captured, even when the sequence of events leading to patient harm began during the 12 hours in question. Second, this is a retrospective study, and all adverse events may not be documented in the medical record. Third, although not formally structured and infrequent, some evening‐shift providers did send an email or call the oncoming day‐shift provider to discuss patients admitted. This process, however, was provider dependent, unstructured, uncommon, and erratic, and thus we were not able to capture it from medical record review. Finally, the patients in this study were deemed low acuity upon triage prior to admission. A face‐to‐face handoff may be less important in ensuring patient safety when caring for low‐acuity compared to high‐acuity patients, considering the rapidity at which the critically ill can deteriorate.
Handoffs of patient care in the hospital have certainly increased in recent years. Consequently, communication among providers is undoubtedly important, with patient safety being the primary goal. Our work suggests that a face‐to‐face component of a handoff is not vital to ensure a safe care transition. Because of the increasing frequency of handoffs, providers' ability to do so face‐to‐face will likely be challenged by time and logistical constraints. Future work is needed to delineate the most effective components of the handoff so that we can design information transfer that promotes safe and efficient care, even without a face‐to‐face interaction.
Acknowledgements
The authors are grateful for support from the Mayo Clinic Department of Medicine Clinical Research Office, Ms. Donna Lawson, and Mr. Stephen Cha.
Disclosures: This publication was made possible by the Mayo Clinic Center for Clinical and Translational Science through grant number UL1 TR000135 from the National Center for Advancing Translational Science, a component of the National Institutes of Health. The authors report no conflicts of interest.
- , , , et al. Effect of the 2011 vs 2003 duty hour regulation‐compliant models on sleep duration, trainee education, and continuity of patient care among internal medicine house staff: a randomized trial. JAMA Intern Med. 2013;173(8):649–655.
- . 'Shift work': 24‐hour workdays are out as residents, hospitals deal with changes, mixed feelings on restrictions. Mod Healthc. 2011;41(30):6–7, 16, 1.
- , , , , . Consequences of inadequate sign‐out for patient care. Arch Intern Med. 2008;168(16):1755–1760.
- , , , , . Communication failures in patient sign‐out and suggestions for improvement: a critical incident analysis. Qual Saf Health Care. 2005;14(6):401–407.
- , , , . Medical errors involving trainees: a study of closed malpractice claims from 5 insurers. Archives of internal medicine. 2007;167(19):2030–2036.
- , , , et al. Patterns of communication breakdowns resulting in injury to surgical patients. J Am Coll Surg. 2007;204(4):533–540.
- Joint Commission International. Standard PC.02.02.01. 2013 Hospital Accreditation Standards. Oak Brook, IL: Joint Commission Resources; 2013.
- , , , , , . Hospitalist handoffs: a systematic review and task force recommendations. J Hosp Med. 2009;4(7):433–440.
- , , . Systematic review of handoff mnemonics literature. Am J Med Qual. 2009;24(3):196–204.
- , , , , . Using a computerized sign‐out program to improve continuity of inpatient care and prevent adverse events. Jt Comm J Qual Improv. 1998;24(2):77–87.
- , , , , . Impact of a new electronic handover system in surgery. Int J Surg. 2011;9(3):217–220.
- , , , . Organizing the transfer of patient care information: the development of a computerized resident sign‐out system. Surgery. 2004;136(1):5–13.
- , , , . Handover after pediatric heart surgery: a simple tool improves information exchange. Pediatr Crit Care Med. 2011;12(3):309–313.
- , , , et al. Simple standardized patient handoff system that increases accuracy and completeness. J Surg Educ. 2008;65(6):476–485.
- , , , et al. Enhancing patient safety in the trauma/surgical intensive care unit. J Trauma. 2009;67(3):430–433; discussion 433–435.
- , , . Standardized sign‐out reduces intern perception of medical errors on the general internal medicine ward. Teach Learn Med. 2009;21(2):121–126.
- , , , , . Gaining efficiency and satisfaction in the handoff process. J Hosp Med. 2010;5(9):547–552.
- , , . Identification of patient information corruption in the intensive care unit: using a scoring tool to direct quality improvements in handover. Crit Care Med. 2009;37(11):2905–2912.
- . Examining the effects that manipulating information given in the change of shift report has on nurses' care planning ability. J Adv Nurs. 2001;33(6):836–846.
- , , , et al. Evaluation of an asynchronous physician voicemail sign‐out for emergency department admissions. Ann Emerg Med. 2009;54(3):368–378.
- , , , et al. Surgical team behaviors and patient outcomes. Am J Surg. 2009;197(5):678–685.
- , , , , , . The value of adding a verbal report to written handoffs on early readmission following prolonged respiratory failure. Chest. 2010;138(6):1475–1479.
- , , , et al. Rates of medical errors and preventable adverse events among hospitalized children following implementation of a resident handoff bundle. JAMA. 2013;310(21):2262–2270.
- , , , . A new method of classifying prognostic comorbidity in longitudinal studies: development and validation. J Chronic Dis. 1987;40(5):373–383.
- , . IHI Global Trigger Tool for measuring adverse events (second edition). IHI Innovation Series white paper. Cambridge, MA: Institute for Healthcare Improvement; 2009. Available at: http://www.ihi.org/resources/Pages/IHIWhitePapers/IHIGlobalTriggerToolWhitePaper.aspx. www.IHI.org). Accessed June 1, 2014.
- National Coordinating Council for Medication Error Reporting and Prevention (NCC MERP) index for categorizing errors. Available at: http://www.nccmerp.org/medErrorCatIndex.html. Accessed June 1, 2014.
- , , , , , . Research electronic data capture (REDCap)—a metadata‐driven methodology and workflow process for providing translational research informatics support. J Biomed Inform. 2009;42(2):377–381.
- , . Statistics in Epidemiology: Methods, Techniques, and Applications. Boca Raton, FL: CRC Press; 1996.
- , , , , , . Safety of using a computerized rounding and sign‐out system to reduce resident duty hours. Acad Med. 2010;85(7):1189–1195.
Handoffs are key events in the care of hospitalized patients whereby vital information is relayed between healthcare providers. Resident duty hour restrictions and the popularity of shift‐based work schedules have increased the frequency of inpatient handoffs.[1, 2] Failures in communication at the time of patient handoff have been implicated as contributing factors to preventable adverse events.[3, 4, 5, 6] With patient safety in mind, accreditation organizations and professional societies have made the standardization of hospital handoff procedures a priority.[7, 8] A variety of strategies have been utilized to standardize handoffs. Examples include the use of mnemonics,[9] electronic resources,[10, 11, 12] preformatted handoff sheets,[13, 14, 15, 16] and optimization of the handoff environment.[17] The primary outcomes for many of these studies center on the provider by measuring their retention of patient facts[18, 19] and completion of tasks[14, 16] after handoff, for example. Few studies examined patient‐centered outcomes such as transfer to a higher level of care,[20] length of stay,[11] mortality,[21] or readmission rate.[22] A study in the pediatric population found that implementation of a handoff bundle was associated with a decrease in medical errors and preventable adverse events.[23]
The Society of Hospital Medicine recommends that patient handoffs consist of both a written and verbal component.[8] Providers in our division work on 3 shifts: day, evening, and night. In 2009, we developed a face‐to‐face morning handoff, during which night‐shift providers hand off patient care to day‐shift providers incorporating an electronically generated service information list.[17] Given that the evening shift ends well before the day shift begins, the evening‐shift providers do not participate in this face‐to‐face handoff of care for patients they admit to day providers.
We wished to compare the clinical outcomes and adverse events of patients admitted by the night‐shift providers to those admitted by the evening‐shift providers. We hypothesized that transfer of care using a face‐to‐face handoff would be associated with fewer adverse events and improved clinical outcomes.
METHODS
The study was deemed exempt by the Mayo Clinic Institutional Review Board.
Study Population
Hospitalists at the study institution, a 1157‐bed academic tertiary referral hospital, admit general medical patients from the emergency department, as transfers from other institutions, and as direct admissions from outpatient offices. Patients included in the study were all adults admitted by evening‐ and night‐shift hospitalists from August 1, 2011 through August 1, 2012 between 6:45 pm and midnight. Our institution primarily uses 2 levels of care for adult inpatients on internal medicine services, including a general care floor for low‐acuity patients and an intensive care unit for high‐acuity patients. All of the patients in this study were triaged as low acuity at the time of admission and were initially admitted to general care units.
Setting
The division's shift schedule during the study period is depicted in Figure 1. Day‐shift providers included a physician and nurse practitioner (NP) or physician assistant (PA) on each of 7 teams. Each service had an average daily patient census between 10 and 15 patients with 3 to 4 new admissions every 24 hours, with 1 to 2 of these admissions occurring during the evening and night shifts, on average. The day shift started at 7:45 am and ended at 7:45 pm, at which time the day teams transitioned care of their patients to 1 of 2 overnight NP/PAs who provided cross‐cover for all teams through the night. The overnight NP/PAs then transitioned care back to the day teams at 7:45 am the following morning.
Two evening‐shift providers, both physicians, including a staff hospitalist and a hospital medicine fellowship trainee, admitted patients without any cross‐cover responsibility. Their shifts had the same start time, but staggered end times (2 pm10 pm and 2 pmmidnight). At the end of their shifts, the evening‐shift providers relayed concerns or items for follow‐up to the night cross‐cover NP/PAs; however, this handoff was nonstandardized and provider dependent. The cross‐cover providers could also choose to pass on any relevant information to day‐shift providers if thought to be necessary, but this, again, was not required or standardized. A printed electronic handoff tool (including the patient's problem list, medications, vital signs, laboratory results, and to do list as determined by the admitting provider) as well as all clinical notes generated since admission were made available to day‐shift providers who assumed care at 7:45 am; however, there was no face‐to‐face handoff between the evening‐ and day‐shift providers.
Two night‐shift physicians, including a moonlighting board‐eligible internal medicine physician and staff hospitalist, also started at staggered times, 6:45 pm and 10 pm, but their shifts both ended at 7:45 am. These physicians also admitted patients without cross‐cover responsibilities. At 7:45 am, in a face‐to‐face meeting, they transitioned care of patients admitted overnight to day‐shift providers. This handoff occurred at a predesignated place with assigned start times for each team. During the meeting, printed electronic documents, including the aforementioned electronic handoff tool as well as all clinical notes generated since admission, were made available to the oncoming day‐shift providers. The face‐to‐face interaction between night‐ and day‐shift providers lasted approximately 5 minutes and allowed for a brief presentation of the patient, review of the diagnostic testing and treatments performed so far, as well as anticipatory guidance regarding potential issues throughout the remainder of the hospitalization. Although inclusion of the above components was encouraged during the face‐to‐face handoff, the interaction was not scripted and topics discussed were at the providers' discretion.
Patients admitted during the evening and night shifts were assigned to day‐shift services primarily based on the current census of each team, so as to distribute the workload evenly.
Chart Review
Patients included in the study were admitted by evening‐ or night‐shift providers between 6:45 pm and midnight. This time period accounts for when the evening shift and night shift overlap, allowing for direct comparison of patients admitted during the same time of day, so as to avoid confounding factors. Patients were grouped by whether they were admitted by an evening‐shift provider or a night‐shift provider. Each study patient's chart was retrospectively reviewed and relevant demographic and clinical data were collected. Demographic information included age, gender, and race. Clinical information included medical comorbidities, Charlson Comorbidity Index score, rapid response team calls, code team calls, transfers to a higher level of care, death in hospital, 30‐day readmission rate, length of stay (LOS), and adverse events. The Charlson Comorbidity Index score[24] was determined from diagnoses in the institution's medical index database. The 30‐day readmission rate included observation stays and full hospital admissions that occurred at our institution in the 30 days following the patient's hospital discharge from the index admission. LOS was determined based on the time of admission and discharge, as reported in the hospital billing system, and is reported as the median and mean LOS in hours for all patients in each group.
The Global Trigger Tool (GTT) was used to identify adverse events, as defined within the GTT whitepaper to be unintended physical injury resulting from or contributed to by medical care that requires additional monitoring, treatment or hospitalization, or that results in death.[25] Developed by the Institute for Healthcare Improvement, the GTT uses triggers, clues in the medical record that suggest an adverse event may have occurred, to cue a more detailed chart review. Registered nurses trained in use of the GTT reviewed all of the included patients' electronic medical records. If a trigger was identified (such as a patient fall suffered in the hospital), further chart review was prompted to determine if patient harm occurred. If there was evidence of harm, an adverse event was determined to have occurred and was then categorized using the National Coordinating Council for Medication Error Reporting and Prevention Index for Categorizing Errors.[26] For example, in the case of a patient fall whereby the patient was determined to have fallen in the hospital and suffered a laceration requiring wound care, but the hospital stay was not prolonged, this adverse event was categorized as category E (an adverse event that caused the patient temporary harm necessitating intervention, without prolongation of the hospital stay).
Outcomes including rapid response team calls, code team calls, transfers to a higher level of care, death in the hospital, and adverse events, as identified using the GTT, were counted if they occurred between 7:45 am on the first morning of admission until 12 hours later at 7:45 pm, at the time of the first evening handoff of the admitted patients' care.
Statistical Methods
Study data were collected and managed using REDCap (Research Electronic Data Capture) electronic data capture tools hosted at Mayo Clinic.[27] When comparing outcomes between the 2 groups, Fisher exact test was used for categorical variables and Student t test was used for continuous variables. Global Trigger Tool data were analyzed using the SAS GENMOD procedure, assuming a negative binomial distribution. All the above analyses were performed using SAS version 9.3 software (SAS Institute Inc., Cary, NC). Rates of adverse events were compared using MedCalc version 13 software (MedCalc Software, Ostend, Belgium).[28] A P value <0.05 was considered significant.
RESULTS
Of 805 patients admitted between 6:45 pm and midnight during the study period, 305 (37.9%) patients were handed off to day‐shift providers without face‐to‐face handoff, and 500 (62.1%) patients were transferred to the care of day‐shift providers with the use of a face‐to‐face handoff.
Baseline characteristics of both groups are depicted in Table 1. Demographic characteristics, including age, gender, and race, were not significantly different between groups. The mean Charlson Comorbidity Index score was not significantly different between the groups without and with a face‐to‐face handoff. In addition, the presence of medical comorbidities including type 2 diabetes mellitus, hypertension, coronary artery disease, hyperlipidemia, heart failure, body mass index (BMI) <18, active cancer, and current cigarette smoking were not significantly different between the 2 groups. There was a trend to a significantly increased proportion of patients with a BMI >30 in the group without face‐to‐face handoff (P=0.05).
| Without Face‐to‐Face Handoff, N=305 | With Face‐to‐Face Handoff, N=500 | P Value | |
|---|---|---|---|
| |||
| Age, y, mean (SD) | 65.8 (19.0) | 64.2 (20.0) | 0.25 |
| Sex, n (%) | 0.69 | ||
| Female | 166 (54%) | 265 (53%) | |
| Male | 139 (46%) | 235 (47%) | |
| Race, n (%) | 0.94 | ||
| White | 287 (95%) | 466 (93%) | |
| African American | 5 (2%) | 9 (2%) | |
| Arab/Middle Eastern | 3 (1%) | 8 (2%) | |
| Asian | 1 (0%) | 3 (1%) | |
| Indian subcontinental | 1 (0%) | 1 (0%) | |
| American Indian/Alaskan | 1 (0%) | 1 (0%) | |
| Other | 3 (1%) | 8 (2%) | |
| Unknown | 1 (0%) | 4 (1%) | |
| Charlson Comorbidity Index, mean ( SD) | 2.98 ( 3.73) | 2.93 ( 3.72) | 0.85 |
| Comorbidities, n (%) | |||
| Type 2 diabetes | 82 (27%) | 143 (29%) | 0.60 |
| Hypertension | 195 (64%) | 303 (61%) | 0.34 |
| Coronary artery disease | 76 (25%) | 137 (27%) | 0.44 |
| Hyperlipidemia | 122 (40%) | 206 (41%) | 0.74 |
| Heart failure | 30 (10%) | 66 (13%) | 0.15 |
| BMI >30 | 109 (36%) | 146 (29%) | 0.05 |
| BMI <18 | 7 (2%) | 12 (2%) | 0.92 |
| Active cancer | 29 (10%) | 46 (9%) | 0.88 |
| Current smoker | 49 (16%) | 90 (18%) | 0.48 |
Results for the outcomes of this study are depicted in Table 2. The frequency of rapid response team calls, code team calls, transfers to a higher level of care, and death in the hospital in the 12 hours following the first morning handoff of the admission were not significantly different between the 2 groups. Both 30‐day readmission rate and LOS (median and mean) were not significantly different between groups.
| Without Face‐to‐Face Handoff, N=305 | With Face‐to‐Face Handoff, N=500 | P Value | |
|---|---|---|---|
| |||
| Rapid response team call, n (%) | 4 (1%) | 5 (1%) | 0.68 |
| Code team call, n (%) | 0 (0%) | 1 (0%) | 0.43 |
| Transfer to higher level of care, n (%) | 7 (2%) | 11 (2%) | 0.93 |
| Patient death, n (%) | 0 (0%) | 0 (0%) | 1.00 |
| 30‐day readmission, n (%) | 50 (16%) | 67 (13%) | 0.23 |
| Hospital length of stay | |||
| Median, h (IQR) | 66.5 (41.3115.6) | 70.3 (41.9131.2) | 0.30 |
| Mean, h ( SD) | 102.0 ( 110.0) | 102.9 ( 94.0) | 0.90 |
| Adverse events (Global Trigger Tool) | |||
| Temporary harm and required intervention (E) | 4 | 7 | 0.92 |
| Temporary harm and required initial or prolonged hospitalization (F) | 7 | 8 | 0.53 |
| Permanent harm (G) | 0 | 1 | 0.44 |
| Intervention required to sustain life (H) | 0 | 6 | 0.14 |
| Death (I) | 0 | 0 | 1.00 |
| Total adverse events per 100 admissions | 3.61 | 4.40 | 0.59 |
| % of admissions with an adverse event | 2.6% | 3.2% | 0.64 |
There was no significant difference between the 2 groups in the frequency of adverse events resulting in harm for any of the categories (categories EI). Total adverse events between groups were also compared. Adverse events per 100 admissions were not significantly different between the group without face‐to‐face handoff compared to the group with face‐to‐face handoff. The percentage of admissions with an adverse event was also similar between groups.
DISCUSSION
We found no significant difference in the rate of rapid response team calls, code team calls, transfers to a higher level of care, death in hospital, or adverse events when comparing patients transitioned to the care of day‐shift providers with or without a face‐to‐face handoff. We hypothesize that a reason adverse events were no different between the 2 groups may be that providers were more vigilant when they did not receive a face‐to‐face handoff from the previous provider. As a result, providers may have dedicated additional time reviewing the medical record, speaking with the patients, and communicating with other healthcare providers to ensure a safe care transition. Similarly, other studies found no significant reduction in adverse events when using a standardized handoff.[10, 13, 29] This may be because patient handoff is 1 of a multitude of factors that impact the rate of adverse events, and a handoff may play a less vital role in a system where documentation of care for a given patient is readily accessible, uniform, and detailed. A face‐to‐face interaction itself in a patient handoff may be less pertinent if key information can be communicated through other channels, such as an electronic handoff tool, email, or phone.
Another potential explanation for the lack of a significant difference in patient outcomes with and without a face‐to‐face handoff is related to the study design and inherent rate of the events measured. With the exception of 30‐day readmission rate and LOS, the outcomes of the study were recorded only if they occurred in the 12 hours following the first morning handoff of the admission. This was done in an attempt to isolate the effect of the nonface‐to‐face versus face‐to‐face handoff on the first morning of the admission, and to avoid confounding effects by subsequent transitions of care later in the hospitalization. The frequency of hospital admissions in which an adverse event occurred during this relatively short 12‐hour window was approximately 3% for all patients in the study. With 805 total patients in the study, there may have been insufficient statistical power to detect a difference in the rate of outcomes, if a difference did exist, considering the event rate for both groups and the sample size.
There are several additional limitations to our study. First, the GTT was designed to be applied across the entirety of a hospitalization. By screening for adverse events over the span of only 12 hours for each hospitalization, the sensitivity of the tool may have been diminished, with a proportion of adverse events not captured, even when the sequence of events leading to patient harm began during the 12 hours in question. Second, this is a retrospective study, and all adverse events may not be documented in the medical record. Third, although not formally structured and infrequent, some evening‐shift providers did send an email or call the oncoming day‐shift provider to discuss patients admitted. This process, however, was provider dependent, unstructured, uncommon, and erratic, and thus we were not able to capture it from medical record review. Finally, the patients in this study were deemed low acuity upon triage prior to admission. A face‐to‐face handoff may be less important in ensuring patient safety when caring for low‐acuity compared to high‐acuity patients, considering the rapidity at which the critically ill can deteriorate.
Handoffs of patient care in the hospital have certainly increased in recent years. Consequently, communication among providers is undoubtedly important, with patient safety being the primary goal. Our work suggests that a face‐to‐face component of a handoff is not vital to ensure a safe care transition. Because of the increasing frequency of handoffs, providers' ability to do so face‐to‐face will likely be challenged by time and logistical constraints. Future work is needed to delineate the most effective components of the handoff so that we can design information transfer that promotes safe and efficient care, even without a face‐to‐face interaction.
Acknowledgements
The authors are grateful for support from the Mayo Clinic Department of Medicine Clinical Research Office, Ms. Donna Lawson, and Mr. Stephen Cha.
Disclosures: This publication was made possible by the Mayo Clinic Center for Clinical and Translational Science through grant number UL1 TR000135 from the National Center for Advancing Translational Science, a component of the National Institutes of Health. The authors report no conflicts of interest.
- , , , et al. Effect of the 2011 vs 2003 duty hour regulation‐compliant models on sleep duration, trainee education, and continuity of patient care among internal medicine house staff: a randomized trial. JAMA Intern Med. 2013;173(8):649–655.
- . 'Shift work': 24‐hour workdays are out as residents, hospitals deal with changes, mixed feelings on restrictions. Mod Healthc. 2011;41(30):6–7, 16, 1.
- , , , , . Consequences of inadequate sign‐out for patient care. Arch Intern Med. 2008;168(16):1755–1760.
- , , , , . Communication failures in patient sign‐out and suggestions for improvement: a critical incident analysis. Qual Saf Health Care. 2005;14(6):401–407.
- , , , . Medical errors involving trainees: a study of closed malpractice claims from 5 insurers. Archives of internal medicine. 2007;167(19):2030–2036.
- , , , et al. Patterns of communication breakdowns resulting in injury to surgical patients. J Am Coll Surg. 2007;204(4):533–540.
- Joint Commission International. Standard PC.02.02.01. 2013 Hospital Accreditation Standards. Oak Brook, IL: Joint Commission Resources; 2013.
- , , , , , . Hospitalist handoffs: a systematic review and task force recommendations. J Hosp Med. 2009;4(7):433–440.
- , , . Systematic review of handoff mnemonics literature. Am J Med Qual. 2009;24(3):196–204.
- , , , , . Using a computerized sign‐out program to improve continuity of inpatient care and prevent adverse events. Jt Comm J Qual Improv. 1998;24(2):77–87.
- , , , , . Impact of a new electronic handover system in surgery. Int J Surg. 2011;9(3):217–220.
- , , , . Organizing the transfer of patient care information: the development of a computerized resident sign‐out system. Surgery. 2004;136(1):5–13.
- , , , . Handover after pediatric heart surgery: a simple tool improves information exchange. Pediatr Crit Care Med. 2011;12(3):309–313.
- , , , et al. Simple standardized patient handoff system that increases accuracy and completeness. J Surg Educ. 2008;65(6):476–485.
- , , , et al. Enhancing patient safety in the trauma/surgical intensive care unit. J Trauma. 2009;67(3):430–433; discussion 433–435.
- , , . Standardized sign‐out reduces intern perception of medical errors on the general internal medicine ward. Teach Learn Med. 2009;21(2):121–126.
- , , , , . Gaining efficiency and satisfaction in the handoff process. J Hosp Med. 2010;5(9):547–552.
- , , . Identification of patient information corruption in the intensive care unit: using a scoring tool to direct quality improvements in handover. Crit Care Med. 2009;37(11):2905–2912.
- . Examining the effects that manipulating information given in the change of shift report has on nurses' care planning ability. J Adv Nurs. 2001;33(6):836–846.
- , , , et al. Evaluation of an asynchronous physician voicemail sign‐out for emergency department admissions. Ann Emerg Med. 2009;54(3):368–378.
- , , , et al. Surgical team behaviors and patient outcomes. Am J Surg. 2009;197(5):678–685.
- , , , , , . The value of adding a verbal report to written handoffs on early readmission following prolonged respiratory failure. Chest. 2010;138(6):1475–1479.
- , , , et al. Rates of medical errors and preventable adverse events among hospitalized children following implementation of a resident handoff bundle. JAMA. 2013;310(21):2262–2270.
- , , , . A new method of classifying prognostic comorbidity in longitudinal studies: development and validation. J Chronic Dis. 1987;40(5):373–383.
- , . IHI Global Trigger Tool for measuring adverse events (second edition). IHI Innovation Series white paper. Cambridge, MA: Institute for Healthcare Improvement; 2009. Available at: http://www.ihi.org/resources/Pages/IHIWhitePapers/IHIGlobalTriggerToolWhitePaper.aspx. www.IHI.org). Accessed June 1, 2014.
- National Coordinating Council for Medication Error Reporting and Prevention (NCC MERP) index for categorizing errors. Available at: http://www.nccmerp.org/medErrorCatIndex.html. Accessed June 1, 2014.
- , , , , , . Research electronic data capture (REDCap)—a metadata‐driven methodology and workflow process for providing translational research informatics support. J Biomed Inform. 2009;42(2):377–381.
- , . Statistics in Epidemiology: Methods, Techniques, and Applications. Boca Raton, FL: CRC Press; 1996.
- , , , , , . Safety of using a computerized rounding and sign‐out system to reduce resident duty hours. Acad Med. 2010;85(7):1189–1195.
© 2015 Society of Hospital Medicine

Munchausen Syndrome by Adult Proxy
Asher first described Munchausen syndrome by proxy over 60 years ago. Like the famous Baron von Munchausen, the persons affected have always traveled widely; and their stories like those attributed to him, are both dramatic and untruthful.[1] Munchausen syndrome is a psychiatric disorder in which a patient intentionally induces or feigns symptoms of physical or psychiatric illness to assume the sick role. In 1977, Meadow described the first case in which a caregiverperpetrator deliberately produced physical symptoms in a child for proxy gratification.[2] Unlike malingering, in which external incentives drive conscious symptom falsification, Munchausen syndrome by proxy (MSBP) is associated with fulfillment of the abuser's own psychological need for garnering praise from medical staff for devoted care given a sick child.[3, 4]
MSBP was once considered vanishingly rare. Many experts now believe it is more common, with a reported annual incidence of 0.4/100,000 in children younger than 16 years, and 2/100,000 in children younger than 1 year.[5] It is a disorder in which a parent, often the mother (94%99%)[6] and often with training or interest in the medical field,[5] is the perpetrator. The medical team caring for her child often views her as unusually helpful, and she is frequently psychiatrically ill with disorders such as depression, personality disorder, or prior personal history of somatoform or factitious disorder.[7, 8] The perpetrator typically inflicts physical harm, although occasionally she may simply lie about symptoms or tamper with laboratory samples.[5] The most common methods of inflicting harm are poisoning and suffocation. Overall mortality is 6% to 9%.[6, 9]
Although a large body of literature addresses pediatric cases, there is little to guide clinicians when victims are adults. An obvious reason may be that MSBP with adult proxies (MSB‐AP) has been reported so rarely, although we believe it is under‐recognized and more common than thought. The primary objective of this review was to identify all published cases of MSB‐AP, and synthesize them to characterize victims and perpetrators, modes of deceit, and relationships between victims and perpetrators so that clinicians will be better equipped to recognize such cases or at least include MSB‐AP in the differential of possibilities when symptoms and history are inconsistent.
METHODS
The Mayo Clinic Rochester Institutional Review Board approved this study. The databases of Ovid MEDLINE, Ovid EMBASE, PubMed, Web of Knowledge, and PsychINFO were searched from inception through April 2014 to identify all published cases of Munchausen by proxy in patients 18 years or older. The following search terms were used: Munchausen syndrome by proxy, factitious disorder by proxy, Munchausen syndrome, and factitious disorder. Reports were included when they described single or multiple cases of MSBP with victims aged at least 18 years. The search was not limited to articles published in English. Bibliographies of selected articles were reviewed for reports identifying additional cases.
RESULTS
We found 10 reports describing 11 cases of MSB‐AP and 1 report describing 2 unique cases of MSB‐AP (Tables 1 and 2). Two case reports were published in French[10, 11] and 1 in Polish.[12] Sigal et al.[13] describes 2 different victims with a common perpetrator, and another report[14] describes the same perpetrator with a third victim. One case, though cited as MSB‐AP in the literature was excluded because it did not meet the criteria for the disorder. In this case, the wife of a 28‐year‐old alcoholic male poured acid on him while he was inebriated, ostensibly to vent frustration and coerce him into sobriety.[15, 16]
| Author | Gender | Age, y | Presenting Features | Occupation/Education | Outcome |
|---|---|---|---|---|---|
| |||||
| Sigal M et al. (1986)[13] | F | 20s | Abscesses (skin) | NP | Death |
| F | 21 | Abscesses (skin) | Child care | Paraplegia | |
| Sigal MD et al. (1991)[14] | M | NP | Rash | NP | Abuse stopped |
| Smith NJ et al. (1989)[19] | M | 69 | None | Retired businessman | Continued fabrication |
| Krebs MO et al. (1996)[10] | M | 40s | Coma | Businessman | Abuse stopped |
| Ben‐Chetrit E et al. (1998)[20] | F | 73 | Coma | NP | Abuse stopped |
| Feldman KW et al. (1998)[8] | F | 21 | NP | Developmental delay | NP |
| Chodorowsk Z et al. (2003)[12] | F | 80 | Syncope | NP | Abuse stopped |
| Strubel D et al. (2003)[11] | F | 82 | None | NP | NP |
| Granot R et al. (2004)[21] | M | 71 | Coma | NP | Abuse stopped |
| Deimel GW et al. (2012)[17] | F | 23 | Rash | High school graduate | Continued abuse |
| F | 21 | Recurrent bacteremia | College student | Death | |
| Singh A et al. (2013)[22] | F | 79 | Fluid overload/false symptom history | Retired | Continued |
| Author | Gender | Age, y | Relationship | Occupation | Mode of Abuse | Outcome When Confronted |
|---|---|---|---|---|---|---|
| ||||||
| Sigal M et al. (1986)[13] | M | 26 | Husbanda | Businessman | Poisoningb followed by subcutaneous gasoline injection | Confession and incarceration |
| M | 29 | Boyfrienda | Businessman | Poisoningb followed by subcutaneous gasoline injection | Confession and incarceration | |
| Sigal MD et al. (1991)[14] | M | 34 | Cellmatea | Worked in medical clinic where incarcerated | Poisoningc followed by subcutaneous turpentine injection | Confession and attempted murder conviction |
| Smith NJ et al. (1989)[19] | F | 55 | Companion | Nurse | False history of hematuria, weakness, headaches | Denial |
| Krebs MO et al. (1996)[10] | F | 47 | Wife | Nurse | Tranquilizer injections | Confession and placed on probation |
| Ben‐Chetrit E et al. (1998)[20] | F | NP | Daughter | Nurse | Insulin injections | Denial |
| Feldman KW et al. (1998)[8] | F | NP | Mother | Business woman | False history of Batten's disease | NP |
| Chodorowsk Z et al. (2003)[12] | F | NP | Granddaughter | NP | Poisoningb | Denial |
| Strubel D et al. (2003)[11] | M | NP | Son | NP | False history of memory loss | NP |
| Granot R et al. (2004)[21] | F | NP | Wife | Hospital employee | Poisoningb | Confession |
| Deimel GW et al. (2012)[17] | F | NP | Mother | Unemployed chronic medical problems | Toxin application to skin | Denial |
| F | NP | Mother | Medical office receptionist | Intravenous injection unknown substance | Denial | |
| Singh A et al. (2013)[22] | M | NP | Son | NP | Fluid administration in context of fluid restriction/erratic medication administration/falsifying severity of symptoms | Denial |
Of the 13 victims, 9 (69%) were women and 4 (31%) were men. Of the ages reported, the median age was 69 years and the mean age was 51 (range, 2182 years). Exact age was not reported in 3 cases. Lying about signs and symptoms, but not actually inducing injury, occurred in 3 cases (23%), whereas in 10 cases (77%), the victims presented with physical findings, including coma (3), rash (2), skin abscesses (2), syncope (1), recurrent bacteremia (1), and fluid overload (1). Seven (54%) of the victims were poisoned, 2 via drug injection and 5 by beverage/food contamination. A perpetrator sedated 3 victims and subsequently injected them, 2 with gasoline and another with turpentine. Two of the victims were involved in business, 1 worked in childcare, 1 attended beauty school after graduating from high school, 1 attended college, and 1 was developmentally delayed. Victim education or occupation was not reported in 7 cases.
Of the 11 perpetrators, 8 (73%) were women, and 3 (27%) were men (note that the same male perpetrator had 3 victims). Median age was 34 years (range, 2655 years), although exact age was not reported in 4 cases. The perpetrator was the victim's mother in 3 cases, wife in 2 cases, son in 2 cases, and daughter, granddaughter, husband, companion, boyfriend, or prison cellmate in 1 case each. Five (38%) worked in healthcare.
All of the perpetrators were highly involved, even overly involved, in the care of their victims, frequently present, sometimes hovering, in hospital settings, and were viewed as generally helpful, if not overintrusive, by hospital staff. When confronted, 3 perpetrators confessed, 3 denied abuse that then ceased, and 4 more denied abuse that continued, culminating in death in 1 case. In 1 case, the outcome was not reported.[8] At least 3 victims remained with their perpetrators. Two perpetrators were criminally charged, 1 receiving probation and the other incarceration. The latter began abusing his cellmate, behavior that did not stop until he was confronted in prison.
CONCLUSION/DISCUSSION
Our primary objective was to locate and review all published cases of MSB‐AP. Our secondary aim was to describe salient characteristics of perpetrators, victims, and fabricated diseases in hopes of helping clinicians better recognize this disorder.
Our review shows that perpetrators were exclusively the victims' caregivers, including mothers, wives, husbands, daughters, granddaughters, or companions. These perpetrators, many with healthcare backgrounds, were attentive, helpful, and excessively present. In the majority of cases, hidden physical abuse yielded visible disease. Less commonly, perpetrators lied about symptoms rather than actually creating signs of disease. The most common mode of disease instigation involved poisoning through beverage/food contamination or subcutaneous injection. Geriatric and developmentally delayed persons appeared particularly vulnerable to victimization. Of the 13 victims, 5 were geriatric and 1 was developmentally delayed.
The adult cases we report are similar to child cases in that the perpetrators are caregivers; however, the caregivers of the adults are a more diverse group. Other similarities between adult and child cases are that physical signs occur more often than simply falsifying information, and poisoning is the most common method of disease fabrication. Suffocation, although common in child cases, has not been reported in adults. Though present in only a minority of cases, another feature distinguishing these cases from those reported in the pediatric literature is the presence of collusion between the perpetrator and victim. When MSBP was first described, Meadow believed that victims would reach an age at which the disorder would cease because they would fight back or report the abuse.[2] In 7 of the adult cases, the victims were unknowingly poisoned; however, in 2 cases,[17] the victims knew what their mothers were doing to them and yet denied that they were harming them. To explain this collusion, Deimel et al. proposed Stockholm syndrome, a condition in which a victim holds a perpetrator in high regard, despite experiencing at their hands what others might consider brainwashing and torture.
The data from the individual cases are sometimes frustratingly incomplete, with inconsistent reporting of dyad demographics and outcomes across the 13 cases, which compromises efforts to compare and contrast them. However, because no published studies have thoroughly reviewed all existing cases of MSB‐AP, we believe our review provides important insights into this condition by consolidating available information. It is our hope that by characterizing perpetrators, victims, and common presentations, we will raise awareness about this condition among healthcare providers so that it may be included in the differential diagnosis when they encounter this dyad: a patient's medical problems do not respond as expected to therapy and a caregivers appears overly involved or attention seeking.
The diagnosis of a factitious disorder often presents an immense clinical challenge and generally involves a multidisciplinary approach.[18] In addition to the incomplete data for existing cases in the literature, we recognize the ongoing difficulties in precise diagnosis of this disorder. Because a hallmark of pathology is secrecy at the outset and often denial, and even abrupt transition of care, upon confrontation, it is often very difficult, especially early on, to uncover patterns of perpetration, let alone posit a motive. We recognize that there may be some perpetrators who are motivated by something other than purely psychological end points, such as financial reward or even sexual victimization. And when alternate care venues are sought, clinicians are often left wondering. Further, the damage that may come to a therapeutic relationship by prematurely diagnosing MSB‐AP is important to keep in mind. Hospitalists who suspect MSB‐AP should consult psychiatry. Although MSB‐AP is a diagnosis of exclusion and often based on circumstantial evidence, psychiatry can assist in diagnosing this disorder and, in the event of a confession, provide immediate therapeutic intervention. Social services can aid in a vulnerable adult investigation for patients who do not have capacity.
When Meadow first described MSBP, he ended his article by asking Is this degree of falsification rare or is it under‐recognized? Time has answered Meadow's question. Now we ask the same question with regard to MSB‐AP, is it rare or under‐recognized? We must remain vigilant for this disorder. Early recognition can prevent healthcare providers from unknowingly perpetuating victimization by treating caregiver‐induced pathology as if legitimate, thereby satisfying the perpetrator's psychological needs. Despite Meadow's assertion that proxies outgrow their victimization, our review warns that advanced age does not preclude vulnerability and in some cases, may actually increase it. In the future, the incidence and prevalence of MSB‐AP is likely to increase as medical technology allows greater survival of cognitively impaired populations who are dependent on others for care. The elderly and developmentally delayed may be especially at risk.
ACKNOWLEDGMENTS
Disclosures: M.C.B., M.B.W., and M.I.L. report no conflicts of interest. J.M.B. receives payment for lectures, including service on speakers bureaus, from nonprofit continuing medical education organizations and universities for occasional lectures; however, this funding is not relevant to this review.
- . Munchausen syndrome. Lancet. 1951(1):339–341.
- . Munchausen syndrome by proxy. The hinterland of child abuse. Lancet. 1977;2(8033):343–345.
- American Psychiatric Association. Diagnostic and Statistical Manual of Mental Disorders, 4th Edition, Text Revision. 4th ed. Washington, DC: American Psychiatric Press; 2000.
- , , , et al. Position paper: definitional issues in Munchausen by proxy. Child Maltreat. 2002;7(2):105–111.
- , , , . Epidemiology of Munchausen syndrome by proxy, non‐accidental poisoning, and non‐accidental suffocation. Arch Dis Child. 1996;75(1):57–61.
- . Web of deceit: a literature review of Munchausen syndrome by proxy. Child Abuse Negl. 1987;11(4):547–563.
- , . Psychopathology of perpetrators of fabricated or induced illness in children: case series. Br J Psychiatry. 2011;199(2):113–118.
- , . The central venous catheter as a source of medical chaos in Munchausen syndrome by proxy. J Pediatr Surg. 1998;33(4):623–627.
- , . Munchausen syndrome by proxy: diagnosis and prevalence. Am J Orthopsychiatry. 1993;63(2):318–321.
- , , , . Munchhausen syndrome by proxy between two adults [in French]. Presse Med. 1996;25(12):583–586.
- , , . Munchhausen syndrome by proxy in an old woman [in French]. Revue Geriatr. 2003;28:425–428.
- , , , . Consciousness disturbances: a case report of Munchausen by proxy syndrome in an elderly patient [in Polish]. Przegl Lek. 2003;60(4):307–308.
- , , . Munchausen syndrome by adult proxy: a perpetrator abusing two adults. J Nerv Ment Dis. 1986;174(11):696–698.
- , , . Munchausen syndrome by adult proxy revisited. Isr J Psychiatry Relat Sci. 1991;28(1):33–36.
- , , , , , . Otolaryngology fantastica: the ear, nose, and throat manifestations of Munchausen's syndrome. Laryngoscope. 2012;122(1):51–57.
- . Witchcraft's syndrome: Munchausen's syndrome by proxy. Int J Dermatol. 1998;37(3):229–230.
- , , , , , . Munchausen syndrome by proxy: an adult dyad. Psychosomatics. 2012;53(3):294–299.
- , . Factitious disorders and malingering: challenges for clinical assessment and management. Lancet. 2014;383(9926):1422–1432.
- , . More in sickness than in health: a case study of Munchausen by proxy in the elderly. J Fam Ther. 1989;11(4):321–334.
- , . Recurrent hypoglycaemia in multiple myeloma: a case of Munchausen syndrome by proxy in an elderly patient. J Intern Med. 1998;244(2):175–178.
- , , , , . Idiopathic recurrent stupor: a warning. J Neurol Neurosurg Psychiatry. 2004;75(3):368–369.
- , , . Munchausen by proxy in older adults: A case report. Maced J Med Sci. 2013;6(2):178–181.
Asher first described Munchausen syndrome by proxy over 60 years ago. Like the famous Baron von Munchausen, the persons affected have always traveled widely; and their stories like those attributed to him, are both dramatic and untruthful.[1] Munchausen syndrome is a psychiatric disorder in which a patient intentionally induces or feigns symptoms of physical or psychiatric illness to assume the sick role. In 1977, Meadow described the first case in which a caregiverperpetrator deliberately produced physical symptoms in a child for proxy gratification.[2] Unlike malingering, in which external incentives drive conscious symptom falsification, Munchausen syndrome by proxy (MSBP) is associated with fulfillment of the abuser's own psychological need for garnering praise from medical staff for devoted care given a sick child.[3, 4]
MSBP was once considered vanishingly rare. Many experts now believe it is more common, with a reported annual incidence of 0.4/100,000 in children younger than 16 years, and 2/100,000 in children younger than 1 year.[5] It is a disorder in which a parent, often the mother (94%99%)[6] and often with training or interest in the medical field,[5] is the perpetrator. The medical team caring for her child often views her as unusually helpful, and she is frequently psychiatrically ill with disorders such as depression, personality disorder, or prior personal history of somatoform or factitious disorder.[7, 8] The perpetrator typically inflicts physical harm, although occasionally she may simply lie about symptoms or tamper with laboratory samples.[5] The most common methods of inflicting harm are poisoning and suffocation. Overall mortality is 6% to 9%.[6, 9]
Although a large body of literature addresses pediatric cases, there is little to guide clinicians when victims are adults. An obvious reason may be that MSBP with adult proxies (MSB‐AP) has been reported so rarely, although we believe it is under‐recognized and more common than thought. The primary objective of this review was to identify all published cases of MSB‐AP, and synthesize them to characterize victims and perpetrators, modes of deceit, and relationships between victims and perpetrators so that clinicians will be better equipped to recognize such cases or at least include MSB‐AP in the differential of possibilities when symptoms and history are inconsistent.
METHODS
The Mayo Clinic Rochester Institutional Review Board approved this study. The databases of Ovid MEDLINE, Ovid EMBASE, PubMed, Web of Knowledge, and PsychINFO were searched from inception through April 2014 to identify all published cases of Munchausen by proxy in patients 18 years or older. The following search terms were used: Munchausen syndrome by proxy, factitious disorder by proxy, Munchausen syndrome, and factitious disorder. Reports were included when they described single or multiple cases of MSBP with victims aged at least 18 years. The search was not limited to articles published in English. Bibliographies of selected articles were reviewed for reports identifying additional cases.
RESULTS
We found 10 reports describing 11 cases of MSB‐AP and 1 report describing 2 unique cases of MSB‐AP (Tables 1 and 2). Two case reports were published in French[10, 11] and 1 in Polish.[12] Sigal et al.[13] describes 2 different victims with a common perpetrator, and another report[14] describes the same perpetrator with a third victim. One case, though cited as MSB‐AP in the literature was excluded because it did not meet the criteria for the disorder. In this case, the wife of a 28‐year‐old alcoholic male poured acid on him while he was inebriated, ostensibly to vent frustration and coerce him into sobriety.[15, 16]
| Author | Gender | Age, y | Presenting Features | Occupation/Education | Outcome |
|---|---|---|---|---|---|
| |||||
| Sigal M et al. (1986)[13] | F | 20s | Abscesses (skin) | NP | Death |
| F | 21 | Abscesses (skin) | Child care | Paraplegia | |
| Sigal MD et al. (1991)[14] | M | NP | Rash | NP | Abuse stopped |
| Smith NJ et al. (1989)[19] | M | 69 | None | Retired businessman | Continued fabrication |
| Krebs MO et al. (1996)[10] | M | 40s | Coma | Businessman | Abuse stopped |
| Ben‐Chetrit E et al. (1998)[20] | F | 73 | Coma | NP | Abuse stopped |
| Feldman KW et al. (1998)[8] | F | 21 | NP | Developmental delay | NP |
| Chodorowsk Z et al. (2003)[12] | F | 80 | Syncope | NP | Abuse stopped |
| Strubel D et al. (2003)[11] | F | 82 | None | NP | NP |
| Granot R et al. (2004)[21] | M | 71 | Coma | NP | Abuse stopped |
| Deimel GW et al. (2012)[17] | F | 23 | Rash | High school graduate | Continued abuse |
| F | 21 | Recurrent bacteremia | College student | Death | |
| Singh A et al. (2013)[22] | F | 79 | Fluid overload/false symptom history | Retired | Continued |
| Author | Gender | Age, y | Relationship | Occupation | Mode of Abuse | Outcome When Confronted |
|---|---|---|---|---|---|---|
| ||||||
| Sigal M et al. (1986)[13] | M | 26 | Husbanda | Businessman | Poisoningb followed by subcutaneous gasoline injection | Confession and incarceration |
| M | 29 | Boyfrienda | Businessman | Poisoningb followed by subcutaneous gasoline injection | Confession and incarceration | |
| Sigal MD et al. (1991)[14] | M | 34 | Cellmatea | Worked in medical clinic where incarcerated | Poisoningc followed by subcutaneous turpentine injection | Confession and attempted murder conviction |
| Smith NJ et al. (1989)[19] | F | 55 | Companion | Nurse | False history of hematuria, weakness, headaches | Denial |
| Krebs MO et al. (1996)[10] | F | 47 | Wife | Nurse | Tranquilizer injections | Confession and placed on probation |
| Ben‐Chetrit E et al. (1998)[20] | F | NP | Daughter | Nurse | Insulin injections | Denial |
| Feldman KW et al. (1998)[8] | F | NP | Mother | Business woman | False history of Batten's disease | NP |
| Chodorowsk Z et al. (2003)[12] | F | NP | Granddaughter | NP | Poisoningb | Denial |
| Strubel D et al. (2003)[11] | M | NP | Son | NP | False history of memory loss | NP |
| Granot R et al. (2004)[21] | F | NP | Wife | Hospital employee | Poisoningb | Confession |
| Deimel GW et al. (2012)[17] | F | NP | Mother | Unemployed chronic medical problems | Toxin application to skin | Denial |
| F | NP | Mother | Medical office receptionist | Intravenous injection unknown substance | Denial | |
| Singh A et al. (2013)[22] | M | NP | Son | NP | Fluid administration in context of fluid restriction/erratic medication administration/falsifying severity of symptoms | Denial |
Of the 13 victims, 9 (69%) were women and 4 (31%) were men. Of the ages reported, the median age was 69 years and the mean age was 51 (range, 2182 years). Exact age was not reported in 3 cases. Lying about signs and symptoms, but not actually inducing injury, occurred in 3 cases (23%), whereas in 10 cases (77%), the victims presented with physical findings, including coma (3), rash (2), skin abscesses (2), syncope (1), recurrent bacteremia (1), and fluid overload (1). Seven (54%) of the victims were poisoned, 2 via drug injection and 5 by beverage/food contamination. A perpetrator sedated 3 victims and subsequently injected them, 2 with gasoline and another with turpentine. Two of the victims were involved in business, 1 worked in childcare, 1 attended beauty school after graduating from high school, 1 attended college, and 1 was developmentally delayed. Victim education or occupation was not reported in 7 cases.
Of the 11 perpetrators, 8 (73%) were women, and 3 (27%) were men (note that the same male perpetrator had 3 victims). Median age was 34 years (range, 2655 years), although exact age was not reported in 4 cases. The perpetrator was the victim's mother in 3 cases, wife in 2 cases, son in 2 cases, and daughter, granddaughter, husband, companion, boyfriend, or prison cellmate in 1 case each. Five (38%) worked in healthcare.
All of the perpetrators were highly involved, even overly involved, in the care of their victims, frequently present, sometimes hovering, in hospital settings, and were viewed as generally helpful, if not overintrusive, by hospital staff. When confronted, 3 perpetrators confessed, 3 denied abuse that then ceased, and 4 more denied abuse that continued, culminating in death in 1 case. In 1 case, the outcome was not reported.[8] At least 3 victims remained with their perpetrators. Two perpetrators were criminally charged, 1 receiving probation and the other incarceration. The latter began abusing his cellmate, behavior that did not stop until he was confronted in prison.
CONCLUSION/DISCUSSION
Our primary objective was to locate and review all published cases of MSB‐AP. Our secondary aim was to describe salient characteristics of perpetrators, victims, and fabricated diseases in hopes of helping clinicians better recognize this disorder.
Our review shows that perpetrators were exclusively the victims' caregivers, including mothers, wives, husbands, daughters, granddaughters, or companions. These perpetrators, many with healthcare backgrounds, were attentive, helpful, and excessively present. In the majority of cases, hidden physical abuse yielded visible disease. Less commonly, perpetrators lied about symptoms rather than actually creating signs of disease. The most common mode of disease instigation involved poisoning through beverage/food contamination or subcutaneous injection. Geriatric and developmentally delayed persons appeared particularly vulnerable to victimization. Of the 13 victims, 5 were geriatric and 1 was developmentally delayed.
The adult cases we report are similar to child cases in that the perpetrators are caregivers; however, the caregivers of the adults are a more diverse group. Other similarities between adult and child cases are that physical signs occur more often than simply falsifying information, and poisoning is the most common method of disease fabrication. Suffocation, although common in child cases, has not been reported in adults. Though present in only a minority of cases, another feature distinguishing these cases from those reported in the pediatric literature is the presence of collusion between the perpetrator and victim. When MSBP was first described, Meadow believed that victims would reach an age at which the disorder would cease because they would fight back or report the abuse.[2] In 7 of the adult cases, the victims were unknowingly poisoned; however, in 2 cases,[17] the victims knew what their mothers were doing to them and yet denied that they were harming them. To explain this collusion, Deimel et al. proposed Stockholm syndrome, a condition in which a victim holds a perpetrator in high regard, despite experiencing at their hands what others might consider brainwashing and torture.
The data from the individual cases are sometimes frustratingly incomplete, with inconsistent reporting of dyad demographics and outcomes across the 13 cases, which compromises efforts to compare and contrast them. However, because no published studies have thoroughly reviewed all existing cases of MSB‐AP, we believe our review provides important insights into this condition by consolidating available information. It is our hope that by characterizing perpetrators, victims, and common presentations, we will raise awareness about this condition among healthcare providers so that it may be included in the differential diagnosis when they encounter this dyad: a patient's medical problems do not respond as expected to therapy and a caregivers appears overly involved or attention seeking.
The diagnosis of a factitious disorder often presents an immense clinical challenge and generally involves a multidisciplinary approach.[18] In addition to the incomplete data for existing cases in the literature, we recognize the ongoing difficulties in precise diagnosis of this disorder. Because a hallmark of pathology is secrecy at the outset and often denial, and even abrupt transition of care, upon confrontation, it is often very difficult, especially early on, to uncover patterns of perpetration, let alone posit a motive. We recognize that there may be some perpetrators who are motivated by something other than purely psychological end points, such as financial reward or even sexual victimization. And when alternate care venues are sought, clinicians are often left wondering. Further, the damage that may come to a therapeutic relationship by prematurely diagnosing MSB‐AP is important to keep in mind. Hospitalists who suspect MSB‐AP should consult psychiatry. Although MSB‐AP is a diagnosis of exclusion and often based on circumstantial evidence, psychiatry can assist in diagnosing this disorder and, in the event of a confession, provide immediate therapeutic intervention. Social services can aid in a vulnerable adult investigation for patients who do not have capacity.
When Meadow first described MSBP, he ended his article by asking Is this degree of falsification rare or is it under‐recognized? Time has answered Meadow's question. Now we ask the same question with regard to MSB‐AP, is it rare or under‐recognized? We must remain vigilant for this disorder. Early recognition can prevent healthcare providers from unknowingly perpetuating victimization by treating caregiver‐induced pathology as if legitimate, thereby satisfying the perpetrator's psychological needs. Despite Meadow's assertion that proxies outgrow their victimization, our review warns that advanced age does not preclude vulnerability and in some cases, may actually increase it. In the future, the incidence and prevalence of MSB‐AP is likely to increase as medical technology allows greater survival of cognitively impaired populations who are dependent on others for care. The elderly and developmentally delayed may be especially at risk.
ACKNOWLEDGMENTS
Disclosures: M.C.B., M.B.W., and M.I.L. report no conflicts of interest. J.M.B. receives payment for lectures, including service on speakers bureaus, from nonprofit continuing medical education organizations and universities for occasional lectures; however, this funding is not relevant to this review.
- . Munchausen syndrome. Lancet. 1951(1):339–341.
- . Munchausen syndrome by proxy. The hinterland of child abuse. Lancet. 1977;2(8033):343–345.
- American Psychiatric Association. Diagnostic and Statistical Manual of Mental Disorders, 4th Edition, Text Revision. 4th ed. Washington, DC: American Psychiatric Press; 2000.
- , , , et al. Position paper: definitional issues in Munchausen by proxy. Child Maltreat. 2002;7(2):105–111.
- , , , . Epidemiology of Munchausen syndrome by proxy, non‐accidental poisoning, and non‐accidental suffocation. Arch Dis Child. 1996;75(1):57–61.
- . Web of deceit: a literature review of Munchausen syndrome by proxy. Child Abuse Negl. 1987;11(4):547–563.
- , . Psychopathology of perpetrators of fabricated or induced illness in children: case series. Br J Psychiatry. 2011;199(2):113–118.
- , . The central venous catheter as a source of medical chaos in Munchausen syndrome by proxy. J Pediatr Surg. 1998;33(4):623–627.
- , . Munchausen syndrome by proxy: diagnosis and prevalence. Am J Orthopsychiatry. 1993;63(2):318–321.
- , , , . Munchhausen syndrome by proxy between two adults [in French]. Presse Med. 1996;25(12):583–586.
- , , . Munchhausen syndrome by proxy in an old woman [in French]. Revue Geriatr. 2003;28:425–428.
- , , , . Consciousness disturbances: a case report of Munchausen by proxy syndrome in an elderly patient [in Polish]. Przegl Lek. 2003;60(4):307–308.
- , , . Munchausen syndrome by adult proxy: a perpetrator abusing two adults. J Nerv Ment Dis. 1986;174(11):696–698.
- , , . Munchausen syndrome by adult proxy revisited. Isr J Psychiatry Relat Sci. 1991;28(1):33–36.
- , , , , , . Otolaryngology fantastica: the ear, nose, and throat manifestations of Munchausen's syndrome. Laryngoscope. 2012;122(1):51–57.
- . Witchcraft's syndrome: Munchausen's syndrome by proxy. Int J Dermatol. 1998;37(3):229–230.
- , , , , , . Munchausen syndrome by proxy: an adult dyad. Psychosomatics. 2012;53(3):294–299.
- , . Factitious disorders and malingering: challenges for clinical assessment and management. Lancet. 2014;383(9926):1422–1432.
- , . More in sickness than in health: a case study of Munchausen by proxy in the elderly. J Fam Ther. 1989;11(4):321–334.
- , . Recurrent hypoglycaemia in multiple myeloma: a case of Munchausen syndrome by proxy in an elderly patient. J Intern Med. 1998;244(2):175–178.
- , , , , . Idiopathic recurrent stupor: a warning. J Neurol Neurosurg Psychiatry. 2004;75(3):368–369.
- , , . Munchausen by proxy in older adults: A case report. Maced J Med Sci. 2013;6(2):178–181.
© 2014 Society of Hospital Medicine
PMI After Hip Fracture Surgery
Perioperative myocardial infarction (PMI) often remains unrecognized with higher mortality in the aged.13 Perioperative ischemic symptoms are often masked by analgesia, sedation, and transient and subtle electrocardiographic (ECG) changes. Postoperative troponin measurement is not routinely done for PMI diagnosis. Hip fracture surgery is the most common non‐cardiac surgical procedure in the elderly, with limited data on clinical presentation of PMI.46 Moreover, the elderly are significantly underrepresented in clinical studies.7 We therefore examined the clinical presentation of PMI and its outcomes among elderly patients admitted for hip fracture repair.
METHODS
Study Population
A population‐based, retrospective, case‐control study was conducted of all residents in Olmsted County, Minnesota undergoing surgery for hip fracture repair from January 1, 1988 through December 31, 2002. Primary indication for the surgery was proximal femur (femoral neck or subtrochanteric) fracture. Patients who were <65 years old, had a pathological hip fracture, multiple injuries or fractures, surgery >72 hours after injury (due to higher mortality with delayed surgery),8 nonsurgical management of hip fracture repair, or incomplete data were excluded. All patients provided prior authorization to use their medical records for research, per institutional protocols.9
Criteria for Perioperative Myocardial Infarction and Death
We utilized the universal definition of acute myocardial infarction10 to define PMI within the first 7 days following hip fracture surgery. We included creatine kinase‐MB fraction (CK‐MB) as the biomarker for 1988July 2000, and troponin as the biomarker for August 20002002. Mortality was defined as death from any cause within the first year following hip fracture repair. Deaths were identified through the National Death Index.
Statistical Analysis
For each case of PMI, we identified 2 control patients who were selected at random from the non‐PMI patient population. These controls were matched to cases based on age at the time of surgery (5 years) and gender in 1:2 ratios. Baseline characteristics across PMI and non‐PMI groups were compared using the Kruskal‐Wallis test (for continuous data) and the chi‐square or Fisher's exact tests (for categorical data). Mean values were utilized in place of the missing values for the following variables: preoperative troponin (missing values 88 [17.5%]), CK‐MB (8 [1.6%]), troponin (21 [5.4%]), and postoperative hemoglobin (17 [3.4%]). Univariate predictors of PMI with P 0.2 baseline characteristics were entered into a multivariate, conditional, logistic regression analysis. Rates of outcomes were calculated using the Kaplan‐Meier method, and by a landmark survival curve for those with and without PMI. Cox proportional hazards analysis was utilized for survival analysis at 30 days and 1 year. All statistical tests were 2‐sided, and P values <0.05 were considered significant. All analyses were performed using SAS for UNIX (version 9.1.3; SAS Institute, Inc, Cary, NC).
RESULTS
In the cohort of 1212 with hip fracture surgeries, 167 (13.8%) cases of PMI occurred in the first 7 days, of which 153 (92%) occurred within the first 48 hours. A total of 334 controls were matched with 167 cases of PMI. Table 1 summarizes the demographic characteristics of the study participants. Of the patients with PMI, 25.2% experienced symptoms of ischemia; 7% reported chest pain, and 12% reported dyspnea. Only 22.8% of patients with PMI had ECG changes consistent with ischemia. ST elevation MI was present in 7.2% patients. PMI patients had a lower mean hemoglobin compared to the patients without PMI (8.9 mg/dL vs 9.4 mg/dL, P < 0.001). Median length of stay (LOS) in the hospital was higher among patients who experienced PMI (11.6 vs 7.4 days, P < 0.001). Overall in‐hospital mortality was 5.6%. There were 24 deaths (14.4%) in the PMI group compared to 4 (1.2%) in‐hospital deaths in patients without PMI (P < 0.001). A total of 473 (94%) patients survived to discharge. At 30‐day follow‐up, there were 29 (17.4%) deaths in the PMI group and 14 (4.2%) deaths in non‐PMI group. During the follow‐up for 1 year, there were 143 (29%) deaths: PMI 66 (39.5%) and 77 (23%) non‐PMI group (P < 0.01).
| Characteristics, n (%) | Patients With PMI | Patients Without PMI | P Value* |
|---|---|---|---|
| (N = 167) | (N = 334) | ||
| |||
| Age mean SD | 85.3 7.4 | 85.2 7.1 | 0.5 |
| Weight (kg) mean SD | 59.98 16.7 | 59.80 13.9 | 0.5 |
| Women | 127 (76.4) | 254 (76) | 0.5 |
| Any symptom of ischemia, n (%) | |||
| Chest/arm pain | 11 (7) | 4 (1) | 0.002 |
| Dyspnea | 20 (12) | 14 (4) | 0.001 |
| Nausea/vomiting | 8 (5) | 6 (2) | 0.08 |
| Diaphoresis | 1 (1) | 1 (0.3) | 1.0 |
| PND | 3 (2) | 1 (0.3) | 0.3 |
| ECG changes, n (%) | |||
| ST‐segment elevation MI | 12 (7.2) | 0 | 0.01 |
| New ECG changes consistent with ischemia | 38 (22.8) | 1(0.3) | 0.01 |
| Biochemical evidence of ischemia, n (%) | |||
| CK‐MB | 147 (88) | 20 (6) | 0.01 |
| Troponin | 52 (33) | 9 (3) | 0.001 |
| Laboratory markers | |||
| Hemoglobin gm/dL mean (SD) | 8.9 1.0 | 9.4 1.2 | 0.001 |
| Postoperative anemia (<8.0 gm/dL), n (%) | 22 (13.2) | 37 (11.1) | 0.5 |
| Length of stay (days), mean SD | 11.6 7.7 | 7.4 6.4 | 0.001 |
| In‐hospital outcome | <0.001 | ||
| Dead | 24 (14.4) | 4 (1.2) | |
| Alive | 143 (85.6) | 330 (98.8) | |
| 30‐Day outcome | <0.001 | ||
| Dead | 29 (17.4) | 14 (4.2) | |
| Alive | 138 (82.6) | 320 (95.8) | |
| 1‐Year outcome | <0.001 | ||
| Dead | 66 (39.5) | 77 (23) | |
| Alive | 101 (60.4) | 257 (77) | |
Table 2 describes the risk factors associated with PMI in‐hospital, 30‐day, and 1‐year mortality. Risk factors for PMI were coronary artery disease (CAD) (odds ratio [OR], 3.5; confidence interval [CI], 2.25.6), and serum creatinine >2 mg/dL (OR, 2.4; CI, 1.34.4). Risk factors for in‐hospital mortality were age 8589 (OR, 5.3; CI, 1.617.7), age 90 (OR, 8.9; CI, 2.630.8), PMI (OR 15.1; CI, 4.648.8), male gender (OR 5.8; CI, 2.215.2), dyspnea (OR 5.4; CI, 1.816.9), and hemoglobin <8.0 gm/dL (OR, 3.5; CI, 1.29.9). PMI was a strong predictor for 30‐day mortality (hazard ratio [HR], 4.3; CI, 2.18.9). Risk factors for 1‐year mortality were: age 90 (HR, 2.0; CI, 1.43.1), male gender (HR, 2.1; CI, 1.53.0), and PMI (HR, 1.9; CI, 1.42.7). Figures 1 and 2 describe the Kaplan‐Meier survival curves for patients with and without PMI.
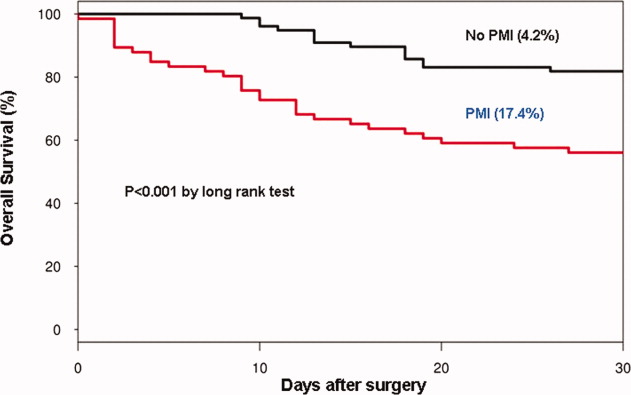
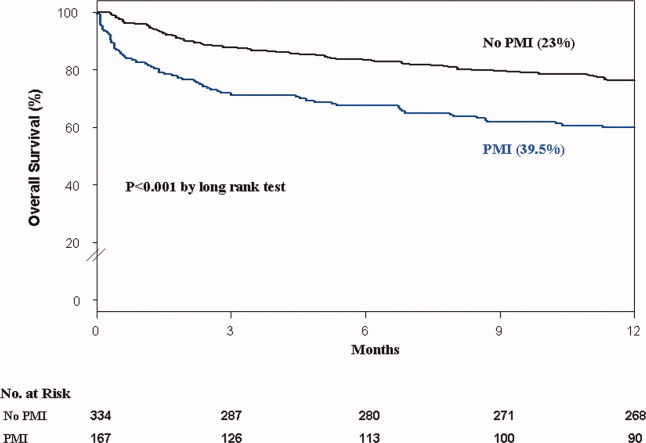
| Unadjusted OR (95% CI) | Adjusted OR (95% CI) | P Value | |
|---|---|---|---|
| |||
| Perioperative myocardial infarction | |||
| Coronary artery disease | 3.0 (2.14.5) | 3.5 (2.25.6) | <0.001 |
| Serum creatinine >2.0 mg/dL | 2.7 (1.64.8) | 2.4 (1.34.4) | 0.003 |
| In‐hospital mortality | |||
| Age 8589 | 1.7 (0.83.7) | 5.3 (1.617.7) | 0.01 |
| Age 90 | 2.2 (1.04.8) | 8.9 (2.630.8) | <0.001 |
| Male gender | 3.0 (1.46.4) | 5.8 (2.215.2) | <0.001 |
| Postoperative anemia (<8.0 gm/dL) | 4.2 (1.710.0) | 3.5 (1.29.9) | 0.02 |
| Perioperative myocardial infarction | 14.0 (5.248.0) | 15.1 (4.649.0) | <0.001 |
| 30‐Day mortality | |||
| Perioperative myocardial infarction | 4.1 (2.27.8) | 4.3 (2.18.9) | <0.001 |
| 1‐Year mortality | |||
| Age 8589 | 1.3 (0.81.9) | 1.6 (1.02.4) | <0.03 |
| Age 90 | 1.9 (1.32.9) | 2.0 (1.43.1) | 0.001 |
| Male gender | 1.9 (1.32.6) | 2.1 (1.53.0) | <0.001 |
| Dementia | 2.5 (1.83.6) | 2.7 (1.93.8) | <0.001 |
| Perioperative myocardial infarction | 2.0 (1.52.8) | 1.9 (1.42.7) | 0.001 |
DISCUSSION
We report the high incidence of PMI (13.8%) in the cohort of 1212 elderly patients (mean age 85 years) undergoing hip fracture surgery. Most PMI events (92%) occurred within the first 48 hours of surgery. Most of the events (75%) were asymptomatic. Elderly patients with PMI had an increased hospital LOS by 4.2 days, with high in‐hospital mortality (13.8%), 30‐day mortality (17.4%), and 1‐year mortality (39.5%).
Most of the PMI patients were identified with cardiac biomarkers on the basis of universal definition of MI within the first 48 hours. Although universal definition of MI does not define PMI as a separate type, PMI shares common pathophysiological pathways of Type 1 MI (primary coronary event) and Type 2 MI (myocardial oxygen supplydemand imbalance). Postoperative tachycardia, hemodynamic instability, anemia, and hypoxemia may initiate pathways causing more Type 2 MI. Our study highlights the continued need for active surveillance of clinical symptoms, postoperative ECG monitoring for STT changes, and utilizing cardiac troponin in older postoperative patients to improve diagnostic accuracy of PMI.
The current study has higher asymptomatic PMI events when compared to a study of Devereaux et al.11 The current study had an older population undergoing urgent hip fracture surgery, with a higher burden of CAD (60%) and renal failure (20%) with serum creatinine >2 gm/dL (see Supporting Information, Appendix 1, in the online version of this article). Older age and a higher burden of these risk factors may explain the higher incidence of PMI in the current study. Perioperative liberal use of analgesics in hip fracture surgery may explain more asymptomatic patients.
In light of the recently published FOCUS12 trial, an important finding from our study is that postoperative anemia among elderly (<8.0 gm/dL) is associated with a 3.5‐fold increased in‐hospital mortality. It is critical to maintain perioperative hemoglobin above 8.0 gm/dL in very elderly patients, due to asymptomatic presentation of PMI.
In the current study, PMI is associated with a 15‐fold increased risk of in‐hospital death and a 4.3‐fold increased risk of 30‐day mortality in the elderly. Advanced age (85 years) is a well known strong predictor of initial hospital admission and death in elderly patients after outpatient surgery.13 Furthermore, the odds for an in‐hospital death increase by 70% for each 10‐year increase in age.14 Therefore, early detection of silent PMI among at‐risk elderly patients by cardiac biomarkers may help in optimization of cardiac pharmacotherapy known to decrease short‐ and long‐term mortality.
There are limitations inherent to the retrospective design and methodology. Data collection was done through the year 2002. CK was used for the period that spans from 1988 to mid‐2000. Troponin was used from 2000 to 2002. Statin use was not analyzed for lack of significant data. Limited use of beta‐blockers (15%) and angiotensin‐converting‐enzyme (ACE) inhibitors (25%) may also contribute to higher events (see Supporting Information, Appendix 1, in the online version of this article).
CONCLUSIONS
Elderly patients have a higher incidence of PMI and mortality after hip fracture surgery than what guidelines indicate. The majority of the elderly patients with PMI did not experience ischemic symptoms and required cardiac biomarkers for diagnosis. The results of our study support the measurement of troponin in postoperative elderly patients for the diagnosis of PMI to implement in‐hospital preventive strategies to reduce PMI‐associated mortality.
Acknowledgements
The authors gratefully acknowledge the assistance of Ms Dawn Bergen in drafting and editing the manuscript.
Disclosures: This research was supported by funding from AHA grant 03‐30103N‐04, Rochester Epidemiology Project (grant RO1‐AR30582 from the National Institute of Arthritis and Musculoskeletal and Skin Diseases). The project was also supported by the National Center for Research Resources and the National Center for Advancing Translational Sciences, National Institutes of Health, through grant UL1 RR024150. The content is solely the responsibility of the authors and does not necessarily represent the official views of the NIH.
- , , , et al. Impact of age on perioperative complications and length of stay in patients undergoing noncardiac surgery. Ann Intern Med. 2001;134(8):637–643.
- , , , et al. Meta‐analysis: excess mortality after hip fracture among older women and men. Ann Intern Med. 2010;152(6):380–390.
- , , , et al. Body mass index (BMI) and risk of noncardiac postoperative medical complications in elderly hip fracture patients: a population‐based study. J Hosp Med. 2009;4(8):E1–E9.
- . History of the Rochester Epidemiology Project. Mayo Clin Proc. 1996;71(3):266–274.
- , , , . Incidence and mortality of hip fractures in the United States. JAMA. 2009;302(14):1573–1579.
- , , , et al. Body mass index and risk of adverse cardiac events in elderly patients with hip fracture: a population‐based study. J Am Geriatr Soc. 2009;57(3):419–426.
- , , , et al. Acute coronary care in the elderly, part I. Non‐ST‐segment‐elevation acute coronary syndromes: a scientific statement for healthcare professionals from the American Heart Association Council on Clinical Cardiology: in collaboration with the Society of Geriatric Cardiology. Circulation. 2007;115(19):2549–2569.
- , . Hip fracture mortality. A prospective, multifactorial study to predict and minimize death risk. Clin Orthop Relat Res. 1992;280:214–222.
- , , , et al. ACC/AHA/ACP‐ASIM guidelines for the management of patients with chronic stable angina. J Am Coll Cardiol. 1999;33(7):2092–2190.
- , , ; for the Joint ESC/ACCF/AHA/WHF Task Force for the Redefinition of Myocardial Infarction. Universal definition of myocardial infarction. J Am Coll Cardiol. 2007;50(22):2173–2195.
- , , , et al. Characteristics and short‐term prognosis of perioperative myocardial infarction in patients undergoing noncardiac surgery. Ann Intern Med. 2011;154(8):523–528.
- , , , et al. Liberal or restrictive transfusion in high‐risk patients after hip surgery. N Engl J Med. 2011;365(26):2453–2462.
- , , , . Inpatient hospital admission and death after outpatient surgery in elderly patients: importance of patient and system characteristics and location of care. Arch Surg. 2004;139(1):67–72.
- , , , et al. Predictors of hospital mortality in the global registry of acute coronary events. Arch Intern Med. 2003;163(19):2345–2353.
Perioperative myocardial infarction (PMI) often remains unrecognized with higher mortality in the aged.13 Perioperative ischemic symptoms are often masked by analgesia, sedation, and transient and subtle electrocardiographic (ECG) changes. Postoperative troponin measurement is not routinely done for PMI diagnosis. Hip fracture surgery is the most common non‐cardiac surgical procedure in the elderly, with limited data on clinical presentation of PMI.46 Moreover, the elderly are significantly underrepresented in clinical studies.7 We therefore examined the clinical presentation of PMI and its outcomes among elderly patients admitted for hip fracture repair.
METHODS
Study Population
A population‐based, retrospective, case‐control study was conducted of all residents in Olmsted County, Minnesota undergoing surgery for hip fracture repair from January 1, 1988 through December 31, 2002. Primary indication for the surgery was proximal femur (femoral neck or subtrochanteric) fracture. Patients who were <65 years old, had a pathological hip fracture, multiple injuries or fractures, surgery >72 hours after injury (due to higher mortality with delayed surgery),8 nonsurgical management of hip fracture repair, or incomplete data were excluded. All patients provided prior authorization to use their medical records for research, per institutional protocols.9
Criteria for Perioperative Myocardial Infarction and Death
We utilized the universal definition of acute myocardial infarction10 to define PMI within the first 7 days following hip fracture surgery. We included creatine kinase‐MB fraction (CK‐MB) as the biomarker for 1988July 2000, and troponin as the biomarker for August 20002002. Mortality was defined as death from any cause within the first year following hip fracture repair. Deaths were identified through the National Death Index.
Statistical Analysis
For each case of PMI, we identified 2 control patients who were selected at random from the non‐PMI patient population. These controls were matched to cases based on age at the time of surgery (5 years) and gender in 1:2 ratios. Baseline characteristics across PMI and non‐PMI groups were compared using the Kruskal‐Wallis test (for continuous data) and the chi‐square or Fisher's exact tests (for categorical data). Mean values were utilized in place of the missing values for the following variables: preoperative troponin (missing values 88 [17.5%]), CK‐MB (8 [1.6%]), troponin (21 [5.4%]), and postoperative hemoglobin (17 [3.4%]). Univariate predictors of PMI with P 0.2 baseline characteristics were entered into a multivariate, conditional, logistic regression analysis. Rates of outcomes were calculated using the Kaplan‐Meier method, and by a landmark survival curve for those with and without PMI. Cox proportional hazards analysis was utilized for survival analysis at 30 days and 1 year. All statistical tests were 2‐sided, and P values <0.05 were considered significant. All analyses were performed using SAS for UNIX (version 9.1.3; SAS Institute, Inc, Cary, NC).
RESULTS
In the cohort of 1212 with hip fracture surgeries, 167 (13.8%) cases of PMI occurred in the first 7 days, of which 153 (92%) occurred within the first 48 hours. A total of 334 controls were matched with 167 cases of PMI. Table 1 summarizes the demographic characteristics of the study participants. Of the patients with PMI, 25.2% experienced symptoms of ischemia; 7% reported chest pain, and 12% reported dyspnea. Only 22.8% of patients with PMI had ECG changes consistent with ischemia. ST elevation MI was present in 7.2% patients. PMI patients had a lower mean hemoglobin compared to the patients without PMI (8.9 mg/dL vs 9.4 mg/dL, P < 0.001). Median length of stay (LOS) in the hospital was higher among patients who experienced PMI (11.6 vs 7.4 days, P < 0.001). Overall in‐hospital mortality was 5.6%. There were 24 deaths (14.4%) in the PMI group compared to 4 (1.2%) in‐hospital deaths in patients without PMI (P < 0.001). A total of 473 (94%) patients survived to discharge. At 30‐day follow‐up, there were 29 (17.4%) deaths in the PMI group and 14 (4.2%) deaths in non‐PMI group. During the follow‐up for 1 year, there were 143 (29%) deaths: PMI 66 (39.5%) and 77 (23%) non‐PMI group (P < 0.01).
| Characteristics, n (%) | Patients With PMI | Patients Without PMI | P Value* |
|---|---|---|---|
| (N = 167) | (N = 334) | ||
| |||
| Age mean SD | 85.3 7.4 | 85.2 7.1 | 0.5 |
| Weight (kg) mean SD | 59.98 16.7 | 59.80 13.9 | 0.5 |
| Women | 127 (76.4) | 254 (76) | 0.5 |
| Any symptom of ischemia, n (%) | |||
| Chest/arm pain | 11 (7) | 4 (1) | 0.002 |
| Dyspnea | 20 (12) | 14 (4) | 0.001 |
| Nausea/vomiting | 8 (5) | 6 (2) | 0.08 |
| Diaphoresis | 1 (1) | 1 (0.3) | 1.0 |
| PND | 3 (2) | 1 (0.3) | 0.3 |
| ECG changes, n (%) | |||
| ST‐segment elevation MI | 12 (7.2) | 0 | 0.01 |
| New ECG changes consistent with ischemia | 38 (22.8) | 1(0.3) | 0.01 |
| Biochemical evidence of ischemia, n (%) | |||
| CK‐MB | 147 (88) | 20 (6) | 0.01 |
| Troponin | 52 (33) | 9 (3) | 0.001 |
| Laboratory markers | |||
| Hemoglobin gm/dL mean (SD) | 8.9 1.0 | 9.4 1.2 | 0.001 |
| Postoperative anemia (<8.0 gm/dL), n (%) | 22 (13.2) | 37 (11.1) | 0.5 |
| Length of stay (days), mean SD | 11.6 7.7 | 7.4 6.4 | 0.001 |
| In‐hospital outcome | <0.001 | ||
| Dead | 24 (14.4) | 4 (1.2) | |
| Alive | 143 (85.6) | 330 (98.8) | |
| 30‐Day outcome | <0.001 | ||
| Dead | 29 (17.4) | 14 (4.2) | |
| Alive | 138 (82.6) | 320 (95.8) | |
| 1‐Year outcome | <0.001 | ||
| Dead | 66 (39.5) | 77 (23) | |
| Alive | 101 (60.4) | 257 (77) | |
Table 2 describes the risk factors associated with PMI in‐hospital, 30‐day, and 1‐year mortality. Risk factors for PMI were coronary artery disease (CAD) (odds ratio [OR], 3.5; confidence interval [CI], 2.25.6), and serum creatinine >2 mg/dL (OR, 2.4; CI, 1.34.4). Risk factors for in‐hospital mortality were age 8589 (OR, 5.3; CI, 1.617.7), age 90 (OR, 8.9; CI, 2.630.8), PMI (OR 15.1; CI, 4.648.8), male gender (OR 5.8; CI, 2.215.2), dyspnea (OR 5.4; CI, 1.816.9), and hemoglobin <8.0 gm/dL (OR, 3.5; CI, 1.29.9). PMI was a strong predictor for 30‐day mortality (hazard ratio [HR], 4.3; CI, 2.18.9). Risk factors for 1‐year mortality were: age 90 (HR, 2.0; CI, 1.43.1), male gender (HR, 2.1; CI, 1.53.0), and PMI (HR, 1.9; CI, 1.42.7). Figures 1 and 2 describe the Kaplan‐Meier survival curves for patients with and without PMI.
| Unadjusted OR (95% CI) | Adjusted OR (95% CI) | P Value | |
|---|---|---|---|
| |||
| Perioperative myocardial infarction | |||
| Coronary artery disease | 3.0 (2.14.5) | 3.5 (2.25.6) | <0.001 |
| Serum creatinine >2.0 mg/dL | 2.7 (1.64.8) | 2.4 (1.34.4) | 0.003 |
| In‐hospital mortality | |||
| Age 8589 | 1.7 (0.83.7) | 5.3 (1.617.7) | 0.01 |
| Age 90 | 2.2 (1.04.8) | 8.9 (2.630.8) | <0.001 |
| Male gender | 3.0 (1.46.4) | 5.8 (2.215.2) | <0.001 |
| Postoperative anemia (<8.0 gm/dL) | 4.2 (1.710.0) | 3.5 (1.29.9) | 0.02 |
| Perioperative myocardial infarction | 14.0 (5.248.0) | 15.1 (4.649.0) | <0.001 |
| 30‐Day mortality | |||
| Perioperative myocardial infarction | 4.1 (2.27.8) | 4.3 (2.18.9) | <0.001 |
| 1‐Year mortality | |||
| Age 8589 | 1.3 (0.81.9) | 1.6 (1.02.4) | <0.03 |
| Age 90 | 1.9 (1.32.9) | 2.0 (1.43.1) | 0.001 |
| Male gender | 1.9 (1.32.6) | 2.1 (1.53.0) | <0.001 |
| Dementia | 2.5 (1.83.6) | 2.7 (1.93.8) | <0.001 |
| Perioperative myocardial infarction | 2.0 (1.52.8) | 1.9 (1.42.7) | 0.001 |
DISCUSSION
We report the high incidence of PMI (13.8%) in the cohort of 1212 elderly patients (mean age 85 years) undergoing hip fracture surgery. Most PMI events (92%) occurred within the first 48 hours of surgery. Most of the events (75%) were asymptomatic. Elderly patients with PMI had an increased hospital LOS by 4.2 days, with high in‐hospital mortality (13.8%), 30‐day mortality (17.4%), and 1‐year mortality (39.5%).
Most of the PMI patients were identified with cardiac biomarkers on the basis of universal definition of MI within the first 48 hours. Although universal definition of MI does not define PMI as a separate type, PMI shares common pathophysiological pathways of Type 1 MI (primary coronary event) and Type 2 MI (myocardial oxygen supplydemand imbalance). Postoperative tachycardia, hemodynamic instability, anemia, and hypoxemia may initiate pathways causing more Type 2 MI. Our study highlights the continued need for active surveillance of clinical symptoms, postoperative ECG monitoring for STT changes, and utilizing cardiac troponin in older postoperative patients to improve diagnostic accuracy of PMI.
The current study has higher asymptomatic PMI events when compared to a study of Devereaux et al.11 The current study had an older population undergoing urgent hip fracture surgery, with a higher burden of CAD (60%) and renal failure (20%) with serum creatinine >2 gm/dL (see Supporting Information, Appendix 1, in the online version of this article). Older age and a higher burden of these risk factors may explain the higher incidence of PMI in the current study. Perioperative liberal use of analgesics in hip fracture surgery may explain more asymptomatic patients.
In light of the recently published FOCUS12 trial, an important finding from our study is that postoperative anemia among elderly (<8.0 gm/dL) is associated with a 3.5‐fold increased in‐hospital mortality. It is critical to maintain perioperative hemoglobin above 8.0 gm/dL in very elderly patients, due to asymptomatic presentation of PMI.
In the current study, PMI is associated with a 15‐fold increased risk of in‐hospital death and a 4.3‐fold increased risk of 30‐day mortality in the elderly. Advanced age (85 years) is a well known strong predictor of initial hospital admission and death in elderly patients after outpatient surgery.13 Furthermore, the odds for an in‐hospital death increase by 70% for each 10‐year increase in age.14 Therefore, early detection of silent PMI among at‐risk elderly patients by cardiac biomarkers may help in optimization of cardiac pharmacotherapy known to decrease short‐ and long‐term mortality.
There are limitations inherent to the retrospective design and methodology. Data collection was done through the year 2002. CK was used for the period that spans from 1988 to mid‐2000. Troponin was used from 2000 to 2002. Statin use was not analyzed for lack of significant data. Limited use of beta‐blockers (15%) and angiotensin‐converting‐enzyme (ACE) inhibitors (25%) may also contribute to higher events (see Supporting Information, Appendix 1, in the online version of this article).
CONCLUSIONS
Elderly patients have a higher incidence of PMI and mortality after hip fracture surgery than what guidelines indicate. The majority of the elderly patients with PMI did not experience ischemic symptoms and required cardiac biomarkers for diagnosis. The results of our study support the measurement of troponin in postoperative elderly patients for the diagnosis of PMI to implement in‐hospital preventive strategies to reduce PMI‐associated mortality.
Acknowledgements
The authors gratefully acknowledge the assistance of Ms Dawn Bergen in drafting and editing the manuscript.
Disclosures: This research was supported by funding from AHA grant 03‐30103N‐04, Rochester Epidemiology Project (grant RO1‐AR30582 from the National Institute of Arthritis and Musculoskeletal and Skin Diseases). The project was also supported by the National Center for Research Resources and the National Center for Advancing Translational Sciences, National Institutes of Health, through grant UL1 RR024150. The content is solely the responsibility of the authors and does not necessarily represent the official views of the NIH.
- , , , et al. Impact of age on perioperative complications and length of stay in patients undergoing noncardiac surgery. Ann Intern Med. 2001;134(8):637–643.
- , , , et al. Meta‐analysis: excess mortality after hip fracture among older women and men. Ann Intern Med. 2010;152(6):380–390.
- , , , et al. Body mass index (BMI) and risk of noncardiac postoperative medical complications in elderly hip fracture patients: a population‐based study. J Hosp Med. 2009;4(8):E1–E9.
- . History of the Rochester Epidemiology Project. Mayo Clin Proc. 1996;71(3):266–274.
- , , , . Incidence and mortality of hip fractures in the United States. JAMA. 2009;302(14):1573–1579.
- , , , et al. Body mass index and risk of adverse cardiac events in elderly patients with hip fracture: a population‐based study. J Am Geriatr Soc. 2009;57(3):419–426.
- , , , et al. Acute coronary care in the elderly, part I. Non‐ST‐segment‐elevation acute coronary syndromes: a scientific statement for healthcare professionals from the American Heart Association Council on Clinical Cardiology: in collaboration with the Society of Geriatric Cardiology. Circulation. 2007;115(19):2549–2569.
- , . Hip fracture mortality. A prospective, multifactorial study to predict and minimize death risk. Clin Orthop Relat Res. 1992;280:214–222.
- , , , et al. ACC/AHA/ACP‐ASIM guidelines for the management of patients with chronic stable angina. J Am Coll Cardiol. 1999;33(7):2092–2190.
- , , ; for the Joint ESC/ACCF/AHA/WHF Task Force for the Redefinition of Myocardial Infarction. Universal definition of myocardial infarction. J Am Coll Cardiol. 2007;50(22):2173–2195.
- , , , et al. Characteristics and short‐term prognosis of perioperative myocardial infarction in patients undergoing noncardiac surgery. Ann Intern Med. 2011;154(8):523–528.
- , , , et al. Liberal or restrictive transfusion in high‐risk patients after hip surgery. N Engl J Med. 2011;365(26):2453–2462.
- , , , . Inpatient hospital admission and death after outpatient surgery in elderly patients: importance of patient and system characteristics and location of care. Arch Surg. 2004;139(1):67–72.
- , , , et al. Predictors of hospital mortality in the global registry of acute coronary events. Arch Intern Med. 2003;163(19):2345–2353.

Alcohol Withdrawal Admissions
Many patients are admitted and readmitted to acute care hospitals with alcohol‐related diagnoses, including alcohol withdrawal syndrome (AWS), and experience significant morbidity and mortality. In patients with septic shock or at risk for acute respiratory distress syndrome (ARDS), chronic alcohol abuse is associated with increased ARDS and severity of multiple organ dysfunction.1 Among intensive care unit (ICU) patients, those with alcohol dependence have higher morbidity, including septic shock, and higher hospital mortality.2 Patients who experience AWS as a result of alcohol dependence may experience life‐threatening complications, such as seizures and delirium tremens.3,4 In‐hospital mortality from AWS is historically high,5 but with benzodiazepines used in a symptom‐driven manner to treat the complications of alcohol use, hospital mortality rates are more recently reported at 2.4%.6
As inpatient outcomes1,2,7 and hospital mortality810 are negatively affected by alcohol abuse, the post‐hospital course of these patients is also of interest. Specifically, patients are often admitted and readmitted with alcohol‐related diagnoses or AWS to acute care hospitals, but relatively little quantitative data exist on readmission factors in this population.11 Patients readmitted to detoxification units or alcohol and substance abuse units have been studied, and factors associated with readmission include psychiatric disorder,1217 female gender,14,15 and delay in rehabilitation aftercare.18
These results cannot be generalized to patients with AWS who are admitted and readmitted to acute‐care hospitals. First, patients hospitalized for alcohol withdrawal symptoms are often medically ill with more severe symptoms, and more frequent coexisting medical and psychiatric illnesses, that complicate the withdrawal syndrome. Detoxification units and substance abuse units require patients to be medically stable before admission, because they do not have the ability to provide a high level of supervision and treatment. Second, much of what we know regarding risk factors for readmission to detoxification centers and substance abuse units comes from studies of administrative data of the Veterans Health Administration,12,13 Medicare Provider Analysis and Review file,16 privately owned outpatient substance abuse centers,14 and publicly funded detoxification centers.18 These results may be difficult to generalize to other patient populations. Accordingly, the objective of this study was to identify demographic and clinical factors associated with multiple admissions to a general medicine service for treatment of AWS over a 3‐year period. Characterization of these high‐risk patients and their hospital course may help focus intervention and reduce these revolving door admissions.
METHODS
The Mayo Clinic Institutional Review Board deemed the study exempt.
Patient Selection
The study was conducted at an 1157‐bed academic tertiary referral hospital, located in the Midwest, that has approximately 15,000 inpatient admissions to general medicine services annually and serves as the main referral center for the region. Patients included in this study were adults admitted to general medicine services and treated with symptom‐triggered Clinical Institute Withdrawal AssessmentAlcohol Revised (CIWA‐Ar) protocol19 between January 1, 2006 and December 31, 2008. Patients were identified using the Mayo Clinic Quality Improvement Resource Center database, as done in a previous CIWA‐Ar study.20 Patients were excluded if the primary diagnosis was a nonalcohol‐related diagnosis (Figure 1).
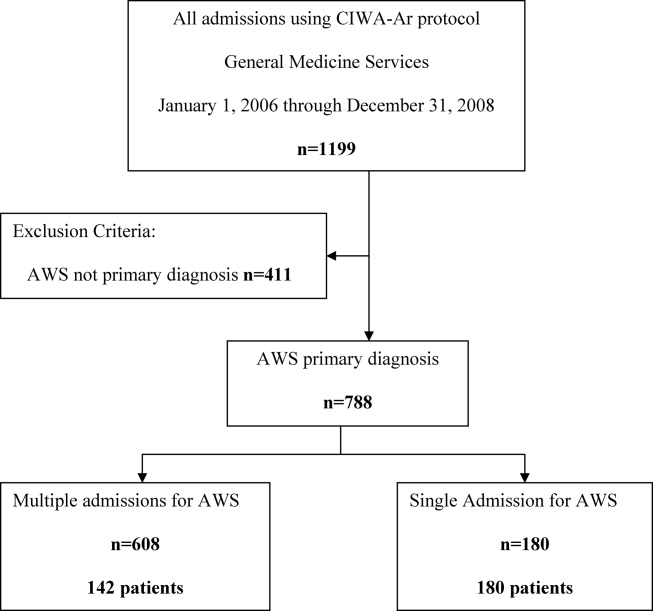
Patients were placed in 1 of 2 groups based on number of admissions during the study period, either a single‐admission group or a multiple‐admissions group. While most readmission studies use a 30‐day mark from discharge, we used 3 years to better capture relapse and recidivism in this patient population. The 2 groups were then compared retrospectively. To insure that a single admission was not arbitrarily created by the December 2008 cutoff, we reviewed the single‐admission group for additional admissions through June of 2009. If a patient did have a subsequent admission, then the patient was moved to the multiple‐admissions group.
Clinical Variables
Demographic and clinical data was obtained using the Mayo Data Retrieval System (DRS), the Mayo Clinic Life Sciences System (MCLSS) database, and electronic medical records. Clinical data for the multiple‐admissions group was derived from the first admission of the study period, and subsequently referred to as index admission. Specific demographic information collected included age, race, gender, marital status, employment status, and education. Clinical data collected included admitting diagnosis, comorbid medical disorders, psychiatric disorders, and CIWA‐Ar evaluations including highest total score (CIWA‐Ar score [max] and component scores). The CIWA‐Ar protocol is a scale to assess the severity of alcohol withdrawal, based on 10 symptoms of alcohol withdrawal ranging from 0 (not present) to 7 (extremely severe). The protocol requires the scale to be administered hourly, and total scores guide the medication dosing and administration of benzodiazepines to control withdrawal symptoms. Laboratory data collected included serum ammonia, alanine aminotransferase(ALT), and admission urine drug screen. For the purposes of this study, a urine drug screen was considered positive if a substance other than alcohol was present. Length of stay (LOS) and adverse events during hospitalization (delirium tremens, intubations, rapid response team [RRT] calls, ICU transfers, and in‐hospital mortality) were also collected.
Medical comorbidity was measured using the Charlson Comorbidity Index (CCI).21 The CCI was scored electronically using diagnoses in the institution's medical index database dating back 5 years from patient's first, or index, admission. Originally validated as a prognostic tool for mortality 1 year after admission in medical patients, the CCI was chosen as it accounts for most medical comorbidities.21 Data was validated, by another investigator not involved in the initial abstracting process, by randomly verifying 5% of the abstracted data.
Statistical Analysis
Standard descriptive statistics were used for patient characteristics and demographics. Comparing the multiple‐admissions group and single‐admission group, categorical variables were evaluated using the Fisher exact test or Pearson chi‐square test. Continuous variables were evaluated using 2‐sample t test. Multivariate logistic model analyses with stepwise elimination method were used to identify risk factors that were associated with multiple admissions. Age, gender, and variables that were statistically significant in the univariate analysis were used in stepwise regression to get to the final model. A P value of 0.05 was considered statistically significant. All statistical analyses were performed using SAS version 9.3 software (SAS Institute, Cary, NC).
RESULTS
The CIWA‐Ar protocol was ordered on 1199 admissions during the study period. Of these, 411 (34.3%) admissions were excluded because AWS was not the primary diagnosis, leaving 788 (65.7%) admissions for 322 patients, which formed the study population. Of the 322 patients, 180 (56%) had a single admission and 142 (44%) had multiple admissions.
Univariate analyses of demographic and clinical variables are shown in Tables 1 and 2, respectively. Patients with multiple admissions were more likely divorced (P = 0.028), have a high school education or less (P = 0.002), have a higher CCI score (P < 0.0001), a higher CIWA‐Ar score (max) (P < 0.0001), a higher ALT level (P = 0.050), more psychiatric comorbidity (P < 0.026), and a positive urine drug screen (P < 0.001). Adverse events were not significantly different between the 2 groups (Table 2).
| Variable | Single Admission N = 180 | Multiple Admissions N = 142 | P Value |
|---|---|---|---|
| |||
| Age, years (SD) | 47.85 (12.84) | 45.94 (12) | 0.170 |
| Male, No. (%) | 122 (68) | 109 (77) | 0.080 |
| Race/Ethnicity, No. (%) | 0.270 | ||
| White | 168 (93) | 132 (93) | |
| African American | 6 (3) | 3 (2) | |
| Asian | 0 (0) | 1 (1) | |
| Middle Eastern | 3 (2) | 0 (0) | |
| Other | 3 (2) | 6 (4) | |
| Relationship status, No. (%) | 0.160 | ||
| Divorced | 49 (27) | 55 (39) | 0.028* |
| Married | 54 (30) | 34 (24) | 0.230 |
| Separated | 9 (5) | 4 (3) | 0.323 |
| Single | 59 (33) | 38 (27) | 0.243 |
| Widowed | 5 (3) | 3 (2) | 0.703 |
| Committed | 4 (2) | 7 (5) | 0.188 |
| Unknown | 0 (0) | 1 (1) | 0.259 |
| Education, No. (%) | 0.002* | ||
| High school graduate, GED, or less | 49 (28) | 67 (47) | |
| Some college or above | 89 (49) | 60 (42) | |
| Unknown | 41 (23) | 15 (11) | |
| Employment, No. (%) | 0.290 | ||
| Retired | 26 (14) | 12 (8) | |
| Employed | 72 (40) | 51 (36) | |
| Unemployed | 51 (28) | 51 (36) | |
| Homemaker | 9 (5) | 4 (3) | |
| Work disabled | 20 (11) | 23 (16) | |
| Student | 1 (1) | 0 (0) | |
| Unknown | 1 (1) | 1 (1) | |
| Variable | Single Admission N = 180 | Multiple Admissions N = 142 | P Value |
|---|---|---|---|
| |||
| LOS, mean (SD) | 3.71 (7.10) | 2.72 (3.40) | 0.130 |
| Charlson Comorbidity Index, mean (SD) | 1.7 (2.23) | 2.51 (2.90) | 0.005* |
| Medical comorbidity, No. (%) | |||
| Diabetes mellitus | 6 (3) | 16 (11) | 0.005* |
| Cardiovascular disease | 6 (3) | 15 (11) | 0.050* |
| Cerebrovascular disease | 0 (0) | 3 (2) | 0.009* |
| Hypertension | 53 (30) | 36 (25) | 0.400 |
| Cancer | 17 (7) | 10 (9) | 0.440 |
| Psychiatric comorbidity, No. (%) | 97 (54) | 94 (66) | 0.026* |
| Adjustment disorder | 0 (0) | 6 (4) | 0.005* |
| Depressive disorder | 85 (47) | 76 (54) | 0.260 |
| Bipolar disorder | 6 (3) | 10 (7) | 0.130 |
| Psychotic disorder | 4 (2) | 6 (4) | 0.030* |
| Anxiety disorder | 30 (17) | 25 (18) | 0.820 |
| Drug abuse | 4 (2) | 4 (3) | 0.730 |
| Eating disorder | 0 (0) | 3 (2) | 0.050* |
| CIWA‐Ar scores | |||
| CIWA‐Ar score (max), mean (SD) | 15 (8) | 20 (9) | <0.000* |
| Component, mean (SD) | |||
| Agitation | 20 (11) | 36 (25) | 0.001* |
| Anxiety | 23 (13) | 38 (27) | 0.001* |
| Auditory disturbance | 4 (2) | 9 (6) | 0.110 |
| Headache | 11 (6) | 26 (18) | 0.001* |
| Nausea/vomiting | 5 (3) | 17 (12) | 0.003* |
| Orientation | 52 (29) | 72 (51) | 0.001* |
| Paroxysm/sweats | 9 (5) | 17 (12) | 0.023* |
| Tactile disturbance | 25 (14) | 54 (38) | 0.001* |
| Tremor | 35 (19) | 47 (33) | 0.004* |
| Visual disturbance | 54 (30) | 77 (54) | 0.001* |
| ALT (U/L), mean (SD) | 76 (85) | 101 (71) | 0.050* |
| Ammonia (mcg N/dl), mean (SD) | 25 (14) | 29 (29) | 0.530 |
| Positive urine drug screen, No. (%) | 25 (14) | 49 (35) | <0.001* |
| Tetrahydrocannabinol | 14 (56) | 19 (39) | |
| Cocaine | 8 (32) | 8 (16) | |
| Benzodiazepine | 6 (24) | 11 (22) | |
| Opiate | 4 (16) | 13 (26) | |
| Amphetamine | 2 (8) | 2 (4) | |
| Barbiturate | 1 (4) | 0 (0) | |
| Adverse event, No. (%) | |||
| RRT | 1 (1) | 1 (1) | 0.866 |
| ICU transfer | 32 (18) | 20 (14) | 0.550 |
| Intubation | 12 (7) | 4 (3) | 0.890 |
| Delirium tremens | 7 (4) | 4 (3) | 0.600 |
| In‐hospital mortality | 0 (0) | 0 (0) | |
Multivariate logistic model analysis was performed using the variables age, male gender, divorced marital status, high school education or less, CIWA‐Ar score (max), CCI score, psychiatric comorbidity, and positive urine drug screen. With a stepwise elimination process, the final model showed that multiple admissions were associated with high school education or less (P = 0.0071), higher CCI score (P = 0.0010), higher CIWA‐Ar score (max) (P < 0.0001), a positive urine drug screen (P = 0.0002), and psychiatric comorbidity (P = 0.0303) (Table 3).
| Variable | Adjusted Odds Ratio (95% CI) | P Value |
|---|---|---|
| ||
| High school education or less | 2.074 (1.219, 3.529) | 0.0071* |
| CIWA‐Ar score (max) | 1.074 (1.042, 1.107) | <0.0001* |
| Charlson Comorbidity Index | 1.232 (1.088, 1.396) | 0.0010* |
| Psychiatric comorbidity | 1.757 (1.055, 2.928) | 0.0303* |
| Positive urine drug screen | 3.180 (1.740, 5.812) | 0.0002* |
DISCUSSION
We provide important information regarding identification of individuals at high risk for multiple admissions to general medicine services for treatment of AWS. This study found that patients with multiple admissions for AWS had more medical comorbidity. They had more cases of diabetes mellitus, cardiovascular disease, and cerebrovascular disease, and their CCI scores were higher. They also had higher CIWA‐Ar (max) scores, as well as higher CIWA‐Ar component scores, indicating a more severe withdrawal.
Further, psychiatric comorbidity was also associated with multiple admissions. Consistent with the high prevalence in alcoholic patients, psychiatric comorbidity was common in both patients with a single admission and multiple admissions. We also found that a positive urine drug screen was associated with multiple admissions. Interestingly, few patients in each group had a diagnosis recorded in the medical record of an additional substance abuse disorder, yet 14% of patients with a single admission and 29% of patients with multiple admissions had a positive urine drug screen for a non‐alcohol substance. Psychiatric comorbidity, including additional substance abuse, is a well‐established risk factor for readmission to detoxification centers.1215, 17,22,23 Also, people with either an alcohol or non‐alcohol drug addiction, are known to be 7 times more likely to have another addiction than the rest of the population.24 This study suggests clinicians may underrecognize additional substance abuse disorders which are common in this patient population.
In contrast to studies of patients readmitted to detoxification units and substance abuse units,14,15,18,22 we found level of education, specifically a high school education or less, to be associated with multiple admissions. In a study of alcoholics, Greenfield and colleagues found that lower education in alcoholics predicts shorter time to relapse.25 A lack of education may result in inadequate healthcare literacy. Poor health behavior choices that follow may lead to relapse and subsequent admissions for AWS. With respect to other demographic variables, patients in our study population were predominantly men, which is not surprising. Gender differences in alcoholism are well established, with alcohol abuse and dependence more prevalent in men.26 We did not find gender associated with multiple admissions.
Our findings have management and treatment implications. First, providers who care for patients with AWS should not simply focus on treating withdrawal signs and symptoms, but also screen for and address other medical issues, which may not be apparent or seem stable at first glance. While a comorbid medical condition may not be the primary reason for hospital admission, comorbid medical conditions are known to be a source of psychological distress27 and have a negative effect on abstinence. Second, all patients should be screened for additional substance abuse. Initial laboratory testing should include a urine drug screen. Third, before discharging the patient, providers should establish primary care follow‐up for continued surveillance of medical issues. There is evidence that primary care services are predictive of better substance abuse treatment outcomes for those with medical problems.28,29
Finally, inpatient psychiatric consultation, upon admission, is essential for several reasons. First, the psychiatric team can help with initial management and treatment of the alcohol withdrawal regardless of stage and severity, obtain a more comprehensive psychiatric history, and assess for the presence of psychiatric comorbidities that may contribute to, aggravate, or complicate the clinical picture. The team can also address other substance abuse issues when detected by drug screen or clinical history. The psychiatric team, along with chemical‐dependency counselors and social workers, can provide valuable input regarding chemical‐dependency resources available on discharge and help instruct the patient in healthy behaviors. Because healthcare illiteracy may be an issue in this patient population, these instructions should be tailored to the patient's educational level. Prior to discharge, the psychiatry team, social workers, or chemical‐dependency counselors can also assist with, or arrange, rehabilitation aftercare for patients. Recent work shows that patients were less likely to be readmitted to crisis detoxification if they entered rehabilitation care within 3 days of discharge.18
Our study has significant limitations. This study was performed with data at a single academic medical center with an ethnically homogeneous patient population, limiting the external validity of its results. Because this is a retrospective study, data analyses are limited by the quality and accuracy of data in the electronic medical record. Also, our follow‐up period may not have been long enough to detect additional admissions, and we did not screen for patient admissions prior to the study period. By limiting data collection to admissions for AWS to general medical services, we may have missed cases of AWS when admitted for other reasons or to subspecialty services, and we may have missed severe cases requiring admission to an intensive care unit. While we believe we were able to capture most admissions, we may underreport this number since we cannot account for those events that may have occurred at other facilities and locations. Lastly, without a control group, this study is limited in its ability to show an association between any variable and readmission.
In our study, 142 patients accounted for 608 admissions during the 3‐year study period, which speaks to the high recidivism rates for patients with AWS. This disease is associated with high morbidity, high medical costs, and high utilization of healthcare. Our study provides insight regarding identification of patients at high risk of multiple admissions with respect to demographic (lower level of education) and clinical characteristics (worse withdrawal severity, more medical and psychiatric comorbidity, and polysubstance abuse). We believe collaboration between social services, chemical‐dependency counselors, psychiatry, and medicine is necessary to effectively treat this population of patients and assist with the crucial transition to the outpatient setting. Future studies should include key social factors, such as health literacy in the readmission risk assessment, as well as primary care follow‐up and rehabilitation aftercare.
- , . Chronic alcohol abuse, acute respiratory distress syndrome, and multiple organ dysfunction. Crit Care Med. 2003;31(4 suppl):S207–S212.
- , , et al. Alcohol dependence is independently associated with sepsis, septic shock, and hospital mortality among adult intensive care unit patients. Crit Care Med. 2007;35(2):345–350.
- , , . Use of an objective clinical scale in the assessment and management of alcohol withdrawal in a large general hospital. Alcohol Clin Exp Res. 1988;12(3):360–364.
- , . Alcohol withdrawal syndromes in the intensive care unit. Crit Care Med. 2010;38(9 suppl):S494–S501.
- , Alcoholism at the Boston City Hospital—V. The causes of death among alcoholic patients at the Haymarket Square Relief Station, 1923–year="1938"1938. N Engl J Med. year="1939"1939;221(July 13):58–59.
- , , . Epidemiology of alcohol withdrawal syndrome: mortality and factors of poor prognosis [in Spanish]. An Med Interna (Madrid). 2006;23(7):307–309.
- , , . The impact of alcohol‐related diagnoses on pneumonia outcomes. Arch Intern Med. 1997;157(13):1446–1452.
- , , , , , . Analysis of the factors determining survival of alcoholic withdrawal syndrome patients in a general hospital. Alcohol Alcohol. 2010;45(2):151–158.
- , , , , . Predictors of mortality in patients with delirium tremens. Acad Emerg Med. 2008;15(8):788–790.
- , , , . Long‐term mortality of patients admitted to the hospital with alcohol withdrawal syndrome. Alcohol Clin Exp Res. 2011;35(6):1180–1186.
- , , , , , . Substance use treatment barriers for patients with frequent hospital admissions. J Subst Abuse Treat. 2010;38(1):22–30.
- , , . Diagnostic subgroups and predictors of one‐year re‐admission among late‐middle‐aged and older substance abuse patients. J Stud Alcohol. 1994;55(2):173–183.
- , , . Rates and predictors of four‐year readmission among late‐middle‐aged and older substance abuse patients. J Stud Alcohol. 1994;55(5):561–570.
- , , . Readmission among chemical dependency patients in private, outpatient treatment: patterns, correlates and role in long‐term outcome. J Stud Alcohol. 2005;66(6):842–847.
- , , , . Predicting readmission to substance abuse treatment using state information systems. The impact of client and treatment characteristics. J Subst Abuse. 2000;12(3):255–270.
- , , , . Elderly Medicare inpatients with substance use disorders: characteristics and predictors of hospital readmissions over a four‐year interval. J Stud Alcohol. 2000;61(6):891–895.
- , . The role of psychiatric comorbidity in the prediction of readmission for detoxification. Compr Psychiatry. 1998;39(3):129–136.
- , , , , , . Factors associated with frequent utilization of crisis substance use detoxification services. J Addict Dis. 2011;30(2):116–122.
- , , , , . Assessment of alcohol withdrawal: the revised Clinical Institute Withdrawal Assessment for Alcohol scale (CIWA‐Ar). Br J Addict. 1989;84(11):1353–1357.
- , , , Inappropriate use of symptom‐triggered therapy for alcohol withdrawal in the general hospital. Mayo Clin Proc. 2008;83(3):274–279.
- , , , . A new method of classifying prognostic comorbidity in longitudinal studies: development and validation. J Chronic Dis. 1987;40(5):373–383.
- , , . A four‐year follow‐up study of male alcoholics: factors affecting the risk of readmission. Alcohol. 2002;27(2):83–88.
- , , , et al. Diagnosis and hospital readmission rates of female veterans with substance‐related disorders. Psychiatr Serv. 1995;46(9):932–937.
- , , , et al. Comorbidity of mental disorders with alcohol and other drug abuse. Results from the Epidemiologic Catchment Area (ECA) Study. JAMA. 1990;264(19):2511–2518.
- , , , , , . The relationship between educational attainment and relapse among alcohol‐dependent men and women: a prospective study. Alcohol Clin Exp Res. 2003;27(8):1278–1285.
- , , , . Prevalence, correlates, disability, and comorbidity of DSM‐IV alcohol abuse and dependence in the United States: results from the National Epidemiologic Survey on Alcohol and Related Conditions. Arch Gen Psychiatry. 2007;64(7):830–842.
- , . Health‐related quality of life among adults with serious psychological distress and chronic medical conditions. Qual Life Res. 2008;17(4):521–528.
- , , , , . Primary medical care and reductions in addiction severity: a prospective cohort study. Addiction. 2005;100(1):70–78.
- , , , . The role of medical conditions and primary care services in 5‐year substance use outcomes among chemical dependency treatment patients. Drug Alcohol Depend. 2008;98(1–2):45–53.
Many patients are admitted and readmitted to acute care hospitals with alcohol‐related diagnoses, including alcohol withdrawal syndrome (AWS), and experience significant morbidity and mortality. In patients with septic shock or at risk for acute respiratory distress syndrome (ARDS), chronic alcohol abuse is associated with increased ARDS and severity of multiple organ dysfunction.1 Among intensive care unit (ICU) patients, those with alcohol dependence have higher morbidity, including septic shock, and higher hospital mortality.2 Patients who experience AWS as a result of alcohol dependence may experience life‐threatening complications, such as seizures and delirium tremens.3,4 In‐hospital mortality from AWS is historically high,5 but with benzodiazepines used in a symptom‐driven manner to treat the complications of alcohol use, hospital mortality rates are more recently reported at 2.4%.6
As inpatient outcomes1,2,7 and hospital mortality810 are negatively affected by alcohol abuse, the post‐hospital course of these patients is also of interest. Specifically, patients are often admitted and readmitted with alcohol‐related diagnoses or AWS to acute care hospitals, but relatively little quantitative data exist on readmission factors in this population.11 Patients readmitted to detoxification units or alcohol and substance abuse units have been studied, and factors associated with readmission include psychiatric disorder,1217 female gender,14,15 and delay in rehabilitation aftercare.18
These results cannot be generalized to patients with AWS who are admitted and readmitted to acute‐care hospitals. First, patients hospitalized for alcohol withdrawal symptoms are often medically ill with more severe symptoms, and more frequent coexisting medical and psychiatric illnesses, that complicate the withdrawal syndrome. Detoxification units and substance abuse units require patients to be medically stable before admission, because they do not have the ability to provide a high level of supervision and treatment. Second, much of what we know regarding risk factors for readmission to detoxification centers and substance abuse units comes from studies of administrative data of the Veterans Health Administration,12,13 Medicare Provider Analysis and Review file,16 privately owned outpatient substance abuse centers,14 and publicly funded detoxification centers.18 These results may be difficult to generalize to other patient populations. Accordingly, the objective of this study was to identify demographic and clinical factors associated with multiple admissions to a general medicine service for treatment of AWS over a 3‐year period. Characterization of these high‐risk patients and their hospital course may help focus intervention and reduce these revolving door admissions.
METHODS
The Mayo Clinic Institutional Review Board deemed the study exempt.
Patient Selection
The study was conducted at an 1157‐bed academic tertiary referral hospital, located in the Midwest, that has approximately 15,000 inpatient admissions to general medicine services annually and serves as the main referral center for the region. Patients included in this study were adults admitted to general medicine services and treated with symptom‐triggered Clinical Institute Withdrawal AssessmentAlcohol Revised (CIWA‐Ar) protocol19 between January 1, 2006 and December 31, 2008. Patients were identified using the Mayo Clinic Quality Improvement Resource Center database, as done in a previous CIWA‐Ar study.20 Patients were excluded if the primary diagnosis was a nonalcohol‐related diagnosis (Figure 1).
Patients were placed in 1 of 2 groups based on number of admissions during the study period, either a single‐admission group or a multiple‐admissions group. While most readmission studies use a 30‐day mark from discharge, we used 3 years to better capture relapse and recidivism in this patient population. The 2 groups were then compared retrospectively. To insure that a single admission was not arbitrarily created by the December 2008 cutoff, we reviewed the single‐admission group for additional admissions through June of 2009. If a patient did have a subsequent admission, then the patient was moved to the multiple‐admissions group.
Clinical Variables
Demographic and clinical data was obtained using the Mayo Data Retrieval System (DRS), the Mayo Clinic Life Sciences System (MCLSS) database, and electronic medical records. Clinical data for the multiple‐admissions group was derived from the first admission of the study period, and subsequently referred to as index admission. Specific demographic information collected included age, race, gender, marital status, employment status, and education. Clinical data collected included admitting diagnosis, comorbid medical disorders, psychiatric disorders, and CIWA‐Ar evaluations including highest total score (CIWA‐Ar score [max] and component scores). The CIWA‐Ar protocol is a scale to assess the severity of alcohol withdrawal, based on 10 symptoms of alcohol withdrawal ranging from 0 (not present) to 7 (extremely severe). The protocol requires the scale to be administered hourly, and total scores guide the medication dosing and administration of benzodiazepines to control withdrawal symptoms. Laboratory data collected included serum ammonia, alanine aminotransferase(ALT), and admission urine drug screen. For the purposes of this study, a urine drug screen was considered positive if a substance other than alcohol was present. Length of stay (LOS) and adverse events during hospitalization (delirium tremens, intubations, rapid response team [RRT] calls, ICU transfers, and in‐hospital mortality) were also collected.
Medical comorbidity was measured using the Charlson Comorbidity Index (CCI).21 The CCI was scored electronically using diagnoses in the institution's medical index database dating back 5 years from patient's first, or index, admission. Originally validated as a prognostic tool for mortality 1 year after admission in medical patients, the CCI was chosen as it accounts for most medical comorbidities.21 Data was validated, by another investigator not involved in the initial abstracting process, by randomly verifying 5% of the abstracted data.
Statistical Analysis
Standard descriptive statistics were used for patient characteristics and demographics. Comparing the multiple‐admissions group and single‐admission group, categorical variables were evaluated using the Fisher exact test or Pearson chi‐square test. Continuous variables were evaluated using 2‐sample t test. Multivariate logistic model analyses with stepwise elimination method were used to identify risk factors that were associated with multiple admissions. Age, gender, and variables that were statistically significant in the univariate analysis were used in stepwise regression to get to the final model. A P value of 0.05 was considered statistically significant. All statistical analyses were performed using SAS version 9.3 software (SAS Institute, Cary, NC).
RESULTS
The CIWA‐Ar protocol was ordered on 1199 admissions during the study period. Of these, 411 (34.3%) admissions were excluded because AWS was not the primary diagnosis, leaving 788 (65.7%) admissions for 322 patients, which formed the study population. Of the 322 patients, 180 (56%) had a single admission and 142 (44%) had multiple admissions.
Univariate analyses of demographic and clinical variables are shown in Tables 1 and 2, respectively. Patients with multiple admissions were more likely divorced (P = 0.028), have a high school education or less (P = 0.002), have a higher CCI score (P < 0.0001), a higher CIWA‐Ar score (max) (P < 0.0001), a higher ALT level (P = 0.050), more psychiatric comorbidity (P < 0.026), and a positive urine drug screen (P < 0.001). Adverse events were not significantly different between the 2 groups (Table 2).
| Variable | Single Admission N = 180 | Multiple Admissions N = 142 | P Value |
|---|---|---|---|
| |||
| Age, years (SD) | 47.85 (12.84) | 45.94 (12) | 0.170 |
| Male, No. (%) | 122 (68) | 109 (77) | 0.080 |
| Race/Ethnicity, No. (%) | 0.270 | ||
| White | 168 (93) | 132 (93) | |
| African American | 6 (3) | 3 (2) | |
| Asian | 0 (0) | 1 (1) | |
| Middle Eastern | 3 (2) | 0 (0) | |
| Other | 3 (2) | 6 (4) | |
| Relationship status, No. (%) | 0.160 | ||
| Divorced | 49 (27) | 55 (39) | 0.028* |
| Married | 54 (30) | 34 (24) | 0.230 |
| Separated | 9 (5) | 4 (3) | 0.323 |
| Single | 59 (33) | 38 (27) | 0.243 |
| Widowed | 5 (3) | 3 (2) | 0.703 |
| Committed | 4 (2) | 7 (5) | 0.188 |
| Unknown | 0 (0) | 1 (1) | 0.259 |
| Education, No. (%) | 0.002* | ||
| High school graduate, GED, or less | 49 (28) | 67 (47) | |
| Some college or above | 89 (49) | 60 (42) | |
| Unknown | 41 (23) | 15 (11) | |
| Employment, No. (%) | 0.290 | ||
| Retired | 26 (14) | 12 (8) | |
| Employed | 72 (40) | 51 (36) | |
| Unemployed | 51 (28) | 51 (36) | |
| Homemaker | 9 (5) | 4 (3) | |
| Work disabled | 20 (11) | 23 (16) | |
| Student | 1 (1) | 0 (0) | |
| Unknown | 1 (1) | 1 (1) | |
| Variable | Single Admission N = 180 | Multiple Admissions N = 142 | P Value |
|---|---|---|---|
| |||
| LOS, mean (SD) | 3.71 (7.10) | 2.72 (3.40) | 0.130 |
| Charlson Comorbidity Index, mean (SD) | 1.7 (2.23) | 2.51 (2.90) | 0.005* |
| Medical comorbidity, No. (%) | |||
| Diabetes mellitus | 6 (3) | 16 (11) | 0.005* |
| Cardiovascular disease | 6 (3) | 15 (11) | 0.050* |
| Cerebrovascular disease | 0 (0) | 3 (2) | 0.009* |
| Hypertension | 53 (30) | 36 (25) | 0.400 |
| Cancer | 17 (7) | 10 (9) | 0.440 |
| Psychiatric comorbidity, No. (%) | 97 (54) | 94 (66) | 0.026* |
| Adjustment disorder | 0 (0) | 6 (4) | 0.005* |
| Depressive disorder | 85 (47) | 76 (54) | 0.260 |
| Bipolar disorder | 6 (3) | 10 (7) | 0.130 |
| Psychotic disorder | 4 (2) | 6 (4) | 0.030* |
| Anxiety disorder | 30 (17) | 25 (18) | 0.820 |
| Drug abuse | 4 (2) | 4 (3) | 0.730 |
| Eating disorder | 0 (0) | 3 (2) | 0.050* |
| CIWA‐Ar scores | |||
| CIWA‐Ar score (max), mean (SD) | 15 (8) | 20 (9) | <0.000* |
| Component, mean (SD) | |||
| Agitation | 20 (11) | 36 (25) | 0.001* |
| Anxiety | 23 (13) | 38 (27) | 0.001* |
| Auditory disturbance | 4 (2) | 9 (6) | 0.110 |
| Headache | 11 (6) | 26 (18) | 0.001* |
| Nausea/vomiting | 5 (3) | 17 (12) | 0.003* |
| Orientation | 52 (29) | 72 (51) | 0.001* |
| Paroxysm/sweats | 9 (5) | 17 (12) | 0.023* |
| Tactile disturbance | 25 (14) | 54 (38) | 0.001* |
| Tremor | 35 (19) | 47 (33) | 0.004* |
| Visual disturbance | 54 (30) | 77 (54) | 0.001* |
| ALT (U/L), mean (SD) | 76 (85) | 101 (71) | 0.050* |
| Ammonia (mcg N/dl), mean (SD) | 25 (14) | 29 (29) | 0.530 |
| Positive urine drug screen, No. (%) | 25 (14) | 49 (35) | <0.001* |
| Tetrahydrocannabinol | 14 (56) | 19 (39) | |
| Cocaine | 8 (32) | 8 (16) | |
| Benzodiazepine | 6 (24) | 11 (22) | |
| Opiate | 4 (16) | 13 (26) | |
| Amphetamine | 2 (8) | 2 (4) | |
| Barbiturate | 1 (4) | 0 (0) | |
| Adverse event, No. (%) | |||
| RRT | 1 (1) | 1 (1) | 0.866 |
| ICU transfer | 32 (18) | 20 (14) | 0.550 |
| Intubation | 12 (7) | 4 (3) | 0.890 |
| Delirium tremens | 7 (4) | 4 (3) | 0.600 |
| In‐hospital mortality | 0 (0) | 0 (0) | |
Multivariate logistic model analysis was performed using the variables age, male gender, divorced marital status, high school education or less, CIWA‐Ar score (max), CCI score, psychiatric comorbidity, and positive urine drug screen. With a stepwise elimination process, the final model showed that multiple admissions were associated with high school education or less (P = 0.0071), higher CCI score (P = 0.0010), higher CIWA‐Ar score (max) (P < 0.0001), a positive urine drug screen (P = 0.0002), and psychiatric comorbidity (P = 0.0303) (Table 3).
| Variable | Adjusted Odds Ratio (95% CI) | P Value |
|---|---|---|
| ||
| High school education or less | 2.074 (1.219, 3.529) | 0.0071* |
| CIWA‐Ar score (max) | 1.074 (1.042, 1.107) | <0.0001* |
| Charlson Comorbidity Index | 1.232 (1.088, 1.396) | 0.0010* |
| Psychiatric comorbidity | 1.757 (1.055, 2.928) | 0.0303* |
| Positive urine drug screen | 3.180 (1.740, 5.812) | 0.0002* |
DISCUSSION
We provide important information regarding identification of individuals at high risk for multiple admissions to general medicine services for treatment of AWS. This study found that patients with multiple admissions for AWS had more medical comorbidity. They had more cases of diabetes mellitus, cardiovascular disease, and cerebrovascular disease, and their CCI scores were higher. They also had higher CIWA‐Ar (max) scores, as well as higher CIWA‐Ar component scores, indicating a more severe withdrawal.
Further, psychiatric comorbidity was also associated with multiple admissions. Consistent with the high prevalence in alcoholic patients, psychiatric comorbidity was common in both patients with a single admission and multiple admissions. We also found that a positive urine drug screen was associated with multiple admissions. Interestingly, few patients in each group had a diagnosis recorded in the medical record of an additional substance abuse disorder, yet 14% of patients with a single admission and 29% of patients with multiple admissions had a positive urine drug screen for a non‐alcohol substance. Psychiatric comorbidity, including additional substance abuse, is a well‐established risk factor for readmission to detoxification centers.1215, 17,22,23 Also, people with either an alcohol or non‐alcohol drug addiction, are known to be 7 times more likely to have another addiction than the rest of the population.24 This study suggests clinicians may underrecognize additional substance abuse disorders which are common in this patient population.
In contrast to studies of patients readmitted to detoxification units and substance abuse units,14,15,18,22 we found level of education, specifically a high school education or less, to be associated with multiple admissions. In a study of alcoholics, Greenfield and colleagues found that lower education in alcoholics predicts shorter time to relapse.25 A lack of education may result in inadequate healthcare literacy. Poor health behavior choices that follow may lead to relapse and subsequent admissions for AWS. With respect to other demographic variables, patients in our study population were predominantly men, which is not surprising. Gender differences in alcoholism are well established, with alcohol abuse and dependence more prevalent in men.26 We did not find gender associated with multiple admissions.
Our findings have management and treatment implications. First, providers who care for patients with AWS should not simply focus on treating withdrawal signs and symptoms, but also screen for and address other medical issues, which may not be apparent or seem stable at first glance. While a comorbid medical condition may not be the primary reason for hospital admission, comorbid medical conditions are known to be a source of psychological distress27 and have a negative effect on abstinence. Second, all patients should be screened for additional substance abuse. Initial laboratory testing should include a urine drug screen. Third, before discharging the patient, providers should establish primary care follow‐up for continued surveillance of medical issues. There is evidence that primary care services are predictive of better substance abuse treatment outcomes for those with medical problems.28,29
Finally, inpatient psychiatric consultation, upon admission, is essential for several reasons. First, the psychiatric team can help with initial management and treatment of the alcohol withdrawal regardless of stage and severity, obtain a more comprehensive psychiatric history, and assess for the presence of psychiatric comorbidities that may contribute to, aggravate, or complicate the clinical picture. The team can also address other substance abuse issues when detected by drug screen or clinical history. The psychiatric team, along with chemical‐dependency counselors and social workers, can provide valuable input regarding chemical‐dependency resources available on discharge and help instruct the patient in healthy behaviors. Because healthcare illiteracy may be an issue in this patient population, these instructions should be tailored to the patient's educational level. Prior to discharge, the psychiatry team, social workers, or chemical‐dependency counselors can also assist with, or arrange, rehabilitation aftercare for patients. Recent work shows that patients were less likely to be readmitted to crisis detoxification if they entered rehabilitation care within 3 days of discharge.18
Our study has significant limitations. This study was performed with data at a single academic medical center with an ethnically homogeneous patient population, limiting the external validity of its results. Because this is a retrospective study, data analyses are limited by the quality and accuracy of data in the electronic medical record. Also, our follow‐up period may not have been long enough to detect additional admissions, and we did not screen for patient admissions prior to the study period. By limiting data collection to admissions for AWS to general medical services, we may have missed cases of AWS when admitted for other reasons or to subspecialty services, and we may have missed severe cases requiring admission to an intensive care unit. While we believe we were able to capture most admissions, we may underreport this number since we cannot account for those events that may have occurred at other facilities and locations. Lastly, without a control group, this study is limited in its ability to show an association between any variable and readmission.
In our study, 142 patients accounted for 608 admissions during the 3‐year study period, which speaks to the high recidivism rates for patients with AWS. This disease is associated with high morbidity, high medical costs, and high utilization of healthcare. Our study provides insight regarding identification of patients at high risk of multiple admissions with respect to demographic (lower level of education) and clinical characteristics (worse withdrawal severity, more medical and psychiatric comorbidity, and polysubstance abuse). We believe collaboration between social services, chemical‐dependency counselors, psychiatry, and medicine is necessary to effectively treat this population of patients and assist with the crucial transition to the outpatient setting. Future studies should include key social factors, such as health literacy in the readmission risk assessment, as well as primary care follow‐up and rehabilitation aftercare.
- , . Chronic alcohol abuse, acute respiratory distress syndrome, and multiple organ dysfunction. Crit Care Med. 2003;31(4 suppl):S207–S212.
- , , et al. Alcohol dependence is independently associated with sepsis, septic shock, and hospital mortality among adult intensive care unit patients. Crit Care Med. 2007;35(2):345–350.
- , , . Use of an objective clinical scale in the assessment and management of alcohol withdrawal in a large general hospital. Alcohol Clin Exp Res. 1988;12(3):360–364.
- , . Alcohol withdrawal syndromes in the intensive care unit. Crit Care Med. 2010;38(9 suppl):S494–S501.
- , Alcoholism at the Boston City Hospital—V. The causes of death among alcoholic patients at the Haymarket Square Relief Station, 1923–year="1938"1938. N Engl J Med. year="1939"1939;221(July 13):58–59.
- , , . Epidemiology of alcohol withdrawal syndrome: mortality and factors of poor prognosis [in Spanish]. An Med Interna (Madrid). 2006;23(7):307–309.
- , , . The impact of alcohol‐related diagnoses on pneumonia outcomes. Arch Intern Med. 1997;157(13):1446–1452.
- , , , , , . Analysis of the factors determining survival of alcoholic withdrawal syndrome patients in a general hospital. Alcohol Alcohol. 2010;45(2):151–158.
- , , , , . Predictors of mortality in patients with delirium tremens. Acad Emerg Med. 2008;15(8):788–790.
- , , , . Long‐term mortality of patients admitted to the hospital with alcohol withdrawal syndrome. Alcohol Clin Exp Res. 2011;35(6):1180–1186.
- , , , , , . Substance use treatment barriers for patients with frequent hospital admissions. J Subst Abuse Treat. 2010;38(1):22–30.
- , , . Diagnostic subgroups and predictors of one‐year re‐admission among late‐middle‐aged and older substance abuse patients. J Stud Alcohol. 1994;55(2):173–183.
- , , . Rates and predictors of four‐year readmission among late‐middle‐aged and older substance abuse patients. J Stud Alcohol. 1994;55(5):561–570.
- , , . Readmission among chemical dependency patients in private, outpatient treatment: patterns, correlates and role in long‐term outcome. J Stud Alcohol. 2005;66(6):842–847.
- , , , . Predicting readmission to substance abuse treatment using state information systems. The impact of client and treatment characteristics. J Subst Abuse. 2000;12(3):255–270.
- , , , . Elderly Medicare inpatients with substance use disorders: characteristics and predictors of hospital readmissions over a four‐year interval. J Stud Alcohol. 2000;61(6):891–895.
- , . The role of psychiatric comorbidity in the prediction of readmission for detoxification. Compr Psychiatry. 1998;39(3):129–136.
- , , , , , . Factors associated with frequent utilization of crisis substance use detoxification services. J Addict Dis. 2011;30(2):116–122.
- , , , , . Assessment of alcohol withdrawal: the revised Clinical Institute Withdrawal Assessment for Alcohol scale (CIWA‐Ar). Br J Addict. 1989;84(11):1353–1357.
- , , , Inappropriate use of symptom‐triggered therapy for alcohol withdrawal in the general hospital. Mayo Clin Proc. 2008;83(3):274–279.
- , , , . A new method of classifying prognostic comorbidity in longitudinal studies: development and validation. J Chronic Dis. 1987;40(5):373–383.
- , , . A four‐year follow‐up study of male alcoholics: factors affecting the risk of readmission. Alcohol. 2002;27(2):83–88.
- , , , et al. Diagnosis and hospital readmission rates of female veterans with substance‐related disorders. Psychiatr Serv. 1995;46(9):932–937.
- , , , et al. Comorbidity of mental disorders with alcohol and other drug abuse. Results from the Epidemiologic Catchment Area (ECA) Study. JAMA. 1990;264(19):2511–2518.
- , , , , , . The relationship between educational attainment and relapse among alcohol‐dependent men and women: a prospective study. Alcohol Clin Exp Res. 2003;27(8):1278–1285.
- , , , . Prevalence, correlates, disability, and comorbidity of DSM‐IV alcohol abuse and dependence in the United States: results from the National Epidemiologic Survey on Alcohol and Related Conditions. Arch Gen Psychiatry. 2007;64(7):830–842.
- , . Health‐related quality of life among adults with serious psychological distress and chronic medical conditions. Qual Life Res. 2008;17(4):521–528.
- , , , , . Primary medical care and reductions in addiction severity: a prospective cohort study. Addiction. 2005;100(1):70–78.
- , , , . The role of medical conditions and primary care services in 5‐year substance use outcomes among chemical dependency treatment patients. Drug Alcohol Depend. 2008;98(1–2):45–53.
Copyright © 2012 Society of Hospital Medicine

Handoff Efficiency
Transfer of responsibility for patients, or handoff,1 occurs frequently in hospitalist services, requiring excellent and timely communication to ensure patient safety. Communication failure is a major contributor to medical errors.2, 3 Recognizing such findings, a growing body of literature addresses handoff techniques for learners.47
Vidyarthi described the handoff process as traditionally informal, unstructured, and idiosyncratic,4 and many believe efforts to formalize and structure this process are important for patient safety.8 Standardized handoff forms have improved accuracy of information.9 Web‐based sign‐out systems reportedly reduced the number of patients missed on rounds.10
Hospitalists also face challenges with effective communication during service change.11 The Society of Hospital Medicine identified the handoff skill as a core competency for hospitalists, and recommendations based on a systematic review of the literature were published.12 Inpatient medicine programs are increasingly using midlevel providers such as nurse practitioners (NPs) and physician assistants (PAs) along with hospitalists to accommodate workload while maintaining the scholarly enterprise in academic centers.13 To our knowledge there is no literature examining the hospitalist service handoffs involving NP/PAs.
We wished to study the effectiveness and timeliness of the morning handoff from the night coverage providers to the daytime teams consisting of one hospitalist and one NP/PA. Our objectives were to identify deficiencies and to evaluate the effectiveness of a restructured handoff process.
Methods
The Mayo Clinic Institutional Review Board reviewed and approved this study.
Setting
At the time of this study, the Division of Hospital Internal Medicine (HIM) at our institution consisted of 22 hospitalists, 11 NPs and 9 PAs (hereinafter NP/PAs), and 2 clinical assistants (CAs). The CAs assist with clerical duties not covered by Unit Secretaries:
-
Obtaining outside records
-
Clarifying referring physician contact information
-
Scheduling follow‐up outpatient appointments for tests, procedures, and visits
-
Attendance at morning handoff
Each CA can assist 3 or 4 daytime service teams.
Daytime Service Organization
Six HIM services, each managing up to 12 patients, are staffed by a partnership of 1 hospitalist and 1 NP/PA: Four services are primary general medicine services, and 2 consulting (orthopedic comanagement) services.
Night Coverage
Three of 4 primary daytime services and one consult service team transfer care to the (in‐house) night NP/PA. The night NP/PA addresses any acute‐care issues and reports at morning handoff to the 3 primary services and 1 consult service. In a designated conference room the morning handoff occurs, with at least 1 (day team) service representative present. This is usually the NP/PA, as the day team hospitalist concurrently receives a report on new admissions from the (in‐house) night hospitalist (who also covers one service and backs up the night NP/PA).
Improvement Process
An improvement team was formed within the Division of HIM consisting of 3 hospitalists, 3 NP/PAs, and 2 CAs to assess the existing handoff process at 7:45am between the Night NP/PA and daytime services. The improvement team met, reviewed evidence‐based literature on handoffs and discussed our local process. Four problems were identified by consensus:
-
Unpredictable start and finish times
-
Inefficiency (time wasted)
-
Poor environment (room noisy and distracting conversations)
-
Poor communication (overwrought and meandering narratives).
Intervention
The improvement team structured a new handoff process to address these deficiencies.
-
Environment: Moved to a smaller room (lower ceiling, less ambient noise).
-
Identification: table cards designating seats for participants (reduced queries regarding what service are you, today?).
-
Start Times: Each service team assigned a consistent start time (labeled on the table card) within a 15‐minute period, and although earlier reportage could occur, any service team present at their designated time has priority for the attention of the night NP/PA, and the opportunity to ask questions.
-
Quiet and Focus: HIM members were reminded to remain quiet in the handoff room, so the service receiving report has the floor and personal conversations must not impede the principals.
-
Visual Cue: Green Good to go sign placed on team table cards when no verbal was required.
-
Written e‐Material: The improvement team required elements of a brief written report in a specified column of our existing electronic service list (ESL). The ESL is a custom designed template importing laboratory, medication, and demographic data automatically but also capable of free text additions (Figure 1). All providers were instructed to update the ESL every 12 hours.
-
Admission and Progress Notes: After manual electronic medical record search, the CAs printed any notes generated in the preceding 12 hours and placed them by the team table card.

The improvement team provided education for the new process at a division meeting and through e‐mail. The recommended report sequence was night NP/PA reporting and day service teams asking questions and seeking clarifications. We discouraged editorial comments and chit‐chat.
A member of the improvement team monitored the new handoff process for 15 days, and 3 months later for 10 days.
Survey
An anonymous survey (Figure 2) concerning staff satisfaction with handoff was conducted immediately before and 15 days after the intervention. In the e‐mail containing the postintervention survey, providers were asked to respond only if they had been on service the preceding 15 days (and thus eligible to participate in handoff). To help insure this, the first question read, Have you been on service during the past 15 days?
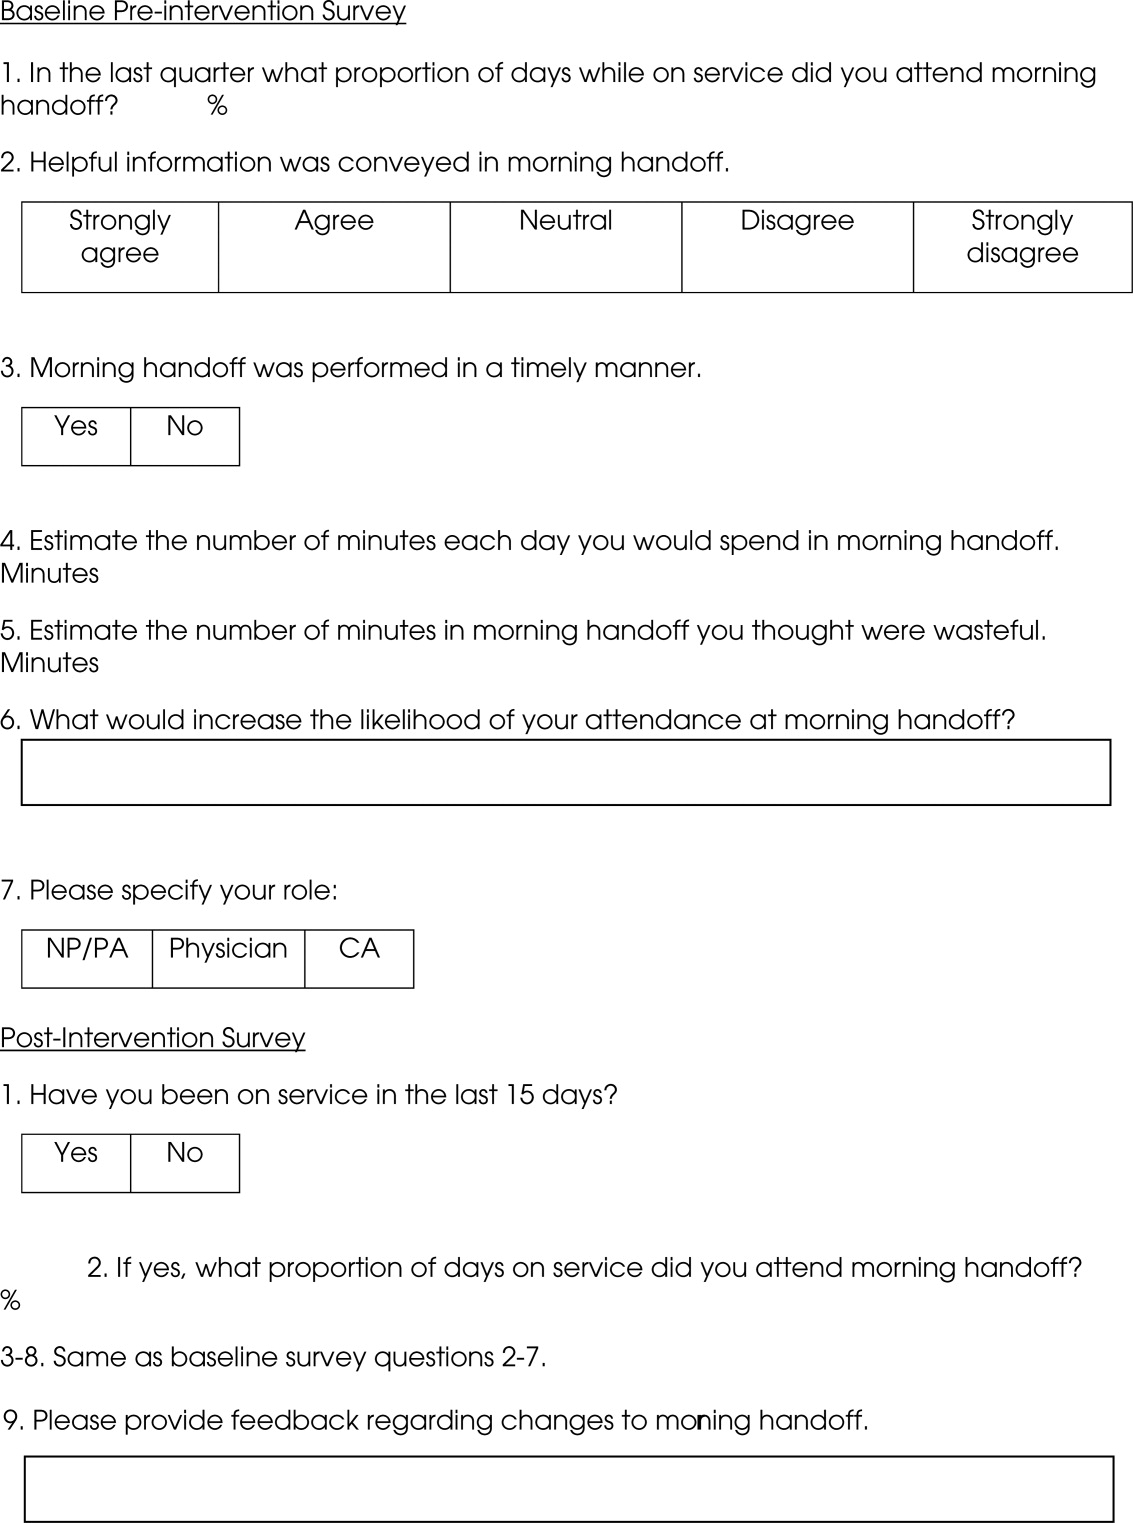
Statistics
To compare the relationship of preintervention and postintervention survey responses, Fisher's exact test was used to compare categorical variables and 2 sample t‐test and Wilcoxon rank sum test were used for continuous variables. Comparisons that adjusted for the possibility of someone responding to both the preintervention and postintervention surveys were not performed since the surveys were anonymous. A P value <0.05 was considered statistically significant. For the item concerning the percentage of days morning report was attended while on service, based on a common standard deviation estimate of 35.3, we had 80% power to detect a difference of 29.1 (pre vs. post). This computation assumes a 2‐sample t‐test of = 0.05 with sample sizes of 36 and 18. We have 59% power to detect a difference of 27% (67% pre vs. 94% post) for those who at least agree that helpful information was conveyed during handoff. This computation is based on a 2‐sided Pearson 2 test with = 0.05.
Qualitative data analysis of respondents' answers to the open‐ended survey questions What would increase the likelihood of your attending handoff? and What feedback do you have regarding the changes to handoff? was performed using the constant comparative method14 associated with grounded theory approaches to identify themes and categories.15 To establish interrater reliability, three investigators (MCB, DTK, LLK) independently identified coding categories for the data set, compared results, redefined coding categories as needed, and reanalyzed the data until 80% agreement was reached.
Results
Thirty‐six of the 44 providers (82%) answered the preintervention survey, including 18 of 22 hospitalists (82%), 17 of 20 NPs/PAs (85%), and 1 of 2 CAs (50%). During the intervention based on our staffing model, 21 providers had the opportunity to participate in handoff, and 18 (86%) answered the postintervention survey, including 5 of 6 hospitalists (83%), 9 of 14 NPs/PAs (64%), and 2 of 2 CAs (100%). All respondents to the postintervention survey reported being on service during the previous 15 days.
As summarized in Table 1, compared to 60.5% of survey participants (n = 38) who thought morning handoff was performed in a timely fashion preintervention, 100% (n = 15) felt it was performed in a timely fashion postintervention (P = 0.005). The average time spent in morning report before the intervention was 11 minutes, as compared to 5 minutes after the intervention (P < 0.0028). Prior to the intervention, 6.5 minutes of the handoff were viewed to be wasteful, as compared to 0.5 minutes of the handoff in the postintervention survey (P < 0.0001). Attendance and quality of information perceptions did not demonstrate statistically significant change.
| Survey Question | Preintervention | Postintervention | P |
|---|---|---|---|
| What proportion of days while on service did you attend morning report? (%) | 78 | 87 | 0.4119 |
| Helpful information was conveyed in morning report, n (%) | 0.112 | ||
| Strongly agree | 9 (25) | 9 (56) | |
| Agree | 15 (42) | 6 (38) | |
| Neutral | 8 (22) | 1 (6) | |
| Disagree | 4 (11) | 0 | |
| Strongly disagree | 0 | 0 | |
| Morning report was performed in a timely manner, #yes/#no | 23/15 | 15/0 | 0.005 |
| Estimate the number of minutes each day you would spend in morning report (minute) | 11 | 5 | <0.0028 |
| Estimate the number of minutes in morning report you thought were wasteful (minute) | 6.5 | 0.5 | <0.0001 |
During the 15‐day observation period, morning handoff started by 0745 on 14 of 15 (93%) of days and finished by 0800 on 15 of 15 (100%) of days. Table cards, ESL, and progress notes were on the table by 0745 on 15 of 15 (100%) of days following the intervention. Three months after the intervention, the following were observed: morning handoff started by 0745 on 10 of 10 (100%) of days; finished by 0800 on 10 of 10 (100%) of days; and table cards, ESL, and progress notes were on the table by 0745 on 10 of 10 (100%) of days.
Qualitative Data Analysis
Three themes were identified in both preintervention and postintervention surveys: timeliness, quality of report and environment (Table 2). In the preintervention survey, timeliness complaints involved inconsistent start time, prolonged duration of handoff, and inefficiency due to time wasted while teams waited for their handoff report. Comments about report quality mentioned the nonstandardized report process that included nonpertinent information and editorializing. Environmental concerns addressed noise from multiple service team members assembled in 1 large room and chatting while awaiting report. In the postintervention survey, respondents' comments noted improved efficiency, environment, and report quality.
| Deficiency | Pre‐Intervention | Post‐Intervention |
|---|---|---|
| Timeliness | Efficiency needed | I found the changes lead to more concise and valuable time spent in report |
| Timely, scheduled and efficient reports would help increase my attendance | I personally enjoyed having the times set so you are held accountable for a certain handoff | |
| Set report times so I don't have to listen to everyone else's report | More organized and efficient | |
| Too much time wasted | Love the good to go card! Can start on rounds | |
| Environment | Not having to listen to chit chat unrelated to patient carewould improve my attendance | There is less chit chat |
| Services should receive report in a quieter room | Seems less chaotic with less people overall in the room so less distraction | |
| Need a quieter and smaller room | Because the room is quieter, I did not have to repeat information | |
| Too noisy | Quiet and respectful | |
| Quality | I would like a more organized format More information isn't needed, just the correct information in a timely manner | I felt that the amount of information shared was only what was pertinent and important |
| If I first had the opportunity to review ESL and any notes generated in the last 12 hours, this would improve report | Written information on the ESL assured that I didn't forget something important | |
| Less editorializing about events and less adrenaline | I liked having the progress notes generated overnight available for review | |
| Need only meaningful information | Excellent report with prompt dissemination of information |
Discussion
We describe an intervention that set the expectation for formal, structured written and verbal communication in a focused environment involving outgoing and incoming clinicians, resulting in improved satisfaction. Before the intervention, the improvement team identified by consensus 4 problems: unpredictable start time, inefficiency, environment, and report quality. Formal structuring of our handoff process resulted in statistically significant improvement in handoff timeliness and efficiency in the view of the HIM division members. Process improvement included precise team specific start times within a 12‐minute window to improve reliability and predictability and eliminating nonproductive waiting. Additionally, receiving teams were clearly identified with table cards so that no time was wasted locating the appropriate service for report, and minimizing role‐identification challenges. The good to go sign signaled teams that no events had occurred overnight requiring verbal report. Handoff timeliness persisted 3 months after the intervention, suggesting that the process is easily sustainable.
Postintervention survey comments noted the improved environment: a smaller, quieter room with the door closed. Before the intervention, all day team providers, CAs and night provider met in a large, loud room where multiple conversations were commonplace. Previous study of the handoff process supports creating an environment free of distraction.4
Postintervention survey responses to the open‐ended questions suggested improved provider satisfaction with the quality of the report. We believe this occurred for several reasons. First, having a precise start time for each team within a 12‐minute window led to a more focused report. Second, the ESL provided a column for providers to suggest plans of care for anticipated overnight events to improve preparedness and avoid significant omissions. Third, hospital notes generated overnight were made available which allowed daytime providers to review events before handoff, for a more informed update, or just after verbal report to reinforce the information just received, a technique used in other high‐reliability organizations.16 This measure also provided an at‐a‐glance view of each patient, decreasing the complexity of handoff.17
This study has important limitations. We address the handoff process of 1 hospitalist group at a single academic center. NP/PAs are the clinicians with first‐call responsibility for the night coverage of our patients, and the handoff process between the night NP/PA and daytime provider was studied. The handoff between physicians for patients admitted overnight was not assessed. Another limitation is that the time spent in handoff is reported as a participant estimate. There was no objective measurement of time, and respondents may have been biased. An additional limitation of our study concerns the preintervention and postintervention surveys. Both surveys were anonymous, which makes discerning the absolute impact of the intervention difficult due to the lack of paired responses. Lastly, our institution has an ESL. This option may not be available in other hospital systems.
Several deficiencies in the handoff process were addressed by providing key clinical data verbally and in written format, enhancing the physical environment, and defining each team's handoff start time. Our process improvements are consistent with the handoff recommendations endorsed by the Society of Hospital Medicine.12 Subsequent direct observation, subjective reports, and survey results demonstrated improvement in the handoff process.
Future studies might measure the effectiveness of morning handoff by end‐shift interviews of the daytime clinicians. Similarly, a study of evening handoff could measure the efficiency and effectiveness of report given by day teams to night‐coverage colleagues. Furthermore, if the handoff report skill set can be more rigorously defined and measured, a hospitalist clinical competency for hospitalists and NP/PAs could be developed in this core process‐of‐care.12
Acknowledgements
The authors thank Lisa Boucher for preparation of this manuscript.
- , , , et al.Lost in translation: challenges and opportunities in physician‐to‐physician communication during patient handoffs.Acad Med.2005;80:1094–1099.
- , , .Communication failures: an insidious contributor to medical mishaps.Acad Med.2004;79:186–194.
- , , .The human factor: the critical importance of effective teamwork and communication in providing safe care.Quality 13 Suppl 1:i85–90.
- , , , et al.Managing discontinuity in academic medical centers: strategies for a safe and effective resident sign‐out.J Hosp Med.2006;1:257–266.
- , , .Development and implementation of an oral sign‐out skills curriculum.J Gen Intern Med.2007;22:1470–1474.
- , , , et al.The top 10 list for a safe and effective sign‐out.Arch Surg2008;143(10):1008–1010.
- , , , et al.Residents' and attending physicians' handoffs: a systematic review of the literature.Acad Med.2009;84(12):1775–1787.
- , , , et al.A structured handoff program for interns.Acad Med.2009;84:347–352.
- , , , et al.Simple standardized patient handoff system that increases accuracy and completeness.J Surg.2008;65:476–485.
- , , , et al.A randomized, controlled trial evaluation the impact of a computerized rounding and sign‐out system on continuity of care and resident work hours.J Am Coll Surg.2005;200:538–545.
- , , , .Understanding communication during hospitalist service changes: A mixed methods study.J Hosp Med.2009;4(9):535–540.
- , , , , , .Hospitalist handoffs: a systematic review and task force recommendations.J of Hosp Med.2009;4(7):433–440.
- , , , et al.Implementation of a physician assistant/hospitalist service in an academic medical center: impact on efficiency and patient outcomes.J Hosp Med.2008;3:361–368.
- , .Basics of Qualitiative Research: Grounded Theory Procedures and Techniques.Sage Publications, Inc.Newbury Park, CA.1990.
- , .Naturalistic Inquiry.Sage Publications, Inc.Newbury Park, CA.1985.
- .Communication strategies from high‐reliability organizations.Ann Surg.2007;245(2):170–172.
- , , , et al.Handoff strategies in settings with high consequences for failure: lessons for health care operations.Int J Qual Health Care.2004;16(2):125.
Transfer of responsibility for patients, or handoff,1 occurs frequently in hospitalist services, requiring excellent and timely communication to ensure patient safety. Communication failure is a major contributor to medical errors.2, 3 Recognizing such findings, a growing body of literature addresses handoff techniques for learners.47
Vidyarthi described the handoff process as traditionally informal, unstructured, and idiosyncratic,4 and many believe efforts to formalize and structure this process are important for patient safety.8 Standardized handoff forms have improved accuracy of information.9 Web‐based sign‐out systems reportedly reduced the number of patients missed on rounds.10
Hospitalists also face challenges with effective communication during service change.11 The Society of Hospital Medicine identified the handoff skill as a core competency for hospitalists, and recommendations based on a systematic review of the literature were published.12 Inpatient medicine programs are increasingly using midlevel providers such as nurse practitioners (NPs) and physician assistants (PAs) along with hospitalists to accommodate workload while maintaining the scholarly enterprise in academic centers.13 To our knowledge there is no literature examining the hospitalist service handoffs involving NP/PAs.
We wished to study the effectiveness and timeliness of the morning handoff from the night coverage providers to the daytime teams consisting of one hospitalist and one NP/PA. Our objectives were to identify deficiencies and to evaluate the effectiveness of a restructured handoff process.
Methods
The Mayo Clinic Institutional Review Board reviewed and approved this study.
Setting
At the time of this study, the Division of Hospital Internal Medicine (HIM) at our institution consisted of 22 hospitalists, 11 NPs and 9 PAs (hereinafter NP/PAs), and 2 clinical assistants (CAs). The CAs assist with clerical duties not covered by Unit Secretaries:
-
Obtaining outside records
-
Clarifying referring physician contact information
-
Scheduling follow‐up outpatient appointments for tests, procedures, and visits
-
Attendance at morning handoff
Each CA can assist 3 or 4 daytime service teams.
Daytime Service Organization
Six HIM services, each managing up to 12 patients, are staffed by a partnership of 1 hospitalist and 1 NP/PA: Four services are primary general medicine services, and 2 consulting (orthopedic comanagement) services.
Night Coverage
Three of 4 primary daytime services and one consult service team transfer care to the (in‐house) night NP/PA. The night NP/PA addresses any acute‐care issues and reports at morning handoff to the 3 primary services and 1 consult service. In a designated conference room the morning handoff occurs, with at least 1 (day team) service representative present. This is usually the NP/PA, as the day team hospitalist concurrently receives a report on new admissions from the (in‐house) night hospitalist (who also covers one service and backs up the night NP/PA).
Improvement Process
An improvement team was formed within the Division of HIM consisting of 3 hospitalists, 3 NP/PAs, and 2 CAs to assess the existing handoff process at 7:45am between the Night NP/PA and daytime services. The improvement team met, reviewed evidence‐based literature on handoffs and discussed our local process. Four problems were identified by consensus:
-
Unpredictable start and finish times
-
Inefficiency (time wasted)
-
Poor environment (room noisy and distracting conversations)
-
Poor communication (overwrought and meandering narratives).
Intervention
The improvement team structured a new handoff process to address these deficiencies.
-
Environment: Moved to a smaller room (lower ceiling, less ambient noise).
-
Identification: table cards designating seats for participants (reduced queries regarding what service are you, today?).
-
Start Times: Each service team assigned a consistent start time (labeled on the table card) within a 15‐minute period, and although earlier reportage could occur, any service team present at their designated time has priority for the attention of the night NP/PA, and the opportunity to ask questions.
-
Quiet and Focus: HIM members were reminded to remain quiet in the handoff room, so the service receiving report has the floor and personal conversations must not impede the principals.
-
Visual Cue: Green Good to go sign placed on team table cards when no verbal was required.
-
Written e‐Material: The improvement team required elements of a brief written report in a specified column of our existing electronic service list (ESL). The ESL is a custom designed template importing laboratory, medication, and demographic data automatically but also capable of free text additions (Figure 1). All providers were instructed to update the ESL every 12 hours.
-
Admission and Progress Notes: After manual electronic medical record search, the CAs printed any notes generated in the preceding 12 hours and placed them by the team table card.
The improvement team provided education for the new process at a division meeting and through e‐mail. The recommended report sequence was night NP/PA reporting and day service teams asking questions and seeking clarifications. We discouraged editorial comments and chit‐chat.
A member of the improvement team monitored the new handoff process for 15 days, and 3 months later for 10 days.
Survey
An anonymous survey (Figure 2) concerning staff satisfaction with handoff was conducted immediately before and 15 days after the intervention. In the e‐mail containing the postintervention survey, providers were asked to respond only if they had been on service the preceding 15 days (and thus eligible to participate in handoff). To help insure this, the first question read, Have you been on service during the past 15 days?
Statistics
To compare the relationship of preintervention and postintervention survey responses, Fisher's exact test was used to compare categorical variables and 2 sample t‐test and Wilcoxon rank sum test were used for continuous variables. Comparisons that adjusted for the possibility of someone responding to both the preintervention and postintervention surveys were not performed since the surveys were anonymous. A P value <0.05 was considered statistically significant. For the item concerning the percentage of days morning report was attended while on service, based on a common standard deviation estimate of 35.3, we had 80% power to detect a difference of 29.1 (pre vs. post). This computation assumes a 2‐sample t‐test of = 0.05 with sample sizes of 36 and 18. We have 59% power to detect a difference of 27% (67% pre vs. 94% post) for those who at least agree that helpful information was conveyed during handoff. This computation is based on a 2‐sided Pearson 2 test with = 0.05.
Qualitative data analysis of respondents' answers to the open‐ended survey questions What would increase the likelihood of your attending handoff? and What feedback do you have regarding the changes to handoff? was performed using the constant comparative method14 associated with grounded theory approaches to identify themes and categories.15 To establish interrater reliability, three investigators (MCB, DTK, LLK) independently identified coding categories for the data set, compared results, redefined coding categories as needed, and reanalyzed the data until 80% agreement was reached.
Results
Thirty‐six of the 44 providers (82%) answered the preintervention survey, including 18 of 22 hospitalists (82%), 17 of 20 NPs/PAs (85%), and 1 of 2 CAs (50%). During the intervention based on our staffing model, 21 providers had the opportunity to participate in handoff, and 18 (86%) answered the postintervention survey, including 5 of 6 hospitalists (83%), 9 of 14 NPs/PAs (64%), and 2 of 2 CAs (100%). All respondents to the postintervention survey reported being on service during the previous 15 days.
As summarized in Table 1, compared to 60.5% of survey participants (n = 38) who thought morning handoff was performed in a timely fashion preintervention, 100% (n = 15) felt it was performed in a timely fashion postintervention (P = 0.005). The average time spent in morning report before the intervention was 11 minutes, as compared to 5 minutes after the intervention (P < 0.0028). Prior to the intervention, 6.5 minutes of the handoff were viewed to be wasteful, as compared to 0.5 minutes of the handoff in the postintervention survey (P < 0.0001). Attendance and quality of information perceptions did not demonstrate statistically significant change.
| Survey Question | Preintervention | Postintervention | P |
|---|---|---|---|
| What proportion of days while on service did you attend morning report? (%) | 78 | 87 | 0.4119 |
| Helpful information was conveyed in morning report, n (%) | 0.112 | ||
| Strongly agree | 9 (25) | 9 (56) | |
| Agree | 15 (42) | 6 (38) | |
| Neutral | 8 (22) | 1 (6) | |
| Disagree | 4 (11) | 0 | |
| Strongly disagree | 0 | 0 | |
| Morning report was performed in a timely manner, #yes/#no | 23/15 | 15/0 | 0.005 |
| Estimate the number of minutes each day you would spend in morning report (minute) | 11 | 5 | <0.0028 |
| Estimate the number of minutes in morning report you thought were wasteful (minute) | 6.5 | 0.5 | <0.0001 |
During the 15‐day observation period, morning handoff started by 0745 on 14 of 15 (93%) of days and finished by 0800 on 15 of 15 (100%) of days. Table cards, ESL, and progress notes were on the table by 0745 on 15 of 15 (100%) of days following the intervention. Three months after the intervention, the following were observed: morning handoff started by 0745 on 10 of 10 (100%) of days; finished by 0800 on 10 of 10 (100%) of days; and table cards, ESL, and progress notes were on the table by 0745 on 10 of 10 (100%) of days.
Qualitative Data Analysis
Three themes were identified in both preintervention and postintervention surveys: timeliness, quality of report and environment (Table 2). In the preintervention survey, timeliness complaints involved inconsistent start time, prolonged duration of handoff, and inefficiency due to time wasted while teams waited for their handoff report. Comments about report quality mentioned the nonstandardized report process that included nonpertinent information and editorializing. Environmental concerns addressed noise from multiple service team members assembled in 1 large room and chatting while awaiting report. In the postintervention survey, respondents' comments noted improved efficiency, environment, and report quality.
| Deficiency | Pre‐Intervention | Post‐Intervention |
|---|---|---|
| Timeliness | Efficiency needed | I found the changes lead to more concise and valuable time spent in report |
| Timely, scheduled and efficient reports would help increase my attendance | I personally enjoyed having the times set so you are held accountable for a certain handoff | |
| Set report times so I don't have to listen to everyone else's report | More organized and efficient | |
| Too much time wasted | Love the good to go card! Can start on rounds | |
| Environment | Not having to listen to chit chat unrelated to patient carewould improve my attendance | There is less chit chat |
| Services should receive report in a quieter room | Seems less chaotic with less people overall in the room so less distraction | |
| Need a quieter and smaller room | Because the room is quieter, I did not have to repeat information | |
| Too noisy | Quiet and respectful | |
| Quality | I would like a more organized format More information isn't needed, just the correct information in a timely manner | I felt that the amount of information shared was only what was pertinent and important |
| If I first had the opportunity to review ESL and any notes generated in the last 12 hours, this would improve report | Written information on the ESL assured that I didn't forget something important | |
| Less editorializing about events and less adrenaline | I liked having the progress notes generated overnight available for review | |
| Need only meaningful information | Excellent report with prompt dissemination of information |
Discussion
We describe an intervention that set the expectation for formal, structured written and verbal communication in a focused environment involving outgoing and incoming clinicians, resulting in improved satisfaction. Before the intervention, the improvement team identified by consensus 4 problems: unpredictable start time, inefficiency, environment, and report quality. Formal structuring of our handoff process resulted in statistically significant improvement in handoff timeliness and efficiency in the view of the HIM division members. Process improvement included precise team specific start times within a 12‐minute window to improve reliability and predictability and eliminating nonproductive waiting. Additionally, receiving teams were clearly identified with table cards so that no time was wasted locating the appropriate service for report, and minimizing role‐identification challenges. The good to go sign signaled teams that no events had occurred overnight requiring verbal report. Handoff timeliness persisted 3 months after the intervention, suggesting that the process is easily sustainable.
Postintervention survey comments noted the improved environment: a smaller, quieter room with the door closed. Before the intervention, all day team providers, CAs and night provider met in a large, loud room where multiple conversations were commonplace. Previous study of the handoff process supports creating an environment free of distraction.4
Postintervention survey responses to the open‐ended questions suggested improved provider satisfaction with the quality of the report. We believe this occurred for several reasons. First, having a precise start time for each team within a 12‐minute window led to a more focused report. Second, the ESL provided a column for providers to suggest plans of care for anticipated overnight events to improve preparedness and avoid significant omissions. Third, hospital notes generated overnight were made available which allowed daytime providers to review events before handoff, for a more informed update, or just after verbal report to reinforce the information just received, a technique used in other high‐reliability organizations.16 This measure also provided an at‐a‐glance view of each patient, decreasing the complexity of handoff.17
This study has important limitations. We address the handoff process of 1 hospitalist group at a single academic center. NP/PAs are the clinicians with first‐call responsibility for the night coverage of our patients, and the handoff process between the night NP/PA and daytime provider was studied. The handoff between physicians for patients admitted overnight was not assessed. Another limitation is that the time spent in handoff is reported as a participant estimate. There was no objective measurement of time, and respondents may have been biased. An additional limitation of our study concerns the preintervention and postintervention surveys. Both surveys were anonymous, which makes discerning the absolute impact of the intervention difficult due to the lack of paired responses. Lastly, our institution has an ESL. This option may not be available in other hospital systems.
Several deficiencies in the handoff process were addressed by providing key clinical data verbally and in written format, enhancing the physical environment, and defining each team's handoff start time. Our process improvements are consistent with the handoff recommendations endorsed by the Society of Hospital Medicine.12 Subsequent direct observation, subjective reports, and survey results demonstrated improvement in the handoff process.
Future studies might measure the effectiveness of morning handoff by end‐shift interviews of the daytime clinicians. Similarly, a study of evening handoff could measure the efficiency and effectiveness of report given by day teams to night‐coverage colleagues. Furthermore, if the handoff report skill set can be more rigorously defined and measured, a hospitalist clinical competency for hospitalists and NP/PAs could be developed in this core process‐of‐care.12
Acknowledgements
The authors thank Lisa Boucher for preparation of this manuscript.
- , , , et al.Lost in translation: challenges and opportunities in physician‐to‐physician communication during patient handoffs.Acad Med.2005;80:1094–1099.
- , , .Communication failures: an insidious contributor to medical mishaps.Acad Med.2004;79:186–194.
- , , .The human factor: the critical importance of effective teamwork and communication in providing safe care.Quality 13 Suppl 1:i85–90.
- , , , et al.Managing discontinuity in academic medical centers: strategies for a safe and effective resident sign‐out.J Hosp Med.2006;1:257–266.
- , , .Development and implementation of an oral sign‐out skills curriculum.J Gen Intern Med.2007;22:1470–1474.
- , , , et al.The top 10 list for a safe and effective sign‐out.Arch Surg2008;143(10):1008–1010.
- , , , et al.Residents' and attending physicians' handoffs: a systematic review of the literature.Acad Med.2009;84(12):1775–1787.
- , , , et al.A structured handoff program for interns.Acad Med.2009;84:347–352.
- , , , et al.Simple standardized patient handoff system that increases accuracy and completeness.J Surg.2008;65:476–485.
- , , , et al.A randomized, controlled trial evaluation the impact of a computerized rounding and sign‐out system on continuity of care and resident work hours.J Am Coll Surg.2005;200:538–545.
- , , , .Understanding communication during hospitalist service changes: A mixed methods study.J Hosp Med.2009;4(9):535–540.
- , , , , , .Hospitalist handoffs: a systematic review and task force recommendations.J of Hosp Med.2009;4(7):433–440.
- , , , et al.Implementation of a physician assistant/hospitalist service in an academic medical center: impact on efficiency and patient outcomes.J Hosp Med.2008;3:361–368.
- , .Basics of Qualitiative Research: Grounded Theory Procedures and Techniques.Sage Publications, Inc.Newbury Park, CA.1990.
- , .Naturalistic Inquiry.Sage Publications, Inc.Newbury Park, CA.1985.
- .Communication strategies from high‐reliability organizations.Ann Surg.2007;245(2):170–172.
- , , , et al.Handoff strategies in settings with high consequences for failure: lessons for health care operations.Int J Qual Health Care.2004;16(2):125.