User login
From the Divisions of Hospital Medicine (Drs. Dawson, Chirila, Bhide, and Burton) and Biomedical Statistics and Informatics (Ms. Thomas), Mayo Clinic, Jacksonville, FL, and the Division of Hospital Medicine, Mayo Clinic, Phoenix, AZ (Dr. Cannon).
Abstract
- Objective: To validate an electronic tool created to identify inpatients who are at risk of readmission within 30 days and quantify the predictive performance of the readmission risk score (RRS).
- Methods: Retrospective cohort study including inpa-tients who were discharged between 1 Nov 2012 and 31 Dec 2012. The ability of the RRS to discriminate between those who did and did not have a 30-day urgent readmission was quantified by the c statistic. Calibration was assessed by plotting the observed and predicted probability of 30-day urgent readmission. Predicted probabilities were obtained from generalized estimating equations, clustering on patient.
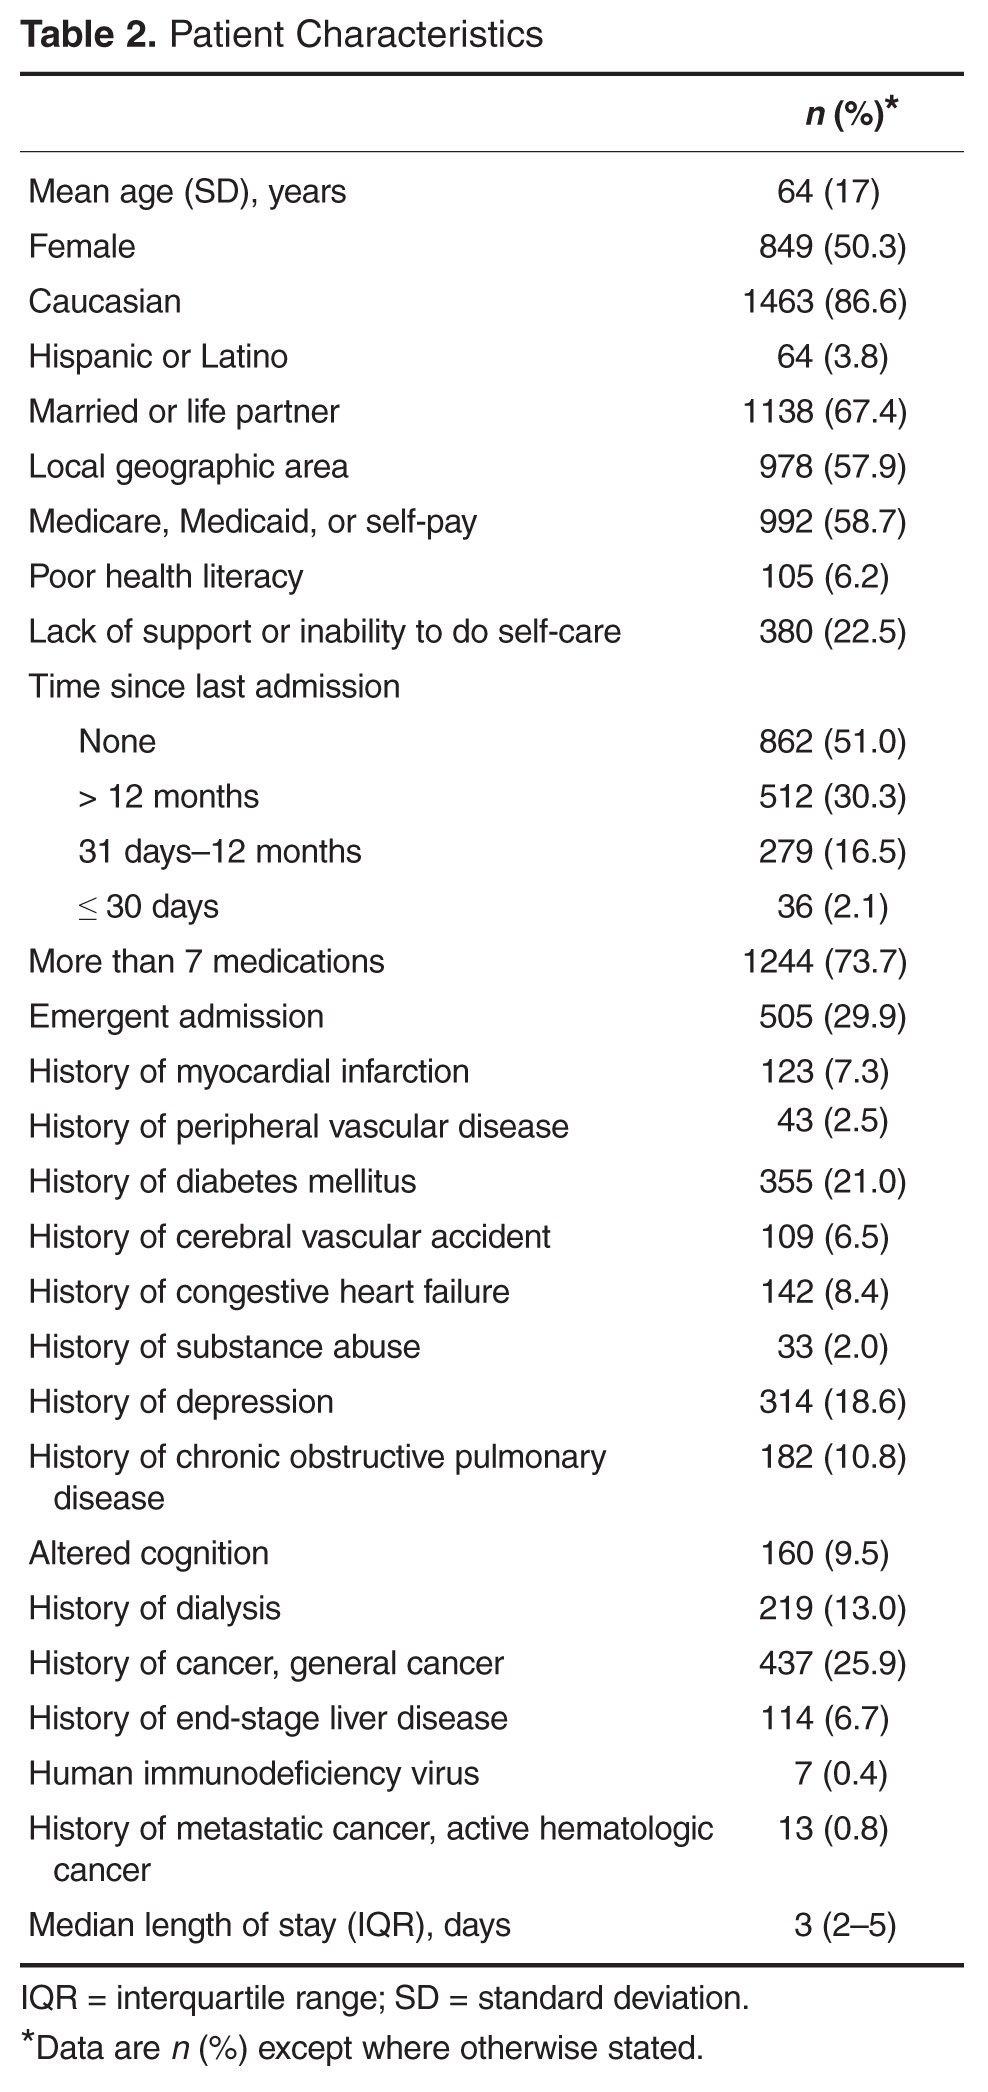
- Results: Of 1689 hospital inpatient discharges (1515 patients), 159 (9.4%) had a 30-day urgent readmission. The RRS had some discriminative ability (c statistic: 0.612; 95% confidence interval: 0.570–0.655) and good calibration.
- Conclusions: Our study shows that the RRS has some discriminative ability. The automated tool can be used to estimate the probability of a 30-day urgent readmission.
Hospital readmissions are increasingly scrutinized by the Center for Medicare and Medicaid Services and other payers due to their frequency and high cost. It is estimated that up to 25% of all patients discharged from acute care hospitals are readmitted within 30 days [1]. To address this problem, the Center for Medicare and Medicaid Services is using these rates as one of the benchmarks for quality for hospitals and health care organizations and has begun to assess penalties to those institutions with the highest rates. This scrutiny and the desire for better patient care transitions has resulted in most hospitals implementing various initiatives to reduce potentially avoidable readmissions.
Multiple interventions have been shown to reduce readmissions [2,3]. These interventions have varying effectiveness and are often labor intensive and thus costly to the institutions implementing them. In fact, no one intervention has been shown to be effective alone [4], and it may take several concurrent interventions targeting the highest risk patients to improve transitions of care at discharge that result in reduced readmissions. Many experts do recommend risk stratifying patients in order to target interventions to the highest risk patients for effective use of resources [5,6]. Several risk factor assessments have been proposed with varying success [7–13]. Multiple factors can limit the effectiveness of these risk stratification profiles. They may have low sensitivity and specificity, be based solely on retrospective data, be limited to certain populations, or be created from administrative data only without taking psychosocial factors into consideration [14].
An effective risk assessment ideally would encompass multiple known risk factors including certain comorbidities such as malignancy and heart failure, psychosocial factors such as health literacy and social support, and administrative data including payment source and demographics. All of these have been shown in prior studies to contribute to readmissions [7–13]. In addition, availability of the assessment early in the hospitalization would allow for interventions throughout the hospital stay to mitigate the effect of these factors where possible. To address these needs, our institution formed a readmission task force in January 2010 to review published literature on hospital 30-day readmissions and create a readmission risk score (RRS). The aim of this study was to quantify the predictive performance of the RRS after it was first implemented into the electronic medical record (EMR) in November 2012.
Methods
Study Design and Cohort
All consecutive adult inpatients who were discharged between 1 November 2012 and 31 December 2012 were included in this retrospective cohort study. This narrow time frame corresponded to the period from RRS tool implementation to the start of readmission interventions. We excluded hospitalizations if the patient died in the hospital.
Outcome Measures
The primary outcome was a 30-day urgent readmission, which included readmissions categorized as either emergency, urgent, or semi-urgent. Secondary outcomes included any 30-day readmission and 30-day death. Only readmissions to Mayo Clinic were examined.
Predictors
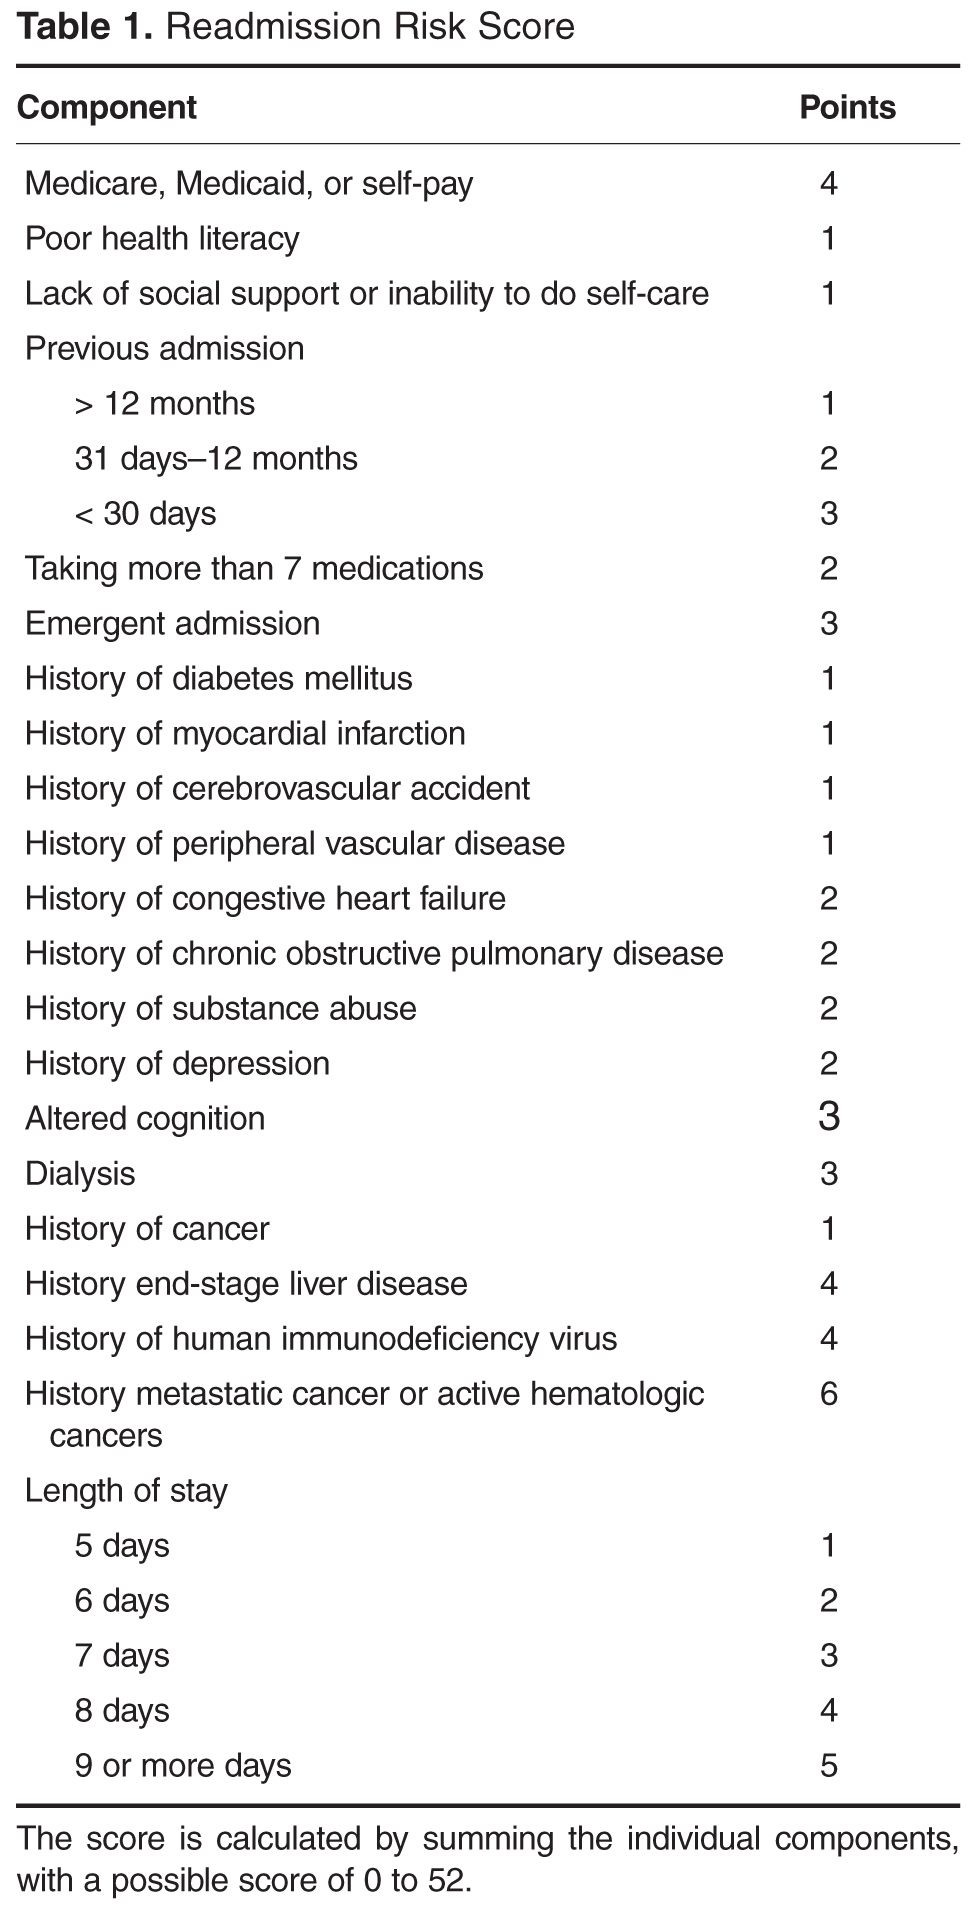
In collaboration with the information technology department, an algorithm was written to extract data from the EMR for each patient within 24 hours of admission to the hospital. This data was retrieved from existing repositories of patient information, such as demographic information, payer source, medication list, problem list, and past medical history. In addition, each patient was interviewed by a nurse at the time of admission, and the nurse completed an “admission profile” in the EMR that confirmed or entered past medical history, medications, social support at home, depression symptoms, and learning styles, among other information (Table 1). The algorithm was able to extract data from this evaluation also, so that each element of the risk score was correlated to at least one data source in the EMR. The algorithm then assigned the correct value to each element, and the total score was electronically calculated and placed in a discrete cell in each patient’s record. The algorithm was automatically run again 48 hours after the initial scoring in order to assure completeness of the information. If the patient had a length of stay greater than 5 days, an additional score was generated to include the length of stay component.
Statistical Analysis
The predictive performance of the RRS was assessed by evaluating the discrimination and calibration. Discrimination is the ability of the RRS to separate those who had a 30-day urgent readmission and those who did not. Discrimination was quantified by the c statistic, which is equivalent to the area under the receiver operating characteristic curve in this study owing to the use of binary endpoints. A c statistic of 1.0 would indicate that the RRS perfectly predicts 30-day urgent readmission while a c statistic of 0.5 would indicate the RRS has no apparent accuracy in predicting 30-day urgent readmission. Calibration assesses how closely predicted outcomes agree with observed outcomes. The predicted probability of 30-day urgent readmission was estimated utilizing a generalized estimating equation model, clustering on patient, with RRS as the only predictor variable. Inpatient discharges were divided into deciles of the predicted probabilities for 30-day urgent readmission. Agreement of the predicted and observed outcomes was displayed graphically according to decile of the predicted outcomes. All analyses were performed using SAS (version 9.3, SAS Institute, Cary, NC) and R statistical software (version 3.1.1, R Foundation for Statistical Computing, Vienna, Austria).
Results
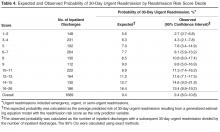
The RRS was significantly associated with 30-day urgent readmission (odds ratio [OR] for 1-point increase in the RRS, 1.07 [95% confidence interval {CI} 1.05–1.10]; P < 0.001). A c statistic of 0.612 (95% CI 0.570–0.655) indicates that the RRS has some ability to discriminate between those with and without a 30-day urgent readmission (Figure, Table 3). The expected and observed probabilities of 30-day urgent readmission were similar in each decile of the RRS. The calibration (Table 4) shows that although there is some deviation between the observed and expected probabilities, 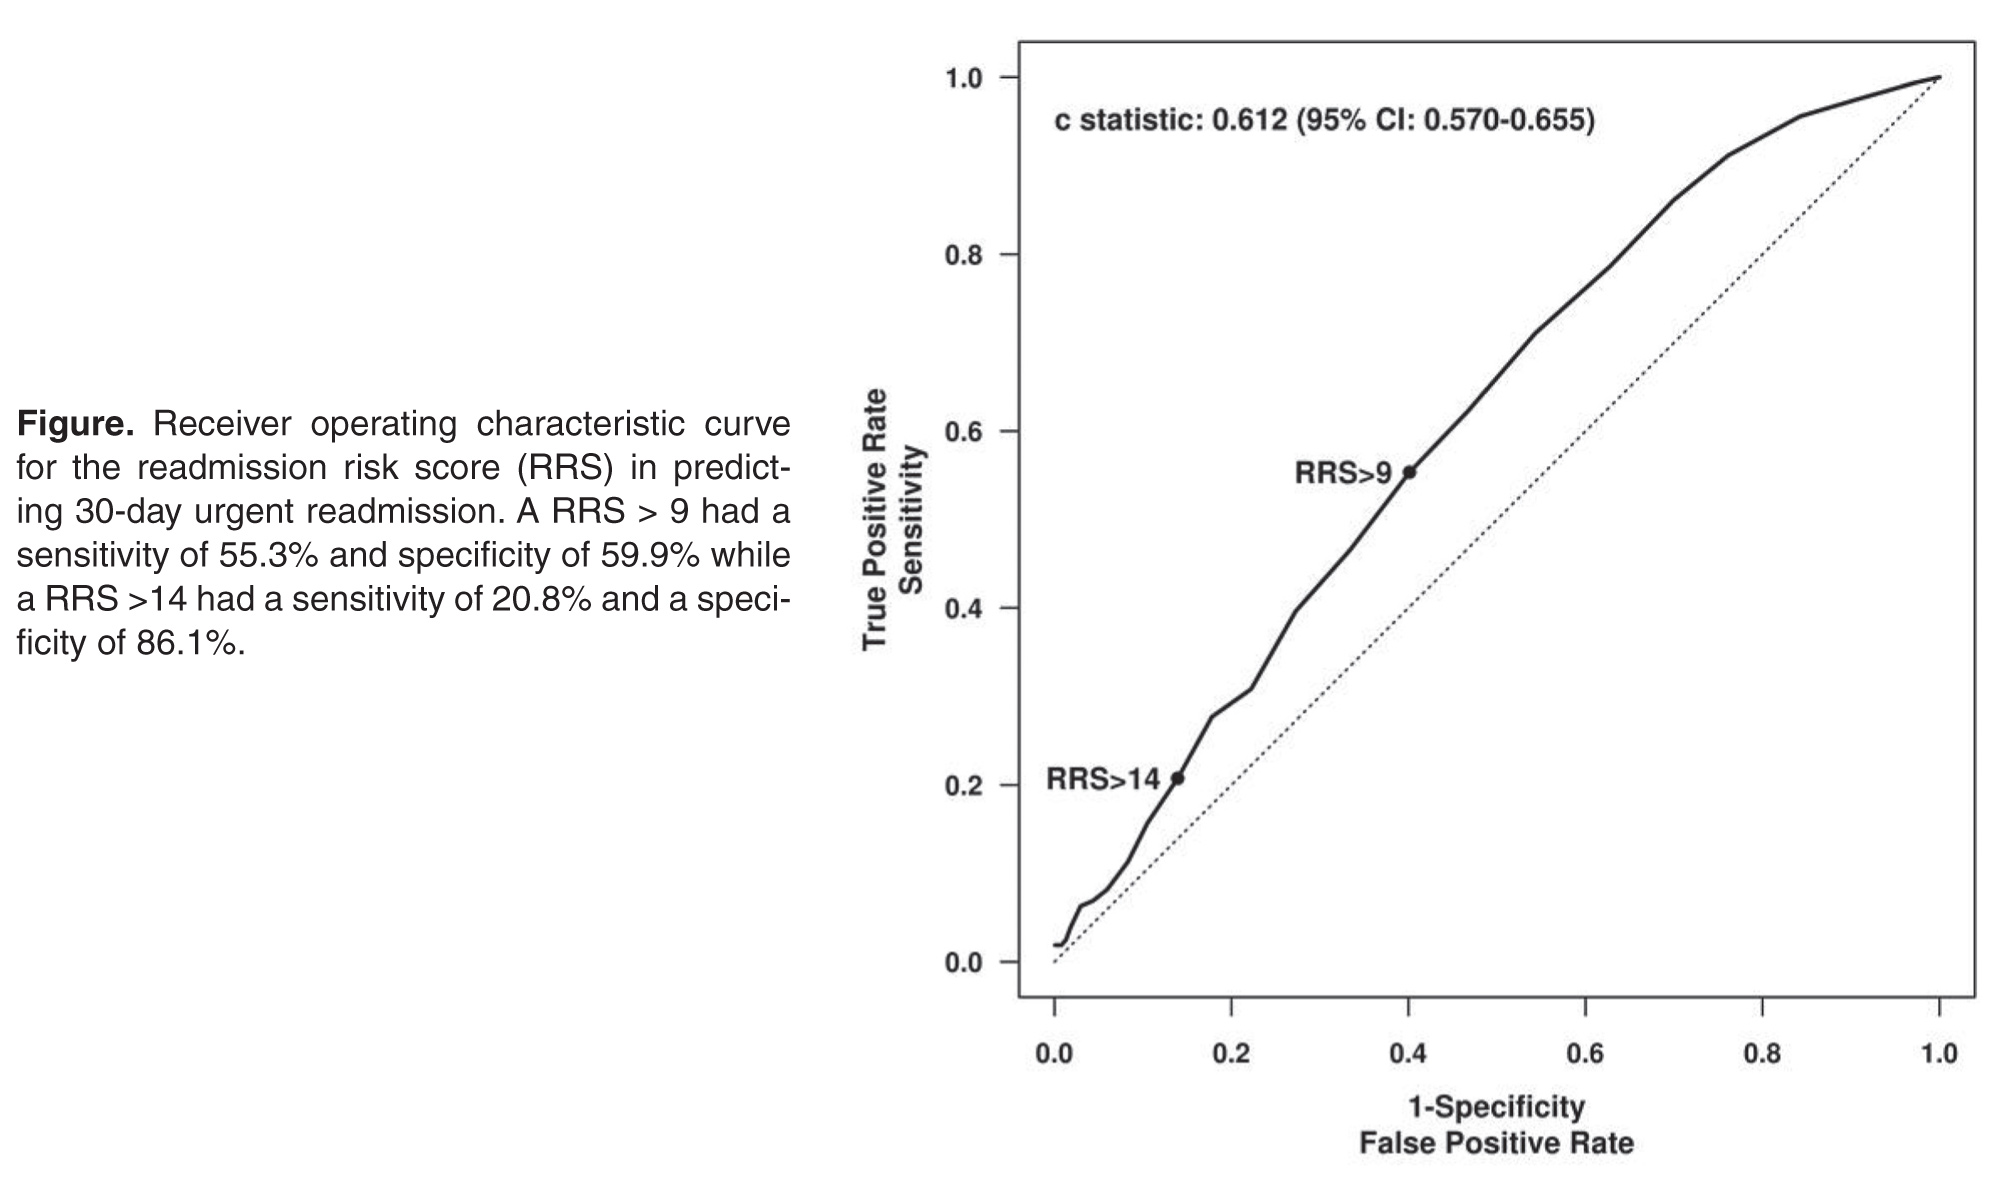
The RRS was also significantly associated with each of the secondary outcome measures. The odds ratios for a 1-point increase in the RRS for any 30-day readmission was 1.06 (95% CI 1.03–1.09, P < 0.001) and the c statistic was 0.591 (95% CI 0.551–0.631, Table 2). The odds ratios for a 1-point increase in the 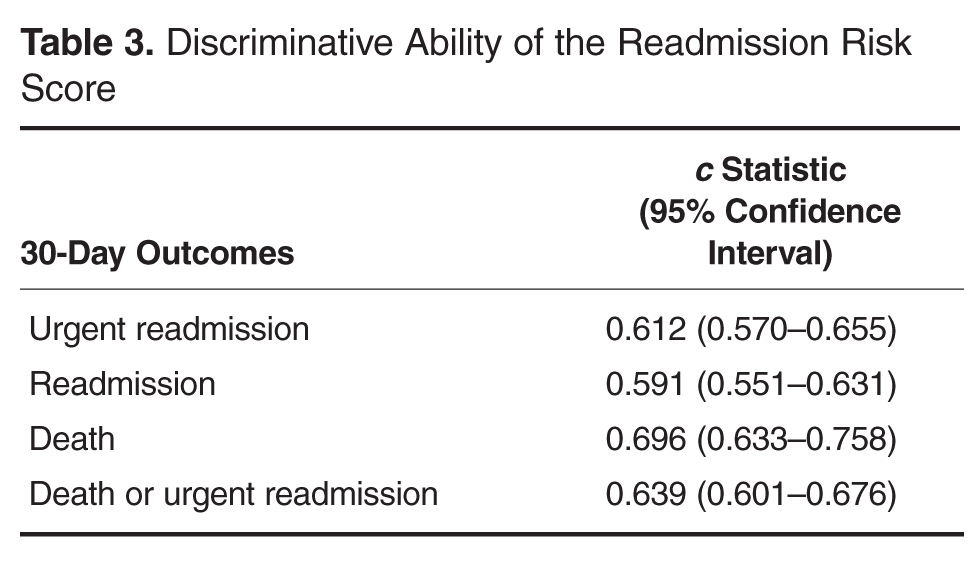
Discussion

Our study provides evidence that the RRS has some ability to discriminate between patients who did and did not have a 30-day urgent readmission (c statistic 0.612 [95% CI 0.570–0.655]). More importantly the calibration appears to be good particularly in the higher risk patients, which are the most crucial to identify in order to target interventions.
In addition to predicting the risk of readmission, our method of risk evaluation has several other advantages. First, the risk score is assigned to each patient within 24 to 48 hours of admission by using elements available at the time of, or soon after, admission. This early evaluation during the hospitalization identifies patients who could benefit from interventions throughout the stay that could help mitigate the risks and allow for a safer transition. Other studies have used elements available only at discharge, such as lab values and length of stay [7,11]. Donze et al used 7 elements in a validated scoring system, but several of the elements were discharge values and the risk assessment system had a fair discriminatory value with a c statistic of 0.71, similar to our results. The advantage to having the score available at admission is that several of the factors used to compose the RRS could be addressed during the hospitalization, including increased education for those with greater than 7 medications, intensive care management intervention for those with a lack of social support, and increased or modified education for those with low health literacy.
Second, the score is derived entirely from elements available in the EMR, thus the score is calculated automatically within 24 hours of admission and displayed in the chart for all providers to access. This eliminates any need for individual chart review or patient evaluation outside the normal admission process, making this system extremely efficient. Van Walraven et al [9] devised a scoring system using length of stay, acuity of admission, comorbidities and emergency department use (LACE index), with a validation c statistic of 0.684, which again is similar to our results. However, the LACE index uses the Charlson comorbidity index as a measure of patient comorbidity and this can be cumbersome to calculate in clinical practice. Having the score automatically available to all providers caring for the patient increases their awareness of the patient’s level of risk. Allaudeen and colleagues showed that providers are unable to intuitively predict those patients who are at high-risk for readmission [15]; therefore, an objective, readily available risk stratification is necessary to inform the providers.
Third, the risk scoring system uses elements from varied sources to include social, medical, and individual factors, all of which have been shown to increase risk of 30-day readmissions [9,15]. An accurate risk scoring system, ideally, should include elements from multiple sources, and use of the EMR allows for this varied compilation. The risk evaluation is done on every patient, regardless of admitting diagnosis, and in spite of this heterogeneous population, it was still found to be significantly accurate. Prior studies have looked at individual populations [7,10,12,13,16]; however, this can miss many patient populations that are also high-risk. Tailoring individual risk algorithms by diagnosis can also be labor intensive.
Our study has limitations. It is a retrospective study and included a relatively short study period of 2 months. This period was chosen because it represented the time from when the RRS was first implemented to when interventions to reduce readmission according to the RRS began, however, it still encompassed a significant number of discharges. We were only able to evaluate readmissions to our own facility; therefore, patients readmitted to other facilities were not included. Although readmission to any facility is undesirable, having a risk scoring system that can reliably predict readmission to the index admission hospital is still helpful. In addition, we only validated the risk score on patients in our own facility. A larger population from multiple facilities would be helpful for further validation. In spite of this limitation we would expect that most of our readmissions return to our own facility given our community setting. In fact, based on Medicare data for readmissions to all facilities, the difference in readmission rate between our facility and all facilities differs by less than 4%.
In summary, we developed a comprehensive risk scoring system that proved to be moderately predictive of readmission that encompasses multiple factors, is available to all providers early in a hospitalization, and is completely automated via the EMR. Further studies are ongoing to refine this score and improve the predictive performance.
Corresponding author: Nancy L. Dawson, MD, Division of Hospital Medicine, Mayo Clinic, 4500 San Pablo Road, Jacksonville, FL 32224, dawson.nancy11@mayo.edu.
Financial disclosures: None.
1. Elixhauser A, Steiner C. Statistical Brief #153: Readmissions to U.S. hospitals by diagnosis, 2010. Agency for Healthcare Research and Quality; 2013. Available at www.hcup-us.ahrq.gov/reports/statbriefs/sb153.pdf.
2. Jack BW, Chetty VK, Anthony D, et al. A reengineered hospital discharge program to decrease rehospitalization: a randomized trial. Ann Intern Med 2009;150:178–87.
3. Boutwell A, Hwu S. Effective interventions to reduce rehospitalizations: a survey of the published evidence. Cambridge, MA: Institute for Healthcare Improvement; 2009. Available at www.ihi.org/resources/Pages/Publications/EffectiveInterventionsReduceRehospitalizationsASurveyPublishedEvidence.aspx.
4. Hansen LO, Young RS, Hinami K, et al. Interventions to reduce 30-day rehospitalization: a systematic review. Ann Intern Med 2011;155:520–8.
5. Kripalani S, Theobald CN, Anctil B, Vasilevskis EE. Reducing hospital readmission rates: current strategies and future directions. Ann Rev Med 2014;65:471–85.
6. Osei-Anto A, Joshi M, Audet AM, et al. Health care leader action guide to reduce avoidable readmissions. Chicago: Health Research & Educational Trust; 2010. Available at www.hret.org/care/projects/resources/readmissions_cp.pdf.
7. Zaya M, Phan A, Schwarz ER. Predictors of re-hospitalization in patients with chronic heart failure. World J Cardiol 2012;4:23–30.
8. Hu J, Gonsahn MD, Nerenz DR. Socioeconomic status and readmissions: evidence from an urban teaching hospital. Health Aff (Millwood) 2014;33:778–85.
9. van Walraven C, Dhalla IA, Bell C, et al. Derivation and validation of an index to predict early death or unplanned readmission after discharge from hospital to the community. CMAJ 2010;182:551–7.
10. Rana S, Tran T, Luo W, et al. Predicting unplanned readmission after myocardial infarction from routinely collected administrative hospital data. Aust Health Rev 2014;38:377–82.
11. Donze J, Aujesky D, Williams D, Schnipper JL. Potentially avoidable 30-day hospital readmissions in medical patients: derivation and validation of a prediction model. JAMA Intern Med 2013;173:632–8.
12. Kogon B, Jain A, Oster M, et al. Risk factors associated with readmission after pediatric cardiothoracic surgery. Ann Thorac Surg 2012;94:865–73.
13. Harhay M, Lin E, Pai A, et al. Early rehospitalization after kidney transplantation: assessing preventability and prognosis. Am J Transplant 2013;13:3164–72.
14. Preventing unnecessary readmissions: transcending the hospital’s four walls to achieve collaborative care coordination. The Advisory Board Company; 2010. Available at www.advisory.com/research/physician-executive-council/studies/2010/preventing-unnecessary-readmissions.
15. Allaudeen N, Schnipper JL, Orav EJ, et al. Inability of providers to predict unplanned readmissions. J Gen Intern Med 2011;26:771–6.
16. Calvillo-King L, Arnold D, Eubank KJ, et al. Impact of social factors on risk of readmission or mortality in pneumonia and heart failure: systematic review. J Gen Intern Med 2013;28:269–82.
From the Divisions of Hospital Medicine (Drs. Dawson, Chirila, Bhide, and Burton) and Biomedical Statistics and Informatics (Ms. Thomas), Mayo Clinic, Jacksonville, FL, and the Division of Hospital Medicine, Mayo Clinic, Phoenix, AZ (Dr. Cannon).
Abstract
- Objective: To validate an electronic tool created to identify inpatients who are at risk of readmission within 30 days and quantify the predictive performance of the readmission risk score (RRS).
- Methods: Retrospective cohort study including inpa-tients who were discharged between 1 Nov 2012 and 31 Dec 2012. The ability of the RRS to discriminate between those who did and did not have a 30-day urgent readmission was quantified by the c statistic. Calibration was assessed by plotting the observed and predicted probability of 30-day urgent readmission. Predicted probabilities were obtained from generalized estimating equations, clustering on patient.
- Results: Of 1689 hospital inpatient discharges (1515 patients), 159 (9.4%) had a 30-day urgent readmission. The RRS had some discriminative ability (c statistic: 0.612; 95% confidence interval: 0.570–0.655) and good calibration.
- Conclusions: Our study shows that the RRS has some discriminative ability. The automated tool can be used to estimate the probability of a 30-day urgent readmission.
Hospital readmissions are increasingly scrutinized by the Center for Medicare and Medicaid Services and other payers due to their frequency and high cost. It is estimated that up to 25% of all patients discharged from acute care hospitals are readmitted within 30 days [1]. To address this problem, the Center for Medicare and Medicaid Services is using these rates as one of the benchmarks for quality for hospitals and health care organizations and has begun to assess penalties to those institutions with the highest rates. This scrutiny and the desire for better patient care transitions has resulted in most hospitals implementing various initiatives to reduce potentially avoidable readmissions.
Multiple interventions have been shown to reduce readmissions [2,3]. These interventions have varying effectiveness and are often labor intensive and thus costly to the institutions implementing them. In fact, no one intervention has been shown to be effective alone [4], and it may take several concurrent interventions targeting the highest risk patients to improve transitions of care at discharge that result in reduced readmissions. Many experts do recommend risk stratifying patients in order to target interventions to the highest risk patients for effective use of resources [5,6]. Several risk factor assessments have been proposed with varying success [7–13]. Multiple factors can limit the effectiveness of these risk stratification profiles. They may have low sensitivity and specificity, be based solely on retrospective data, be limited to certain populations, or be created from administrative data only without taking psychosocial factors into consideration [14].
An effective risk assessment ideally would encompass multiple known risk factors including certain comorbidities such as malignancy and heart failure, psychosocial factors such as health literacy and social support, and administrative data including payment source and demographics. All of these have been shown in prior studies to contribute to readmissions [7–13]. In addition, availability of the assessment early in the hospitalization would allow for interventions throughout the hospital stay to mitigate the effect of these factors where possible. To address these needs, our institution formed a readmission task force in January 2010 to review published literature on hospital 30-day readmissions and create a readmission risk score (RRS). The aim of this study was to quantify the predictive performance of the RRS after it was first implemented into the electronic medical record (EMR) in November 2012.
Methods
Study Design and Cohort
All consecutive adult inpatients who were discharged between 1 November 2012 and 31 December 2012 were included in this retrospective cohort study. This narrow time frame corresponded to the period from RRS tool implementation to the start of readmission interventions. We excluded hospitalizations if the patient died in the hospital.
Outcome Measures
The primary outcome was a 30-day urgent readmission, which included readmissions categorized as either emergency, urgent, or semi-urgent. Secondary outcomes included any 30-day readmission and 30-day death. Only readmissions to Mayo Clinic were examined.
Predictors
In collaboration with the information technology department, an algorithm was written to extract data from the EMR for each patient within 24 hours of admission to the hospital. This data was retrieved from existing repositories of patient information, such as demographic information, payer source, medication list, problem list, and past medical history. In addition, each patient was interviewed by a nurse at the time of admission, and the nurse completed an “admission profile” in the EMR that confirmed or entered past medical history, medications, social support at home, depression symptoms, and learning styles, among other information (Table 1). The algorithm was able to extract data from this evaluation also, so that each element of the risk score was correlated to at least one data source in the EMR. The algorithm then assigned the correct value to each element, and the total score was electronically calculated and placed in a discrete cell in each patient’s record. The algorithm was automatically run again 48 hours after the initial scoring in order to assure completeness of the information. If the patient had a length of stay greater than 5 days, an additional score was generated to include the length of stay component.
Statistical Analysis
The predictive performance of the RRS was assessed by evaluating the discrimination and calibration. Discrimination is the ability of the RRS to separate those who had a 30-day urgent readmission and those who did not. Discrimination was quantified by the c statistic, which is equivalent to the area under the receiver operating characteristic curve in this study owing to the use of binary endpoints. A c statistic of 1.0 would indicate that the RRS perfectly predicts 30-day urgent readmission while a c statistic of 0.5 would indicate the RRS has no apparent accuracy in predicting 30-day urgent readmission. Calibration assesses how closely predicted outcomes agree with observed outcomes. The predicted probability of 30-day urgent readmission was estimated utilizing a generalized estimating equation model, clustering on patient, with RRS as the only predictor variable. Inpatient discharges were divided into deciles of the predicted probabilities for 30-day urgent readmission. Agreement of the predicted and observed outcomes was displayed graphically according to decile of the predicted outcomes. All analyses were performed using SAS (version 9.3, SAS Institute, Cary, NC) and R statistical software (version 3.1.1, R Foundation for Statistical Computing, Vienna, Austria).
Results
The RRS was significantly associated with 30-day urgent readmission (odds ratio [OR] for 1-point increase in the RRS, 1.07 [95% confidence interval {CI} 1.05–1.10]; P < 0.001). A c statistic of 0.612 (95% CI 0.570–0.655) indicates that the RRS has some ability to discriminate between those with and without a 30-day urgent readmission (Figure, Table 3). The expected and observed probabilities of 30-day urgent readmission were similar in each decile of the RRS. The calibration (Table 4) shows that although there is some deviation between the observed and expected probabilities,
The RRS was also significantly associated with each of the secondary outcome measures. The odds ratios for a 1-point increase in the RRS for any 30-day readmission was 1.06 (95% CI 1.03–1.09, P < 0.001) and the c statistic was 0.591 (95% CI 0.551–0.631, Table 2). The odds ratios for a 1-point increase in the
Discussion
Our study provides evidence that the RRS has some ability to discriminate between patients who did and did not have a 30-day urgent readmission (c statistic 0.612 [95% CI 0.570–0.655]). More importantly the calibration appears to be good particularly in the higher risk patients, which are the most crucial to identify in order to target interventions.
In addition to predicting the risk of readmission, our method of risk evaluation has several other advantages. First, the risk score is assigned to each patient within 24 to 48 hours of admission by using elements available at the time of, or soon after, admission. This early evaluation during the hospitalization identifies patients who could benefit from interventions throughout the stay that could help mitigate the risks and allow for a safer transition. Other studies have used elements available only at discharge, such as lab values and length of stay [7,11]. Donze et al used 7 elements in a validated scoring system, but several of the elements were discharge values and the risk assessment system had a fair discriminatory value with a c statistic of 0.71, similar to our results. The advantage to having the score available at admission is that several of the factors used to compose the RRS could be addressed during the hospitalization, including increased education for those with greater than 7 medications, intensive care management intervention for those with a lack of social support, and increased or modified education for those with low health literacy.
Second, the score is derived entirely from elements available in the EMR, thus the score is calculated automatically within 24 hours of admission and displayed in the chart for all providers to access. This eliminates any need for individual chart review or patient evaluation outside the normal admission process, making this system extremely efficient. Van Walraven et al [9] devised a scoring system using length of stay, acuity of admission, comorbidities and emergency department use (LACE index), with a validation c statistic of 0.684, which again is similar to our results. However, the LACE index uses the Charlson comorbidity index as a measure of patient comorbidity and this can be cumbersome to calculate in clinical practice. Having the score automatically available to all providers caring for the patient increases their awareness of the patient’s level of risk. Allaudeen and colleagues showed that providers are unable to intuitively predict those patients who are at high-risk for readmission [15]; therefore, an objective, readily available risk stratification is necessary to inform the providers.
Third, the risk scoring system uses elements from varied sources to include social, medical, and individual factors, all of which have been shown to increase risk of 30-day readmissions [9,15]. An accurate risk scoring system, ideally, should include elements from multiple sources, and use of the EMR allows for this varied compilation. The risk evaluation is done on every patient, regardless of admitting diagnosis, and in spite of this heterogeneous population, it was still found to be significantly accurate. Prior studies have looked at individual populations [7,10,12,13,16]; however, this can miss many patient populations that are also high-risk. Tailoring individual risk algorithms by diagnosis can also be labor intensive.
Our study has limitations. It is a retrospective study and included a relatively short study period of 2 months. This period was chosen because it represented the time from when the RRS was first implemented to when interventions to reduce readmission according to the RRS began, however, it still encompassed a significant number of discharges. We were only able to evaluate readmissions to our own facility; therefore, patients readmitted to other facilities were not included. Although readmission to any facility is undesirable, having a risk scoring system that can reliably predict readmission to the index admission hospital is still helpful. In addition, we only validated the risk score on patients in our own facility. A larger population from multiple facilities would be helpful for further validation. In spite of this limitation we would expect that most of our readmissions return to our own facility given our community setting. In fact, based on Medicare data for readmissions to all facilities, the difference in readmission rate between our facility and all facilities differs by less than 4%.
In summary, we developed a comprehensive risk scoring system that proved to be moderately predictive of readmission that encompasses multiple factors, is available to all providers early in a hospitalization, and is completely automated via the EMR. Further studies are ongoing to refine this score and improve the predictive performance.
Corresponding author: Nancy L. Dawson, MD, Division of Hospital Medicine, Mayo Clinic, 4500 San Pablo Road, Jacksonville, FL 32224, dawson.nancy11@mayo.edu.
Financial disclosures: None.
1. Elixhauser A, Steiner C. Statistical Brief #153: Readmissions to U.S. hospitals by diagnosis, 2010. Agency for Healthcare Research and Quality; 2013. Available at www.hcup-us.ahrq.gov/reports/statbriefs/sb153.pdf.
2. Jack BW, Chetty VK, Anthony D, et al. A reengineered hospital discharge program to decrease rehospitalization: a randomized trial. Ann Intern Med 2009;150:178–87.
3. Boutwell A, Hwu S. Effective interventions to reduce rehospitalizations: a survey of the published evidence. Cambridge, MA: Institute for Healthcare Improvement; 2009. Available at www.ihi.org/resources/Pages/Publications/EffectiveInterventionsReduceRehospitalizationsASurveyPublishedEvidence.aspx.
4. Hansen LO, Young RS, Hinami K, et al. Interventions to reduce 30-day rehospitalization: a systematic review. Ann Intern Med 2011;155:520–8.
5. Kripalani S, Theobald CN, Anctil B, Vasilevskis EE. Reducing hospital readmission rates: current strategies and future directions. Ann Rev Med 2014;65:471–85.
6. Osei-Anto A, Joshi M, Audet AM, et al. Health care leader action guide to reduce avoidable readmissions. Chicago: Health Research & Educational Trust; 2010. Available at www.hret.org/care/projects/resources/readmissions_cp.pdf.
7. Zaya M, Phan A, Schwarz ER. Predictors of re-hospitalization in patients with chronic heart failure. World J Cardiol 2012;4:23–30.
8. Hu J, Gonsahn MD, Nerenz DR. Socioeconomic status and readmissions: evidence from an urban teaching hospital. Health Aff (Millwood) 2014;33:778–85.
9. van Walraven C, Dhalla IA, Bell C, et al. Derivation and validation of an index to predict early death or unplanned readmission after discharge from hospital to the community. CMAJ 2010;182:551–7.
10. Rana S, Tran T, Luo W, et al. Predicting unplanned readmission after myocardial infarction from routinely collected administrative hospital data. Aust Health Rev 2014;38:377–82.
11. Donze J, Aujesky D, Williams D, Schnipper JL. Potentially avoidable 30-day hospital readmissions in medical patients: derivation and validation of a prediction model. JAMA Intern Med 2013;173:632–8.
12. Kogon B, Jain A, Oster M, et al. Risk factors associated with readmission after pediatric cardiothoracic surgery. Ann Thorac Surg 2012;94:865–73.
13. Harhay M, Lin E, Pai A, et al. Early rehospitalization after kidney transplantation: assessing preventability and prognosis. Am J Transplant 2013;13:3164–72.
14. Preventing unnecessary readmissions: transcending the hospital’s four walls to achieve collaborative care coordination. The Advisory Board Company; 2010. Available at www.advisory.com/research/physician-executive-council/studies/2010/preventing-unnecessary-readmissions.
15. Allaudeen N, Schnipper JL, Orav EJ, et al. Inability of providers to predict unplanned readmissions. J Gen Intern Med 2011;26:771–6.
16. Calvillo-King L, Arnold D, Eubank KJ, et al. Impact of social factors on risk of readmission or mortality in pneumonia and heart failure: systematic review. J Gen Intern Med 2013;28:269–82.