User login
The Inpatient Blindside: Comorbid Mental Health Conditions and Readmissions among Hospitalized Children
To ensure hospital quality, the Centers for Medicaid & Medicare Services have tied payments to performance measures, including readmissions.1 One readmission metric, the Potentially Preventable Readmission measure (3M, PPR), was initially developed for Medicare and defined as readmissions related to an index admission, excluding those for treatment of cancer, related to trauma or burns, or following neonatal hospitalization. The PPR includes readmissions for both primary mental health conditions (MHCs) and for other hospitalizations with comorbid MHCs.2 Although controversies surround equating a hospital’s quality with its rate of readmissions, the PPR has been expanded to include numerous states. Since the PPR is also used for the Medicaid population in these states, it also measures pediatric readmissions. Hospitals in states adopting PPR calculations, including children’s hospitals, must either meet these new quality metrics or risk financial penalties. In light of evidence of high readmission rates among adult patients with MHCs, several states have modified the PPR to exclude MHCs and claims for mental health services.3–9
In their study, “Mental Health Conditions and Unplanned Hospital Readmissions in Children,” Doupnik et al. provided compelling evidence that MHCs in children (similar to adults) are closely associated with readmissions.10 MHCs are possibly underappreciated risk factors for readmission penalties and therefore represent a necessary point for increased awareness. Doupnik et al. calculated 30-day unplanned hospital readmissions of children with versus without comorbid MHCs using another standard measure, the Pediatric All-Condition Readmission (PACR) measure. The PACR measure excludes index admissions with a MHC as primary diagnosis but includes children with comorbid MHCs.
Doupnik et al. used a nationally representative cohort of all index hospitalizations of children aged 3–21 years from the 2013 Nationwide Readmission Database that allowed for estimates of MHC prevalence in the study population.11 A comorbid MHC was identified in almost 1 in 5 medical admissions and 1 in 7 procedural admissions. Comorbid substance abuse was identified in 5.4% of medical admissions and 4.7% of procedure admissions, making this diagnosis the most frequently coded stand-alone MHC. The authors’ findings are particularly noteworthy given that diagnosis of MHCs is highly dependent upon coding and is therefore almost certainly underreported. In pediatric inpatient populations, the true prevalence of comorbid MHCs is probably higher.
Doupnik et al. observed that comorbid MHCs are a significant risk factor for readmission. After adjustment for demographic, clinical, and hospital characteristics, children with MHCs presented a nearly 25% higher chance of readmission for both medical and procedural hospitalizations. Children admitted with medical conditions and multiple MHCs yielded odds of readmission 50% higher than that of children without MHCs. Overall, the presence of MHCs was associated with more than 2,500 medical and 200 procedure readmissions.
Previous studies in adult populations have also found that comorbid MHCs are an important risk factor for readmissions.12,13 Other research describes that children with MHCs have increased hospital resource use, including longer lengths of stay and higher hospitalization costs.14-17 Further, children with MHCs as a primary diagnosis are more prone to readmission, with readmission rates approaching those observed in children with medical complexity in some cases.18,19 MHCs are common among hospitalized children and have become an increasingly present comorbidity in primary medical or surgical admissions.17
One particular strength of this study lies in its description of the relationship between comorbid (not primary) MHCs and readmission following medical or surgical procedures in hospitalized children. This relationship has been examined in adult inpatient populations but less so in pediatric inpatient populations.12,13 This study provides insights into the relationships between specific MHCs and unplanned readmissions for certain primary medical or surgical diagnoses, including those for attention deficit disorder and autism that are not well-recognized in adult populations.
High-quality inpatient pediatric practice depends not only upon recognition of concurrent MHCs during hospitalizations but also assurance of follow-up outside of such institutions. During the inpatient care of children, pediatric hospitalists often perform myopic inpatient care which fails to routinely address underlying MHCs.20 For example, among children who are admitted with primary medical or procedure diagnoses, it is possible, or perhaps likely, that providers give little attention to an underlying MHC outside of continuation of a current medication. Comorbid MHCs are not accounted for within readmission calculations that directly affect hospital reimbursement. This study suggests that comorbid MHCs in hospitalized children may worsen readmission penalty status. In this manner, comorbid MHCs may represent a hospital’s blindside.
We agree with Doupnik et al. that an integrated approach with medical and mental health professionals may improve the care of children with MHCs in hospitalized settings. This improvement in care may eventually affect hospital-level national quality metrics, such as readmissions. The findings of Doupnik et al. also provide a strong argument that pediatric inpatient providers should consider mental health consultations for patients with frequent admissions associated with chronic conditions, as comorbid MHCs are associated with worsened disease states and account for a disproportionate share of admissions for children with chronic conditions.21,22 Recognition of comorbid MHCs may improve baseline chronic disease states for hospitalized children.
We assert that the current silos in inpatient pediatrics of medical and mental healthcare are outdated. Pediatric hospitalists need to assess for and access effective MHC treatment options in the inpatient setting. In addition to the provision of mental health care within hospital settings, providers should also ensure that appropriate follow-up is arranged at the time of discharge. From a health policy standpoint, providers should clarify how both primary and comorbid MHCs are included within readmission measures while considering the close association of these conditions with readmission. Although the care of children with MHCs requires a long-term and coordinated approach, identification and treatment during hospitalization offer unique opportunities to modify outcomes of MHCs and coexistent medical and surgical diagnoses.
Disclosures
The authors declare no conflict of interest.
1. Centers for Medicare & Medicaid Services. Hospital Readmission Reduction Program. https://www.cms.gov/Medicare/Quality-Initiatives-Patient-Assessment-Instruments/Value-Based-Programs/HRRP/Hospital-Readmission-Reduction-Program.html. Published September 28, 2015. Accessed February 9, 2018.
2. 3M. Potentially Preventable Readmissions Classification System. http://multimedia.3m.com/mws/media/1042610O/resources-and-references-his-2015.pdf. Accessed February 9, 2018.
3. Illinois Department of Family and Healthcare Services. Hospital Inpatient Potentially Preventable Readmissions Information and Reports. https://www.illinois.gov/hfs/MedicalProviders/hospitals/PPRReports/Pages/default.aspx. Accessed February 9, 2018.
4. New York State Department of Health. Potentially preventable hospital readmissions among medicaid recipients with mental health and/or substance abuse health conditions compared with all others: New York State, 2007. https://www.health.ny.gov/health_care/managed_care/reports/statistics_data/3hospital_readmissions_mentahealth.pdf. Accessed February 9, 2018.
5. Texas Health and Human Services Commission. Potentially preventable readmissions in Texas Medicaid and CHIP Programs, Fiscal Year 2013. https://hhs.texas.gov/reports/2016/08/potentially-preventable-readmissions-texas-medicaid-and-chip-programs-fiscal-year-2013. Accessed February 9, 2018.
6. Oklahoma Healthcare Association. Provider reimbursement notice. https://www.okhca.org/providers.aspx?id=2538. Accessed February 9, 2018.
7. Washington State Hospital Association. Potentially preventable readmission (PPR) adjustments. http://www.wsha.org/articles/hca-implements-potentially-preventable-readmission-ppr-adjustments/. Accessed February 9, 2018.
8. State of Colorado. HQIP 30-day All cause readmission. https://www.colorado.gov/pacific/sites/default/files/2016%20March%20HQIP%2030-day%20all-cause%20readmission%20measure.pdf. Accessed February 9, 2018.
9. Maryland Health Services Cost Review Commission. Readmission reduction incentive program. http://www.hscrc.state.md.us/Pages/init-readm-rip.aspx. Accessed February 9, 2018.
10. Doupnik SK, Lawlor J, Zima BT, et al. Mental health conditions and unplanned hospital readmissions in children. J Hosp Med. 2018(13):445-452. PubMed
11. NRD Overview. https://www.hcup-us.ahrq.gov/nrdoverview.jsp. Accessed February 9, 2018.
12. Singh G, Zhang W, Kuo Y-F, Sharma G. Association of psychological disorders with 30-day readmission rates in patients with COPD. Chest. 2016;149(4):905-915. doi:10.1378/chest.15-0449 PubMed
13. McIntyre LK, Arbabi S, Robinson EF, Maier RV. Analysis of risk factors for patient readmission 30 days following discharge from general surgery. JAMA Surg. 2016;151(9):855-861. doi:10.1001/jamasurg.2016.1258 PubMed
14. Bardach NS, Coker TR, Zima BT, et al. Common and costly hospitalizations for pediatric mental health disorders. Pediatrics. 2014;133(4):602-609. doi:10.1542/peds.2013-3165 PubMed
15. Doupnik SK, Lawlor J, Zima BT, et al. Mental health conditions and medical and surgical hospital utilization. Pediatrics. 2016;138(6): e20162416. doi:10.1542/peds.2016-2416 PubMed
16. Doupnik SK, Mitra N, Feudtner C, Marcus SC. The influence of comorbid mood and anxiety disorders on outcomes of pediatric patients hospitalized for pneumonia. Hosp Pediatr. 2016;6(3):135-142. doi:10.1542/hpeds.2015-0177 PubMed
17. Zima BT, Rodean J, Hall M, Bardach NS, Coker TR, Berry JG. Psychiatric disorders and trends in resource use in pediatric hospitals. Pediatrics. 2016;138(5): e20160909. doi:10.1542/peds.2016-0909 PubMed
18. Feng JY, Toomey SL, Zaslavsky AM, Nakamura MM, Schuster MA. Readmission after pediatric mental health admissions. Pediatrics. 2017;140(6):e20171571. doi:10.1542/peds.2017-1571 PubMed
19. Cohen E, Berry JG, Camacho X, Anderson G, Wodchis W, Guttmann A. Patterns and costs of health care use of children with medical complexity. Pediatrics. 2012;130(6):e1463-e1470. doi:10.1542/peds.2012-0175 PubMed
20. Doupnik SK, Walter JK. Collaboration is key to improving hospital care for patients with medical and psychiatric comorbidity. Hosp Pediatr. 2016;6(12):760-762. doi:10.1542/hpeds.2016-0165 PubMed
21. Richardson LP, Russo JE, Lozano P, McCauley E, Katon W. The effect of comorbid anxiety and depressive disorders on health care utilization and costs among adolescents with asthma. Gen Hosp Psychiatry. 2008;30(5):398-406. doi:10.1016/j.genhosppsych.2008.06.004 PubMed
22. Malik FS, Hall M, Mangione-Smith R, et al. Patient characteristics associated with differences in admission frequency for diabetic ketoacidosis in United States children’s hospitals. J Pediatr. 2016;171:104-110. doi:10.1016/j.jpeds.2015.12.015 PubMed
To ensure hospital quality, the Centers for Medicaid & Medicare Services have tied payments to performance measures, including readmissions.1 One readmission metric, the Potentially Preventable Readmission measure (3M, PPR), was initially developed for Medicare and defined as readmissions related to an index admission, excluding those for treatment of cancer, related to trauma or burns, or following neonatal hospitalization. The PPR includes readmissions for both primary mental health conditions (MHCs) and for other hospitalizations with comorbid MHCs.2 Although controversies surround equating a hospital’s quality with its rate of readmissions, the PPR has been expanded to include numerous states. Since the PPR is also used for the Medicaid population in these states, it also measures pediatric readmissions. Hospitals in states adopting PPR calculations, including children’s hospitals, must either meet these new quality metrics or risk financial penalties. In light of evidence of high readmission rates among adult patients with MHCs, several states have modified the PPR to exclude MHCs and claims for mental health services.3–9
In their study, “Mental Health Conditions and Unplanned Hospital Readmissions in Children,” Doupnik et al. provided compelling evidence that MHCs in children (similar to adults) are closely associated with readmissions.10 MHCs are possibly underappreciated risk factors for readmission penalties and therefore represent a necessary point for increased awareness. Doupnik et al. calculated 30-day unplanned hospital readmissions of children with versus without comorbid MHCs using another standard measure, the Pediatric All-Condition Readmission (PACR) measure. The PACR measure excludes index admissions with a MHC as primary diagnosis but includes children with comorbid MHCs.
Doupnik et al. used a nationally representative cohort of all index hospitalizations of children aged 3–21 years from the 2013 Nationwide Readmission Database that allowed for estimates of MHC prevalence in the study population.11 A comorbid MHC was identified in almost 1 in 5 medical admissions and 1 in 7 procedural admissions. Comorbid substance abuse was identified in 5.4% of medical admissions and 4.7% of procedure admissions, making this diagnosis the most frequently coded stand-alone MHC. The authors’ findings are particularly noteworthy given that diagnosis of MHCs is highly dependent upon coding and is therefore almost certainly underreported. In pediatric inpatient populations, the true prevalence of comorbid MHCs is probably higher.
Doupnik et al. observed that comorbid MHCs are a significant risk factor for readmission. After adjustment for demographic, clinical, and hospital characteristics, children with MHCs presented a nearly 25% higher chance of readmission for both medical and procedural hospitalizations. Children admitted with medical conditions and multiple MHCs yielded odds of readmission 50% higher than that of children without MHCs. Overall, the presence of MHCs was associated with more than 2,500 medical and 200 procedure readmissions.
Previous studies in adult populations have also found that comorbid MHCs are an important risk factor for readmissions.12,13 Other research describes that children with MHCs have increased hospital resource use, including longer lengths of stay and higher hospitalization costs.14-17 Further, children with MHCs as a primary diagnosis are more prone to readmission, with readmission rates approaching those observed in children with medical complexity in some cases.18,19 MHCs are common among hospitalized children and have become an increasingly present comorbidity in primary medical or surgical admissions.17
One particular strength of this study lies in its description of the relationship between comorbid (not primary) MHCs and readmission following medical or surgical procedures in hospitalized children. This relationship has been examined in adult inpatient populations but less so in pediatric inpatient populations.12,13 This study provides insights into the relationships between specific MHCs and unplanned readmissions for certain primary medical or surgical diagnoses, including those for attention deficit disorder and autism that are not well-recognized in adult populations.
High-quality inpatient pediatric practice depends not only upon recognition of concurrent MHCs during hospitalizations but also assurance of follow-up outside of such institutions. During the inpatient care of children, pediatric hospitalists often perform myopic inpatient care which fails to routinely address underlying MHCs.20 For example, among children who are admitted with primary medical or procedure diagnoses, it is possible, or perhaps likely, that providers give little attention to an underlying MHC outside of continuation of a current medication. Comorbid MHCs are not accounted for within readmission calculations that directly affect hospital reimbursement. This study suggests that comorbid MHCs in hospitalized children may worsen readmission penalty status. In this manner, comorbid MHCs may represent a hospital’s blindside.
We agree with Doupnik et al. that an integrated approach with medical and mental health professionals may improve the care of children with MHCs in hospitalized settings. This improvement in care may eventually affect hospital-level national quality metrics, such as readmissions. The findings of Doupnik et al. also provide a strong argument that pediatric inpatient providers should consider mental health consultations for patients with frequent admissions associated with chronic conditions, as comorbid MHCs are associated with worsened disease states and account for a disproportionate share of admissions for children with chronic conditions.21,22 Recognition of comorbid MHCs may improve baseline chronic disease states for hospitalized children.
We assert that the current silos in inpatient pediatrics of medical and mental healthcare are outdated. Pediatric hospitalists need to assess for and access effective MHC treatment options in the inpatient setting. In addition to the provision of mental health care within hospital settings, providers should also ensure that appropriate follow-up is arranged at the time of discharge. From a health policy standpoint, providers should clarify how both primary and comorbid MHCs are included within readmission measures while considering the close association of these conditions with readmission. Although the care of children with MHCs requires a long-term and coordinated approach, identification and treatment during hospitalization offer unique opportunities to modify outcomes of MHCs and coexistent medical and surgical diagnoses.
Disclosures
The authors declare no conflict of interest.
1. Centers for Medicare & Medicaid Services. Hospital Readmission Reduction Program. https://www.cms.gov/Medicare/Quality-Initiatives-Patient-Assessment-Instruments/Value-Based-Programs/HRRP/Hospital-Readmission-Reduction-Program.html. Published September 28, 2015. Accessed February 9, 2018.
2. 3M. Potentially Preventable Readmissions Classification System. http://multimedia.3m.com/mws/media/1042610O/resources-and-references-his-2015.pdf. Accessed February 9, 2018.
3. Illinois Department of Family and Healthcare Services. Hospital Inpatient Potentially Preventable Readmissions Information and Reports. https://www.illinois.gov/hfs/MedicalProviders/hospitals/PPRReports/Pages/default.aspx. Accessed February 9, 2018.
4. New York State Department of Health. Potentially preventable hospital readmissions among medicaid recipients with mental health and/or substance abuse health conditions compared with all others: New York State, 2007. https://www.health.ny.gov/health_care/managed_care/reports/statistics_data/3hospital_readmissions_mentahealth.pdf. Accessed February 9, 2018.
5. Texas Health and Human Services Commission. Potentially preventable readmissions in Texas Medicaid and CHIP Programs, Fiscal Year 2013. https://hhs.texas.gov/reports/2016/08/potentially-preventable-readmissions-texas-medicaid-and-chip-programs-fiscal-year-2013. Accessed February 9, 2018.
6. Oklahoma Healthcare Association. Provider reimbursement notice. https://www.okhca.org/providers.aspx?id=2538. Accessed February 9, 2018.
7. Washington State Hospital Association. Potentially preventable readmission (PPR) adjustments. http://www.wsha.org/articles/hca-implements-potentially-preventable-readmission-ppr-adjustments/. Accessed February 9, 2018.
8. State of Colorado. HQIP 30-day All cause readmission. https://www.colorado.gov/pacific/sites/default/files/2016%20March%20HQIP%2030-day%20all-cause%20readmission%20measure.pdf. Accessed February 9, 2018.
9. Maryland Health Services Cost Review Commission. Readmission reduction incentive program. http://www.hscrc.state.md.us/Pages/init-readm-rip.aspx. Accessed February 9, 2018.
10. Doupnik SK, Lawlor J, Zima BT, et al. Mental health conditions and unplanned hospital readmissions in children. J Hosp Med. 2018(13):445-452. PubMed
11. NRD Overview. https://www.hcup-us.ahrq.gov/nrdoverview.jsp. Accessed February 9, 2018.
12. Singh G, Zhang W, Kuo Y-F, Sharma G. Association of psychological disorders with 30-day readmission rates in patients with COPD. Chest. 2016;149(4):905-915. doi:10.1378/chest.15-0449 PubMed
13. McIntyre LK, Arbabi S, Robinson EF, Maier RV. Analysis of risk factors for patient readmission 30 days following discharge from general surgery. JAMA Surg. 2016;151(9):855-861. doi:10.1001/jamasurg.2016.1258 PubMed
14. Bardach NS, Coker TR, Zima BT, et al. Common and costly hospitalizations for pediatric mental health disorders. Pediatrics. 2014;133(4):602-609. doi:10.1542/peds.2013-3165 PubMed
15. Doupnik SK, Lawlor J, Zima BT, et al. Mental health conditions and medical and surgical hospital utilization. Pediatrics. 2016;138(6): e20162416. doi:10.1542/peds.2016-2416 PubMed
16. Doupnik SK, Mitra N, Feudtner C, Marcus SC. The influence of comorbid mood and anxiety disorders on outcomes of pediatric patients hospitalized for pneumonia. Hosp Pediatr. 2016;6(3):135-142. doi:10.1542/hpeds.2015-0177 PubMed
17. Zima BT, Rodean J, Hall M, Bardach NS, Coker TR, Berry JG. Psychiatric disorders and trends in resource use in pediatric hospitals. Pediatrics. 2016;138(5): e20160909. doi:10.1542/peds.2016-0909 PubMed
18. Feng JY, Toomey SL, Zaslavsky AM, Nakamura MM, Schuster MA. Readmission after pediatric mental health admissions. Pediatrics. 2017;140(6):e20171571. doi:10.1542/peds.2017-1571 PubMed
19. Cohen E, Berry JG, Camacho X, Anderson G, Wodchis W, Guttmann A. Patterns and costs of health care use of children with medical complexity. Pediatrics. 2012;130(6):e1463-e1470. doi:10.1542/peds.2012-0175 PubMed
20. Doupnik SK, Walter JK. Collaboration is key to improving hospital care for patients with medical and psychiatric comorbidity. Hosp Pediatr. 2016;6(12):760-762. doi:10.1542/hpeds.2016-0165 PubMed
21. Richardson LP, Russo JE, Lozano P, McCauley E, Katon W. The effect of comorbid anxiety and depressive disorders on health care utilization and costs among adolescents with asthma. Gen Hosp Psychiatry. 2008;30(5):398-406. doi:10.1016/j.genhosppsych.2008.06.004 PubMed
22. Malik FS, Hall M, Mangione-Smith R, et al. Patient characteristics associated with differences in admission frequency for diabetic ketoacidosis in United States children’s hospitals. J Pediatr. 2016;171:104-110. doi:10.1016/j.jpeds.2015.12.015 PubMed
© 2018 Society of Hospital Medicine
Regional Variation in Standardized Costs of Care at Children’s Hospitals
With some areas of the country spending close to 3 times more on healthcare than others, regional variation in healthcare spending has been the focus of national attention.1-7 Since 1973, the Dartmouth Institute has studied regional variation in healthcare utilization and spending and concluded that variation is “unwarranted” because it is driven by providers’ practice patterns rather than differences in medical need, patient preferences, or evidence-based medicine.8-11 However, critics of the Dartmouth Institute’s findings argue that their approach does not adequately adjust for community-level income, and that higher costs in some areas reflect greater patient needs that are not reflected in illness acuity alone.12-14
While Medicare data have made it possible to study variations in spending for the senior population, fragmentation of insurance coverage and nonstandardized data structures make studying the pediatric population more difficult. However, the Children’s Hospital Association’s (CHA) Pediatric Health Information System (PHIS) has made large-scale comparisons more feasible. To overcome challenges associated with using charges and nonuniform cost data, PHIS-derived standardized costs provide new opportunities for comparisons.15,16 Initial analyses using PHIS data showed significant interhospital variations in costs of care,15 but they did not adjust for differences in populations and assess the drivers of variation. A more recent study that controlled for payer status, comorbidities, and illness severity found that intensive care unit (ICU) utilization varied significantly for children hospitalized for asthma, suggesting that hospital practice patterns drive differences in cost.17
This study uses PHIS data to analyze regional variations in standardized costs of care for 3 conditions for which children are hospitalized. To assess potential drivers of variation, the study investigates the effects of patient-level demographic and illness-severity variables as well as encounter-level variables on costs of care. It also estimates cost savings from reducing variation.
METHODS
Data Source
This retrospective cohort study uses the PHIS database (CHA, Overland Park, KS), which includes 48 freestanding children’s hospitals located in noncompeting markets across the United States and accounts for approximately 20% of pediatric hospitalizations. PHIS includes patient demographics, International Classification of Diseases, 9th Revision (ICD-9) diagnosis and procedure codes, as well as hospital charges. In addition to total charges, PHIS reports imaging, laboratory, pharmacy, and “other” charges. The “other” category aggregates clinical, supply, room, and nursing charges (including facility fees and ancillary staff services).
Inclusion Criteria
Inpatient- and observation-status hospitalizations for asthma, diabetic ketoacidosis (DKA), and acute gastroenteritis (AGE) at 46 PHIS hospitals from October 2014 to September 2015 were included. Two hospitals were excluded because of missing data. Hospitalizations for patients >18 years were excluded.
Hospitalizations were categorized by using All Patient Refined-Diagnosis Related Groups (APR-DRGs) version 24 (3M Health Information Systems, St. Paul, MN)18 based on the ICD-9 diagnosis and procedure codes assigned during the episode of care. Analyses included APR-DRG 141 (asthma), primary diagnosis ICD-9 codes 250.11 and 250.13 (DKA), and APR-DRG 249 (AGE). ICD-9 codes were used for DKA for increased specificity.19 These conditions were chosen to represent 3 clinical scenarios: (1) a diagnosis for which hospitals differ on whether certain aspects of care are provided in the ICU (asthma), (2) a diagnosis that frequently includes care in an ICU (DKA), and (3) a diagnosis that typically does not include ICU care (AGE).19
Study Design
To focus the analysis on variation in resource utilization across hospitals rather than variations in hospital item charges, each billed resource was assigned a standardized cost.15,16 For each clinical transaction code (CTC), the median unit cost was calculated for each hospital. The median of the hospital medians was defined as the standardized unit cost for that CTC.
The primary outcome variable was the total standardized cost for the hospitalization adjusted for patient-level demographic and illness-severity variables. Patient demographic and illness-severity covariates included age, race, gender, ZIP code-based median annual household income (HHI), rural-urban location, distance from home ZIP code to the hospital, chronic condition indicator (CCI), and severity-of-illness (SOI). When assessing drivers of variation, encounter-level covariates were added, including length of stay (LOS) in hours, ICU utilization, and 7-day readmission (an imprecise measure to account for quality of care during the index visit). The contribution of imaging, laboratory, pharmacy, and “other” costs was also considered.
Median annual HHI for patients’ home ZIP code was obtained from 2010 US Census data. Community-level HHI, a proxy for socioeconomic status (SES),20,21 was classified into categories based on the 2015 US federal poverty level (FPL) for a family of 422: HHI-1 = ≤ 1.5 × FPL; HHI-2 = 1.5 to 2 × FPL; HHI-3 = 2 to 3 × FPL; HHI-4 = ≥ 3 × FPL. Rural-urban commuting area (RUCA) codes were used to determine the rural-urban classification of the patient’s home.23 The distance from home ZIP code to the hospital was included as an additional control for illness severity because patients traveling longer distances are often more sick and require more resources.24
The Agency for Healthcare Research and Quality CCI classification system was used to identify the presence of a chronic condition.25 For asthma, CCI was flagged if the patient had a chronic condition other than asthma; for DKA, CCI was flagged if the patient had a chronic condition other than DKA; and for AGE, CCI was flagged if the patient had any chronic condition.
The APR-DRG system provides a 4-level SOI score with each APR-DRG category. Patient factors, such as comorbid diagnoses, are considered in severity scores generated through 3M’s proprietary algorithms.18
For the first analysis, the 46 hospitals were categorized into 7 geographic regions based on 2010 US Census Divisions.26 To overcome small hospital sample sizes, Mountain and Pacific were combined into West, and Middle Atlantic and New England were combined into North East. Because PHIS hospitals are located in noncompeting geographic regions, for the second analysis, we examined hospital-level variation (considering each hospital as its own region).
Data Analysis
To focus the analysis on “typical” patients and produce more robust estimates of central tendencies, the top and bottom 5% of hospitalizations with the most extreme standardized costs by condition were trimmed.27 Standardized costs were log-transformed because of their nonnormal distribution and analyzed by using linear mixed models. Covariates were added stepwise to assess the proportion of the variance explained by each predictor. Post-hoc tests with conservative single-step stepwise mutation model corrections for multiple testing were used to compare adjusted costs. Statistical analyses were performed using SAS version 9.3 (SAS Institute, Cary, NC). P values < 0.05 were considered significant. The Children’s Hospital of Philadelphia Institutional Review Board did not classify this study as human subjects research.
RESULTS
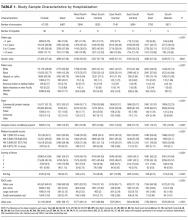

During the study period, there were 26,430 hospitalizations for asthma, 5056 for DKA, and 16,274 for AGE (Table 1).
Variation Across Census Regions
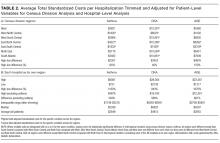
After adjusting for patient-level demographic and illness-severity variables, differences in adjusted total standardized costs remained between regions (P < 0.001). Although no region was an outlier compared to the overall mean for any of the conditions, regions were statistically different in pairwise comparison. The East North Central, South Atlantic, and West South Central regions had the highest adjusted total standardized costs for each of the conditions. The East South Central and West North Central regions had the lowest costs for each of the conditions. Adjusted total standardized costs were 120% higher for asthma ($1920 vs $4227), 46% higher for DKA ($7429 vs $10,881), and 150% higher for AGE ($3316 vs $8292) in the highest-cost region compared with the lowest-cost region (Table 2A).
Variation Within Census Regions

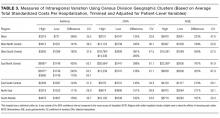
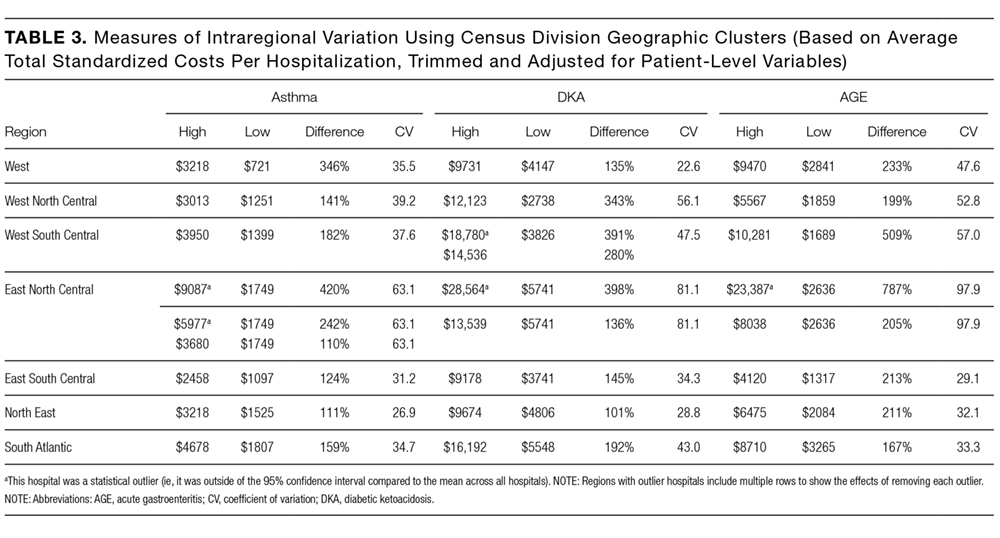
After controlling for patient-level demographic and illness-severity variables, standardized costs were different across hospitals in the same region (P < 0.001; panel A in Figure). This was true for all conditions in each region. Differences between the lowest- and highest-cost hospitals within the same region ranged from 111% to 420% for asthma, 101% to 398% for DKA, and 166% to 787% for AGE (Table 3).
Variation Across Hospitals (Each Hospital as Its Own Region)
One hospital had the highest adjusted standardized costs for all 3 conditions ($9087 for asthma, $28,564 for DKA, and $23,387 for AGE) and was outside of the 95% confidence interval compared with the overall means. The second highest-cost hospitals for asthma ($5977) and AGE ($18,780) were also outside of the 95% confidence interval. After removing these outliers, the difference between the highest- and lowest-cost hospitals was 549% for asthma ($721 vs $4678), 491% for DKA ($2738 vs $16,192), and 681% for AGE ($1317 vs $10,281; Table 2B).
Drivers of Variation Across Census Regions
Patient-level demographic and illness-severity variables explained very little of the variation in standardized costs across regions. For each of the conditions, age, race, gender, community-level HHI, RUCA, and distance from home to the hospital each accounted for <1.5% of variation, while SOI and CCI each accounted for <5%. Overall, patient-level variables explained 5.5%, 3.7%, and 6.7% of variation for asthma, DKA, and AGE.
Encounter-level variables explained a much larger percentage of the variation in costs. LOS accounted for 17.8% of the variation for asthma, 9.8% for DKA, and 8.7% for AGE. ICU utilization explained 6.9% of the variation for asthma and 12.5% for DKA; ICU use was not a major driver for AGE. Seven-day readmissions accounted for <0.5% for each of the conditions. The combination of patient-level and encounter-level variables explained 27%, 24%, and 15% of the variation for asthma, DKA, and AGE.
Drivers of Variation Across Hospitals
For each of the conditions, patient-level demographic variables each accounted for <2% of variation in costs between hospitals. SOI accounted for 4.5% of the variation for asthma and CCI accounted for 5.2% for AGE. Overall, patient-level variables explained 6.9%, 5.3%, and 7.3% of variation for asthma, DKA, and AGE.
Encounter-level variables accounted for a much larger percentage of the variation in cost. LOS explained 25.4% for asthma, 13.3% for DKA, and 14.2% for AGE. ICU utilization accounted for 13.4% for asthma and 21.9% for DKA; ICU use was not a major driver for AGE. Seven-day readmissions accounted for <0.5% for each of the conditions. Together, patient-level and encounter-level variables explained 40%, 36%, and 22% of variation for asthma, DKA, and AGE.
Imaging, Laboratory, Pharmacy, and “Other” Costs
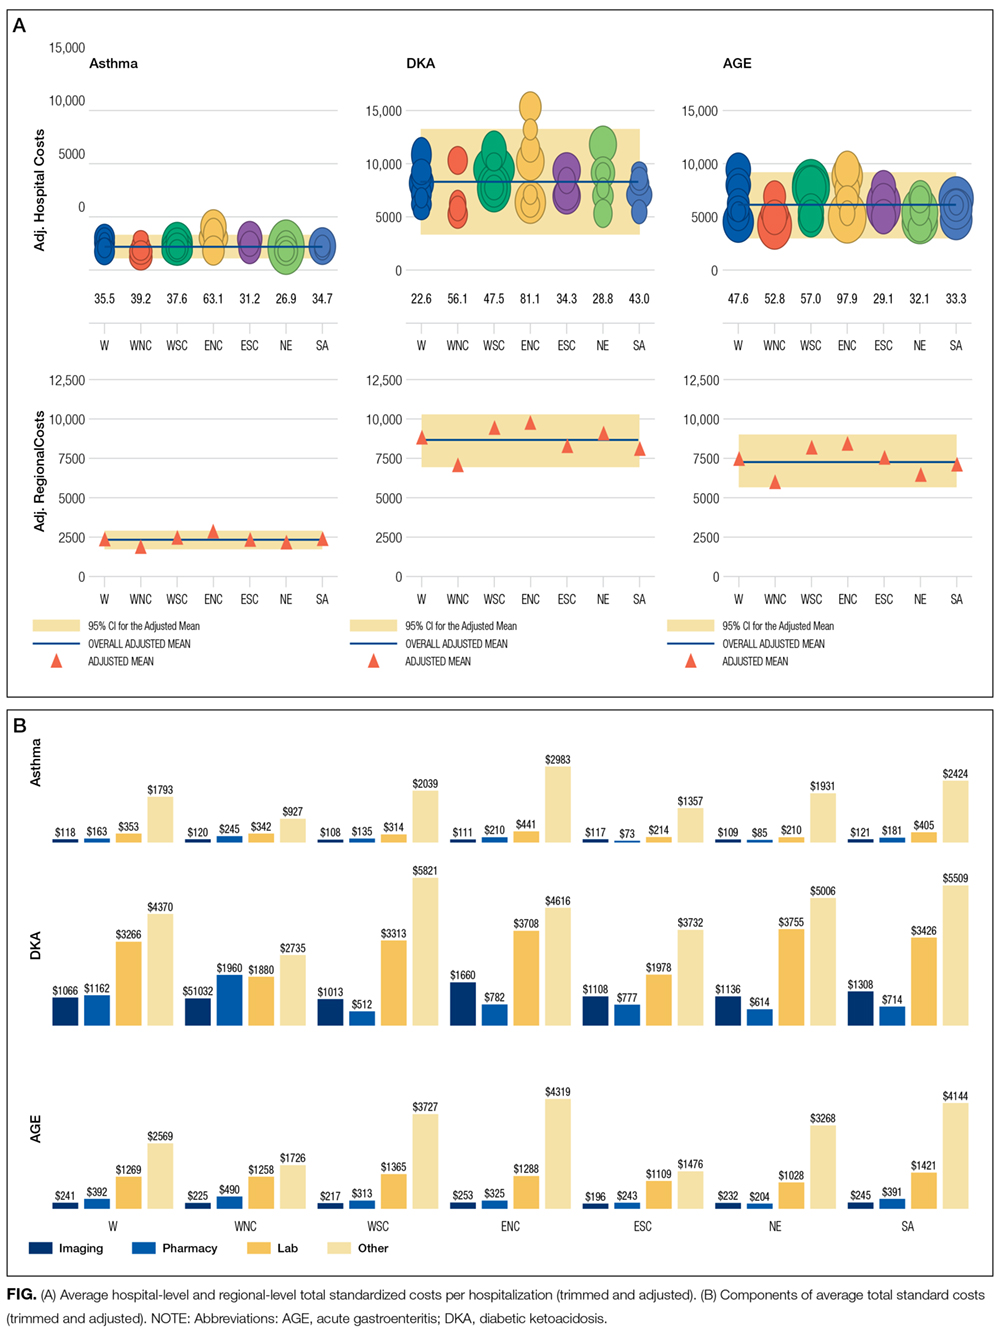
The largest contributor to total costs adjusted for patient-level factors for all conditions was “other,” which aggregates room, nursing, clinical, and supply charges (panel B in Figure). When considering drivers of variation, this category explained >50% for each of the conditions. The next largest contributor to total costs was laboratory charges, which accounted for 15% of the variation across regions for asthma and 11% for DKA. Differences in imaging accounted for 18% of the variation for DKA and 15% for AGE. Differences in pharmacy charges accounted for <4% of the variation for each of the conditions. Adding the 4 cost components to the other patient- and encounter-level covariates, the model explained 81%, 78%, and 72% of the variation across census regions for asthma, DKA, and AGE.
For the hospital-level analysis, differences in “other” remained the largest driver of cost variation. For asthma, “other” explained 61% of variation, while pharmacy, laboratory, and imaging each accounted for <8%. For DKA, differences in imaging accounted for 18% of the variation and laboratory charges accounted for 12%. For AGE, imaging accounted for 15% of the variation. Adding the 4 cost components to the other patient- and encounter-level covariates, the model explained 81%, 72%, and 67% of the variation for asthma, DKA, and AGE.
Cost Savings
If all hospitals in this cohort with adjusted standardized costs above the national PHIS average achieved costs equal to the national PHIS average, estimated annual savings in adjusted standardized costs for these 3 conditions would be $69.1 million. If each hospital with adjusted costs above the average within its census region achieved costs equal to its regional average, estimated annual savings in adjusted standardized costs for these conditions would be $25.2 million.
DISCUSSION
This study reported on the regional variation in costs of care for 3 conditions treated at 46 children’s hospitals across 7 geographic regions, and it demonstrated that variations in costs of care exist in pediatrics. This study used standardized costs to compare utilization patterns across hospitals and adjusted for several patient-level demographic and illness-severity factors, and it found that differences in costs of care for children hospitalized with asthma, DKA, and AGE remained both between and within regions.
These variations are noteworthy, as hospitals strive to improve the value of healthcare. If the higher-cost hospitals in this cohort could achieve costs equal to the national PHIS averages, estimated annual savings in adjusted standardized costs for these conditions alone would equal $69.1 million. If higher-cost hospitals relative to the average in their own region reduced costs to their regional averages, annual standardized cost savings could equal $25.2 million for these conditions.
The differences observed are also significant in that they provide a foundation for exploring whether lower-cost regions or lower-cost hospitals achieve comparable quality outcomes.28 If so, studying what those hospitals do to achieve outcomes more efficiently can serve as the basis for the establishment of best practices.29 Standardizing best practices through protocols, pathways, and care-model redesign can reduce potentially unnecessary spending.30
Our findings showed that patient-level demographic and illness-severity covariates, including community-level HHI and SOI, did not consistently explain cost differences. Instead, LOS and ICU utilization were associated with higher costs.17,19 When considering the effect of the 4 cost components on the variation in total standardized costs between regions and between hospitals, the fact that the “other” category accounted for the largest percent of the variation is not surprising, because the cost of room occupancy and nursing services increases with longer LOS and more time in the ICU. Other individual cost components that were major drivers of variation were laboratory utilization for asthma and imaging for DKA and AGE31 (though they accounted for a much smaller proportion of total adjusted costs).19
To determine if these factors are modifiable, more information is needed to explain why practices differ. Many factors may contribute to varying utilization patterns, including differences in capabilities and resources (in the hospital and in the community) and patient volumes. For example, some hospitals provide continuous albuterol for status asthmaticus only in ICUs, while others provide it on regular units.32 But if certain hospitals do not have adequate resources or volumes to effectively care for certain populations outside of the ICU, their higher-value approach (considering quality and cost) may be to utilize ICU beds, even if some other hospitals care for those patients on non-ICU floors. Another possibility is that family preferences about care delivery (such as how long children stay in the hospital) may vary across regions.33
Other evidence suggests that physician practice and spending patterns are strongly influenced by the practices of the region where they trained.34 Because physicians often practice close to where they trained,35,36 this may partially explain how regional patterns are reinforced.
Even considering all mentioned covariates, our model did not fully explain variation in standardized costs. After adding the cost components as covariates, between one-third and one-fifth of the variation remained unexplained. It is possible that this unexplained variation stemmed from unmeasured patient-level factors.
In addition, while proxies for SES, including community-level HHI, did not significantly predict differences in costs across regions, it is possible that SES affected LOS differently in different regions. Previous studies have suggested that lower SES is associated with longer LOS.37 If this effect is more pronounced in certain regions (potentially because of differences in social service infrastructures), SES may be contributing to variations in cost through LOS.
Our findings were subject to limitations. First, this study only examined 3 diagnoses and did not include surgical or less common conditions. Second, while PHIS includes tertiary care, academic, and freestanding children’s hospitals, it does not include general hospitals, which is where most pediatric patients receive care.38 Third, we used ZIP code-based median annual HHI to account for SES, and we used ZIP codes to determine the distance to the hospital and rural-urban location of patients’ homes. These approximations lack precision because SES and distances vary within ZIP codes.39 Fourth, while adjusted standardized costs allow for comparisons between hospitals, they do not represent actual costs to patients or individual hospitals. Additionally, when determining whether variation remained after controlling for patient-level variables, we included SOI as a reflection of illness-severity at presentation. However, in practice, SOI scores may be assigned partially based on factors determined during the hospitalization.18 Finally, the use of other regional boundaries or the selection of different hospitals may yield different results.
CONCLUSION
This study reveals regional variations in costs of care for 3 inpatient pediatric conditions. Future studies should explore whether lower-cost regions or lower-cost hospitals achieve comparable quality outcomes. To the extent that variation is driven by modifiable factors and lower spending does not compromise outcomes, these data may prompt reviews of care models to reduce unwarranted variation and improve the value of care delivery at local, regional, and national levels.
Disclosure
Internal funds from the CHA and The Children’s Hospital of Philadelphia supported the conduct of this work. The authors have no financial interests, relationships, or affiliations relevant to the subject matter or materials discussed in the manuscript to disclose. The authors have no potential conflicts of interest relevant to the subject matter or materials discussed in the manuscript to disclose
1. Fisher E, Skinner J. Making Sense of Geographic Variations in Health Care: The New IOM Report. 2013; http://healthaffairs.org/blog/2013/07/24/making-sense-of-geographic-variations-in-health-care-the-new-iom-report/. Accessed on April 11, 2014.
With some areas of the country spending close to 3 times more on healthcare than others, regional variation in healthcare spending has been the focus of national attention.1-7 Since 1973, the Dartmouth Institute has studied regional variation in healthcare utilization and spending and concluded that variation is “unwarranted” because it is driven by providers’ practice patterns rather than differences in medical need, patient preferences, or evidence-based medicine.8-11 However, critics of the Dartmouth Institute’s findings argue that their approach does not adequately adjust for community-level income, and that higher costs in some areas reflect greater patient needs that are not reflected in illness acuity alone.12-14
While Medicare data have made it possible to study variations in spending for the senior population, fragmentation of insurance coverage and nonstandardized data structures make studying the pediatric population more difficult. However, the Children’s Hospital Association’s (CHA) Pediatric Health Information System (PHIS) has made large-scale comparisons more feasible. To overcome challenges associated with using charges and nonuniform cost data, PHIS-derived standardized costs provide new opportunities for comparisons.15,16 Initial analyses using PHIS data showed significant interhospital variations in costs of care,15 but they did not adjust for differences in populations and assess the drivers of variation. A more recent study that controlled for payer status, comorbidities, and illness severity found that intensive care unit (ICU) utilization varied significantly for children hospitalized for asthma, suggesting that hospital practice patterns drive differences in cost.17
This study uses PHIS data to analyze regional variations in standardized costs of care for 3 conditions for which children are hospitalized. To assess potential drivers of variation, the study investigates the effects of patient-level demographic and illness-severity variables as well as encounter-level variables on costs of care. It also estimates cost savings from reducing variation.
METHODS
Data Source
This retrospective cohort study uses the PHIS database (CHA, Overland Park, KS), which includes 48 freestanding children’s hospitals located in noncompeting markets across the United States and accounts for approximately 20% of pediatric hospitalizations. PHIS includes patient demographics, International Classification of Diseases, 9th Revision (ICD-9) diagnosis and procedure codes, as well as hospital charges. In addition to total charges, PHIS reports imaging, laboratory, pharmacy, and “other” charges. The “other” category aggregates clinical, supply, room, and nursing charges (including facility fees and ancillary staff services).
Inclusion Criteria
Inpatient- and observation-status hospitalizations for asthma, diabetic ketoacidosis (DKA), and acute gastroenteritis (AGE) at 46 PHIS hospitals from October 2014 to September 2015 were included. Two hospitals were excluded because of missing data. Hospitalizations for patients >18 years were excluded.
Hospitalizations were categorized by using All Patient Refined-Diagnosis Related Groups (APR-DRGs) version 24 (3M Health Information Systems, St. Paul, MN)18 based on the ICD-9 diagnosis and procedure codes assigned during the episode of care. Analyses included APR-DRG 141 (asthma), primary diagnosis ICD-9 codes 250.11 and 250.13 (DKA), and APR-DRG 249 (AGE). ICD-9 codes were used for DKA for increased specificity.19 These conditions were chosen to represent 3 clinical scenarios: (1) a diagnosis for which hospitals differ on whether certain aspects of care are provided in the ICU (asthma), (2) a diagnosis that frequently includes care in an ICU (DKA), and (3) a diagnosis that typically does not include ICU care (AGE).19
Study Design
To focus the analysis on variation in resource utilization across hospitals rather than variations in hospital item charges, each billed resource was assigned a standardized cost.15,16 For each clinical transaction code (CTC), the median unit cost was calculated for each hospital. The median of the hospital medians was defined as the standardized unit cost for that CTC.
The primary outcome variable was the total standardized cost for the hospitalization adjusted for patient-level demographic and illness-severity variables. Patient demographic and illness-severity covariates included age, race, gender, ZIP code-based median annual household income (HHI), rural-urban location, distance from home ZIP code to the hospital, chronic condition indicator (CCI), and severity-of-illness (SOI). When assessing drivers of variation, encounter-level covariates were added, including length of stay (LOS) in hours, ICU utilization, and 7-day readmission (an imprecise measure to account for quality of care during the index visit). The contribution of imaging, laboratory, pharmacy, and “other” costs was also considered.
Median annual HHI for patients’ home ZIP code was obtained from 2010 US Census data. Community-level HHI, a proxy for socioeconomic status (SES),20,21 was classified into categories based on the 2015 US federal poverty level (FPL) for a family of 422: HHI-1 = ≤ 1.5 × FPL; HHI-2 = 1.5 to 2 × FPL; HHI-3 = 2 to 3 × FPL; HHI-4 = ≥ 3 × FPL. Rural-urban commuting area (RUCA) codes were used to determine the rural-urban classification of the patient’s home.23 The distance from home ZIP code to the hospital was included as an additional control for illness severity because patients traveling longer distances are often more sick and require more resources.24
The Agency for Healthcare Research and Quality CCI classification system was used to identify the presence of a chronic condition.25 For asthma, CCI was flagged if the patient had a chronic condition other than asthma; for DKA, CCI was flagged if the patient had a chronic condition other than DKA; and for AGE, CCI was flagged if the patient had any chronic condition.
The APR-DRG system provides a 4-level SOI score with each APR-DRG category. Patient factors, such as comorbid diagnoses, are considered in severity scores generated through 3M’s proprietary algorithms.18
For the first analysis, the 46 hospitals were categorized into 7 geographic regions based on 2010 US Census Divisions.26 To overcome small hospital sample sizes, Mountain and Pacific were combined into West, and Middle Atlantic and New England were combined into North East. Because PHIS hospitals are located in noncompeting geographic regions, for the second analysis, we examined hospital-level variation (considering each hospital as its own region).
Data Analysis
To focus the analysis on “typical” patients and produce more robust estimates of central tendencies, the top and bottom 5% of hospitalizations with the most extreme standardized costs by condition were trimmed.27 Standardized costs were log-transformed because of their nonnormal distribution and analyzed by using linear mixed models. Covariates were added stepwise to assess the proportion of the variance explained by each predictor. Post-hoc tests with conservative single-step stepwise mutation model corrections for multiple testing were used to compare adjusted costs. Statistical analyses were performed using SAS version 9.3 (SAS Institute, Cary, NC). P values < 0.05 were considered significant. The Children’s Hospital of Philadelphia Institutional Review Board did not classify this study as human subjects research.
RESULTS
During the study period, there were 26,430 hospitalizations for asthma, 5056 for DKA, and 16,274 for AGE (Table 1).
Variation Across Census Regions
After adjusting for patient-level demographic and illness-severity variables, differences in adjusted total standardized costs remained between regions (P < 0.001). Although no region was an outlier compared to the overall mean for any of the conditions, regions were statistically different in pairwise comparison. The East North Central, South Atlantic, and West South Central regions had the highest adjusted total standardized costs for each of the conditions. The East South Central and West North Central regions had the lowest costs for each of the conditions. Adjusted total standardized costs were 120% higher for asthma ($1920 vs $4227), 46% higher for DKA ($7429 vs $10,881), and 150% higher for AGE ($3316 vs $8292) in the highest-cost region compared with the lowest-cost region (Table 2A).
Variation Within Census Regions
After controlling for patient-level demographic and illness-severity variables, standardized costs were different across hospitals in the same region (P < 0.001; panel A in Figure). This was true for all conditions in each region. Differences between the lowest- and highest-cost hospitals within the same region ranged from 111% to 420% for asthma, 101% to 398% for DKA, and 166% to 787% for AGE (Table 3).
Variation Across Hospitals (Each Hospital as Its Own Region)
One hospital had the highest adjusted standardized costs for all 3 conditions ($9087 for asthma, $28,564 for DKA, and $23,387 for AGE) and was outside of the 95% confidence interval compared with the overall means. The second highest-cost hospitals for asthma ($5977) and AGE ($18,780) were also outside of the 95% confidence interval. After removing these outliers, the difference between the highest- and lowest-cost hospitals was 549% for asthma ($721 vs $4678), 491% for DKA ($2738 vs $16,192), and 681% for AGE ($1317 vs $10,281; Table 2B).
Drivers of Variation Across Census Regions
Patient-level demographic and illness-severity variables explained very little of the variation in standardized costs across regions. For each of the conditions, age, race, gender, community-level HHI, RUCA, and distance from home to the hospital each accounted for <1.5% of variation, while SOI and CCI each accounted for <5%. Overall, patient-level variables explained 5.5%, 3.7%, and 6.7% of variation for asthma, DKA, and AGE.
Encounter-level variables explained a much larger percentage of the variation in costs. LOS accounted for 17.8% of the variation for asthma, 9.8% for DKA, and 8.7% for AGE. ICU utilization explained 6.9% of the variation for asthma and 12.5% for DKA; ICU use was not a major driver for AGE. Seven-day readmissions accounted for <0.5% for each of the conditions. The combination of patient-level and encounter-level variables explained 27%, 24%, and 15% of the variation for asthma, DKA, and AGE.
Drivers of Variation Across Hospitals
For each of the conditions, patient-level demographic variables each accounted for <2% of variation in costs between hospitals. SOI accounted for 4.5% of the variation for asthma and CCI accounted for 5.2% for AGE. Overall, patient-level variables explained 6.9%, 5.3%, and 7.3% of variation for asthma, DKA, and AGE.
Encounter-level variables accounted for a much larger percentage of the variation in cost. LOS explained 25.4% for asthma, 13.3% for DKA, and 14.2% for AGE. ICU utilization accounted for 13.4% for asthma and 21.9% for DKA; ICU use was not a major driver for AGE. Seven-day readmissions accounted for <0.5% for each of the conditions. Together, patient-level and encounter-level variables explained 40%, 36%, and 22% of variation for asthma, DKA, and AGE.
Imaging, Laboratory, Pharmacy, and “Other” Costs
The largest contributor to total costs adjusted for patient-level factors for all conditions was “other,” which aggregates room, nursing, clinical, and supply charges (panel B in Figure). When considering drivers of variation, this category explained >50% for each of the conditions. The next largest contributor to total costs was laboratory charges, which accounted for 15% of the variation across regions for asthma and 11% for DKA. Differences in imaging accounted for 18% of the variation for DKA and 15% for AGE. Differences in pharmacy charges accounted for <4% of the variation for each of the conditions. Adding the 4 cost components to the other patient- and encounter-level covariates, the model explained 81%, 78%, and 72% of the variation across census regions for asthma, DKA, and AGE.
For the hospital-level analysis, differences in “other” remained the largest driver of cost variation. For asthma, “other” explained 61% of variation, while pharmacy, laboratory, and imaging each accounted for <8%. For DKA, differences in imaging accounted for 18% of the variation and laboratory charges accounted for 12%. For AGE, imaging accounted for 15% of the variation. Adding the 4 cost components to the other patient- and encounter-level covariates, the model explained 81%, 72%, and 67% of the variation for asthma, DKA, and AGE.
Cost Savings
If all hospitals in this cohort with adjusted standardized costs above the national PHIS average achieved costs equal to the national PHIS average, estimated annual savings in adjusted standardized costs for these 3 conditions would be $69.1 million. If each hospital with adjusted costs above the average within its census region achieved costs equal to its regional average, estimated annual savings in adjusted standardized costs for these conditions would be $25.2 million.
DISCUSSION
This study reported on the regional variation in costs of care for 3 conditions treated at 46 children’s hospitals across 7 geographic regions, and it demonstrated that variations in costs of care exist in pediatrics. This study used standardized costs to compare utilization patterns across hospitals and adjusted for several patient-level demographic and illness-severity factors, and it found that differences in costs of care for children hospitalized with asthma, DKA, and AGE remained both between and within regions.
These variations are noteworthy, as hospitals strive to improve the value of healthcare. If the higher-cost hospitals in this cohort could achieve costs equal to the national PHIS averages, estimated annual savings in adjusted standardized costs for these conditions alone would equal $69.1 million. If higher-cost hospitals relative to the average in their own region reduced costs to their regional averages, annual standardized cost savings could equal $25.2 million for these conditions.
The differences observed are also significant in that they provide a foundation for exploring whether lower-cost regions or lower-cost hospitals achieve comparable quality outcomes.28 If so, studying what those hospitals do to achieve outcomes more efficiently can serve as the basis for the establishment of best practices.29 Standardizing best practices through protocols, pathways, and care-model redesign can reduce potentially unnecessary spending.30
Our findings showed that patient-level demographic and illness-severity covariates, including community-level HHI and SOI, did not consistently explain cost differences. Instead, LOS and ICU utilization were associated with higher costs.17,19 When considering the effect of the 4 cost components on the variation in total standardized costs between regions and between hospitals, the fact that the “other” category accounted for the largest percent of the variation is not surprising, because the cost of room occupancy and nursing services increases with longer LOS and more time in the ICU. Other individual cost components that were major drivers of variation were laboratory utilization for asthma and imaging for DKA and AGE31 (though they accounted for a much smaller proportion of total adjusted costs).19
To determine if these factors are modifiable, more information is needed to explain why practices differ. Many factors may contribute to varying utilization patterns, including differences in capabilities and resources (in the hospital and in the community) and patient volumes. For example, some hospitals provide continuous albuterol for status asthmaticus only in ICUs, while others provide it on regular units.32 But if certain hospitals do not have adequate resources or volumes to effectively care for certain populations outside of the ICU, their higher-value approach (considering quality and cost) may be to utilize ICU beds, even if some other hospitals care for those patients on non-ICU floors. Another possibility is that family preferences about care delivery (such as how long children stay in the hospital) may vary across regions.33
Other evidence suggests that physician practice and spending patterns are strongly influenced by the practices of the region where they trained.34 Because physicians often practice close to where they trained,35,36 this may partially explain how regional patterns are reinforced.
Even considering all mentioned covariates, our model did not fully explain variation in standardized costs. After adding the cost components as covariates, between one-third and one-fifth of the variation remained unexplained. It is possible that this unexplained variation stemmed from unmeasured patient-level factors.
In addition, while proxies for SES, including community-level HHI, did not significantly predict differences in costs across regions, it is possible that SES affected LOS differently in different regions. Previous studies have suggested that lower SES is associated with longer LOS.37 If this effect is more pronounced in certain regions (potentially because of differences in social service infrastructures), SES may be contributing to variations in cost through LOS.
Our findings were subject to limitations. First, this study only examined 3 diagnoses and did not include surgical or less common conditions. Second, while PHIS includes tertiary care, academic, and freestanding children’s hospitals, it does not include general hospitals, which is where most pediatric patients receive care.38 Third, we used ZIP code-based median annual HHI to account for SES, and we used ZIP codes to determine the distance to the hospital and rural-urban location of patients’ homes. These approximations lack precision because SES and distances vary within ZIP codes.39 Fourth, while adjusted standardized costs allow for comparisons between hospitals, they do not represent actual costs to patients or individual hospitals. Additionally, when determining whether variation remained after controlling for patient-level variables, we included SOI as a reflection of illness-severity at presentation. However, in practice, SOI scores may be assigned partially based on factors determined during the hospitalization.18 Finally, the use of other regional boundaries or the selection of different hospitals may yield different results.
CONCLUSION
This study reveals regional variations in costs of care for 3 inpatient pediatric conditions. Future studies should explore whether lower-cost regions or lower-cost hospitals achieve comparable quality outcomes. To the extent that variation is driven by modifiable factors and lower spending does not compromise outcomes, these data may prompt reviews of care models to reduce unwarranted variation and improve the value of care delivery at local, regional, and national levels.
Disclosure
Internal funds from the CHA and The Children’s Hospital of Philadelphia supported the conduct of this work. The authors have no financial interests, relationships, or affiliations relevant to the subject matter or materials discussed in the manuscript to disclose. The authors have no potential conflicts of interest relevant to the subject matter or materials discussed in the manuscript to disclose
1. Fisher E, Skinner J. Making Sense of Geographic Variations in Health Care: The New IOM Report. 2013; http://healthaffairs.org/blog/2013/07/24/making-sense-of-geographic-variations-in-health-care-the-new-iom-report/. Accessed on April 11, 2014.
1. Fisher E, Skinner J. Making Sense of Geographic Variations in Health Care: The New IOM Report. 2013; http://healthaffairs.org/blog/2013/07/24/making-sense-of-geographic-variations-in-health-care-the-new-iom-report/. Accessed on April 11, 2014.
© 2017 Society of Hospital Medicine
Definition of a Children's Hospital
When I was a resident, one common warning delivered to us by our putatively omniscient attendings was, Well you know, most children are not hospitalized at children's hospitals. This caution was likely meant to warn us future pediatricians that the supports and access to pediatric subspecialists we took for granted in a children's hospital would be different once we graduated and left for community settings. However, it is doubtful that any resident ever challenged the validity of that statement. Are most children hospitalized at general hospitals and is the availability of subspecialty services different between general and children's hospitals?
In this issue of the Journal of Hospital Medicine, Leyenaar et al.[1] set out to test that warning and to quantify where children in the United States are hospitalized. They investigated differences in the pediatric hospitalizations at general and freestanding children's hospitals. In doing so, their findings began to implicitly explore what is meant by the term children's hospital. The authors utilized the Agency for Healthcare Quality and Research's (AHQR) 2012 Kids Inpatient Database (KID), which after excluding in‐hospital births and pregnancy‐related admissions, captured nearly 4000 hospitals and 1.4 million acute care pediatric admissions across the United States.
Leyenaar et al. found that our attendings were correct, confirming a prior study on the subject[2]; close to three‐quarters of discharges were from general hospitals. However, although the most frequent reasons for hospitalization were similar between the 2 types of hospitals, that is where the similarities ended. They found that although the median annual number of discharges at the 50 freestanding children's hospitals was 12,000, it was only 56 at the nearly 4000 general hospitals. Approximately 80% of general hospitals (the equivalent of nearly 3000 hospitals) accounted for only 11% of all discharges and had less than 375 annual pediatric discharges, essentially 1 discharge per day or fewer. In addition, over one‐third of discharges at freestanding children's hospitals were for children with medical complexity, compared to 1 in 5 at general hospitals. Furthermore, one‐quarter of discharges at freestanding children's hospitals were of high or highest severity, compared with half that amount at general hospitals.
Although it is not possible to determine the quality of care from the KID, the authors insightfully discuss the implications these differences have on quality improvement and quality measurement. General hospitals with low volumes of pediatric inpatients may have difficulty providing condition‐specific quality metrics or implementing condition‐specific quality improvement processes. How can you compare quality across hospitals averaging only 56 pediatric admissions a year? If existing quality metrics are not meaningful for those hospitals, but the majority of children are admitted to them, the development of new, more useful, quality metrics is needed.
Perhaps the most interesting finding resulted from a new and unfortunate limitation in the KID database. Beginning in 2012, the AHQR began deidentifying all hospitals contributing data to the KID, leaving researchers reliant on KID's categorization of hospitals as either freestanding children's hospitals or general hospitals. The authors attempted to work around these limitations to identify those children's hospitals that were not freestanding but were located within general hospitals. They found that 36 general hospitals had patient volumes equivalent to freestanding children's hospitals, whereas 20 freestanding children's hospitals had very infrequent admissions for the most common discharge diagnoses. The authors are almost certainly correct in deeming the latter 20 hospitals to be subspecialty children's hospitals, such as those focused solely on orthopedic or oncologic conditions. Among the 36 high‐volume general hospitals, the authors found that patient complexity and severity was more similar to freestanding children's hospitals than to the low‐volume general hospitals. Length of stay (and therefore presumably costs as well) for high‐volume general hospitals was positioned between freestanding children's hospitals and low‐volume general hospitals.
Who are those high‐volume hospitals that appear to be general in name only? Because of KID's deidentification of hospitals, we do not know. It is possible that those hospitals self‐identify as being children's hospitals, but are not freestanding, meaning that they are located within a general hospital (hospitals within a hospital). If they are children's hospitals within general hospitals, it would provide a different perspective to the study's overall finding that 71% of hospitalizations, 64% of hospital days, and 50% of costs occur at general hospitals. As the authors allude to, some institutions may not call themselves freestanding children's hospitals but function that way; other institutions call themselves freestanding children's hospitals but offer very focused specialty services. Through this limitation in the KID database, the authors began the process of identifying hospitals that look like freestanding children's hospitals but are not called that. In other words, they began creating a more robust functional definition of which institutions are truly children's hospitals. Volume does not, of course, always equate into specialization, and much work needs to be done measuring the availability of subspecialty and critical care services before any functional definition of children's hospital can be made; the potential, however, is intriguing.
Does it matter which hospitals are deemed children's hospitals? Although a hospitalist may not place importance on the name over the hospital's entrance, the Centers for Medicare and Medicaid Services (CMS) and state insurance regulators may find the difference extremely important. CMS and state insurance regulators are increasingly focusing their attention on the adequacy of pediatric insurance networks.[3, 4, 5, 6] They are seeking to create rules that ensure health insurance plans have a broad range of pediatric subspecialists in close proximity to the great majority of children insured by the plan. For adult insurance, the adequacy of a plan's network is typically defined by the time and distance from a patient's home to a specialist. However, unlike in adult medicine, pediatric subspecialty care is becoming increasingly regionalized at academic medical centers, especially children's hospitals. Furthermore, unlike adult care, a wide range of pediatric subspecialists is unlikely to be found at the hospital closest to a patient's home. Therefore, time and distance rules for ensuring network adequacy may fail within pediatric care. Instead, inclusion of a hospital designatedby functional or other criteriaas a children's hospital may be the best way to ensure the adequate provision of pediatric specialty care within a network.
How policymakers define pediatric network adequacy will have important implications for ensuring that pediatric inpatient medicine achieves the goal of the right patient, the right place, the right time. Therefore, the attending from our residency may have been correct that most children are not hospitalized at children's hospitals. However, depending on how pediatric network adequacy rules are developed, that may not have to mean that these children (and their pediatricians) will be out there alone.
Disclosure
Nothing to report.
- , , , , , . Epidemiology of pediatric hospitalizations at general hospitals and freestanding children's hospitals in the United States. J Hosp Med. 2016;11(11):743–749.
- , , , et al. Hospitalizations of low‐income children and children with severe health conditions: implications of the Patient Protection and Affordable Care Act. JAMA Pediatr. 2016;170(2):176–178.
- . Provider networks: comparison of child‐focused network adequacy standards between CHIP and private health plans. United States Government Accountability Office Report to the Ranking Member, Committee on Finance, United States Senate. Available at: http://www.gao.gov/assets/680/674999.pdf. Published February 2016. Accessed May 10, 2016.
- Medicaid and CHIP Payment and Access Commission. March 2015 Report to Congress on Medicaid and CHIP. Available at: https://www.macpac.gov/wp‐content/uploads/2015/03/March‐2015‐Report‐to‐Congress‐on‐Medicaid‐and‐CHIP.pdf. Published March 2015. Accessed May 10, 2016.
- . Insurance carriers and access to healthcare providers: network adequacy. National Conference of State Legislatures website. Available at: www.ncsl.org/research/health/insurance‐carriers‐and‐access‐to‐healthcare‐providers‐network‐adequacy.aspx. Published November 13, 2015. Accessed April 4, 2016.
- , , , et al. Ensuring consumers' access to care: network adequacy state insurance survey findings and recommendations for regulatory reforms in a changing insurance market. Available at: http://www.naic.org/documents/committees_conliaison_network_adequacy_report.pdf. Published November 2014. Accessed May 10, 2016.
When I was a resident, one common warning delivered to us by our putatively omniscient attendings was, Well you know, most children are not hospitalized at children's hospitals. This caution was likely meant to warn us future pediatricians that the supports and access to pediatric subspecialists we took for granted in a children's hospital would be different once we graduated and left for community settings. However, it is doubtful that any resident ever challenged the validity of that statement. Are most children hospitalized at general hospitals and is the availability of subspecialty services different between general and children's hospitals?
In this issue of the Journal of Hospital Medicine, Leyenaar et al.[1] set out to test that warning and to quantify where children in the United States are hospitalized. They investigated differences in the pediatric hospitalizations at general and freestanding children's hospitals. In doing so, their findings began to implicitly explore what is meant by the term children's hospital. The authors utilized the Agency for Healthcare Quality and Research's (AHQR) 2012 Kids Inpatient Database (KID), which after excluding in‐hospital births and pregnancy‐related admissions, captured nearly 4000 hospitals and 1.4 million acute care pediatric admissions across the United States.
Leyenaar et al. found that our attendings were correct, confirming a prior study on the subject[2]; close to three‐quarters of discharges were from general hospitals. However, although the most frequent reasons for hospitalization were similar between the 2 types of hospitals, that is where the similarities ended. They found that although the median annual number of discharges at the 50 freestanding children's hospitals was 12,000, it was only 56 at the nearly 4000 general hospitals. Approximately 80% of general hospitals (the equivalent of nearly 3000 hospitals) accounted for only 11% of all discharges and had less than 375 annual pediatric discharges, essentially 1 discharge per day or fewer. In addition, over one‐third of discharges at freestanding children's hospitals were for children with medical complexity, compared to 1 in 5 at general hospitals. Furthermore, one‐quarter of discharges at freestanding children's hospitals were of high or highest severity, compared with half that amount at general hospitals.
Although it is not possible to determine the quality of care from the KID, the authors insightfully discuss the implications these differences have on quality improvement and quality measurement. General hospitals with low volumes of pediatric inpatients may have difficulty providing condition‐specific quality metrics or implementing condition‐specific quality improvement processes. How can you compare quality across hospitals averaging only 56 pediatric admissions a year? If existing quality metrics are not meaningful for those hospitals, but the majority of children are admitted to them, the development of new, more useful, quality metrics is needed.
Perhaps the most interesting finding resulted from a new and unfortunate limitation in the KID database. Beginning in 2012, the AHQR began deidentifying all hospitals contributing data to the KID, leaving researchers reliant on KID's categorization of hospitals as either freestanding children's hospitals or general hospitals. The authors attempted to work around these limitations to identify those children's hospitals that were not freestanding but were located within general hospitals. They found that 36 general hospitals had patient volumes equivalent to freestanding children's hospitals, whereas 20 freestanding children's hospitals had very infrequent admissions for the most common discharge diagnoses. The authors are almost certainly correct in deeming the latter 20 hospitals to be subspecialty children's hospitals, such as those focused solely on orthopedic or oncologic conditions. Among the 36 high‐volume general hospitals, the authors found that patient complexity and severity was more similar to freestanding children's hospitals than to the low‐volume general hospitals. Length of stay (and therefore presumably costs as well) for high‐volume general hospitals was positioned between freestanding children's hospitals and low‐volume general hospitals.
Who are those high‐volume hospitals that appear to be general in name only? Because of KID's deidentification of hospitals, we do not know. It is possible that those hospitals self‐identify as being children's hospitals, but are not freestanding, meaning that they are located within a general hospital (hospitals within a hospital). If they are children's hospitals within general hospitals, it would provide a different perspective to the study's overall finding that 71% of hospitalizations, 64% of hospital days, and 50% of costs occur at general hospitals. As the authors allude to, some institutions may not call themselves freestanding children's hospitals but function that way; other institutions call themselves freestanding children's hospitals but offer very focused specialty services. Through this limitation in the KID database, the authors began the process of identifying hospitals that look like freestanding children's hospitals but are not called that. In other words, they began creating a more robust functional definition of which institutions are truly children's hospitals. Volume does not, of course, always equate into specialization, and much work needs to be done measuring the availability of subspecialty and critical care services before any functional definition of children's hospital can be made; the potential, however, is intriguing.
Does it matter which hospitals are deemed children's hospitals? Although a hospitalist may not place importance on the name over the hospital's entrance, the Centers for Medicare and Medicaid Services (CMS) and state insurance regulators may find the difference extremely important. CMS and state insurance regulators are increasingly focusing their attention on the adequacy of pediatric insurance networks.[3, 4, 5, 6] They are seeking to create rules that ensure health insurance plans have a broad range of pediatric subspecialists in close proximity to the great majority of children insured by the plan. For adult insurance, the adequacy of a plan's network is typically defined by the time and distance from a patient's home to a specialist. However, unlike in adult medicine, pediatric subspecialty care is becoming increasingly regionalized at academic medical centers, especially children's hospitals. Furthermore, unlike adult care, a wide range of pediatric subspecialists is unlikely to be found at the hospital closest to a patient's home. Therefore, time and distance rules for ensuring network adequacy may fail within pediatric care. Instead, inclusion of a hospital designatedby functional or other criteriaas a children's hospital may be the best way to ensure the adequate provision of pediatric specialty care within a network.
How policymakers define pediatric network adequacy will have important implications for ensuring that pediatric inpatient medicine achieves the goal of the right patient, the right place, the right time. Therefore, the attending from our residency may have been correct that most children are not hospitalized at children's hospitals. However, depending on how pediatric network adequacy rules are developed, that may not have to mean that these children (and their pediatricians) will be out there alone.
Disclosure
Nothing to report.
- , , , , , . Epidemiology of pediatric hospitalizations at general hospitals and freestanding children's hospitals in the United States. J Hosp Med. 2016;11(11):743–749.
- , , , et al. Hospitalizations of low‐income children and children with severe health conditions: implications of the Patient Protection and Affordable Care Act. JAMA Pediatr. 2016;170(2):176–178.
- . Provider networks: comparison of child‐focused network adequacy standards between CHIP and private health plans. United States Government Accountability Office Report to the Ranking Member, Committee on Finance, United States Senate. Available at: http://www.gao.gov/assets/680/674999.pdf. Published February 2016. Accessed May 10, 2016.
- Medicaid and CHIP Payment and Access Commission. March 2015 Report to Congress on Medicaid and CHIP. Available at: https://www.macpac.gov/wp‐content/uploads/2015/03/March‐2015‐Report‐to‐Congress‐on‐Medicaid‐and‐CHIP.pdf. Published March 2015. Accessed May 10, 2016.
- . Insurance carriers and access to healthcare providers: network adequacy. National Conference of State Legislatures website. Available at: www.ncsl.org/research/health/insurance‐carriers‐and‐access‐to‐healthcare‐providers‐network‐adequacy.aspx. Published November 13, 2015. Accessed April 4, 2016.
- , , , et al. Ensuring consumers' access to care: network adequacy state insurance survey findings and recommendations for regulatory reforms in a changing insurance market. Available at: http://www.naic.org/documents/committees_conliaison_network_adequacy_report.pdf. Published November 2014. Accessed May 10, 2016.
In‐Hospital Asthma Resource Utilization
Pediatric hospitalizations for obesity‐related conditions have doubled in the last decade, mirroring the trend of higher levels of childhood obesity in the United States.[1, 2, 3] Recent studies have demonstrated worsened pediatric in‐hospital outcomes, including mortality and increased resource utilization, for children with obesity across a range of diagnoses.[4, 5, 6, 7, 8, 9, 10] Although the mechanisms driving the association between obesity and in‐hospital outcomes are not fully known, for asthma it is believed that adipocytes expressing inflammatory markers create a low level of systemic inflammation, thereby increasing the severity of allergic‐type illnesses and decreasing the response to anti‐inflammatory medications, such as steroids.[11, 12, 13, 14, 15, 16, 17, 18] The relationship of obesity and in‐hospital asthma outcomes is of particular interest because status asthmaticus is the most common reason for admission in children aged 3 to 12 years, accounting for approximately 150,000 admissions (7.4% of all hospitalizations for children and adolescents) and $835 million in hospital costs annually.[19]
Few prior studies have examined the association of obesity and asthma outcomes in the in‐hospital setting. The studies examining this association have found patients with obesity to have a longer hospital length of stay (LOS) and increased hospital costs.[8, 9, 20] Obesity has also been associated with increased respiratory treatments and supplemental oxygen requirements.[20] Associations between obesity and admission rates from the emergency department (ED) for pediatric asthma have been inconsistent.[21, 22] Most of these prior studies had several limitations in identifying patients with obesity, including using weight‐for‐age percentiles or International Classification of Diseases, Ninth Revision (ICD‐9) codes, rather than body mass index (BMI) percentile for age, the currently recommended method.[23, 24, 25] Methods other than BMI have the potential to either underestimate obesity (ie, ICD‐9 codes)[26] or to confound weight with adiposity (ie, weight‐for‐age percentiles),[27] thereby skewing the primary exposure of interest.
In the present study, we sought to examine associations between obesity and in‐hospital outcomes for pediatric status asthmaticus using the currently endorsed method for identifying obesity in children, BMI percentile for age.[23, 24, 25] The outcomes of interest included a broad range of in‐hospital measures, including resource utilization (medication and radiology use), readmission rates, billed charges, and LOS. We hypothesize that obesity, due to its proinflammatory state, would result in increased LOS, increased resource utilization, and an increased readmission rate for children admitted with status asthmaticus.
METHODS
Data Sources
Data for this retrospective cross‐sectional study were obtained from 2 sources. First, we queried the Pediatric Health Information System (PHIS) administrative database, which draws information from multiple children's hospitals to identify patients at our 2 institutions of interest who met study criteria. The PHIS database also was used to collect patient demographic data. PHIS is an administrative database operated by Children's Hospital Association (Overland Park, KS) containing clinical and billing data from 43 tertiary care, freestanding children's hospitals, including data on 41 ICD‐9 diagnoses, billed charges, and LOS. Based on the primary diagnosis, PHIS assigns each discharge to an All Patient Refined‐Diagnosis Related Group (APR‐DRG v.24) (3M Health information Systems, St. Paul, MN). APR‐DRGs allow similar diagnoses to be grouped together.[28, 29] PHIS also uses ICD‐9 codes to identify patients with a complex chronic condition (CCC).[30, 31] CCCs are those conditions that can be reasonably expected to last at least 12 months (unless death intervenes) and to involve either several different organ systems or one system severely enough to require specialty pediatric care and probably some period of hospitalization in a tertiary care center.[30, 31] PHIS data quality is ensured through a collaborative effort of the participating hospitals, the Children's Hospital Association, and Truven Healthcare.
Second, standardized chart reviews were then performed to collect clinical data not found in PHIS: BMI, LOS in hours, and medications administered, including total number of albuterol treatments administered during both the admission and the associated preceding ED visit.
Study Setting and Participants
All admissions examined in this study were at Children's Mercy Hospitals. Children's Mercy Hospitals includes 2 separate hospitals: 1 hospital is a 354‐bed academic, tertiary care freestanding children's hospital located in Kansas City, Missouri; a second, smaller, 50‐bed freestanding hospital is located in Overland Park, Kansas. Both hospitals have pediatric emergency departments. Inclusion criteria included patients aged 5 to 17 years discharged for status asthmaticus (APR‐DRG 141) at Children's Mercy Hospital from October 1, 2011 to September 30, 2012, with a recorded BMI during the admission or within 30 days of the admission. Patients between the ages of 2 and 5 years old were not included because of the incidence of viral‐induced wheezing in this age group and therefore possible miscoding of the asthma diagnosis. Exclusion criteria included a concurrent diagnosis of a CCC or bacterial pneumonia because these conditions could alter LOS, resource utilization, and readmission rates independent of the subject's status asthmaticus. In addition, to account for differences in the amount of treatment given in the pre‐inpatient setting, patients not initially treated through the hospital's ED were excluded. For patients with multiple admissions during the study period for the same diagnosis, only the index admission was examined. The institutional review board at Children's Mercy Hospital approved this study with waiver of informed consent.
Study Definitions
BMI percentile for age was used as both a continuous and categorical predictor variable. As a categorical variable it was divided into 4 categories: underweight (BMI <5%), normal weight (BMI 5%84%), overweight (BMI 85%94%), and obese (BMI 95%).[23] Race was categorized non‐Hispanic white, non‐Hispanic black, and other. Other included Asian, Pacific Islander, American Indian, and other. Ethnicity was categorized as Hispanic and non‐Hispanic. Insurance categories included private (commercial or TRICARE), public (Medicaid and Title V), and other (uninsured, self‐pay, and other). Adjusted billed charges were calculated for each hospitalization. Adjusted billed charges are the billed charges adjusted by the US Centers of Medicare and Medicaid Services' price/wage index for the study site's location.[32, 33]
To compare albuterol of different delivery methods, albuterol equivalents were calculated. Based upon prior research demonstrating equal efficacy between albuterol administered by nebulizer and metered‐dose inhaler (MDI),[34] every 2.5 mg of albuterol administered by nebulizer was treated as equivalent to 2 sprays of albuterol (90 g/spray) administered by MDI. Therefore, albuterol 2.5 mg nebulized and 2 sprays of albuterol (90 g/spray) were each defined as 1 albuterol equivalent. To compare continuous administration of nebulized albuterol with intermittent administration of albuterol, the total milligrams of continuously nebulized albuterol were examined. Per protocol at the study site, 10 mg per hour of continuous albuterol are administered for patients 5 years and younger and, for children 6 years and older, 15 mg per hour of continuous albuterol are administered. Based upon milligrams of albuterol nebulized, 5‐year‐old subjects receiving an hour of continuous albuterol would equal 4 albuterol equivalents (or 4 treatments of nebulized albuterol 2.5 mg/treatment or 4 treatments of albuterol 90 g/spray 2 sprays/treatment); for patients 6 years and older, an hour of continuous albuterol would equal 6 albuterol equivalents (or 6 treatments of nebulized albuterol 2.5 mg/treatment or 6 treatments of albuterol 90 g/spray 2 sprays/treatment). The variable total albuterol was then created to include albuterol equivalents delivered by metered dose inhaler and as both single and continuous nebulized treatments.
Main Exposure
The main exposure of interest was BMI percentile for age.
Outcome Measures
The main outcome measure was inpatient LOS measured in hours. Secondary outcome measures included the total albuterol (in the inpatient setting as well as combined inpatient and ED settings) and the administration of intravenous IV fluids and intramuscular (IM) or IV systemic steroids. Other secondary measures included readmission for status asthmaticus during the study period, adjusted billed charges, and inpatient chest radiograph utilization.
Statistical Analyses
We summarized categorical variables with frequencies and percentages, and used [2] test across BMI categories. The non‐normal distribution of continuous dependent variables (LOS, number of albuterol treatments, billed charges) were summarized with medians and interquartile ranges (IQRs). Kruskal‐Wallis test was used to examine outcomes across BMI categories. For regression models, BMI percentile for age was divided into deciles and treated as a continuous predictor. Factors used in the regression models included age, gender, race, ethnicity, and insurance. Total albuterol received in the ED was also included in the model to adjust for differences in the amount of treatment received prior to admission. Incidence rate ratios were created using Poisson regression for continuous outcomes (LOS, billed charges, and number of albuterol equivalent treatments administered), and odds ratios were created using logistic regression for dichotomous outcomes. All statistical analyses were performed using IBM SPSS Statistics version 20 (IBM, Armonk, NY), and P values <0.05 were considered statistically significant.
RESULTS
Patient Characteristics
Of 788 patients admitted for status asthmaticus during the study period, 518 (65.7%) met inclusion criteria; 42 (5.3%) did not meet inclusion criteria due to lack of a documented BMI (Table 1). Most patients were normal weight (59.7%). Approximately one‐third (36.7%) were either overweight or obese. The median age was 8 years, with patients with obesity being significantly older than underweight patients (9 vs 7.5 years, P<0.001). The majority of patients were black/African American (56.9%) and non‐Hispanic (88.6%). The percentage of patients who were obese was higher in patients of other race (29.3%) than whites (20.2%) or blacks (16.3%) (P<0.05). Patients of Hispanic ethnicity had a higher rate of obesity compared to non‐Hispanic patients (37.3% vs 17.4%, P<0.01). There were no differences in BMI categories for insurance.
| Patient Characteristics | Total | Category of Body Mass Index Percentile for Age | ||||
|---|---|---|---|---|---|---|
| Underweight | Normal | Overweight | Obese | P* | ||
| ||||||
| Total patients, n (%) | 518 | 18 (3.5) | 310 (59.8) | 88 (17.0) | 102 (19.7) | |
| Age, y, median (IQR) | 8 (611) | 7.5 (5.89) | 8 (610) | 8 (610) | 9 (712) | <0.001 |
| Gender, n (%) | ||||||
| Male | 309 | 12 (3.9) | 184 (59.5) | 46 (14.9) | 67 (21.7) | 0.27 |
| Female | 209 | 6 (2.9) | 126 (60.3) | 42 (20.1) | 35 (16.7) | |
| Race, n (%) | ||||||
| Non‐Hispanic white | 124 | 8 (6.5) | 76 (61.3) | 15 (12.1) | 25 (20.2) | 0.021 |
| Non‐Hispanic black | 295 | 7 (2.4) | 182 (61.7) | 58 (19.7) | 48 (16.3) | |
| Other | 99 | 3 (3.0) | 52 (52.5) | 15 (15.2) | 29 (29.3) | |
| Ethnicity, n (%) | ||||||
| Hispanic | 59 | 1 (1.7) | 25 (42.4) | 11 (18.6) | 22 (37.3) | 0.002 |
| Non‐Hispanic | 459 | 17 (3.7) | 285 (62.1) | 77 (16.8) | 80 (17.4) | |
| Insurance, n (%) | ||||||
| Private | 163 | 10 (6.1) | 97 (59.5) | 28 (17.2) | 28 (17.2) | 0.48 |
| Public | 313 | 7 (2.2) | 190 (60.7) | 51 (16.3) | 65 (20.8) | |
| Other | 42 | 1 (2.4) | 23 (54.8) | 9 (21.4) | 9 (21.4) | |
LOS and Resource Utilization
The median LOS for all patients was approximately 1 day (Table 2). The median number of albuterol treatments in the inpatient setting was 14 (IQR, 824). When albuterol treatments given in the ED were included, the median number of treatments increased to 38 (IQR, 2848). Approximately one‐half of patients required supplemental oxygen, one‐third received IV fluids, and one‐fifth received either IV or IM steroids (with all but 1.6% of the remaining patients receiving oral steroids). Less than 5% of the study population received magnesium sulfate, epinephrine, required intensive care unit (ICU) admission, or were readmitted for status asthmaticus within 30 days. Approximately 15% of patients received a chest radiograph. The median adjusted billed charge was approximately $7,000. There were no differences in any of these outcomes by BMI category (P>0.05).
| Total | Body Mass Index Category | ||||
|---|---|---|---|---|---|
| Underweight | Normal | Overweight | Obese | ||
| |||||
| Total Patients, n (%) | 518 | 18 (3.5) | 310 (59.8) | 88 (17.0) | 102 (19.7) |
| LOS, h, median (IQR) | 26 (1841) | 41 (19.560.5) | 26 (1841) | 26 (19.2540) | 31 (1942) |
| Inpatient albuterol equivalents, median (IQR) | 14(824) | 19 (9.528) | 14 (824) | 14 (8.522) | 16 (824) |
| Total albuterol equivalents, median (IQR) | 38 (2848) | 34 (2734) | 36 (2848) | 37 (2849.5) | 40 (3052) |
| Adjusted billed charges, $, median (IQR) | 6,999.5 (52929258) | 7,457 (56048536) | 6876 (52379390) | 7056 (54099061) | 7198 (53319306) |
| All readmits, n (%) | 44 (8.5) | 2 (11.1) | 29 (9.4) | 7 (8.0) | 6 (5.9) |
| Readmits within 30 days, n (%) | 11 (2.1) | 1 (5.6) | 7 (2.3) | 1 (1.1) | 2 (2.0) |
| ICU admissions, n (%) | 24 (4.6) | 0 (0) | 13 (4.2) | 7 (8.0) | 4 (3.9) |
| Chest radiograph, n (%) | 64 (12.4) | 5 (27.8) | 34 (11.0) | 12 (13.6) | 13 (12.7) |
| Oxygen, n (%) | 255 (49.2) | 11 (61.1) | 157 (50.6) | 42 (47.7) | 45 (44.1) |
| IV/IM steroid, n (%) | 93 (18.0) | 2 (11.1) | 53 (17.1) | 18 (20.5) | 20 (19.6) |
| Epinephrine, n (%) | 2 (0.4) | 0 (0) | 2 (0.6) | 0 (0) | 0 (0) |
| Magnesium, n (%) | 15 (2.9) | 0 (0) | 8 (2.6) | 3 (3.4) | 4 (3.9) |
| IV fluids, n (%) | 152 (29.3) | 4 (22.2) | 85 (27.4) | 31 (35.2) | 32 (31.4) |
Multivariable Results
After adjusting for age, gender, race, ethnicity, and insurance, the decile of BMI percentile for age showed a small negative association with LOS. Specifically, for each decile increase for BMI percentile for age, LOS decreased by approximately 2%. BMI percentile for age was not associated with other measures of resource utilization including total albuterol use, adjusted billed charges, readmission, ICU care, receipt of supplemental oxygen or a chest radiograph, IV fluids, or other medications (IV/IM steroids, epinephrine, or magnesium sulfate).
DISCUSSION
Our study suggests that the decile of BMI percentile for age is inversely associated with LOS but did not have a clinically meaningful effect. Secondary measures, such as total albuterol needs and adjusted billed charges, did not show an association with BMI percentile for age. There were also no associations between BMI percentile for age and other resource utilization outcomes.
Our findings differ from previous studies examining in‐hospital status asthmaticus in children who are overweight or obese. In addition, the present study was able to adjust for therapies received prior to admission. Carroll et al. demonstrated an increased LOS of approximately 3 days for overweight or obese asthmatics admitted to the ICU with status asthmaticus as well as increased duration of supplemental oxygen, continuous albuterol, and intravenous steroids.[20] It is possible that differences in methodology (ie, weight‐for‐age percentile vs BMI percentile for age, inclusion of ED treatments), different thresholds for treatment of status asthmaticus outside the ICU, or differences in patient populations studied (ie, only ICU patients vs all in‐hospital patients) explain the difference between their findings and the present study. The present study's use of BMI percentile for age follows current recommendations for classifying a patient as obese or overweight.[23, 24, 25] However, the use of classifications other than BMI percentile for age would tend to bias toward the null hypothesis, whereas in Carroll's study children who were overweight or obese had increased resource utilization. Additionally, in the time frame between this publication and the current study, many hospitals worked to standardize asthma hospitalizations by creating weaning protocols for albuterol, thereby decreasing LOS for all asthmatics, which may also affect the differences in LOS between groups of obese and nonobese patients.[35]
Woolford et al. found approximately a one‐half‐day increase in LOS and $2,000 higher mean charges for patients admitted with status asthmaticus and a secondary diagnosis of obesity.[8, 9] Study location and differing methods for defining obesity may account for the discrepancy between Woolford's findings and our study. We examined children admitted to the inpatient floor of a tertiary care children's hospital compared to Woolford et al.'s examination of pediatric patients admitted to all hospitals via the Kids' Inpatient Database (Healthcare Cost and Utilization Project, Agency for Healthcare Research and Quality). That study also relied on the coding of obesity as an ICD‐9 diagnosis, rather than examining the BMI of all admitted patients. Previous research has demonstrated that relying on a coded diagnosis of obesity is not as sensitive as measurement.[26] By relying on ICD‐9 diagnosis coding, only patients with very high BMIs may be diagnosed with obesity during the admission and therefore only associations between very high BMI and status asthmaticus will be examined.
There are several limitations to our findings. First, our study was limited to a single, tertiary care children's hospital and may not be generalizable to other hospitals. Our hospital standardizes the treatment of inpatient status asthmatics by formation of a respiratory care plan, involving interval scoring of respiratory symptoms and automatic spacing of albuterol treatments. This likely minimizes physician‐to‐physician variation. Second, we included only those patients who were initially treated within the ED associated with the admitting hospital to minimize the effects of timing for treatments prior to admittance. This excluded those patients first cared for by their primary care physician or by an outlying ED. Therefore, our sample may be biased toward a study population less connected to a medical home and therefore possibly poorer asthma control. Third, to utilize the most accurate method to define obesity, we excluded approximately 5% of eligible patients because BMI was unavailable. This may have included children with more severe asthma symptoms, as a height measurement may have been deferred due to their higher acuity. Asthma severity or chronicity would be associated with our outcomes of interest. However, we were unable to collect reliable data on severity or chronicity. Finally, to measure the amount of total albuterol needed by a patient during the ED and inpatient admissions, albuterol treatments delivered by MDI, nebulizer, or continuously were converted into total albuterol. Although based upon total milligram dosing and studies comparing routes of albuterol administration,[34] the validity of this conversion is unknown.
CONCLUSION
Although BMI percentile for age is inversely associated with LOS for in‐hospital pediatric status asthmaticus, the impact of BMI on this outcome likely is not clinically meaningful. Future investigations should examine other elements of BMI and in‐hospital status asthmaticus, such as any associations between BMI and admission rates.
Acknowledgements
The authors offer their appreciation to their research assistant, Amy Lee, for her support and dedication to this project.
Disclosures
Internal funds from Children's Mercy Hospital and Clinics supported the conduct of this work. The authors report no conflicts of interest.
- , , . Incidence of childhood obesity in the United States. N Engl J Med. 2014;370(5):403–411.
- , . Prevalence and trends in obesity and severe obesity among children in the United States, 1999–2012. JAMA Pediatr. 2014;168(6):561–566.
- , , , . Effects of childhood obesity on hospital care and costs, 1999–2005. Health Affairs. 2009;28(4):w751–w760.
- , , , , . Influence of obesity on clinical outcomes in hospitalized children: a systematic review. JAMA Pediatr. 2013;167(5):476–482.
- , . Appendicitis in the obese child. J Pediatr Surg. 2007;42(5):857–861.
- , , , , . Obesity: influence on length of hospital stay for the pediatric burn patient. J Burn Care Res. 2010;31(2):251–256.
- , , , , , . The impact of obesity on severely injured children and adolescents. J Pediatr Surg. 2006;41(1):88–91.
- , , , . Incremental hospital charges associated with obesity as a secondary diagnosis in children. Obesity (Silver Spring). 2007;15(7):1895–1901.
- , , , . Persistent gap of incremental charges for obesity as a secondary diagnosis in common pediatric hospitalizations. J Hosp Med. 2009;4(3):149–156.
- , , , . Resource utilization and expenditures for overweight and obese children. Arch Pediatr Adolesc Med. 2007;161(1):11–14.
- , , , , , . Decreased response to inhaled steroids in overweight and obese asthmatic children. J Allergy Clin Immunol. 2011;127(3):741–749.
- , , , , . Body mass and glucocorticoid response in asthma. Am J Respir Crit Care Med. 2008;178(7):682–687.
- , , , ; National Heart, Lung, and Blood Institute's Asthma Clinical Research Network. Body mass index and phenotype in subjects with mild‐to‐moderate persistent asthma. J Allergy Clin Immunol. 2009;123(6):1328–1334.e1.
- , . Obesity and asthma disease phenotypes. Curr Opin Allergy Clin Immunol. 2012;12(1):76–81.
- , . Obesity and the lung: 4. Obesity and asthma. Thorax. 2008;63(11):1018–1023.
- , , , et al. Body mass index and response to asthma therapy: fluticasone propionate/salmeterol versus montelukast. J Asthma. 2010;47(1):76–82.
- , , , et al. Effect of obesity on clinical presentation and response to treatment in asthma. J Asthma. 2006;43(7):553–558.
- , , , . Asthma and obesity in three‐year‐old urban children: role of sex and home environment. J Pediatr. 2011;159(1):14–20.
- , , , . Care of Children and Adolescents in U.S. Hospitals. Rockville, MD: Agency for Healthcare Research and Quality; 2003. Available at: http://archive.ahrq.gov/data/hcup/factbk4/factbk4.pdf. Accessed February 12, 2014.
- , , , . Childhood obesity increases duration of therapy during severe asthma exacerbations. Pediatr Crit Care Med. 2006;7(6):527–531.
- , , , , . Childhood overweight increases hospital admission rates for asthma. Pediatr. 2007;120(4):734–740.
- , , , . Body mass index and acute asthma severity among children presenting to the emergency department. Pediatr Allergy Immunol. 2009;21(3):480–488.
- Centers for Disease Control and Prevention. Basics about childhood obesity. Available at: http://www.cdc.gov/obesity/childhood/basics.html. Accessed February 12, 2014.
- . Screening and interventions for childhood overweight: a summary of evidence for the US Preventive Services Task Force. Pediatrics. 2005;116(1):e125–e144.
- ; Expert Committee. Expert committee recommendations regarding the prevention, assessment, and treatment of child and adolescent overweight and obesity: summary report. Pediatrics. 2007;120(suppl 4):S164–S192.
- , , , . Comparison of ICD code‐based diagnosis of obesity with measured obesity in children and the implications for health care cost estimates. BMC Med Res Methodol. 2011;11(1):173.
- , ; American Academy of Pediatrics Committee on Nutrition. Prevention of pediatric overweight and obesity. Pediatrics. 2003;112(2):424–430.
- . Development of the 3M all patient‐refined diagnosis‐related groups (APR DRGs). Available at: http//www.ahrq.gov/legacy/qual/mortality/Hughes3.htm. Accessed March 1, 2014.
- . 3M Health Information Systems (HIS) APR‐DRG classification software: overview. Available at: http://www.ahrq.gov/legacy/qual/mortality/Hughessumm.htm. Accessed March 1, 2014.
- , , , , . Shifting place of death among children with complex chronic conditions in the United States, 1989–2003. JAMA. 2007;297(24):2725–2732.
- , , . Pediatric deaths attributable to complex chronic conditions: a population‐based study of Washington State, 1980–1997. Pediatrics. 2000;106(1 pt 2):205–209.
- , , , et al. Comparative effectiveness of pleural drainage procedures for the treatment of complicated pneumonia in childhood. J Hosp Med. 2011;6(5):256–263.
- , , , , , . Adjunct corticosteroids in children hospitalized with community‐acquired pneumonia. Pediatrics. 2011;127(2):e255–e263.
- , , . Holding chambers (spacers) versus nebulisers for beta‐agonist treatment of acute asthma. Cochrane Database Syst Rev. 2013;9:CD000052.
- , , , . Effectiveness of a clinical pathway for inpatient asthma management. Pediatrics. 2000;106(5):1006–1012.
Pediatric hospitalizations for obesity‐related conditions have doubled in the last decade, mirroring the trend of higher levels of childhood obesity in the United States.[1, 2, 3] Recent studies have demonstrated worsened pediatric in‐hospital outcomes, including mortality and increased resource utilization, for children with obesity across a range of diagnoses.[4, 5, 6, 7, 8, 9, 10] Although the mechanisms driving the association between obesity and in‐hospital outcomes are not fully known, for asthma it is believed that adipocytes expressing inflammatory markers create a low level of systemic inflammation, thereby increasing the severity of allergic‐type illnesses and decreasing the response to anti‐inflammatory medications, such as steroids.[11, 12, 13, 14, 15, 16, 17, 18] The relationship of obesity and in‐hospital asthma outcomes is of particular interest because status asthmaticus is the most common reason for admission in children aged 3 to 12 years, accounting for approximately 150,000 admissions (7.4% of all hospitalizations for children and adolescents) and $835 million in hospital costs annually.[19]
Few prior studies have examined the association of obesity and asthma outcomes in the in‐hospital setting. The studies examining this association have found patients with obesity to have a longer hospital length of stay (LOS) and increased hospital costs.[8, 9, 20] Obesity has also been associated with increased respiratory treatments and supplemental oxygen requirements.[20] Associations between obesity and admission rates from the emergency department (ED) for pediatric asthma have been inconsistent.[21, 22] Most of these prior studies had several limitations in identifying patients with obesity, including using weight‐for‐age percentiles or International Classification of Diseases, Ninth Revision (ICD‐9) codes, rather than body mass index (BMI) percentile for age, the currently recommended method.[23, 24, 25] Methods other than BMI have the potential to either underestimate obesity (ie, ICD‐9 codes)[26] or to confound weight with adiposity (ie, weight‐for‐age percentiles),[27] thereby skewing the primary exposure of interest.
In the present study, we sought to examine associations between obesity and in‐hospital outcomes for pediatric status asthmaticus using the currently endorsed method for identifying obesity in children, BMI percentile for age.[23, 24, 25] The outcomes of interest included a broad range of in‐hospital measures, including resource utilization (medication and radiology use), readmission rates, billed charges, and LOS. We hypothesize that obesity, due to its proinflammatory state, would result in increased LOS, increased resource utilization, and an increased readmission rate for children admitted with status asthmaticus.
METHODS
Data Sources
Data for this retrospective cross‐sectional study were obtained from 2 sources. First, we queried the Pediatric Health Information System (PHIS) administrative database, which draws information from multiple children's hospitals to identify patients at our 2 institutions of interest who met study criteria. The PHIS database also was used to collect patient demographic data. PHIS is an administrative database operated by Children's Hospital Association (Overland Park, KS) containing clinical and billing data from 43 tertiary care, freestanding children's hospitals, including data on 41 ICD‐9 diagnoses, billed charges, and LOS. Based on the primary diagnosis, PHIS assigns each discharge to an All Patient Refined‐Diagnosis Related Group (APR‐DRG v.24) (3M Health information Systems, St. Paul, MN). APR‐DRGs allow similar diagnoses to be grouped together.[28, 29] PHIS also uses ICD‐9 codes to identify patients with a complex chronic condition (CCC).[30, 31] CCCs are those conditions that can be reasonably expected to last at least 12 months (unless death intervenes) and to involve either several different organ systems or one system severely enough to require specialty pediatric care and probably some period of hospitalization in a tertiary care center.[30, 31] PHIS data quality is ensured through a collaborative effort of the participating hospitals, the Children's Hospital Association, and Truven Healthcare.
Second, standardized chart reviews were then performed to collect clinical data not found in PHIS: BMI, LOS in hours, and medications administered, including total number of albuterol treatments administered during both the admission and the associated preceding ED visit.
Study Setting and Participants
All admissions examined in this study were at Children's Mercy Hospitals. Children's Mercy Hospitals includes 2 separate hospitals: 1 hospital is a 354‐bed academic, tertiary care freestanding children's hospital located in Kansas City, Missouri; a second, smaller, 50‐bed freestanding hospital is located in Overland Park, Kansas. Both hospitals have pediatric emergency departments. Inclusion criteria included patients aged 5 to 17 years discharged for status asthmaticus (APR‐DRG 141) at Children's Mercy Hospital from October 1, 2011 to September 30, 2012, with a recorded BMI during the admission or within 30 days of the admission. Patients between the ages of 2 and 5 years old were not included because of the incidence of viral‐induced wheezing in this age group and therefore possible miscoding of the asthma diagnosis. Exclusion criteria included a concurrent diagnosis of a CCC or bacterial pneumonia because these conditions could alter LOS, resource utilization, and readmission rates independent of the subject's status asthmaticus. In addition, to account for differences in the amount of treatment given in the pre‐inpatient setting, patients not initially treated through the hospital's ED were excluded. For patients with multiple admissions during the study period for the same diagnosis, only the index admission was examined. The institutional review board at Children's Mercy Hospital approved this study with waiver of informed consent.
Study Definitions
BMI percentile for age was used as both a continuous and categorical predictor variable. As a categorical variable it was divided into 4 categories: underweight (BMI <5%), normal weight (BMI 5%84%), overweight (BMI 85%94%), and obese (BMI 95%).[23] Race was categorized non‐Hispanic white, non‐Hispanic black, and other. Other included Asian, Pacific Islander, American Indian, and other. Ethnicity was categorized as Hispanic and non‐Hispanic. Insurance categories included private (commercial or TRICARE), public (Medicaid and Title V), and other (uninsured, self‐pay, and other). Adjusted billed charges were calculated for each hospitalization. Adjusted billed charges are the billed charges adjusted by the US Centers of Medicare and Medicaid Services' price/wage index for the study site's location.[32, 33]
To compare albuterol of different delivery methods, albuterol equivalents were calculated. Based upon prior research demonstrating equal efficacy between albuterol administered by nebulizer and metered‐dose inhaler (MDI),[34] every 2.5 mg of albuterol administered by nebulizer was treated as equivalent to 2 sprays of albuterol (90 g/spray) administered by MDI. Therefore, albuterol 2.5 mg nebulized and 2 sprays of albuterol (90 g/spray) were each defined as 1 albuterol equivalent. To compare continuous administration of nebulized albuterol with intermittent administration of albuterol, the total milligrams of continuously nebulized albuterol were examined. Per protocol at the study site, 10 mg per hour of continuous albuterol are administered for patients 5 years and younger and, for children 6 years and older, 15 mg per hour of continuous albuterol are administered. Based upon milligrams of albuterol nebulized, 5‐year‐old subjects receiving an hour of continuous albuterol would equal 4 albuterol equivalents (or 4 treatments of nebulized albuterol 2.5 mg/treatment or 4 treatments of albuterol 90 g/spray 2 sprays/treatment); for patients 6 years and older, an hour of continuous albuterol would equal 6 albuterol equivalents (or 6 treatments of nebulized albuterol 2.5 mg/treatment or 6 treatments of albuterol 90 g/spray 2 sprays/treatment). The variable total albuterol was then created to include albuterol equivalents delivered by metered dose inhaler and as both single and continuous nebulized treatments.
Main Exposure
The main exposure of interest was BMI percentile for age.
Outcome Measures
The main outcome measure was inpatient LOS measured in hours. Secondary outcome measures included the total albuterol (in the inpatient setting as well as combined inpatient and ED settings) and the administration of intravenous IV fluids and intramuscular (IM) or IV systemic steroids. Other secondary measures included readmission for status asthmaticus during the study period, adjusted billed charges, and inpatient chest radiograph utilization.
Statistical Analyses
We summarized categorical variables with frequencies and percentages, and used [2] test across BMI categories. The non‐normal distribution of continuous dependent variables (LOS, number of albuterol treatments, billed charges) were summarized with medians and interquartile ranges (IQRs). Kruskal‐Wallis test was used to examine outcomes across BMI categories. For regression models, BMI percentile for age was divided into deciles and treated as a continuous predictor. Factors used in the regression models included age, gender, race, ethnicity, and insurance. Total albuterol received in the ED was also included in the model to adjust for differences in the amount of treatment received prior to admission. Incidence rate ratios were created using Poisson regression for continuous outcomes (LOS, billed charges, and number of albuterol equivalent treatments administered), and odds ratios were created using logistic regression for dichotomous outcomes. All statistical analyses were performed using IBM SPSS Statistics version 20 (IBM, Armonk, NY), and P values <0.05 were considered statistically significant.
RESULTS
Patient Characteristics
Of 788 patients admitted for status asthmaticus during the study period, 518 (65.7%) met inclusion criteria; 42 (5.3%) did not meet inclusion criteria due to lack of a documented BMI (Table 1). Most patients were normal weight (59.7%). Approximately one‐third (36.7%) were either overweight or obese. The median age was 8 years, with patients with obesity being significantly older than underweight patients (9 vs 7.5 years, P<0.001). The majority of patients were black/African American (56.9%) and non‐Hispanic (88.6%). The percentage of patients who were obese was higher in patients of other race (29.3%) than whites (20.2%) or blacks (16.3%) (P<0.05). Patients of Hispanic ethnicity had a higher rate of obesity compared to non‐Hispanic patients (37.3% vs 17.4%, P<0.01). There were no differences in BMI categories for insurance.
| Patient Characteristics | Total | Category of Body Mass Index Percentile for Age | ||||
|---|---|---|---|---|---|---|
| Underweight | Normal | Overweight | Obese | P* | ||
| ||||||
| Total patients, n (%) | 518 | 18 (3.5) | 310 (59.8) | 88 (17.0) | 102 (19.7) | |
| Age, y, median (IQR) | 8 (611) | 7.5 (5.89) | 8 (610) | 8 (610) | 9 (712) | <0.001 |
| Gender, n (%) | ||||||
| Male | 309 | 12 (3.9) | 184 (59.5) | 46 (14.9) | 67 (21.7) | 0.27 |
| Female | 209 | 6 (2.9) | 126 (60.3) | 42 (20.1) | 35 (16.7) | |
| Race, n (%) | ||||||
| Non‐Hispanic white | 124 | 8 (6.5) | 76 (61.3) | 15 (12.1) | 25 (20.2) | 0.021 |
| Non‐Hispanic black | 295 | 7 (2.4) | 182 (61.7) | 58 (19.7) | 48 (16.3) | |
| Other | 99 | 3 (3.0) | 52 (52.5) | 15 (15.2) | 29 (29.3) | |
| Ethnicity, n (%) | ||||||
| Hispanic | 59 | 1 (1.7) | 25 (42.4) | 11 (18.6) | 22 (37.3) | 0.002 |
| Non‐Hispanic | 459 | 17 (3.7) | 285 (62.1) | 77 (16.8) | 80 (17.4) | |
| Insurance, n (%) | ||||||
| Private | 163 | 10 (6.1) | 97 (59.5) | 28 (17.2) | 28 (17.2) | 0.48 |
| Public | 313 | 7 (2.2) | 190 (60.7) | 51 (16.3) | 65 (20.8) | |
| Other | 42 | 1 (2.4) | 23 (54.8) | 9 (21.4) | 9 (21.4) | |
LOS and Resource Utilization
The median LOS for all patients was approximately 1 day (Table 2). The median number of albuterol treatments in the inpatient setting was 14 (IQR, 824). When albuterol treatments given in the ED were included, the median number of treatments increased to 38 (IQR, 2848). Approximately one‐half of patients required supplemental oxygen, one‐third received IV fluids, and one‐fifth received either IV or IM steroids (with all but 1.6% of the remaining patients receiving oral steroids). Less than 5% of the study population received magnesium sulfate, epinephrine, required intensive care unit (ICU) admission, or were readmitted for status asthmaticus within 30 days. Approximately 15% of patients received a chest radiograph. The median adjusted billed charge was approximately $7,000. There were no differences in any of these outcomes by BMI category (P>0.05).
| Total | Body Mass Index Category | ||||
|---|---|---|---|---|---|
| Underweight | Normal | Overweight | Obese | ||
| |||||
| Total Patients, n (%) | 518 | 18 (3.5) | 310 (59.8) | 88 (17.0) | 102 (19.7) |
| LOS, h, median (IQR) | 26 (1841) | 41 (19.560.5) | 26 (1841) | 26 (19.2540) | 31 (1942) |
| Inpatient albuterol equivalents, median (IQR) | 14(824) | 19 (9.528) | 14 (824) | 14 (8.522) | 16 (824) |
| Total albuterol equivalents, median (IQR) | 38 (2848) | 34 (2734) | 36 (2848) | 37 (2849.5) | 40 (3052) |
| Adjusted billed charges, $, median (IQR) | 6,999.5 (52929258) | 7,457 (56048536) | 6876 (52379390) | 7056 (54099061) | 7198 (53319306) |
| All readmits, n (%) | 44 (8.5) | 2 (11.1) | 29 (9.4) | 7 (8.0) | 6 (5.9) |
| Readmits within 30 days, n (%) | 11 (2.1) | 1 (5.6) | 7 (2.3) | 1 (1.1) | 2 (2.0) |
| ICU admissions, n (%) | 24 (4.6) | 0 (0) | 13 (4.2) | 7 (8.0) | 4 (3.9) |
| Chest radiograph, n (%) | 64 (12.4) | 5 (27.8) | 34 (11.0) | 12 (13.6) | 13 (12.7) |
| Oxygen, n (%) | 255 (49.2) | 11 (61.1) | 157 (50.6) | 42 (47.7) | 45 (44.1) |
| IV/IM steroid, n (%) | 93 (18.0) | 2 (11.1) | 53 (17.1) | 18 (20.5) | 20 (19.6) |
| Epinephrine, n (%) | 2 (0.4) | 0 (0) | 2 (0.6) | 0 (0) | 0 (0) |
| Magnesium, n (%) | 15 (2.9) | 0 (0) | 8 (2.6) | 3 (3.4) | 4 (3.9) |
| IV fluids, n (%) | 152 (29.3) | 4 (22.2) | 85 (27.4) | 31 (35.2) | 32 (31.4) |
Multivariable Results
After adjusting for age, gender, race, ethnicity, and insurance, the decile of BMI percentile for age showed a small negative association with LOS. Specifically, for each decile increase for BMI percentile for age, LOS decreased by approximately 2%. BMI percentile for age was not associated with other measures of resource utilization including total albuterol use, adjusted billed charges, readmission, ICU care, receipt of supplemental oxygen or a chest radiograph, IV fluids, or other medications (IV/IM steroids, epinephrine, or magnesium sulfate).
DISCUSSION
Our study suggests that the decile of BMI percentile for age is inversely associated with LOS but did not have a clinically meaningful effect. Secondary measures, such as total albuterol needs and adjusted billed charges, did not show an association with BMI percentile for age. There were also no associations between BMI percentile for age and other resource utilization outcomes.
Our findings differ from previous studies examining in‐hospital status asthmaticus in children who are overweight or obese. In addition, the present study was able to adjust for therapies received prior to admission. Carroll et al. demonstrated an increased LOS of approximately 3 days for overweight or obese asthmatics admitted to the ICU with status asthmaticus as well as increased duration of supplemental oxygen, continuous albuterol, and intravenous steroids.[20] It is possible that differences in methodology (ie, weight‐for‐age percentile vs BMI percentile for age, inclusion of ED treatments), different thresholds for treatment of status asthmaticus outside the ICU, or differences in patient populations studied (ie, only ICU patients vs all in‐hospital patients) explain the difference between their findings and the present study. The present study's use of BMI percentile for age follows current recommendations for classifying a patient as obese or overweight.[23, 24, 25] However, the use of classifications other than BMI percentile for age would tend to bias toward the null hypothesis, whereas in Carroll's study children who were overweight or obese had increased resource utilization. Additionally, in the time frame between this publication and the current study, many hospitals worked to standardize asthma hospitalizations by creating weaning protocols for albuterol, thereby decreasing LOS for all asthmatics, which may also affect the differences in LOS between groups of obese and nonobese patients.[35]
Woolford et al. found approximately a one‐half‐day increase in LOS and $2,000 higher mean charges for patients admitted with status asthmaticus and a secondary diagnosis of obesity.[8, 9] Study location and differing methods for defining obesity may account for the discrepancy between Woolford's findings and our study. We examined children admitted to the inpatient floor of a tertiary care children's hospital compared to Woolford et al.'s examination of pediatric patients admitted to all hospitals via the Kids' Inpatient Database (Healthcare Cost and Utilization Project, Agency for Healthcare Research and Quality). That study also relied on the coding of obesity as an ICD‐9 diagnosis, rather than examining the BMI of all admitted patients. Previous research has demonstrated that relying on a coded diagnosis of obesity is not as sensitive as measurement.[26] By relying on ICD‐9 diagnosis coding, only patients with very high BMIs may be diagnosed with obesity during the admission and therefore only associations between very high BMI and status asthmaticus will be examined.
There are several limitations to our findings. First, our study was limited to a single, tertiary care children's hospital and may not be generalizable to other hospitals. Our hospital standardizes the treatment of inpatient status asthmatics by formation of a respiratory care plan, involving interval scoring of respiratory symptoms and automatic spacing of albuterol treatments. This likely minimizes physician‐to‐physician variation. Second, we included only those patients who were initially treated within the ED associated with the admitting hospital to minimize the effects of timing for treatments prior to admittance. This excluded those patients first cared for by their primary care physician or by an outlying ED. Therefore, our sample may be biased toward a study population less connected to a medical home and therefore possibly poorer asthma control. Third, to utilize the most accurate method to define obesity, we excluded approximately 5% of eligible patients because BMI was unavailable. This may have included children with more severe asthma symptoms, as a height measurement may have been deferred due to their higher acuity. Asthma severity or chronicity would be associated with our outcomes of interest. However, we were unable to collect reliable data on severity or chronicity. Finally, to measure the amount of total albuterol needed by a patient during the ED and inpatient admissions, albuterol treatments delivered by MDI, nebulizer, or continuously were converted into total albuterol. Although based upon total milligram dosing and studies comparing routes of albuterol administration,[34] the validity of this conversion is unknown.
CONCLUSION
Although BMI percentile for age is inversely associated with LOS for in‐hospital pediatric status asthmaticus, the impact of BMI on this outcome likely is not clinically meaningful. Future investigations should examine other elements of BMI and in‐hospital status asthmaticus, such as any associations between BMI and admission rates.
Acknowledgements
The authors offer their appreciation to their research assistant, Amy Lee, for her support and dedication to this project.
Disclosures
Internal funds from Children's Mercy Hospital and Clinics supported the conduct of this work. The authors report no conflicts of interest.
- , , . Incidence of childhood obesity in the United States. N Engl J Med. 2014;370(5):403–411.
- , . Prevalence and trends in obesity and severe obesity among children in the United States, 1999–2012. JAMA Pediatr. 2014;168(6):561–566.
- , , , . Effects of childhood obesity on hospital care and costs, 1999–2005. Health Affairs. 2009;28(4):w751–w760.
- , , , , . Influence of obesity on clinical outcomes in hospitalized children: a systematic review. JAMA Pediatr. 2013;167(5):476–482.
- , . Appendicitis in the obese child. J Pediatr Surg. 2007;42(5):857–861.
- , , , , . Obesity: influence on length of hospital stay for the pediatric burn patient. J Burn Care Res. 2010;31(2):251–256.
- , , , , , . The impact of obesity on severely injured children and adolescents. J Pediatr Surg. 2006;41(1):88–91.
- , , , . Incremental hospital charges associated with obesity as a secondary diagnosis in children. Obesity (Silver Spring). 2007;15(7):1895–1901.
- , , , . Persistent gap of incremental charges for obesity as a secondary diagnosis in common pediatric hospitalizations. J Hosp Med. 2009;4(3):149–156.
- , , , . Resource utilization and expenditures for overweight and obese children. Arch Pediatr Adolesc Med. 2007;161(1):11–14.
- , , , , , . Decreased response to inhaled steroids in overweight and obese asthmatic children. J Allergy Clin Immunol. 2011;127(3):741–749.
- , , , , . Body mass and glucocorticoid response in asthma. Am J Respir Crit Care Med. 2008;178(7):682–687.
- , , , ; National Heart, Lung, and Blood Institute's Asthma Clinical Research Network. Body mass index and phenotype in subjects with mild‐to‐moderate persistent asthma. J Allergy Clin Immunol. 2009;123(6):1328–1334.e1.
- , . Obesity and asthma disease phenotypes. Curr Opin Allergy Clin Immunol. 2012;12(1):76–81.
- , . Obesity and the lung: 4. Obesity and asthma. Thorax. 2008;63(11):1018–1023.
- , , , et al. Body mass index and response to asthma therapy: fluticasone propionate/salmeterol versus montelukast. J Asthma. 2010;47(1):76–82.
- , , , et al. Effect of obesity on clinical presentation and response to treatment in asthma. J Asthma. 2006;43(7):553–558.
- , , , . Asthma and obesity in three‐year‐old urban children: role of sex and home environment. J Pediatr. 2011;159(1):14–20.
- , , , . Care of Children and Adolescents in U.S. Hospitals. Rockville, MD: Agency for Healthcare Research and Quality; 2003. Available at: http://archive.ahrq.gov/data/hcup/factbk4/factbk4.pdf. Accessed February 12, 2014.
- , , , . Childhood obesity increases duration of therapy during severe asthma exacerbations. Pediatr Crit Care Med. 2006;7(6):527–531.
- , , , , . Childhood overweight increases hospital admission rates for asthma. Pediatr. 2007;120(4):734–740.
- , , , . Body mass index and acute asthma severity among children presenting to the emergency department. Pediatr Allergy Immunol. 2009;21(3):480–488.
- Centers for Disease Control and Prevention. Basics about childhood obesity. Available at: http://www.cdc.gov/obesity/childhood/basics.html. Accessed February 12, 2014.
- . Screening and interventions for childhood overweight: a summary of evidence for the US Preventive Services Task Force. Pediatrics. 2005;116(1):e125–e144.
- ; Expert Committee. Expert committee recommendations regarding the prevention, assessment, and treatment of child and adolescent overweight and obesity: summary report. Pediatrics. 2007;120(suppl 4):S164–S192.
- , , , . Comparison of ICD code‐based diagnosis of obesity with measured obesity in children and the implications for health care cost estimates. BMC Med Res Methodol. 2011;11(1):173.
- , ; American Academy of Pediatrics Committee on Nutrition. Prevention of pediatric overweight and obesity. Pediatrics. 2003;112(2):424–430.
- . Development of the 3M all patient‐refined diagnosis‐related groups (APR DRGs). Available at: http//www.ahrq.gov/legacy/qual/mortality/Hughes3.htm. Accessed March 1, 2014.
- . 3M Health Information Systems (HIS) APR‐DRG classification software: overview. Available at: http://www.ahrq.gov/legacy/qual/mortality/Hughessumm.htm. Accessed March 1, 2014.
- , , , , . Shifting place of death among children with complex chronic conditions in the United States, 1989–2003. JAMA. 2007;297(24):2725–2732.
- , , . Pediatric deaths attributable to complex chronic conditions: a population‐based study of Washington State, 1980–1997. Pediatrics. 2000;106(1 pt 2):205–209.
- , , , et al. Comparative effectiveness of pleural drainage procedures for the treatment of complicated pneumonia in childhood. J Hosp Med. 2011;6(5):256–263.
- , , , , , . Adjunct corticosteroids in children hospitalized with community‐acquired pneumonia. Pediatrics. 2011;127(2):e255–e263.
- , , . Holding chambers (spacers) versus nebulisers for beta‐agonist treatment of acute asthma. Cochrane Database Syst Rev. 2013;9:CD000052.
- , , , . Effectiveness of a clinical pathway for inpatient asthma management. Pediatrics. 2000;106(5):1006–1012.
© 2014 Society of Hospital Medicine