User login
Defining Potential Overutilization of Physical Therapy Consults on Hospital Medicine Services
During hospitalization, patients spend 87% to 100% of their time in bed.1 This prolonged immobilization is a key contributor to the development of hospital-associated disability (HAD), defined as a new loss of ability to complete one or more activities of daily living (ADLs) without assistance after hospital discharge. HAD can lead to readmissions, institutionalization, and death and occurs in approximately one-third of all hospitalized patients.2,3 The most effective way to prevent HAD is by mobilizing patients early and throughout their hospitalization.4 Typically, physical therapists are the primary team members responsible for mobilizing patients, but they are a constrained resource in most inpatient settings.
The Activity Measure-Post Acute Care Inpatient Mobility Short Form (AM-PAC IMSF) is a validated tool for measuring physical function.5 The AM-PAC score has been used to predict discharge destination within 48 hours of admission6 and as a guide to allocate inpatient therapy referrals on a medical and a neurosurgical service.7,8 To date, however, no studies have used AM-PAC scores to evaluate overutilization of physical therapy consults on direct care hospital medicine services. In this study, we aimed to assess the potential overutilization of physical therapy consults on direct care hospital medicine services using validated AM-PAC score cutoffs.
METHODS
Study Design and Setting
We analyzed a retrospective cohort of admissions from September 30, 2018, through September 29, 2019, on all direct care hospital medicine services at the University of Chicago Medical Center (UC), Illinois. These services included general medicine, oncology, transplant (renal, lung, and liver), cardiology, and cirrhotic populations at the medical-surgical and telemetry level of care. All patients were hospitalized for longer than 48 hours. Patients who left against medical advice; died; were discharged to hospice, another hospital, or an inpatient psychiatric facility; or received no physical therapy referral during admission were excluded. For the remaining patients, we obtained age, sex, admission and discharge dates, admission and discharge AM-PAC scores, and discharge disposition.
Mobility Measure
At UC, the inpatient mobility protocol requires nursing staff to assess and document AM-PAC mobility scores for each patient at the time of admission and every nursing shift thereafter. They utilize the original version of the AM-PAC “6-Clicks” Basic Mobility score, which includes three questions assessing difficulty with mobility and three questions assessing help needed with mobility activities. It has high interrater reliability, with an intraclass correlation coefficient of 0.85.9
Outcomes and Predictors
The primary outcome was “potential overutilization.” Secondary outcomes were discharge disposition and change in mobility. Our predictors included admission AM-PAC score, age, and sex. Based on previous studies that validated an AM-PAC score of 42.9 (raw score, 17) as a cutoff for predicting discharge to home,6 we defined physical therapy consults as “potentially inappropriate” in patients with admission AM-PAC scores >43.63 (raw score, 18) who were discharged to home. Likewise, in the UC mobility protocol, nursing staff independently mobilize patients with AM-PAC scores >18, another rationale to use this cutoff for defining physical therapy consult inappropriateness. “Discharge to home” was defined as going home with no additional needs or services, going home with outpatient physical therapy, or going home with home health physical therapy services, since none of these require inpatient physical therapy assessment for the order to be placed. Discharge to long-term acute care, skilled nursing facility, subacute rehabilitation facility, or acute rehabilitation facility were considered “discharge to post–acute care.” Loss of mobility was calculated as: discharge AM-PAC − admission AM-PAC, termed delta AM-PAC.
Statistical Analysis
Descriptive statistics were used to summarize age (mean and SD) and age categorized as <65 years or ≥65 years, sex (male or female), admission AM-PAC score (mean and SD) and categorization (≤43.63 or >43.63), discharge AM-PAC score (mean and SD), and discharge destination (home vs post–acute care). Chi-square analysis was used to test for associations between admission AM-PAC score and delta AM-PAC. Two-sample t-test was used to test for difference in mean delta AM-PAC between admission AM-PAC groups. Multivariable logistic regression was used to test for independent associations between age, sex, and admission AM-PAC score and odds of being discharged to home, controlling for length of stay. P values of <.05 were considered statistically significant for all tests. Analyses were performed using Stata statistical software, release 16 (StataCorp LLC).
RESULTS
During the 1-year study period, 3592 admissions with physical therapy consults occurred on the direct care hospital medicine services (58% of all admissions). Mean age was 66.3 years (SD, 15.4 years), and 48% of patients were female. The mean admission AM-PAC score was 43.9 (SD, 11.1), and the mean discharge AM-PAC score was 46.8 (SD, 10.8). In our sample, 38% of physical therapy consults were for patients with an AM-PAC score >43.63 who were discharged to home and were therefore deemed “potential overutilization.” Of those, 40% were for patients who were 65 years or younger (18% of all physical therapy consults) (Table 1).
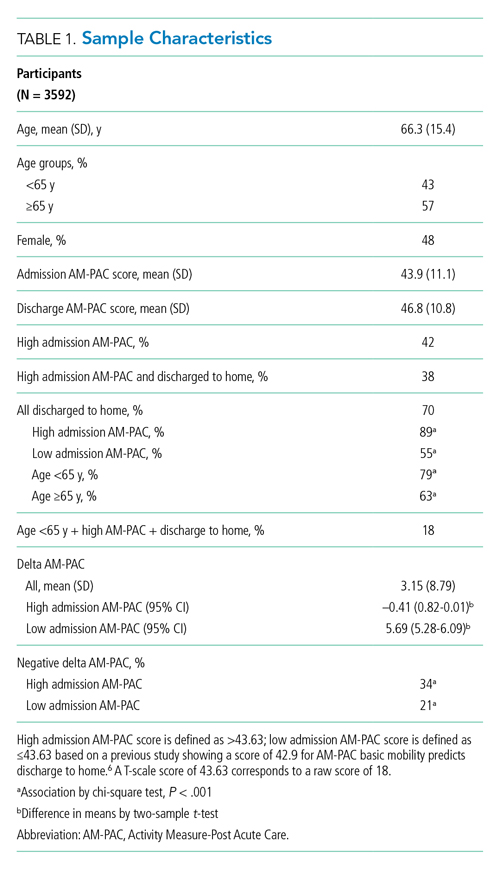
A higher proportion of patients with AM-PAC scores >43.63 were discharged to home compared with those with AM-PAC scores ≤43.63 (89% vs 55%; χ2 [1, N = 3099], 396.5; P < .001). More patients younger than 65 years were discharged to home compared with those 65 years and older (79% vs 63%; χ2 [1, N = 3099], 113.6; P < .001). Additionally, for all patients younger than 65 years, those with AM-PAC score >43.63 were discharged to home more frequently than those with AM-PAC ≤43.63 (92% vs 66%, χ2 [1, N = 1,354], 134.4; P < .001). For 11% (n = 147) of the high-mobility group, the patient was not discharged home but was sent to post–acute care. Reviewing these patient charts showed the reasons for discharge to post–acute care were predominantly personal or social needs (eg, homelessness, need for 24-hour supervision with no family support, patient request) or medical needs (eg, intravenous antibiotics or new tubes, lines, drains, or medications requiring extra nursing support or management). Only 16% of patients in this group (n = 23) experienced deconditioning necessitating physical therapy consult during hospitalization, per their record.
Compared with patients with admission AM-PAC score >43.63, patients with admission AM-PAC ≤43.63 had significantly different changes in mobility as measured by mean delta AM-PAC score (delta AM-PAC, –0.41 for AM-PAC >43.63 vs +5.69 for AM-PAC ≤43.63; t (3097) = –20.3; P < .001) (Table 1).
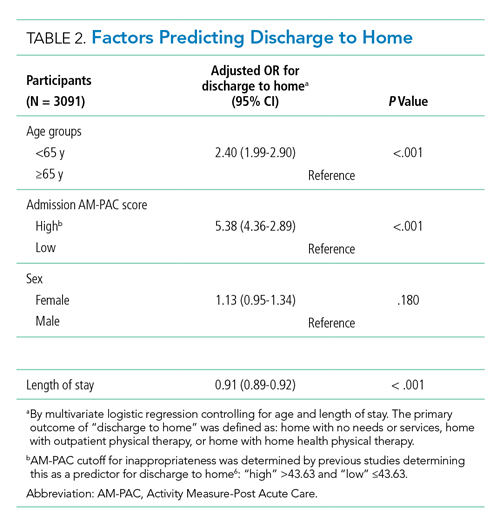
In multivariate logistic regression, AM-PAC >43.63 (OR, 5.38; 95% CI, 4.36-2.89; P < .001) and age younger than 65 years (OR, 2.40; 95% CI, 1.99-2.90; P < .001) were associated with increased odds of discharge to home (Table 2).
DISCUSSION
In this study, we found that physical therapists may be unnecessarily consulted on direct care hospitalist services as much as 38% of the time based on AM-PAC score. We also demonstrated that patients admitted with high mobility by AM-PAC score are more than five times as likely to be discharged to home. When admitted with high AM-PAC scores, patients had virtually no change in mobility during hospitalization, whereas patients with low AM-PAC scores gained mobility during hospitalization, underscoring the benefit of physical therapy referrals for this group.
Given resource scarcity and cost, achieving optimal physical therapy utilization is an important goal for healthcare systems.10 Appropriate allocation of physical therapy has the potential to improve outcomes from the patient to the payor level. While it may be necessary to consult physical therapy for reasons other than mobility later in the hospitalization, identifying patients who will benefit from skilled physical therapy at the time of admission can help prevent disability and institutionalization and shorten length of stay.5,6 Likewise, decreasing physical therapy referrals for low-risk patients can increase the amount of time spent rehabilitating at-risk patients.
There are limitations of our study worth considering. First, our analyses did not consider whether physical therapy contributed to patients’ ability to return home after discharge. However, in our hospital, patients with AM-PAC >43.63 who cannot safely ambulate independently do progressive mobility with nursing staff. Our physical therapy leadership has also observed that the vast majority of highly mobile patients who are referred for physical therapy ultimately receive no treatment. Second, we did not consider discharge diagnosis, but our patient populations present with a wide variety of conditions, and it is impossible to predict their discharge diagnosis. By not including discharge diagnosis, we assess how AM-PAC performs on admission regardless of the medical condition for which someone is treated. Our hospital treats a high proportion of African American and a low proportion of White, Hispanic, and Asian American patients, limiting the generalizability of our findings. Although the AM-PAC “6-Clicks” score has been shown to have high interrater reliability among physical therapists, our AM-PAC scores are assessed and documented by our nursing staff, which might decrease accuracy. However, one single-center study noted an intraclass correlation coefficient of 0.96 between nurses and physical therapists for the AM-PAC “6-Clicks.”11Despite these limitations, this study underscores the need to be more judicious in the decision to refer a patient for inpatient physical therapy, especially at the time of admission, and demonstrates the utility of using standardized mobility assessment to help in that decision-making process.
1. Fazio S, Stocking J, Kuhn B, et al. How much do hospitalized adults move? A systematic review and meta-analysis. Appl Nurs Res. 2020;51:151189. https://doi.org/10.1016/j.apnr.2019.151189
2. Brown CJ, Redden DT, Flood KL, Allman RM. The underrecognized epidemic of low mobility during hospitalization of older adults. J Am Geriatr Soc. 2009;57(9):1660-1665. https://doi.org/10.1111/j.1532-5415.2009.02393.x
3. Brown C.J, Friedkin RJ, Inouye SK. Prevalence and outcomes of low mobility in hospitalized older patients. J Am Geriatr Soc. 2004;52:1263-1270. https://doi.org/10.1111/j.1532-5415.2004.52354.x
4. Zisberg A, Shadmi E, Gur-Yaish N, Tonkikh O, Sinoff G. Hospital-associated functional decline: the role of hospitalization processes beyond individual risk factors. J Am Geriatr Soc. 2015;63:55-62. https://doi.org/10.1111/jgs.13193
5. Jette DU, Stilphen M, Ranganathan VK, Passek SD, Frost FS, Jette AM. Validity of the AM-PAC “6-Clicks” inpatient daily activity and basic mobility short forms. Phys Ther. 2014;94(3):379-391. https://doi.org/10.2522/ptj.20130199
6. Jette DU, Stilphen M, Ranganathan VK, Passek SD, Frost FS, Jette AM. AM-PAC “6-Clicks” functional assessment scores predict acute care hospital discharge destination. Phys Ther. 2014;94(9):1252-1261. https://doi.org/10.2522/ptj.20130359
7. Probasco JC, Lavezza A, Cassell A, et al. Choosing wisely together: physical and occupational therapy consultation for acute neurology inpatients. Neurohospitalist. 2018;8(2):53-59. https://doi.org/10.1177/1941874417729981
8. Young DL, Colantuoni E, Friedman LA, et al. Prediction of disposition within 48 hours of hospital admission using patient mobility scores. J Hosp Med. 2020;15(9);540-543. https://doi.org/10.12788/jhm.3332
9. Jette DU, Stilphen M, Ranganathan VK, Passek S, Frost FS, Jette AM. Interrater reliability of AM-PAC “6-Clicks” basic mobility and daily activity short forms. Phys Ther. 2015;95(5):758-766. https://doi.org/10.2522/ptj.20140174
10. Juneau A, Bolduc A, Nguyen P, et al. Feasibility of implementing an exercise program in a geriatric assessment unit: the SPRINT program. Can Geriatr J. 2018;21(3):284-289. https://doi.org/10.5770/cgj.21.311
11. Hoyer EH, Young DL, Klein LM, et al. Toward a common language for measuring patient mobility in the hospital: reliability and construct validity of interprofessional mobility measures. Phys Ther. 2018;98(2):133-142. https://doi.org/10.1093/ptj/pzx110
During hospitalization, patients spend 87% to 100% of their time in bed.1 This prolonged immobilization is a key contributor to the development of hospital-associated disability (HAD), defined as a new loss of ability to complete one or more activities of daily living (ADLs) without assistance after hospital discharge. HAD can lead to readmissions, institutionalization, and death and occurs in approximately one-third of all hospitalized patients.2,3 The most effective way to prevent HAD is by mobilizing patients early and throughout their hospitalization.4 Typically, physical therapists are the primary team members responsible for mobilizing patients, but they are a constrained resource in most inpatient settings.
The Activity Measure-Post Acute Care Inpatient Mobility Short Form (AM-PAC IMSF) is a validated tool for measuring physical function.5 The AM-PAC score has been used to predict discharge destination within 48 hours of admission6 and as a guide to allocate inpatient therapy referrals on a medical and a neurosurgical service.7,8 To date, however, no studies have used AM-PAC scores to evaluate overutilization of physical therapy consults on direct care hospital medicine services. In this study, we aimed to assess the potential overutilization of physical therapy consults on direct care hospital medicine services using validated AM-PAC score cutoffs.
METHODS
Study Design and Setting
We analyzed a retrospective cohort of admissions from September 30, 2018, through September 29, 2019, on all direct care hospital medicine services at the University of Chicago Medical Center (UC), Illinois. These services included general medicine, oncology, transplant (renal, lung, and liver), cardiology, and cirrhotic populations at the medical-surgical and telemetry level of care. All patients were hospitalized for longer than 48 hours. Patients who left against medical advice; died; were discharged to hospice, another hospital, or an inpatient psychiatric facility; or received no physical therapy referral during admission were excluded. For the remaining patients, we obtained age, sex, admission and discharge dates, admission and discharge AM-PAC scores, and discharge disposition.
Mobility Measure
At UC, the inpatient mobility protocol requires nursing staff to assess and document AM-PAC mobility scores for each patient at the time of admission and every nursing shift thereafter. They utilize the original version of the AM-PAC “6-Clicks” Basic Mobility score, which includes three questions assessing difficulty with mobility and three questions assessing help needed with mobility activities. It has high interrater reliability, with an intraclass correlation coefficient of 0.85.9
Outcomes and Predictors
The primary outcome was “potential overutilization.” Secondary outcomes were discharge disposition and change in mobility. Our predictors included admission AM-PAC score, age, and sex. Based on previous studies that validated an AM-PAC score of 42.9 (raw score, 17) as a cutoff for predicting discharge to home,6 we defined physical therapy consults as “potentially inappropriate” in patients with admission AM-PAC scores >43.63 (raw score, 18) who were discharged to home. Likewise, in the UC mobility protocol, nursing staff independently mobilize patients with AM-PAC scores >18, another rationale to use this cutoff for defining physical therapy consult inappropriateness. “Discharge to home” was defined as going home with no additional needs or services, going home with outpatient physical therapy, or going home with home health physical therapy services, since none of these require inpatient physical therapy assessment for the order to be placed. Discharge to long-term acute care, skilled nursing facility, subacute rehabilitation facility, or acute rehabilitation facility were considered “discharge to post–acute care.” Loss of mobility was calculated as: discharge AM-PAC − admission AM-PAC, termed delta AM-PAC.
Statistical Analysis
Descriptive statistics were used to summarize age (mean and SD) and age categorized as <65 years or ≥65 years, sex (male or female), admission AM-PAC score (mean and SD) and categorization (≤43.63 or >43.63), discharge AM-PAC score (mean and SD), and discharge destination (home vs post–acute care). Chi-square analysis was used to test for associations between admission AM-PAC score and delta AM-PAC. Two-sample t-test was used to test for difference in mean delta AM-PAC between admission AM-PAC groups. Multivariable logistic regression was used to test for independent associations between age, sex, and admission AM-PAC score and odds of being discharged to home, controlling for length of stay. P values of <.05 were considered statistically significant for all tests. Analyses were performed using Stata statistical software, release 16 (StataCorp LLC).
RESULTS
During the 1-year study period, 3592 admissions with physical therapy consults occurred on the direct care hospital medicine services (58% of all admissions). Mean age was 66.3 years (SD, 15.4 years), and 48% of patients were female. The mean admission AM-PAC score was 43.9 (SD, 11.1), and the mean discharge AM-PAC score was 46.8 (SD, 10.8). In our sample, 38% of physical therapy consults were for patients with an AM-PAC score >43.63 who were discharged to home and were therefore deemed “potential overutilization.” Of those, 40% were for patients who were 65 years or younger (18% of all physical therapy consults) (Table 1).
A higher proportion of patients with AM-PAC scores >43.63 were discharged to home compared with those with AM-PAC scores ≤43.63 (89% vs 55%; χ2 [1, N = 3099], 396.5; P < .001). More patients younger than 65 years were discharged to home compared with those 65 years and older (79% vs 63%; χ2 [1, N = 3099], 113.6; P < .001). Additionally, for all patients younger than 65 years, those with AM-PAC score >43.63 were discharged to home more frequently than those with AM-PAC ≤43.63 (92% vs 66%, χ2 [1, N = 1,354], 134.4; P < .001). For 11% (n = 147) of the high-mobility group, the patient was not discharged home but was sent to post–acute care. Reviewing these patient charts showed the reasons for discharge to post–acute care were predominantly personal or social needs (eg, homelessness, need for 24-hour supervision with no family support, patient request) or medical needs (eg, intravenous antibiotics or new tubes, lines, drains, or medications requiring extra nursing support or management). Only 16% of patients in this group (n = 23) experienced deconditioning necessitating physical therapy consult during hospitalization, per their record.
Compared with patients with admission AM-PAC score >43.63, patients with admission AM-PAC ≤43.63 had significantly different changes in mobility as measured by mean delta AM-PAC score (delta AM-PAC, –0.41 for AM-PAC >43.63 vs +5.69 for AM-PAC ≤43.63; t (3097) = –20.3; P < .001) (Table 1).
In multivariate logistic regression, AM-PAC >43.63 (OR, 5.38; 95% CI, 4.36-2.89; P < .001) and age younger than 65 years (OR, 2.40; 95% CI, 1.99-2.90; P < .001) were associated with increased odds of discharge to home (Table 2).
DISCUSSION
In this study, we found that physical therapists may be unnecessarily consulted on direct care hospitalist services as much as 38% of the time based on AM-PAC score. We also demonstrated that patients admitted with high mobility by AM-PAC score are more than five times as likely to be discharged to home. When admitted with high AM-PAC scores, patients had virtually no change in mobility during hospitalization, whereas patients with low AM-PAC scores gained mobility during hospitalization, underscoring the benefit of physical therapy referrals for this group.
Given resource scarcity and cost, achieving optimal physical therapy utilization is an important goal for healthcare systems.10 Appropriate allocation of physical therapy has the potential to improve outcomes from the patient to the payor level. While it may be necessary to consult physical therapy for reasons other than mobility later in the hospitalization, identifying patients who will benefit from skilled physical therapy at the time of admission can help prevent disability and institutionalization and shorten length of stay.5,6 Likewise, decreasing physical therapy referrals for low-risk patients can increase the amount of time spent rehabilitating at-risk patients.
There are limitations of our study worth considering. First, our analyses did not consider whether physical therapy contributed to patients’ ability to return home after discharge. However, in our hospital, patients with AM-PAC >43.63 who cannot safely ambulate independently do progressive mobility with nursing staff. Our physical therapy leadership has also observed that the vast majority of highly mobile patients who are referred for physical therapy ultimately receive no treatment. Second, we did not consider discharge diagnosis, but our patient populations present with a wide variety of conditions, and it is impossible to predict their discharge diagnosis. By not including discharge diagnosis, we assess how AM-PAC performs on admission regardless of the medical condition for which someone is treated. Our hospital treats a high proportion of African American and a low proportion of White, Hispanic, and Asian American patients, limiting the generalizability of our findings. Although the AM-PAC “6-Clicks” score has been shown to have high interrater reliability among physical therapists, our AM-PAC scores are assessed and documented by our nursing staff, which might decrease accuracy. However, one single-center study noted an intraclass correlation coefficient of 0.96 between nurses and physical therapists for the AM-PAC “6-Clicks.”11Despite these limitations, this study underscores the need to be more judicious in the decision to refer a patient for inpatient physical therapy, especially at the time of admission, and demonstrates the utility of using standardized mobility assessment to help in that decision-making process.
1. Fazio S, Stocking J, Kuhn B, et al. How much do hospitalized adults move? A systematic review and meta-analysis. Appl Nurs Res. 2020;51:151189. https://doi.org/10.1016/j.apnr.2019.151189
2. Brown CJ, Redden DT, Flood KL, Allman RM. The underrecognized epidemic of low mobility during hospitalization of older adults. J Am Geriatr Soc. 2009;57(9):1660-1665. https://doi.org/10.1111/j.1532-5415.2009.02393.x
3. Brown C.J, Friedkin RJ, Inouye SK. Prevalence and outcomes of low mobility in hospitalized older patients. J Am Geriatr Soc. 2004;52:1263-1270. https://doi.org/10.1111/j.1532-5415.2004.52354.x
4. Zisberg A, Shadmi E, Gur-Yaish N, Tonkikh O, Sinoff G. Hospital-associated functional decline: the role of hospitalization processes beyond individual risk factors. J Am Geriatr Soc. 2015;63:55-62. https://doi.org/10.1111/jgs.13193
5. Jette DU, Stilphen M, Ranganathan VK, Passek SD, Frost FS, Jette AM. Validity of the AM-PAC “6-Clicks” inpatient daily activity and basic mobility short forms. Phys Ther. 2014;94(3):379-391. https://doi.org/10.2522/ptj.20130199
6. Jette DU, Stilphen M, Ranganathan VK, Passek SD, Frost FS, Jette AM. AM-PAC “6-Clicks” functional assessment scores predict acute care hospital discharge destination. Phys Ther. 2014;94(9):1252-1261. https://doi.org/10.2522/ptj.20130359
7. Probasco JC, Lavezza A, Cassell A, et al. Choosing wisely together: physical and occupational therapy consultation for acute neurology inpatients. Neurohospitalist. 2018;8(2):53-59. https://doi.org/10.1177/1941874417729981
8. Young DL, Colantuoni E, Friedman LA, et al. Prediction of disposition within 48 hours of hospital admission using patient mobility scores. J Hosp Med. 2020;15(9);540-543. https://doi.org/10.12788/jhm.3332
9. Jette DU, Stilphen M, Ranganathan VK, Passek S, Frost FS, Jette AM. Interrater reliability of AM-PAC “6-Clicks” basic mobility and daily activity short forms. Phys Ther. 2015;95(5):758-766. https://doi.org/10.2522/ptj.20140174
10. Juneau A, Bolduc A, Nguyen P, et al. Feasibility of implementing an exercise program in a geriatric assessment unit: the SPRINT program. Can Geriatr J. 2018;21(3):284-289. https://doi.org/10.5770/cgj.21.311
11. Hoyer EH, Young DL, Klein LM, et al. Toward a common language for measuring patient mobility in the hospital: reliability and construct validity of interprofessional mobility measures. Phys Ther. 2018;98(2):133-142. https://doi.org/10.1093/ptj/pzx110
© 2021 Society of Hospital Medicine
Implementing Physical Distancing in the Hospital: A Key Strategy to Prevent Nosocomial Transmission of COVID-19
Hospitalists serve as frontline healthcare professionals caring for the increasing number of COVID-19 patients in the United States. The safety of hospitalists and other frontline healthcare workers is paramount to preventing high nosocomial transmission as has been reported in several other countries. Much effort to date has rightly focused on ensuring healthcare workers have appropriate personal protective equipment (PPE) given the known increased risk of nosocomial infection to healthcare workers. However, another important strategy to prevent nosocomial transmission is to implement “social distancing,” or avoiding close contact with others. While this approach has received considerable press with regards to implementation in communities, social, or physical, distancing in the hospital is also a critical way to prevent nosocomial transmission and ensure the health and welfare of our workforce to meet the challenge. The Centers for Disease Control and Prevention (CDC) defines close contact as less than 6 feet away for over 10 minutes.1 Given the myriad clinical interactions that occur within teams in the hospital, such distancing can prove challenging.
At the University of Chicago Medicine in Illinois, our hospitalist group was an early adopter of implementing several strategies to facilitate physical distancing in the context of clinical care to minimize community transmission of COVID-19 among healthcare professionals. We describe how to implement physical distancing effectively in specific hospital settings, including some challenges and strategies to surmount them.
EDUCATIONAL CONFERENCES AND ADMINISTRATIVE MEETINGS
Educational conferences and administrative meetings need to be transitioned to virtual meetings. While it may be easy to broadcast a conference in lieu of meeting in a conference room, it is critical that hospital clinicians do not “huddle close together” in front of a computer, which would defeat the purpose of physical distancing. While “flipping the classroom” in preclinical and higher education is common, this method can be effective to deliver standard education followed by a virtual question and answer session or chat room.2
Educational discussions can also occur asynchronously through learning management systems, such as Canvas, or even closed social media channels, such as Slack, that enable discussions. These tools require training to work, so it is important to invest in education on the chosen platform to ensure that it functions smoothly. It is equally important that administrators become familiar with these tools while working remotely and can facilitate administrative meetings without difficulty. We created a one-page tip sheet to help ease the transition for department administrators. The tip sheet highlighted how to start a virtual meeting and meeting etiquette (eg, mute upon entry into the meeting, mute when not talking, announce yourself when talking) as well as ensuring that dial-ins could easily access the meeting by including one-touch options, when available, on calendar invites in addition to the weblink. A daily email update can be an important adjunct to administrative meetings to ensure critical updates are reaching all clinicians in a group and also preserves meeting time for clarifying questions.
CLINICAL WORKROOMS
Perhaps the biggest challenge is how many clinical workrooms in hospitals today are crowded with computers next to each other. Ventilation can also be poor, making conditions riskier. This makes implemention of social distancing extremely challenging, but also critical, given how much time hospital-based clinicians spend on computers and in their workrooms. The first step to achieving social distancing in the workroom is to take an inventory of how many people work there and get a log of the number of computers. Consider whether existing computers can be rearranged with a goal of keeping people 6 feet apart. For particularly cramped workrooms, this may require assigning computer spaces to physicians across a floor or several floors, using computers out on a unit, or using mobile computers to limit the number of people in the workroom at one time. We suggest working with physical plant leaders and Information Technology to reallocate mobile workstations, laptops, or desktops to conference rooms, patient visiting areas, and offices that are not being used. Because coronavirus can survive on surfaces for several hours, it is also important to stock work rooms with disinfectants to clean surfaces such as keyboards and desktops frequently. One other important thing to consider is whether computers can be assigned to specific teams or people to limit the use of a computer by multiple people.
ROUNDING, SIGN-OUT, AND MULTIDISCIPLINARY ROUNDS
Rounding
Perhaps one of the most fundamental hardships with physical distancing is how to conduct routine clinical care such as rounds, sign-out, or multidisciplinary rounds. Rounds on teaching services are particularly challenging given the number of people. At many teaching institutions, medical students are no longer on clinical rotations, which immediately reduces the number of people on teaching teams. The other thing to consider is how rounds are conducted. As opposed to a large team walking together, assign one person from the team as the liaison for the patient, which also has the added benefit of conserving precious PPE. Virtual rounding enables clinicians, including residents and attendings, to work together and decide the plan for the day without first crowding into a patient room. This is perhaps the most important cultural hurdle that one may face.
Another administrative hurdle and common concern is how to bill for such interactions. While federal guidance evolves, our institution created smartphrases for this type of virtual rounding whereby attendings attest to resident notes even if they did not physically see the patient. Additional information may be obtained from patients by calling them on their patient-room phones or by using telemedicine as some hospitals are implementing.3 For large “mega” teams, split the team into smaller groups to facilitate continuity and easier conversations.
Sign-out
When feasible, it is important to transition to phone sign-out supplemented with viewing an updated shared sign-out, ideally electronically, for shift change. When using phone sign-out, it is ideal to implement a verbal read-back to ensure understanding and to keep your sign-out updated. Because using the telephone is not the most effective communication channel for sign-out, it is key to be vigilant with other sign-out best practices, such as using a standard template like IPASS4 or another framework, prioritizing sick patients, and ensuring a focus on to-do and if/then items that are critical for the receiver to ensure understanding.5
Multidisciplinary Rounds
As multidisciplinary rounds typically occur either at the bedside or in a conference room, it is key to ensure that these occur virtually whenever possible. One option is to use conference calls or video chat (eg, Zoom) for multidisciplinary rounds whenever possible. Calendar invites or paging reminders can be used to prompt teams when to call in to discuss patients. Because multiple people are entering a virtual room at once, it is important to establish an order or have a leader orchestrate who is next. In addition, given the importance of multiple people contributing to the discussion, it is also equally important for those speaking always to announce who they are and their role (eg, social worker, case manager, physical therapist) since it may not be possible to recognize people’s voices alone. This is where visual recognition can be helpful through use of institutional video conferencing that enables hearing and seeing someone. Further, it is important to ensure that the platform being used is HIPAA compliant.
CALL ROOMS
Call rooms in hospitals can be particularly challenging if they are shared. Finding additional call rooms may require use of cots or reallocation of patient rooms. It is also possible for hospitalists to consider air mattresses in their offices or other private spaces to avoid sharing call rooms. Consider assigning the same call room to the same few people over the course of a rotation or period to avoid many people sharing one room. If a hospital is converting units to group patients under investigation or those who are COVID-19 positive, reallocating call rooms may be necessary to accommodate new teams. Lastly, it is important to communicate proactively with environmental services staff to make sure all call rooms are equipped with cleaning supplies and hand sanitizer and are cleaned daily to avoid nosocomial transmission.
CONCLUSION
/section>Containing nosocomial spread of coronavirus is particularly challenging for hospitals because of how contagious the virus is, the extreme shortage of PPE, and lack of mass testing to identify those who are sick. Therefore, physical distancing in the hospital is critical to ensure the health and well-being of the health professional workforce during the pandemic.
1. Centers for Disease Control and Prevention. Interim U.S. Guidance for Risk Assessment and Public Health Management of Healthcare Personnel with Potential Exposure in a Healthcare Setting to Patients with Coronavirus Disease (COVID-19). https://www.cdc.gov/coronavirus/2019-ncov/hcp/guidance-risk-assesment-hcp.html. Accessed April 2, 2020.
2. Stephenson CR, Wang AT, Szostek JH, et al. Flipping the continuing medical education classroom: validating a measure of attendees’ perceptions. J Contin Educ Health Prof. 2016;36(4):256-262. https://doi.org/10.1097/CEH.0000000000000113.
3. Doshi A, Platt Y, Dressen JR, K Mathews BK, Siy JC. Keep calm and log on: telemedicine for COVID-19 pandemic response. J Hosp Med. 2020;15(4):xxx-xxxx. https://doi.org/10.12788/jhm.3419.
4. Starmer AJ, Spector ND, Srivastava R, et al. Changes in medical errors after implementation of a handoff program. N Engl J Med. 2014;371(19):1803-1812. https://doi.org/10.1056/NEJMsa1405556.
5. Gaffney S, Farnan JM, Hirsch K, McGinty M, Arora VM. The modified, multi-patient observed simulated handoff experience (M-OSHE): assessment and feedback for entering residents on handoff performance. J Gen Intern Med. 2016;31(4):438-441. https://doi.org/10.1007/s11606-016-3591-8.
Hospitalists serve as frontline healthcare professionals caring for the increasing number of COVID-19 patients in the United States. The safety of hospitalists and other frontline healthcare workers is paramount to preventing high nosocomial transmission as has been reported in several other countries. Much effort to date has rightly focused on ensuring healthcare workers have appropriate personal protective equipment (PPE) given the known increased risk of nosocomial infection to healthcare workers. However, another important strategy to prevent nosocomial transmission is to implement “social distancing,” or avoiding close contact with others. While this approach has received considerable press with regards to implementation in communities, social, or physical, distancing in the hospital is also a critical way to prevent nosocomial transmission and ensure the health and welfare of our workforce to meet the challenge. The Centers for Disease Control and Prevention (CDC) defines close contact as less than 6 feet away for over 10 minutes.1 Given the myriad clinical interactions that occur within teams in the hospital, such distancing can prove challenging.
At the University of Chicago Medicine in Illinois, our hospitalist group was an early adopter of implementing several strategies to facilitate physical distancing in the context of clinical care to minimize community transmission of COVID-19 among healthcare professionals. We describe how to implement physical distancing effectively in specific hospital settings, including some challenges and strategies to surmount them.
EDUCATIONAL CONFERENCES AND ADMINISTRATIVE MEETINGS
Educational conferences and administrative meetings need to be transitioned to virtual meetings. While it may be easy to broadcast a conference in lieu of meeting in a conference room, it is critical that hospital clinicians do not “huddle close together” in front of a computer, which would defeat the purpose of physical distancing. While “flipping the classroom” in preclinical and higher education is common, this method can be effective to deliver standard education followed by a virtual question and answer session or chat room.2
Educational discussions can also occur asynchronously through learning management systems, such as Canvas, or even closed social media channels, such as Slack, that enable discussions. These tools require training to work, so it is important to invest in education on the chosen platform to ensure that it functions smoothly. It is equally important that administrators become familiar with these tools while working remotely and can facilitate administrative meetings without difficulty. We created a one-page tip sheet to help ease the transition for department administrators. The tip sheet highlighted how to start a virtual meeting and meeting etiquette (eg, mute upon entry into the meeting, mute when not talking, announce yourself when talking) as well as ensuring that dial-ins could easily access the meeting by including one-touch options, when available, on calendar invites in addition to the weblink. A daily email update can be an important adjunct to administrative meetings to ensure critical updates are reaching all clinicians in a group and also preserves meeting time for clarifying questions.
CLINICAL WORKROOMS
Perhaps the biggest challenge is how many clinical workrooms in hospitals today are crowded with computers next to each other. Ventilation can also be poor, making conditions riskier. This makes implemention of social distancing extremely challenging, but also critical, given how much time hospital-based clinicians spend on computers and in their workrooms. The first step to achieving social distancing in the workroom is to take an inventory of how many people work there and get a log of the number of computers. Consider whether existing computers can be rearranged with a goal of keeping people 6 feet apart. For particularly cramped workrooms, this may require assigning computer spaces to physicians across a floor or several floors, using computers out on a unit, or using mobile computers to limit the number of people in the workroom at one time. We suggest working with physical plant leaders and Information Technology to reallocate mobile workstations, laptops, or desktops to conference rooms, patient visiting areas, and offices that are not being used. Because coronavirus can survive on surfaces for several hours, it is also important to stock work rooms with disinfectants to clean surfaces such as keyboards and desktops frequently. One other important thing to consider is whether computers can be assigned to specific teams or people to limit the use of a computer by multiple people.
ROUNDING, SIGN-OUT, AND MULTIDISCIPLINARY ROUNDS
Rounding
Perhaps one of the most fundamental hardships with physical distancing is how to conduct routine clinical care such as rounds, sign-out, or multidisciplinary rounds. Rounds on teaching services are particularly challenging given the number of people. At many teaching institutions, medical students are no longer on clinical rotations, which immediately reduces the number of people on teaching teams. The other thing to consider is how rounds are conducted. As opposed to a large team walking together, assign one person from the team as the liaison for the patient, which also has the added benefit of conserving precious PPE. Virtual rounding enables clinicians, including residents and attendings, to work together and decide the plan for the day without first crowding into a patient room. This is perhaps the most important cultural hurdle that one may face.
Another administrative hurdle and common concern is how to bill for such interactions. While federal guidance evolves, our institution created smartphrases for this type of virtual rounding whereby attendings attest to resident notes even if they did not physically see the patient. Additional information may be obtained from patients by calling them on their patient-room phones or by using telemedicine as some hospitals are implementing.3 For large “mega” teams, split the team into smaller groups to facilitate continuity and easier conversations.
Sign-out
When feasible, it is important to transition to phone sign-out supplemented with viewing an updated shared sign-out, ideally electronically, for shift change. When using phone sign-out, it is ideal to implement a verbal read-back to ensure understanding and to keep your sign-out updated. Because using the telephone is not the most effective communication channel for sign-out, it is key to be vigilant with other sign-out best practices, such as using a standard template like IPASS4 or another framework, prioritizing sick patients, and ensuring a focus on to-do and if/then items that are critical for the receiver to ensure understanding.5
Multidisciplinary Rounds
As multidisciplinary rounds typically occur either at the bedside or in a conference room, it is key to ensure that these occur virtually whenever possible. One option is to use conference calls or video chat (eg, Zoom) for multidisciplinary rounds whenever possible. Calendar invites or paging reminders can be used to prompt teams when to call in to discuss patients. Because multiple people are entering a virtual room at once, it is important to establish an order or have a leader orchestrate who is next. In addition, given the importance of multiple people contributing to the discussion, it is also equally important for those speaking always to announce who they are and their role (eg, social worker, case manager, physical therapist) since it may not be possible to recognize people’s voices alone. This is where visual recognition can be helpful through use of institutional video conferencing that enables hearing and seeing someone. Further, it is important to ensure that the platform being used is HIPAA compliant.
CALL ROOMS
Call rooms in hospitals can be particularly challenging if they are shared. Finding additional call rooms may require use of cots or reallocation of patient rooms. It is also possible for hospitalists to consider air mattresses in their offices or other private spaces to avoid sharing call rooms. Consider assigning the same call room to the same few people over the course of a rotation or period to avoid many people sharing one room. If a hospital is converting units to group patients under investigation or those who are COVID-19 positive, reallocating call rooms may be necessary to accommodate new teams. Lastly, it is important to communicate proactively with environmental services staff to make sure all call rooms are equipped with cleaning supplies and hand sanitizer and are cleaned daily to avoid nosocomial transmission.
CONCLUSION
/section>Containing nosocomial spread of coronavirus is particularly challenging for hospitals because of how contagious the virus is, the extreme shortage of PPE, and lack of mass testing to identify those who are sick. Therefore, physical distancing in the hospital is critical to ensure the health and well-being of the health professional workforce during the pandemic.
1. Centers for Disease Control and Prevention. Interim U.S. Guidance for Risk Assessment and Public Health Management of Healthcare Personnel with Potential Exposure in a Healthcare Setting to Patients with Coronavirus Disease (COVID-19). https://www.cdc.gov/coronavirus/2019-ncov/hcp/guidance-risk-assesment-hcp.html. Accessed April 2, 2020.
2. Stephenson CR, Wang AT, Szostek JH, et al. Flipping the continuing medical education classroom: validating a measure of attendees’ perceptions. J Contin Educ Health Prof. 2016;36(4):256-262. https://doi.org/10.1097/CEH.0000000000000113.
3. Doshi A, Platt Y, Dressen JR, K Mathews BK, Siy JC. Keep calm and log on: telemedicine for COVID-19 pandemic response. J Hosp Med. 2020;15(4):xxx-xxxx. https://doi.org/10.12788/jhm.3419.
4. Starmer AJ, Spector ND, Srivastava R, et al. Changes in medical errors after implementation of a handoff program. N Engl J Med. 2014;371(19):1803-1812. https://doi.org/10.1056/NEJMsa1405556.
5. Gaffney S, Farnan JM, Hirsch K, McGinty M, Arora VM. The modified, multi-patient observed simulated handoff experience (M-OSHE): assessment and feedback for entering residents on handoff performance. J Gen Intern Med. 2016;31(4):438-441. https://doi.org/10.1007/s11606-016-3591-8.
© 2020 Society of Hospital Medicine
Hospitalist Effects on Acute IGIH Patients
Acute upper gastrointestinal hemorrhage (UGIH) is one of the most common hospital admissions for acute care. Estimates indicate that 300,000 patients (100‐150 cases per 100,000 adults) are admitted annually with an associated economic impact of $2.5 billion.15 The current standard management of UGIH requires hospital admission and esophagogastroduodenoscopy (EGD) by a gastroenterologist for diagnosis and/or treatment. This management strategy results in a high consumption of hospital resources and costs.
Simultaneously, hospitalists have dramatically changed the delivery of inpatient care in the United States and are recognized as a location‐driven subspecialty for the care of acute hospitalized patients, similar to emergency medicine. Currently there are 20,000 hospitalists, and more than one‐third of general medicine inpatients are cared for by hospitalists.6, 7
Previous studies have shown that hospitalist care offers better or comparable outcomes, with lower overall length of stay (LOS) and costs compared to traditional providers.810 However, most of these studies were performed in single institutions, had weak designs or little‐to‐no adjustment for severity of illness, or were limited to 7 specific diseases (pneumonia, congestive heart failure [CHF], chest pain, ischemic stroke, urinary tract infection, chronic obstructive lung disease [COPD], and acute myocardial infarction [AMI]).8
Furthermore, less is known about the effect of hospitalists on conditions that may be dependent upon specialist consultation for procedures and/or treatment plans. In this study, gastroenterologists performed diagnostic and/or therapeutic endoscopy work as consultants to the attending physicians in the management of acute inpatient UGIH.
To explore the effects of hospitalists on care of patients with acute UGIH, we examined data from the Multicenter Hospitalist (MCH) trial. The objectives of our study were to compare clinical outcomesin‐hospital mortality and complications (ie, recurrent bleeding, intensive care unit [ICU] transfer, decompensation, transfusion, reendoscopy, 30‐day readmission)and efficiency (LOS and costs) in hospitalized acute UGIH patients cared for by hospitalists and nonhospitalists in 6 academic centers in the United States during a 2‐year period.
Patients and Methods
Study Sites
From July 1, 2001 to June 30, 2003, the MCH trial1113 was a prospective, multicenter, observational trial of the care provided by hospitalists to patients admitted to general medical services at 6 academic medical institutions. There were 31,000 consecutive admissions to the general medical services of these participating sites: University of Chicago (Chicago, IL), University of Wisconsin Hospital (Madison, WI), University of Iowa (Iowa City, IA), University of California at San Francisco (San Francisco, CA), University of New Mexico (Albuquerque, NM), and Brigham and Women's Hospital (Boston, MA). The study was approved by the institutional review boards (IRBs) at each of the 6 participating institutions.
MCH Study Patients
Patients were eligible if they were admitted to the general medical services under the care of a hospitalist or nonhospitalist physician. Regardless of the admitting provider, each medical service was composed of rotating senior and junior resident physicians in all 6 sites. Furthermore, patients were 18 years of age or older, and were able to give consent themselves or had an appropriate proxy. Patients with mini‐mental status score of 17 (out of 22), admitted under their primary care physician or to an inpatient gastroenterology service, or transferred from another hospital, were excluded. The MCH study was designed to study the outcomes and efficiency in patients admitted for CHF, pneumonia, UGIH, and end‐of‐life care.
Acute UGIH Patients
Within the MCH‐eligible patients, we identified those with acute UGIH using the following International Classification of Diseases, 9th edition (ICD‐9) codes assigned at discharge: esophageal varices with hemorrhage (456.0, 456.20); Mallory‐Weiss syndrome (530.7); gastric ulcer with hemorrhage (531.00531.61); duodenal ulcer with hemorrhage (532.00532.61); peptic ulcer, site unspecified, with hemorrhage (533.00533.61); gastrojejunal ulcer with hemorrhage (534.00534.61); gastritis with hemorrhage (535.61); angiodysplasia of stomach/duodenum with hemorrhage (537.83); and hematemesis (578.0, 578.9). We also confirmed the diagnosis of UGIH by reviewing patient medical records for observed hematemesis, nasogastric tube aspirate with gross or hemoccult blood, or clinical history of hematemesis, melena, or hematochezia.14, 15
Data
All data were obtained from the 6 hospitals' administrative records, patient interviews, and medical chart abstractions. Dates of admission and discharge, ICD‐9 diagnosis codes, insurance type, age, race, and gender were obtained from administrative data. One‐month follow‐up telephone interviews assessed whether or not patient had any follow‐up appointment or hospital readmissions. Trained abstractors from each site performed manual chart reviews using a standard data collection sheet. The ICD‐9 code designation and chart abstraction methodology were developed prior to the initiation of the study to ensure consistent data collection and reduce bias.
The following data elements were collected: comorbidities, endoscopic findings, inpatient mortality, clinical evidence of rebleeding, endoscopic treatment or gastrointestinal (GI) surgery to control bleeding, repeat EGD, ICU transfer, decompensated comorbid illness requiring continued hospitalization, and blood transfusion (packed red cells, plasma, platelets). Clinical evidence of rebleeding was defined as either hematemesis or melena with decrease in hemoglobin of 2 g in 24 hours with or without hemodynamic compromise.14, 15 For the purpose of this study, recurrent bleeding was defined as clinical evidence of rebleeding, emergency GI surgery for control of UGIH, or repeat EGD before discharge. Furthermore, a composite endpoint termed total complications encompassed all adverse outcomes related to the UGIH hospitalization. The 30‐day readmission variable was defined using readmission identified in administrative records and a 30‐day follow‐up phone call. To guard against recall bias, self‐report data was only included for nonsite admissions.
We defined efficiency in terms of costs and LOS. Total hospital costs were measured using the TSI cost accounting system (Transition Systems, Inc., Boston, MA; now Eclipsys Corporation)16, 17 at 5 out of the 6 participating sites. TSI is a hospital cost accounting software system that integrates resource utilization and financial data already recorded in other hospital databases (such as the billing system, payroll system, and general ledger system).17 Hospital LOS was defined as the number of days from patient admission to the general medicine service until patient discharge.
Provider Specialization: Hospitalists vs. Nonhospitalists
The study was designed as a natural experiment based on a call cycle. The hospitalist‐led teams at each institution alternated in a 4‐day or 5‐day general medicine call cycle with teams led by traditional academic internal medicine attending physicians. All patients were assigned to teams according to their position in the call cycle without regard to whether the attending physician was a hospitalist or a nonhospitalist. Hospitalists are physicians whose primary professional focus is the general medical care of hospitalized patients.18, 19 As previously reported in a related MCH work,11 a hospitalist was also defined as a provider who spends at least 25% of his or her time on an academic inpatient general medicine service. Nonhospitalist physicians were most often outpatient general internal medicine faculty or subspecialists, who attended 1 month per year. Physicians were classified as hospitalists or nonhospitalists according to the designations provided by each site.
UGIH‐specific Confounders
From chart abstraction, we captured severity of illness, comorbidity, and performance of early EGD, variables that can confound analysis in UGIH. To capture severity of illness, a complete Rockall risk score was calculated for each patient. The complete Rockall uses 3 clinical variables (age, shock, and comorbidity) and 2 endoscopic variables (endoscopic diagnosis and stigmata of recent hemorrhage).5, 20 A complete Rockall score of 2 is considered low‐risk for rebleeding or death following admission.21, 22 The accepted definition of low‐risk is <5% recurrent bleeding and <1% mortality risk. A complete Rockall score of 3 to 5 is considered moderate‐risk while 6 is considered high‐risk. Comorbidity was measured using the Charlson comorbidity index.23 Performance of early endoscopy, usually defined as endoscopy performed within 24 hours from presentation, was previously shown to decrease LOS and need for surgical intervention in patients with acute UGIH.24, 25 Documented times of presentation to the emergency department and time of endoscopy performance were collected to calculate for the rate of early endoscopy in our study population.
Statistical Analysis
All statistical analyses were performed using SAS Version 9.1 for Windows (SAS Institute, Cary, NC).
Differences in baseline demographic characteristics of patients and their endoscopic findings were compared between the 2 types of providers. Univariate analyses were also performed to compare the differences in adverse outcomes, LOS, and costs between patients cared for by hospitalists and nonhospitalists. Chi‐square tests were used for categorical variables; while both Wilcoxon rank sum test and Student's t test were used in the analysis of continuous variables.
Next, we performed multivariable analyses to determine the independent association between hospitalist care and the odds of the patients having certain outcomes. However, to prevent overfitting, we only developed regression models for adverse outcomes that have at least 20% event rate.
Multivariable regression models were developed separately for LOS and costs. In contrast with the models on outcomes, analyses of LOS and costs were restricted to: (1) patients who were discharged alive; and (2) to cases with LOS and costs values within 3 standard deviations (SDs) of the mean because of the skewed nature of these data.
All models were adjusted for age, gender, race, insurance type, complete Rockall risk score, performance of early EGD, Charlson comorbidity index, and study site. Final candidate variables in the models were chosen based on stepwise selection, a method very similar to forward selection except that variables selected for the model do not necessarily remain in the model. Effects were entered into and then removed from the model in such a way that each forward selection step can be followed by 1 or more backward elimination steps. The stepwise selection was terminated if no further effect can be added to the model or if the current model was identical to the previous model. The stepwise selection model was generated using statistical criterion of alpha = 0.05 for entry and elimination from the model. Variables that can be a profound source of variation, such as study site and treating physician, were included in the model irrespective of their statistical significance.
To account for clustering of patients treated by the same physician, we used multilevel modeling with SAS PROC GLIMMIX (with random effects). For outcomes (categorical variables), we utilized models with logit‐link and binomial‐distributed errors. As for efficiency (continuous variables with skewed distribution), the multivariable analyses used a generalized linear model with log‐link and assuming gamma‐distributed errors.
Results
Patient Characteristics and Endoscopic Diagnoses
Out of 31,000 patients, the study identified a total of 566 patients (1.8%) with acute UGIH (Table 1). However, 116 patients transferred from another hospital were excluded as their initial management was provided elsewhere, giving a final study sample of 450 patients. Overall, there are 163 admitting physicians from 6 sites, with 39 (24%) classified as hospitalists and 124 (76%) as nonhospitalists. Forty‐two percent (177/450) of patients were cared for by hospitalists. Compared to nonhospitalists, patients admitted to the hospitalist service were older (62.8 vs. 57.7 years, P < 0.01) and with third‐party payor mix differences (P < 0.01). However, there were no statistical differences between patients attended by hospitalists and nonhospitalists with regard to Complete Rockall risk score, Charlson comorbidity index, performance of early endoscopy, and mean hemoglobin values on admission. Upper endoscopy was performed in all patients with distribution of the 3 most common diagnoses being similar (P > 0.05) between hospitalists and nonhospitalists: erosive disease (49.7% vs. 54.6%), peptic ulcer disease (PUD) (48% vs. 46.9%), and varices (18.6% vs. 14.7%).
| Variable | Admitting Service | P | |
|---|---|---|---|
| Hospitalist (n = 177) | Nonhospitalist (n = 273) | ||
| |||
| Age, years (meanSD) | 62.817.4 | 57.718.5 | <0.01 |
| Male sex, n (%) | 104 (58.8) | 169 (61.9) | 0.50 |
| Ethnicity, n (%) | 0.13 | ||
| White | 83 (46.9) | 102 (37.4) | |
| African‐American | 34 (19.2) | 75 (27.5) | |
| Hispanic | 21 (11.9) | 40 (14.7) | |
| Asian/Pacific Islander | 24 (13.6) | 29 (10.6) | |
| Others/unknown | 15 (8.5) | 27 (9.9) | |
| Insurance, n (%) | <0.01 | ||
| Medicare | 86 (48.6) | 104 (38.1) | |
| Medicaid | 15 (8.5) | 33 (12.1) | |
| No payer | 18 (10.2) | 36 (13.2) | |
| Private | 46 (26) | 52 (19.1) | |
| Unknown | 12 (6.8) | 48 (17.5) | |
| Charlson Comorbidity Index (meanSD) | 1.91.6 | 1.81.7 | 0.51 |
| Complete Rockall, n (%) | 0.11 | ||
| Low‐risk (0‐2) | 82 (46.3) | 103 (37.7) | |
| Moderate‐risk (3‐5) | 71 (40.1) | 137 (50.2) | |
| High‐risk (6) | 24 (14.6) | 33 (12.1) | |
| Early endoscopy (<24 hours) | 82 (46.3) | 133 (48.7) | 0.62 |
| Endoscopic diagnosis, n (%)* | |||
| Erosive disease | 88 (49.7) | 149 (54.6) | 0.31 |
| Peptic ulcer disease | 85 (48.0) | 128 (46.9) | 0.81 |
| Varices | 33 (18.6) | 40 (14.7) | 0.26 |
| Mallory‐Weiss tear | 9 (5.1) | 21 (7.7) | 0.28 |
| Angiodysplasia | 9 (5.1) | 13 (4.8) | 0.88 |
| GI mass | 1 (0.6) | 4 (1.5) | 0.65 |
| Normal | 7 (4.0) | 8 (2.9) | 0.55 |
| Admission hemoglobin values (meanSD) | 10.22.9 | 10.22.9 | 0.78 |
Clinical Outcomes
Between hospitalists and nonhospitalists, unadjusted outcomes were similar (P > 0.05) for mortality (2.3% vs. 0.4%), recurrent bleeding (11% vs. 11%), need for endoscopic therapy (24% vs. 22%), ICU‐transfer and decompensation (15% vs. 15%), as well as an overall composite measure of any complication (79% vs. 72%) (Table 2). However, the hospitalist‐led teams performed more blood transfusions (74% vs. 63%, P = 0.02) and readmission rates were higher (7.3% vs. 3.3%, P = 0.05).
| Outcomes, n (%) | Admitting Service | P | |
|---|---|---|---|
| Hospitalist (n = 177) | Nonhospitalist (n = 273) | ||
| |||
| Inpatient mortality | 4 (2.3) | 1 (0.4) | 0.08 |
| Recurrent bleeding* | 20 (11.3) | 29 (10.6) | 0.88 |
| Endoscopic therapy | 43 (24.3) | 60 (22.0) | 0.57 |
| ICU transfers | 23 (13) | 24 (8.8) | 0.20 |
| Decompensated comorbidities that required continued hospitalization | 26 (14.7) | 41 (15.0) | 0.92 |
| Any transfusion | 131 (74.0) | 172 (63.0) | 0.02 |
| Total complications | 139 (78.5) | 196 (71.8) | 0.11 |
| 30‐day all‐cause readmissions | 13 (7.3) | 9 (3.3) | 0.05 |
| Efficiency | Hospitalist (n = 164) | Nonhospitalist (n = 259) | P |
| LOS, days | |||
| MeanSD | 4.83.5 | 4.53.0 | 0.30 |
| Median (interquartile range) | 4 (36) | 4 (26) | 0.69 |
| Total costs, U.S. $ | |||
| MeanSD | 10,466.669191.00 | 7926.716065.00 | <0.01 |
| Median (interquartile range) | 7359.00 (4,698.0012,550.00) | 6181.00 (3744.0010,344.00) | <0.01 |
Because of the low event rate of certain adverse outcomes (<20%), we were only able to perform adjusted analyses on 4 outcomes: need for endoscopic therapy (odds ratio [OR], 0.82; 95% confidence interval [CI], 0.491.37), ICU transfer and decompensation (OR, 0.82; 95% CI, 0.451.52), blood transfusion (OR, 1.30; 95% CI, 0.822.04), and any complication (OR, 1.18; 95% CI, 0.711.96). Since outcome differences disappeared after controlling for confounders, the data suggest that overall care provided by hospitalists and nonhospitalists might be equivalenteven in certain outcomes that we were unable to substantiate using multivariable methods.
Efficiency
Efficiency, as measured by LOS and costs, are presented both as means and medians in univariate analyses in Table 2. Median LOS was similar for hospitalist‐led and nonhospitalist‐led teams (4 days). Despite having similar LOS, the median costs of acute UGIH in patients cared for by hospitalists were higher ($7,359.00 vs. $6,181.00; P < 0.01).
After adjusting for demographic factors, Rockall risk score, comorbidity, early EGD, and hospital site, LOS remained similar between the 2 groups. On the other hand, the adjusted cost for UGIH patients cared for by hospitalists and nonhospitalists persisted, with hospitalist care costs $1,502.40 more than their nonhospitalist counterparts (Table 3).
| Efficiency | Treatment Provider | P | |
|---|---|---|---|
| Hospitalist (n = 164) | Nonhospitalist (n = 259) | ||
| |||
| Adjusted length of stay, days (mean SD) | 5.2 (4.95.6) | 4.7 (4.55.0) | 0.15 |
| Adjusted total cost, U.S. $ (mean SD) | 9006.50 (8366.609693.60) | 7504.10 (7069.907964.20) | 0.03 |
Discussion
This is the first study that has looked at the effect of hospitalists on clinical outcomes and efficiency in patients admitted for acute UGIH, a condition highly dependent upon another specialty for procedures and management. This is also one of only a few studies on UGIH that adjusted for severity of illness (Rockall score), comorbidity, performance of early endoscopypatient‐level confounders usually unaccounted for in prior research.
We show that hospitalists and nonhospitalists caring for acute UGIH patients had overall similar unadjusted outcomes; except for blood transfusion and 30‐day readmission rates. Unfortunately, due to the small number of events for readmissions, we were unable to perform adjusted analysis for readmission. Differences between hospitalists and nonhospitalists on blood transfusion rates were not substantiated on multivariable adjustments.
As for efficiency, univariable and multivariable analyses revealed that LOS was similar between provider types while costs were greater in UGIH patients attended by hospitalists.
Reductions in resource use, particularly costs, may be achieved by increasing throughput (eg, reducing LOS) or by decreasing service intensity (eg, using fewer ancillary services and specialty consultations).26 Specifically in acute UGIH, LOS is significantly affected by performance of early EGD.27, 28 In these studies, gastroenterologist‐led teams, compared to internists and surgeons, have easier access to endoscopy, thus reducing LOS and overall costs.27, 28
Similarly, prior studies have shown that the mechanism by which hospitalists lower costs is by decreasing LOS.810, 29 There are several hypotheses on how hospitalists affect LOS. Hospitalists, by being available all day, are thought to respond quickly to acute symptoms or new test results, are more efficient in navigating the complex hospital environment, or develop greater expertise as a result of added inpatient experience.8 On the downside, although the hospitalist model reduces overall LOS and costs, they also provide higher intensity of care as reflected by greater costs when broken down per hospital day.29 Thus, the cost differential we found may represent higher intensity of care by hospitalists in their management of acute UGIH, as higher intensity care without decreasing LOS can translate to higher costs.
In addition, patients with acute UGIH are unique in several respects. In contrast to diseases like heart failure, COPD, and pneumonia, in which the admitting provider has the option to request a subspecialist consultation, all patients with acute UGIH need a gastroenterologist to perform endoscopy as part of the management. These patients are usually admitted to general medicine wards, aggressively resuscitated with intravenous fluids, with a nonurgent gastroenterology consult or EGD performed on the next available schedule.
Aside from LOS being greatly affected by performance of early EGD and/or delay in consulting gastroenterology, sicker patients require longer hospitalization and drive LOS and healthcare costs up. It was therefore crucial that we accounted for severity of illness, comorbidity, and performance of early EGD in our regression models for LOS and costs. This approach allows us to acquire a more accurate estimate on the effects of hospitalist on LOS and costs in patients admitted with acute UGIH.
Our findings suggest that the academic hospitalist model of care may not have as great of an impact on hospital efficiency in certain patient groups that require nonurgent subspecialty consultations. Future studies should focus on elucidating these relationships.
Limitations
This study has several limitations. First, clinical data were abstracted at 6 sites by different abstractors so it is possible there were variations in how data were collected. To reduce variation, a standardized abstraction form with instructions was developed and the primary investigator (PI) was available for specific questions during the abstraction process. Second, only 5 out of the 6 sites used TSI accounting systems. Although similar, interhospital costs captured by TSI may vary among sites in terms of classifying direct and indirect costs, potentially resulting in misclassification bias in our cost estimates.17 We addressed these issues by including the hospital site variable in our regression models, regardless of its significance. Third, consent rates across sites vary from 70% to 85%. It is possible that patients who refused enrollment in the MCH trial are systematically different and may introduce bias in our analysis.
Furthermore, the study was designed as a natural experiment based on a rotational call cycle between hospitalist‐led and nonhospitalist‐led teams. It is possible that the order of patient assignment might not be completely naturally random as we intended. However, the study period was for 2 years and we expect the effect of order would have averaged out in time.
There are many hospitalist models of care. In terms of generalizability, the study pertains only to academic hospitalists and may not be applicable to hospitalists practicing in community hospitals. For example, the nonhospitalist comparison group is likely different in the community and academic settings. Community nonhospitalists (traditional practitioners) are usually internists covering both inpatient and outpatient responsibilities at the same time. In contrast, academic nonhospitalists are internists or subspecialists serving as ward attendings for a limited period (usually 1 month) with considerable variation in their nonattending responsibilities (eg, research, clinic, administration). Furthermore, academic nonhospitalist providers might be a self‐selected group by their willingness to serve as a ward attending, making them more hospitalist‐like. Changes and variability of inpatient attendings may also affect our findings when compared to prior work. Finally, it is also possible that having residents at academic medical centers may attenuate the effect of hospitalists more than in community‐based models.
Conclusions/Implications
Compared to nonhospitalists, academic hospitalist care of acute UGIH patients had similar overall clinical outcomes. However, our finding of similar LOS yet higher costs for patients cared for by hospitalists support 1 proposed mechanism in which hospitalists decrease healthcare costs: providing higher intensity of care per day of hospitalization. However, in academic hospitalist models, this higher intensity hypothesis should be revisited, especially in certain patient groups in which timing and involvement of subspecialists may influence discharge decisions, affecting LOS and overall costs.
Due to inherent limitations in this observational study, future studies should focus on verifying and elucidating these relationships further. Lastly, understanding which patient groups receive the greatest potential benefit from this model will help guide both organizational efforts and quality improvement strategies.
- ,.Bleeding peptic ulcer.N Engl J Med.1994;331(11):717–727.
- .Epidemiology of hospitalization for acute upper gastrointestinal hemorrhage: a population‐based study.Am J Gastroenterol.1995;90(2):206–210.
- ,,, et al.Variation in outcome after acute upper gastrointestinal haemorrhage. the national audit of acute upper gastrointestinal haemorrhage.Lancet.1995;346(8971):346–350.
- ,,, et al.Influencing the practice and outcome in acute upper gastrointestinal haemorrhage. Steering committee of the National Audit of Acute Upper Gastrointestinal Haemorrhage.Gut.1997;41(5):606–611.
- ,,, et al.Risk assessment after acute upper gastrointestinal haemorrhage.Gut.1996;38(3):316–321.
- ,,, et al.The potential size of the hospitalist workforce in the united states.Am J Med.1999;106(4):441–445.
- Society of Hospital Medicine. About SHM. Available at: http://www.hospitalmedicine.org/AM/Template.cfm?Section=General_Information357(25):2589–2600.
- ,,, et al.Effects of physician experience on costs and outcomes on an academic general medicine service: results of a trial of hospitalists.Ann Intern Med.2002;137(11):866–874.
- .A systematic review of outcomes and quality measures in adult patients cared for by hospitalists vs nonhospitalists.Mayo Clin Proc.2009;84(3):248–254.
- ,,, et al.Do hospitalists or physicians with greater inpatient HIV experience improve HIV care in the era of highly active antiretroviral therapy? Results from a multicenter trial of academic hospitalists.Clin Infect Dis.2008;46(7):1085–1092.
- ,,, et al.Quality of care for decompensated heart failure: comparable performance between academic hospitalists and non‐hospitalists. J Gen Intern Med.2008;23(9):1399–1406.
- ,,, et al.Factors associated with discussion of care plans and code status at the time of hospital admission: results from the Multicenter Hospitalist Study.J Hosp Med.2008;3(6):437–445.
- ,,, et al.Upper gastrointestinal hemorrhage clinical guideline determining the optimal hospital length of stay.Am J Med.1996;100(3):313–322.
- ,,, et al.Prospective evaluation of a clinical guideline recommending hospital length of stay in upper gastrointestinal tract hemorrhage.JAMA.1997;278(24):2151–2156.
- ,,, et al.In‐hospital cost of abdominal aortic aneurysm repair in Canada and the United States.Arch Intern Med.2003;163(20):2500–2504.
- ,,, et al.The use of transition cost accounting system in health services research.Cost Eff Resour Alloc.2007;5:11.
- Society of Hospital Medicine. Definition of a Hospitalist. Available at: http://www.hospitalmedicine.org/AM/Template.cfm?Section=General_Information335(7):514–517.
- ,,, et al.Selection of patients for early discharge or outpatient care after acute upper gastrointestinal haemorrhage. National Audit of Acute Upper Gastrointestinal Haemorrhage.Lancet.1996;347(9009):1138–1140.
- ,,, et al.Utilization of health care resources for low‐risk patients with acute, nonvariceal upper GI hemorrhage: an historical cohort study.Gastrointest Endosc.2002;55(3):321–327.
- ,.Incremental value of upper endoscopy for triage of patients with acute non‐variceal upper‐GI hemorrhage.Gastrointest Endosc.2004;60(1):9–14.
- ,,, et al.The Charlson comorbidity index is adapted to predict costs of chronic disease in primary care patients.J Clin Epidemiol.2008;61(12):1234–1240.
- ,,, et al.The effectiveness of early endoscopy for upper gastrointestinal hemorrhage: a community‐based analysis.Med Care.1998;36(4):462–474.
- ,,, et al.Early endoscopy in upper gastrointestinal hemorrhage: associations with recurrent bleeding, surgery, and length of hospital stay.Gastrointest Endosc.1999;49(2):145–152.
- ,.The impact of hospitalists on the cost and quality of inpatient care in the united states: a research synthesis.Med Care Res Rev.2005;62(4):379–406.
- ,,, et al.Physician specialty and variations in the cost of treating patients with acute upper gastrointestinal bleeding.Gastroenterology.1997;113(5):1443–1448.
- ,,, et al.Impact of physician specialty on the cost of nonvariceal upper GI bleeding care.Am J Gastroenterol.2002;97(6):1535–1542.
- ,,.Associations with reduced length of stay and costs on an academic hospitalist service.Am J Manag Care.2004;10(8):561–568.
Acute upper gastrointestinal hemorrhage (UGIH) is one of the most common hospital admissions for acute care. Estimates indicate that 300,000 patients (100‐150 cases per 100,000 adults) are admitted annually with an associated economic impact of $2.5 billion.15 The current standard management of UGIH requires hospital admission and esophagogastroduodenoscopy (EGD) by a gastroenterologist for diagnosis and/or treatment. This management strategy results in a high consumption of hospital resources and costs.
Simultaneously, hospitalists have dramatically changed the delivery of inpatient care in the United States and are recognized as a location‐driven subspecialty for the care of acute hospitalized patients, similar to emergency medicine. Currently there are 20,000 hospitalists, and more than one‐third of general medicine inpatients are cared for by hospitalists.6, 7
Previous studies have shown that hospitalist care offers better or comparable outcomes, with lower overall length of stay (LOS) and costs compared to traditional providers.810 However, most of these studies were performed in single institutions, had weak designs or little‐to‐no adjustment for severity of illness, or were limited to 7 specific diseases (pneumonia, congestive heart failure [CHF], chest pain, ischemic stroke, urinary tract infection, chronic obstructive lung disease [COPD], and acute myocardial infarction [AMI]).8
Furthermore, less is known about the effect of hospitalists on conditions that may be dependent upon specialist consultation for procedures and/or treatment plans. In this study, gastroenterologists performed diagnostic and/or therapeutic endoscopy work as consultants to the attending physicians in the management of acute inpatient UGIH.
To explore the effects of hospitalists on care of patients with acute UGIH, we examined data from the Multicenter Hospitalist (MCH) trial. The objectives of our study were to compare clinical outcomesin‐hospital mortality and complications (ie, recurrent bleeding, intensive care unit [ICU] transfer, decompensation, transfusion, reendoscopy, 30‐day readmission)and efficiency (LOS and costs) in hospitalized acute UGIH patients cared for by hospitalists and nonhospitalists in 6 academic centers in the United States during a 2‐year period.
Patients and Methods
Study Sites
From July 1, 2001 to June 30, 2003, the MCH trial1113 was a prospective, multicenter, observational trial of the care provided by hospitalists to patients admitted to general medical services at 6 academic medical institutions. There were 31,000 consecutive admissions to the general medical services of these participating sites: University of Chicago (Chicago, IL), University of Wisconsin Hospital (Madison, WI), University of Iowa (Iowa City, IA), University of California at San Francisco (San Francisco, CA), University of New Mexico (Albuquerque, NM), and Brigham and Women's Hospital (Boston, MA). The study was approved by the institutional review boards (IRBs) at each of the 6 participating institutions.
MCH Study Patients
Patients were eligible if they were admitted to the general medical services under the care of a hospitalist or nonhospitalist physician. Regardless of the admitting provider, each medical service was composed of rotating senior and junior resident physicians in all 6 sites. Furthermore, patients were 18 years of age or older, and were able to give consent themselves or had an appropriate proxy. Patients with mini‐mental status score of 17 (out of 22), admitted under their primary care physician or to an inpatient gastroenterology service, or transferred from another hospital, were excluded. The MCH study was designed to study the outcomes and efficiency in patients admitted for CHF, pneumonia, UGIH, and end‐of‐life care.
Acute UGIH Patients
Within the MCH‐eligible patients, we identified those with acute UGIH using the following International Classification of Diseases, 9th edition (ICD‐9) codes assigned at discharge: esophageal varices with hemorrhage (456.0, 456.20); Mallory‐Weiss syndrome (530.7); gastric ulcer with hemorrhage (531.00531.61); duodenal ulcer with hemorrhage (532.00532.61); peptic ulcer, site unspecified, with hemorrhage (533.00533.61); gastrojejunal ulcer with hemorrhage (534.00534.61); gastritis with hemorrhage (535.61); angiodysplasia of stomach/duodenum with hemorrhage (537.83); and hematemesis (578.0, 578.9). We also confirmed the diagnosis of UGIH by reviewing patient medical records for observed hematemesis, nasogastric tube aspirate with gross or hemoccult blood, or clinical history of hematemesis, melena, or hematochezia.14, 15
Data
All data were obtained from the 6 hospitals' administrative records, patient interviews, and medical chart abstractions. Dates of admission and discharge, ICD‐9 diagnosis codes, insurance type, age, race, and gender were obtained from administrative data. One‐month follow‐up telephone interviews assessed whether or not patient had any follow‐up appointment or hospital readmissions. Trained abstractors from each site performed manual chart reviews using a standard data collection sheet. The ICD‐9 code designation and chart abstraction methodology were developed prior to the initiation of the study to ensure consistent data collection and reduce bias.
The following data elements were collected: comorbidities, endoscopic findings, inpatient mortality, clinical evidence of rebleeding, endoscopic treatment or gastrointestinal (GI) surgery to control bleeding, repeat EGD, ICU transfer, decompensated comorbid illness requiring continued hospitalization, and blood transfusion (packed red cells, plasma, platelets). Clinical evidence of rebleeding was defined as either hematemesis or melena with decrease in hemoglobin of 2 g in 24 hours with or without hemodynamic compromise.14, 15 For the purpose of this study, recurrent bleeding was defined as clinical evidence of rebleeding, emergency GI surgery for control of UGIH, or repeat EGD before discharge. Furthermore, a composite endpoint termed total complications encompassed all adverse outcomes related to the UGIH hospitalization. The 30‐day readmission variable was defined using readmission identified in administrative records and a 30‐day follow‐up phone call. To guard against recall bias, self‐report data was only included for nonsite admissions.
We defined efficiency in terms of costs and LOS. Total hospital costs were measured using the TSI cost accounting system (Transition Systems, Inc., Boston, MA; now Eclipsys Corporation)16, 17 at 5 out of the 6 participating sites. TSI is a hospital cost accounting software system that integrates resource utilization and financial data already recorded in other hospital databases (such as the billing system, payroll system, and general ledger system).17 Hospital LOS was defined as the number of days from patient admission to the general medicine service until patient discharge.
Provider Specialization: Hospitalists vs. Nonhospitalists
The study was designed as a natural experiment based on a call cycle. The hospitalist‐led teams at each institution alternated in a 4‐day or 5‐day general medicine call cycle with teams led by traditional academic internal medicine attending physicians. All patients were assigned to teams according to their position in the call cycle without regard to whether the attending physician was a hospitalist or a nonhospitalist. Hospitalists are physicians whose primary professional focus is the general medical care of hospitalized patients.18, 19 As previously reported in a related MCH work,11 a hospitalist was also defined as a provider who spends at least 25% of his or her time on an academic inpatient general medicine service. Nonhospitalist physicians were most often outpatient general internal medicine faculty or subspecialists, who attended 1 month per year. Physicians were classified as hospitalists or nonhospitalists according to the designations provided by each site.
UGIH‐specific Confounders
From chart abstraction, we captured severity of illness, comorbidity, and performance of early EGD, variables that can confound analysis in UGIH. To capture severity of illness, a complete Rockall risk score was calculated for each patient. The complete Rockall uses 3 clinical variables (age, shock, and comorbidity) and 2 endoscopic variables (endoscopic diagnosis and stigmata of recent hemorrhage).5, 20 A complete Rockall score of 2 is considered low‐risk for rebleeding or death following admission.21, 22 The accepted definition of low‐risk is <5% recurrent bleeding and <1% mortality risk. A complete Rockall score of 3 to 5 is considered moderate‐risk while 6 is considered high‐risk. Comorbidity was measured using the Charlson comorbidity index.23 Performance of early endoscopy, usually defined as endoscopy performed within 24 hours from presentation, was previously shown to decrease LOS and need for surgical intervention in patients with acute UGIH.24, 25 Documented times of presentation to the emergency department and time of endoscopy performance were collected to calculate for the rate of early endoscopy in our study population.
Statistical Analysis
All statistical analyses were performed using SAS Version 9.1 for Windows (SAS Institute, Cary, NC).
Differences in baseline demographic characteristics of patients and their endoscopic findings were compared between the 2 types of providers. Univariate analyses were also performed to compare the differences in adverse outcomes, LOS, and costs between patients cared for by hospitalists and nonhospitalists. Chi‐square tests were used for categorical variables; while both Wilcoxon rank sum test and Student's t test were used in the analysis of continuous variables.
Next, we performed multivariable analyses to determine the independent association between hospitalist care and the odds of the patients having certain outcomes. However, to prevent overfitting, we only developed regression models for adverse outcomes that have at least 20% event rate.
Multivariable regression models were developed separately for LOS and costs. In contrast with the models on outcomes, analyses of LOS and costs were restricted to: (1) patients who were discharged alive; and (2) to cases with LOS and costs values within 3 standard deviations (SDs) of the mean because of the skewed nature of these data.
All models were adjusted for age, gender, race, insurance type, complete Rockall risk score, performance of early EGD, Charlson comorbidity index, and study site. Final candidate variables in the models were chosen based on stepwise selection, a method very similar to forward selection except that variables selected for the model do not necessarily remain in the model. Effects were entered into and then removed from the model in such a way that each forward selection step can be followed by 1 or more backward elimination steps. The stepwise selection was terminated if no further effect can be added to the model or if the current model was identical to the previous model. The stepwise selection model was generated using statistical criterion of alpha = 0.05 for entry and elimination from the model. Variables that can be a profound source of variation, such as study site and treating physician, were included in the model irrespective of their statistical significance.
To account for clustering of patients treated by the same physician, we used multilevel modeling with SAS PROC GLIMMIX (with random effects). For outcomes (categorical variables), we utilized models with logit‐link and binomial‐distributed errors. As for efficiency (continuous variables with skewed distribution), the multivariable analyses used a generalized linear model with log‐link and assuming gamma‐distributed errors.
Results
Patient Characteristics and Endoscopic Diagnoses
Out of 31,000 patients, the study identified a total of 566 patients (1.8%) with acute UGIH (Table 1). However, 116 patients transferred from another hospital were excluded as their initial management was provided elsewhere, giving a final study sample of 450 patients. Overall, there are 163 admitting physicians from 6 sites, with 39 (24%) classified as hospitalists and 124 (76%) as nonhospitalists. Forty‐two percent (177/450) of patients were cared for by hospitalists. Compared to nonhospitalists, patients admitted to the hospitalist service were older (62.8 vs. 57.7 years, P < 0.01) and with third‐party payor mix differences (P < 0.01). However, there were no statistical differences between patients attended by hospitalists and nonhospitalists with regard to Complete Rockall risk score, Charlson comorbidity index, performance of early endoscopy, and mean hemoglobin values on admission. Upper endoscopy was performed in all patients with distribution of the 3 most common diagnoses being similar (P > 0.05) between hospitalists and nonhospitalists: erosive disease (49.7% vs. 54.6%), peptic ulcer disease (PUD) (48% vs. 46.9%), and varices (18.6% vs. 14.7%).
| Variable | Admitting Service | P | |
|---|---|---|---|
| Hospitalist (n = 177) | Nonhospitalist (n = 273) | ||
| |||
| Age, years (meanSD) | 62.817.4 | 57.718.5 | <0.01 |
| Male sex, n (%) | 104 (58.8) | 169 (61.9) | 0.50 |
| Ethnicity, n (%) | 0.13 | ||
| White | 83 (46.9) | 102 (37.4) | |
| African‐American | 34 (19.2) | 75 (27.5) | |
| Hispanic | 21 (11.9) | 40 (14.7) | |
| Asian/Pacific Islander | 24 (13.6) | 29 (10.6) | |
| Others/unknown | 15 (8.5) | 27 (9.9) | |
| Insurance, n (%) | <0.01 | ||
| Medicare | 86 (48.6) | 104 (38.1) | |
| Medicaid | 15 (8.5) | 33 (12.1) | |
| No payer | 18 (10.2) | 36 (13.2) | |
| Private | 46 (26) | 52 (19.1) | |
| Unknown | 12 (6.8) | 48 (17.5) | |
| Charlson Comorbidity Index (meanSD) | 1.91.6 | 1.81.7 | 0.51 |
| Complete Rockall, n (%) | 0.11 | ||
| Low‐risk (0‐2) | 82 (46.3) | 103 (37.7) | |
| Moderate‐risk (3‐5) | 71 (40.1) | 137 (50.2) | |
| High‐risk (6) | 24 (14.6) | 33 (12.1) | |
| Early endoscopy (<24 hours) | 82 (46.3) | 133 (48.7) | 0.62 |
| Endoscopic diagnosis, n (%)* | |||
| Erosive disease | 88 (49.7) | 149 (54.6) | 0.31 |
| Peptic ulcer disease | 85 (48.0) | 128 (46.9) | 0.81 |
| Varices | 33 (18.6) | 40 (14.7) | 0.26 |
| Mallory‐Weiss tear | 9 (5.1) | 21 (7.7) | 0.28 |
| Angiodysplasia | 9 (5.1) | 13 (4.8) | 0.88 |
| GI mass | 1 (0.6) | 4 (1.5) | 0.65 |
| Normal | 7 (4.0) | 8 (2.9) | 0.55 |
| Admission hemoglobin values (meanSD) | 10.22.9 | 10.22.9 | 0.78 |
Clinical Outcomes
Between hospitalists and nonhospitalists, unadjusted outcomes were similar (P > 0.05) for mortality (2.3% vs. 0.4%), recurrent bleeding (11% vs. 11%), need for endoscopic therapy (24% vs. 22%), ICU‐transfer and decompensation (15% vs. 15%), as well as an overall composite measure of any complication (79% vs. 72%) (Table 2). However, the hospitalist‐led teams performed more blood transfusions (74% vs. 63%, P = 0.02) and readmission rates were higher (7.3% vs. 3.3%, P = 0.05).
| Outcomes, n (%) | Admitting Service | P | |
|---|---|---|---|
| Hospitalist (n = 177) | Nonhospitalist (n = 273) | ||
| |||
| Inpatient mortality | 4 (2.3) | 1 (0.4) | 0.08 |
| Recurrent bleeding* | 20 (11.3) | 29 (10.6) | 0.88 |
| Endoscopic therapy | 43 (24.3) | 60 (22.0) | 0.57 |
| ICU transfers | 23 (13) | 24 (8.8) | 0.20 |
| Decompensated comorbidities that required continued hospitalization | 26 (14.7) | 41 (15.0) | 0.92 |
| Any transfusion | 131 (74.0) | 172 (63.0) | 0.02 |
| Total complications | 139 (78.5) | 196 (71.8) | 0.11 |
| 30‐day all‐cause readmissions | 13 (7.3) | 9 (3.3) | 0.05 |
| Efficiency | Hospitalist (n = 164) | Nonhospitalist (n = 259) | P |
| LOS, days | |||
| MeanSD | 4.83.5 | 4.53.0 | 0.30 |
| Median (interquartile range) | 4 (36) | 4 (26) | 0.69 |
| Total costs, U.S. $ | |||
| MeanSD | 10,466.669191.00 | 7926.716065.00 | <0.01 |
| Median (interquartile range) | 7359.00 (4,698.0012,550.00) | 6181.00 (3744.0010,344.00) | <0.01 |
Because of the low event rate of certain adverse outcomes (<20%), we were only able to perform adjusted analyses on 4 outcomes: need for endoscopic therapy (odds ratio [OR], 0.82; 95% confidence interval [CI], 0.491.37), ICU transfer and decompensation (OR, 0.82; 95% CI, 0.451.52), blood transfusion (OR, 1.30; 95% CI, 0.822.04), and any complication (OR, 1.18; 95% CI, 0.711.96). Since outcome differences disappeared after controlling for confounders, the data suggest that overall care provided by hospitalists and nonhospitalists might be equivalenteven in certain outcomes that we were unable to substantiate using multivariable methods.
Efficiency
Efficiency, as measured by LOS and costs, are presented both as means and medians in univariate analyses in Table 2. Median LOS was similar for hospitalist‐led and nonhospitalist‐led teams (4 days). Despite having similar LOS, the median costs of acute UGIH in patients cared for by hospitalists were higher ($7,359.00 vs. $6,181.00; P < 0.01).
After adjusting for demographic factors, Rockall risk score, comorbidity, early EGD, and hospital site, LOS remained similar between the 2 groups. On the other hand, the adjusted cost for UGIH patients cared for by hospitalists and nonhospitalists persisted, with hospitalist care costs $1,502.40 more than their nonhospitalist counterparts (Table 3).
| Efficiency | Treatment Provider | P | |
|---|---|---|---|
| Hospitalist (n = 164) | Nonhospitalist (n = 259) | ||
| |||
| Adjusted length of stay, days (mean SD) | 5.2 (4.95.6) | 4.7 (4.55.0) | 0.15 |
| Adjusted total cost, U.S. $ (mean SD) | 9006.50 (8366.609693.60) | 7504.10 (7069.907964.20) | 0.03 |
Discussion
This is the first study that has looked at the effect of hospitalists on clinical outcomes and efficiency in patients admitted for acute UGIH, a condition highly dependent upon another specialty for procedures and management. This is also one of only a few studies on UGIH that adjusted for severity of illness (Rockall score), comorbidity, performance of early endoscopypatient‐level confounders usually unaccounted for in prior research.
We show that hospitalists and nonhospitalists caring for acute UGIH patients had overall similar unadjusted outcomes; except for blood transfusion and 30‐day readmission rates. Unfortunately, due to the small number of events for readmissions, we were unable to perform adjusted analysis for readmission. Differences between hospitalists and nonhospitalists on blood transfusion rates were not substantiated on multivariable adjustments.
As for efficiency, univariable and multivariable analyses revealed that LOS was similar between provider types while costs were greater in UGIH patients attended by hospitalists.
Reductions in resource use, particularly costs, may be achieved by increasing throughput (eg, reducing LOS) or by decreasing service intensity (eg, using fewer ancillary services and specialty consultations).26 Specifically in acute UGIH, LOS is significantly affected by performance of early EGD.27, 28 In these studies, gastroenterologist‐led teams, compared to internists and surgeons, have easier access to endoscopy, thus reducing LOS and overall costs.27, 28
Similarly, prior studies have shown that the mechanism by which hospitalists lower costs is by decreasing LOS.810, 29 There are several hypotheses on how hospitalists affect LOS. Hospitalists, by being available all day, are thought to respond quickly to acute symptoms or new test results, are more efficient in navigating the complex hospital environment, or develop greater expertise as a result of added inpatient experience.8 On the downside, although the hospitalist model reduces overall LOS and costs, they also provide higher intensity of care as reflected by greater costs when broken down per hospital day.29 Thus, the cost differential we found may represent higher intensity of care by hospitalists in their management of acute UGIH, as higher intensity care without decreasing LOS can translate to higher costs.
In addition, patients with acute UGIH are unique in several respects. In contrast to diseases like heart failure, COPD, and pneumonia, in which the admitting provider has the option to request a subspecialist consultation, all patients with acute UGIH need a gastroenterologist to perform endoscopy as part of the management. These patients are usually admitted to general medicine wards, aggressively resuscitated with intravenous fluids, with a nonurgent gastroenterology consult or EGD performed on the next available schedule.
Aside from LOS being greatly affected by performance of early EGD and/or delay in consulting gastroenterology, sicker patients require longer hospitalization and drive LOS and healthcare costs up. It was therefore crucial that we accounted for severity of illness, comorbidity, and performance of early EGD in our regression models for LOS and costs. This approach allows us to acquire a more accurate estimate on the effects of hospitalist on LOS and costs in patients admitted with acute UGIH.
Our findings suggest that the academic hospitalist model of care may not have as great of an impact on hospital efficiency in certain patient groups that require nonurgent subspecialty consultations. Future studies should focus on elucidating these relationships.
Limitations
This study has several limitations. First, clinical data were abstracted at 6 sites by different abstractors so it is possible there were variations in how data were collected. To reduce variation, a standardized abstraction form with instructions was developed and the primary investigator (PI) was available for specific questions during the abstraction process. Second, only 5 out of the 6 sites used TSI accounting systems. Although similar, interhospital costs captured by TSI may vary among sites in terms of classifying direct and indirect costs, potentially resulting in misclassification bias in our cost estimates.17 We addressed these issues by including the hospital site variable in our regression models, regardless of its significance. Third, consent rates across sites vary from 70% to 85%. It is possible that patients who refused enrollment in the MCH trial are systematically different and may introduce bias in our analysis.
Furthermore, the study was designed as a natural experiment based on a rotational call cycle between hospitalist‐led and nonhospitalist‐led teams. It is possible that the order of patient assignment might not be completely naturally random as we intended. However, the study period was for 2 years and we expect the effect of order would have averaged out in time.
There are many hospitalist models of care. In terms of generalizability, the study pertains only to academic hospitalists and may not be applicable to hospitalists practicing in community hospitals. For example, the nonhospitalist comparison group is likely different in the community and academic settings. Community nonhospitalists (traditional practitioners) are usually internists covering both inpatient and outpatient responsibilities at the same time. In contrast, academic nonhospitalists are internists or subspecialists serving as ward attendings for a limited period (usually 1 month) with considerable variation in their nonattending responsibilities (eg, research, clinic, administration). Furthermore, academic nonhospitalist providers might be a self‐selected group by their willingness to serve as a ward attending, making them more hospitalist‐like. Changes and variability of inpatient attendings may also affect our findings when compared to prior work. Finally, it is also possible that having residents at academic medical centers may attenuate the effect of hospitalists more than in community‐based models.
Conclusions/Implications
Compared to nonhospitalists, academic hospitalist care of acute UGIH patients had similar overall clinical outcomes. However, our finding of similar LOS yet higher costs for patients cared for by hospitalists support 1 proposed mechanism in which hospitalists decrease healthcare costs: providing higher intensity of care per day of hospitalization. However, in academic hospitalist models, this higher intensity hypothesis should be revisited, especially in certain patient groups in which timing and involvement of subspecialists may influence discharge decisions, affecting LOS and overall costs.
Due to inherent limitations in this observational study, future studies should focus on verifying and elucidating these relationships further. Lastly, understanding which patient groups receive the greatest potential benefit from this model will help guide both organizational efforts and quality improvement strategies.
- ,.Bleeding peptic ulcer.N Engl J Med.1994;331(11):717–727.
- .Epidemiology of hospitalization for acute upper gastrointestinal hemorrhage: a population‐based study.Am J Gastroenterol.1995;90(2):206–210.
- ,,, et al.Variation in outcome after acute upper gastrointestinal haemorrhage. the national audit of acute upper gastrointestinal haemorrhage.Lancet.1995;346(8971):346–350.
- ,,, et al.Influencing the practice and outcome in acute upper gastrointestinal haemorrhage. Steering committee of the National Audit of Acute Upper Gastrointestinal Haemorrhage.Gut.1997;41(5):606–611.
- ,,, et al.Risk assessment after acute upper gastrointestinal haemorrhage.Gut.1996;38(3):316–321.
- ,,, et al.The potential size of the hospitalist workforce in the united states.Am J Med.1999;106(4):441–445.
- Society of Hospital Medicine. About SHM. Available at: http://www.hospitalmedicine.org/AM/Template.cfm?Section=General_Information357(25):2589–2600.
- ,,, et al.Effects of physician experience on costs and outcomes on an academic general medicine service: results of a trial of hospitalists.Ann Intern Med.2002;137(11):866–874.
- .A systematic review of outcomes and quality measures in adult patients cared for by hospitalists vs nonhospitalists.Mayo Clin Proc.2009;84(3):248–254.
- ,,, et al.Do hospitalists or physicians with greater inpatient HIV experience improve HIV care in the era of highly active antiretroviral therapy? Results from a multicenter trial of academic hospitalists.Clin Infect Dis.2008;46(7):1085–1092.
- ,,, et al.Quality of care for decompensated heart failure: comparable performance between academic hospitalists and non‐hospitalists. J Gen Intern Med.2008;23(9):1399–1406.
- ,,, et al.Factors associated with discussion of care plans and code status at the time of hospital admission: results from the Multicenter Hospitalist Study.J Hosp Med.2008;3(6):437–445.
- ,,, et al.Upper gastrointestinal hemorrhage clinical guideline determining the optimal hospital length of stay.Am J Med.1996;100(3):313–322.
- ,,, et al.Prospective evaluation of a clinical guideline recommending hospital length of stay in upper gastrointestinal tract hemorrhage.JAMA.1997;278(24):2151–2156.
- ,,, et al.In‐hospital cost of abdominal aortic aneurysm repair in Canada and the United States.Arch Intern Med.2003;163(20):2500–2504.
- ,,, et al.The use of transition cost accounting system in health services research.Cost Eff Resour Alloc.2007;5:11.
- Society of Hospital Medicine. Definition of a Hospitalist. Available at: http://www.hospitalmedicine.org/AM/Template.cfm?Section=General_Information335(7):514–517.
- ,,, et al.Selection of patients for early discharge or outpatient care after acute upper gastrointestinal haemorrhage. National Audit of Acute Upper Gastrointestinal Haemorrhage.Lancet.1996;347(9009):1138–1140.
- ,,, et al.Utilization of health care resources for low‐risk patients with acute, nonvariceal upper GI hemorrhage: an historical cohort study.Gastrointest Endosc.2002;55(3):321–327.
- ,.Incremental value of upper endoscopy for triage of patients with acute non‐variceal upper‐GI hemorrhage.Gastrointest Endosc.2004;60(1):9–14.
- ,,, et al.The Charlson comorbidity index is adapted to predict costs of chronic disease in primary care patients.J Clin Epidemiol.2008;61(12):1234–1240.
- ,,, et al.The effectiveness of early endoscopy for upper gastrointestinal hemorrhage: a community‐based analysis.Med Care.1998;36(4):462–474.
- ,,, et al.Early endoscopy in upper gastrointestinal hemorrhage: associations with recurrent bleeding, surgery, and length of hospital stay.Gastrointest Endosc.1999;49(2):145–152.
- ,.The impact of hospitalists on the cost and quality of inpatient care in the united states: a research synthesis.Med Care Res Rev.2005;62(4):379–406.
- ,,, et al.Physician specialty and variations in the cost of treating patients with acute upper gastrointestinal bleeding.Gastroenterology.1997;113(5):1443–1448.
- ,,, et al.Impact of physician specialty on the cost of nonvariceal upper GI bleeding care.Am J Gastroenterol.2002;97(6):1535–1542.
- ,,.Associations with reduced length of stay and costs on an academic hospitalist service.Am J Manag Care.2004;10(8):561–568.
Copyright © 2010 Society of Hospital Medicine
Short Title
The United States spends more on healthcare than any country in the world, and it is widely believed that the Nation could spend less while achieving comparable or better outcomes. The recent debate over healthcare reform in the United States, the large Federal budget deficit in the context of the current economic recession, and the prospect of widening gaps in Medicare funding with the increasing entry of baby boomers into old age suggest that the issue of healthcare cost will remain intense for many years to come. What roles hospitalists will play in the nation's struggle to control health care costs remain to be seen. Six papers in this issue of the Journal of Hospital Medicine discuss issues related to costs, and reflect several of the ways in which hospital medicine can contribute to understanding, and ultimately, controlling healthcare costs.
Two papers, one by Whelan et al.1 examining the costs associated with upper vs. lower GI bleeding and one by Lorch et al.2 examining the costs associated with herpex simplex virus (HSV) infections among neonates with and without congenital abnormalities, focus on epidemiologic determinants of healthcare costs. Such studies can identify subgroups of patients with high costs who may be logical targets for efforts to control costs. One tension in the use of such analyses to control cost is that total cost for any patient group is the product of both the cost per patient and the number of patients falling into each group. In the case of gastrointestinal (GI) bleeding, the surprise compared to past reports is that lower GI bleeding is about as common among hospitalized patients as upper GI bleeding. This may be because pharmacotherapy for conditions that cause upper GI bleeding is reducing the rate at which disease progresses to the point where hospitalization is required. The importance of prevalence is reinforced even in the findings about HSV infection, where despite 2‐ to 3‐fold higher average costs among babies with HSV who have congenital abnormalities, the fact that 90% of babies hospitalized with HSV lack congenital abnormalities implies that the clear majority of costs are due to babies without congenital abnormalities. In seeking strategies to control costs, it is important to pay attention to both the prevalence and cost per case of specific conditions. Because hospitalists are generalist physicians who typically care for few patients with any given diagnosis, the importance of prevalence implies that disease‐specific efforts to control costs may produce smaller total gains than those that cross diseases, such as efforts to improve communication between inpatient and outpatient physicians.
Moreover, the presence of high costs for some condition does not, of course, imply that effective interventions exist to reduce those costs. Two other papers, one by Mudge et al.3 examining a disease management program for heart failure, and one by Go et al.4 examining the effects of hospitalists on the costs of hospitalization for GI bleeding, reinforce the idea that interventions to reduce hospital costs are not always as effective as hoped. Even worse, efforts to control costs can have unintended effects, such as the delays in antimicrobial administration with antimicrobial approval policies that are reported by Winters et al.5 These studies also illustrate that analyses of the effectiveness of interventions can be performed using a variety of experimental designs (eg, the before/after comparison used by Mudge et al,3 and the natural experiments based on assignment of patients to physicians based on day of admission used by Go et al.4 or based on time of day used by Winters et al.)5 The role of hospitalists as clinical leaders in hospitals often places them in positions to design and execute experiments, but the role of hospitalists as astute clinicians who can recognize the presence of natural experiments in their clinical environment can be every bit as powerful in producing valid research designs.
As society seeks strategies to control healthcare costs in the years ahead, it will almost certainly turn to the same general strategies that have been used in the past: bundling services into fixed payments for a prospectively defined episode of care, asking patients to pay more of the costs of care, and simply not paying for, or paying less for, any given type of care. Hospitalists already have dealt with many of these approaches in one form or another. Medicare's prospective payment system and the payment of fixed annual fees for the care of patients in health maintenance organizations have given all hospitalists some exposure to the pressure for lower hospital resources use under prospective payment systems. Proposals for demonstration projects within healthcare reform to study the effects of bundling inpatient and outpatient care or even hospital and professional fees suggest that hospitalists may need to be open to new incentive structures in the years to come. For example, reduced incentives for rapid discharge if costs pushed into the outpatient setting are borne by the hospital, there may be co‐management models if professional and hospital fees are bundled. Increases in patient copayments may also play some role in healthcare reform, and the paper by Ross et al.6 should be a reminder to hospitalists that we may do our patients a great disservice if we fail to recognize the effects of our decisions on their out‐of‐pocket costs. Indeed, while doctors and patient both recognize the importance of discussing out‐of‐pocket costs, they both agree that these discussions rarely occur.7 That such discussions are not reimbursed explicitly suggests one of the many challenges of controlling healthcare costs; if physician payments are decreased to control costs and physicians respond by attempting to see even more patients in any given time period, discussions of important but less urgent issues such as out‐of‐pocket costs seem likely to be reduced. Such dilemmas arise frequently as the healthcare system devises increasingly complex approaches to the control of costs and suggest to many that fundamental reform of the payment and delivery system with greater reliance on integrated health systems paid through full capitation will eventually need to become the nation's approach to healthcare cost containment.8
- ,., et al.Upper versus lower gastrointestinal bleeding: a direct comparison of clinical presentation, outcomes, and resource utilization.J Hosp Med.2010;5(3):140–146.
- ,,.Impact of congenital anomalies and treatment location on clinical outcomes and health resource use in infants hospitalized with herpes simplex virus.J Hosp Med.2010;5(3):154–158.
- ,,, et al.The paradox of readmission: effect of a quality improvement programme in hospitalised patients with heart failure.J Hosp Med.2010;5:147–152.
- ,,, et al.Do hospitalists affect clinical outcomes and efficiency for patients with acute upper gastrointestinal hemorrhage (UGIH)?J Hosp Med.2010;5(3):138–138.
- ,,.Impact of a restrictive antimicrobial policy on the process and timing of antimicrobial administration.J Hosp Med.2010;5(2):E41–E45.
- ,.Reducing patient financial liability for hospitalizations: the physician role.J Hosp Med.2010;5(3):159–161.
- ,,.Patient‐physician communication about out‐of‐pocket costs.JAMA.2003;290(7):953–958.
- ,,, et al.Toward a 21st‐century health care system: recommendations for health care reform.Ann Intern Med.2009;150:493–495.
The United States spends more on healthcare than any country in the world, and it is widely believed that the Nation could spend less while achieving comparable or better outcomes. The recent debate over healthcare reform in the United States, the large Federal budget deficit in the context of the current economic recession, and the prospect of widening gaps in Medicare funding with the increasing entry of baby boomers into old age suggest that the issue of healthcare cost will remain intense for many years to come. What roles hospitalists will play in the nation's struggle to control health care costs remain to be seen. Six papers in this issue of the Journal of Hospital Medicine discuss issues related to costs, and reflect several of the ways in which hospital medicine can contribute to understanding, and ultimately, controlling healthcare costs.
Two papers, one by Whelan et al.1 examining the costs associated with upper vs. lower GI bleeding and one by Lorch et al.2 examining the costs associated with herpex simplex virus (HSV) infections among neonates with and without congenital abnormalities, focus on epidemiologic determinants of healthcare costs. Such studies can identify subgroups of patients with high costs who may be logical targets for efforts to control costs. One tension in the use of such analyses to control cost is that total cost for any patient group is the product of both the cost per patient and the number of patients falling into each group. In the case of gastrointestinal (GI) bleeding, the surprise compared to past reports is that lower GI bleeding is about as common among hospitalized patients as upper GI bleeding. This may be because pharmacotherapy for conditions that cause upper GI bleeding is reducing the rate at which disease progresses to the point where hospitalization is required. The importance of prevalence is reinforced even in the findings about HSV infection, where despite 2‐ to 3‐fold higher average costs among babies with HSV who have congenital abnormalities, the fact that 90% of babies hospitalized with HSV lack congenital abnormalities implies that the clear majority of costs are due to babies without congenital abnormalities. In seeking strategies to control costs, it is important to pay attention to both the prevalence and cost per case of specific conditions. Because hospitalists are generalist physicians who typically care for few patients with any given diagnosis, the importance of prevalence implies that disease‐specific efforts to control costs may produce smaller total gains than those that cross diseases, such as efforts to improve communication between inpatient and outpatient physicians.
Moreover, the presence of high costs for some condition does not, of course, imply that effective interventions exist to reduce those costs. Two other papers, one by Mudge et al.3 examining a disease management program for heart failure, and one by Go et al.4 examining the effects of hospitalists on the costs of hospitalization for GI bleeding, reinforce the idea that interventions to reduce hospital costs are not always as effective as hoped. Even worse, efforts to control costs can have unintended effects, such as the delays in antimicrobial administration with antimicrobial approval policies that are reported by Winters et al.5 These studies also illustrate that analyses of the effectiveness of interventions can be performed using a variety of experimental designs (eg, the before/after comparison used by Mudge et al,3 and the natural experiments based on assignment of patients to physicians based on day of admission used by Go et al.4 or based on time of day used by Winters et al.)5 The role of hospitalists as clinical leaders in hospitals often places them in positions to design and execute experiments, but the role of hospitalists as astute clinicians who can recognize the presence of natural experiments in their clinical environment can be every bit as powerful in producing valid research designs.
As society seeks strategies to control healthcare costs in the years ahead, it will almost certainly turn to the same general strategies that have been used in the past: bundling services into fixed payments for a prospectively defined episode of care, asking patients to pay more of the costs of care, and simply not paying for, or paying less for, any given type of care. Hospitalists already have dealt with many of these approaches in one form or another. Medicare's prospective payment system and the payment of fixed annual fees for the care of patients in health maintenance organizations have given all hospitalists some exposure to the pressure for lower hospital resources use under prospective payment systems. Proposals for demonstration projects within healthcare reform to study the effects of bundling inpatient and outpatient care or even hospital and professional fees suggest that hospitalists may need to be open to new incentive structures in the years to come. For example, reduced incentives for rapid discharge if costs pushed into the outpatient setting are borne by the hospital, there may be co‐management models if professional and hospital fees are bundled. Increases in patient copayments may also play some role in healthcare reform, and the paper by Ross et al.6 should be a reminder to hospitalists that we may do our patients a great disservice if we fail to recognize the effects of our decisions on their out‐of‐pocket costs. Indeed, while doctors and patient both recognize the importance of discussing out‐of‐pocket costs, they both agree that these discussions rarely occur.7 That such discussions are not reimbursed explicitly suggests one of the many challenges of controlling healthcare costs; if physician payments are decreased to control costs and physicians respond by attempting to see even more patients in any given time period, discussions of important but less urgent issues such as out‐of‐pocket costs seem likely to be reduced. Such dilemmas arise frequently as the healthcare system devises increasingly complex approaches to the control of costs and suggest to many that fundamental reform of the payment and delivery system with greater reliance on integrated health systems paid through full capitation will eventually need to become the nation's approach to healthcare cost containment.8
- ,., et al.Upper versus lower gastrointestinal bleeding: a direct comparison of clinical presentation, outcomes, and resource utilization.J Hosp Med.2010;5(3):140–146.
- ,,.Impact of congenital anomalies and treatment location on clinical outcomes and health resource use in infants hospitalized with herpes simplex virus.J Hosp Med.2010;5(3):154–158.
- ,,, et al.The paradox of readmission: effect of a quality improvement programme in hospitalised patients with heart failure.J Hosp Med.2010;5:147–152.
- ,,, et al.Do hospitalists affect clinical outcomes and efficiency for patients with acute upper gastrointestinal hemorrhage (UGIH)?J Hosp Med.2010;5(3):138–138.
- ,,.Impact of a restrictive antimicrobial policy on the process and timing of antimicrobial administration.J Hosp Med.2010;5(2):E41–E45.
- ,.Reducing patient financial liability for hospitalizations: the physician role.J Hosp Med.2010;5(3):159–161.
- ,,.Patient‐physician communication about out‐of‐pocket costs.JAMA.2003;290(7):953–958.
- ,,, et al.Toward a 21st‐century health care system: recommendations for health care reform.Ann Intern Med.2009;150:493–495.
Advice and Preparedness to Quit Smoking
Hospitalization may offer a natural opportunity to screen and advise patients on the advantages of quitting smoking due to a variety of reasons, such as the smoke‐free environment, availability of medical personnel, suitability of tailoring information, and the potential to catch a teachable moment.1, 2 Additionally, a recent meta‐analysis suggested that hospital‐based cessation programs and referrals to cardiac rehabilitation result in significantly higher rates of cessation among discharged smokers.3 In 2008, the U.S. Public Health Service Task Force on Clinical Practice Guidelines for Treating Tobacco Use and Dependence in hospitalized smokers recommended listing smoking status on problem lists, evaluating a smoker's preparedness to quit, providing counseling and medications to treat in‐hospital withdrawal symptoms, and arranging discharge follow‐up to help smokers remain abstinent.4 To promote these practices, the Center for Medicaid and Medicare Services (CMS) has made smoking cessation counseling a quality of care indicator for patients hospitalized with congestive heart failure (CHF), acute myocardial infarction (AMI), or pneumonia. This indicator is a critical step in recognizing the importance of smoking cessation counseling in improving mortality and morbidity for these patients.
Despite the importance of promoting smoking cessation among hospitalized patients, few studies have looked at whether or not hospitalized patients are prepared to quit smoking. Ascertaining patients' preparedness to quit smoking is an important first step in understanding a patient's readiness to change their health behaviors because smoking cessation is the culmination of a lengthy process of behavior change.5 Studies of healthy factory workers suggest that smokers who were more prepared to quit smoking had a higher number of previous quit attempts and perceived coworker encouragement.6
Understanding patient preparedness to quit smoking is especially important among African American smokers, who face a disproportionate health burden due to smoking‐related illness. Studies show that African Americans are less likely than other racial groups to engage in formal tobacco cessation interventions and have lower long‐term quit rates, despite a higher desire to quit smoking.5, 79 Understanding preparedness to quit among this particular group of hospitalized patients may be an important first step in identifying those most likely to quit and benefit from tailored, intensive interventions, such as using medications to assist in combination with postdischarge tobacco cessation counseling.
The aim of this study was to characterize the preparedness to quit smoking and to assess quit attempts made, methods used for quitting, and the success of such quit attempts at 1‐month follow‐up in a group comprised of a high proportion of underserved African American hospitalized smokers. In addition, the relationship of hospitalized patients' preparedness to quit and the effect of inpatient advice on the likelihood of subsequent tobacco cessation were examined.
Patients and Methods
The data used for this study were collected for the Cardiology Quality of Care Study, an ongoing prospective study of patients hospitalized on the inpatient cardiology service at the University of Chicago Medical Center. Newly admitted patients were approached by research assistants and consented to the study using a previously described protocol for enrolling hospitalized patients.10 Patients that lacked decisional capacity (score of <17 on the telephone version of the Mini‐Mental Status Exam)11 were excluded. Patients did not receive any scripted intervention during this admission to assist with cessation. The study left cessation counseling and advice to quit up to the discretion of the individual physician caring for the patient in the hospital. The Institutional Review Board at the University of Chicago approved this study.
Inpatient Interview
The inpatient interview is a 60‐item questionnaire taking approximately 15 minutes to administer by trained research assistants. The questionnaire is designed to assess demographic characteristics (race, socioeconomic status, education, sex, and age), smoking habits, and preparedness to quit. Demographics were collected on all consented patients. Seven items focused on cigarette smoking, consistent with questions in the National Health Information Survey.12 Patients were classified as lifetime smokers if they smoked at least 100 cigarettes in their lifetime. To identify current smokers on admission, patients were asked if they now smoke cigarettes some days or everyday. Additionally, smokers were asked if they had made any quit attempts in the past 12 months.
Patients rated their level of preparedness using a modified version of the Biener Abrams Contemplation Ladder. The Contemplation Ladder is an easily‐administered tool represented by a ladder image of rungs with anchor statements developed as an alternative method to the Prochaska and DiClemente Stages of Change.13 The 10‐point scale ranges from 1 (I enjoy smoking and have decided not to quit smoking for my lifetime; I have no interest in quitting) to 10 (I have quit smoking and will never smoke again.) Tobacco users may rank their current level of motivation to quit. A level of 6 (I definitely plan to quit smoking in the next 6 months) or higher is consistent with preparedness to quit. The Contemplation Ladder was validated by Biener and Abrams6 in a work site study which demonstrated that subjects with higher Ladder scores (score 6) were more likely than those with lower Ladder scores (scores < 6) to participate in awareness activities (eg, educational session) and make a quit attempt in 6 months. This instrument is easier to administer than the more well known Transtheoretical Model of Change, given that it is an ordinal scale with clear steps that may be more user‐friendly for both clinicians and patients.6 In a prior study of emergency room patients, an individual's Ladder score was shown to be significantly associated with a patient's reported intention to quit, number of previous quit attempts, perceived coworker encouragement, and socioeconomic status.14
Admission Diagnoses
Chart audit was performed by trained research assistants at the time of the inpatient interview (within 24 hours of admission) to assess whether patients were admitted with the potential diagnoses of AMI, CHF, neither, or both. All were based on the chart documentation of the patients' clinical presentation. This information was used to assess which CMS Quality Indicators applied to cardiology patients, given that smoking cessation is now a quality indicator for patients with AMI or CHF.
Thirty‐day Follow‐up Telephone Survey
Trained research assistants interviewed patients by telephone at approximately 1 month postdischarge. The follow‐up telephone survey included routine questions concerning follow‐up appointments, readmissions, emergency room visits, and patient satisfaction.15, 10 An additional 5 questions related to smoking cessation were added for this study. Questions were developed using the CMS quality indicators16 or were taken from the National Health Information Survey.12 Patients were asked to self‐report quit attempts made postdischarge, whether or not these quit attempts were associated with success (self‐reported abstinence at the time of follow‐up), and what methods were used to quit (ie, nicotine replacement therapy [NRT], other pharmacotherapy, quit line, pamphlet, counseling group, or cold turkey.) Patients were also asked if they recalled receiving advice to quit during their hospitalization from either a nurse or physician.
Data Analysis
Descriptive statistics were used to summarize Contemplation Ladder scores and types of quit methods used. Chi square tests were used to assess the effect of preparedness (Ladder score 6) on quit behaviors. The main quit behavior was any self‐reported quit attempt made within 1 month after discharge. Additionally, the relationship between preparedness and making a successful quit attempt (defined as a self‐report of not smoking as a result of this quit attempt in the last month) was examined. Multivariate logistic regression, controlling for demographic characteristics, was performed to test the effect of preparedness on quit behaviors (any quit attempt after discharge, or successful quit attempt). While not a primary aim of this study, the association between recall of in‐hospital advice and quit behaviors after discharge was also examined using chi square tests and multivariate logistic regression models, controlling for the demographic characteristics as above. Models also tested the effect of preparedness and recall of in‐hospital advice as independent predictors on quit behaviors and whether or not an interaction between preparedness and advice existed. A linear test of trend was also performed on preparedness and advice. All statistical tests were performed using Intercooled Stata 9.0 (Stata Corporation, College Station, TX), with statistical significance defined as P < 0.05.
Results
From February 2006 through July 2007, 86% (2906/3364) of all cardiology inpatients approached were interviewed. Fifteen percent (436/2906) of patients enrolled in the study indicated that they were current smokers. Contemplation Ladder scores were obtained on 95% (415/436) of the current smokers, and 1‐month postdischarge follow‐up telephone surveys were completed in 67% (276/415) of the current smokers. Three attempts were made to contact patients who were lost to follow‐up (Figure 1). The major reasons for inability to contact patients included wrong telephone numbers, disconnected phone lines, or no method to leave a message for the patient (ie, no answering machine). Given that we were only able to complete follow‐up interviews on 276 patients, we conducted our analyses on only this group of patients.
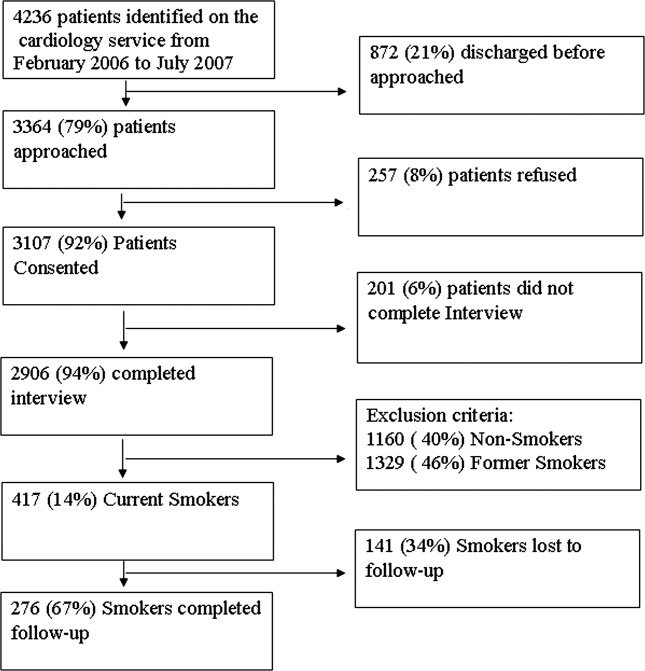
The average age of current smokers in the sample was 55 years (95% confidence interval [CI], 54‐58). Most current smokers were of the African American race (83%; 224/276). More than 65% of smokers had completed high school or higher, and nearly one‐half (46%) had an average household income of $25,000 or less before taxes. The most common admitting diagnoses per chart audit among current inpatient smokers were AMI (31%) and CHF (27%). The vast majority (95%) of hospitalized smokers in this sample were first‐time admissions to the University of Chicago. Table 1 shows the demographic data for current smokers compared to former smokers (those who have quit smoking prior to admission). Current smokers were more likely to be African American, had lower income levels, and were less likely to have completed high school. Additionally, current smokers were more likely to carry a potential diagnosis of AMI or CHF and to be a first‐time admission (Table 1).
| Demographic Variables | Current Smokers (n = 276)* | Nonsmoker (n = 1329)* | P Value |
|---|---|---|---|
| |||
| Male sex | 156 (57) | 705 (53) | 0.22 |
| African American race | 224 (83) | 886 (67) | <0.001 |
| Age (years) | 55.3 | 64.0 | <0.001 |
| Highest completed level of education | 0.02 | ||
| Junior high school or less | 15 (6) | 98 (7) | |
| Some high school | 67 (25) | 230 (17) | |
| High school graduate | 81 (30) | 403 (31) | |
| Some college education | 68 (25) | 313 (24) | |
| College graduate | 19 (7) | 135 (10) | |
| Graduate level education | 11 (4) | 96 (7) | |
| Household income before taxes | 0.001 | ||
| <$2500 | 33 (12) | 79 (6) | |
| $2501‐$15,000 | 66 (24) | 334 (26) | |
| $15,001‐$50,000 | 51 (19) | 311 (24) | |
| 50,001‐$100,000 | 22 (8) | 126 (9) | |
| >$100,001 | 11 (4) | 50 (4) | |
| Did not answer | 88 (33) | 422 (32) | |
| Diagnosis on admission | 0.02 | ||
| AMI | 66 (31) | 269 (24) | |
| CHF | 58 (27) | 287 (25) | |
| Both | 49 (23) | 273 (24) | |
| Neither | 42 (19) | 305 (27) | |
| Admission status | |||
| New admission | 258 (95) | 1,154 (87) | 0.051 |
| Readmission | 14 (5) | 175 (13) | |
Approximately three‐quarters (76%; 210/276) of current smokers were identified as prepared to quit, with a Ladder score 6. There was a wide distribution of Ladder scores, with one‐third (31%; 86/276) of smokers reporting a Ladder score of 8, indicating that they still smoke, but are ready to set a quit date and another 34% (95/276 patients) with Ladder scores of either 6 or 7 also indicating they were planning to quit smoking (Figure 2). A significant portion of smokers (71%; 195/276) reported making a quit attempt after discharge, and 38% of smokers (106/276) self‐reported that their quit attempt was successful (ie, no longer smoking at 1 month post discharge). Note that the quit rate is reduced to 26% (106/415) at 1 month if one conservatively assumes that those who did not take part in follow‐up were relapsers. Among those who did participate in follow‐up, as shown in Figure 3, the most frequently reported (53%; 145/276) method used to quit smoking was cold turkey. Thirteen percent (37/276) of patients reported making a quit attempt using pharmacological therapy (ie, NRT or bupropion) and only 4% (12/276) of patients reported making a quit attempt using the help of a smoking cessation program (Figure 3).
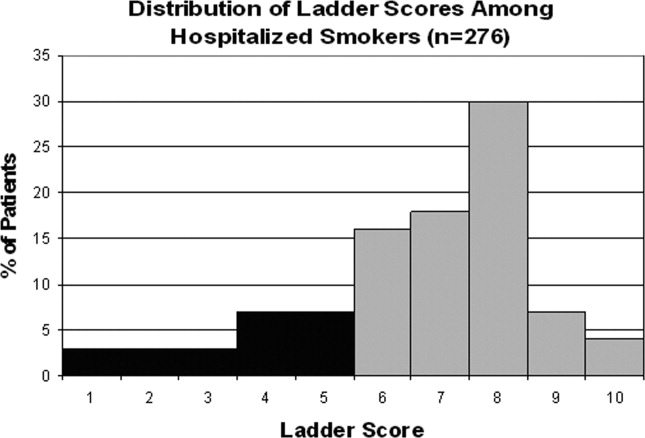

Preparedness was an important predictor of making a quit attempt. Prepared patients (ie, Ladder score 6) were significantly more likely than patients who were less prepared to report making a quit attempt after discharge (163/212 [77%] vs. 32/64 [50%], respectively; P < 0.001). This result remained significant after adjusting for sociodemographic characteristics with a similar effect size (adjusted estimates 76% [95% CI, 75.7‐76.7] prepared vs. 49% [95% CI, 48.5‐49.8]; P < 0.001). These results also remained significant with a similar effect size in analyses using multivariate logistic regression (Table 2). Of those patients who made quit attempts, prepared patients were slightly more likely to report a successful quit attempt (90/163; 55%) than were less‐prepared patients (16/32; 50%), though this was not significant (P = 0.205).
| Statistical test | Quit Behavior | Prepared % (95% CI) | Unprepared % (95% CI) | P Value |
|---|---|---|---|---|
| ||||
| Chi square tests | Any quit attempt made after discharge | 76.9 (71.2‐82.6) | 50.0 (37.8‐62.2) | <0.001 |
| Successful quit attempt at time of follow‐up | 55.0 (45.9‐60.2) | 50.0 (25.4‐58.2) | 0.20 | |
| Multivariate logistic regression* | Any quit attempt made after discharge | 76.2 (75.7‐76.7) | 49.2 (48.5‐49.9) | <0.001 |
In the follow‐up sample, 17% could not remember if they received advice to quit smoking. Among those who were able to recall receiving advice, the majority (78%; 180/230) reported that they received advice from a nurse or physician during hospitalization, compared to 22% who did not recall ever being advised to quit by any healthcare provider during the admission. Patients who reported receiving advice to quit were more likely to report making a quit attempt postdischarge as compared to those that did not recall receiving advice (70% vs. 46%, respectively; P = 0.002). In a multivariate logistic regression, controlling for demographic factors and admitting diagnosis, both preparedness and receipt of in‐hospital advice were independent predictors of making a future quit attempt (odds ratio [OR] = 4.05; 95% CI, 1.91‐8.60; P < 0.001 for preparedness; OR = 3.96; 95% CI, 1.84‐8.54; P < 0.001 for advice). Additionally, there was no significant interaction or synergistic effect between being prepared to quit smoking and receiving in‐hospital advice to quit (OR = 1.24; 95% CI, 0.17‐9.21; P = 0.836) (Figure 4). When analyzing the effects of preparedness and advice on quit attempts, only preparedness to quit remained a significant predictor of a successful quit attempt (OR = 2.93; 95% CI, 1.13‐7.60; P = 0.027 for preparedness; OR = 2.16; 95% CI, 0.85‐5.49; P = 0.10 for advice to quit). As demonstrated in Table 2, a higher percentage of prepared patients made a quit attempt after discharge (76.9% vs. 50%) and had a successful quit attempt and short‐term abstinence (55% prepared patients vs. 50% less prepared patients).
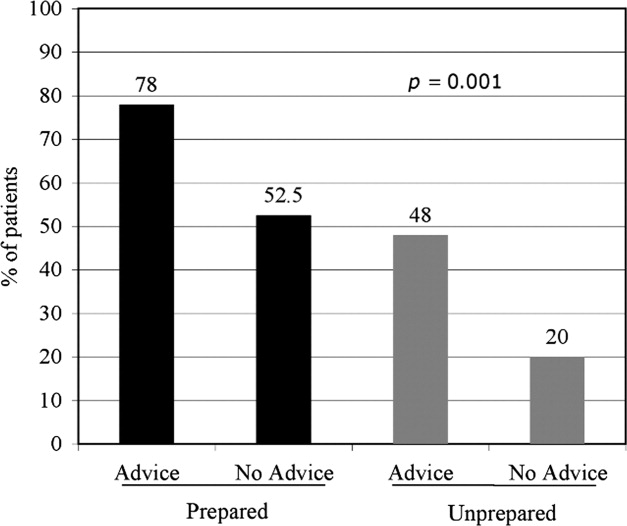
Discussion
This study demonstrated that in a group of hospitalized underserved, and predominantly African American smokers, the majority of patients reported being prepared to quit smoking at the time of hospitalization. Prepared patients were more likely to report making a quit attempt after discharge and more likely to report being successful in their quit attempt than patients who reported being less prepared to quit during their hospitalization. Nevertheless, approximately one‐half of unprepared patients did make a quit attempt 1 month after discharge, demonstrating a desire to quit smoking after hospitalization among this population. However, short‐term success rates in this group were lower than in patients prepared to quit. In addition, preparedness to quit and receipt of in‐hospital advice to quit smoking were both found to be independent predictors of making a quit attempt, with nearly identical ORs; however, only preparedness remained significant after controlling for advice to quit. Last, although the majority of hospitalized cardiac patients were making quit attempts after discharge, most patients reported using the least effective quit methods (ie, cold turkey) rather than more effective and intensive interventions such as counseling in combination with pharmacotherapy.
These findings have important implications for current quality initiatives targeted at promoting smoking cessation among cardiac patients. First, these results highlight the need for evidence‐based methods to be made available to hospitalized smokers who are prepared to quit. Our results are consistent with other studies reporting rare use (5.2%) of NRT in the hospital setting, despite the proven benefit in treating nicotine withdrawal symptoms.17 This is also consistent with data reporting that among nonhospitalized smokers, quitting cold turkey was the most commonly used and least effective cessation method.18 Second, the rate of recall of in‐hospital advice among patients (78%) was generally consistent with those reported to CMS (most recent quarter 95% for AMI and 88% for CHF).19
In addition to receiving advice, preparedness to quit was associated with higher quit attempts, therefore highlighting the importance of assessing level of preparedness in addition to giving advice. The fact that most quit attempts were made using cold turkey and resulted in low short‐term success rates underscores the need to reevaluate the current CMS quality indicator of advice alone for hospitalized smokers. Furthermore, the recently updated 2008 U.S. Public Health guidelines recently recommend, in addition to advice, that all hospitalized smokers be assessed for readiness to change, be assisted in quitting with pharmacotherapy, and be arranged follow‐up for tobacco cessation postdischarge, highlighting the inadequacy of advice alone.4 While it is important to continue to advise all hospitalized smokers to quit, the study findings demonstrate that assessing preparedness may result in targeting more prepared patients with more intensive interventions. Further policy implications include that less prepared patients may need motivational techniques to increase their level of preparedness to quit during hospitalization.
Several limitations are worth mentioning. First, the study included a relatively small sample size drawn from a single urban medical center. The prevalence of current smokers in our sample was 15%, which is lower than many studies looking at cardiology inpatient smokers.3, 20 This limitation of our study may be attributed to the advanced age of the majority of our patients, as compared with other studies, as well as the possibility of socially desirable response bias that many low‐income African American smokers may experience, leaving them less likely to admit to smoking at the time of hospitalization. Second, there was a low follow‐up rate, with 66% of patients undergoing follow‐up postdischarge. While this may raise the concerns of differences between ladder scores in those patients that participated in follow‐up and those that did not, analyses show no significant difference between level of preparedness in these 2 groups (68% prepared in patients who received follow‐up vs. 63% prepared patients in those who did not participate in follow‐up; P = 0.36). Third, follow‐up of quit attempts and receipt of advice were all assessed using self‐report, and, therefore, were limited by lack of verification and lack of assessment for potential recall bias. Fourth, in this pilot study, the follow‐up period was relatively short at 1 month postdischarge. It is likely that rates of successful quit attempts would be lower with longer‐term follow‐up periods, given previous literature demonstrating the difficulty with long‐term abstinence.21 Last, the study was not able to account for potential effects that hospitalization itself may have on preparedness, as patients may be more likely to report being prepared to quit when in the face of a health shock,22 as well as the fact that some patients may demonstrate a socially desirable response bias influenced by hospitalization.
In conclusion, the majority of underserved smokers with cardiac disease reported being prepared to quit smoking and were more likely to self‐report making a quit attempt after discharge. However, the majority of these quit attempts were made via cold turkey, without the support of available evidence‐based methods to quit. It is possible that by directly providing education, access to pharmacotherapy, and counseling options, the utilization rates for more efficacious treatments would increase in cardiac patients who are prepared to quit. While recall of in‐hospital advice was associated with future quit attempts, prepared patients who recalled receiving advice were more likely to make a quit attempt than prepared patients who did not recall receiving advice, as well as unprepared patients. Together, these findings highlight the need to consider a patient's level of preparedness to quit in understanding the success of in‐hospital advice and the importance of making evidence‐based cessation methods available to hospitalized smokers who are prepared to quit. Additionally, identifying patients not prepared to quit may help in providing them with appropriate motivational therapy, to move them along the stages of change, as well as educational information on how to quit once they have decided to do so.
- ,,.Helping hospitalized smokers quit: new directions for treatment and research.J Consult Clin Psychol.1993;61:778–789.
- ,.Smokers who are hospitalized: a window of opportunity for cessation interventions.Prev Med.1992;21:262–269.
- ,,, et al.Predictors of smoking cessation after a myocardial infarction: the role of institutional smoking cessation programs in improving success.Arch Intern Med.2008;168(18):1961–1967.
- Guideline Panel.Clinical Practice Guidelines: Treating Tobacco Use and Dependence.Washington, DC:Public Health Service, U.S. Department of Health and Human Services;2008.
- ,.Stages and processes of self‐change in smoking: toward an integrative model of change.J Consult Clin Psychol.1983;51:390–395.
- ,.The Contemplation Ladder: validation of a measure of readiness to consider smoking cessation.Health Psychol.1991;10(5):360–365.
- ,,,,.Smoking cessation factors among African Americans and Whites.Am J Public Health.1993;83(2):220–226.
- U.S. Department of Health and Human Services.The Health Benefits of Smoking Cessation.Rockville, MD:Office on Smoking and Health, Centers for Chronic Disease Prevention and Health Promotion, Public Health Service,U.S. Department of Health and Human Services,Washington, DC;2000.
- ,,,,.Trends in cigarette smoking in the United States. the changing influence of gender and race.JAMA.1989;261(1):49–55.
- ,,, et al.Effects of physician experience on costs and outcomes on an academic general medicine service: results of a trial of hospitalists.Ann Intern Med.2002;137(11):866–874.
- ,,,.Validation of a telephone version of the Mini‐Mental State Examination.J Am Geriatr Soc.1992;40(7):697–702.
- National Health Information Survey Questionnaire, Sample Adult,Adult Health Behaviors;2004.
- ,,, et al.The Marijuana Ladder: measuring motivation to change marijuana use in incarcerated adolescents.Drug Alcohol Depend.2006;83:42–48.
- ,,,,.Motivation for stopping tobacco use among emergency department patients.Acad Emerg Med.2005;12:568–571.
- Picker‐Commonwealth Survey of Patient‐Centered Care.Health Aff.1991.
- Hospital Quality Initiatives. Centers for Medicare and Medicaid Services (CMS). Available at: http://www.cms.hhs.gov/HospitalQualtiyInits. Accessed April2009.
- ,,, et al.The use of nicotine replacement therapy by hospitalized smokers.Am J Prev Med.1999;17(4):255–259.
- ,,,,.Methods used to quit smoking in the United States: do cessation programs help?JAMA.1990;263(20):2795–2796.
- U.S. Department of Health and Human Services.Hospital Compare.2006 Data Graphs. Available at: http://www.hospitalcompare.hhs.gov. Accessed April2009.
- ,,, et al.Office on Smoking and Health, National Center for Chronic Disease Prevention and Health Promotion, CDC. Cigarette smoking among adults—United States, 2006.MMWR Morb Mortal Wkly Rep.2007;56:1157–1161.
- ,,.Smoking cessation interventions for hospitalized smokers.Arch Intern Med.2008;168(18):1950–1960.
- ,.Health beliefs and smoking patterns in heart patients and their wives: a longitudinal study.Am J Public Health.1977;67:921–930.
Hospitalization may offer a natural opportunity to screen and advise patients on the advantages of quitting smoking due to a variety of reasons, such as the smoke‐free environment, availability of medical personnel, suitability of tailoring information, and the potential to catch a teachable moment.1, 2 Additionally, a recent meta‐analysis suggested that hospital‐based cessation programs and referrals to cardiac rehabilitation result in significantly higher rates of cessation among discharged smokers.3 In 2008, the U.S. Public Health Service Task Force on Clinical Practice Guidelines for Treating Tobacco Use and Dependence in hospitalized smokers recommended listing smoking status on problem lists, evaluating a smoker's preparedness to quit, providing counseling and medications to treat in‐hospital withdrawal symptoms, and arranging discharge follow‐up to help smokers remain abstinent.4 To promote these practices, the Center for Medicaid and Medicare Services (CMS) has made smoking cessation counseling a quality of care indicator for patients hospitalized with congestive heart failure (CHF), acute myocardial infarction (AMI), or pneumonia. This indicator is a critical step in recognizing the importance of smoking cessation counseling in improving mortality and morbidity for these patients.
Despite the importance of promoting smoking cessation among hospitalized patients, few studies have looked at whether or not hospitalized patients are prepared to quit smoking. Ascertaining patients' preparedness to quit smoking is an important first step in understanding a patient's readiness to change their health behaviors because smoking cessation is the culmination of a lengthy process of behavior change.5 Studies of healthy factory workers suggest that smokers who were more prepared to quit smoking had a higher number of previous quit attempts and perceived coworker encouragement.6
Understanding patient preparedness to quit smoking is especially important among African American smokers, who face a disproportionate health burden due to smoking‐related illness. Studies show that African Americans are less likely than other racial groups to engage in formal tobacco cessation interventions and have lower long‐term quit rates, despite a higher desire to quit smoking.5, 79 Understanding preparedness to quit among this particular group of hospitalized patients may be an important first step in identifying those most likely to quit and benefit from tailored, intensive interventions, such as using medications to assist in combination with postdischarge tobacco cessation counseling.
The aim of this study was to characterize the preparedness to quit smoking and to assess quit attempts made, methods used for quitting, and the success of such quit attempts at 1‐month follow‐up in a group comprised of a high proportion of underserved African American hospitalized smokers. In addition, the relationship of hospitalized patients' preparedness to quit and the effect of inpatient advice on the likelihood of subsequent tobacco cessation were examined.
Patients and Methods
The data used for this study were collected for the Cardiology Quality of Care Study, an ongoing prospective study of patients hospitalized on the inpatient cardiology service at the University of Chicago Medical Center. Newly admitted patients were approached by research assistants and consented to the study using a previously described protocol for enrolling hospitalized patients.10 Patients that lacked decisional capacity (score of <17 on the telephone version of the Mini‐Mental Status Exam)11 were excluded. Patients did not receive any scripted intervention during this admission to assist with cessation. The study left cessation counseling and advice to quit up to the discretion of the individual physician caring for the patient in the hospital. The Institutional Review Board at the University of Chicago approved this study.
Inpatient Interview
The inpatient interview is a 60‐item questionnaire taking approximately 15 minutes to administer by trained research assistants. The questionnaire is designed to assess demographic characteristics (race, socioeconomic status, education, sex, and age), smoking habits, and preparedness to quit. Demographics were collected on all consented patients. Seven items focused on cigarette smoking, consistent with questions in the National Health Information Survey.12 Patients were classified as lifetime smokers if they smoked at least 100 cigarettes in their lifetime. To identify current smokers on admission, patients were asked if they now smoke cigarettes some days or everyday. Additionally, smokers were asked if they had made any quit attempts in the past 12 months.
Patients rated their level of preparedness using a modified version of the Biener Abrams Contemplation Ladder. The Contemplation Ladder is an easily‐administered tool represented by a ladder image of rungs with anchor statements developed as an alternative method to the Prochaska and DiClemente Stages of Change.13 The 10‐point scale ranges from 1 (I enjoy smoking and have decided not to quit smoking for my lifetime; I have no interest in quitting) to 10 (I have quit smoking and will never smoke again.) Tobacco users may rank their current level of motivation to quit. A level of 6 (I definitely plan to quit smoking in the next 6 months) or higher is consistent with preparedness to quit. The Contemplation Ladder was validated by Biener and Abrams6 in a work site study which demonstrated that subjects with higher Ladder scores (score 6) were more likely than those with lower Ladder scores (scores < 6) to participate in awareness activities (eg, educational session) and make a quit attempt in 6 months. This instrument is easier to administer than the more well known Transtheoretical Model of Change, given that it is an ordinal scale with clear steps that may be more user‐friendly for both clinicians and patients.6 In a prior study of emergency room patients, an individual's Ladder score was shown to be significantly associated with a patient's reported intention to quit, number of previous quit attempts, perceived coworker encouragement, and socioeconomic status.14
Admission Diagnoses
Chart audit was performed by trained research assistants at the time of the inpatient interview (within 24 hours of admission) to assess whether patients were admitted with the potential diagnoses of AMI, CHF, neither, or both. All were based on the chart documentation of the patients' clinical presentation. This information was used to assess which CMS Quality Indicators applied to cardiology patients, given that smoking cessation is now a quality indicator for patients with AMI or CHF.
Thirty‐day Follow‐up Telephone Survey
Trained research assistants interviewed patients by telephone at approximately 1 month postdischarge. The follow‐up telephone survey included routine questions concerning follow‐up appointments, readmissions, emergency room visits, and patient satisfaction.15, 10 An additional 5 questions related to smoking cessation were added for this study. Questions were developed using the CMS quality indicators16 or were taken from the National Health Information Survey.12 Patients were asked to self‐report quit attempts made postdischarge, whether or not these quit attempts were associated with success (self‐reported abstinence at the time of follow‐up), and what methods were used to quit (ie, nicotine replacement therapy [NRT], other pharmacotherapy, quit line, pamphlet, counseling group, or cold turkey.) Patients were also asked if they recalled receiving advice to quit during their hospitalization from either a nurse or physician.
Data Analysis
Descriptive statistics were used to summarize Contemplation Ladder scores and types of quit methods used. Chi square tests were used to assess the effect of preparedness (Ladder score 6) on quit behaviors. The main quit behavior was any self‐reported quit attempt made within 1 month after discharge. Additionally, the relationship between preparedness and making a successful quit attempt (defined as a self‐report of not smoking as a result of this quit attempt in the last month) was examined. Multivariate logistic regression, controlling for demographic characteristics, was performed to test the effect of preparedness on quit behaviors (any quit attempt after discharge, or successful quit attempt). While not a primary aim of this study, the association between recall of in‐hospital advice and quit behaviors after discharge was also examined using chi square tests and multivariate logistic regression models, controlling for the demographic characteristics as above. Models also tested the effect of preparedness and recall of in‐hospital advice as independent predictors on quit behaviors and whether or not an interaction between preparedness and advice existed. A linear test of trend was also performed on preparedness and advice. All statistical tests were performed using Intercooled Stata 9.0 (Stata Corporation, College Station, TX), with statistical significance defined as P < 0.05.
Results
From February 2006 through July 2007, 86% (2906/3364) of all cardiology inpatients approached were interviewed. Fifteen percent (436/2906) of patients enrolled in the study indicated that they were current smokers. Contemplation Ladder scores were obtained on 95% (415/436) of the current smokers, and 1‐month postdischarge follow‐up telephone surveys were completed in 67% (276/415) of the current smokers. Three attempts were made to contact patients who were lost to follow‐up (Figure 1). The major reasons for inability to contact patients included wrong telephone numbers, disconnected phone lines, or no method to leave a message for the patient (ie, no answering machine). Given that we were only able to complete follow‐up interviews on 276 patients, we conducted our analyses on only this group of patients.
The average age of current smokers in the sample was 55 years (95% confidence interval [CI], 54‐58). Most current smokers were of the African American race (83%; 224/276). More than 65% of smokers had completed high school or higher, and nearly one‐half (46%) had an average household income of $25,000 or less before taxes. The most common admitting diagnoses per chart audit among current inpatient smokers were AMI (31%) and CHF (27%). The vast majority (95%) of hospitalized smokers in this sample were first‐time admissions to the University of Chicago. Table 1 shows the demographic data for current smokers compared to former smokers (those who have quit smoking prior to admission). Current smokers were more likely to be African American, had lower income levels, and were less likely to have completed high school. Additionally, current smokers were more likely to carry a potential diagnosis of AMI or CHF and to be a first‐time admission (Table 1).
| Demographic Variables | Current Smokers (n = 276)* | Nonsmoker (n = 1329)* | P Value |
|---|---|---|---|
| |||
| Male sex | 156 (57) | 705 (53) | 0.22 |
| African American race | 224 (83) | 886 (67) | <0.001 |
| Age (years) | 55.3 | 64.0 | <0.001 |
| Highest completed level of education | 0.02 | ||
| Junior high school or less | 15 (6) | 98 (7) | |
| Some high school | 67 (25) | 230 (17) | |
| High school graduate | 81 (30) | 403 (31) | |
| Some college education | 68 (25) | 313 (24) | |
| College graduate | 19 (7) | 135 (10) | |
| Graduate level education | 11 (4) | 96 (7) | |
| Household income before taxes | 0.001 | ||
| <$2500 | 33 (12) | 79 (6) | |
| $2501‐$15,000 | 66 (24) | 334 (26) | |
| $15,001‐$50,000 | 51 (19) | 311 (24) | |
| 50,001‐$100,000 | 22 (8) | 126 (9) | |
| >$100,001 | 11 (4) | 50 (4) | |
| Did not answer | 88 (33) | 422 (32) | |
| Diagnosis on admission | 0.02 | ||
| AMI | 66 (31) | 269 (24) | |
| CHF | 58 (27) | 287 (25) | |
| Both | 49 (23) | 273 (24) | |
| Neither | 42 (19) | 305 (27) | |
| Admission status | |||
| New admission | 258 (95) | 1,154 (87) | 0.051 |
| Readmission | 14 (5) | 175 (13) | |
Approximately three‐quarters (76%; 210/276) of current smokers were identified as prepared to quit, with a Ladder score 6. There was a wide distribution of Ladder scores, with one‐third (31%; 86/276) of smokers reporting a Ladder score of 8, indicating that they still smoke, but are ready to set a quit date and another 34% (95/276 patients) with Ladder scores of either 6 or 7 also indicating they were planning to quit smoking (Figure 2). A significant portion of smokers (71%; 195/276) reported making a quit attempt after discharge, and 38% of smokers (106/276) self‐reported that their quit attempt was successful (ie, no longer smoking at 1 month post discharge). Note that the quit rate is reduced to 26% (106/415) at 1 month if one conservatively assumes that those who did not take part in follow‐up were relapsers. Among those who did participate in follow‐up, as shown in Figure 3, the most frequently reported (53%; 145/276) method used to quit smoking was cold turkey. Thirteen percent (37/276) of patients reported making a quit attempt using pharmacological therapy (ie, NRT or bupropion) and only 4% (12/276) of patients reported making a quit attempt using the help of a smoking cessation program (Figure 3).
Preparedness was an important predictor of making a quit attempt. Prepared patients (ie, Ladder score 6) were significantly more likely than patients who were less prepared to report making a quit attempt after discharge (163/212 [77%] vs. 32/64 [50%], respectively; P < 0.001). This result remained significant after adjusting for sociodemographic characteristics with a similar effect size (adjusted estimates 76% [95% CI, 75.7‐76.7] prepared vs. 49% [95% CI, 48.5‐49.8]; P < 0.001). These results also remained significant with a similar effect size in analyses using multivariate logistic regression (Table 2). Of those patients who made quit attempts, prepared patients were slightly more likely to report a successful quit attempt (90/163; 55%) than were less‐prepared patients (16/32; 50%), though this was not significant (P = 0.205).
| Statistical test | Quit Behavior | Prepared % (95% CI) | Unprepared % (95% CI) | P Value |
|---|---|---|---|---|
| ||||
| Chi square tests | Any quit attempt made after discharge | 76.9 (71.2‐82.6) | 50.0 (37.8‐62.2) | <0.001 |
| Successful quit attempt at time of follow‐up | 55.0 (45.9‐60.2) | 50.0 (25.4‐58.2) | 0.20 | |
| Multivariate logistic regression* | Any quit attempt made after discharge | 76.2 (75.7‐76.7) | 49.2 (48.5‐49.9) | <0.001 |
In the follow‐up sample, 17% could not remember if they received advice to quit smoking. Among those who were able to recall receiving advice, the majority (78%; 180/230) reported that they received advice from a nurse or physician during hospitalization, compared to 22% who did not recall ever being advised to quit by any healthcare provider during the admission. Patients who reported receiving advice to quit were more likely to report making a quit attempt postdischarge as compared to those that did not recall receiving advice (70% vs. 46%, respectively; P = 0.002). In a multivariate logistic regression, controlling for demographic factors and admitting diagnosis, both preparedness and receipt of in‐hospital advice were independent predictors of making a future quit attempt (odds ratio [OR] = 4.05; 95% CI, 1.91‐8.60; P < 0.001 for preparedness; OR = 3.96; 95% CI, 1.84‐8.54; P < 0.001 for advice). Additionally, there was no significant interaction or synergistic effect between being prepared to quit smoking and receiving in‐hospital advice to quit (OR = 1.24; 95% CI, 0.17‐9.21; P = 0.836) (Figure 4). When analyzing the effects of preparedness and advice on quit attempts, only preparedness to quit remained a significant predictor of a successful quit attempt (OR = 2.93; 95% CI, 1.13‐7.60; P = 0.027 for preparedness; OR = 2.16; 95% CI, 0.85‐5.49; P = 0.10 for advice to quit). As demonstrated in Table 2, a higher percentage of prepared patients made a quit attempt after discharge (76.9% vs. 50%) and had a successful quit attempt and short‐term abstinence (55% prepared patients vs. 50% less prepared patients).
Discussion
This study demonstrated that in a group of hospitalized underserved, and predominantly African American smokers, the majority of patients reported being prepared to quit smoking at the time of hospitalization. Prepared patients were more likely to report making a quit attempt after discharge and more likely to report being successful in their quit attempt than patients who reported being less prepared to quit during their hospitalization. Nevertheless, approximately one‐half of unprepared patients did make a quit attempt 1 month after discharge, demonstrating a desire to quit smoking after hospitalization among this population. However, short‐term success rates in this group were lower than in patients prepared to quit. In addition, preparedness to quit and receipt of in‐hospital advice to quit smoking were both found to be independent predictors of making a quit attempt, with nearly identical ORs; however, only preparedness remained significant after controlling for advice to quit. Last, although the majority of hospitalized cardiac patients were making quit attempts after discharge, most patients reported using the least effective quit methods (ie, cold turkey) rather than more effective and intensive interventions such as counseling in combination with pharmacotherapy.
These findings have important implications for current quality initiatives targeted at promoting smoking cessation among cardiac patients. First, these results highlight the need for evidence‐based methods to be made available to hospitalized smokers who are prepared to quit. Our results are consistent with other studies reporting rare use (5.2%) of NRT in the hospital setting, despite the proven benefit in treating nicotine withdrawal symptoms.17 This is also consistent with data reporting that among nonhospitalized smokers, quitting cold turkey was the most commonly used and least effective cessation method.18 Second, the rate of recall of in‐hospital advice among patients (78%) was generally consistent with those reported to CMS (most recent quarter 95% for AMI and 88% for CHF).19
In addition to receiving advice, preparedness to quit was associated with higher quit attempts, therefore highlighting the importance of assessing level of preparedness in addition to giving advice. The fact that most quit attempts were made using cold turkey and resulted in low short‐term success rates underscores the need to reevaluate the current CMS quality indicator of advice alone for hospitalized smokers. Furthermore, the recently updated 2008 U.S. Public Health guidelines recently recommend, in addition to advice, that all hospitalized smokers be assessed for readiness to change, be assisted in quitting with pharmacotherapy, and be arranged follow‐up for tobacco cessation postdischarge, highlighting the inadequacy of advice alone.4 While it is important to continue to advise all hospitalized smokers to quit, the study findings demonstrate that assessing preparedness may result in targeting more prepared patients with more intensive interventions. Further policy implications include that less prepared patients may need motivational techniques to increase their level of preparedness to quit during hospitalization.
Several limitations are worth mentioning. First, the study included a relatively small sample size drawn from a single urban medical center. The prevalence of current smokers in our sample was 15%, which is lower than many studies looking at cardiology inpatient smokers.3, 20 This limitation of our study may be attributed to the advanced age of the majority of our patients, as compared with other studies, as well as the possibility of socially desirable response bias that many low‐income African American smokers may experience, leaving them less likely to admit to smoking at the time of hospitalization. Second, there was a low follow‐up rate, with 66% of patients undergoing follow‐up postdischarge. While this may raise the concerns of differences between ladder scores in those patients that participated in follow‐up and those that did not, analyses show no significant difference between level of preparedness in these 2 groups (68% prepared in patients who received follow‐up vs. 63% prepared patients in those who did not participate in follow‐up; P = 0.36). Third, follow‐up of quit attempts and receipt of advice were all assessed using self‐report, and, therefore, were limited by lack of verification and lack of assessment for potential recall bias. Fourth, in this pilot study, the follow‐up period was relatively short at 1 month postdischarge. It is likely that rates of successful quit attempts would be lower with longer‐term follow‐up periods, given previous literature demonstrating the difficulty with long‐term abstinence.21 Last, the study was not able to account for potential effects that hospitalization itself may have on preparedness, as patients may be more likely to report being prepared to quit when in the face of a health shock,22 as well as the fact that some patients may demonstrate a socially desirable response bias influenced by hospitalization.
In conclusion, the majority of underserved smokers with cardiac disease reported being prepared to quit smoking and were more likely to self‐report making a quit attempt after discharge. However, the majority of these quit attempts were made via cold turkey, without the support of available evidence‐based methods to quit. It is possible that by directly providing education, access to pharmacotherapy, and counseling options, the utilization rates for more efficacious treatments would increase in cardiac patients who are prepared to quit. While recall of in‐hospital advice was associated with future quit attempts, prepared patients who recalled receiving advice were more likely to make a quit attempt than prepared patients who did not recall receiving advice, as well as unprepared patients. Together, these findings highlight the need to consider a patient's level of preparedness to quit in understanding the success of in‐hospital advice and the importance of making evidence‐based cessation methods available to hospitalized smokers who are prepared to quit. Additionally, identifying patients not prepared to quit may help in providing them with appropriate motivational therapy, to move them along the stages of change, as well as educational information on how to quit once they have decided to do so.
- ,,.Helping hospitalized smokers quit: new directions for treatment and research.J Consult Clin Psychol.1993;61:778–789.
- ,.Smokers who are hospitalized: a window of opportunity for cessation interventions.Prev Med.1992;21:262–269.
- ,,, et al.Predictors of smoking cessation after a myocardial infarction: the role of institutional smoking cessation programs in improving success.Arch Intern Med.2008;168(18):1961–1967.
- Guideline Panel.Clinical Practice Guidelines: Treating Tobacco Use and Dependence.Washington, DC:Public Health Service, U.S. Department of Health and Human Services;2008.
- ,.Stages and processes of self‐change in smoking: toward an integrative model of change.J Consult Clin Psychol.1983;51:390–395.
- ,.The Contemplation Ladder: validation of a measure of readiness to consider smoking cessation.Health Psychol.1991;10(5):360–365.
- ,,,,.Smoking cessation factors among African Americans and Whites.Am J Public Health.1993;83(2):220–226.
- U.S. Department of Health and Human Services.The Health Benefits of Smoking Cessation.Rockville, MD:Office on Smoking and Health, Centers for Chronic Disease Prevention and Health Promotion, Public Health Service,U.S. Department of Health and Human Services,Washington, DC;2000.
- ,,,,.Trends in cigarette smoking in the United States. the changing influence of gender and race.JAMA.1989;261(1):49–55.
- ,,, et al.Effects of physician experience on costs and outcomes on an academic general medicine service: results of a trial of hospitalists.Ann Intern Med.2002;137(11):866–874.
- ,,,.Validation of a telephone version of the Mini‐Mental State Examination.J Am Geriatr Soc.1992;40(7):697–702.
- National Health Information Survey Questionnaire, Sample Adult,Adult Health Behaviors;2004.
- ,,, et al.The Marijuana Ladder: measuring motivation to change marijuana use in incarcerated adolescents.Drug Alcohol Depend.2006;83:42–48.
- ,,,,.Motivation for stopping tobacco use among emergency department patients.Acad Emerg Med.2005;12:568–571.
- Picker‐Commonwealth Survey of Patient‐Centered Care.Health Aff.1991.
- Hospital Quality Initiatives. Centers for Medicare and Medicaid Services (CMS). Available at: http://www.cms.hhs.gov/HospitalQualtiyInits. Accessed April2009.
- ,,, et al.The use of nicotine replacement therapy by hospitalized smokers.Am J Prev Med.1999;17(4):255–259.
- ,,,,.Methods used to quit smoking in the United States: do cessation programs help?JAMA.1990;263(20):2795–2796.
- U.S. Department of Health and Human Services.Hospital Compare.2006 Data Graphs. Available at: http://www.hospitalcompare.hhs.gov. Accessed April2009.
- ,,, et al.Office on Smoking and Health, National Center for Chronic Disease Prevention and Health Promotion, CDC. Cigarette smoking among adults—United States, 2006.MMWR Morb Mortal Wkly Rep.2007;56:1157–1161.
- ,,.Smoking cessation interventions for hospitalized smokers.Arch Intern Med.2008;168(18):1950–1960.
- ,.Health beliefs and smoking patterns in heart patients and their wives: a longitudinal study.Am J Public Health.1977;67:921–930.
Copyright © 2010 Society of Hospital Medicine

Factors of Care Plan Discussions at Admission
Despite an ideal of dying at home, most Americans die in hospitals.1 Patients and families are clear about what they need from the healthcare system at the end of life: relief of distressing symptoms, the opportunity to communicate with physicians and others about death and dying, and the assurance that they will be attended to and comforted by their physicians as they approach death.2, 3 However, discussions about patient preferences for care occur infrequently,47 even though patients want to discuss care with their doctor,68 and physicians believe these discussions are their responsibility.9
The most prominent work in this area occurred in the Study to Understand Prognoses and Preferences for Outcomes and Risks of Treatments (SUPPORT) study, which focused on patients with advanced disease, often in the intensive care unit.4 Furthermore, few studies have focused on general medical patients, and healthcare has changed in important ways since SUPPORT's publication. First, the Patient Self‐Determination Act (PSDA) requires that all patients be asked about their care wishes at the time of admission and document the presence of an advanced directive.10, 11 Second, there is growing awareness of the need to improve palliative care for all hospitalized patients, with many advocating that hospitalization itself is a reason to ask about patient's preferences for care regardless of a patient's level of chronic or acute illness.12 Finally, emergence of hospitalists,1316 movement toward closed intensive care units,17, 18 and changes in residency training have increased segmentation in care of hospitalized patients.15, 18
To overcome limitations of previous literature and update our knowledge of how care discussions take place in the current healthcare environment, we analyzed data from a large study of patients admitted to general medicine services at 6 academic centers. Using this robust dataset, which included prospectively collected information about preferences for communication with their physician, we performed statistical analyses to understand which patient clinical, sociodemographic, and preference‐related factors, as well as factors related to their site of care, were associated with documentation that a code status discussion took place at the time of hospital admission.
PATIENTS AND METHODS
Sites
The Multicenter Hospitalist Study (MCHS) was a multicenter trial of general medical services that enrolled patients at 6 geographically diverse centers: The University of Chicago (which also served as the coordinating center), University of Iowa Hospitals and Clinics, University of California San Francisco, University of Wisconsin, University of New Mexico, and Brigham and Women's Hospital.19
Each site was selected to participate in the MCHS because patients on their general medicine service were admitted to hospitalist and nonhospitalist physicians in a random fashion (eg, based on predetermined call schedule based on day of the week). As teaching hospitals, house officers provided direct care to patients hospitalized at each center; nonteaching services were not present at the sites during the period of this study.
During the period of this study, each site complied with PSDA requirements for noting that patients had been informed about their right to create an advance directive, but no sites had a guideline or other program in place specifically intended to facilitate physician‐patient communication about care wishes. Two sites had active Hospice or Palliative Care services, and another 2 had Geriatrics Consultation services, but none had standard protocols mandating involvement of these consultants at the time of admission, the time when our key outcomes were documented.
Patients
Patients were eligible for inclusion in the MCHS if they were older than 18 years of age and were admitted at random to a hospitalist or nonhospitalist physician; we excluded patients from MCHS if they were admitted specifically under the care of their primary care physician or subspecialist (eg, admitted for chemotherapy) or were a prison inmate. Patients meeting these eligibility criteria were then approached for purposes of informed consent.
Data Collection
Data for this study were obtained from administrative data, patient interview, and chart abstraction as in previous work.14 Administrative data were drawn from cost‐accounting databases at each participating hospital; administrative data were used to provide cost and length of stay data, as well as information about patient insurance type, age, and sex.
We interviewed patients immediately after informed consent was obtained, with both taking place generally within 24 hours of admission. Interviews collected data about patient preferences for care and functional status,20 and other data not reliably available from administrative sources (such as housing situation).
Patient care plan before admission was taken from notes and orders written in the first 24 hours of hospitalization, as mentioned above. Using criteria we employed in previous work,21 a care discussion (CD) was defined as documentation of a discussion between patients (or family) and at least 1 physician (primary physician, hospitalist, consulting physician, or house officer) during the first 24 hours of hospitalization. CDs needed to specify that the person who wrote the note had actually spoken with the patient or their family for the purposes of determining preferences for care, and that this discussion resulted in a specific care plan. Thus, notations such as do not resuscitate/do not intubate, or spoke with family, questions answered, did not qualify as CDs, but a note stating the patient continues to want full efforts was counted as a CD.
Principal investigators at each site were responsible for training and overseeing interviewing and chart abstraction activities at each site, with central oversight of data quality provided by the central coordinating center. Upon receipt at the data coordinating center, all data were examined for missing, nonsensical, or outlier data with errors referred back to the participating sites for correction.
Statistical Analysis
For bivariable comparisons of patients with and without CDs, we used chi‐squared or Mann‐Whitney U‐tests, as appropriate.
Variables with P < 0.20 in bivariable comparisons were selected for initial inclusion in models. Then, using automated forward and stepwise selection techniques as well as manually entered variables, we fit multivariable generalized estimating equations permitting clustering of effects at the physician level to determine the independent association between the multiple factors tested and presence of a CD. In order to guard against the threat of multiple testing, we retained variables at a significance level of P < 0.01; variables were also retained because of observed confounding with other independent variables, or to maintain face validity of the model. All analyses were performed using SAS 9.0 for Windows (SAS Institute Inc., Cary, NC).
RESULTS
Patient Sociodemographics (Table 1)
A total of 17,097 of 33,638 patients (50.8%) were interviewed and gave consent for chart abstraction. Of these patients, 1776 (10.3%) had a CD documented in the first 24 hours of hospitalization. Patients with documented CDs were older, more often white, had completed more years of education, were more likely to have lived in a nursing home prior to admission, and more likely to have been hospitalized in the last 12 months. The proportion of patients with CDs was highly variable across site of enrollment, from 2.8%‐24.9%.
| Value | No Documented CD (n = 15321, 89.7%) | Documented CD (n = 1776, 10.3%) | P* |
|---|---|---|---|
| |||
| Age (Median, 95%CI)* | 56 (55, 56) | 69 (67, 71) | < 0.0001 |
| Female (n, %) | 8390 (54.8%) | 990 (55.7%) | 0.4312 |
| Race (n, %) | |||
| White | 6640 (43.3%) | 938 (52.8%) | < 0.0001 |
| African American | 4673 (30.5%) | 280 (15.8%) | |
| Asian | 532 (3.5%) | 167 (9.4%) | |
| American Indian | 325 (2.1%) | 26 (1.5%) | |
| Other | 1951 (12.7%) | 241 (13.6%) | |
| Refused/Don't know | 1200 (7.8%) | 124 (7.0%) | |
| Ethnicity (n, %) | |||
| Hispanic or Latino Ethnicity | 1724 (11.3%) | 183 (10.3%) | 0.0039 |
| Insurance type (n, %) | |||
| Charity | 481 (3.4%) | 14 (0.8%) | < 0.0001 |
| Indemnity | 3983 (28.2%) | 327 (19.3%) | |
| Medicaid | 2487 (17.6%) | 195 (11.5%) | |
| Medicare | 6418 (45.5%) | 1114 (65.9%) | |
| Other | 105 (0.7%) | 4 (0.2%) | |
| Self pay | 628 (4.5%) | 36 (2.1%) | |
| Self‐reported education (n, %) | |||
| Junior high school or less | 1297 (8.5%) | 217 (12.2%) | < 0.0001 |
| Some high school | 2146 (14.0%) | 182 (10.2%) | |
| High school graduate | 4435 (28.9%) | 465 (26.2%) | |
| Some college or junior college | 3521 (23.0%) | 347 (19.5%) | |
| College graduate | 1729 (11.3%) | 255 (14.4%) | |
| Post‐graduate | 1191 (7.8%) | 173 (9.7%) | |
| Refused/Don't know | 1002 (6.5%) | 137 (7.7%) | |
| Self reported income (n, %) | |||
| $2,500 or less | 1079 (7.0%) | 108 (6.1%) | 0.0002 |
| $2,501 to $5,000 | 424 (2.8%) | 33 (1.9%) | |
| $5,001 to $10,000 | 1436 (9.4%) | 211 (11.9%) | |
| $10,001 to $15,000 | 1080 (7.0%) | 141 (7.9%) | |
| $15,001 to $25,000 | 1054 (6.9%) | 134 (7.5%) | |
| $25,001 to $35,000 | 837 (5.5%) | 74 (4.2%) | |
| $35,001 to $50,000 | 882 (5.8%) | 94 (5.3%) | |
| $50,001 to $100,000 | 1027 (6.7%) | 125 (7.0%) | |
| $100,001 to $200,000 | 357 (2.3%) | 57 (3.2%) | |
| Over $200,000 | 245 (1.6%) | 34 (1.9%) | |
| Don't know/refused | 6900 (45.0%) | 765 (43.1%) | |
| Housing situation (n, %) | |||
| Own apartment or house | 11887 (77.6%) | 1264 (71.2%) | < 0.0001 |
| A relative or friend's apartment or house | 1804 (11.8%) | 217 (12.2%) | |
| A nursing home, group home, or long‐term care facility | 663 (4.3%) | 204 (11.5%) | |
| A homeless shelter | 258 (1.7%) | 27 (1.5%) | |
| Other | 709 (4.6%) | 64 (3.6%) | |
| Marital status (n, %) | |||
| Married | 4992 (32.6%) | 603 (34.0%) | < 0.0001 |
| Living as if married | 440 (2.9%) | 32 (1.8%) | |
| Divorced | 2027 (13.2%) | 199 (11.2%) | |
| Separated | 569 (3.7%) | 30 (1.7%) | |
| Widowed | 2577 (16.8%) | 487 (27.4%) | |
| Single | 4074 (26.6%) | 364 (20.5%) | |
| Refused | 642 (4.2%) | 61 (3.4%) | |
| Hospitalized in the last 12 months (n, %) | 7602 (49.6%) | 1011 (56.9%) | < 0.0001 |
| Site of enrollment (n, %) | |||
| A | 4602 (30.0%) | 135 (7.6%) | < 0.0001 |
| B | 1595 (10.4%) | 158 (8.9%) | |
| C | 3017 (19.7%) | 998 (56.2%) | |
| D | 2387 (15.6%) | 212 (11.9%) | |
| E | 2057 (13.4%) | 131 (7.4%) | |
| F | 1663 (10.9%) | 142 (8.0%) | |
Patient Self‐Reported Health Status and Comorbid Illness (Table 2)
Patients with CDs more often reported a lot of difficulties with bathing, eating, or dressing; household chores; and moderate activities. Patients with CDs were more likely to report accomplishing less than they would like due to their health. They were more likely to have cancer, depression, a history of stroke, and heart disease, but less likely to have diabetes or human immunodeficiency virus.
| Value | No Documented CD (n = 15321, 89.7%) | Documented CD (n = 1776, 10.3%) | P** |
|---|---|---|---|
| |||
| Thinking back again to one month ago, did any impairment or health problem cause you to need help of other persons with personal care needs, such as eating, bathing, dressing, or getting around the home? (n, %) | |||
| No | 10673 (69.7%) | 973 (54.8%) | < 0.0001 |
| Yes, a little | 1933 (12.6%) | 268 (15.1%) | |
| Yes, a lot | 2127 (13.9%) | 487 (27.4%) | |
| Don't know | 588 (3.8%) | 48 (2.7%) | |
| Thinking back to one month ago, did any impairment or health problem cause you to need help in handling everyday household chores, necessary business, shopping, or getting around for other purposes? (n, %) | |||
| No | 7262 (47.4%) | 566 (31.9%) | < 0.0001 |
| Yes, a little | 2692 (17.6%) | 324 (18.2%) | |
| Yes, a lot | 4126 (26.9%) | 825 (46.5%) | |
| Don't know | 1241 (8.1%) | 61 (3.4%) | |
| As far as you know do you have any of the following health conditions at the present time? (n, %) | |||
| Cancer | |||
| No | 13281 (86.7%) | 1376 (77.5%) | < 0.0001 |
| Yes | 1751 (11.4%) | 351 (19.8%) | |
| Not sure | 289 (1.9%) | 49 (2.8%) | |
| Depression | |||
| No | 10269 (67.0%) | 1099 (61.9%) | < 0.0001 |
| Yes | 4730 (30.9%) | 624 (35.1%) | |
| Not sure | 322 (2.1%) | 53 (3.0%) | |
| Diabetes | |||
| No | 10902 (71.2%) | 1356 (76.4%) | < 0.0001 |
| Yes | 4132 (27.0%) | 394 (22.2%) | |
| Not sure | 287 (1.9%) | 26 (1.5%) | |
| Heart trouble | |||
| No | 10251 (66.9%) | 1080 (60.8%) | < 0.0001 |
| Yes | 4491 (29.3%) | 627 (35.3%) | |
| Not sure | 579 (3.8%) | 69 (3.9%) | |
| HIV or AIDS | |||
| No | 14300 (93.3%) | 1679 (94.5%) | 0.026 |
| Yes | 912 (6.0%) | 80 (4.5%) | |
| Not sure | 109 (0.7%) | 17 (1.0%) | |
| Stroke | |||
| No | 13344 (87.1%) | 1494 (84.1%) | 0.0005 |
| Yes | 1722 (11.2%) | 236 (13.3%) | |
| Not sure | 255 (1.7%) | 46 (2.6%) | |
Patient Preferences, Care Plan Documentation, and Care Coordination at Admission (Table 3)
Patients who had documented CDs were less likely to prefer my doctor give me choices regarding my care, and more often disagreed with the statement I prefer to leave care decisions to my physician. These patients were also more likely to have a durable power of attorney or living will in their chart, or have an alternate decision‐maker noted. The majority of patients without a documented CD (79.9%) had no notation of their care wishes, compared to 29.7% in patients with a documented CD. Patients with a documented CD were more likely to have a regular medical provider and a note in the chart from their primary care physician.
| Value | No Documented CD (n = 15321, 89.7%) | Documented CD (n = 1776, 10.3%) | P* |
|---|---|---|---|
| |||
| I prefer my doctor give me choices regarding my care** (n, %) | |||
| Definitely agree | 11619 (75.8%) | 1247 (70.2%) | < 0.0001 |
| Somewhat agree | 1912 (12.5%) | 252 (14.2%) | |
| Somewhat disagree | 488 (3.2%) | 76 (4.3%) | |
| Definitely disagree | 414 (2.7%) | 87 (4.9%) | |
| Don't know | 888 (5.8%) | 114 (6.4%) | |
| I prefer to leave care decisions to my physician** (n, %) | |||
| Definitely agree | 5660 (36.9%) | 613 (34.5%) | < 0.0001 |
| Somewhat agree | 4539 (29.6%) | 493 (27.8%) | |
| Somewhat disagree | 2265 (14.8%) | 257 (14.5%) | |
| Definitely disagree | 1956 (12.8%) | 304 (17.1%) | |
| Don't know | 901 (5.9%) | 109 (6.1%) | |
| Documentation of care wishes before hospitalization (n, %) | |||
| No documentation | 12238 (79.9%) | 527 (29.7%) | < 0.0001 |
| Full support | 2624 (17.1%) | 742 (41.8%) | |
| Do not resuscitate or intubate (DNR/DNI) | 264 (1.7%) | 370 (20.8%) | |
| Hospice | 53 (0.3%) | 22 (1.2%) | |
| Other limitation (eg, no pressors) | 142 (0.9%) | 115 (6.5%) | |
| Had durable power of attorney in chart (n, %) | 286 (1.9%) | 133 (7.5%) | < 0.0001 |
| Had a living will in chart (n, %) | 266 (1.7%) | 142 (8.0%) | < 0.0001 |
| Alternate decision maker named in chart (n, %) | 2770 (18.1%) | 638 (35.9%) | < 0.0001 |
| Patient noted to be unable to participate in their care at admission (eg, confused, unable to respond) (n, %) | 1227 (8.0%) | 431 (24.3%) | < 0.0001 |
| Inpatient team documented discussion with primary care physician (n, %) | 627 (4.1%) | 136 (7.7%) | < 0.0001 |
| Do not have a regular medical provider** (n, %) | 3836 (25.0%) | 254 (14.3%) | < 0.0001 |
| Note from primary care physician in chart (n, %) | 148 (1.0%) | 39 (2.2%) | < 0.0001 |
Factors Associated with Documented Care Discussions (Table 4)
Using predictor variables presented in Tables 1‐3, we then constructed multivariable models seeking to understand factors independently associated with documentation of code status in the entire cohort, as well as among patients who had no preexisting care wishes.
| Entire Cohort (n = 17097) | Patients with No Documentation of Preadmission Wishes (n = 12765) | |||
|---|---|---|---|---|
| Adjusted Odds Ratio (95% CI) | P Value | Adjusted Odds Ratio (95% CI) | P Value | |
| Preadmission Code Status | ||||
| No documentation | Referent | NA | ||
| Full support | 3.22 (2.28, 4.55) | < 0.0001 | NA | |
| Do not resuscitate or intubate (DNR/DNI) | 11.32 (8.52, 15.04) | < 0.0001 | NA | |
| Hospice | 4.02 (2.33, 6.94) | < 0.0001 | NA | |
| Other limitation (eg, no pressors) | 10.13 (7.35, 13.96) | < 0.0001 | NA | |
| Insurance type | ||||
| Medicare | Referent | Referent | ||
| Charity care | 0.50 (0.30, 0.85) | 0.0099 | 0.56 (0.25, 1.25) | 0.1589 |
| Commercial | 0.81 (0.69, 0.95) | 0.0090 | 0.66 (0.52, 0.85) | 0.0009 |
| Medicaid | 0.69 (0.57, 0.82) | < 0.0001 | 0.49 (0.36, 0.67) | < 0.0001 |
| Other | 0.46 (0.18, 1.13) | 0.0912 | 0.60 (0.17, 2.12) | 0.4302 |
| Self pay | 0.70 (0.52, 0.95) | 0.0203 | 0.49 (0.29, 0.81) | 0.0060 |
| Any limitations in bathing, toileting, dressing or feeding self? | ||||
| No | Referent | Referent | ||
| Yes, a little | 1.25 (1.10, 1.42) | 0.0007 | 1.31 (1.03, 1.67) | 0.0272 |
| Yes, a lot | 1.25 (1.09, 1.43) | 0.0015 | 1.42 (1.11, 1.81) | 0.0055 |
| Unable to respond | 0.81 (0.59, 1.12) | 0.2006 | 0.80 (0.45, 1.41) | 0.4299 |
| Patient has a documented surrogate decision maker | 1.72 (1.47, 2.02) | < 0.0001 | 2.08 (1.62, 2.66) | < 0.0001 |
| Patient noted to be unable to participate in their care at admission (eg, confused, unable to respond) | 1.63 (1.37, 1.94) | < 0.0001 | 2.20 (1.60, 3.02) | < 0.0001 |
| Notation that team had spoken to primary care physician at admission | 1.65 (1.29, 2.11) | < 0.0001 | 1.45 (0.92, 2.28) | 0.1116 |
| History of cancer | ||||
| No | Referent | Referent | ||
| Yes | 1.31 (1.13, 1.51) | 0.0003 | 1.26 (0.96, 1.65) | 0.0960 |
| Not sure | 1.26 (0.87, 1.82) | 0.2162 | 1.80 (1.03, 3.15) | 0.0396 |
| History of diabetes | ||||
| No | Referent | Referent | ||
| Yes | 0.87 (0.75, 1.003) | 0.0543 | 0.79 (0.62, 0.997) | 0.0467 |
| Not sure | 0.61 (0.38, 0.99) | 0.0445 | 0.84 (0.43, 1.65) | 0.6183 |
| Housing situation | ||||
| Own house or apartment | Referent | Referent | ||
| Relative or friend's apartment or house | 1.22 (1.03, 1.45) | 0.0229 | 1.29 (0.97, 1.71) | 0.0783 |
| Nursing home, group home, or long‐term care facility | 1.42 (1.16, 1.74) | 0.0006 | 1.74 (1.27, 2.40) | 0.0007 |
| Homeless shelter | 1.12 (0.72, 1.73) | 0.6204 | 0.87 (0.46, 1.63) | 0.6559 |
| Other/Don't know | 1.02 (0.75, 1.40) | 0.8987 | 1.35 (0.78, 2.36) | 0.2859 |
| Age Group | ||||
| <50 | Referent | Referent | ||
| 5059 | 1.19 (0.99, 1.43) | 0.0647 | 1.18 (0.88, 1.59) | 0.2583 |
| 6069 | 1.18 (0.99, 1.40) | 0.0585 | 1.20 (0.88, 1.66) | 0.2549 |
| 7079 | 1.10 (0.91, 1.33) | 0.3178 | 1.19 (0.85, 1.67) | 0.3033 |
| 8089 | 1.23 (1.03, 1.47) | 0.0207 | 1.34 (0.96, 1.88) | 0.0879 |
| 90+ | 1.45 (1.12, 1.88) | 0.0045 | 1.44 (0.94, 2.20) | 0.0934 |
| Site of Enrollment | ||||
| A | Referent | Referent | ||
| B | 1.74 (1.16, 2.61) | 0.007 | 4.95 (2.90, 8.45) | < 0.0001 |
| C | 5.14 (3.42, 7.74) | < 0.0001 | 26.36 (17.28, 40.23) | < 0.0001 |
| D | 4.19 (2.64, 6.66) | < 0.0001 | 8.06 (4.63, 14.03) | < 0.0001 |
| E | 3.00 (1.82, 4.9) | < 0.0001 | 5.30 (2.71, 10.38) | < 0.0001 |
| F | 4.09 (2.69, 6.23) | < 0.0001 | 2.32 (1.32, 4.08) | 0.0037 |
In the entire cohort, insurance type was independently associated with likelihood of a care discussion, with patients with Medicare having greater adjusted odds ratio for a CD than patients with all other forms of insurance, even after adjusting for age. Patients who had functional limitations with bathing, toileting, and feeding; had a documented surrogate decision maker; were unable to participate in their care; had cancer; or did not live in their own home were more likely to have a documented CD. Subjects with diabetes were less likely to have a CD, although this was of borderline significance. Patients whose team had documented a CD with the patients' primary physician were also more likely to have a discussion noted. However, the magnitude of these predictors was small compared to the independent effects attributable to the site the patient was enrolled or whether the patient had any preexisting documentation. Whereas the adjusted odds ratio associated with clinical or functional measures (such as age, cancer) were generally between 1.5 and 2.5, the range of odds ratios associated with having any documentation of care wishes (compared to no documentation) were all greater than 3, and the odds ratios associated with site of enrollment were 1.7 or higher.
We observed similar findings in analyses limited to patients with no preexisting care documentation. While clinical, sociodemographic, and functional factors remained statistically associated with a CD (albeit with wider confidence intervals due to smaller sample sizes), the effect of the patient's site of enrollment became even more striking (Table 4).
DISCUSSION
In this multicenter study of hospitalized general medical patients, documentation of CDs were highly dependent on where patients received care and whether patients had previous documentation of a care plan. In contrast, although clinical, prognostic, and socioeconomic factors were also associated with whether physicians documented asking patients about their wishes for care, the influence of these factors was modest.
Improving communication between patients and their physicians during an episode of acute illness has been a long‐standing goal, with the Study to Understand Prognoses and Preferences for Outcomes of Treatment (SUPPORT) trial providing the most notable example of an effort to improve patient care through aligning patient wishes, prognosis, and aggressiveness for care. However, even the SUPPORT interventiona robust, well‐implemented, and highly labor‐intensive strategywas not able to achieve this goal. In their summary of SUPPORT study findings, the authors suggested that the likelihood of and effectiveness of communication in seriously ill patients may be powerfully influenced by patient and caregiver culture4; our findings may partially confirm SUPPORT's conclusions.
Preexisting documentation in our study would not have included mandated documentation that someone had given the patient information about advance directives (as mandated by the PSDA), but rather a specification for that advance care plan. This distinction means that preexisting documentation in our study represented a previous decision by the patient (or the patient and their physician) to have made a plan, and an association with hospital discussions may be because the first conversation is the hardest to undertake; subsequent discussions then represent confirmatory or clarifying discussions that may be less difficult to broach (particularly for less experienced trainees). A CD may have also been prompted when documentation was unclear, or when a change in prognosis took place (eg, a new diagnosis of metastatic cancer).22 Alternatively, a preexisting plan may serve as a reminder for clinicians to discuss code status, signify patients who are more willing to broach this subject, and either seem more approachable or bring up the topic themselves.
The influence of site on documentation and CD provides additional evidence that caregiver culture played a role in CDs. Although this variation may have been in part due to culture around documentation practices more generally, it is important to note that none of our participating centers had a policy for documentation of care wishes or patient‐doctor communication, or a policy mandating these discussions in any specific patient group. Furthermore, site‐related differences were seen even in patients with no preexisting documentation, and were seen after adjustment for other documentation or communication practices (eg, documenting a discussion with the patient's primary care provider), making it unlikely that documentation practices are solely responsible for our results. Persistence of variations in care documentation raises interesting questions, particularly when one considers recent data describing variations in end‐of‐life care between similar academic centers (one of which was a participating site in this trial).23 Given that the sites in our study represent diverse institutions yet share a number of characteristics, understanding the specific practices or aspects of medical culture that promote conversations may provide insights in how to improve this promotion elsewhere.
Our results would argue that mandates to document code status on admission may be unlikely to improve communication unless sites also develop an approach to using this newly documented information as a prompt for subsequent discussions. In nursing home settings, documentation of advance directives may reduce resource use, but it is unclear whether similar effects will be seen in hospital settings.24 It is also a challenge to insure that documentation of a care plan in the nursing home is communicated to the providers in the hospital.25 The PSDA was a first step in this direction, but its effects on improving communication are uncertain.26 Our results would confirm that the PSDA or systems to mandate documentation are not solutions in themselves, but are 2 steps in a larger process.
We do not want to discount our findings of less frequent CDs among patients of lower socioeconomic status, where gaps in quality of care, communication, and outcomes are well‐recognized.27 As such, our results delineate yet another area where practice can and should be improved for vulnerable patients. However, factors related to site of care and documentation may provide opportunities to improve care even more profoundly and within a fairly discrete (if complex) acute episode of care. Having said this, our results also demonstrate a potential pitfall of using code status documentation for risk‐adjustment, because such notation may be more dependent on local documentation patterns than clinical appropriateness.
Our study has a number of limitations. As an observational study, our findings are likely prone to biases related to unadjusted confounding due to comorbidity. The influence of comorbidity would seem to have been most important in biasing the effects of preexisting documentation, where documentation would be associated with more unaccounted comorbidity. However, there were no differences in documentation even after accounting for prognosis by adjusting for age, functional status, and a valid comorbidity score.28 As we have pointed out, our key outcome is based on documentation of communication and not actual communication, and as such may be biased in subtle ways not related to site of care or the items tested in our model. While we cannot directly eliminate the possibility of documentation biases in our results using statistical methods, it is important to point out that our chart abstraction protocol used highly specific criteria to detect these discussions, and therefore may under‐detect discussions which may have been documented in less detail. Our study did not examine whether documentation of CDs influenced subsequent care. However, previous studies have shown that advance care planning has only a minor influence on care.29 However, communication about preferences at the time of admission, when the need for specific care decisions may be more evident, may be more likely to influence hospital care. Our results show that previous documentation is associated with discussions early in an admission. Such discussion may affect care, even if the decision made is different than what was previously documented. In addition, patients who were included in our study (those able to provide consent and participate in an interview) may be healthier or more cognitively intact than a general population of hospitalized patients. However, how this would have affected our results is unclear. Being able to speak and consent for oneself are key facilitators to communication, but sicker patients who cannot consent or speak for themselves might also be more likely to have care planning decisions made based on illness severity; documentation in these patients may be more driven by whether such notes were required because of the involvement of home health services (or skilled nursing facilities). Finally, although our study is one of the largest examinations of in‐hospital communication to date and its implications for resident education are worth noting, the sites involved in the MCHS may not be representative of nonteaching hospitals, or community‐based teaching hospitals.
Our results suggest that, although comorbid illness and socioeconomic status play an important role in determining which patients receive CDs at the time of admission, these factors are substantially less powerful than preexisting documentation practices and culture or care practices specific to their site of care. These results suggest that future work should consider organizational characteristics and culture as important targets for interventions to improve care planning in hospitalized patients.
- Committee on Care at the End of Life, Institute of Medicine.Approaching Death: Improving Care at the End of Life.Field MJ,Cassel CK, eds.Washington, DC:National Academy Press;1997.
- ,,,,,.Factors considered important at the end of life by patients, family, physicians, and other care providers.JAMA.2000;284(19):2476–2482.
- ,,,,,.In search of a good death: observations of patients, families, and providers.Ann Intern Med.2000;132(10):825–832.
- The SUPPORT Principal Investigators.A controlled trial to improve care for seriously ill hospitalized patients. The study to understand prognoses and preferences for outcomes and risks of treatments (SUPPORT).JAMA.1995;274(20):1591–1598.
- ,.Choices about cardiopulmonary resuscitation in the hospital. When do physicians talk with patients?N Engl J Med.1984;310(17):1089–1093.
- ,,, et al.Patient preferences for communication with physicians about end‐of‐life decisions. SUPPORT Investigators. Study to Understand Prognoses and Preference for Outcomes and Risks of Treatment.Ann Intern Med.1997;127(1):1–12.
- ,,,.Discussing cardiopulmonary resuscitation: a study of elderly outpatients.J Gen Intern Med.1988;3(4):317–321.
- ,,,,.Educating the elderly: cardiopulmonary resuscitation decisions before and after intervention.J Am Geriatr Soc.1991;39(4):372–377.
- ,,,.Factors influencing physicians in recommending in‐hospital cardiopulmonary resuscitation.Arch Intern Med.1993;153(17):1999–2003.
- Federal Register. 42 USC 1395‐1396. Patient Self‐Determination Act1990.
- ,,.Advance directives on admission. Clinical implications and analysis of the Patient Self‐Determination Act of 1990.JAMA.1991;266(3):402–405.
- ,,.A new doctor in the house: ethical issues in hospitalist systems.JAMA.1999;282(2):171–174.
- ,,,,,.Implementation of a hospitalist service at a community teaching hospital: improving clinical efficiency and patient outcomes.Ann Intern Med.2002;137:859–865.
- ,,, et al.Effects of hospitalist physicians on an academic general medical service: results of a randomized trial.Ann Intern Med.2002;137:866–874.
- ,.The hospitalist movement 5 years later.JAMA.2002;287(4):487–494.
- ,,,,.Reorganizing an academic medical service: impact on cost, quality, patient satisfaction, and education.JAMA.1998;279(19):1560–1565.
- ,,,,,.Physician staffing patterns and clinical outcomes in critically ill patients: a systematic review.JAMA.2002;288(17):2151–2162.
- ,,, et al.Organizational characteristics of intensive care units related to outcomes of abdominal aortic surgery.JAMA.1999;281(14):1310–1317.
- ,,, et al.Effects of inpatient experience on outcomes and costs in a multicenter trial of academic hospitalists.J Gen Intern Med.2005;20(Suppl 1):141–142.
- ,,.SF‐12: How to Score the SF‐12 Physical and Mental Health Summary Scales.2nd ed.Boston, MA:New England Medical Center, The Health Institute;1995.
- ,.End‐of‐life care in a voluntary hospitalist model: effects on communication, processes of care, and patient symptoms.Am J Med.2004;116(10):669–675.
- ,,,.Role of written advance directives in decision making: insights from qualitative and quantitative data.J Gen Intern Med.1998;13(7):439–446.
- ,,,,.Evaluating the efficiency of California providers in caring for patients with chronic illnesses.Health Aff (Millwood).2005 Jul‐Dec;Suppl Web Exclusives:W5–526–43.
- ,,, et al.Systematic implementation of an advance directive program in nursing homes: a randomized controlled trial.JAMA.2000;283(11):1437–1444.
- ,.Meeting palliative care needs in post‐acute care settings: “to help them live until they die”.JAMA.2006;295(6):681–686.
- ,,, et al.Advance directives for seriously ill hospitalized patients: effectiveness with the patient self‐determination act and the SUPPORT intervention. SUPPORT Investigators. Study to Understand Prognoses and Preferences for Outcomes and Risks of Treatment.J Am Geriatr Soc.1997;45(4):500–507.
- Institute of Medicine.Unequal Treatment: Confronting Racial and Ethnic Disparities in Health Care.Smedley BD,Stith AY,Nelson AR, eds.Washington, DC:National Academies Press;2003.
- ,,.Use of a self‐report‐generated Charlson Comorbidity Index for predicting mortality.Med Care.2005;43(6):607–615.
- ,,.Can clinical interventions change care at the end of life?Ann Intern Med.1997;126(5):381–388.
Despite an ideal of dying at home, most Americans die in hospitals.1 Patients and families are clear about what they need from the healthcare system at the end of life: relief of distressing symptoms, the opportunity to communicate with physicians and others about death and dying, and the assurance that they will be attended to and comforted by their physicians as they approach death.2, 3 However, discussions about patient preferences for care occur infrequently,47 even though patients want to discuss care with their doctor,68 and physicians believe these discussions are their responsibility.9
The most prominent work in this area occurred in the Study to Understand Prognoses and Preferences for Outcomes and Risks of Treatments (SUPPORT) study, which focused on patients with advanced disease, often in the intensive care unit.4 Furthermore, few studies have focused on general medical patients, and healthcare has changed in important ways since SUPPORT's publication. First, the Patient Self‐Determination Act (PSDA) requires that all patients be asked about their care wishes at the time of admission and document the presence of an advanced directive.10, 11 Second, there is growing awareness of the need to improve palliative care for all hospitalized patients, with many advocating that hospitalization itself is a reason to ask about patient's preferences for care regardless of a patient's level of chronic or acute illness.12 Finally, emergence of hospitalists,1316 movement toward closed intensive care units,17, 18 and changes in residency training have increased segmentation in care of hospitalized patients.15, 18
To overcome limitations of previous literature and update our knowledge of how care discussions take place in the current healthcare environment, we analyzed data from a large study of patients admitted to general medicine services at 6 academic centers. Using this robust dataset, which included prospectively collected information about preferences for communication with their physician, we performed statistical analyses to understand which patient clinical, sociodemographic, and preference‐related factors, as well as factors related to their site of care, were associated with documentation that a code status discussion took place at the time of hospital admission.
PATIENTS AND METHODS
Sites
The Multicenter Hospitalist Study (MCHS) was a multicenter trial of general medical services that enrolled patients at 6 geographically diverse centers: The University of Chicago (which also served as the coordinating center), University of Iowa Hospitals and Clinics, University of California San Francisco, University of Wisconsin, University of New Mexico, and Brigham and Women's Hospital.19
Each site was selected to participate in the MCHS because patients on their general medicine service were admitted to hospitalist and nonhospitalist physicians in a random fashion (eg, based on predetermined call schedule based on day of the week). As teaching hospitals, house officers provided direct care to patients hospitalized at each center; nonteaching services were not present at the sites during the period of this study.
During the period of this study, each site complied with PSDA requirements for noting that patients had been informed about their right to create an advance directive, but no sites had a guideline or other program in place specifically intended to facilitate physician‐patient communication about care wishes. Two sites had active Hospice or Palliative Care services, and another 2 had Geriatrics Consultation services, but none had standard protocols mandating involvement of these consultants at the time of admission, the time when our key outcomes were documented.
Patients
Patients were eligible for inclusion in the MCHS if they were older than 18 years of age and were admitted at random to a hospitalist or nonhospitalist physician; we excluded patients from MCHS if they were admitted specifically under the care of their primary care physician or subspecialist (eg, admitted for chemotherapy) or were a prison inmate. Patients meeting these eligibility criteria were then approached for purposes of informed consent.
Data Collection
Data for this study were obtained from administrative data, patient interview, and chart abstraction as in previous work.14 Administrative data were drawn from cost‐accounting databases at each participating hospital; administrative data were used to provide cost and length of stay data, as well as information about patient insurance type, age, and sex.
We interviewed patients immediately after informed consent was obtained, with both taking place generally within 24 hours of admission. Interviews collected data about patient preferences for care and functional status,20 and other data not reliably available from administrative sources (such as housing situation).
Patient care plan before admission was taken from notes and orders written in the first 24 hours of hospitalization, as mentioned above. Using criteria we employed in previous work,21 a care discussion (CD) was defined as documentation of a discussion between patients (or family) and at least 1 physician (primary physician, hospitalist, consulting physician, or house officer) during the first 24 hours of hospitalization. CDs needed to specify that the person who wrote the note had actually spoken with the patient or their family for the purposes of determining preferences for care, and that this discussion resulted in a specific care plan. Thus, notations such as do not resuscitate/do not intubate, or spoke with family, questions answered, did not qualify as CDs, but a note stating the patient continues to want full efforts was counted as a CD.
Principal investigators at each site were responsible for training and overseeing interviewing and chart abstraction activities at each site, with central oversight of data quality provided by the central coordinating center. Upon receipt at the data coordinating center, all data were examined for missing, nonsensical, or outlier data with errors referred back to the participating sites for correction.
Statistical Analysis
For bivariable comparisons of patients with and without CDs, we used chi‐squared or Mann‐Whitney U‐tests, as appropriate.
Variables with P < 0.20 in bivariable comparisons were selected for initial inclusion in models. Then, using automated forward and stepwise selection techniques as well as manually entered variables, we fit multivariable generalized estimating equations permitting clustering of effects at the physician level to determine the independent association between the multiple factors tested and presence of a CD. In order to guard against the threat of multiple testing, we retained variables at a significance level of P < 0.01; variables were also retained because of observed confounding with other independent variables, or to maintain face validity of the model. All analyses were performed using SAS 9.0 for Windows (SAS Institute Inc., Cary, NC).
RESULTS
Patient Sociodemographics (Table 1)
A total of 17,097 of 33,638 patients (50.8%) were interviewed and gave consent for chart abstraction. Of these patients, 1776 (10.3%) had a CD documented in the first 24 hours of hospitalization. Patients with documented CDs were older, more often white, had completed more years of education, were more likely to have lived in a nursing home prior to admission, and more likely to have been hospitalized in the last 12 months. The proportion of patients with CDs was highly variable across site of enrollment, from 2.8%‐24.9%.
| Value | No Documented CD (n = 15321, 89.7%) | Documented CD (n = 1776, 10.3%) | P* |
|---|---|---|---|
| |||
| Age (Median, 95%CI)* | 56 (55, 56) | 69 (67, 71) | < 0.0001 |
| Female (n, %) | 8390 (54.8%) | 990 (55.7%) | 0.4312 |
| Race (n, %) | |||
| White | 6640 (43.3%) | 938 (52.8%) | < 0.0001 |
| African American | 4673 (30.5%) | 280 (15.8%) | |
| Asian | 532 (3.5%) | 167 (9.4%) | |
| American Indian | 325 (2.1%) | 26 (1.5%) | |
| Other | 1951 (12.7%) | 241 (13.6%) | |
| Refused/Don't know | 1200 (7.8%) | 124 (7.0%) | |
| Ethnicity (n, %) | |||
| Hispanic or Latino Ethnicity | 1724 (11.3%) | 183 (10.3%) | 0.0039 |
| Insurance type (n, %) | |||
| Charity | 481 (3.4%) | 14 (0.8%) | < 0.0001 |
| Indemnity | 3983 (28.2%) | 327 (19.3%) | |
| Medicaid | 2487 (17.6%) | 195 (11.5%) | |
| Medicare | 6418 (45.5%) | 1114 (65.9%) | |
| Other | 105 (0.7%) | 4 (0.2%) | |
| Self pay | 628 (4.5%) | 36 (2.1%) | |
| Self‐reported education (n, %) | |||
| Junior high school or less | 1297 (8.5%) | 217 (12.2%) | < 0.0001 |
| Some high school | 2146 (14.0%) | 182 (10.2%) | |
| High school graduate | 4435 (28.9%) | 465 (26.2%) | |
| Some college or junior college | 3521 (23.0%) | 347 (19.5%) | |
| College graduate | 1729 (11.3%) | 255 (14.4%) | |
| Post‐graduate | 1191 (7.8%) | 173 (9.7%) | |
| Refused/Don't know | 1002 (6.5%) | 137 (7.7%) | |
| Self reported income (n, %) | |||
| $2,500 or less | 1079 (7.0%) | 108 (6.1%) | 0.0002 |
| $2,501 to $5,000 | 424 (2.8%) | 33 (1.9%) | |
| $5,001 to $10,000 | 1436 (9.4%) | 211 (11.9%) | |
| $10,001 to $15,000 | 1080 (7.0%) | 141 (7.9%) | |
| $15,001 to $25,000 | 1054 (6.9%) | 134 (7.5%) | |
| $25,001 to $35,000 | 837 (5.5%) | 74 (4.2%) | |
| $35,001 to $50,000 | 882 (5.8%) | 94 (5.3%) | |
| $50,001 to $100,000 | 1027 (6.7%) | 125 (7.0%) | |
| $100,001 to $200,000 | 357 (2.3%) | 57 (3.2%) | |
| Over $200,000 | 245 (1.6%) | 34 (1.9%) | |
| Don't know/refused | 6900 (45.0%) | 765 (43.1%) | |
| Housing situation (n, %) | |||
| Own apartment or house | 11887 (77.6%) | 1264 (71.2%) | < 0.0001 |
| A relative or friend's apartment or house | 1804 (11.8%) | 217 (12.2%) | |
| A nursing home, group home, or long‐term care facility | 663 (4.3%) | 204 (11.5%) | |
| A homeless shelter | 258 (1.7%) | 27 (1.5%) | |
| Other | 709 (4.6%) | 64 (3.6%) | |
| Marital status (n, %) | |||
| Married | 4992 (32.6%) | 603 (34.0%) | < 0.0001 |
| Living as if married | 440 (2.9%) | 32 (1.8%) | |
| Divorced | 2027 (13.2%) | 199 (11.2%) | |
| Separated | 569 (3.7%) | 30 (1.7%) | |
| Widowed | 2577 (16.8%) | 487 (27.4%) | |
| Single | 4074 (26.6%) | 364 (20.5%) | |
| Refused | 642 (4.2%) | 61 (3.4%) | |
| Hospitalized in the last 12 months (n, %) | 7602 (49.6%) | 1011 (56.9%) | < 0.0001 |
| Site of enrollment (n, %) | |||
| A | 4602 (30.0%) | 135 (7.6%) | < 0.0001 |
| B | 1595 (10.4%) | 158 (8.9%) | |
| C | 3017 (19.7%) | 998 (56.2%) | |
| D | 2387 (15.6%) | 212 (11.9%) | |
| E | 2057 (13.4%) | 131 (7.4%) | |
| F | 1663 (10.9%) | 142 (8.0%) | |
Patient Self‐Reported Health Status and Comorbid Illness (Table 2)
Patients with CDs more often reported a lot of difficulties with bathing, eating, or dressing; household chores; and moderate activities. Patients with CDs were more likely to report accomplishing less than they would like due to their health. They were more likely to have cancer, depression, a history of stroke, and heart disease, but less likely to have diabetes or human immunodeficiency virus.
| Value | No Documented CD (n = 15321, 89.7%) | Documented CD (n = 1776, 10.3%) | P** |
|---|---|---|---|
| |||
| Thinking back again to one month ago, did any impairment or health problem cause you to need help of other persons with personal care needs, such as eating, bathing, dressing, or getting around the home? (n, %) | |||
| No | 10673 (69.7%) | 973 (54.8%) | < 0.0001 |
| Yes, a little | 1933 (12.6%) | 268 (15.1%) | |
| Yes, a lot | 2127 (13.9%) | 487 (27.4%) | |
| Don't know | 588 (3.8%) | 48 (2.7%) | |
| Thinking back to one month ago, did any impairment or health problem cause you to need help in handling everyday household chores, necessary business, shopping, or getting around for other purposes? (n, %) | |||
| No | 7262 (47.4%) | 566 (31.9%) | < 0.0001 |
| Yes, a little | 2692 (17.6%) | 324 (18.2%) | |
| Yes, a lot | 4126 (26.9%) | 825 (46.5%) | |
| Don't know | 1241 (8.1%) | 61 (3.4%) | |
| As far as you know do you have any of the following health conditions at the present time? (n, %) | |||
| Cancer | |||
| No | 13281 (86.7%) | 1376 (77.5%) | < 0.0001 |
| Yes | 1751 (11.4%) | 351 (19.8%) | |
| Not sure | 289 (1.9%) | 49 (2.8%) | |
| Depression | |||
| No | 10269 (67.0%) | 1099 (61.9%) | < 0.0001 |
| Yes | 4730 (30.9%) | 624 (35.1%) | |
| Not sure | 322 (2.1%) | 53 (3.0%) | |
| Diabetes | |||
| No | 10902 (71.2%) | 1356 (76.4%) | < 0.0001 |
| Yes | 4132 (27.0%) | 394 (22.2%) | |
| Not sure | 287 (1.9%) | 26 (1.5%) | |
| Heart trouble | |||
| No | 10251 (66.9%) | 1080 (60.8%) | < 0.0001 |
| Yes | 4491 (29.3%) | 627 (35.3%) | |
| Not sure | 579 (3.8%) | 69 (3.9%) | |
| HIV or AIDS | |||
| No | 14300 (93.3%) | 1679 (94.5%) | 0.026 |
| Yes | 912 (6.0%) | 80 (4.5%) | |
| Not sure | 109 (0.7%) | 17 (1.0%) | |
| Stroke | |||
| No | 13344 (87.1%) | 1494 (84.1%) | 0.0005 |
| Yes | 1722 (11.2%) | 236 (13.3%) | |
| Not sure | 255 (1.7%) | 46 (2.6%) | |
Patient Preferences, Care Plan Documentation, and Care Coordination at Admission (Table 3)
Patients who had documented CDs were less likely to prefer my doctor give me choices regarding my care, and more often disagreed with the statement I prefer to leave care decisions to my physician. These patients were also more likely to have a durable power of attorney or living will in their chart, or have an alternate decision‐maker noted. The majority of patients without a documented CD (79.9%) had no notation of their care wishes, compared to 29.7% in patients with a documented CD. Patients with a documented CD were more likely to have a regular medical provider and a note in the chart from their primary care physician.
| Value | No Documented CD (n = 15321, 89.7%) | Documented CD (n = 1776, 10.3%) | P* |
|---|---|---|---|
| |||
| I prefer my doctor give me choices regarding my care** (n, %) | |||
| Definitely agree | 11619 (75.8%) | 1247 (70.2%) | < 0.0001 |
| Somewhat agree | 1912 (12.5%) | 252 (14.2%) | |
| Somewhat disagree | 488 (3.2%) | 76 (4.3%) | |
| Definitely disagree | 414 (2.7%) | 87 (4.9%) | |
| Don't know | 888 (5.8%) | 114 (6.4%) | |
| I prefer to leave care decisions to my physician** (n, %) | |||
| Definitely agree | 5660 (36.9%) | 613 (34.5%) | < 0.0001 |
| Somewhat agree | 4539 (29.6%) | 493 (27.8%) | |
| Somewhat disagree | 2265 (14.8%) | 257 (14.5%) | |
| Definitely disagree | 1956 (12.8%) | 304 (17.1%) | |
| Don't know | 901 (5.9%) | 109 (6.1%) | |
| Documentation of care wishes before hospitalization (n, %) | |||
| No documentation | 12238 (79.9%) | 527 (29.7%) | < 0.0001 |
| Full support | 2624 (17.1%) | 742 (41.8%) | |
| Do not resuscitate or intubate (DNR/DNI) | 264 (1.7%) | 370 (20.8%) | |
| Hospice | 53 (0.3%) | 22 (1.2%) | |
| Other limitation (eg, no pressors) | 142 (0.9%) | 115 (6.5%) | |
| Had durable power of attorney in chart (n, %) | 286 (1.9%) | 133 (7.5%) | < 0.0001 |
| Had a living will in chart (n, %) | 266 (1.7%) | 142 (8.0%) | < 0.0001 |
| Alternate decision maker named in chart (n, %) | 2770 (18.1%) | 638 (35.9%) | < 0.0001 |
| Patient noted to be unable to participate in their care at admission (eg, confused, unable to respond) (n, %) | 1227 (8.0%) | 431 (24.3%) | < 0.0001 |
| Inpatient team documented discussion with primary care physician (n, %) | 627 (4.1%) | 136 (7.7%) | < 0.0001 |
| Do not have a regular medical provider** (n, %) | 3836 (25.0%) | 254 (14.3%) | < 0.0001 |
| Note from primary care physician in chart (n, %) | 148 (1.0%) | 39 (2.2%) | < 0.0001 |
Factors Associated with Documented Care Discussions (Table 4)
Using predictor variables presented in Tables 1‐3, we then constructed multivariable models seeking to understand factors independently associated with documentation of code status in the entire cohort, as well as among patients who had no preexisting care wishes.
| Entire Cohort (n = 17097) | Patients with No Documentation of Preadmission Wishes (n = 12765) | |||
|---|---|---|---|---|
| Adjusted Odds Ratio (95% CI) | P Value | Adjusted Odds Ratio (95% CI) | P Value | |
| Preadmission Code Status | ||||
| No documentation | Referent | NA | ||
| Full support | 3.22 (2.28, 4.55) | < 0.0001 | NA | |
| Do not resuscitate or intubate (DNR/DNI) | 11.32 (8.52, 15.04) | < 0.0001 | NA | |
| Hospice | 4.02 (2.33, 6.94) | < 0.0001 | NA | |
| Other limitation (eg, no pressors) | 10.13 (7.35, 13.96) | < 0.0001 | NA | |
| Insurance type | ||||
| Medicare | Referent | Referent | ||
| Charity care | 0.50 (0.30, 0.85) | 0.0099 | 0.56 (0.25, 1.25) | 0.1589 |
| Commercial | 0.81 (0.69, 0.95) | 0.0090 | 0.66 (0.52, 0.85) | 0.0009 |
| Medicaid | 0.69 (0.57, 0.82) | < 0.0001 | 0.49 (0.36, 0.67) | < 0.0001 |
| Other | 0.46 (0.18, 1.13) | 0.0912 | 0.60 (0.17, 2.12) | 0.4302 |
| Self pay | 0.70 (0.52, 0.95) | 0.0203 | 0.49 (0.29, 0.81) | 0.0060 |
| Any limitations in bathing, toileting, dressing or feeding self? | ||||
| No | Referent | Referent | ||
| Yes, a little | 1.25 (1.10, 1.42) | 0.0007 | 1.31 (1.03, 1.67) | 0.0272 |
| Yes, a lot | 1.25 (1.09, 1.43) | 0.0015 | 1.42 (1.11, 1.81) | 0.0055 |
| Unable to respond | 0.81 (0.59, 1.12) | 0.2006 | 0.80 (0.45, 1.41) | 0.4299 |
| Patient has a documented surrogate decision maker | 1.72 (1.47, 2.02) | < 0.0001 | 2.08 (1.62, 2.66) | < 0.0001 |
| Patient noted to be unable to participate in their care at admission (eg, confused, unable to respond) | 1.63 (1.37, 1.94) | < 0.0001 | 2.20 (1.60, 3.02) | < 0.0001 |
| Notation that team had spoken to primary care physician at admission | 1.65 (1.29, 2.11) | < 0.0001 | 1.45 (0.92, 2.28) | 0.1116 |
| History of cancer | ||||
| No | Referent | Referent | ||
| Yes | 1.31 (1.13, 1.51) | 0.0003 | 1.26 (0.96, 1.65) | 0.0960 |
| Not sure | 1.26 (0.87, 1.82) | 0.2162 | 1.80 (1.03, 3.15) | 0.0396 |
| History of diabetes | ||||
| No | Referent | Referent | ||
| Yes | 0.87 (0.75, 1.003) | 0.0543 | 0.79 (0.62, 0.997) | 0.0467 |
| Not sure | 0.61 (0.38, 0.99) | 0.0445 | 0.84 (0.43, 1.65) | 0.6183 |
| Housing situation | ||||
| Own house or apartment | Referent | Referent | ||
| Relative or friend's apartment or house | 1.22 (1.03, 1.45) | 0.0229 | 1.29 (0.97, 1.71) | 0.0783 |
| Nursing home, group home, or long‐term care facility | 1.42 (1.16, 1.74) | 0.0006 | 1.74 (1.27, 2.40) | 0.0007 |
| Homeless shelter | 1.12 (0.72, 1.73) | 0.6204 | 0.87 (0.46, 1.63) | 0.6559 |
| Other/Don't know | 1.02 (0.75, 1.40) | 0.8987 | 1.35 (0.78, 2.36) | 0.2859 |
| Age Group | ||||
| <50 | Referent | Referent | ||
| 5059 | 1.19 (0.99, 1.43) | 0.0647 | 1.18 (0.88, 1.59) | 0.2583 |
| 6069 | 1.18 (0.99, 1.40) | 0.0585 | 1.20 (0.88, 1.66) | 0.2549 |
| 7079 | 1.10 (0.91, 1.33) | 0.3178 | 1.19 (0.85, 1.67) | 0.3033 |
| 8089 | 1.23 (1.03, 1.47) | 0.0207 | 1.34 (0.96, 1.88) | 0.0879 |
| 90+ | 1.45 (1.12, 1.88) | 0.0045 | 1.44 (0.94, 2.20) | 0.0934 |
| Site of Enrollment | ||||
| A | Referent | Referent | ||
| B | 1.74 (1.16, 2.61) | 0.007 | 4.95 (2.90, 8.45) | < 0.0001 |
| C | 5.14 (3.42, 7.74) | < 0.0001 | 26.36 (17.28, 40.23) | < 0.0001 |
| D | 4.19 (2.64, 6.66) | < 0.0001 | 8.06 (4.63, 14.03) | < 0.0001 |
| E | 3.00 (1.82, 4.9) | < 0.0001 | 5.30 (2.71, 10.38) | < 0.0001 |
| F | 4.09 (2.69, 6.23) | < 0.0001 | 2.32 (1.32, 4.08) | 0.0037 |
In the entire cohort, insurance type was independently associated with likelihood of a care discussion, with patients with Medicare having greater adjusted odds ratio for a CD than patients with all other forms of insurance, even after adjusting for age. Patients who had functional limitations with bathing, toileting, and feeding; had a documented surrogate decision maker; were unable to participate in their care; had cancer; or did not live in their own home were more likely to have a documented CD. Subjects with diabetes were less likely to have a CD, although this was of borderline significance. Patients whose team had documented a CD with the patients' primary physician were also more likely to have a discussion noted. However, the magnitude of these predictors was small compared to the independent effects attributable to the site the patient was enrolled or whether the patient had any preexisting documentation. Whereas the adjusted odds ratio associated with clinical or functional measures (such as age, cancer) were generally between 1.5 and 2.5, the range of odds ratios associated with having any documentation of care wishes (compared to no documentation) were all greater than 3, and the odds ratios associated with site of enrollment were 1.7 or higher.
We observed similar findings in analyses limited to patients with no preexisting care documentation. While clinical, sociodemographic, and functional factors remained statistically associated with a CD (albeit with wider confidence intervals due to smaller sample sizes), the effect of the patient's site of enrollment became even more striking (Table 4).
DISCUSSION
In this multicenter study of hospitalized general medical patients, documentation of CDs were highly dependent on where patients received care and whether patients had previous documentation of a care plan. In contrast, although clinical, prognostic, and socioeconomic factors were also associated with whether physicians documented asking patients about their wishes for care, the influence of these factors was modest.
Improving communication between patients and their physicians during an episode of acute illness has been a long‐standing goal, with the Study to Understand Prognoses and Preferences for Outcomes of Treatment (SUPPORT) trial providing the most notable example of an effort to improve patient care through aligning patient wishes, prognosis, and aggressiveness for care. However, even the SUPPORT interventiona robust, well‐implemented, and highly labor‐intensive strategywas not able to achieve this goal. In their summary of SUPPORT study findings, the authors suggested that the likelihood of and effectiveness of communication in seriously ill patients may be powerfully influenced by patient and caregiver culture4; our findings may partially confirm SUPPORT's conclusions.
Preexisting documentation in our study would not have included mandated documentation that someone had given the patient information about advance directives (as mandated by the PSDA), but rather a specification for that advance care plan. This distinction means that preexisting documentation in our study represented a previous decision by the patient (or the patient and their physician) to have made a plan, and an association with hospital discussions may be because the first conversation is the hardest to undertake; subsequent discussions then represent confirmatory or clarifying discussions that may be less difficult to broach (particularly for less experienced trainees). A CD may have also been prompted when documentation was unclear, or when a change in prognosis took place (eg, a new diagnosis of metastatic cancer).22 Alternatively, a preexisting plan may serve as a reminder for clinicians to discuss code status, signify patients who are more willing to broach this subject, and either seem more approachable or bring up the topic themselves.
The influence of site on documentation and CD provides additional evidence that caregiver culture played a role in CDs. Although this variation may have been in part due to culture around documentation practices more generally, it is important to note that none of our participating centers had a policy for documentation of care wishes or patient‐doctor communication, or a policy mandating these discussions in any specific patient group. Furthermore, site‐related differences were seen even in patients with no preexisting documentation, and were seen after adjustment for other documentation or communication practices (eg, documenting a discussion with the patient's primary care provider), making it unlikely that documentation practices are solely responsible for our results. Persistence of variations in care documentation raises interesting questions, particularly when one considers recent data describing variations in end‐of‐life care between similar academic centers (one of which was a participating site in this trial).23 Given that the sites in our study represent diverse institutions yet share a number of characteristics, understanding the specific practices or aspects of medical culture that promote conversations may provide insights in how to improve this promotion elsewhere.
Our results would argue that mandates to document code status on admission may be unlikely to improve communication unless sites also develop an approach to using this newly documented information as a prompt for subsequent discussions. In nursing home settings, documentation of advance directives may reduce resource use, but it is unclear whether similar effects will be seen in hospital settings.24 It is also a challenge to insure that documentation of a care plan in the nursing home is communicated to the providers in the hospital.25 The PSDA was a first step in this direction, but its effects on improving communication are uncertain.26 Our results would confirm that the PSDA or systems to mandate documentation are not solutions in themselves, but are 2 steps in a larger process.
We do not want to discount our findings of less frequent CDs among patients of lower socioeconomic status, where gaps in quality of care, communication, and outcomes are well‐recognized.27 As such, our results delineate yet another area where practice can and should be improved for vulnerable patients. However, factors related to site of care and documentation may provide opportunities to improve care even more profoundly and within a fairly discrete (if complex) acute episode of care. Having said this, our results also demonstrate a potential pitfall of using code status documentation for risk‐adjustment, because such notation may be more dependent on local documentation patterns than clinical appropriateness.
Our study has a number of limitations. As an observational study, our findings are likely prone to biases related to unadjusted confounding due to comorbidity. The influence of comorbidity would seem to have been most important in biasing the effects of preexisting documentation, where documentation would be associated with more unaccounted comorbidity. However, there were no differences in documentation even after accounting for prognosis by adjusting for age, functional status, and a valid comorbidity score.28 As we have pointed out, our key outcome is based on documentation of communication and not actual communication, and as such may be biased in subtle ways not related to site of care or the items tested in our model. While we cannot directly eliminate the possibility of documentation biases in our results using statistical methods, it is important to point out that our chart abstraction protocol used highly specific criteria to detect these discussions, and therefore may under‐detect discussions which may have been documented in less detail. Our study did not examine whether documentation of CDs influenced subsequent care. However, previous studies have shown that advance care planning has only a minor influence on care.29 However, communication about preferences at the time of admission, when the need for specific care decisions may be more evident, may be more likely to influence hospital care. Our results show that previous documentation is associated with discussions early in an admission. Such discussion may affect care, even if the decision made is different than what was previously documented. In addition, patients who were included in our study (those able to provide consent and participate in an interview) may be healthier or more cognitively intact than a general population of hospitalized patients. However, how this would have affected our results is unclear. Being able to speak and consent for oneself are key facilitators to communication, but sicker patients who cannot consent or speak for themselves might also be more likely to have care planning decisions made based on illness severity; documentation in these patients may be more driven by whether such notes were required because of the involvement of home health services (or skilled nursing facilities). Finally, although our study is one of the largest examinations of in‐hospital communication to date and its implications for resident education are worth noting, the sites involved in the MCHS may not be representative of nonteaching hospitals, or community‐based teaching hospitals.
Our results suggest that, although comorbid illness and socioeconomic status play an important role in determining which patients receive CDs at the time of admission, these factors are substantially less powerful than preexisting documentation practices and culture or care practices specific to their site of care. These results suggest that future work should consider organizational characteristics and culture as important targets for interventions to improve care planning in hospitalized patients.
- Committee on Care at the End of Life, Institute of Medicine.Approaching Death: Improving Care at the End of Life.Field MJ,Cassel CK, eds.Washington, DC:National Academy Press;1997.
- ,,,,,.Factors considered important at the end of life by patients, family, physicians, and other care providers.JAMA.2000;284(19):2476–2482.
- ,,,,,.In search of a good death: observations of patients, families, and providers.Ann Intern Med.2000;132(10):825–832.
- The SUPPORT Principal Investigators.A controlled trial to improve care for seriously ill hospitalized patients. The study to understand prognoses and preferences for outcomes and risks of treatments (SUPPORT).JAMA.1995;274(20):1591–1598.
- ,.Choices about cardiopulmonary resuscitation in the hospital. When do physicians talk with patients?N Engl J Med.1984;310(17):1089–1093.
- ,,, et al.Patient preferences for communication with physicians about end‐of‐life decisions. SUPPORT Investigators. Study to Understand Prognoses and Preference for Outcomes and Risks of Treatment.Ann Intern Med.1997;127(1):1–12.
- ,,,.Discussing cardiopulmonary resuscitation: a study of elderly outpatients.J Gen Intern Med.1988;3(4):317–321.
- ,,,,.Educating the elderly: cardiopulmonary resuscitation decisions before and after intervention.J Am Geriatr Soc.1991;39(4):372–377.
- ,,,.Factors influencing physicians in recommending in‐hospital cardiopulmonary resuscitation.Arch Intern Med.1993;153(17):1999–2003.
- Federal Register. 42 USC 1395‐1396. Patient Self‐Determination Act1990.
- ,,.Advance directives on admission. Clinical implications and analysis of the Patient Self‐Determination Act of 1990.JAMA.1991;266(3):402–405.
- ,,.A new doctor in the house: ethical issues in hospitalist systems.JAMA.1999;282(2):171–174.
- ,,,,,.Implementation of a hospitalist service at a community teaching hospital: improving clinical efficiency and patient outcomes.Ann Intern Med.2002;137:859–865.
- ,,, et al.Effects of hospitalist physicians on an academic general medical service: results of a randomized trial.Ann Intern Med.2002;137:866–874.
- ,.The hospitalist movement 5 years later.JAMA.2002;287(4):487–494.
- ,,,,.Reorganizing an academic medical service: impact on cost, quality, patient satisfaction, and education.JAMA.1998;279(19):1560–1565.
- ,,,,,.Physician staffing patterns and clinical outcomes in critically ill patients: a systematic review.JAMA.2002;288(17):2151–2162.
- ,,, et al.Organizational characteristics of intensive care units related to outcomes of abdominal aortic surgery.JAMA.1999;281(14):1310–1317.
- ,,, et al.Effects of inpatient experience on outcomes and costs in a multicenter trial of academic hospitalists.J Gen Intern Med.2005;20(Suppl 1):141–142.
- ,,.SF‐12: How to Score the SF‐12 Physical and Mental Health Summary Scales.2nd ed.Boston, MA:New England Medical Center, The Health Institute;1995.
- ,.End‐of‐life care in a voluntary hospitalist model: effects on communication, processes of care, and patient symptoms.Am J Med.2004;116(10):669–675.
- ,,,.Role of written advance directives in decision making: insights from qualitative and quantitative data.J Gen Intern Med.1998;13(7):439–446.
- ,,,,.Evaluating the efficiency of California providers in caring for patients with chronic illnesses.Health Aff (Millwood).2005 Jul‐Dec;Suppl Web Exclusives:W5–526–43.
- ,,, et al.Systematic implementation of an advance directive program in nursing homes: a randomized controlled trial.JAMA.2000;283(11):1437–1444.
- ,.Meeting palliative care needs in post‐acute care settings: “to help them live until they die”.JAMA.2006;295(6):681–686.
- ,,, et al.Advance directives for seriously ill hospitalized patients: effectiveness with the patient self‐determination act and the SUPPORT intervention. SUPPORT Investigators. Study to Understand Prognoses and Preferences for Outcomes and Risks of Treatment.J Am Geriatr Soc.1997;45(4):500–507.
- Institute of Medicine.Unequal Treatment: Confronting Racial and Ethnic Disparities in Health Care.Smedley BD,Stith AY,Nelson AR, eds.Washington, DC:National Academies Press;2003.
- ,,.Use of a self‐report‐generated Charlson Comorbidity Index for predicting mortality.Med Care.2005;43(6):607–615.
- ,,.Can clinical interventions change care at the end of life?Ann Intern Med.1997;126(5):381–388.
Copyright © 2008 Society of Hospital Medicine
Curriculum for the Hospitalized Aging Medical Patient
A crucial arena of innovative educational programs for the care of the elderly must include the hospital setting, a place of great cost, morbidity, and mortality for a population currently occupying approximately half of US hospital beds.1 With a marked acceleration in the number of persons living to an advanced age, there is a clear imperative to address the health‐care needs of the elderly, particularly the complex and frail.24 An educational grounding that steps beyond the traditional organ‐based models of disease to a much broader patient‐centered framework of care is necessary to aid physicians in advanced clinical decision‐making in the care of older patients. Organizing the medical care of the older patient within existing systems of care and a team care management network must also be improved.
Curricular materials and methods are widely available for teaching geriatric medicine,57 but most are geared toward outpatient care and management, with few addressing the care of the hospitalized, older medical patient.810 There is even less published on curricular materials, methods, and tools for such teaching outside of specialized hospital‐based geriatric units by nongeriatrics‐trained faculty.1113 Furthermore, the evaluation of geriatrics educational programs in the hospital setting has not been done with the ultimate assessment, the linking of educational programs to demonstrated changes in clinical practice and patient care outcomes.
To address these needs, we designed and implemented the Curriculum for the Hospitalized Aging Medical Patient (CHAMP) Faculty Development Program (FDP). CHAMP was funded by a grant from the Donald W. Reynolds Foundation Aging and Quality of Life Program with a matching commitment from the University of Chicago Department of Medicine. At the core of CHAMP are principles of care for the older patient in the hospital setting, with an emphasis on identifying and providing care for the complex and frail elderly with nongeriatrician inpatient medicine faculty as the primary teachers of these materials. The overall educational goals of the CHAMP FDP are the following: (1) to train hospitalists and general internists to recognize opportunities to teach geriatric medicine topics specific to the care of the hospitalized older patient; (2) to create teaching materials, tools, and methods that can be used in the busy medical inpatient setting at the bedside; (3) to create materials and tools that facilitate teaching the Accreditation Council for Graduate Medical Education (ACGME) core competencies14 during ward rounds; and (4) to increase the frequency and effectiveness with which this geriatrics content is taught in the hospital setting. This article describes the development and refinement of the CHAMP FDP and evaluation results to date.
METHODS
The CHAMP FDP was developed by a core group of geriatricians, hospitalists, general medicine faculty, and PhD educators from the Office of the Dean at the University of Chicago Pritzker School of Medicine. The core group piloted the FDP for themselves in spring 2004, and the FDP was offered to target learners annually from 2004 to 2006.
CHAMP Participants
The targeted faculty learners for the CHAMP FDP were hospitalists and general internists who attend on an inpatient medicine service for 1 to 4 months yearly. CHAMP Faculty Scholars were self‐selected from the eligible faculty of the University of Chicago. Approximately one‐third of the CHAMP Faculty Scholars held significant administrative and/or teaching positions in the Department of Medicine, residency program, or medical school. Overall, general internist and hospitalist faculty members of the University of Chicago are highly rated inpatient teachers with a 2004‐2007 average overall resident teaching rating of 3.79 (standard deviation = 0.53) on a scale of 1 to 4 (4 = outstanding). For each yearly cohort, we sought to train 8 to 10 Faculty Scholars. The Donald W. Reynolds Foundation grant funds supported the time of the Faculty Scholars to attend the CHAMP FDP 4 hours weekly for the 12 weeks of the course with release from a half‐day of outpatient clinical duties per week for the length of the FDP. Scholars also received continuing medical education credit for time spent in the FDP.
CHAMP Course Design, Structure, and Content
Design and Structure
The CHAMP FDP consists of twelve 4‐hour sessions given once weekly from September through November of each calendar year. Each session is composed of discrete teaching modules. During the first 2 hours of each session, 1 or 2 modules cover inpatient geriatric medicine content. The remaining 2 hours are devoted to modules consisting of the Stanford FDP for Medical Teachers: Improving Clinical Teaching (first 7 sessions)15, 16 and a course developed for the CHAMP FDP named Teaching on Today's Wards (remaining 5 sessions).
In addition to the overarching goals of the CHAMP FDP, each CHAMP module has specific learning objectives and an evaluation process based on the standard precepts of curriculum design.17 Further modifications of the CHAMP content and methods were strongly influenced by subsequent formal evaluative feedback on the course content, materials, and methods by the Faculty Scholars in each of the 4 FDP groups to date.
Geriatrics Content
The FDP geriatrics content and design model were developed as follows: reviewing existing published geriatrics curricular materials,5, 6, 8, 18 including high‐risk areas of geriatric hospital care;1922 drawing from the experience of the inpatient geriatric evaluation and treatment units;2325 and reviewing the Joint Commission mandates26 that have a particular impact on the care of the older hospitalized patients (eg, high‐risk medications, medication reconciliation, restraint use, and transitions of care). Final curricular materials were approved by consensus of the University of Chicago geriatrics/hospitalist core CHAMP faculty. A needs assessment surveying hospitalists at a regional Society of Hospital Medicine meeting showed a strong concordance between geriatrics topics that respondents thought they were least confident about in their knowledge, that they thought would be most useful to learn, and that we proposed for the core geriatrics topics for the CHAMP FDP, including pharmacy of aging, pressure ulcers, delirium, palliative care, decision‐making capacity, and dementia.27
Each geriatric topic is presented in 30‐ to 90‐minute teaching sessions with didactic lectures and case‐based discussions and is organized around 4 broad themes (Table 1). These lectures emphasize application of the content to bedside teaching during hospital medicine rounds. For example, the session on dementia focuses on assessing decision‐making capacity, the impact of dementia on the care of other medical illnesses and discharge decisions, dementia‐associated frailty with increased risk of hospitalization‐related adverse outcomes, and pain assessment in persons with dementia.
|
| Theme 1: Identify the frail/vulnerable elder |
| Identification and assessment of the vulnerable hospitalized older patient |
| Dementia in hospitalized older medical patients: Recognition of and screening for dementia, assessment of medical decision‐making capacity, implications for the treatment of nondementia illness, pain assessment, and improvement of the posthospitalization transition of care |
| Theme 2: Recognize and avoid hazards of hospitalization |
| Delirium: Diagnosis, treatment, risk stratification, and prevention |
| Falls: Assessment and prevention |
| Foley catheters: Scope of the problem, appropriate indications, and management |
| Deconditioning: Scope of the problem and prevention |
| Adverse drug reactions and medication errors: Principles of drug review |
| Pressure ulcers: Assessment, treatment, and prevention |
| Theme 3: Palliate and address end‐of‐life issues |
| Pain control: General principles and use of opiates |
| Symptom management in advanced disease: Nausea |
| Difficult conversations and advance directives |
| Hospice and palliative care and changing goals of care |
| Theme 4: Improve transitions of care |
| The ideal hospital discharge: Core components and determining destination |
| Destinations of posthospital care: Nursing homes for skilled rehabilitation and long‐term care |
The CHAMP materials created for teaching each topic at the bedside included topic‐specific teaching triggers, clinical teaching questions, and summary teaching points. The bedside teaching materials and other teaching tools, such as pocket cards with teaching triggers and clinical content (see the example in the appendix), commonly used geriatric measures (eg, the Confusion Assessment Method for delirium),28 and sample forms for teaching aspects of practice‐based learning and improvement and systems‐based practice, were available to Faculty Scholars electronically on the University of Chicago Course Management System (the CHALK E‐learning Web site). The CHAMP materials are now published at the University of Chicago Web site (
Teaching Content
The material referring to the process of teaching has been organized under 4 components in the CHAMP FDP.
The Stanford FDP for Medical Teachers15, 16
This established teaching skills course uses case scenarios and practice sessions to hone skills in key elements of teaching: learning climate, control of session, communication of goals, promotion of understanding and retention, evaluation, feedback, and promotion of self‐directed learning. This portion of the FDP was taught by a University of Chicago General Medicine faculty member trained and certified to teach the course at Stanford.
Teaching on Today's Wards
The Teaching on Today's Wards component was developed specifically for CHAMP to address the following: (1) to improve bedside teaching in the specific setting of the inpatient wards; (2) to increase the amount of geriatric medicine content taught by nongeriatrics faculty during bedside rounds; and (3) to teach the specific ACGME core competencies of professionalism, communication, practice‐based learning and improvement, and systems‐based practice during ward rounds (Table 2).
| ACGME Core Competency | Addressed in CHAMP Curriculum |
|---|---|
| |
| Knowledge/patient care | All geriatric lectures (see Table 1) |
| Professionalism | Geriatric lectures |
| 1. Advance directives and difficult conversations | |
| 2. Dementia: Decision‐making capacity | |
| Teaching on Today's Wards exercises and games | |
| 1. Process mapping | |
| 2. I Hope I Get a Good Team game | |
| 3. Deciding What To Teach/Missed Teaching Opportunities game | |
| Communication | Geriatric lectures |
| 1. Advance directives and difficult conversations | |
| 2. Dementia: Decision‐making capacity | |
| 3. Destinations for posthospital care: Nursing homes | |
| Teaching on Today's Wards exercises and games | |
| 1. Process mapping | |
| 2. Deciding What To Teach/Missed Teaching Opportunities game | |
| Systems‐based practice | Geriatric lectures |
| 1. Frailty: Screening | |
| 2. Delirium: Screening and prevention | |
| 3. Deconditioning: Prevention | |
| 4. Falls: Prevention | |
| 5. Pressure ulcers: Prevention | |
| 6. Drugs and aging: Drug review | |
| 7. Foley catheter: Indications for use | |
| 8. Ideal hospital discharge | |
| Teaching on Today's Wards exercises and games | |
| 1. Process mapping | |
| 2. Deciding What To Teach/Missed Teaching Opportunities game | |
| 3. Quality improvement projects | |
| Practice‐based learning and improvement | Teaching on Today's Wards exercises and games |
| 1. Case audit | |
| 2. Census audit | |
| 3. Process mapping | |
Session one of Teaching on Today's Wards takes the Faculty Scholars through an exploration of their teaching process on a postcall day using process mapping.29, 30 This technique, similar to constructing a flow chart, involves outlining the series of steps involved in one's actual (not ideal) process of postcall teaching. Faculty Scholars then explore how to recognize opportunities and add geriatric topics and the ACGME core competencies to their teaching on the basis of their own teaching process, skill sets, and clinical experience.
Session two explores goal setting, team dynamics, and the incorporation of more geriatrics teaching into the Faculty Scholar's teaching agenda through a series of interactive card game exercises facilitated in small group discussion. Card game 1, I Hope I Get a Good Team, allows learners to practice goal setting for their inpatient team using a hypothetical game card team based on the learning level, individuals' strengths and weaknesses, and individuals' roles in the team hierarchy. Card game 2, Deciding What To Teach/Missed Opportunities, helps learners develop a teaching agenda on any set of patients that incorporates the CHAMP geriatric topics and the ACGME core competencies.
Sessions three and four teach learners about the systems‐based practice and practice‐based learning and improvement competencies, including an introduction to quality improvement. These interactive sessions introduce Faculty Scholars to the plan‐do‐study‐act method,31 using the example of census and case audits32 to provide an objective and structured method of assessing care. These audits provide a structure for the medical team to review its actual care and management practices and for faculty to teach quality improvement. Examples of census audits developed by CHAMP faculty, including deep venous thrombosis prophylaxis, Foley catheter use, and use of proton pump inhibitors, provide models for the faculty learners to create their own audits.
The fifth session focuses on developing skills for life‐long learning. Based on previous work on medical education and evidence‐based medicine,33, 34 these sessions provide learners with a framework to identify and address knowledge gaps, obtain effective consultation, ask pertinent questions of learners, and self‐assess their teaching skills.
Observed Structured Teaching Exercises
Observed structured teaching exercises allow the deliberate practice of teaching new curricular materials and skills and have been shown to improve teaching skills for both faculty and resident teachers using standardized students in a simulated teaching environment.3537 The observed structured teaching exercises developed for CHAMP allow the Faculty Scholars to practice teaching geriatrics content using the one‐minute preceptor teaching method.38
Commitment to Change (CTC) Contracts
CTC contracts provide a method for sustaining CHAMP teaching. At the end of the FDP, we ask Faculty Scholars to sign a CTC contract,39, 40 selecting at least 1 geriatric topic and 1 topic from Teaching on Today's Wards to teach in future inpatient teaching attending months. Over the year(s) following the FDP, the CHAMP project director frequently contacts the Faculty Scholars via e‐mail and phone interviews before, during, and after each month of inpatient service. The CTC contract is formally reviewed and revised annually with each CHAMP Faculty Scholar by the CHAMP project director and a core CHAMP faculty member.
Evaluation
A comprehensive multilevel evaluation scheme was developed based on the work of Kirkpatrick,41 including participant experience and teaching and subsequent clinical outcomes. This article reports only on the knowledge, attitudes, and behavioral self‐report data collected from participants, and remaining data will be presented in future articles.
The evaluation of the FDP program includes many commonly used methods for evaluating faculty learners, including recollection and retention of course content and self‐reported behavioral changes regarding the incorporation of the material into clinical teaching and practice. The more proximal evaluation includes precourse and postcourse performance on a previously validated geriatric medicine knowledge test,4244 precourse and postcourse performance on a validated survey of attitudes regarding older persons and geriatric medicine,45 a self‐assessment survey measuring self‐reported importance of and confidence in practicing and teaching geriatric skills, and Faculty Scholars' reports of subsequent frequency of teaching on the geriatric medicine and Teaching on Today's Wards content.
Faculty Scholars' feedback regarding their reaction to and satisfaction with the CHAMP FDP includes immediate postsession evaluations of each individual CHAMP FDP session and its content.
Analyses
We calculated the overall satisfaction of the FDP by aggregating evaluations for all session modules across the 4 cohorts. Satisfaction was measured with 6 questions, which included an overall satisfaction question and were answered with 5‐point Likert scales.
Pre‐CHAMP and post‐CHAMP scores on the geriatrics knowledge test and geriatrics attitude scale were calculated for each participant and compared with paired‐sample t tests. Composite scores for the self‐reported behavior for importance of/confidence in practice and importance of/confidence in teaching were calculated for each set of responses from each participant. The average scores across all 14 geriatrics content items for importance of/confidence in practice and importance of/confidence in teaching were calculated pre‐CHAMP and post‐CHAMP and compared with a paired‐sample t test. Similarly, self‐reported behavior ratings of importance of/confidence in teaching were calculated by the averaging of responses across the 10 Teaching on Today's Wards items. Pre‐CHAMP and post‐CHAMP average scores were compared with paired‐sample t tests on SPSS version 14 (SPSS, Chicago, IL). Data from the pilot sessions were included in the analyses to provide adequate power.
RESULTS
We pilot‐tested the format, materials, methods, and evaluation components of the CHAMP FDP with the CHAMP core faculty in the spring of 2004. The revised CHAMP FDP was given in the fall of 2004 to the first group of 8 faculty learners. Similar annual CHAMP FDPs have occurred since 2004, with a total of 29 Faculty Scholars by 2006. This includes approximately half of the University of Chicago general medicine faculty and the majority of the hospitalist faculty. Geriatrics fellows, a medicine chief resident, and other internal medicine subspecialists have also taken the CHAMP FDP. The average evaluations of all CHAMP sessions by all participants are shown in Table 3.
| Rating Criteria* | Average (SD) | N |
|---|---|---|
| ||
| Teaching methods were appropriate for the content covered. | 4.5 0.8 | 571 |
| The module made an important contribution to my practice. | 4.4 0.9 | 566 |
| Supplemental materials were effectively used to enhance learning. | 4.0 1.6 | 433 |
| I feel prepared to teach the material covered in this module. | 4.1 1.0 | 567 |
| I feel prepared to incorporate this material into my practice. | 4.4 0.8 | 569 |
| Overall, this was a valuable educational experience. | 4.5 0.8 | 565 |
Faculty Scholars rated the FDP highly regarding preparation for teaching and incorporation of the material into their teaching and practice. Likewise, qualitative comments by the Faculty Scholars were strongly supportive of CHAMP:
Significantly more aware and confident in teaching around typical geriatric issues present in our patients.
Provided concrete, structured ideas about curriculum, learning goals, content materials and how to implement them.
The online teaching resources were something I used on an almost daily basis.
Wish we had this for outpatient.
CHAMP had a favorable impact on the Faculty Scholars across the domains of knowledge, attitudes, and perceived behavior change (Table 4). Significant differences on paired‐sample t tests found significant improvement on all but one measure (importance of teaching). After the CHAMP program, Faculty Scholars were more knowledgeable about geriatrics content (P = 0.023), had more positive attitudes to older patients (P = 0.049), and had greater confidence in their ability to care for older patients (P < 0.001) and teach geriatric medicine skills (P < 0.001) and Teaching on Today's Wards content (P < 0.001). There was a significant increase in the perceived importance of practicing the learned skills (P = 0.008) and Teaching on Today's Wards (P = 0.001). The increased importance of teaching geriatrics skills was marginally significant (P = 0.064).
| Domain | N | Average Response | SE | P Value* | ||
|---|---|---|---|---|---|---|
| Pre‐CHAMP | Post‐CHAMP | |||||
| ||||||
| Knowledge | Geriatric medicine knowledge test | 21 | 62.14 | 68.05 | 2.40 | 0.023 |
| Attitudes | Geriatrics attitude scale | 26 | 56.86 | 58.38 | 0.736 | 0.049 |
| Self‐report behavior change | Importance of practice | 28 | 4.40 | 4.62 | 0.078 | 0.008 |
| Confidence in practice | 28 | 3.59 | 4.33 | 0.096 | <0.001 | |
| Importance of teaching | 27 | 4.52 | 4.66 | 0.074 | 0.064 | |
| Confidence in teaching | 27 | 3.42 | 4.47 | 0.112 | <0.001 | |
| Importance of Teaching on Today's Wards∥ | 27 | 3.92 | 4.30 | 0.093 | 0.001 | |
| Confidence in Teaching on Today's Wards∥ | 27 | 2.81 | 4.05 | 0.136 | <0.001 | |
DISCUSSION
Central to CHAMP's design are (1) the creation of teaching materials and teaching resources that specifically address the challenges of teaching the care of the hospitalized older patient in busy hospital settings, (2) the provision of methods to reinforce the newly learned geriatrics teaching skills, and (3) a multidimensional evaluation scheme. The enthusiastic response to the CHAMP FDP and the evaluation results to date support the relevance and importance of CHAMP's focus, materials, and educational methods. The ideal outcome for our CHAMP FDP graduates is more informed, confident, and frequent teaching of geriatrics topics keyed to quality improvement and systems of care through a more streamlined but personalized bedside teaching process.13, 46 The CHAMP Faculty Scholar graduates' self‐report surveys of their performance and teaching of CHAMP course geriatrics skills did reveal a significant shift in clinical behavior, teaching, and confidence. Although the strongest indicator of perceived behavior change was in the enhanced self‐confidence in practicing and teaching, the significant changes in knowledge and attitude reinforce our observations of a shift in the mindset about teaching and caring for hospitalized elderly patients. This provides strong evidence for the efficacy of the CHAMP course in positively influencing participants.
Our biggest challenge with the CHAMP FDP was providing enough ongoing support to reinforce learning with an eye on the greater goal of changing teaching behaviors and clinical outcomes. After pilot testing, we added multiple types of support and follow‐up to the FDP: observed structured teaching exercises to practice CHAMP geriatrics content and teaching skills; modification of Teaching on Today's Wards through the addition of practice‐oriented exercises, games, and tutorials; frequent contact with our Faculty Scholar graduates post‐CHAMP FDP through CTC contracts; annual Faculty Scholars reunions; and continued access for the scholars to CHAMP materials on our Web site. Maintaining face‐to‐face contact between CHAMP core faculty and Faculty Scholars once the latter have finished the FDP has been challenging, largely because of clinical and teaching obligations over geographically separate sites. To overcome this, we are working to integrate CHAMP core faculty into hospitalist and general medicine section lecture series, increasing the frequency of CHAMP reunions, renewing CTC contracts with the Faculty Scholar graduates annually, and considering the concept of CHAMP core faculty guests attending during Faculty Scholars inpatient ward rounds.47
The CHAMP FDP and our evaluations to date have several limitations. First, FDP Scholars were volunteer participants who may have been more motivated to improve their geriatric care and teaching than nonparticipants. However, FDP Scholars had only moderate levels of geriatrics knowledge, attitudes, and confidence in their teaching on baseline testing and showed marked improvements in these domains after the FDP. In addition, Scholars' FDP participation was made possible by a reduction of other clinical obligations through direct reimbursement to their sections with CHAMP funds. Other incentives for CHAMP participation could include its focus on generalizable bedside teaching skills and provision of specific techniques for teaching the ACGME core competencies and quality improvement while using geriatrics content. Although the CHAMP FDP in its 48‐hour format is not sustainable or generalizable, the FDP modules and CHAMP materials were specifically designed to be usable in small pieces that could be incorporated into existing teaching structures, grand rounds, section meetings, teacher conferences, and continuing medical education workshops. CHAMP core group members have already presented and taught CHAMP components in many venues (see Dissemination on the CHAMP Web site). The excitement generated by CHAMP at national and specialty meetings, including multiple requests for materials, speaks to widespread interest in our CHAMP model. We are pursuing the creation of a mini‐CHAMP, an abbreviated FDP with an online component. These activities as well as feedback from users of CHAMP materials from the CHAMP Web site and the Portal of Geriatric Online Education will provide important opportunities for examining the use and acceptance of CHAMP outside our institution.
Another limitation of the CHAMP FDP is reliance on FDP Scholar self‐assessment in several of the evaluation components. Some studies have shown poor concordance between physicians' self‐assessment and external assessment over a range of domains.48 However, others have noted that despite these limitations, self‐assessment remains an essential tool for enabling physicians to discover the motivational discomfort of a performance gap, which may lead to changing concepts and mental models or changing work‐flow processes.49 Teaching on Today's Wards sessions in CHAMP emphasize self‐audit processes (such as process mapping and census audits) that can augment self‐assessment. We used such self‐audit processes in 1 small pilot study to date, providing summative and qualitative feedback to a group of FDP Scholars on their use of census audits.
However, the evaluation of the CHAMP FDP is enhanced by a yearly survey of all medical residents and medical students and by the linking of the teaching reported by residents and medical students to specific attendings. We have begun the analysis of resident perceptions of being taught CHAMP geriatrics topics by CHAMP faculty versus non‐CHAMP faculty. In addition, we are gathering data on patient‐level process of care and outcomes tied to the CHAMP FDP course session objectives by linking to the ongoing University of Chicago Hospitalist Project, a large clinical research project that enrolls general medicine inpatients in a study examining the quality of care and resource allocation for these patients.50 Because the ultimate goal of CHAMP is to improve the quality of care and outcomes for elderly hospitalized patients, the University of Chicago Hospitalist Project infrastructure was modified by the incorporation of the Vulnerable Elder Survey‐1351 and a process‐of‐care chart audit specifically based on the Assessing Care of the Vulnerable Elders Hospital Quality Indicators.52 Preliminary work included testing and validating these measures.53 Further evaluation of these clinical outcomes and CHAMP's efficacy and durability at the University of Chicago is ongoing and will be presented in future reports.
CONCLUSIONS
Through a collaboration of geriatricians, hospitalists, and general internists, the CHAMP FDP provides educational materials and methods keyed to bedside teaching in the fast‐paced world of the hospital. CHAMP improves faculty knowledge and attitudes and the frequency of teaching geriatrics topics and skills necessary to deliver quality care to the elderly hospitalized medical patient. Although the CHAMP FDP was developed and refined for use at a specific institution, the multitiered CHAMP FDP materials and methods have the potential for widespread use by multiple types of inpatient attendings for teaching the care of the older hospitalized medicine patient. Hospitalists in particular will require this expertise as both clinicians and teachers as their role, leadership, and influence continue to expand nationally.
Acknowledgements
The Curriculum for the Hospitalized Aging Medical Patient (CHAMP) Program was supported by funding from the Donald W. Reynolds Foundation with matching funds from the University of Chicago Department of Medicine, by the Hartford Foundation Geriatrics Center for Excellence, and by a Geriatric Academic Career Award to Don Scott. Presentations on CHAMP and its materials include a number of national and international meeting venues, including meetings of the Society of Hospital Medicine, the American Geriatrics Society, and the Association of Program Directors in Internal Medicine and the International Ottawa Conference.
APPENDIX
EXAMPLE OF A CHAMP POCKET CARD: FOLEY CATHETERS
| CHAMP: Foley Catheters | CHAMP: Inability to Void | |
|---|---|---|
| ||
| Catherine DuBeau, MD, Geriatrics, University of Chicago | Catherine DuBeau, MD, Geriatrics, University of Chicago | |
| 1. Does this patient have a catheter? Incorporate regular catheter checks on rounds as a practice‐based learning and improvement exercise. | 1. Is there a medical reason for this patient's inability to void? | |
| Two Basic Reasons | ||
| 2. Does this patient need a catheter? | Poor pump | |
| Only Four Indications | ▪ Meds: anticholinergics, Ca++ blockers, narcotics | |
| a. Inability to void | ▪ Sacral cord disease | |
| b. Urinary incontinence and | ▪ Neuropathy: DM, B12 | |
| ▪ Open sacral or perineal wound | ▪ Constipation/emmpaction | |
| ▪ Palliative care | Blocked outlet | |
| c. Urine output monitoring | ▪ Prostate disease | |
| ▪ Critical illnessfrequent/urgent monitoring needed | ▪ Suprasacral spinal cord disease (eg, MS) with detrusor‐sphincter dyssynergia | |
| ▪ Patient unable/unwilling to collect urine | ▪ Women: scarring, large cystocele | |
| d. After general or spinal anesthesia | ▪ Constipation/emmpaction | |
| 3. Why should catheter use be minimized? | Evaluation of Inability To Void | |
| a. Infection risk | ||
| ▪ Cause of 40% of nosocomial infections | Action Step | Possible Medical Reasons |
| b. Morbidity | ||
| ▪ Internal catheters | ||
| ○Associated with delirium | Review meds | ‐Cholinergics, narcotics, calcium channel blockers, ‐agonists |
| ○Urethral and meatal injury | ||
| ○Bladder and renal stones | ||
| ○Fever | Review med Hx | Diabetes with neuropathy, sacral/subsacral cord, B12, GU surgery or radiation |
| ○Polymicrobial bacteruria | ||
| ▪ External (condom) catheters | ||
| ○Penile cellulitus/necrosis | Physical exam | Womenpelvic for prolapse; all‐sacral root S2‐4anal wink and bulbocavernosus reflexes |
| ○Urinary retention | ||
| ○Bacteruria and infection | ||
| c. Foleys are uncomfortable/painful. | Postvoiding residual | This should have been done in the evaluation of the patient's inability to void and repeated after catheter removal with voiding trial. |
| d. Foleys are restrictive falls and delirium. | ||
| e. Cost | ||
- ,.2002 National Hospital Discharge Survey.Hyattsville, MD:National Center for Health Statistics;2002.Advance Data from Vital and Health Statistics 342.
- ,,, et al.The critical shortage of geriatrics faculty.J Am Geriatr Soc.1993;41:560–569.
- ,,, et al.Development of geriatrics‐oriented faculty in general internal medicine.Ann Intern Med.2003;139:615–620.
- ,,.General internal medicine and geriatrics: building a foundation to improve the training of general internists in the care of older adults.Ann Intern Med.2003;139:609–614.
- ,.Curriculum recommendations for resident training in nursing home care. A collaborative effort of the Society of General Internal Medicine Task Force on Geriatric Medicine, the Society of Teachers of Family Medicine Geriatrics Task Force, the American Medical Directors Association, and the American Geriatrics Society Education Committee.J Am Geriatr Soc.1994;42:1200–1201.
- ,,,,.Curriculum recommendations for resident training in geriatrics interdisciplinary team care.J Am Geriatr Soc.1999;47:1145–1148.
- ,,,,.A national survey on the current status of family practice residency education in geriatric medicine.Fam Med.2003;35:35–41.
- ,.ACGME requirements for geriatrics medicine curricula in medical specialties: progress made and progress needed.Acad Med.2005;80:279–285.
- ,,, et al.Improving geriatrics training in internal medicine residency programs: best practices and sustainable solutions.Ann Intern Med.2003;139:628–634.
- ,,,,.Core competencies in hospital medicine.J Hosp Med.2006;1(suppl 1):48–56.
- ,,,.A medical unit for the acute care of the elderly.J Am Geriatr Soc.1994;42:545–552.
- ,,, et al.Dissemination and characteristics of acute care of elders (ACE) units in the United States.Int J Technol Assess Health Care.2003;19:220–227.
- ,,,.Changing physician performance: a systematic review of the effect of continuing medical education strategies.J Am Med Assoc.1995;274:700–750.
- Accreditation Council for Graduate Medical Education. Outcome project: general competencies. Available at: http://www.acgme.org/outcome/comp/compfull.asp. Accessed October2005.
- ,,, et al.The Stanford faculty development program for medical teachers: a dissemination approach to faculty development for medical teachers.Teach Learn Med.1992;4:180–187.
- ,,.How do you get to teaching improvement? A longitudinal faculty development program for medical educators.Teach Learn Med.1998;11:52–57.
- .Curriculum Development for Medical Education: A Six‐Step Approach.Baltimore, MD:Johns Hopkins University Press;1998.
- .Acute hospital care. In:Cassel C,Cohen HJ,Larson EB, et al., eds.Geriatric Medicine,4th ed.New York:Springer‐Verlag;2003.
- ,,, et al.A multicomponent intervention to prevent delirium in hospitalized older patients.N Engl J Med.1999;340:669–676.
- ,,, et al.Importance of functional measures in predicting mortality among older hospitalized patients.JAMA.1998;279:1187–1193.
- ,,, et al.Cognitive screening predicts magnitude of functional recovery from admission to 3 months after discharge in hospitalized elders.J Gerontol Med Sci.2003;58:37–45.
- ,,, et al.Comprehensive discharge planning and home follow‐up of hospitalized elders: a randomized controlled trial.JAMA.1999;17:613–620.
- ,,, et al.A randomized trial of care in a hospital medical unit especially designed to improve the functional outcomes of acutely ill older patients.N Engl J Med.1995;332:1338–1344.
- ,,, et al.A controlled trial of inpatient and outpatient geriatric evaluation and management.N Engl J Med.2002;346:905–912.
- ,,, et al.Effects of a multicomponent intervention on functional outcomes and process of care in hospitalized older patients: a randomized controlled trial of acute care for the elders (ACE) in a community hospital.J Am Geriatr Soc.2000;48:1572–1581.
- The Joint Commission. Available at http://www.jcinc.com. Accessed April2008.
- ,,, et al.A learner's needs assessment in geriatric medicine for hospitalists. Paper to be presented at: American Geriatrics Society Annual Meeting; May2004; Las Vegas, NV.
- ,,, et al.Clarifying confusion: the confusion assessment method. A new method for detecting delirium.Ann Intern Med1990;113:941–948.
- ,.Meeting the JCAHO national patient safety goal: a model for building a standardized hand‐off protocol.Jt Comm J Qual Saf.2006;32:645–655.
- ,.Safety by design: understanding the dynamic complexity of redesigning care around the clinical microsystem.Qual Saf Health Care.2006;15(suppl 1):i10–i16.
- ,.The PDSA cycle at the core of learning in health professions education.Jt Comm J Qual Improv.1996;22:206–212.
- ,,.A case‐based approach to teaching practice‐based learning and improvement on the wards.Semin Med Pract.2005;8:64–74.
- ,,,.Does the structure of questions affect the outcome of curbside consultations with specialty colleagues?Arch Fam Med.2000;9:541–547.
- ,,.Enhancing medical student consultation request skills in an academic emergency department.J Emerg Med.1998;16:659–662.
- ,,,.Using an objective structured teaching evaluation for faculty development.Med Educ.2005;39:1160–1161.
- ,.Using standardised students in faculty development workshops to improve clinical teaching skills.Med Educ.2003;37:621.
- ,,,,,.Reliability and validity of an objective structured teaching examination for generalist resident teachers.Acad Med.2002;77:S29.
- ,,,.A five‐step “microskills” model of clinical teaching.J Am Board Fam Pract.1992;5:419–424.
- ,.Commitment to change: theoretical foundations, methods, and outcomes.J Cont Educ Health Prof.1999;19:200–207.
- .Commitment to change: a strategy for promoting educational effectiveness.J Cont Educ Health Prof.2000;20:156–163.
- .Evaluation of training. In:Craig R,Bittel I, eds.Training and Development Handbook.New York, NY:McGraw‐Hill;1967.
- ,,, et al.Development and evaluation of a geriatrics knowledge test for primary care residents.J Gen Intern Med.1997;12:450–452.
- ,.UNIPAC Three: Assessment and Treatment of Pain in the Terminally Ill.2nd ed.Glenview, IL:American Academy of Hospice and Palliative Care;2003.
- ,,, et al.Development and validation of a geriatric knowledge test for medical students.J Am Geriatr Soc.2004;52:983–988.
- ,,, et al.Development and validation of a geriatrics attitudes scale for primary care residents.J Am Geriatr Soc.1998;46:1425–1430.
- ,,,.No magic bullets: a systematic review of 102 trials of interventions to improve professional practice.Can Med Assoc J.1995;153:1423–1431.
- ,,,,.Faculty development in geriatrics for clinician educators: a unique model for skills acquisition and academic achievement.J Am Geriatr Soc.2005;53:516–521.
- ,,, et al.Accuracy of physician self‐assessment compared with observed measures of competence: a systematic review.JAMA.2006;296:1094–1102.
- ,.Self‐assessment in lifelong learning and improving performance in practice: physician know thyself.JAMA.2006;296:1137–1139.
- ,,, et al.Effects of physician experience on costs and outcomes on an academic general medicine service: results of a trial of hospitalists.Ann Intern Med.2002;137:866–874.
- ,,, et al.The vulnerable elders survey: a tool for identifying vulnerable older people in the community.J Am Geriatr Soc.2001;49:1691–1699.
- ,, and the ACOVE Investigators.Assessing care of vulnerable elders: ACOVE project overview.Ann Intern Med.2001;135:642–646.
- ,,, et al.Using assessing care of vulnerable elders quality indicators to measure quality of hospital care for vulnerable elders.J Am Geriatr Soc.2007;55:1705–1711.
A crucial arena of innovative educational programs for the care of the elderly must include the hospital setting, a place of great cost, morbidity, and mortality for a population currently occupying approximately half of US hospital beds.1 With a marked acceleration in the number of persons living to an advanced age, there is a clear imperative to address the health‐care needs of the elderly, particularly the complex and frail.24 An educational grounding that steps beyond the traditional organ‐based models of disease to a much broader patient‐centered framework of care is necessary to aid physicians in advanced clinical decision‐making in the care of older patients. Organizing the medical care of the older patient within existing systems of care and a team care management network must also be improved.
Curricular materials and methods are widely available for teaching geriatric medicine,57 but most are geared toward outpatient care and management, with few addressing the care of the hospitalized, older medical patient.810 There is even less published on curricular materials, methods, and tools for such teaching outside of specialized hospital‐based geriatric units by nongeriatrics‐trained faculty.1113 Furthermore, the evaluation of geriatrics educational programs in the hospital setting has not been done with the ultimate assessment, the linking of educational programs to demonstrated changes in clinical practice and patient care outcomes.
To address these needs, we designed and implemented the Curriculum for the Hospitalized Aging Medical Patient (CHAMP) Faculty Development Program (FDP). CHAMP was funded by a grant from the Donald W. Reynolds Foundation Aging and Quality of Life Program with a matching commitment from the University of Chicago Department of Medicine. At the core of CHAMP are principles of care for the older patient in the hospital setting, with an emphasis on identifying and providing care for the complex and frail elderly with nongeriatrician inpatient medicine faculty as the primary teachers of these materials. The overall educational goals of the CHAMP FDP are the following: (1) to train hospitalists and general internists to recognize opportunities to teach geriatric medicine topics specific to the care of the hospitalized older patient; (2) to create teaching materials, tools, and methods that can be used in the busy medical inpatient setting at the bedside; (3) to create materials and tools that facilitate teaching the Accreditation Council for Graduate Medical Education (ACGME) core competencies14 during ward rounds; and (4) to increase the frequency and effectiveness with which this geriatrics content is taught in the hospital setting. This article describes the development and refinement of the CHAMP FDP and evaluation results to date.
METHODS
The CHAMP FDP was developed by a core group of geriatricians, hospitalists, general medicine faculty, and PhD educators from the Office of the Dean at the University of Chicago Pritzker School of Medicine. The core group piloted the FDP for themselves in spring 2004, and the FDP was offered to target learners annually from 2004 to 2006.
CHAMP Participants
The targeted faculty learners for the CHAMP FDP were hospitalists and general internists who attend on an inpatient medicine service for 1 to 4 months yearly. CHAMP Faculty Scholars were self‐selected from the eligible faculty of the University of Chicago. Approximately one‐third of the CHAMP Faculty Scholars held significant administrative and/or teaching positions in the Department of Medicine, residency program, or medical school. Overall, general internist and hospitalist faculty members of the University of Chicago are highly rated inpatient teachers with a 2004‐2007 average overall resident teaching rating of 3.79 (standard deviation = 0.53) on a scale of 1 to 4 (4 = outstanding). For each yearly cohort, we sought to train 8 to 10 Faculty Scholars. The Donald W. Reynolds Foundation grant funds supported the time of the Faculty Scholars to attend the CHAMP FDP 4 hours weekly for the 12 weeks of the course with release from a half‐day of outpatient clinical duties per week for the length of the FDP. Scholars also received continuing medical education credit for time spent in the FDP.
CHAMP Course Design, Structure, and Content
Design and Structure
The CHAMP FDP consists of twelve 4‐hour sessions given once weekly from September through November of each calendar year. Each session is composed of discrete teaching modules. During the first 2 hours of each session, 1 or 2 modules cover inpatient geriatric medicine content. The remaining 2 hours are devoted to modules consisting of the Stanford FDP for Medical Teachers: Improving Clinical Teaching (first 7 sessions)15, 16 and a course developed for the CHAMP FDP named Teaching on Today's Wards (remaining 5 sessions).
In addition to the overarching goals of the CHAMP FDP, each CHAMP module has specific learning objectives and an evaluation process based on the standard precepts of curriculum design.17 Further modifications of the CHAMP content and methods were strongly influenced by subsequent formal evaluative feedback on the course content, materials, and methods by the Faculty Scholars in each of the 4 FDP groups to date.
Geriatrics Content
The FDP geriatrics content and design model were developed as follows: reviewing existing published geriatrics curricular materials,5, 6, 8, 18 including high‐risk areas of geriatric hospital care;1922 drawing from the experience of the inpatient geriatric evaluation and treatment units;2325 and reviewing the Joint Commission mandates26 that have a particular impact on the care of the older hospitalized patients (eg, high‐risk medications, medication reconciliation, restraint use, and transitions of care). Final curricular materials were approved by consensus of the University of Chicago geriatrics/hospitalist core CHAMP faculty. A needs assessment surveying hospitalists at a regional Society of Hospital Medicine meeting showed a strong concordance between geriatrics topics that respondents thought they were least confident about in their knowledge, that they thought would be most useful to learn, and that we proposed for the core geriatrics topics for the CHAMP FDP, including pharmacy of aging, pressure ulcers, delirium, palliative care, decision‐making capacity, and dementia.27
Each geriatric topic is presented in 30‐ to 90‐minute teaching sessions with didactic lectures and case‐based discussions and is organized around 4 broad themes (Table 1). These lectures emphasize application of the content to bedside teaching during hospital medicine rounds. For example, the session on dementia focuses on assessing decision‐making capacity, the impact of dementia on the care of other medical illnesses and discharge decisions, dementia‐associated frailty with increased risk of hospitalization‐related adverse outcomes, and pain assessment in persons with dementia.
|
| Theme 1: Identify the frail/vulnerable elder |
| Identification and assessment of the vulnerable hospitalized older patient |
| Dementia in hospitalized older medical patients: Recognition of and screening for dementia, assessment of medical decision‐making capacity, implications for the treatment of nondementia illness, pain assessment, and improvement of the posthospitalization transition of care |
| Theme 2: Recognize and avoid hazards of hospitalization |
| Delirium: Diagnosis, treatment, risk stratification, and prevention |
| Falls: Assessment and prevention |
| Foley catheters: Scope of the problem, appropriate indications, and management |
| Deconditioning: Scope of the problem and prevention |
| Adverse drug reactions and medication errors: Principles of drug review |
| Pressure ulcers: Assessment, treatment, and prevention |
| Theme 3: Palliate and address end‐of‐life issues |
| Pain control: General principles and use of opiates |
| Symptom management in advanced disease: Nausea |
| Difficult conversations and advance directives |
| Hospice and palliative care and changing goals of care |
| Theme 4: Improve transitions of care |
| The ideal hospital discharge: Core components and determining destination |
| Destinations of posthospital care: Nursing homes for skilled rehabilitation and long‐term care |
The CHAMP materials created for teaching each topic at the bedside included topic‐specific teaching triggers, clinical teaching questions, and summary teaching points. The bedside teaching materials and other teaching tools, such as pocket cards with teaching triggers and clinical content (see the example in the appendix), commonly used geriatric measures (eg, the Confusion Assessment Method for delirium),28 and sample forms for teaching aspects of practice‐based learning and improvement and systems‐based practice, were available to Faculty Scholars electronically on the University of Chicago Course Management System (the CHALK E‐learning Web site). The CHAMP materials are now published at the University of Chicago Web site (
Teaching Content
The material referring to the process of teaching has been organized under 4 components in the CHAMP FDP.
The Stanford FDP for Medical Teachers15, 16
This established teaching skills course uses case scenarios and practice sessions to hone skills in key elements of teaching: learning climate, control of session, communication of goals, promotion of understanding and retention, evaluation, feedback, and promotion of self‐directed learning. This portion of the FDP was taught by a University of Chicago General Medicine faculty member trained and certified to teach the course at Stanford.
Teaching on Today's Wards
The Teaching on Today's Wards component was developed specifically for CHAMP to address the following: (1) to improve bedside teaching in the specific setting of the inpatient wards; (2) to increase the amount of geriatric medicine content taught by nongeriatrics faculty during bedside rounds; and (3) to teach the specific ACGME core competencies of professionalism, communication, practice‐based learning and improvement, and systems‐based practice during ward rounds (Table 2).
| ACGME Core Competency | Addressed in CHAMP Curriculum |
|---|---|
| |
| Knowledge/patient care | All geriatric lectures (see Table 1) |
| Professionalism | Geriatric lectures |
| 1. Advance directives and difficult conversations | |
| 2. Dementia: Decision‐making capacity | |
| Teaching on Today's Wards exercises and games | |
| 1. Process mapping | |
| 2. I Hope I Get a Good Team game | |
| 3. Deciding What To Teach/Missed Teaching Opportunities game | |
| Communication | Geriatric lectures |
| 1. Advance directives and difficult conversations | |
| 2. Dementia: Decision‐making capacity | |
| 3. Destinations for posthospital care: Nursing homes | |
| Teaching on Today's Wards exercises and games | |
| 1. Process mapping | |
| 2. Deciding What To Teach/Missed Teaching Opportunities game | |
| Systems‐based practice | Geriatric lectures |
| 1. Frailty: Screening | |
| 2. Delirium: Screening and prevention | |
| 3. Deconditioning: Prevention | |
| 4. Falls: Prevention | |
| 5. Pressure ulcers: Prevention | |
| 6. Drugs and aging: Drug review | |
| 7. Foley catheter: Indications for use | |
| 8. Ideal hospital discharge | |
| Teaching on Today's Wards exercises and games | |
| 1. Process mapping | |
| 2. Deciding What To Teach/Missed Teaching Opportunities game | |
| 3. Quality improvement projects | |
| Practice‐based learning and improvement | Teaching on Today's Wards exercises and games |
| 1. Case audit | |
| 2. Census audit | |
| 3. Process mapping | |
Session one of Teaching on Today's Wards takes the Faculty Scholars through an exploration of their teaching process on a postcall day using process mapping.29, 30 This technique, similar to constructing a flow chart, involves outlining the series of steps involved in one's actual (not ideal) process of postcall teaching. Faculty Scholars then explore how to recognize opportunities and add geriatric topics and the ACGME core competencies to their teaching on the basis of their own teaching process, skill sets, and clinical experience.
Session two explores goal setting, team dynamics, and the incorporation of more geriatrics teaching into the Faculty Scholar's teaching agenda through a series of interactive card game exercises facilitated in small group discussion. Card game 1, I Hope I Get a Good Team, allows learners to practice goal setting for their inpatient team using a hypothetical game card team based on the learning level, individuals' strengths and weaknesses, and individuals' roles in the team hierarchy. Card game 2, Deciding What To Teach/Missed Opportunities, helps learners develop a teaching agenda on any set of patients that incorporates the CHAMP geriatric topics and the ACGME core competencies.
Sessions three and four teach learners about the systems‐based practice and practice‐based learning and improvement competencies, including an introduction to quality improvement. These interactive sessions introduce Faculty Scholars to the plan‐do‐study‐act method,31 using the example of census and case audits32 to provide an objective and structured method of assessing care. These audits provide a structure for the medical team to review its actual care and management practices and for faculty to teach quality improvement. Examples of census audits developed by CHAMP faculty, including deep venous thrombosis prophylaxis, Foley catheter use, and use of proton pump inhibitors, provide models for the faculty learners to create their own audits.
The fifth session focuses on developing skills for life‐long learning. Based on previous work on medical education and evidence‐based medicine,33, 34 these sessions provide learners with a framework to identify and address knowledge gaps, obtain effective consultation, ask pertinent questions of learners, and self‐assess their teaching skills.
Observed Structured Teaching Exercises
Observed structured teaching exercises allow the deliberate practice of teaching new curricular materials and skills and have been shown to improve teaching skills for both faculty and resident teachers using standardized students in a simulated teaching environment.3537 The observed structured teaching exercises developed for CHAMP allow the Faculty Scholars to practice teaching geriatrics content using the one‐minute preceptor teaching method.38
Commitment to Change (CTC) Contracts
CTC contracts provide a method for sustaining CHAMP teaching. At the end of the FDP, we ask Faculty Scholars to sign a CTC contract,39, 40 selecting at least 1 geriatric topic and 1 topic from Teaching on Today's Wards to teach in future inpatient teaching attending months. Over the year(s) following the FDP, the CHAMP project director frequently contacts the Faculty Scholars via e‐mail and phone interviews before, during, and after each month of inpatient service. The CTC contract is formally reviewed and revised annually with each CHAMP Faculty Scholar by the CHAMP project director and a core CHAMP faculty member.
Evaluation
A comprehensive multilevel evaluation scheme was developed based on the work of Kirkpatrick,41 including participant experience and teaching and subsequent clinical outcomes. This article reports only on the knowledge, attitudes, and behavioral self‐report data collected from participants, and remaining data will be presented in future articles.
The evaluation of the FDP program includes many commonly used methods for evaluating faculty learners, including recollection and retention of course content and self‐reported behavioral changes regarding the incorporation of the material into clinical teaching and practice. The more proximal evaluation includes precourse and postcourse performance on a previously validated geriatric medicine knowledge test,4244 precourse and postcourse performance on a validated survey of attitudes regarding older persons and geriatric medicine,45 a self‐assessment survey measuring self‐reported importance of and confidence in practicing and teaching geriatric skills, and Faculty Scholars' reports of subsequent frequency of teaching on the geriatric medicine and Teaching on Today's Wards content.
Faculty Scholars' feedback regarding their reaction to and satisfaction with the CHAMP FDP includes immediate postsession evaluations of each individual CHAMP FDP session and its content.
Analyses
We calculated the overall satisfaction of the FDP by aggregating evaluations for all session modules across the 4 cohorts. Satisfaction was measured with 6 questions, which included an overall satisfaction question and were answered with 5‐point Likert scales.
Pre‐CHAMP and post‐CHAMP scores on the geriatrics knowledge test and geriatrics attitude scale were calculated for each participant and compared with paired‐sample t tests. Composite scores for the self‐reported behavior for importance of/confidence in practice and importance of/confidence in teaching were calculated for each set of responses from each participant. The average scores across all 14 geriatrics content items for importance of/confidence in practice and importance of/confidence in teaching were calculated pre‐CHAMP and post‐CHAMP and compared with a paired‐sample t test. Similarly, self‐reported behavior ratings of importance of/confidence in teaching were calculated by the averaging of responses across the 10 Teaching on Today's Wards items. Pre‐CHAMP and post‐CHAMP average scores were compared with paired‐sample t tests on SPSS version 14 (SPSS, Chicago, IL). Data from the pilot sessions were included in the analyses to provide adequate power.
RESULTS
We pilot‐tested the format, materials, methods, and evaluation components of the CHAMP FDP with the CHAMP core faculty in the spring of 2004. The revised CHAMP FDP was given in the fall of 2004 to the first group of 8 faculty learners. Similar annual CHAMP FDPs have occurred since 2004, with a total of 29 Faculty Scholars by 2006. This includes approximately half of the University of Chicago general medicine faculty and the majority of the hospitalist faculty. Geriatrics fellows, a medicine chief resident, and other internal medicine subspecialists have also taken the CHAMP FDP. The average evaluations of all CHAMP sessions by all participants are shown in Table 3.
| Rating Criteria* | Average (SD) | N |
|---|---|---|
| ||
| Teaching methods were appropriate for the content covered. | 4.5 0.8 | 571 |
| The module made an important contribution to my practice. | 4.4 0.9 | 566 |
| Supplemental materials were effectively used to enhance learning. | 4.0 1.6 | 433 |
| I feel prepared to teach the material covered in this module. | 4.1 1.0 | 567 |
| I feel prepared to incorporate this material into my practice. | 4.4 0.8 | 569 |
| Overall, this was a valuable educational experience. | 4.5 0.8 | 565 |
Faculty Scholars rated the FDP highly regarding preparation for teaching and incorporation of the material into their teaching and practice. Likewise, qualitative comments by the Faculty Scholars were strongly supportive of CHAMP:
Significantly more aware and confident in teaching around typical geriatric issues present in our patients.
Provided concrete, structured ideas about curriculum, learning goals, content materials and how to implement them.
The online teaching resources were something I used on an almost daily basis.
Wish we had this for outpatient.
CHAMP had a favorable impact on the Faculty Scholars across the domains of knowledge, attitudes, and perceived behavior change (Table 4). Significant differences on paired‐sample t tests found significant improvement on all but one measure (importance of teaching). After the CHAMP program, Faculty Scholars were more knowledgeable about geriatrics content (P = 0.023), had more positive attitudes to older patients (P = 0.049), and had greater confidence in their ability to care for older patients (P < 0.001) and teach geriatric medicine skills (P < 0.001) and Teaching on Today's Wards content (P < 0.001). There was a significant increase in the perceived importance of practicing the learned skills (P = 0.008) and Teaching on Today's Wards (P = 0.001). The increased importance of teaching geriatrics skills was marginally significant (P = 0.064).
| Domain | N | Average Response | SE | P Value* | ||
|---|---|---|---|---|---|---|
| Pre‐CHAMP | Post‐CHAMP | |||||
| ||||||
| Knowledge | Geriatric medicine knowledge test | 21 | 62.14 | 68.05 | 2.40 | 0.023 |
| Attitudes | Geriatrics attitude scale | 26 | 56.86 | 58.38 | 0.736 | 0.049 |
| Self‐report behavior change | Importance of practice | 28 | 4.40 | 4.62 | 0.078 | 0.008 |
| Confidence in practice | 28 | 3.59 | 4.33 | 0.096 | <0.001 | |
| Importance of teaching | 27 | 4.52 | 4.66 | 0.074 | 0.064 | |
| Confidence in teaching | 27 | 3.42 | 4.47 | 0.112 | <0.001 | |
| Importance of Teaching on Today's Wards∥ | 27 | 3.92 | 4.30 | 0.093 | 0.001 | |
| Confidence in Teaching on Today's Wards∥ | 27 | 2.81 | 4.05 | 0.136 | <0.001 | |
DISCUSSION
Central to CHAMP's design are (1) the creation of teaching materials and teaching resources that specifically address the challenges of teaching the care of the hospitalized older patient in busy hospital settings, (2) the provision of methods to reinforce the newly learned geriatrics teaching skills, and (3) a multidimensional evaluation scheme. The enthusiastic response to the CHAMP FDP and the evaluation results to date support the relevance and importance of CHAMP's focus, materials, and educational methods. The ideal outcome for our CHAMP FDP graduates is more informed, confident, and frequent teaching of geriatrics topics keyed to quality improvement and systems of care through a more streamlined but personalized bedside teaching process.13, 46 The CHAMP Faculty Scholar graduates' self‐report surveys of their performance and teaching of CHAMP course geriatrics skills did reveal a significant shift in clinical behavior, teaching, and confidence. Although the strongest indicator of perceived behavior change was in the enhanced self‐confidence in practicing and teaching, the significant changes in knowledge and attitude reinforce our observations of a shift in the mindset about teaching and caring for hospitalized elderly patients. This provides strong evidence for the efficacy of the CHAMP course in positively influencing participants.
Our biggest challenge with the CHAMP FDP was providing enough ongoing support to reinforce learning with an eye on the greater goal of changing teaching behaviors and clinical outcomes. After pilot testing, we added multiple types of support and follow‐up to the FDP: observed structured teaching exercises to practice CHAMP geriatrics content and teaching skills; modification of Teaching on Today's Wards through the addition of practice‐oriented exercises, games, and tutorials; frequent contact with our Faculty Scholar graduates post‐CHAMP FDP through CTC contracts; annual Faculty Scholars reunions; and continued access for the scholars to CHAMP materials on our Web site. Maintaining face‐to‐face contact between CHAMP core faculty and Faculty Scholars once the latter have finished the FDP has been challenging, largely because of clinical and teaching obligations over geographically separate sites. To overcome this, we are working to integrate CHAMP core faculty into hospitalist and general medicine section lecture series, increasing the frequency of CHAMP reunions, renewing CTC contracts with the Faculty Scholar graduates annually, and considering the concept of CHAMP core faculty guests attending during Faculty Scholars inpatient ward rounds.47
The CHAMP FDP and our evaluations to date have several limitations. First, FDP Scholars were volunteer participants who may have been more motivated to improve their geriatric care and teaching than nonparticipants. However, FDP Scholars had only moderate levels of geriatrics knowledge, attitudes, and confidence in their teaching on baseline testing and showed marked improvements in these domains after the FDP. In addition, Scholars' FDP participation was made possible by a reduction of other clinical obligations through direct reimbursement to their sections with CHAMP funds. Other incentives for CHAMP participation could include its focus on generalizable bedside teaching skills and provision of specific techniques for teaching the ACGME core competencies and quality improvement while using geriatrics content. Although the CHAMP FDP in its 48‐hour format is not sustainable or generalizable, the FDP modules and CHAMP materials were specifically designed to be usable in small pieces that could be incorporated into existing teaching structures, grand rounds, section meetings, teacher conferences, and continuing medical education workshops. CHAMP core group members have already presented and taught CHAMP components in many venues (see Dissemination on the CHAMP Web site). The excitement generated by CHAMP at national and specialty meetings, including multiple requests for materials, speaks to widespread interest in our CHAMP model. We are pursuing the creation of a mini‐CHAMP, an abbreviated FDP with an online component. These activities as well as feedback from users of CHAMP materials from the CHAMP Web site and the Portal of Geriatric Online Education will provide important opportunities for examining the use and acceptance of CHAMP outside our institution.
Another limitation of the CHAMP FDP is reliance on FDP Scholar self‐assessment in several of the evaluation components. Some studies have shown poor concordance between physicians' self‐assessment and external assessment over a range of domains.48 However, others have noted that despite these limitations, self‐assessment remains an essential tool for enabling physicians to discover the motivational discomfort of a performance gap, which may lead to changing concepts and mental models or changing work‐flow processes.49 Teaching on Today's Wards sessions in CHAMP emphasize self‐audit processes (such as process mapping and census audits) that can augment self‐assessment. We used such self‐audit processes in 1 small pilot study to date, providing summative and qualitative feedback to a group of FDP Scholars on their use of census audits.
However, the evaluation of the CHAMP FDP is enhanced by a yearly survey of all medical residents and medical students and by the linking of the teaching reported by residents and medical students to specific attendings. We have begun the analysis of resident perceptions of being taught CHAMP geriatrics topics by CHAMP faculty versus non‐CHAMP faculty. In addition, we are gathering data on patient‐level process of care and outcomes tied to the CHAMP FDP course session objectives by linking to the ongoing University of Chicago Hospitalist Project, a large clinical research project that enrolls general medicine inpatients in a study examining the quality of care and resource allocation for these patients.50 Because the ultimate goal of CHAMP is to improve the quality of care and outcomes for elderly hospitalized patients, the University of Chicago Hospitalist Project infrastructure was modified by the incorporation of the Vulnerable Elder Survey‐1351 and a process‐of‐care chart audit specifically based on the Assessing Care of the Vulnerable Elders Hospital Quality Indicators.52 Preliminary work included testing and validating these measures.53 Further evaluation of these clinical outcomes and CHAMP's efficacy and durability at the University of Chicago is ongoing and will be presented in future reports.
CONCLUSIONS
Through a collaboration of geriatricians, hospitalists, and general internists, the CHAMP FDP provides educational materials and methods keyed to bedside teaching in the fast‐paced world of the hospital. CHAMP improves faculty knowledge and attitudes and the frequency of teaching geriatrics topics and skills necessary to deliver quality care to the elderly hospitalized medical patient. Although the CHAMP FDP was developed and refined for use at a specific institution, the multitiered CHAMP FDP materials and methods have the potential for widespread use by multiple types of inpatient attendings for teaching the care of the older hospitalized medicine patient. Hospitalists in particular will require this expertise as both clinicians and teachers as their role, leadership, and influence continue to expand nationally.
Acknowledgements
The Curriculum for the Hospitalized Aging Medical Patient (CHAMP) Program was supported by funding from the Donald W. Reynolds Foundation with matching funds from the University of Chicago Department of Medicine, by the Hartford Foundation Geriatrics Center for Excellence, and by a Geriatric Academic Career Award to Don Scott. Presentations on CHAMP and its materials include a number of national and international meeting venues, including meetings of the Society of Hospital Medicine, the American Geriatrics Society, and the Association of Program Directors in Internal Medicine and the International Ottawa Conference.
APPENDIX
EXAMPLE OF A CHAMP POCKET CARD: FOLEY CATHETERS
| CHAMP: Foley Catheters | CHAMP: Inability to Void | |
|---|---|---|
| ||
| Catherine DuBeau, MD, Geriatrics, University of Chicago | Catherine DuBeau, MD, Geriatrics, University of Chicago | |
| 1. Does this patient have a catheter? Incorporate regular catheter checks on rounds as a practice‐based learning and improvement exercise. | 1. Is there a medical reason for this patient's inability to void? | |
| Two Basic Reasons | ||
| 2. Does this patient need a catheter? | Poor pump | |
| Only Four Indications | ▪ Meds: anticholinergics, Ca++ blockers, narcotics | |
| a. Inability to void | ▪ Sacral cord disease | |
| b. Urinary incontinence and | ▪ Neuropathy: DM, B12 | |
| ▪ Open sacral or perineal wound | ▪ Constipation/emmpaction | |
| ▪ Palliative care | Blocked outlet | |
| c. Urine output monitoring | ▪ Prostate disease | |
| ▪ Critical illnessfrequent/urgent monitoring needed | ▪ Suprasacral spinal cord disease (eg, MS) with detrusor‐sphincter dyssynergia | |
| ▪ Patient unable/unwilling to collect urine | ▪ Women: scarring, large cystocele | |
| d. After general or spinal anesthesia | ▪ Constipation/emmpaction | |
| 3. Why should catheter use be minimized? | Evaluation of Inability To Void | |
| a. Infection risk | ||
| ▪ Cause of 40% of nosocomial infections | Action Step | Possible Medical Reasons |
| b. Morbidity | ||
| ▪ Internal catheters | ||
| ○Associated with delirium | Review meds | ‐Cholinergics, narcotics, calcium channel blockers, ‐agonists |
| ○Urethral and meatal injury | ||
| ○Bladder and renal stones | ||
| ○Fever | Review med Hx | Diabetes with neuropathy, sacral/subsacral cord, B12, GU surgery or radiation |
| ○Polymicrobial bacteruria | ||
| ▪ External (condom) catheters | ||
| ○Penile cellulitus/necrosis | Physical exam | Womenpelvic for prolapse; all‐sacral root S2‐4anal wink and bulbocavernosus reflexes |
| ○Urinary retention | ||
| ○Bacteruria and infection | ||
| c. Foleys are uncomfortable/painful. | Postvoiding residual | This should have been done in the evaluation of the patient's inability to void and repeated after catheter removal with voiding trial. |
| d. Foleys are restrictive falls and delirium. | ||
| e. Cost | ||
- ,.2002 National Hospital Discharge Survey.Hyattsville, MD:National Center for Health Statistics;2002.Advance Data from Vital and Health Statistics 342.
- ,,, et al.The critical shortage of geriatrics faculty.J Am Geriatr Soc.1993;41:560–569.
- ,,, et al.Development of geriatrics‐oriented faculty in general internal medicine.Ann Intern Med.2003;139:615–620.
- ,,.General internal medicine and geriatrics: building a foundation to improve the training of general internists in the care of older adults.Ann Intern Med.2003;139:609–614.
- ,.Curriculum recommendations for resident training in nursing home care. A collaborative effort of the Society of General Internal Medicine Task Force on Geriatric Medicine, the Society of Teachers of Family Medicine Geriatrics Task Force, the American Medical Directors Association, and the American Geriatrics Society Education Committee.J Am Geriatr Soc.1994;42:1200–1201.
- ,,,,.Curriculum recommendations for resident training in geriatrics interdisciplinary team care.J Am Geriatr Soc.1999;47:1145–1148.
- ,,,,.A national survey on the current status of family practice residency education in geriatric medicine.Fam Med.2003;35:35–41.
- ,.ACGME requirements for geriatrics medicine curricula in medical specialties: progress made and progress needed.Acad Med.2005;80:279–285.
- ,,, et al.Improving geriatrics training in internal medicine residency programs: best practices and sustainable solutions.Ann Intern Med.2003;139:628–634.
- ,,,,.Core competencies in hospital medicine.J Hosp Med.2006;1(suppl 1):48–56.
- ,,,.A medical unit for the acute care of the elderly.J Am Geriatr Soc.1994;42:545–552.
- ,,, et al.Dissemination and characteristics of acute care of elders (ACE) units in the United States.Int J Technol Assess Health Care.2003;19:220–227.
- ,,,.Changing physician performance: a systematic review of the effect of continuing medical education strategies.J Am Med Assoc.1995;274:700–750.
- Accreditation Council for Graduate Medical Education. Outcome project: general competencies. Available at: http://www.acgme.org/outcome/comp/compfull.asp. Accessed October2005.
- ,,, et al.The Stanford faculty development program for medical teachers: a dissemination approach to faculty development for medical teachers.Teach Learn Med.1992;4:180–187.
- ,,.How do you get to teaching improvement? A longitudinal faculty development program for medical educators.Teach Learn Med.1998;11:52–57.
- .Curriculum Development for Medical Education: A Six‐Step Approach.Baltimore, MD:Johns Hopkins University Press;1998.
- .Acute hospital care. In:Cassel C,Cohen HJ,Larson EB, et al., eds.Geriatric Medicine,4th ed.New York:Springer‐Verlag;2003.
- ,,, et al.A multicomponent intervention to prevent delirium in hospitalized older patients.N Engl J Med.1999;340:669–676.
- ,,, et al.Importance of functional measures in predicting mortality among older hospitalized patients.JAMA.1998;279:1187–1193.
- ,,, et al.Cognitive screening predicts magnitude of functional recovery from admission to 3 months after discharge in hospitalized elders.J Gerontol Med Sci.2003;58:37–45.
- ,,, et al.Comprehensive discharge planning and home follow‐up of hospitalized elders: a randomized controlled trial.JAMA.1999;17:613–620.
- ,,, et al.A randomized trial of care in a hospital medical unit especially designed to improve the functional outcomes of acutely ill older patients.N Engl J Med.1995;332:1338–1344.
- ,,, et al.A controlled trial of inpatient and outpatient geriatric evaluation and management.N Engl J Med.2002;346:905–912.
- ,,, et al.Effects of a multicomponent intervention on functional outcomes and process of care in hospitalized older patients: a randomized controlled trial of acute care for the elders (ACE) in a community hospital.J Am Geriatr Soc.2000;48:1572–1581.
- The Joint Commission. Available at http://www.jcinc.com. Accessed April2008.
- ,,, et al.A learner's needs assessment in geriatric medicine for hospitalists. Paper to be presented at: American Geriatrics Society Annual Meeting; May2004; Las Vegas, NV.
- ,,, et al.Clarifying confusion: the confusion assessment method. A new method for detecting delirium.Ann Intern Med1990;113:941–948.
- ,.Meeting the JCAHO national patient safety goal: a model for building a standardized hand‐off protocol.Jt Comm J Qual Saf.2006;32:645–655.
- ,.Safety by design: understanding the dynamic complexity of redesigning care around the clinical microsystem.Qual Saf Health Care.2006;15(suppl 1):i10–i16.
- ,.The PDSA cycle at the core of learning in health professions education.Jt Comm J Qual Improv.1996;22:206–212.
- ,,.A case‐based approach to teaching practice‐based learning and improvement on the wards.Semin Med Pract.2005;8:64–74.
- ,,,.Does the structure of questions affect the outcome of curbside consultations with specialty colleagues?Arch Fam Med.2000;9:541–547.
- ,,.Enhancing medical student consultation request skills in an academic emergency department.J Emerg Med.1998;16:659–662.
- ,,,.Using an objective structured teaching evaluation for faculty development.Med Educ.2005;39:1160–1161.
- ,.Using standardised students in faculty development workshops to improve clinical teaching skills.Med Educ.2003;37:621.
- ,,,,,.Reliability and validity of an objective structured teaching examination for generalist resident teachers.Acad Med.2002;77:S29.
- ,,,.A five‐step “microskills” model of clinical teaching.J Am Board Fam Pract.1992;5:419–424.
- ,.Commitment to change: theoretical foundations, methods, and outcomes.J Cont Educ Health Prof.1999;19:200–207.
- .Commitment to change: a strategy for promoting educational effectiveness.J Cont Educ Health Prof.2000;20:156–163.
- .Evaluation of training. In:Craig R,Bittel I, eds.Training and Development Handbook.New York, NY:McGraw‐Hill;1967.
- ,,, et al.Development and evaluation of a geriatrics knowledge test for primary care residents.J Gen Intern Med.1997;12:450–452.
- ,.UNIPAC Three: Assessment and Treatment of Pain in the Terminally Ill.2nd ed.Glenview, IL:American Academy of Hospice and Palliative Care;2003.
- ,,, et al.Development and validation of a geriatric knowledge test for medical students.J Am Geriatr Soc.2004;52:983–988.
- ,,, et al.Development and validation of a geriatrics attitudes scale for primary care residents.J Am Geriatr Soc.1998;46:1425–1430.
- ,,,.No magic bullets: a systematic review of 102 trials of interventions to improve professional practice.Can Med Assoc J.1995;153:1423–1431.
- ,,,,.Faculty development in geriatrics for clinician educators: a unique model for skills acquisition and academic achievement.J Am Geriatr Soc.2005;53:516–521.
- ,,, et al.Accuracy of physician self‐assessment compared with observed measures of competence: a systematic review.JAMA.2006;296:1094–1102.
- ,.Self‐assessment in lifelong learning and improving performance in practice: physician know thyself.JAMA.2006;296:1137–1139.
- ,,, et al.Effects of physician experience on costs and outcomes on an academic general medicine service: results of a trial of hospitalists.Ann Intern Med.2002;137:866–874.
- ,,, et al.The vulnerable elders survey: a tool for identifying vulnerable older people in the community.J Am Geriatr Soc.2001;49:1691–1699.
- ,, and the ACOVE Investigators.Assessing care of vulnerable elders: ACOVE project overview.Ann Intern Med.2001;135:642–646.
- ,,, et al.Using assessing care of vulnerable elders quality indicators to measure quality of hospital care for vulnerable elders.J Am Geriatr Soc.2007;55:1705–1711.
Copyright © 2008 Society of Hospital Medicine
Hospitalists Effects on Outcomes, Costs, Point-of-Care HIV Testing, and More
Community Teaching
Halasyamani L, Valenstein P, Friedlander M. et al. A comparison of two hospitalist models with traditional care in a community teaching hospital. Am J Med. 2005;118:536-543.
Background: A growing body of literature has demonstrated the effects of hospitalists on reducing inpatient length of stay and cost of care, with some literature showing a decreased in-hospital and 30-day mortality. However, most prior studies were conducted in academic medical centers or health maintenance organizations where one group of hospitalists, employed by the institution within which they worked, was compared with traditional primary care physicians. Direct comparisons between different hospitalist models practicing within a single institution have not been published. As a result, the impact of different hospitalist characteristics, including employment status and reimbursement incentives, on inpatient resource utilization and patient care outcomes is unknown.
Methods: Halasyamani and colleagues conducted a retrospective cohort study of 10,595 patients in a tertiary care community-based teaching hospital in which private hospitalists, academic hospitalists, and community physicians all practice. They measured risk-adjusted length of stay, variable costs, 30-day readmission rates, and in-hospital and 30-day mortality for patients treated by each of these three groups, controlling for potentially confounding variables. Community physicians belonged to 21 rounding groups, most of which were private or solo. Two of the community physicians groups were hospital-owned practices reimbursed by a relative value unit system. The private hospitalist group was self-employed with no financial relationship to the hospital and worked an average of 40 weeks per year. Community physicians and private hospitalists worked Monday-Friday and covered weekends or holidays about 25% of the time. Academic hospitalists worked with internal medicine residents and students on a teaching service. They were employed by the hospital using a relative value unit system. They worked an average of 14 weeks per year as an inpatient attending in half-month rotations, which included weekend coverage.
Results: There was a 20% reduction (-0.72 days absolute difference) in length of stay on the academic hospitalist service (P<0.0001) and 8% (-0.28 days absolute difference) on the private hospitalist service (P=0.049) compared with community physicians. Case-mix adjusted relative total costs were 10% less ($173 absolute difference) on the academic (P<0.0001) and 6% less ($109 absolute difference) on the private hospitalist services (P=0.02) compared with community physicians. There were no differences in 30-day readmission, in-hospital and 30-day mortality between the three groups.
Discussion: This study is the first to look at the effects of two separate hospitalist models on resource utilization and patient outcomes within the same institution. Although both the academic and private hospitalist groups demonstrated improved resource utilization as compared with the community physicians, the magnitude of benefit was much greater for the academic hospitalist group.
As the authors point out, one major difference between the two groups was employment status, with the academic hospitalists employed directly by the hospital and the private hospitalists receiving all payment directly from payers. Previous studies have also focused on hospitalists, which were employed by the institution at which they worked, raising the question of whether alignment of employee and employer incentives is an important factor affecting resource utilization outcomes.
Results of this study highlight the need for more studies which seek to clarify specific physician-level, group-level, and organization-level characteristics of hospitalists that result in improved resource utilization and patient care outcomes.
The Last Few Hours
Bailey FA, Burgio KL, Woodby LL, et al. Improving the processes of hospital care during the last hours of life. Arch Int Med. 2005;165(15):1722-1727.
Background: End-of-life care in the acute care inpatient setting is often not initiated until very late in the dying process and may be related to inadequate early recognition of dying patients as well as difficulty transitioning from disease-modifying treatments to palliative measures. Additional barriers exist, including lack of familiarity of hospital staff with initiation and implementation of hospice care. Education about end-of-life care and introduction of a physician-led palliative care team available for consultation within acute care hospitals may help promote better recognition of the dying patient by staff and allow for a “good death.”
Methods: A single hospital within the Veterans Affairs (VA) medical system (Birmingham, Ala., VA Medical Center) was chosen as a pilot center for initiation of a physician-led Inpatient Comfort Care Program (ICCP). The study was framed as a “before-after intervention trial” and analyzed all inpatient deaths identified by the Computerized Patient Recognition System during a six-month period before and substantially after the introduction of the ICCP. A structured chart abstraction tool was used and data was obtained from the last seven days of hospitalization analyzing variables associated with recognition of the dying patient and initiation of palliative care. Education of hospital staff on both hospice care and case identification was initiated during the intervention phase of the study. Additionally, a flexible comfort care order set was introduced.
Results: Two hundred and three veterans were identified (98% men, average age 68) and no significant differences in clinical characteristics were noted between the two groups, pre-intervention and post-intervention. Post-intervention, 59.3% of patients had formal palliative care consultation. Significant findings (P<0.01) following implementation of ICCP were increased documentation of end-of-life symptoms, increased documentation of care plans, increased utilization of opioids (57.1% to 87.2%), increased initiation of do-not-resuscitate orders (61.9% to 85.1%) with a concurrent decrease in cardiopulmonary resuscitation at death (34.4% to 15.4%), and a surprising increase in restraint use (6.0% to 22.6%).
Discussion: Data on hospice care patients indicate that 10% to 30% die in an acute care hospital, identifying a need for increased education and training in palliative medicine. This study demonstrates the positive outcomes of implementation of an inpatient palliative care service both for heightened awareness of identifying the dying patient as well as initiation of end-of-life care. The increased use of opioid medications is an important marker given that many patients experience pain and dyspnea at the end of life. This study is limited by its single site and further validation at other centers implementing similar protocols and assessing similar outcomes is needed. While this intervention had important clinical benefits, additional studies examining the cost implications of this system would be helpful.
Education alone has not been shown to be entirely effective in creating change. This single-site implementation of a palliative care consultation service successfully integrated an education program with on-site consultants. Distributing pocket cards with clinical findings identifying the dying patient aided in recognition of those patients and pre-printed order sets facilitated initiation of end-of-life care. The intervention initiated is possible for many medical centers and promotes an environment allowing for a “good death” for dying patients.
Computers, Doctors, and Errors
Koppel R, Metlay JP, Cohen A, et al. Role of computerized physician order entry systems in facilitating medication errors. JAMA. 2005;293(10):1197-1203
For physicians, computerized physician order entry (CPOE) has become an important topic of discussion as many hospitals and health systems embark on the complex and lengthy process of implementing new enterprise clinical systems. Though there are undoubtedly benefits to such systems, practicing clinicians are apt to remain skeptical of the grandiose pictures the more vocal advocates of CPOE may paint. This is not to say that the promises of CPOE are empty; to the contrary, there have been substantial successes, notably in the realm of medication error prevention.
At the same time, CPOE is a mixture of complex technologies that interface in complicated ways with the culture of clinical medicine. The view that medical informatics is a technical problem that has been solved long ago is simplistic and naïve. The article by Koppel, et al, has two important implications: 1) It is critical to look at clinical information systems in the social milieu in which it functions, and 2) there are often unintended consequences that may not beneficial.
This article examines a widely used, commercial CPOE system in use at the University of Pennsylvania (Philadelphia) using both quantitative and qualitative methods. The researchers conducted focus groups and expert interviews in addition to field observations of physicians (house officers and attendings), nurses, and pharmacists in order to identify themes relating to work with the order entry system. This work helped to guide the creation of a survey instrument subsequently used to survey house staff about working conditions and sources of error and stress. There was an 85%-90% response rate that primarily included house staff who ordered more than nine medication orders per month.
Researchers found two broad categories of errors that were fostered in this environment. The first category, which they termed “information errors” were generated by fragmentation of data and the failure to integrate the hospitals various systems both electronic and paper. Examples of this type of error include antibiotic renewal failures. A common way this failure would occur is that renewal reminder stickers would be placed in the patients’ charts, but the house staff would overlook these because medication orders occurred electronically. Another example is assumed dose errors, where house staff would assume that the default dose displayed was the recommended starting dose, when in fact this was the smallest dose unit available. Physicians were assuming decision support was available when it was not.
The second type of error, human-machine interface flaws, occurred when machine rules did not correspond to work behaviors. An example of this is when patients were listed alphabetically rather than by service, making it easy to select the wrong patient. In another instance, many screens (up to 20) were required to view all of a patient’s medications, making it difficult to choose a correct medication for editing.
This study has been criticized by industry advocates for focusing on an older set of technologies or because a number of these issues related to training or “user factors.” At the other extreme, this study has been cited as a cautionary tale about the risks of CPOE. Both types of criticism miss the point. This study demonstrates that CPOE and the social environment in which it sits is a complex entity and that careful design, proper support, and maintenance are critical ingredients to the success of an incredibly complex but vital new component of hospital medicine.
Point-of-Care HIV Testing in Inpatients
Lubelchek R, Kroc K, Hota B, et al. The role of rapid vs conventional human immunodeficiency virus testing for inpatients: effects on quality of care. Arch Intern Med. 2005;165:1956-1960.
Despite advances in treatment, infection with HIV and AIDS remains a public health problem in the United States. According to the CDC the rate of new diagnosis of HIV infection has remained steady from 2000 to 2003 at about 20 per 100,000 people. (Centers for Disease Control and Prevention. Diagnosis of HIV/AIDS–32 states, 2009-2003. MMWR Morb Mortal Wkly Rep. 2004;53:1106-1110). Currently, about 850,000 to 950,000 people are believed to be living with HIV infection, and it is estimated that 180,000 to 280,000 are unaware of their diagnosis. (Fleming P, Byers RH, Sweeney PA, et al., HIV prevalence in the United States, 2000 [Abstract 11]. Presented at the Ninth Conference on Retroviruses and Opportunistic Infections, Seattle; February 24–28, 2002). These patients are not only at risk for disease progression, but can undermine efforts at disease prevention if they continue to engage in unsafe activities. Thus, increasing awareness of HIV status is an important aspect of disease prevention.
HIV testing remains a challenge. Conventional testing with enzyme immunoassay (EIA) and confirmatory Western blot requires patient follow-up for results, which approximately 25% of patients in various outpatient testing sites fail to do. (Centers for Disease Control and Prevention. Update: HIV counseling and testing using rapid tests, United States, 1995. MMWR Morb Mortal Wkly Rep. 1998;47:211-215). Given the difficulties inherent in the transition of care from the inpatient to outpatient setting, conventional testing in the inpatient setting presents additional barriers to appropriate notification. As various point-of-care HIV tests have been developed for commercial use, the possibility of rapid HIV testing presents an opportunity to reduce notification failure and improve patient care. While not replacing traditional testing, the CDC has endorsed rapid HIV testing as a means to initiate therapy and provide counseling with a particular focus on preventing further disease transmission. In this retrospective study, Lubelchek and colleagues present the effects of a rapid HIV test utilized in the emergency department on various inpatient quality of care measures for those patients who received a positive rapid HIV test later confirmed by Western blot as compared with those patients who were diagnosed after admission by traditional diagnostic methods. This study took place in the context of CDC-funded study of the use of OraQuick (OraSure Technologies, Bethlehem, Pa.) rapid HIV testing in the emergency department at Cook County Hospital in Chicago.
The manufacturer claims the product has a sensitivity of 99.6% and a specificity of 100% as compared with conventional testing. (OraQuick rapid HIV-1 antibody test summary of safety and effectiveness. November 7, 2002. Accessed October 1, 2005, at www.fda.gov/cber/pma/P010047.htm). In the initial study, two of the three emergency department’s treatment pods were equipped to provide HIV screening utilizing the point-of-care technology to consenting patients. Patients in the third pod could be referred to rapid testing based on symptoms or risk factors. All patients who received the rapid test also submitted specimens for conventional EIA and confirmatory Western blot testing. All positive rapid HIV tests were confirmed by Western blot.
In this study, patients who were not known to be infected and were subsequently admitted on non-obstetric or surgical services over 17 months from 2003 to 2004 and confirmed to be HIV positive by Western blot were identified utilizing administrative records. Where possible, charts were reviewed to confirm no prior diagnosis of HIV. Patients who received rapid HIV testing were compared with those who only received conventional testing. Endpoints included time to primary inpatient care service awareness of HIV diagnosis, time to admission or transfer to the inpatient HIV service, time to empiric treatment of diagnosis of opportunistic infection, length of stay, discharge with appropriate prophylactic medications, discharge with patient knowledge of HIV diagnosis, and initial engagement in outpatient care. Length of stay was adjusted by multivariate regression on co-morbid diagnoses (congestive heart failure, end-stage renal disease, cirrhosis, chronic obstructive pulmonary disease, and diabetes), opportunistic infections, ICU admission, need for mechanical ventilation, and CD4 count.
A total of 103 patients were identified with complete chart review completed on 86 of them. All patients except one were admitted through the emergency department. Forty-eight patients were diagnosed initially with the rapid HIV test with 58% of these specifically referred for testing by the emergency department physician, and 55 were diagnosed with conventional testing. Overall, 78% were male, 62% African American, and 20% Hispanic. The two groups were comparable in terms of age, sex, ethnicity, history of substance abuse, HIV risk factors, psychiatric diagnoses, homelessness, CD4 count, presence of opportunistic infections, mechanical ventilation, and co-morbidities. However, conventionally tested patients were more likely to require an ICU stay (31% vs. 10%, P=.01).
Patients in the rapid test group were more quickly documented in the chart as having HIV (.8 vs. 6.4 days, p<.001), placed on an HIV service sooner (1.4 versus 6.9 days, P<.001), initiated outpatient follow-up sooner (21.5 versus 49.5 days, p=.05), and had less unawareness of their HIV status (0 vs. 16%, P=.002). There was no significant difference between the two groups in time from admission to empiric treatment or diagnosis of an opportunistic infection. Patients who received the rapid test did have a lower length of stay (6.4 versus 13.2 days, P<.001). Although much of this difference was due to higher number of ICU stays in the conventional group, in multivariate analysis conventional testing still increased length of stay significantly, OR 5.4 days (2.5, 8.3).
This study suggests that patients who are tested with rapid HIV testing can lead to more efficient inpatient treatment of the complications of HIV, improved patient awareness of HIV status, and quicker outpatient follow-up. These findings have ramifications not just to the inpatient management of patients with HIV but to general public health efforts to reduce the spread of HIV infection.
Nevertheless, these results must be interpreted with caution. They reflect the experience of one institution situated in an area with a high prevalence of HIV. Some degree of selection bias is suggested by the higher presence of ICU admissions in the conventional testing group. The multivariate analysis attempted to control for confounding factors, but the possibility remains that other unrecognized factors may have influenced results. The authors do note that an analysis of patients in the rapid test group stratified by whether the test was performed for screening or by referral of the physician did not demonstrate a statistically significant difference in length of stay. This finding provides further support that the sicker patients which triggered the rapid test had shorter lengths of stay on account of the rapid test and not simply because they were sicker.
As recognized by the authors, physicians in routine practice rely on surrogate markers of HIV infection, most notably a patient’s CD4 count, and thus it is not surprising that the rapid test did not affect time to empiric treatment or diagnosis of opportunistic infection. If treatment did not differ, then explaining the longer length of stay remains an unexplained puzzle. The fact that the two groups were equally matched socially and psychiatrically leaves open the possibility that it was actual knowledge of the HIV test result—and not its effect on treatment—that drove the longer length of stay.
One possibility not suggested by the authors is that definitive knowledge of HIV status helped to mobilize patient discharge. If there were legitimate concerns of follow-up, physicians may have delayed discharge in order to receive HIV test results. Alternatively, some patients may have resisted discharge until receiving test results and the development of a more concrete plan. It would be interesting to know if the time to follow-up for the two groups would be the same if the 16% who did not know their HIV status at discharge were excluded. This suggests that knowledge of HIV status drives follow-up time and would lend some support to the notion that patient discharge was delayed for test results and clarification of the follow-up treatment plan.
Even putting aside the difference in length of stay, the difference of rapid testing on improved knowledge of HIV status and quicker follow-up is likely real and meaningful. Although this study was not designed to assess the impact of this knowledge on patient behavior, immediate knowledge of HIV status during hospitalization may translate to decreased transmission as patients alter their behavior and lends further credibility to the utility of rapid HIV testing in conjunction with conventional methods in the management of inpatients. TH