User login
U.S. Physician Satisfaction
The burden of dissatisfaction among medical professionals concerns both physicians and policy makers, especially given the potential ramifications on the work force.1, 2 Abundant research documents a strong relationship between low levels of physician satisfaction and burnout,37 intention to leave,6, 815 and job turnover.13, 1618 Moreover, low physician satisfaction is associated with self‐reported psychiatric symptoms1921 and poorer perceived mental health.22 Not surprisingly, dissatisfied physicians are less likely to recommend to medical students that they pursue their specialty.23
Importantly, physician satisfaction appears to benefit patients. Several studies show a positive relationship between higher physician satisfaction and patient satisfaction and outcomes.2426 Patients cared for by satisfied physicians declare more trust and confidence in their physicians, have better continuity, higher ratings of their care,26, 27 lower no‐show rates,25 and enhanced adherence to their medical care.28 There is also some evidence that higher job satisfaction is associated with lower likelihood of patient errors and suboptimal patient care.29
Physician satisfaction can be influenced by factors intrinsic to the individual physician (age, gender, race, and specialty) and extrinsic to the physician (work environment, practice setting, patient characteristics, and income).22, 30 In this way, satisfaction is not a static property in any physician or physician group, but reflects a dynamic interplay among the expectations and environments within which they work. Although each physician, physician group, and specialty has distinct factors that affect satisfaction, none are immune to potential dissatisfaction.
Given the documented impact of physician satisfaction on multiple aspects of healthcare delivery, we undertook a systematic review of the existing literature to achieve a greater understanding of the current state of U.S. physician satisfaction. In addition, we sought to identify the major survey tools used to measure satisfaction and the characteristics intrinsic and extrinsic to the physician that are associated with satisfaction. We conclude by suggesting needed additional research.
Materials and Methods
We performed a literature search of MEDLINE (
Results
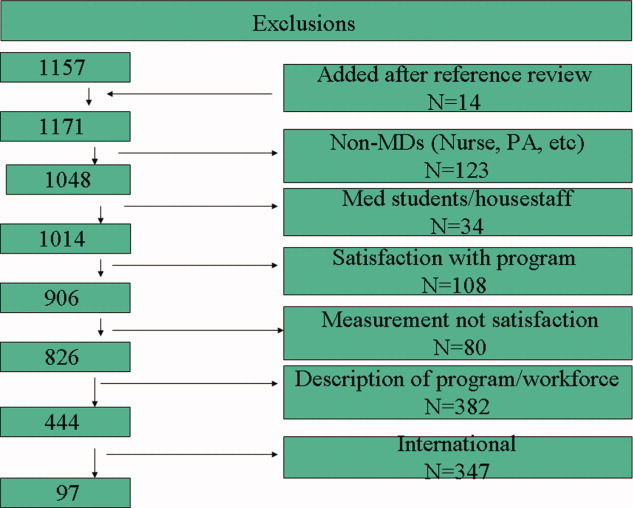
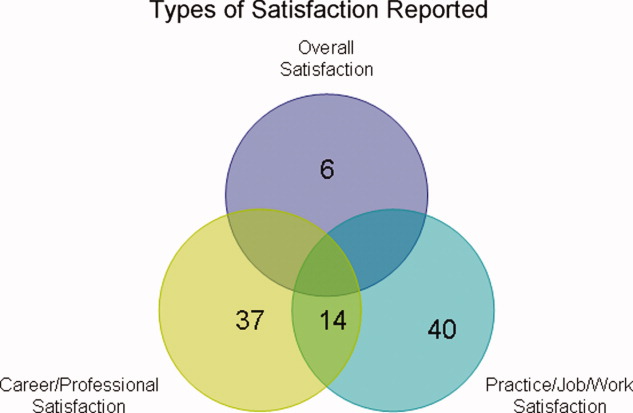
Of the 97 studies, 69 were cross‐sectional (distributed to purposive and often convenience samples of physicians) with sampling sizes ranging from 39 to 6441 and response rates ranging from 31% to 97% (Appendix 1). The other 28 were from larger nationally representative studies (Table 1), including the CTS (n = 92, 45, 71, 74, 91, 102, 104106), RWJS (n = 81, 18, 3334, 39, 40, 60, 61), PWS (n = 711, 22, 23, 55, 83, 92, 99), and WPHS (n = 444, 4951). Fourteen articles reported information from longitudinal (n = 2)18, 86 or repeated cross‐sectional studies (n = 12)1, 2, 39, 73, 76, 79, 85, 91, 96, 97, 102, 110 to help determine satisfaction trends. The survey instruments from the 4 national physician surveys are outlined in Table 1. The types of satisfaction reported are outlined in Figure 2.
| Survey | Satisfaction Measured | MD Type Sampled | Sampled/Responded/Adjusted Response [n/n/% (year of survey)] |
|---|---|---|---|
| |||
| PWS | 150‐item survey; 3 satisfaction domains (job, career, and specialty; all 5‐point Likert scales); 10 satisfaction facets | AMA Masterfile; random sample; FP, IM, IM specialists, pediatrics, and pediatric specialists | 5704/2326/52% |
| CTS | Career satisfaction (5 point Likert scale) | AMA Masterfile; random sample; all physicians in direct patient care 20+ hours a week | 19054/12385/65% (1996); 20131/12280/61% (1998); 20998/12389/59% (2000) |
| RWJ | Practice satisfaction (4‐point Likert scale); career satisfaction (3‐point Likert scale) | AMA Masterfile; random sample; 1987: physicians <40 years old in practice 1‐6 years; 1991: physicians <45 years old in practice 2‐9 years; 1997: physicians <52 years old in practice 8‐17 years | 8379/5865/70% (1987); 9745/4373/70% (1991); 2093/1549/74% (1997) |
| WPHS | Career satisfaction (5‐point Likert scale) | AMA Masterfile; random sample; female medical school graduates from 1950 to 1989 | 4501/2656/59% |
Trends in U.S. Physician Satisfaction
The CTS physician survey used sophisticated large‐scale random sampling methods and consistent questionnaires, thus allowing assessment of trends. From these repeated cross‐sectional surveys, career satisfaction from 1996 to 2001 was stable (81% to 80% among primary care physicians [PCPs], and 81% to 81% among specialists), although the portion of PCPs who report being very satisfied declined from 42% to 38% (P < 0.001) with no significant change for specialists (43% to 42%; P = 0.20).2
The RWJ surveys found small overall declines. From 1991 to 1997, practice satisfaction declined from 86% to 79%, and career satisfaction declined 96% to 88% (P = not available [NA]).1 A comparison of the 1991 RWJ survey to a 1996 age‐matched California physician survey and also found practice satisfaction declined slightly (86% to 82%, P = NA; very satisfied declined 48% to 37%, P = 0.05).39
Two studies of PCPs in Massachusetts found similar modest declines. The first found practice satisfaction declined from 80% to 66% (1996 to 1999; P < 0.001),73 and the second found a nonsignificant decline in professional satisfaction from 81% to 73% (1986 to 1997; P = not significant [NS]).85 Other studies of specific physician populations found insignificant changes in satisfaction levels during the study periods.76, 79, 86, 91, 96, 97, 110 In summary, recent overall physician satisfaction is relatively unchanged, although there may be modest declines in PCPs and young physicians who report high satisfaction, as evidenced from the CTS, RWJ studies, and other small physician cohorts.
Major Characteristics Associated with Physician Satisfaction
Both factors intrinsic to the physician and characteristics of the job influence physician satisfaction (Figure 3). Intrinsic physician factors are typically not changeable when developing strategies to improve satisfaction. However, they do significantly affect what physicians consider important when choosing a job, and influence how physicians respond to changes in the job. Job characteristics, or extrinsic factors, are generally considered more modifiable when developing institutional strategies to improve satisfaction. Although the intrinsic factors are seemingly unmodifiable, one must take them into account when assessing satisfaction in order to determine the independent effects that the more modifiable extrinsic factors have on satisfaction. The next section describes the variables associated with satisfaction, from the 37 studies that utilized multivariate analyses (Appendix 2) to control for other factors (Appendix 3).

Physician Factors
Physician Age
Age is likely weakly but independently associated with satisfaction, although interpretation is limited by the heterogeneity of the physician samples and the manner in which age is reported. Of the 18 studies that evaluated age, 3 (from the PWS, WPHS, and 1 other) found a weak but positive association.9, 23, 50 Five (from the CTS and others) found a U‐shaped relationship (those at the extremes of age were the most satisfied),59, 68, 70, 71, 74 and 3 found an inverse association (2 CTS PCP subsets, and 1 small single‐county study.35, 45, 106 Six found no association, of which only 1 was from a nationally representative sample (PWS PCPs).5, 96, 97, 109, 110, 112
As a surrogate for age, 6 studies evaluated years in practice or years since medical school graduation. Of these, 2 found a weak but positive association (although only seen in specialists, not PCPs in the CTS),89, 104 and 1 found a negative association (when dichotomized),73 with no association in 3 smaller studies.5, 56, 88
These studies support that age is weakly but independently associated with physician satisfaction when studied as a continuous variable. When studied within various age brackets, studies support a U‐shaped association, with the highest satisfaction in those at the extremes of ages, although this may not be true for PCPs. In addition, the association with older age may be the result of less satisfied physicians leaving the profession.
Physician Gender
The association between gender and overall satisfaction is difficult to interpret due to the heterogeneity of the satisfaction assessments and included confounders, although there may be gender differences in facets of satisfaction. Of the 22 studies that evaluated gender, 3 found an independent effect for women (PWS general internal medicine [GIM] sample, CTS, and 1 other),23, 104, 110 3 for men,41, 81, 98 and no gender effect in the others. Those that found men with higher satisfaction included 1 national study of family practitioners (FPs)98 and 2 academic studies, the latter of which found men with or without children with higher satisfaction compared to women with children, indicating children (or work life balance) may confound gender satisfaction.41, 81
Other national studies, including the CTS and PWS, did not find a gender difference in overall satisfaction,9, 35, 45, 56, 59, 68, 71, 73, 74, 88, 89, 96, 97, 106, 109 although the PWS did find differences in facets of satisfaction (women were more satisfied with relationships with colleagues and patients, but less satisfied with autonomy, pay, resources, and community relationships).83
In summary, the relationship between gender and overall satisfaction is likely confounded by many factors, and its independent effect is difficult to quantify given the heterogeneity of the studies reviewed. There may be gender differences in facets of satisfaction, evaluated only in the PWS.
Physician Race/Ethnicity
There were only 5 multivariate studies delineating the association of race/ethnicity with satisfaction, of which 4 found no difference.35, 50, 56, 88 One study found lower satisfaction in minorities compared to whites, but was only a small sample of preventive medicine physicians.93 Given the growing racial and ethnic diversity of physicians, future research should further explore this association.
Physician Specialty
Overall, pediatricians appear to have higher, and GIM to have lower, satisfaction when compared among the PCPs or specialists, although the interpretation is limited by the heterogeneity of the specialties included, how the specialties are demarcated, and the composition of the reference group.
Of the 17 studies that evaluated specialty, 6 found pediatricians had higher satisfaction (including the CTS),5, 70, 73, 74, 104, 106 and 5 found GIM to have lower satisfaction (including the CTS and PWS)5, 11, 74, 104, 106 than various other comparison groups. Generalized interpretation of the other studies is difficult, as 8 of the 11 arise from very specific convenience samples of physicians (within a state or county).35, 56, 68, 73, 89, 96, 97, 109
Job Factors
Job Demand
There is evidence of a relationship between subjective, but not objective, job demands and satisfaction (categorized in the literature as work stress/pressure, workload, and work hours). Of the 10 studies that evaluated various types of perceived work stress/pressure, 9 found a significant association with dissatisfaction.5, 11, 22, 23, 45, 50, 68, 98, 104
Of the 8 studies that evaluated workload, 4 of them evaluated subjective workload and found too much or too little was associated with dissatisfaction.50, 86, 107, 110 The other 4 evaluated actual number of visits (per week or per hour); 3 did not find an association5, 56, 68 and 1 found a weak but negative association with satisfaction.70
Of the 13 studies that evaluated work hours, 8 found no association (including the PWS, CTS, and WPHS).23, 50, 73, 88, 89, 104, 107, 112 Only 1 found a positive association; however, these results were from a stepwise regression analysis in which work stress had already been controlled for in the model, and a separate stepwise regression showed more work hours to be associated with higher stress levels.98 One found satisfaction with work hours had a strong association with overall satisfaction (but not actual work hours).86 Three found a weak negative association, the last of which found that a recent increase in work hours was significantly associated with dissatisfaction, but not actual work hours.2, 70, 84
Of the 3 studies that evaluated on‐call frequency, 2 found higher call frequency to be moderately negatively associated70, 88 and 1 found no association.50
In summary, there is unequivocal evidence that an imbalance between expected and experienced stress, pressure, or workload is moderately associated with dissatisfaction, but there is less evidence of a significant association with objective workload or work hours. On‐call duty may moderately negatively influence satisfaction, although based only on 2 small studies.
Job Control/Autonomy
There is also a strong association with satisfaction and physician control over elements in their work place. Although the studies are heterogeneous in their assessment of work control and autonomy, 15 of the 16 studies found these dimensions to be strongly and significantly associated with satisfaction.1, 2, 5, 20, 45, 50, 56, 68, 71, 86, 96, 97, 104, 107, 109, 112
Relationship with Colleagues
All 5 studies associating relationship with colleagues with satisfaction found the perception of collegial support/emnteraction to exert a moderate independent effect on satisfaction.5, 20, 89, 104, 112
Part‐time Work Status
Of the 3 studies that evaluated this factor in multivariate analysis, 2 did not find a significant association,71, 110 and 1 reported higher satisfaction with full time work (but did not report statistical values).9 Given the number of U.S. physicians working part time, this warrants further research.
Practice Characteristics (Size/Setting/Site/Ownership)
The interpretation of practice characteristics and satisfaction is limited by the heterogeneity in the way the studies partitioned the practice characteristics, and the reference group composition. Of the 10 studies that evaluated several types of practice settings, 5 found solo or small (1‐2 person) practice sizes more likely associated with dissatisfaction than larger practice sizes.88, 97, 104106 The PWS and CTS obstetrician‐gynecologist (ob‐gyn) subset also found health maintenance organization (HMO) satisfaction to be lower compared to various comparisons11, 71 (although the PWS GIM subset did not find a difference).23 Of the 6 surveys evaluating academic/medical school as the reference group, 4 found higher satisfaction with academics (including 2 from the CTS),9, 71, 104, 110 but 2 smaller studies did not find a difference with university affiliation or teaching.88, 96 Of those studies evaluating single vs. multispecialty groups, only 1 found single‐specialty with higher satisfaction than multispecialty89 and 3 others did not find a difference.56, 68, 73
Regarding practice size, 3 of the 4 found no association with satisfaction.56, 109, 110, 112 Only the CTS evaluated practice region and community size and found rural physicians, those in small metropolitan areas, and those in New England and West North central regions had higher satisfaction.45, 71, 74 The CTS also supports that physicians that are part‐owners or nonowners of their practice have higher satisfaction than full owners.45, 74
In summary, practice characteristics may influence physician satisfaction. Physicians in solo and HMO practices may be less satisfied than physicians in other practice settings and sizes, and academic affiliation may have a small but significant association with satisfaction. Practice size and single vs. multispecialty does not appear to significantly affect satisfaction, and satisfaction association with practice region, community size, and ownership is drawn primarily from the CTS and requires further study.
Patient‐payer Mix and Insurance Status
Capitation and provider‐managed care training does appear to affect satisfaction, but managed care or patient insurance status does not. Of the 9 studies that addressed the influence of managed care or capitation on satisfaction, the percentage of managed care practice revenue, number of managed care contracts, or percentage of managed care patients in a practice had no association with satisfaction.2, 71, 73, 74, 104, 105, 109, 112 Two studies did find that capitation was associated with provider dissatisfaction.2, 68 One CTS study found career satisfaction increased in states after the implementation of patient protection acts (implying physician satisfaction increased with less managed care control and more patient/provider empowerment).102 Two other studies found that physicians with training in managed care and positive attitudes about managed care were more likely to be satisfied.98, 112
Regarding insurance status, 3 studies of PCPs in different states did not find an association between satisfaction and insurance (private, none, Medicare, or Medicaid),35, 68, 89 although a study of rural PCPs found more dissatisfaction in those who reported a recent decrease in the number of patients with adequate insurance.84
In summary, there is unlikely an independent effect of patient‐payer mix or managed care on satisfaction. However, capitation may exert a negative effect, and managed care training (and attitude) may exert a positive effect.
Patient Characteristics
Most patient factors were not found to be independently associated with physician satisfaction, including patient complexity,23, 112 patient demands,5, 20 or specific patient demographics.56 The PWS and CTS studies found physicians who value and are able to maintain long‐term patient relationships were more satisfied.45, 104, 112 One study found that those who perceive patients lack confidence in physicians were more likely to be dissatisfied.109 In summary, patient characteristics do not appear to influence provider satisfaction, but a provider's value of, and ability to maintain, long‐term relationships, as well as their perception of patient trust, may influence satisfaction.
Income
Of the 14 studies that evaluated income, 11 found a positive association (the CTS, RWJ, and others) with actual income1, 2, 45, 74, 84, 88, 93, 104 and income satisfaction.97, 98, 109 Of the 3 that did not find an association with actual income, 2 were from the PWS,23, 112 and 1 from the CTS ob‐gyn subset.71
In summary, the association between actual income and satisfaction may be confounded by other variables (such as work hours and part‐time status), but satisfaction with income does appear to correlate with overall satisfaction.
Incentives
There does appear to be a moderate satisfaction association with the types of income incentives. The CTS studies found more satisfied physicians were those with the ability to make clinical decisions without affecting one's income (although that was not found for the PCP subset).45, 104, 106 Other studies found more satisfaction in those reporting a practice with incentives/emphasis based on quality, and less satisfaction in those with incentives/emphasis based on productivity or service reduction.1, 57, 112 Therefore, the evidence favors higher satisfaction with incentives based on quality rather than productivity or utilization.
Other Physician Factors
Board certification may be modestly positively associated with satisfaction, and being a foreign medical graduate may be modestly negatively associated with satisfaction, although this is limited to few studies.9, 45, 74, 98, 104, 106 Other physician characteristics, such as personal matters (marital status, home stress, mental health, personal satisfaction), work matters (amount of charity care they provide and history of work harassment), and personality (reform mindedness and tolerance for uncertainty) require further research.50, 56, 88, 98, 104
Discussion
Our review of satisfaction trends for U.S. physicians revealed relative stability except for a slight decline among PCPs. We found factors significantly associated with satisfaction to include both physician (age and specialty) and job factors (work demand, work control, colleague support, ability to maintain patient relationships, practice setting, income satisfaction, and incentive types). Based on limited data, the association with race/ethnicity and part‐time work requires more research, and factors that do not appear to have an independent effect on satisfaction include physician gender, patient‐payer mix, and patient characteristics.
As the fastest growing specialty in the history of American medicine, hospital medicine should focus on career satisfaction as a top priority in shaping the future of the more than 20,000 hospitalists now practicing. Although the term hospitalist was coined less than 15 years ago114 the demand for hospitalists is expected to grow to as many as 50,000 by 2020.115 In this time of rapid growth, in order to mold a sustainable specialty, we must all recognize the factors that contribute to satisfaction and strive to maintain good job‐person fit. For individual hospitalists, all of these mediators of satisfaction should be considered when contemplating employment. To ensure a mutual fit, each physician must reflect on how their goals and values coincide with those of the program they are considering. For hospital medicine program leaders, areas of program‐specific dissatisfaction must be continually sought and addressed.
In this review, the variables with the strongest associations with satisfaction that are most pertinent to hospitalists are work demand, control, income/emncentives, and collegial relationships. These variables coincide with the 4 pillars of career satisfaction identified in the Society of Hospital Medicine Career Satisfaction Task Force.116 Perceived work stress/pressure and objective workload can easily (and serially) be measured, and the latter can be compared to national benchmarks to ensure appropriate workload expectations.116 Reducing work pressure/stress may involve assessing and matching variations in workload with manpower, reducing nonclinical tasks by utilizing administrative assistants or physician extenders, or having an emergency plan for unexpected absences. Autonomy and control can be assessed by the job‐fit questionnaire to identify programwide and physician‐specific areas of potential discontent.116 Increasing autonomy/control may involve pursuing leadership within hospital projects or committees, creatively scheduling flexibility, and seeking support from hospital administration. Income expectations should also be couched within national benchmarks, and incentive programs should reflect work quality rather than quantity. Collegial support can be enhanced by instituting a mentoring program, journal club, regular social function, or configuration of offices spaces to allow proximity. Although the conclusions of this review are limited by the lack of hospitalists included in the studies and our inability to perform a meta‐analysis, we believe extrapolation of this information to hospitalist physicians is valid and appropriate. That said, future studies specifically addressing hospitalist satisfaction are needed to ensure this.
Conclusions
In summary, physician satisfaction is not a static parameter, but a dynamic entity mediated by both physician‐related and job‐related factors, the majority of which are modifiable. Thus hospitalists and hospital medicine program leaders can be optimistic that uncovering the presence of dissatisfaction through surveys, and addressing the issues triggering it, should enhance physician satisfaction. With improved awareness of mitigating factors of dissatisfaction and commitments to improvement, there is reason for hope. It is unreasonable to believe that dissatisfaction is intrinsic to any medical profession. It is reasonable to believe that physician satisfaction, with all of its desirable implications, can be attained through continual research and prioritization.
The burden of dissatisfaction among medical professionals concerns both physicians and policy makers, especially given the potential ramifications on the work force.1, 2 Abundant research documents a strong relationship between low levels of physician satisfaction and burnout,37 intention to leave,6, 815 and job turnover.13, 1618 Moreover, low physician satisfaction is associated with self‐reported psychiatric symptoms1921 and poorer perceived mental health.22 Not surprisingly, dissatisfied physicians are less likely to recommend to medical students that they pursue their specialty.23
Importantly, physician satisfaction appears to benefit patients. Several studies show a positive relationship between higher physician satisfaction and patient satisfaction and outcomes.2426 Patients cared for by satisfied physicians declare more trust and confidence in their physicians, have better continuity, higher ratings of their care,26, 27 lower no‐show rates,25 and enhanced adherence to their medical care.28 There is also some evidence that higher job satisfaction is associated with lower likelihood of patient errors and suboptimal patient care.29
Physician satisfaction can be influenced by factors intrinsic to the individual physician (age, gender, race, and specialty) and extrinsic to the physician (work environment, practice setting, patient characteristics, and income).22, 30 In this way, satisfaction is not a static property in any physician or physician group, but reflects a dynamic interplay among the expectations and environments within which they work. Although each physician, physician group, and specialty has distinct factors that affect satisfaction, none are immune to potential dissatisfaction.
Given the documented impact of physician satisfaction on multiple aspects of healthcare delivery, we undertook a systematic review of the existing literature to achieve a greater understanding of the current state of U.S. physician satisfaction. In addition, we sought to identify the major survey tools used to measure satisfaction and the characteristics intrinsic and extrinsic to the physician that are associated with satisfaction. We conclude by suggesting needed additional research.
Materials and Methods
We performed a literature search of MEDLINE (
Results
Of the 97 studies, 69 were cross‐sectional (distributed to purposive and often convenience samples of physicians) with sampling sizes ranging from 39 to 6441 and response rates ranging from 31% to 97% (Appendix 1). The other 28 were from larger nationally representative studies (Table 1), including the CTS (n = 92, 45, 71, 74, 91, 102, 104106), RWJS (n = 81, 18, 3334, 39, 40, 60, 61), PWS (n = 711, 22, 23, 55, 83, 92, 99), and WPHS (n = 444, 4951). Fourteen articles reported information from longitudinal (n = 2)18, 86 or repeated cross‐sectional studies (n = 12)1, 2, 39, 73, 76, 79, 85, 91, 96, 97, 102, 110 to help determine satisfaction trends. The survey instruments from the 4 national physician surveys are outlined in Table 1. The types of satisfaction reported are outlined in Figure 2.
| Survey | Satisfaction Measured | MD Type Sampled | Sampled/Responded/Adjusted Response [n/n/% (year of survey)] |
|---|---|---|---|
| |||
| PWS | 150‐item survey; 3 satisfaction domains (job, career, and specialty; all 5‐point Likert scales); 10 satisfaction facets | AMA Masterfile; random sample; FP, IM, IM specialists, pediatrics, and pediatric specialists | 5704/2326/52% |
| CTS | Career satisfaction (5 point Likert scale) | AMA Masterfile; random sample; all physicians in direct patient care 20+ hours a week | 19054/12385/65% (1996); 20131/12280/61% (1998); 20998/12389/59% (2000) |
| RWJ | Practice satisfaction (4‐point Likert scale); career satisfaction (3‐point Likert scale) | AMA Masterfile; random sample; 1987: physicians <40 years old in practice 1‐6 years; 1991: physicians <45 years old in practice 2‐9 years; 1997: physicians <52 years old in practice 8‐17 years | 8379/5865/70% (1987); 9745/4373/70% (1991); 2093/1549/74% (1997) |
| WPHS | Career satisfaction (5‐point Likert scale) | AMA Masterfile; random sample; female medical school graduates from 1950 to 1989 | 4501/2656/59% |
Trends in U.S. Physician Satisfaction
The CTS physician survey used sophisticated large‐scale random sampling methods and consistent questionnaires, thus allowing assessment of trends. From these repeated cross‐sectional surveys, career satisfaction from 1996 to 2001 was stable (81% to 80% among primary care physicians [PCPs], and 81% to 81% among specialists), although the portion of PCPs who report being very satisfied declined from 42% to 38% (P < 0.001) with no significant change for specialists (43% to 42%; P = 0.20).2
The RWJ surveys found small overall declines. From 1991 to 1997, practice satisfaction declined from 86% to 79%, and career satisfaction declined 96% to 88% (P = not available [NA]).1 A comparison of the 1991 RWJ survey to a 1996 age‐matched California physician survey and also found practice satisfaction declined slightly (86% to 82%, P = NA; very satisfied declined 48% to 37%, P = 0.05).39
Two studies of PCPs in Massachusetts found similar modest declines. The first found practice satisfaction declined from 80% to 66% (1996 to 1999; P < 0.001),73 and the second found a nonsignificant decline in professional satisfaction from 81% to 73% (1986 to 1997; P = not significant [NS]).85 Other studies of specific physician populations found insignificant changes in satisfaction levels during the study periods.76, 79, 86, 91, 96, 97, 110 In summary, recent overall physician satisfaction is relatively unchanged, although there may be modest declines in PCPs and young physicians who report high satisfaction, as evidenced from the CTS, RWJ studies, and other small physician cohorts.
Major Characteristics Associated with Physician Satisfaction
Both factors intrinsic to the physician and characteristics of the job influence physician satisfaction (Figure 3). Intrinsic physician factors are typically not changeable when developing strategies to improve satisfaction. However, they do significantly affect what physicians consider important when choosing a job, and influence how physicians respond to changes in the job. Job characteristics, or extrinsic factors, are generally considered more modifiable when developing institutional strategies to improve satisfaction. Although the intrinsic factors are seemingly unmodifiable, one must take them into account when assessing satisfaction in order to determine the independent effects that the more modifiable extrinsic factors have on satisfaction. The next section describes the variables associated with satisfaction, from the 37 studies that utilized multivariate analyses (Appendix 2) to control for other factors (Appendix 3).
Physician Factors
Physician Age
Age is likely weakly but independently associated with satisfaction, although interpretation is limited by the heterogeneity of the physician samples and the manner in which age is reported. Of the 18 studies that evaluated age, 3 (from the PWS, WPHS, and 1 other) found a weak but positive association.9, 23, 50 Five (from the CTS and others) found a U‐shaped relationship (those at the extremes of age were the most satisfied),59, 68, 70, 71, 74 and 3 found an inverse association (2 CTS PCP subsets, and 1 small single‐county study.35, 45, 106 Six found no association, of which only 1 was from a nationally representative sample (PWS PCPs).5, 96, 97, 109, 110, 112
As a surrogate for age, 6 studies evaluated years in practice or years since medical school graduation. Of these, 2 found a weak but positive association (although only seen in specialists, not PCPs in the CTS),89, 104 and 1 found a negative association (when dichotomized),73 with no association in 3 smaller studies.5, 56, 88
These studies support that age is weakly but independently associated with physician satisfaction when studied as a continuous variable. When studied within various age brackets, studies support a U‐shaped association, with the highest satisfaction in those at the extremes of ages, although this may not be true for PCPs. In addition, the association with older age may be the result of less satisfied physicians leaving the profession.
Physician Gender
The association between gender and overall satisfaction is difficult to interpret due to the heterogeneity of the satisfaction assessments and included confounders, although there may be gender differences in facets of satisfaction. Of the 22 studies that evaluated gender, 3 found an independent effect for women (PWS general internal medicine [GIM] sample, CTS, and 1 other),23, 104, 110 3 for men,41, 81, 98 and no gender effect in the others. Those that found men with higher satisfaction included 1 national study of family practitioners (FPs)98 and 2 academic studies, the latter of which found men with or without children with higher satisfaction compared to women with children, indicating children (or work life balance) may confound gender satisfaction.41, 81
Other national studies, including the CTS and PWS, did not find a gender difference in overall satisfaction,9, 35, 45, 56, 59, 68, 71, 73, 74, 88, 89, 96, 97, 106, 109 although the PWS did find differences in facets of satisfaction (women were more satisfied with relationships with colleagues and patients, but less satisfied with autonomy, pay, resources, and community relationships).83
In summary, the relationship between gender and overall satisfaction is likely confounded by many factors, and its independent effect is difficult to quantify given the heterogeneity of the studies reviewed. There may be gender differences in facets of satisfaction, evaluated only in the PWS.
Physician Race/Ethnicity
There were only 5 multivariate studies delineating the association of race/ethnicity with satisfaction, of which 4 found no difference.35, 50, 56, 88 One study found lower satisfaction in minorities compared to whites, but was only a small sample of preventive medicine physicians.93 Given the growing racial and ethnic diversity of physicians, future research should further explore this association.
Physician Specialty
Overall, pediatricians appear to have higher, and GIM to have lower, satisfaction when compared among the PCPs or specialists, although the interpretation is limited by the heterogeneity of the specialties included, how the specialties are demarcated, and the composition of the reference group.
Of the 17 studies that evaluated specialty, 6 found pediatricians had higher satisfaction (including the CTS),5, 70, 73, 74, 104, 106 and 5 found GIM to have lower satisfaction (including the CTS and PWS)5, 11, 74, 104, 106 than various other comparison groups. Generalized interpretation of the other studies is difficult, as 8 of the 11 arise from very specific convenience samples of physicians (within a state or county).35, 56, 68, 73, 89, 96, 97, 109
Job Factors
Job Demand
There is evidence of a relationship between subjective, but not objective, job demands and satisfaction (categorized in the literature as work stress/pressure, workload, and work hours). Of the 10 studies that evaluated various types of perceived work stress/pressure, 9 found a significant association with dissatisfaction.5, 11, 22, 23, 45, 50, 68, 98, 104
Of the 8 studies that evaluated workload, 4 of them evaluated subjective workload and found too much or too little was associated with dissatisfaction.50, 86, 107, 110 The other 4 evaluated actual number of visits (per week or per hour); 3 did not find an association5, 56, 68 and 1 found a weak but negative association with satisfaction.70
Of the 13 studies that evaluated work hours, 8 found no association (including the PWS, CTS, and WPHS).23, 50, 73, 88, 89, 104, 107, 112 Only 1 found a positive association; however, these results were from a stepwise regression analysis in which work stress had already been controlled for in the model, and a separate stepwise regression showed more work hours to be associated with higher stress levels.98 One found satisfaction with work hours had a strong association with overall satisfaction (but not actual work hours).86 Three found a weak negative association, the last of which found that a recent increase in work hours was significantly associated with dissatisfaction, but not actual work hours.2, 70, 84
Of the 3 studies that evaluated on‐call frequency, 2 found higher call frequency to be moderately negatively associated70, 88 and 1 found no association.50
In summary, there is unequivocal evidence that an imbalance between expected and experienced stress, pressure, or workload is moderately associated with dissatisfaction, but there is less evidence of a significant association with objective workload or work hours. On‐call duty may moderately negatively influence satisfaction, although based only on 2 small studies.
Job Control/Autonomy
There is also a strong association with satisfaction and physician control over elements in their work place. Although the studies are heterogeneous in their assessment of work control and autonomy, 15 of the 16 studies found these dimensions to be strongly and significantly associated with satisfaction.1, 2, 5, 20, 45, 50, 56, 68, 71, 86, 96, 97, 104, 107, 109, 112
Relationship with Colleagues
All 5 studies associating relationship with colleagues with satisfaction found the perception of collegial support/emnteraction to exert a moderate independent effect on satisfaction.5, 20, 89, 104, 112
Part‐time Work Status
Of the 3 studies that evaluated this factor in multivariate analysis, 2 did not find a significant association,71, 110 and 1 reported higher satisfaction with full time work (but did not report statistical values).9 Given the number of U.S. physicians working part time, this warrants further research.
Practice Characteristics (Size/Setting/Site/Ownership)
The interpretation of practice characteristics and satisfaction is limited by the heterogeneity in the way the studies partitioned the practice characteristics, and the reference group composition. Of the 10 studies that evaluated several types of practice settings, 5 found solo or small (1‐2 person) practice sizes more likely associated with dissatisfaction than larger practice sizes.88, 97, 104106 The PWS and CTS obstetrician‐gynecologist (ob‐gyn) subset also found health maintenance organization (HMO) satisfaction to be lower compared to various comparisons11, 71 (although the PWS GIM subset did not find a difference).23 Of the 6 surveys evaluating academic/medical school as the reference group, 4 found higher satisfaction with academics (including 2 from the CTS),9, 71, 104, 110 but 2 smaller studies did not find a difference with university affiliation or teaching.88, 96 Of those studies evaluating single vs. multispecialty groups, only 1 found single‐specialty with higher satisfaction than multispecialty89 and 3 others did not find a difference.56, 68, 73
Regarding practice size, 3 of the 4 found no association with satisfaction.56, 109, 110, 112 Only the CTS evaluated practice region and community size and found rural physicians, those in small metropolitan areas, and those in New England and West North central regions had higher satisfaction.45, 71, 74 The CTS also supports that physicians that are part‐owners or nonowners of their practice have higher satisfaction than full owners.45, 74
In summary, practice characteristics may influence physician satisfaction. Physicians in solo and HMO practices may be less satisfied than physicians in other practice settings and sizes, and academic affiliation may have a small but significant association with satisfaction. Practice size and single vs. multispecialty does not appear to significantly affect satisfaction, and satisfaction association with practice region, community size, and ownership is drawn primarily from the CTS and requires further study.
Patient‐payer Mix and Insurance Status
Capitation and provider‐managed care training does appear to affect satisfaction, but managed care or patient insurance status does not. Of the 9 studies that addressed the influence of managed care or capitation on satisfaction, the percentage of managed care practice revenue, number of managed care contracts, or percentage of managed care patients in a practice had no association with satisfaction.2, 71, 73, 74, 104, 105, 109, 112 Two studies did find that capitation was associated with provider dissatisfaction.2, 68 One CTS study found career satisfaction increased in states after the implementation of patient protection acts (implying physician satisfaction increased with less managed care control and more patient/provider empowerment).102 Two other studies found that physicians with training in managed care and positive attitudes about managed care were more likely to be satisfied.98, 112
Regarding insurance status, 3 studies of PCPs in different states did not find an association between satisfaction and insurance (private, none, Medicare, or Medicaid),35, 68, 89 although a study of rural PCPs found more dissatisfaction in those who reported a recent decrease in the number of patients with adequate insurance.84
In summary, there is unlikely an independent effect of patient‐payer mix or managed care on satisfaction. However, capitation may exert a negative effect, and managed care training (and attitude) may exert a positive effect.
Patient Characteristics
Most patient factors were not found to be independently associated with physician satisfaction, including patient complexity,23, 112 patient demands,5, 20 or specific patient demographics.56 The PWS and CTS studies found physicians who value and are able to maintain long‐term patient relationships were more satisfied.45, 104, 112 One study found that those who perceive patients lack confidence in physicians were more likely to be dissatisfied.109 In summary, patient characteristics do not appear to influence provider satisfaction, but a provider's value of, and ability to maintain, long‐term relationships, as well as their perception of patient trust, may influence satisfaction.
Income
Of the 14 studies that evaluated income, 11 found a positive association (the CTS, RWJ, and others) with actual income1, 2, 45, 74, 84, 88, 93, 104 and income satisfaction.97, 98, 109 Of the 3 that did not find an association with actual income, 2 were from the PWS,23, 112 and 1 from the CTS ob‐gyn subset.71
In summary, the association between actual income and satisfaction may be confounded by other variables (such as work hours and part‐time status), but satisfaction with income does appear to correlate with overall satisfaction.
Incentives
There does appear to be a moderate satisfaction association with the types of income incentives. The CTS studies found more satisfied physicians were those with the ability to make clinical decisions without affecting one's income (although that was not found for the PCP subset).45, 104, 106 Other studies found more satisfaction in those reporting a practice with incentives/emphasis based on quality, and less satisfaction in those with incentives/emphasis based on productivity or service reduction.1, 57, 112 Therefore, the evidence favors higher satisfaction with incentives based on quality rather than productivity or utilization.
Other Physician Factors
Board certification may be modestly positively associated with satisfaction, and being a foreign medical graduate may be modestly negatively associated with satisfaction, although this is limited to few studies.9, 45, 74, 98, 104, 106 Other physician characteristics, such as personal matters (marital status, home stress, mental health, personal satisfaction), work matters (amount of charity care they provide and history of work harassment), and personality (reform mindedness and tolerance for uncertainty) require further research.50, 56, 88, 98, 104
Discussion
Our review of satisfaction trends for U.S. physicians revealed relative stability except for a slight decline among PCPs. We found factors significantly associated with satisfaction to include both physician (age and specialty) and job factors (work demand, work control, colleague support, ability to maintain patient relationships, practice setting, income satisfaction, and incentive types). Based on limited data, the association with race/ethnicity and part‐time work requires more research, and factors that do not appear to have an independent effect on satisfaction include physician gender, patient‐payer mix, and patient characteristics.
As the fastest growing specialty in the history of American medicine, hospital medicine should focus on career satisfaction as a top priority in shaping the future of the more than 20,000 hospitalists now practicing. Although the term hospitalist was coined less than 15 years ago114 the demand for hospitalists is expected to grow to as many as 50,000 by 2020.115 In this time of rapid growth, in order to mold a sustainable specialty, we must all recognize the factors that contribute to satisfaction and strive to maintain good job‐person fit. For individual hospitalists, all of these mediators of satisfaction should be considered when contemplating employment. To ensure a mutual fit, each physician must reflect on how their goals and values coincide with those of the program they are considering. For hospital medicine program leaders, areas of program‐specific dissatisfaction must be continually sought and addressed.
In this review, the variables with the strongest associations with satisfaction that are most pertinent to hospitalists are work demand, control, income/emncentives, and collegial relationships. These variables coincide with the 4 pillars of career satisfaction identified in the Society of Hospital Medicine Career Satisfaction Task Force.116 Perceived work stress/pressure and objective workload can easily (and serially) be measured, and the latter can be compared to national benchmarks to ensure appropriate workload expectations.116 Reducing work pressure/stress may involve assessing and matching variations in workload with manpower, reducing nonclinical tasks by utilizing administrative assistants or physician extenders, or having an emergency plan for unexpected absences. Autonomy and control can be assessed by the job‐fit questionnaire to identify programwide and physician‐specific areas of potential discontent.116 Increasing autonomy/control may involve pursuing leadership within hospital projects or committees, creatively scheduling flexibility, and seeking support from hospital administration. Income expectations should also be couched within national benchmarks, and incentive programs should reflect work quality rather than quantity. Collegial support can be enhanced by instituting a mentoring program, journal club, regular social function, or configuration of offices spaces to allow proximity. Although the conclusions of this review are limited by the lack of hospitalists included in the studies and our inability to perform a meta‐analysis, we believe extrapolation of this information to hospitalist physicians is valid and appropriate. That said, future studies specifically addressing hospitalist satisfaction are needed to ensure this.
Conclusions
In summary, physician satisfaction is not a static parameter, but a dynamic entity mediated by both physician‐related and job‐related factors, the majority of which are modifiable. Thus hospitalists and hospital medicine program leaders can be optimistic that uncovering the presence of dissatisfaction through surveys, and addressing the issues triggering it, should enhance physician satisfaction. With improved awareness of mitigating factors of dissatisfaction and commitments to improvement, there is reason for hope. It is unreasonable to believe that dissatisfaction is intrinsic to any medical profession. It is reasonable to believe that physician satisfaction, with all of its desirable implications, can be attained through continual research and prioritization.

Factors of Care Plan Discussions at Admission
Despite an ideal of dying at home, most Americans die in hospitals.1 Patients and families are clear about what they need from the healthcare system at the end of life: relief of distressing symptoms, the opportunity to communicate with physicians and others about death and dying, and the assurance that they will be attended to and comforted by their physicians as they approach death.2, 3 However, discussions about patient preferences for care occur infrequently,47 even though patients want to discuss care with their doctor,68 and physicians believe these discussions are their responsibility.9
The most prominent work in this area occurred in the Study to Understand Prognoses and Preferences for Outcomes and Risks of Treatments (SUPPORT) study, which focused on patients with advanced disease, often in the intensive care unit.4 Furthermore, few studies have focused on general medical patients, and healthcare has changed in important ways since SUPPORT's publication. First, the Patient Self‐Determination Act (PSDA) requires that all patients be asked about their care wishes at the time of admission and document the presence of an advanced directive.10, 11 Second, there is growing awareness of the need to improve palliative care for all hospitalized patients, with many advocating that hospitalization itself is a reason to ask about patient's preferences for care regardless of a patient's level of chronic or acute illness.12 Finally, emergence of hospitalists,1316 movement toward closed intensive care units,17, 18 and changes in residency training have increased segmentation in care of hospitalized patients.15, 18
To overcome limitations of previous literature and update our knowledge of how care discussions take place in the current healthcare environment, we analyzed data from a large study of patients admitted to general medicine services at 6 academic centers. Using this robust dataset, which included prospectively collected information about preferences for communication with their physician, we performed statistical analyses to understand which patient clinical, sociodemographic, and preference‐related factors, as well as factors related to their site of care, were associated with documentation that a code status discussion took place at the time of hospital admission.
PATIENTS AND METHODS
Sites
The Multicenter Hospitalist Study (MCHS) was a multicenter trial of general medical services that enrolled patients at 6 geographically diverse centers: The University of Chicago (which also served as the coordinating center), University of Iowa Hospitals and Clinics, University of California San Francisco, University of Wisconsin, University of New Mexico, and Brigham and Women's Hospital.19
Each site was selected to participate in the MCHS because patients on their general medicine service were admitted to hospitalist and nonhospitalist physicians in a random fashion (eg, based on predetermined call schedule based on day of the week). As teaching hospitals, house officers provided direct care to patients hospitalized at each center; nonteaching services were not present at the sites during the period of this study.
During the period of this study, each site complied with PSDA requirements for noting that patients had been informed about their right to create an advance directive, but no sites had a guideline or other program in place specifically intended to facilitate physician‐patient communication about care wishes. Two sites had active Hospice or Palliative Care services, and another 2 had Geriatrics Consultation services, but none had standard protocols mandating involvement of these consultants at the time of admission, the time when our key outcomes were documented.
Patients
Patients were eligible for inclusion in the MCHS if they were older than 18 years of age and were admitted at random to a hospitalist or nonhospitalist physician; we excluded patients from MCHS if they were admitted specifically under the care of their primary care physician or subspecialist (eg, admitted for chemotherapy) or were a prison inmate. Patients meeting these eligibility criteria were then approached for purposes of informed consent.
Data Collection
Data for this study were obtained from administrative data, patient interview, and chart abstraction as in previous work.14 Administrative data were drawn from cost‐accounting databases at each participating hospital; administrative data were used to provide cost and length of stay data, as well as information about patient insurance type, age, and sex.
We interviewed patients immediately after informed consent was obtained, with both taking place generally within 24 hours of admission. Interviews collected data about patient preferences for care and functional status,20 and other data not reliably available from administrative sources (such as housing situation).
Patient care plan before admission was taken from notes and orders written in the first 24 hours of hospitalization, as mentioned above. Using criteria we employed in previous work,21 a care discussion (CD) was defined as documentation of a discussion between patients (or family) and at least 1 physician (primary physician, hospitalist, consulting physician, or house officer) during the first 24 hours of hospitalization. CDs needed to specify that the person who wrote the note had actually spoken with the patient or their family for the purposes of determining preferences for care, and that this discussion resulted in a specific care plan. Thus, notations such as do not resuscitate/do not intubate, or spoke with family, questions answered, did not qualify as CDs, but a note stating the patient continues to want full efforts was counted as a CD.
Principal investigators at each site were responsible for training and overseeing interviewing and chart abstraction activities at each site, with central oversight of data quality provided by the central coordinating center. Upon receipt at the data coordinating center, all data were examined for missing, nonsensical, or outlier data with errors referred back to the participating sites for correction.
Statistical Analysis
For bivariable comparisons of patients with and without CDs, we used chi‐squared or Mann‐Whitney U‐tests, as appropriate.
Variables with P < 0.20 in bivariable comparisons were selected for initial inclusion in models. Then, using automated forward and stepwise selection techniques as well as manually entered variables, we fit multivariable generalized estimating equations permitting clustering of effects at the physician level to determine the independent association between the multiple factors tested and presence of a CD. In order to guard against the threat of multiple testing, we retained variables at a significance level of P < 0.01; variables were also retained because of observed confounding with other independent variables, or to maintain face validity of the model. All analyses were performed using SAS 9.0 for Windows (SAS Institute Inc., Cary, NC).
RESULTS
Patient Sociodemographics (Table 1)
A total of 17,097 of 33,638 patients (50.8%) were interviewed and gave consent for chart abstraction. Of these patients, 1776 (10.3%) had a CD documented in the first 24 hours of hospitalization. Patients with documented CDs were older, more often white, had completed more years of education, were more likely to have lived in a nursing home prior to admission, and more likely to have been hospitalized in the last 12 months. The proportion of patients with CDs was highly variable across site of enrollment, from 2.8%‐24.9%.
| Value | No Documented CD (n = 15321, 89.7%) | Documented CD (n = 1776, 10.3%) | P* |
|---|---|---|---|
| |||
| Age (Median, 95%CI)* | 56 (55, 56) | 69 (67, 71) | < 0.0001 |
| Female (n, %) | 8390 (54.8%) | 990 (55.7%) | 0.4312 |
| Race (n, %) | |||
| White | 6640 (43.3%) | 938 (52.8%) | < 0.0001 |
| African American | 4673 (30.5%) | 280 (15.8%) | |
| Asian | 532 (3.5%) | 167 (9.4%) | |
| American Indian | 325 (2.1%) | 26 (1.5%) | |
| Other | 1951 (12.7%) | 241 (13.6%) | |
| Refused/Don't know | 1200 (7.8%) | 124 (7.0%) | |
| Ethnicity (n, %) | |||
| Hispanic or Latino Ethnicity | 1724 (11.3%) | 183 (10.3%) | 0.0039 |
| Insurance type (n, %) | |||
| Charity | 481 (3.4%) | 14 (0.8%) | < 0.0001 |
| Indemnity | 3983 (28.2%) | 327 (19.3%) | |
| Medicaid | 2487 (17.6%) | 195 (11.5%) | |
| Medicare | 6418 (45.5%) | 1114 (65.9%) | |
| Other | 105 (0.7%) | 4 (0.2%) | |
| Self pay | 628 (4.5%) | 36 (2.1%) | |
| Self‐reported education (n, %) | |||
| Junior high school or less | 1297 (8.5%) | 217 (12.2%) | < 0.0001 |
| Some high school | 2146 (14.0%) | 182 (10.2%) | |
| High school graduate | 4435 (28.9%) | 465 (26.2%) | |
| Some college or junior college | 3521 (23.0%) | 347 (19.5%) | |
| College graduate | 1729 (11.3%) | 255 (14.4%) | |
| Post‐graduate | 1191 (7.8%) | 173 (9.7%) | |
| Refused/Don't know | 1002 (6.5%) | 137 (7.7%) | |
| Self reported income (n, %) | |||
| $2,500 or less | 1079 (7.0%) | 108 (6.1%) | 0.0002 |
| $2,501 to $5,000 | 424 (2.8%) | 33 (1.9%) | |
| $5,001 to $10,000 | 1436 (9.4%) | 211 (11.9%) | |
| $10,001 to $15,000 | 1080 (7.0%) | 141 (7.9%) | |
| $15,001 to $25,000 | 1054 (6.9%) | 134 (7.5%) | |
| $25,001 to $35,000 | 837 (5.5%) | 74 (4.2%) | |
| $35,001 to $50,000 | 882 (5.8%) | 94 (5.3%) | |
| $50,001 to $100,000 | 1027 (6.7%) | 125 (7.0%) | |
| $100,001 to $200,000 | 357 (2.3%) | 57 (3.2%) | |
| Over $200,000 | 245 (1.6%) | 34 (1.9%) | |
| Don't know/refused | 6900 (45.0%) | 765 (43.1%) | |
| Housing situation (n, %) | |||
| Own apartment or house | 11887 (77.6%) | 1264 (71.2%) | < 0.0001 |
| A relative or friend's apartment or house | 1804 (11.8%) | 217 (12.2%) | |
| A nursing home, group home, or long‐term care facility | 663 (4.3%) | 204 (11.5%) | |
| A homeless shelter | 258 (1.7%) | 27 (1.5%) | |
| Other | 709 (4.6%) | 64 (3.6%) | |
| Marital status (n, %) | |||
| Married | 4992 (32.6%) | 603 (34.0%) | < 0.0001 |
| Living as if married | 440 (2.9%) | 32 (1.8%) | |
| Divorced | 2027 (13.2%) | 199 (11.2%) | |
| Separated | 569 (3.7%) | 30 (1.7%) | |
| Widowed | 2577 (16.8%) | 487 (27.4%) | |
| Single | 4074 (26.6%) | 364 (20.5%) | |
| Refused | 642 (4.2%) | 61 (3.4%) | |
| Hospitalized in the last 12 months (n, %) | 7602 (49.6%) | 1011 (56.9%) | < 0.0001 |
| Site of enrollment (n, %) | |||
| A | 4602 (30.0%) | 135 (7.6%) | < 0.0001 |
| B | 1595 (10.4%) | 158 (8.9%) | |
| C | 3017 (19.7%) | 998 (56.2%) | |
| D | 2387 (15.6%) | 212 (11.9%) | |
| E | 2057 (13.4%) | 131 (7.4%) | |
| F | 1663 (10.9%) | 142 (8.0%) | |
Patient Self‐Reported Health Status and Comorbid Illness (Table 2)
Patients with CDs more often reported a lot of difficulties with bathing, eating, or dressing; household chores; and moderate activities. Patients with CDs were more likely to report accomplishing less than they would like due to their health. They were more likely to have cancer, depression, a history of stroke, and heart disease, but less likely to have diabetes or human immunodeficiency virus.
| Value | No Documented CD (n = 15321, 89.7%) | Documented CD (n = 1776, 10.3%) | P** |
|---|---|---|---|
| |||
| Thinking back again to one month ago, did any impairment or health problem cause you to need help of other persons with personal care needs, such as eating, bathing, dressing, or getting around the home? (n, %) | |||
| No | 10673 (69.7%) | 973 (54.8%) | < 0.0001 |
| Yes, a little | 1933 (12.6%) | 268 (15.1%) | |
| Yes, a lot | 2127 (13.9%) | 487 (27.4%) | |
| Don't know | 588 (3.8%) | 48 (2.7%) | |
| Thinking back to one month ago, did any impairment or health problem cause you to need help in handling everyday household chores, necessary business, shopping, or getting around for other purposes? (n, %) | |||
| No | 7262 (47.4%) | 566 (31.9%) | < 0.0001 |
| Yes, a little | 2692 (17.6%) | 324 (18.2%) | |
| Yes, a lot | 4126 (26.9%) | 825 (46.5%) | |
| Don't know | 1241 (8.1%) | 61 (3.4%) | |
| As far as you know do you have any of the following health conditions at the present time? (n, %) | |||
| Cancer | |||
| No | 13281 (86.7%) | 1376 (77.5%) | < 0.0001 |
| Yes | 1751 (11.4%) | 351 (19.8%) | |
| Not sure | 289 (1.9%) | 49 (2.8%) | |
| Depression | |||
| No | 10269 (67.0%) | 1099 (61.9%) | < 0.0001 |
| Yes | 4730 (30.9%) | 624 (35.1%) | |
| Not sure | 322 (2.1%) | 53 (3.0%) | |
| Diabetes | |||
| No | 10902 (71.2%) | 1356 (76.4%) | < 0.0001 |
| Yes | 4132 (27.0%) | 394 (22.2%) | |
| Not sure | 287 (1.9%) | 26 (1.5%) | |
| Heart trouble | |||
| No | 10251 (66.9%) | 1080 (60.8%) | < 0.0001 |
| Yes | 4491 (29.3%) | 627 (35.3%) | |
| Not sure | 579 (3.8%) | 69 (3.9%) | |
| HIV or AIDS | |||
| No | 14300 (93.3%) | 1679 (94.5%) | 0.026 |
| Yes | 912 (6.0%) | 80 (4.5%) | |
| Not sure | 109 (0.7%) | 17 (1.0%) | |
| Stroke | |||
| No | 13344 (87.1%) | 1494 (84.1%) | 0.0005 |
| Yes | 1722 (11.2%) | 236 (13.3%) | |
| Not sure | 255 (1.7%) | 46 (2.6%) | |
Patient Preferences, Care Plan Documentation, and Care Coordination at Admission (Table 3)
Patients who had documented CDs were less likely to prefer my doctor give me choices regarding my care, and more often disagreed with the statement I prefer to leave care decisions to my physician. These patients were also more likely to have a durable power of attorney or living will in their chart, or have an alternate decision‐maker noted. The majority of patients without a documented CD (79.9%) had no notation of their care wishes, compared to 29.7% in patients with a documented CD. Patients with a documented CD were more likely to have a regular medical provider and a note in the chart from their primary care physician.
| Value | No Documented CD (n = 15321, 89.7%) | Documented CD (n = 1776, 10.3%) | P* |
|---|---|---|---|
| |||
| I prefer my doctor give me choices regarding my care** (n, %) | |||
| Definitely agree | 11619 (75.8%) | 1247 (70.2%) | < 0.0001 |
| Somewhat agree | 1912 (12.5%) | 252 (14.2%) | |
| Somewhat disagree | 488 (3.2%) | 76 (4.3%) | |
| Definitely disagree | 414 (2.7%) | 87 (4.9%) | |
| Don't know | 888 (5.8%) | 114 (6.4%) | |
| I prefer to leave care decisions to my physician** (n, %) | |||
| Definitely agree | 5660 (36.9%) | 613 (34.5%) | < 0.0001 |
| Somewhat agree | 4539 (29.6%) | 493 (27.8%) | |
| Somewhat disagree | 2265 (14.8%) | 257 (14.5%) | |
| Definitely disagree | 1956 (12.8%) | 304 (17.1%) | |
| Don't know | 901 (5.9%) | 109 (6.1%) | |
| Documentation of care wishes before hospitalization (n, %) | |||
| No documentation | 12238 (79.9%) | 527 (29.7%) | < 0.0001 |
| Full support | 2624 (17.1%) | 742 (41.8%) | |
| Do not resuscitate or intubate (DNR/DNI) | 264 (1.7%) | 370 (20.8%) | |
| Hospice | 53 (0.3%) | 22 (1.2%) | |
| Other limitation (eg, no pressors) | 142 (0.9%) | 115 (6.5%) | |
| Had durable power of attorney in chart (n, %) | 286 (1.9%) | 133 (7.5%) | < 0.0001 |
| Had a living will in chart (n, %) | 266 (1.7%) | 142 (8.0%) | < 0.0001 |
| Alternate decision maker named in chart (n, %) | 2770 (18.1%) | 638 (35.9%) | < 0.0001 |
| Patient noted to be unable to participate in their care at admission (eg, confused, unable to respond) (n, %) | 1227 (8.0%) | 431 (24.3%) | < 0.0001 |
| Inpatient team documented discussion with primary care physician (n, %) | 627 (4.1%) | 136 (7.7%) | < 0.0001 |
| Do not have a regular medical provider** (n, %) | 3836 (25.0%) | 254 (14.3%) | < 0.0001 |
| Note from primary care physician in chart (n, %) | 148 (1.0%) | 39 (2.2%) | < 0.0001 |
Factors Associated with Documented Care Discussions (Table 4)
Using predictor variables presented in Tables 1‐3, we then constructed multivariable models seeking to understand factors independently associated with documentation of code status in the entire cohort, as well as among patients who had no preexisting care wishes.
| Entire Cohort (n = 17097) | Patients with No Documentation of Preadmission Wishes (n = 12765) | |||
|---|---|---|---|---|
| Adjusted Odds Ratio (95% CI) | P Value | Adjusted Odds Ratio (95% CI) | P Value | |
| Preadmission Code Status | ||||
| No documentation | Referent | NA | ||
| Full support | 3.22 (2.28, 4.55) | < 0.0001 | NA | |
| Do not resuscitate or intubate (DNR/DNI) | 11.32 (8.52, 15.04) | < 0.0001 | NA | |
| Hospice | 4.02 (2.33, 6.94) | < 0.0001 | NA | |
| Other limitation (eg, no pressors) | 10.13 (7.35, 13.96) | < 0.0001 | NA | |
| Insurance type | ||||
| Medicare | Referent | Referent | ||
| Charity care | 0.50 (0.30, 0.85) | 0.0099 | 0.56 (0.25, 1.25) | 0.1589 |
| Commercial | 0.81 (0.69, 0.95) | 0.0090 | 0.66 (0.52, 0.85) | 0.0009 |
| Medicaid | 0.69 (0.57, 0.82) | < 0.0001 | 0.49 (0.36, 0.67) | < 0.0001 |
| Other | 0.46 (0.18, 1.13) | 0.0912 | 0.60 (0.17, 2.12) | 0.4302 |
| Self pay | 0.70 (0.52, 0.95) | 0.0203 | 0.49 (0.29, 0.81) | 0.0060 |
| Any limitations in bathing, toileting, dressing or feeding self? | ||||
| No | Referent | Referent | ||
| Yes, a little | 1.25 (1.10, 1.42) | 0.0007 | 1.31 (1.03, 1.67) | 0.0272 |
| Yes, a lot | 1.25 (1.09, 1.43) | 0.0015 | 1.42 (1.11, 1.81) | 0.0055 |
| Unable to respond | 0.81 (0.59, 1.12) | 0.2006 | 0.80 (0.45, 1.41) | 0.4299 |
| Patient has a documented surrogate decision maker | 1.72 (1.47, 2.02) | < 0.0001 | 2.08 (1.62, 2.66) | < 0.0001 |
| Patient noted to be unable to participate in their care at admission (eg, confused, unable to respond) | 1.63 (1.37, 1.94) | < 0.0001 | 2.20 (1.60, 3.02) | < 0.0001 |
| Notation that team had spoken to primary care physician at admission | 1.65 (1.29, 2.11) | < 0.0001 | 1.45 (0.92, 2.28) | 0.1116 |
| History of cancer | ||||
| No | Referent | Referent | ||
| Yes | 1.31 (1.13, 1.51) | 0.0003 | 1.26 (0.96, 1.65) | 0.0960 |
| Not sure | 1.26 (0.87, 1.82) | 0.2162 | 1.80 (1.03, 3.15) | 0.0396 |
| History of diabetes | ||||
| No | Referent | Referent | ||
| Yes | 0.87 (0.75, 1.003) | 0.0543 | 0.79 (0.62, 0.997) | 0.0467 |
| Not sure | 0.61 (0.38, 0.99) | 0.0445 | 0.84 (0.43, 1.65) | 0.6183 |
| Housing situation | ||||
| Own house or apartment | Referent | Referent | ||
| Relative or friend's apartment or house | 1.22 (1.03, 1.45) | 0.0229 | 1.29 (0.97, 1.71) | 0.0783 |
| Nursing home, group home, or long‐term care facility | 1.42 (1.16, 1.74) | 0.0006 | 1.74 (1.27, 2.40) | 0.0007 |
| Homeless shelter | 1.12 (0.72, 1.73) | 0.6204 | 0.87 (0.46, 1.63) | 0.6559 |
| Other/Don't know | 1.02 (0.75, 1.40) | 0.8987 | 1.35 (0.78, 2.36) | 0.2859 |
| Age Group | ||||
| <50 | Referent | Referent | ||
| 5059 | 1.19 (0.99, 1.43) | 0.0647 | 1.18 (0.88, 1.59) | 0.2583 |
| 6069 | 1.18 (0.99, 1.40) | 0.0585 | 1.20 (0.88, 1.66) | 0.2549 |
| 7079 | 1.10 (0.91, 1.33) | 0.3178 | 1.19 (0.85, 1.67) | 0.3033 |
| 8089 | 1.23 (1.03, 1.47) | 0.0207 | 1.34 (0.96, 1.88) | 0.0879 |
| 90+ | 1.45 (1.12, 1.88) | 0.0045 | 1.44 (0.94, 2.20) | 0.0934 |
| Site of Enrollment | ||||
| A | Referent | Referent | ||
| B | 1.74 (1.16, 2.61) | 0.007 | 4.95 (2.90, 8.45) | < 0.0001 |
| C | 5.14 (3.42, 7.74) | < 0.0001 | 26.36 (17.28, 40.23) | < 0.0001 |
| D | 4.19 (2.64, 6.66) | < 0.0001 | 8.06 (4.63, 14.03) | < 0.0001 |
| E | 3.00 (1.82, 4.9) | < 0.0001 | 5.30 (2.71, 10.38) | < 0.0001 |
| F | 4.09 (2.69, 6.23) | < 0.0001 | 2.32 (1.32, 4.08) | 0.0037 |
In the entire cohort, insurance type was independently associated with likelihood of a care discussion, with patients with Medicare having greater adjusted odds ratio for a CD than patients with all other forms of insurance, even after adjusting for age. Patients who had functional limitations with bathing, toileting, and feeding; had a documented surrogate decision maker; were unable to participate in their care; had cancer; or did not live in their own home were more likely to have a documented CD. Subjects with diabetes were less likely to have a CD, although this was of borderline significance. Patients whose team had documented a CD with the patients' primary physician were also more likely to have a discussion noted. However, the magnitude of these predictors was small compared to the independent effects attributable to the site the patient was enrolled or whether the patient had any preexisting documentation. Whereas the adjusted odds ratio associated with clinical or functional measures (such as age, cancer) were generally between 1.5 and 2.5, the range of odds ratios associated with having any documentation of care wishes (compared to no documentation) were all greater than 3, and the odds ratios associated with site of enrollment were 1.7 or higher.
We observed similar findings in analyses limited to patients with no preexisting care documentation. While clinical, sociodemographic, and functional factors remained statistically associated with a CD (albeit with wider confidence intervals due to smaller sample sizes), the effect of the patient's site of enrollment became even more striking (Table 4).
DISCUSSION
In this multicenter study of hospitalized general medical patients, documentation of CDs were highly dependent on where patients received care and whether patients had previous documentation of a care plan. In contrast, although clinical, prognostic, and socioeconomic factors were also associated with whether physicians documented asking patients about their wishes for care, the influence of these factors was modest.
Improving communication between patients and their physicians during an episode of acute illness has been a long‐standing goal, with the Study to Understand Prognoses and Preferences for Outcomes of Treatment (SUPPORT) trial providing the most notable example of an effort to improve patient care through aligning patient wishes, prognosis, and aggressiveness for care. However, even the SUPPORT interventiona robust, well‐implemented, and highly labor‐intensive strategywas not able to achieve this goal. In their summary of SUPPORT study findings, the authors suggested that the likelihood of and effectiveness of communication in seriously ill patients may be powerfully influenced by patient and caregiver culture4; our findings may partially confirm SUPPORT's conclusions.
Preexisting documentation in our study would not have included mandated documentation that someone had given the patient information about advance directives (as mandated by the PSDA), but rather a specification for that advance care plan. This distinction means that preexisting documentation in our study represented a previous decision by the patient (or the patient and their physician) to have made a plan, and an association with hospital discussions may be because the first conversation is the hardest to undertake; subsequent discussions then represent confirmatory or clarifying discussions that may be less difficult to broach (particularly for less experienced trainees). A CD may have also been prompted when documentation was unclear, or when a change in prognosis took place (eg, a new diagnosis of metastatic cancer).22 Alternatively, a preexisting plan may serve as a reminder for clinicians to discuss code status, signify patients who are more willing to broach this subject, and either seem more approachable or bring up the topic themselves.
The influence of site on documentation and CD provides additional evidence that caregiver culture played a role in CDs. Although this variation may have been in part due to culture around documentation practices more generally, it is important to note that none of our participating centers had a policy for documentation of care wishes or patient‐doctor communication, or a policy mandating these discussions in any specific patient group. Furthermore, site‐related differences were seen even in patients with no preexisting documentation, and were seen after adjustment for other documentation or communication practices (eg, documenting a discussion with the patient's primary care provider), making it unlikely that documentation practices are solely responsible for our results. Persistence of variations in care documentation raises interesting questions, particularly when one considers recent data describing variations in end‐of‐life care between similar academic centers (one of which was a participating site in this trial).23 Given that the sites in our study represent diverse institutions yet share a number of characteristics, understanding the specific practices or aspects of medical culture that promote conversations may provide insights in how to improve this promotion elsewhere.
Our results would argue that mandates to document code status on admission may be unlikely to improve communication unless sites also develop an approach to using this newly documented information as a prompt for subsequent discussions. In nursing home settings, documentation of advance directives may reduce resource use, but it is unclear whether similar effects will be seen in hospital settings.24 It is also a challenge to insure that documentation of a care plan in the nursing home is communicated to the providers in the hospital.25 The PSDA was a first step in this direction, but its effects on improving communication are uncertain.26 Our results would confirm that the PSDA or systems to mandate documentation are not solutions in themselves, but are 2 steps in a larger process.
We do not want to discount our findings of less frequent CDs among patients of lower socioeconomic status, where gaps in quality of care, communication, and outcomes are well‐recognized.27 As such, our results delineate yet another area where practice can and should be improved for vulnerable patients. However, factors related to site of care and documentation may provide opportunities to improve care even more profoundly and within a fairly discrete (if complex) acute episode of care. Having said this, our results also demonstrate a potential pitfall of using code status documentation for risk‐adjustment, because such notation may be more dependent on local documentation patterns than clinical appropriateness.
Our study has a number of limitations. As an observational study, our findings are likely prone to biases related to unadjusted confounding due to comorbidity. The influence of comorbidity would seem to have been most important in biasing the effects of preexisting documentation, where documentation would be associated with more unaccounted comorbidity. However, there were no differences in documentation even after accounting for prognosis by adjusting for age, functional status, and a valid comorbidity score.28 As we have pointed out, our key outcome is based on documentation of communication and not actual communication, and as such may be biased in subtle ways not related to site of care or the items tested in our model. While we cannot directly eliminate the possibility of documentation biases in our results using statistical methods, it is important to point out that our chart abstraction protocol used highly specific criteria to detect these discussions, and therefore may under‐detect discussions which may have been documented in less detail. Our study did not examine whether documentation of CDs influenced subsequent care. However, previous studies have shown that advance care planning has only a minor influence on care.29 However, communication about preferences at the time of admission, when the need for specific care decisions may be more evident, may be more likely to influence hospital care. Our results show that previous documentation is associated with discussions early in an admission. Such discussion may affect care, even if the decision made is different than what was previously documented. In addition, patients who were included in our study (those able to provide consent and participate in an interview) may be healthier or more cognitively intact than a general population of hospitalized patients. However, how this would have affected our results is unclear. Being able to speak and consent for oneself are key facilitators to communication, but sicker patients who cannot consent or speak for themselves might also be more likely to have care planning decisions made based on illness severity; documentation in these patients may be more driven by whether such notes were required because of the involvement of home health services (or skilled nursing facilities). Finally, although our study is one of the largest examinations of in‐hospital communication to date and its implications for resident education are worth noting, the sites involved in the MCHS may not be representative of nonteaching hospitals, or community‐based teaching hospitals.
Our results suggest that, although comorbid illness and socioeconomic status play an important role in determining which patients receive CDs at the time of admission, these factors are substantially less powerful than preexisting documentation practices and culture or care practices specific to their site of care. These results suggest that future work should consider organizational characteristics and culture as important targets for interventions to improve care planning in hospitalized patients.
- Committee on Care at the End of Life, Institute of Medicine.Approaching Death: Improving Care at the End of Life.Field MJ,Cassel CK, eds.Washington, DC:National Academy Press;1997.
- ,,,,,.Factors considered important at the end of life by patients, family, physicians, and other care providers.JAMA.2000;284(19):2476–2482.
- ,,,,,.In search of a good death: observations of patients, families, and providers.Ann Intern Med.2000;132(10):825–832.
- The SUPPORT Principal Investigators.A controlled trial to improve care for seriously ill hospitalized patients. The study to understand prognoses and preferences for outcomes and risks of treatments (SUPPORT).JAMA.1995;274(20):1591–1598.
- ,.Choices about cardiopulmonary resuscitation in the hospital. When do physicians talk with patients?N Engl J Med.1984;310(17):1089–1093.
- ,,, et al.Patient preferences for communication with physicians about end‐of‐life decisions. SUPPORT Investigators. Study to Understand Prognoses and Preference for Outcomes and Risks of Treatment.Ann Intern Med.1997;127(1):1–12.
- ,,,.Discussing cardiopulmonary resuscitation: a study of elderly outpatients.J Gen Intern Med.1988;3(4):317–321.
- ,,,,.Educating the elderly: cardiopulmonary resuscitation decisions before and after intervention.J Am Geriatr Soc.1991;39(4):372–377.
- ,,,.Factors influencing physicians in recommending in‐hospital cardiopulmonary resuscitation.Arch Intern Med.1993;153(17):1999–2003.
- Federal Register. 42 USC 1395‐1396. Patient Self‐Determination Act1990.
- ,,.Advance directives on admission. Clinical implications and analysis of the Patient Self‐Determination Act of 1990.JAMA.1991;266(3):402–405.
- ,,.A new doctor in the house: ethical issues in hospitalist systems.JAMA.1999;282(2):171–174.
- ,,,,,.Implementation of a hospitalist service at a community teaching hospital: improving clinical efficiency and patient outcomes.Ann Intern Med.2002;137:859–865.
- ,,, et al.Effects of hospitalist physicians on an academic general medical service: results of a randomized trial.Ann Intern Med.2002;137:866–874.
- ,.The hospitalist movement 5 years later.JAMA.2002;287(4):487–494.
- ,,,,.Reorganizing an academic medical service: impact on cost, quality, patient satisfaction, and education.JAMA.1998;279(19):1560–1565.
- ,,,,,.Physician staffing patterns and clinical outcomes in critically ill patients: a systematic review.JAMA.2002;288(17):2151–2162.
- ,,, et al.Organizational characteristics of intensive care units related to outcomes of abdominal aortic surgery.JAMA.1999;281(14):1310–1317.
- ,,, et al.Effects of inpatient experience on outcomes and costs in a multicenter trial of academic hospitalists.J Gen Intern Med.2005;20(Suppl 1):141–142.
- ,,.SF‐12: How to Score the SF‐12 Physical and Mental Health Summary Scales.2nd ed.Boston, MA:New England Medical Center, The Health Institute;1995.
- ,.End‐of‐life care in a voluntary hospitalist model: effects on communication, processes of care, and patient symptoms.Am J Med.2004;116(10):669–675.
- ,,,.Role of written advance directives in decision making: insights from qualitative and quantitative data.J Gen Intern Med.1998;13(7):439–446.
- ,,,,.Evaluating the efficiency of California providers in caring for patients with chronic illnesses.Health Aff (Millwood).2005 Jul‐Dec;Suppl Web Exclusives:W5–526–43.
- ,,, et al.Systematic implementation of an advance directive program in nursing homes: a randomized controlled trial.JAMA.2000;283(11):1437–1444.
- ,.Meeting palliative care needs in post‐acute care settings: “to help them live until they die”.JAMA.2006;295(6):681–686.
- ,,, et al.Advance directives for seriously ill hospitalized patients: effectiveness with the patient self‐determination act and the SUPPORT intervention. SUPPORT Investigators. Study to Understand Prognoses and Preferences for Outcomes and Risks of Treatment.J Am Geriatr Soc.1997;45(4):500–507.
- Institute of Medicine.Unequal Treatment: Confronting Racial and Ethnic Disparities in Health Care.Smedley BD,Stith AY,Nelson AR, eds.Washington, DC:National Academies Press;2003.
- ,,.Use of a self‐report‐generated Charlson Comorbidity Index for predicting mortality.Med Care.2005;43(6):607–615.
- ,,.Can clinical interventions change care at the end of life?Ann Intern Med.1997;126(5):381–388.
Despite an ideal of dying at home, most Americans die in hospitals.1 Patients and families are clear about what they need from the healthcare system at the end of life: relief of distressing symptoms, the opportunity to communicate with physicians and others about death and dying, and the assurance that they will be attended to and comforted by their physicians as they approach death.2, 3 However, discussions about patient preferences for care occur infrequently,47 even though patients want to discuss care with their doctor,68 and physicians believe these discussions are their responsibility.9
The most prominent work in this area occurred in the Study to Understand Prognoses and Preferences for Outcomes and Risks of Treatments (SUPPORT) study, which focused on patients with advanced disease, often in the intensive care unit.4 Furthermore, few studies have focused on general medical patients, and healthcare has changed in important ways since SUPPORT's publication. First, the Patient Self‐Determination Act (PSDA) requires that all patients be asked about their care wishes at the time of admission and document the presence of an advanced directive.10, 11 Second, there is growing awareness of the need to improve palliative care for all hospitalized patients, with many advocating that hospitalization itself is a reason to ask about patient's preferences for care regardless of a patient's level of chronic or acute illness.12 Finally, emergence of hospitalists,1316 movement toward closed intensive care units,17, 18 and changes in residency training have increased segmentation in care of hospitalized patients.15, 18
To overcome limitations of previous literature and update our knowledge of how care discussions take place in the current healthcare environment, we analyzed data from a large study of patients admitted to general medicine services at 6 academic centers. Using this robust dataset, which included prospectively collected information about preferences for communication with their physician, we performed statistical analyses to understand which patient clinical, sociodemographic, and preference‐related factors, as well as factors related to their site of care, were associated with documentation that a code status discussion took place at the time of hospital admission.
PATIENTS AND METHODS
Sites
The Multicenter Hospitalist Study (MCHS) was a multicenter trial of general medical services that enrolled patients at 6 geographically diverse centers: The University of Chicago (which also served as the coordinating center), University of Iowa Hospitals and Clinics, University of California San Francisco, University of Wisconsin, University of New Mexico, and Brigham and Women's Hospital.19
Each site was selected to participate in the MCHS because patients on their general medicine service were admitted to hospitalist and nonhospitalist physicians in a random fashion (eg, based on predetermined call schedule based on day of the week). As teaching hospitals, house officers provided direct care to patients hospitalized at each center; nonteaching services were not present at the sites during the period of this study.
During the period of this study, each site complied with PSDA requirements for noting that patients had been informed about their right to create an advance directive, but no sites had a guideline or other program in place specifically intended to facilitate physician‐patient communication about care wishes. Two sites had active Hospice or Palliative Care services, and another 2 had Geriatrics Consultation services, but none had standard protocols mandating involvement of these consultants at the time of admission, the time when our key outcomes were documented.
Patients
Patients were eligible for inclusion in the MCHS if they were older than 18 years of age and were admitted at random to a hospitalist or nonhospitalist physician; we excluded patients from MCHS if they were admitted specifically under the care of their primary care physician or subspecialist (eg, admitted for chemotherapy) or were a prison inmate. Patients meeting these eligibility criteria were then approached for purposes of informed consent.
Data Collection
Data for this study were obtained from administrative data, patient interview, and chart abstraction as in previous work.14 Administrative data were drawn from cost‐accounting databases at each participating hospital; administrative data were used to provide cost and length of stay data, as well as information about patient insurance type, age, and sex.
We interviewed patients immediately after informed consent was obtained, with both taking place generally within 24 hours of admission. Interviews collected data about patient preferences for care and functional status,20 and other data not reliably available from administrative sources (such as housing situation).
Patient care plan before admission was taken from notes and orders written in the first 24 hours of hospitalization, as mentioned above. Using criteria we employed in previous work,21 a care discussion (CD) was defined as documentation of a discussion between patients (or family) and at least 1 physician (primary physician, hospitalist, consulting physician, or house officer) during the first 24 hours of hospitalization. CDs needed to specify that the person who wrote the note had actually spoken with the patient or their family for the purposes of determining preferences for care, and that this discussion resulted in a specific care plan. Thus, notations such as do not resuscitate/do not intubate, or spoke with family, questions answered, did not qualify as CDs, but a note stating the patient continues to want full efforts was counted as a CD.
Principal investigators at each site were responsible for training and overseeing interviewing and chart abstraction activities at each site, with central oversight of data quality provided by the central coordinating center. Upon receipt at the data coordinating center, all data were examined for missing, nonsensical, or outlier data with errors referred back to the participating sites for correction.
Statistical Analysis
For bivariable comparisons of patients with and without CDs, we used chi‐squared or Mann‐Whitney U‐tests, as appropriate.
Variables with P < 0.20 in bivariable comparisons were selected for initial inclusion in models. Then, using automated forward and stepwise selection techniques as well as manually entered variables, we fit multivariable generalized estimating equations permitting clustering of effects at the physician level to determine the independent association between the multiple factors tested and presence of a CD. In order to guard against the threat of multiple testing, we retained variables at a significance level of P < 0.01; variables were also retained because of observed confounding with other independent variables, or to maintain face validity of the model. All analyses were performed using SAS 9.0 for Windows (SAS Institute Inc., Cary, NC).
RESULTS
Patient Sociodemographics (Table 1)
A total of 17,097 of 33,638 patients (50.8%) were interviewed and gave consent for chart abstraction. Of these patients, 1776 (10.3%) had a CD documented in the first 24 hours of hospitalization. Patients with documented CDs were older, more often white, had completed more years of education, were more likely to have lived in a nursing home prior to admission, and more likely to have been hospitalized in the last 12 months. The proportion of patients with CDs was highly variable across site of enrollment, from 2.8%‐24.9%.
| Value | No Documented CD (n = 15321, 89.7%) | Documented CD (n = 1776, 10.3%) | P* |
|---|---|---|---|
| |||
| Age (Median, 95%CI)* | 56 (55, 56) | 69 (67, 71) | < 0.0001 |
| Female (n, %) | 8390 (54.8%) | 990 (55.7%) | 0.4312 |
| Race (n, %) | |||
| White | 6640 (43.3%) | 938 (52.8%) | < 0.0001 |
| African American | 4673 (30.5%) | 280 (15.8%) | |
| Asian | 532 (3.5%) | 167 (9.4%) | |
| American Indian | 325 (2.1%) | 26 (1.5%) | |
| Other | 1951 (12.7%) | 241 (13.6%) | |
| Refused/Don't know | 1200 (7.8%) | 124 (7.0%) | |
| Ethnicity (n, %) | |||
| Hispanic or Latino Ethnicity | 1724 (11.3%) | 183 (10.3%) | 0.0039 |
| Insurance type (n, %) | |||
| Charity | 481 (3.4%) | 14 (0.8%) | < 0.0001 |
| Indemnity | 3983 (28.2%) | 327 (19.3%) | |
| Medicaid | 2487 (17.6%) | 195 (11.5%) | |
| Medicare | 6418 (45.5%) | 1114 (65.9%) | |
| Other | 105 (0.7%) | 4 (0.2%) | |
| Self pay | 628 (4.5%) | 36 (2.1%) | |
| Self‐reported education (n, %) | |||
| Junior high school or less | 1297 (8.5%) | 217 (12.2%) | < 0.0001 |
| Some high school | 2146 (14.0%) | 182 (10.2%) | |
| High school graduate | 4435 (28.9%) | 465 (26.2%) | |
| Some college or junior college | 3521 (23.0%) | 347 (19.5%) | |
| College graduate | 1729 (11.3%) | 255 (14.4%) | |
| Post‐graduate | 1191 (7.8%) | 173 (9.7%) | |
| Refused/Don't know | 1002 (6.5%) | 137 (7.7%) | |
| Self reported income (n, %) | |||
| $2,500 or less | 1079 (7.0%) | 108 (6.1%) | 0.0002 |
| $2,501 to $5,000 | 424 (2.8%) | 33 (1.9%) | |
| $5,001 to $10,000 | 1436 (9.4%) | 211 (11.9%) | |
| $10,001 to $15,000 | 1080 (7.0%) | 141 (7.9%) | |
| $15,001 to $25,000 | 1054 (6.9%) | 134 (7.5%) | |
| $25,001 to $35,000 | 837 (5.5%) | 74 (4.2%) | |
| $35,001 to $50,000 | 882 (5.8%) | 94 (5.3%) | |
| $50,001 to $100,000 | 1027 (6.7%) | 125 (7.0%) | |
| $100,001 to $200,000 | 357 (2.3%) | 57 (3.2%) | |
| Over $200,000 | 245 (1.6%) | 34 (1.9%) | |
| Don't know/refused | 6900 (45.0%) | 765 (43.1%) | |
| Housing situation (n, %) | |||
| Own apartment or house | 11887 (77.6%) | 1264 (71.2%) | < 0.0001 |
| A relative or friend's apartment or house | 1804 (11.8%) | 217 (12.2%) | |
| A nursing home, group home, or long‐term care facility | 663 (4.3%) | 204 (11.5%) | |
| A homeless shelter | 258 (1.7%) | 27 (1.5%) | |
| Other | 709 (4.6%) | 64 (3.6%) | |
| Marital status (n, %) | |||
| Married | 4992 (32.6%) | 603 (34.0%) | < 0.0001 |
| Living as if married | 440 (2.9%) | 32 (1.8%) | |
| Divorced | 2027 (13.2%) | 199 (11.2%) | |
| Separated | 569 (3.7%) | 30 (1.7%) | |
| Widowed | 2577 (16.8%) | 487 (27.4%) | |
| Single | 4074 (26.6%) | 364 (20.5%) | |
| Refused | 642 (4.2%) | 61 (3.4%) | |
| Hospitalized in the last 12 months (n, %) | 7602 (49.6%) | 1011 (56.9%) | < 0.0001 |
| Site of enrollment (n, %) | |||
| A | 4602 (30.0%) | 135 (7.6%) | < 0.0001 |
| B | 1595 (10.4%) | 158 (8.9%) | |
| C | 3017 (19.7%) | 998 (56.2%) | |
| D | 2387 (15.6%) | 212 (11.9%) | |
| E | 2057 (13.4%) | 131 (7.4%) | |
| F | 1663 (10.9%) | 142 (8.0%) | |
Patient Self‐Reported Health Status and Comorbid Illness (Table 2)
Patients with CDs more often reported a lot of difficulties with bathing, eating, or dressing; household chores; and moderate activities. Patients with CDs were more likely to report accomplishing less than they would like due to their health. They were more likely to have cancer, depression, a history of stroke, and heart disease, but less likely to have diabetes or human immunodeficiency virus.
| Value | No Documented CD (n = 15321, 89.7%) | Documented CD (n = 1776, 10.3%) | P** |
|---|---|---|---|
| |||
| Thinking back again to one month ago, did any impairment or health problem cause you to need help of other persons with personal care needs, such as eating, bathing, dressing, or getting around the home? (n, %) | |||
| No | 10673 (69.7%) | 973 (54.8%) | < 0.0001 |
| Yes, a little | 1933 (12.6%) | 268 (15.1%) | |
| Yes, a lot | 2127 (13.9%) | 487 (27.4%) | |
| Don't know | 588 (3.8%) | 48 (2.7%) | |
| Thinking back to one month ago, did any impairment or health problem cause you to need help in handling everyday household chores, necessary business, shopping, or getting around for other purposes? (n, %) | |||
| No | 7262 (47.4%) | 566 (31.9%) | < 0.0001 |
| Yes, a little | 2692 (17.6%) | 324 (18.2%) | |
| Yes, a lot | 4126 (26.9%) | 825 (46.5%) | |
| Don't know | 1241 (8.1%) | 61 (3.4%) | |
| As far as you know do you have any of the following health conditions at the present time? (n, %) | |||
| Cancer | |||
| No | 13281 (86.7%) | 1376 (77.5%) | < 0.0001 |
| Yes | 1751 (11.4%) | 351 (19.8%) | |
| Not sure | 289 (1.9%) | 49 (2.8%) | |
| Depression | |||
| No | 10269 (67.0%) | 1099 (61.9%) | < 0.0001 |
| Yes | 4730 (30.9%) | 624 (35.1%) | |
| Not sure | 322 (2.1%) | 53 (3.0%) | |
| Diabetes | |||
| No | 10902 (71.2%) | 1356 (76.4%) | < 0.0001 |
| Yes | 4132 (27.0%) | 394 (22.2%) | |
| Not sure | 287 (1.9%) | 26 (1.5%) | |
| Heart trouble | |||
| No | 10251 (66.9%) | 1080 (60.8%) | < 0.0001 |
| Yes | 4491 (29.3%) | 627 (35.3%) | |
| Not sure | 579 (3.8%) | 69 (3.9%) | |
| HIV or AIDS | |||
| No | 14300 (93.3%) | 1679 (94.5%) | 0.026 |
| Yes | 912 (6.0%) | 80 (4.5%) | |
| Not sure | 109 (0.7%) | 17 (1.0%) | |
| Stroke | |||
| No | 13344 (87.1%) | 1494 (84.1%) | 0.0005 |
| Yes | 1722 (11.2%) | 236 (13.3%) | |
| Not sure | 255 (1.7%) | 46 (2.6%) | |
Patient Preferences, Care Plan Documentation, and Care Coordination at Admission (Table 3)
Patients who had documented CDs were less likely to prefer my doctor give me choices regarding my care, and more often disagreed with the statement I prefer to leave care decisions to my physician. These patients were also more likely to have a durable power of attorney or living will in their chart, or have an alternate decision‐maker noted. The majority of patients without a documented CD (79.9%) had no notation of their care wishes, compared to 29.7% in patients with a documented CD. Patients with a documented CD were more likely to have a regular medical provider and a note in the chart from their primary care physician.
| Value | No Documented CD (n = 15321, 89.7%) | Documented CD (n = 1776, 10.3%) | P* |
|---|---|---|---|
| |||
| I prefer my doctor give me choices regarding my care** (n, %) | |||
| Definitely agree | 11619 (75.8%) | 1247 (70.2%) | < 0.0001 |
| Somewhat agree | 1912 (12.5%) | 252 (14.2%) | |
| Somewhat disagree | 488 (3.2%) | 76 (4.3%) | |
| Definitely disagree | 414 (2.7%) | 87 (4.9%) | |
| Don't know | 888 (5.8%) | 114 (6.4%) | |
| I prefer to leave care decisions to my physician** (n, %) | |||
| Definitely agree | 5660 (36.9%) | 613 (34.5%) | < 0.0001 |
| Somewhat agree | 4539 (29.6%) | 493 (27.8%) | |
| Somewhat disagree | 2265 (14.8%) | 257 (14.5%) | |
| Definitely disagree | 1956 (12.8%) | 304 (17.1%) | |
| Don't know | 901 (5.9%) | 109 (6.1%) | |
| Documentation of care wishes before hospitalization (n, %) | |||
| No documentation | 12238 (79.9%) | 527 (29.7%) | < 0.0001 |
| Full support | 2624 (17.1%) | 742 (41.8%) | |
| Do not resuscitate or intubate (DNR/DNI) | 264 (1.7%) | 370 (20.8%) | |
| Hospice | 53 (0.3%) | 22 (1.2%) | |
| Other limitation (eg, no pressors) | 142 (0.9%) | 115 (6.5%) | |
| Had durable power of attorney in chart (n, %) | 286 (1.9%) | 133 (7.5%) | < 0.0001 |
| Had a living will in chart (n, %) | 266 (1.7%) | 142 (8.0%) | < 0.0001 |
| Alternate decision maker named in chart (n, %) | 2770 (18.1%) | 638 (35.9%) | < 0.0001 |
| Patient noted to be unable to participate in their care at admission (eg, confused, unable to respond) (n, %) | 1227 (8.0%) | 431 (24.3%) | < 0.0001 |
| Inpatient team documented discussion with primary care physician (n, %) | 627 (4.1%) | 136 (7.7%) | < 0.0001 |
| Do not have a regular medical provider** (n, %) | 3836 (25.0%) | 254 (14.3%) | < 0.0001 |
| Note from primary care physician in chart (n, %) | 148 (1.0%) | 39 (2.2%) | < 0.0001 |
Factors Associated with Documented Care Discussions (Table 4)
Using predictor variables presented in Tables 1‐3, we then constructed multivariable models seeking to understand factors independently associated with documentation of code status in the entire cohort, as well as among patients who had no preexisting care wishes.
| Entire Cohort (n = 17097) | Patients with No Documentation of Preadmission Wishes (n = 12765) | |||
|---|---|---|---|---|
| Adjusted Odds Ratio (95% CI) | P Value | Adjusted Odds Ratio (95% CI) | P Value | |
| Preadmission Code Status | ||||
| No documentation | Referent | NA | ||
| Full support | 3.22 (2.28, 4.55) | < 0.0001 | NA | |
| Do not resuscitate or intubate (DNR/DNI) | 11.32 (8.52, 15.04) | < 0.0001 | NA | |
| Hospice | 4.02 (2.33, 6.94) | < 0.0001 | NA | |
| Other limitation (eg, no pressors) | 10.13 (7.35, 13.96) | < 0.0001 | NA | |
| Insurance type | ||||
| Medicare | Referent | Referent | ||
| Charity care | 0.50 (0.30, 0.85) | 0.0099 | 0.56 (0.25, 1.25) | 0.1589 |
| Commercial | 0.81 (0.69, 0.95) | 0.0090 | 0.66 (0.52, 0.85) | 0.0009 |
| Medicaid | 0.69 (0.57, 0.82) | < 0.0001 | 0.49 (0.36, 0.67) | < 0.0001 |
| Other | 0.46 (0.18, 1.13) | 0.0912 | 0.60 (0.17, 2.12) | 0.4302 |
| Self pay | 0.70 (0.52, 0.95) | 0.0203 | 0.49 (0.29, 0.81) | 0.0060 |
| Any limitations in bathing, toileting, dressing or feeding self? | ||||
| No | Referent | Referent | ||
| Yes, a little | 1.25 (1.10, 1.42) | 0.0007 | 1.31 (1.03, 1.67) | 0.0272 |
| Yes, a lot | 1.25 (1.09, 1.43) | 0.0015 | 1.42 (1.11, 1.81) | 0.0055 |
| Unable to respond | 0.81 (0.59, 1.12) | 0.2006 | 0.80 (0.45, 1.41) | 0.4299 |
| Patient has a documented surrogate decision maker | 1.72 (1.47, 2.02) | < 0.0001 | 2.08 (1.62, 2.66) | < 0.0001 |
| Patient noted to be unable to participate in their care at admission (eg, confused, unable to respond) | 1.63 (1.37, 1.94) | < 0.0001 | 2.20 (1.60, 3.02) | < 0.0001 |
| Notation that team had spoken to primary care physician at admission | 1.65 (1.29, 2.11) | < 0.0001 | 1.45 (0.92, 2.28) | 0.1116 |
| History of cancer | ||||
| No | Referent | Referent | ||
| Yes | 1.31 (1.13, 1.51) | 0.0003 | 1.26 (0.96, 1.65) | 0.0960 |
| Not sure | 1.26 (0.87, 1.82) | 0.2162 | 1.80 (1.03, 3.15) | 0.0396 |
| History of diabetes | ||||
| No | Referent | Referent | ||
| Yes | 0.87 (0.75, 1.003) | 0.0543 | 0.79 (0.62, 0.997) | 0.0467 |
| Not sure | 0.61 (0.38, 0.99) | 0.0445 | 0.84 (0.43, 1.65) | 0.6183 |
| Housing situation | ||||
| Own house or apartment | Referent | Referent | ||
| Relative or friend's apartment or house | 1.22 (1.03, 1.45) | 0.0229 | 1.29 (0.97, 1.71) | 0.0783 |
| Nursing home, group home, or long‐term care facility | 1.42 (1.16, 1.74) | 0.0006 | 1.74 (1.27, 2.40) | 0.0007 |
| Homeless shelter | 1.12 (0.72, 1.73) | 0.6204 | 0.87 (0.46, 1.63) | 0.6559 |
| Other/Don't know | 1.02 (0.75, 1.40) | 0.8987 | 1.35 (0.78, 2.36) | 0.2859 |
| Age Group | ||||
| <50 | Referent | Referent | ||
| 5059 | 1.19 (0.99, 1.43) | 0.0647 | 1.18 (0.88, 1.59) | 0.2583 |
| 6069 | 1.18 (0.99, 1.40) | 0.0585 | 1.20 (0.88, 1.66) | 0.2549 |
| 7079 | 1.10 (0.91, 1.33) | 0.3178 | 1.19 (0.85, 1.67) | 0.3033 |
| 8089 | 1.23 (1.03, 1.47) | 0.0207 | 1.34 (0.96, 1.88) | 0.0879 |
| 90+ | 1.45 (1.12, 1.88) | 0.0045 | 1.44 (0.94, 2.20) | 0.0934 |
| Site of Enrollment | ||||
| A | Referent | Referent | ||
| B | 1.74 (1.16, 2.61) | 0.007 | 4.95 (2.90, 8.45) | < 0.0001 |
| C | 5.14 (3.42, 7.74) | < 0.0001 | 26.36 (17.28, 40.23) | < 0.0001 |
| D | 4.19 (2.64, 6.66) | < 0.0001 | 8.06 (4.63, 14.03) | < 0.0001 |
| E | 3.00 (1.82, 4.9) | < 0.0001 | 5.30 (2.71, 10.38) | < 0.0001 |
| F | 4.09 (2.69, 6.23) | < 0.0001 | 2.32 (1.32, 4.08) | 0.0037 |
In the entire cohort, insurance type was independently associated with likelihood of a care discussion, with patients with Medicare having greater adjusted odds ratio for a CD than patients with all other forms of insurance, even after adjusting for age. Patients who had functional limitations with bathing, toileting, and feeding; had a documented surrogate decision maker; were unable to participate in their care; had cancer; or did not live in their own home were more likely to have a documented CD. Subjects with diabetes were less likely to have a CD, although this was of borderline significance. Patients whose team had documented a CD with the patients' primary physician were also more likely to have a discussion noted. However, the magnitude of these predictors was small compared to the independent effects attributable to the site the patient was enrolled or whether the patient had any preexisting documentation. Whereas the adjusted odds ratio associated with clinical or functional measures (such as age, cancer) were generally between 1.5 and 2.5, the range of odds ratios associated with having any documentation of care wishes (compared to no documentation) were all greater than 3, and the odds ratios associated with site of enrollment were 1.7 or higher.
We observed similar findings in analyses limited to patients with no preexisting care documentation. While clinical, sociodemographic, and functional factors remained statistically associated with a CD (albeit with wider confidence intervals due to smaller sample sizes), the effect of the patient's site of enrollment became even more striking (Table 4).
DISCUSSION
In this multicenter study of hospitalized general medical patients, documentation of CDs were highly dependent on where patients received care and whether patients had previous documentation of a care plan. In contrast, although clinical, prognostic, and socioeconomic factors were also associated with whether physicians documented asking patients about their wishes for care, the influence of these factors was modest.
Improving communication between patients and their physicians during an episode of acute illness has been a long‐standing goal, with the Study to Understand Prognoses and Preferences for Outcomes of Treatment (SUPPORT) trial providing the most notable example of an effort to improve patient care through aligning patient wishes, prognosis, and aggressiveness for care. However, even the SUPPORT interventiona robust, well‐implemented, and highly labor‐intensive strategywas not able to achieve this goal. In their summary of SUPPORT study findings, the authors suggested that the likelihood of and effectiveness of communication in seriously ill patients may be powerfully influenced by patient and caregiver culture4; our findings may partially confirm SUPPORT's conclusions.
Preexisting documentation in our study would not have included mandated documentation that someone had given the patient information about advance directives (as mandated by the PSDA), but rather a specification for that advance care plan. This distinction means that preexisting documentation in our study represented a previous decision by the patient (or the patient and their physician) to have made a plan, and an association with hospital discussions may be because the first conversation is the hardest to undertake; subsequent discussions then represent confirmatory or clarifying discussions that may be less difficult to broach (particularly for less experienced trainees). A CD may have also been prompted when documentation was unclear, or when a change in prognosis took place (eg, a new diagnosis of metastatic cancer).22 Alternatively, a preexisting plan may serve as a reminder for clinicians to discuss code status, signify patients who are more willing to broach this subject, and either seem more approachable or bring up the topic themselves.
The influence of site on documentation and CD provides additional evidence that caregiver culture played a role in CDs. Although this variation may have been in part due to culture around documentation practices more generally, it is important to note that none of our participating centers had a policy for documentation of care wishes or patient‐doctor communication, or a policy mandating these discussions in any specific patient group. Furthermore, site‐related differences were seen even in patients with no preexisting documentation, and were seen after adjustment for other documentation or communication practices (eg, documenting a discussion with the patient's primary care provider), making it unlikely that documentation practices are solely responsible for our results. Persistence of variations in care documentation raises interesting questions, particularly when one considers recent data describing variations in end‐of‐life care between similar academic centers (one of which was a participating site in this trial).23 Given that the sites in our study represent diverse institutions yet share a number of characteristics, understanding the specific practices or aspects of medical culture that promote conversations may provide insights in how to improve this promotion elsewhere.
Our results would argue that mandates to document code status on admission may be unlikely to improve communication unless sites also develop an approach to using this newly documented information as a prompt for subsequent discussions. In nursing home settings, documentation of advance directives may reduce resource use, but it is unclear whether similar effects will be seen in hospital settings.24 It is also a challenge to insure that documentation of a care plan in the nursing home is communicated to the providers in the hospital.25 The PSDA was a first step in this direction, but its effects on improving communication are uncertain.26 Our results would confirm that the PSDA or systems to mandate documentation are not solutions in themselves, but are 2 steps in a larger process.
We do not want to discount our findings of less frequent CDs among patients of lower socioeconomic status, where gaps in quality of care, communication, and outcomes are well‐recognized.27 As such, our results delineate yet another area where practice can and should be improved for vulnerable patients. However, factors related to site of care and documentation may provide opportunities to improve care even more profoundly and within a fairly discrete (if complex) acute episode of care. Having said this, our results also demonstrate a potential pitfall of using code status documentation for risk‐adjustment, because such notation may be more dependent on local documentation patterns than clinical appropriateness.
Our study has a number of limitations. As an observational study, our findings are likely prone to biases related to unadjusted confounding due to comorbidity. The influence of comorbidity would seem to have been most important in biasing the effects of preexisting documentation, where documentation would be associated with more unaccounted comorbidity. However, there were no differences in documentation even after accounting for prognosis by adjusting for age, functional status, and a valid comorbidity score.28 As we have pointed out, our key outcome is based on documentation of communication and not actual communication, and as such may be biased in subtle ways not related to site of care or the items tested in our model. While we cannot directly eliminate the possibility of documentation biases in our results using statistical methods, it is important to point out that our chart abstraction protocol used highly specific criteria to detect these discussions, and therefore may under‐detect discussions which may have been documented in less detail. Our study did not examine whether documentation of CDs influenced subsequent care. However, previous studies have shown that advance care planning has only a minor influence on care.29 However, communication about preferences at the time of admission, when the need for specific care decisions may be more evident, may be more likely to influence hospital care. Our results show that previous documentation is associated with discussions early in an admission. Such discussion may affect care, even if the decision made is different than what was previously documented. In addition, patients who were included in our study (those able to provide consent and participate in an interview) may be healthier or more cognitively intact than a general population of hospitalized patients. However, how this would have affected our results is unclear. Being able to speak and consent for oneself are key facilitators to communication, but sicker patients who cannot consent or speak for themselves might also be more likely to have care planning decisions made based on illness severity; documentation in these patients may be more driven by whether such notes were required because of the involvement of home health services (or skilled nursing facilities). Finally, although our study is one of the largest examinations of in‐hospital communication to date and its implications for resident education are worth noting, the sites involved in the MCHS may not be representative of nonteaching hospitals, or community‐based teaching hospitals.
Our results suggest that, although comorbid illness and socioeconomic status play an important role in determining which patients receive CDs at the time of admission, these factors are substantially less powerful than preexisting documentation practices and culture or care practices specific to their site of care. These results suggest that future work should consider organizational characteristics and culture as important targets for interventions to improve care planning in hospitalized patients.
- Committee on Care at the End of Life, Institute of Medicine.Approaching Death: Improving Care at the End of Life.Field MJ,Cassel CK, eds.Washington, DC:National Academy Press;1997.
- ,,,,,.Factors considered important at the end of life by patients, family, physicians, and other care providers.JAMA.2000;284(19):2476–2482.
- ,,,,,.In search of a good death: observations of patients, families, and providers.Ann Intern Med.2000;132(10):825–832.
- The SUPPORT Principal Investigators.A controlled trial to improve care for seriously ill hospitalized patients. The study to understand prognoses and preferences for outcomes and risks of treatments (SUPPORT).JAMA.1995;274(20):1591–1598.
- ,.Choices about cardiopulmonary resuscitation in the hospital. When do physicians talk with patients?N Engl J Med.1984;310(17):1089–1093.
- ,,, et al.Patient preferences for communication with physicians about end‐of‐life decisions. SUPPORT Investigators. Study to Understand Prognoses and Preference for Outcomes and Risks of Treatment.Ann Intern Med.1997;127(1):1–12.
- ,,,.Discussing cardiopulmonary resuscitation: a study of elderly outpatients.J Gen Intern Med.1988;3(4):317–321.
- ,,,,.Educating the elderly: cardiopulmonary resuscitation decisions before and after intervention.J Am Geriatr Soc.1991;39(4):372–377.
- ,,,.Factors influencing physicians in recommending in‐hospital cardiopulmonary resuscitation.Arch Intern Med.1993;153(17):1999–2003.
- Federal Register. 42 USC 1395‐1396. Patient Self‐Determination Act1990.
- ,,.Advance directives on admission. Clinical implications and analysis of the Patient Self‐Determination Act of 1990.JAMA.1991;266(3):402–405.
- ,,.A new doctor in the house: ethical issues in hospitalist systems.JAMA.1999;282(2):171–174.
- ,,,,,.Implementation of a hospitalist service at a community teaching hospital: improving clinical efficiency and patient outcomes.Ann Intern Med.2002;137:859–865.
- ,,, et al.Effects of hospitalist physicians on an academic general medical service: results of a randomized trial.Ann Intern Med.2002;137:866–874.
- ,.The hospitalist movement 5 years later.JAMA.2002;287(4):487–494.
- ,,,,.Reorganizing an academic medical service: impact on cost, quality, patient satisfaction, and education.JAMA.1998;279(19):1560–1565.
- ,,,,,.Physician staffing patterns and clinical outcomes in critically ill patients: a systematic review.JAMA.2002;288(17):2151–2162.
- ,,, et al.Organizational characteristics of intensive care units related to outcomes of abdominal aortic surgery.JAMA.1999;281(14):1310–1317.
- ,,, et al.Effects of inpatient experience on outcomes and costs in a multicenter trial of academic hospitalists.J Gen Intern Med.2005;20(Suppl 1):141–142.
- ,,.SF‐12: How to Score the SF‐12 Physical and Mental Health Summary Scales.2nd ed.Boston, MA:New England Medical Center, The Health Institute;1995.
- ,.End‐of‐life care in a voluntary hospitalist model: effects on communication, processes of care, and patient symptoms.Am J Med.2004;116(10):669–675.
- ,,,.Role of written advance directives in decision making: insights from qualitative and quantitative data.J Gen Intern Med.1998;13(7):439–446.
- ,,,,.Evaluating the efficiency of California providers in caring for patients with chronic illnesses.Health Aff (Millwood).2005 Jul‐Dec;Suppl Web Exclusives:W5–526–43.
- ,,, et al.Systematic implementation of an advance directive program in nursing homes: a randomized controlled trial.JAMA.2000;283(11):1437–1444.
- ,.Meeting palliative care needs in post‐acute care settings: “to help them live until they die”.JAMA.2006;295(6):681–686.
- ,,, et al.Advance directives for seriously ill hospitalized patients: effectiveness with the patient self‐determination act and the SUPPORT intervention. SUPPORT Investigators. Study to Understand Prognoses and Preferences for Outcomes and Risks of Treatment.J Am Geriatr Soc.1997;45(4):500–507.
- Institute of Medicine.Unequal Treatment: Confronting Racial and Ethnic Disparities in Health Care.Smedley BD,Stith AY,Nelson AR, eds.Washington, DC:National Academies Press;2003.
- ,,.Use of a self‐report‐generated Charlson Comorbidity Index for predicting mortality.Med Care.2005;43(6):607–615.
- ,,.Can clinical interventions change care at the end of life?Ann Intern Med.1997;126(5):381–388.
Copyright © 2008 Society of Hospital Medicine
Career Satisfaction Toolkit
Early survey data on hospitalists, which suggest high levels of job engagement and low turnover rates, may not be as relevant as programs mature in a competitive marketplace to meet important needs such as rising census and Accreditation Council for Graduate Medical Education (ACGME) requirements. There is also a paucity of data on how different models of compensation affect hospitalists’ career satisfaction.
In 2005 the role of the hospitalist has evolved from simply improving throughput (average length of stay) to one of leadership, quality improvement, and teaching that extends beyond direct patient care. Compensation for hospitalists should not, therefore, be based solely on billing revenue. Improving the efficiency of the hospitalists work environment, which may include IT support, adequate office space, and administrative support, may not only enhance productivity but also job satisfaction. More research is needed to examine these questions.
Progress Report
One of the Career Satisfaction Task Force’s major initiatives has been developing a toolkit for the SHM membership with the purpose of providing members with an action plan for attaining a long and satisfying career in hospital medicine. The following steps are being taken in the creation of the toolkit:
- Needs assessment—questionnaire at the SHM 2005 Annual Meeting;
- Monthly conference calls;
- Timeline:
- Toolkit draft completion—Sept. 2005;
- Review SHM Membership Committee—Oct. 2005;
- Further revision;
- Submission to SHM Board for review—Nov. 2005;
- Further revision; and
- Dissemination at SHM Annual Meeting—May 2006.
- Content—four workplace domains:
- Control/Autonomy;
- Workload/Schedule;
- Community/Environment; and
- Reward/Recognition.
- Elements comprising each domain:
- Definition: specific description of workplace domain;
- Background: review of literature, expert opinion, experience-based observation, executive summary of background content;
- Guidelines: practical actionable recommendations and educational initiatives;
- Pitfalls: specific examples;
- Examples: application to different settings (community, academic, pediatric); and
- References.
Research and Timeline
In parallel to the development of the work domains for the toolkit, the Career Satisfaction Task Force is developing a questionnaire to survey hospitalist physicians on career satisfaction and “worklife.” The last survey of this type was performed in 1999. This questionnaire will allow us to assess changes in hospitalist quality of working life over time to further explore how hospitalists are faring during this critical time of rapid growth of our specialty.
The task force is developing a list of important aspects of worklife, satisfaction, and stress for hospitalists. This list will be supplemented by semi-structured interviews of SHM members and leaders in hospital medicine to include a representative viewpoint of hospitalist worklife: adult and pediatric medicine, academic and community, gender and age, directors of programs, and different employer types.
The interviews were expected to be completed in the fall of 2005. Qualitative data analysis will allow us to ascertain important themes for job performance and satisfaction to be highlighted in the survey. The questionnaire development will also consider inclusion of aspects from the prior surveys to follow results over time and when possible will use validated questions from the quality of working life literature.
We anticipate completion of the questionnaire in spring 2006 followed by surveying of a random sample of hospitalists from the SHM membership through a Web-based survey. Sampling of groups of hospitalists based on job characteristics will occur because there is significant interest and need for information about hospitalist worklife in certain work settings. The questionnaire dissemination time will overlap with the annual meeting to maximize survey response. The task force will work with SHM annual meeting committee to discuss having a dedicated computer for filling out the Web-based survey on-site.
Any SHM member who would like to participate in the questionnaire on-site, even if they were not selected for the random sample, will be encouraged to do so. Data analysis will occur in mid-late 2006. The task force will use information from the analyses to update the SHM Worklife Toolkit. We will also provide numerous forums for dissemination of the data. In particular, we plan to showcase this data at the 2007 SHM Annual Meeting followed by journal publication and Web site posting. It is our hope that this data will provide key information on the current quality of working life of hospitalist physicians to support worklife recommendations that promote sustainable, enjoyable careers in hospital medicine.