User login
Applying a Text-Search Algorithm to Radiology Reports Can Find More Patients With Pulmonary Nodules Than Radiology Coding Alone (FULL)
Rapid advances in imaging technology have led to better spatial resolution with lower radiation doses to patients. These advances have helped to increase the use of diagnostic chest imaging, particularly in emergency departments and oncology centers, and in screening for coronary artery disease. As a result, there has been an explosion of incidental findings on chest imaging—including indeterminate lung nodules.1,2
Lung nodules are rounded and well-circumscribed lung opacities (≤ 3 cm in diameter) that may present as solitary or multiple lesions in usually asymptomatic patients. Most lung nodules are benign, the result of an infectious or inflammatory process. Nodules that are ≤ 8 mm in diameter, unless they show increase in size over time, often can be safely followed with imaging surveillance. In contrast, lung nodules > 8 mm could represent an early-stage lung cancer, especially among patients with high-risk for developing lung cancer (ie, those with advanced age, heavy tobacco abuse, or emphysema) and should be further assessed with close imaging surveillance, either chest computed tomography (CT) alone or positron-emission tomography (PET)/CT, or tissue biopsy, based on the underlying likelihood of malignancy.
Patients who receive an early-stage lung cancer diagnosis can be offered curative treatments leading to improved 5-year survival rates.3,4 Consequently, health care systems need to be able to identify these nodules accurately, in order to categorize and manage them accordingly to the Fleischner radiographic and American College of Chest Physicians clinical guidelines.5,6 Unfortunately, many hospitals struggle to identify patients with incidental lung nodules found during diagnostic chest and abdominal imaging, due in part to poor adherence to Fleischner guidelines among radiologists for categorizing pulmonary nodules.7,8
The Veterans Health Administration (VHA) system is interested in effectively detecting patients with incidental lung nodules. Veterans have a higher risk of developing lung cancer when compared with the entire US population, mainly due to a higher incidence of tobacco use.6 The prevalence of lung nodules among veterans with significant risk factors for lung cancer is about 60% nationwide, and up to 85% in the Midwest, due to the high prevalence of histoplasmosis.7 However, only a small percentage of these nodules represent an early stage primary lung cancer.
Several Veterans Integrated Service Networks (VISNs) in the VHA use a radiology diagnostic code to systematically identify imaging studies with presence of lung nodules. In VISN 23, which includes Minnesota, North Dakota, South Dakota, Iowa, and portions of neighboring states, the code used to identify these radiology studies is 44. However, there is high variability in the reporting and coding of imaging studies among radiologists, which could lead to misclassifying patients with lung nodules.8
Some studies suggest that using an automated text search algorithm within radiology reports can be a highly effective strategy to identify patients with lung nodules.9,10 In this study, we compared the diagnostic performance of a newly developed text search algorithm applied to radiology reports with the current standard practice of using a radiology diagnostic code for identifying patients with lung nodules at the Iowa City US Department of Veterans Affairs (VA) Health Care System (ICVAHCS) hospital in Iowa.
Methods
Since 2014, The ICVAHCS has used a radiology diagnostic code to identify any imaging studies with lung nodules. The radiologist enters “44” at the end of the reading process using the Nuance Powerscribe 360 radiation reporting system. The code is uploaded into the VHA Corporate Data Warehouse (CDW), and it is located within the radiology exam domain. This strategy was created and implemented by the Minneapolis VA Health Care System in Minnesota for all the VA hospitals in VISN 23. A lung nodule registry nurse was provided with a list of radiology studies flagged with this radiology diagnostic code every 2 weeks. A chart review was then performed for all these studies to determine the presence of a lung nodule. When detected, the ordering health care provider was alerted and given recommendations for managing the nodule.
We initially searched for the radiology studies with a presumptive lung nodule using the radiology code 44 within the CDW. Separately, we applied the text search strategy only to radiology reports from chest and abdomen studies (ie, X-rays, CT, magnetic resonance imaging [MRI], and PET) that contained any of the keyword phrases. The text search strategy was modeled based on a natural language processing (NLP) algorithm developed by the Puget Sound VA Healthcare System in Seattle, Washington to identify lung nodules on radiology reports.9 Our algorithm included a series of text searches using Microsoft SQL. After several simulations using a random group of radiology reports, we chose the keywords: “lung AND nodul”; “pulm AND nodul”; “pulm AND mass”; “lung AND mass”; and “ground glass”. We selected only chest and abdomen studies because on several simulations using a random group of radiology reports, the vast majority of lung nodules were identified on chest and abdomen imaging studies. Also, it would not have been feasible to chart review the approximately 30,000 total radiology reports that were generated during the study period.
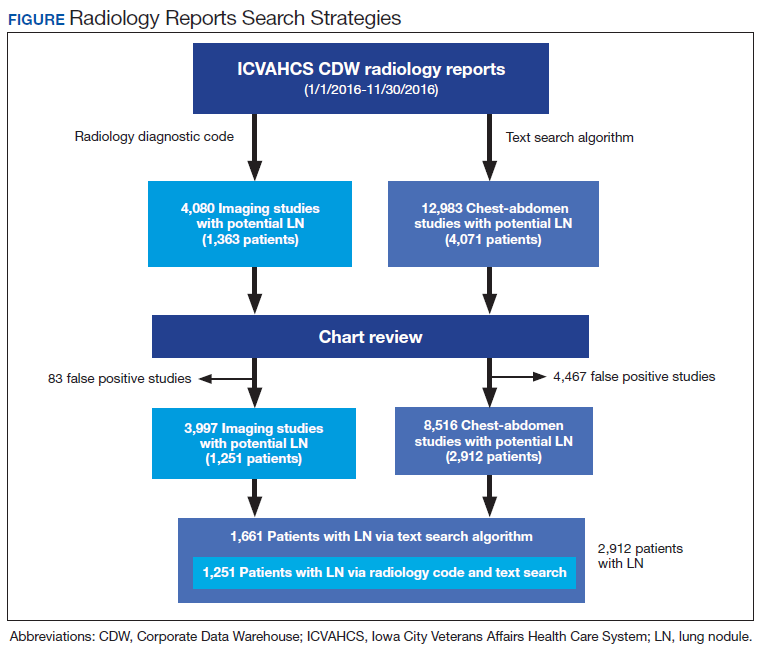
From January 1, 2016 through November 30, 2016, we applied both search strategies independently: radiology diagnostic code for lung nodules to all imaging studies, and text search to all radiology reports of chest and abdomen imaging studies in the CDW (Figure). We also collected demographic (eg, age, sex, race, rurality) and clinical (eg, medical comorbidities, tobacco use) information that were uploaded to the database automatically from CDW using International Statistical Classification of Diseases, Tenth Edition and demographic codes. The VHA uses the Rural-Urban Commuting Areas (RUCA) system to define rurality, which takes into account population density and how closely a community is linked socioeconomically to larger urban centers.11 The protocol was reviewed and approved by the institutional review board of ICVAHCS and the University of Iowa.
The presence of a lung nodule was established by having the lung nodule registry nurse manually review the charts of every patient with a radiology report identified by either code 44 or the text search algorithm. The goal was to ensure that our text search strategy identified all reports with a code 44 to be compliant with VISN expectations. Cases in which a lung nodule was described in the radiology report were considered true positives, and those without a lung nodule description were considered false positives.
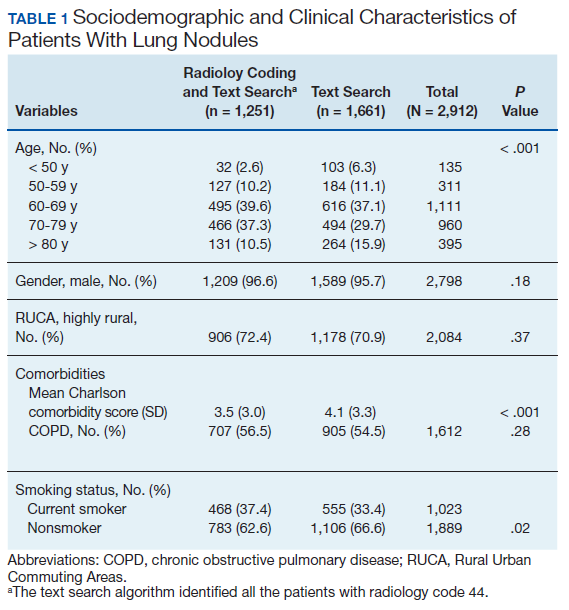
We compared the sociodemographic and clinical characteristics of patients with lung nodules between those identified with both code 44 and the text search and those identified with the text search alone. We used χ2 tests for categorical variables (eg, age, gender, RUCA, chronic obstructive pulmonary disease (COPD), smoking status) and t tests for continuous variables (eg, Charlson comorbidity score). A P value ≤ .05 was considered statistically significant. To assess the yield of each search strategy, we determined the number of patients with lung nodules detected by the text search and the radiology diagnostic code. We also calculated the positive predictive value (PPV) and 95% CI of each search strategy.
Results
We identified 12,983 radiology studies that required manual review during the study period. We confirmed that 8,516 imaging studies had lung nodules, representing 2,912 patients. Subjects with lung nodules were predominantly male (96%), aged between 60 and 79 years (71%), and lived in a rural area (72%). More than 50% of these patients had COPD and over a third were current smokers (Table 1). The text search algorithm identified all of the patients identified by the radiology diagnostic code (n = 1,251). It also identified an additional 1,661 patients with lung nodules that otherwise would have been missed by the radiology code. Compared with those identified only by the text search, those identified by both the radiology coding and text search were older, had lower Charlson comorbidity scores, and were more likely to be a current smoker.
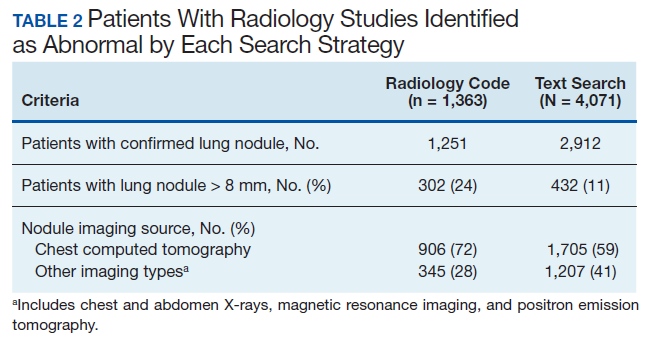
The text search algorithm identified more than twice as many patients with potential lung nodules compared with the radiology diagnostic code (4,071 vs 1,363) (Table 2). However, the text search algorithm was associated with a much higher number of false positives than was the diagnostic code (1,159 vs 112) and a lower PPV (72% [95% CI, 70.6-73.4] vs 92% [95% CI, 90.6-93.4], respectively). The text search algorithm identified 130 patients with lung nodules of moderate to high risk for malignancy (> 8 mm diameter) that were not identified by the radiology code. When the PPV of each search strategy was calculated based on imaging studies with nodules (most patients had > 1 imaging study), the results remained similar (98% for radiology code and 66% for text search). A larger proportion of the lung nodules detected by code 44 vs the text search algorithm were from CT chest studies.
Discussion
In a population of predominantly older male veterans with significant risk factors for lung cancer and high incidence of incidental lung nodules, applying a text search algorithm on radiology reports identified a substantial number of patients with lung nodules, including some with nodules > 8 mm, that were missed by the radiologist-generated code.9,10 Improving the yield of detection for lung nodules in a population with high risk for lung cancer would increase the likelihood of detecting patients with potentially curable early-stage lung cancers, decreasing lung cancer mortality.
The reasons for the high number of patients with lung nodules missed by the radiology code are unclear. Potential explanations may include the lack of standardization of imaging reports by the radiologists (ie, only 21% of chest CTs used a standardized template describing a lung nodule in our study), a problem well recognized both within and outside VHA.8,12
The text search algorithm identified more patients with lung nodules but had a higher rate of false positives when compared with the diagnostic code. The high rate of false positives resulted in more charts to review and an increased workload for the lung nodule registry team. The challenges presented by an increased workload should be balanced against the potential harms of missing nodules that develop into advanced cancer.
Text Search Adjustments
Refining the text search criteria algorithm and the chart review process may decrease the rate of false positives significantly without affecting detection of lung nodules. In subsequent simulations, we found that by adding an exclusion criteria to text search algorithm to remove reports with specific keywords we could substantially reduce the number of false positive reports without affecting the detection rate of the lung nodules. These exclusion criteria would exclude any reports that: (1) contain “nodul” within the next 8 words after mentioning “no”; (2) contain “clear” within the next 8 words after mentioning “lung” in the text (eg, “lungs appear to be clear”); (3) contain “clear” within the next 4 words after mentioning “otherwise” in the text (eg, “otherwise appear to be clear”). Based on our study results, we further refined the text search strategy by limiting the search to only chest imaging studies. When we applied the revised algorithm to a random sample of imaging reports, we found all the code 44 radiology reports were still captured, but we were able to reduce the number of radiology reports needing review by about 80%.
Although classification approaches are being refined to improve radiology performance in multiple categories of nodules, this study suggests that alternative approaches based on text algorithms can improve the capture of pulmonary nodules that require surveillance. These algorithms also can be used to augment radiologist reporting systems. This represents an investment in resources to build a team that should include a bioinformatics specialist, lung nodule registry personnel (review charts of the detected imaging studies with lung nodules, populating the lung nodule database, and determining and tracking the need of imaging follow up), a lung nodule clinic nurse coordinator, and a dedicated lung nodule clinic pulmonologist.
Radiology departments could employ this text search approach to identify missed nodules and use an audit and feedback system to train radiologists to code lung nodules consistently at the time of the initial reading to avoid delays in identifying patients with nodules. Alternatively, the more widespread use of a standardized CT chest radiology reports using Fleischner or the American College of Radiology Lung Imaging Reporting and Data System (Lung RADS) templates might improve the detection of patients with lung nodules.5,13,14
The VHA system should have an effective strategy for identifying incidental lung nodules during routine radiology examinations. Relying only on radiologists to identify and code pulmonary nodules can lead to missing a significant number of patients with lung nodules and some patients with early stage lung cancer who could receive curative therapy.12,14-16 The use of a standardized algorithm, like a text search strategy, might decrease the risk of variation in the execution and result in a more sensitive detection of patients with lung nodules. The text search strategy might be easily implemented and shared with other hospitals both within and outside the VHA.
Limitations
This study was performed in a single VHA hospital and the findings may not be generalizable to other settings of care. Second, our study design is susceptible to work-up bias because the results of a diagnostic test (eg, chest or abdomen imaging) affected whether the chart review was used to verify the test result. It was not feasible to review the patient records of all radiology studies done at the facility during the study period, consequently complete 2 × 2 tables could not be created to calculate sensitivity, specificity, and negative predictive value.
Conclusion
A text search algorithm of radiology reports increased the detection of patients with lung nodules when compared with radiology diagnostic coding alone. However, the improved detection was associated with a higher rate of false positives, which requires manually reviewing a larger number of patient’s chart reports. Future research and quality improvement should focus on standardizing the radiology reporting process and improving the efficiency and reliability of follow up and tracking of incidental lung nodules.
Acknowledgments
The work reported here was supported by a grant from the Office of Rural Health (N32-FY16Q1-S1-P01577), US Department of Veterans Affairs, Veterans Health Administration. We also had the support from the Veterans Rural Health Resource Center-Iowa City, and the Health Services Research and Development (HSR&D) Service through the Comprehensive Access and Delivery Research and Evaluation (CADRE) Center (REA 09-220).
1. Jacobs PC, Mali WP, Grobbee DE, van der Graaf Y. Prevalence of incidental findings in computed tomographic screening of the chest: a systematic review. Journal of computer assisted tomography. 2008;32(2):214-221.
2. Frank L, Quint LE. Chest CT incidentalomas: thyroid lesions, enlarged mediastinal lymph nodes, and lung nodules. Cancer Imaging. 2012;12(1):41-48.
3. National Institutes of Health, National Cancer Institute, Surveillance, Epidemiology, and End Results Program. Cancer stat facts: lung and bronchus cancer. https://seer.cancer.gov/statfacts/html/lungb.html. Accessed April 8, 2020.
4. Alberg AJ, Brock MV, Ford JG, Samet JM, Spivack SD. Epidemiology of lung cancer: Diagnosis and management of lung cancer, 3rd ed: American College of Chest Physicians evidence-based clinical practice guidelines. Chest. 2013;143(5 Suppl):e1S-e29S.
5. MacMahon H, Naidich DP, Goo JM, et al. Guidelines for Management of Incidental Pulmonary Nodules Detected on CT Images: From the Fleischner Society 2017. Radiology. 2017;284(1):228-243.
6. Zullig LL, Jackson GL, Dorn RA, et al. Cancer incidence among patients of the U.S. Veterans Affairs Health Care System. Mil Med. 2012;177(6):693-701.
7. Kinsinger LS, Anderson C, Kim J, et al. Implementation of lung cancer screening in the Veterans Health Administration. JAMA Intern Med. 2017;177(3):399-406.
8. Iqbal MN, Stott E, Huml AM, et al. What’s in a name? Factors associated with documentation and evaluation of incidental pulmonary nodules. Ann Am Thorac Soc. 2016;13(10):1704-1711.
9. Farjah F, Halgrim S, Buist DS, et al. An automated method for identifying individuals with a lung nodule can be feasibly implemented across health systems. Egems (Wash DC). 2016;4(1):1254.
10. Danforth KN, Early MI, Ngan S, Kosco AE, Zheng C, Gould MK. Automated identification of patients with pulmonary nodules in an integrated health system using administrative health plan data, radiology reports, and natural language processing. J Thorac Oncol. 2012;7(8):1257-1262.
11. US Department of Veterans Affairs, Office of Rural Health. https://www.ruralhealth.va.gov/aboutus/ruralvets.asp. Updated January 28, 2020. Accessed April 8, 2020.
12. Blagev DP, Lloyd JF, Conner K, et al. Follow-up of incidental pulmonary nodules and the radiology report. J Am Coll Radiol. 2016;13(2 suppl):R18-R24.
13. Eisenberg RL, Fleischner S. Ways to improve radiologists’ adherence to Fleischner Society guidelines for management of pulmonary nodules. J Am Coll Radiol. 2013;10(6):439-441.
14. Aberle DR. Implementing lung cancer screening: the US experience. Clin Radiol. 2017;72(5):401-406.
15. Gould MK, Donington J, Lynch WR, et al. Evaluation of individuals with pulmonary nodules: when is it lung cancer? Diagnosis and management of lung cancer, 3rd ed: American College of Chest Physicians evidence-based clinical practice guidelines. Chest. 2013;143(5 Suppl):e93S-e120S.
16. Callister ME, Baldwin DR. How should pulmonary nodules be optimally investigated and managed? Lung Cancer. 2016;91:48-55.
Rapid advances in imaging technology have led to better spatial resolution with lower radiation doses to patients. These advances have helped to increase the use of diagnostic chest imaging, particularly in emergency departments and oncology centers, and in screening for coronary artery disease. As a result, there has been an explosion of incidental findings on chest imaging—including indeterminate lung nodules.1,2
Lung nodules are rounded and well-circumscribed lung opacities (≤ 3 cm in diameter) that may present as solitary or multiple lesions in usually asymptomatic patients. Most lung nodules are benign, the result of an infectious or inflammatory process. Nodules that are ≤ 8 mm in diameter, unless they show increase in size over time, often can be safely followed with imaging surveillance. In contrast, lung nodules > 8 mm could represent an early-stage lung cancer, especially among patients with high-risk for developing lung cancer (ie, those with advanced age, heavy tobacco abuse, or emphysema) and should be further assessed with close imaging surveillance, either chest computed tomography (CT) alone or positron-emission tomography (PET)/CT, or tissue biopsy, based on the underlying likelihood of malignancy.
Patients who receive an early-stage lung cancer diagnosis can be offered curative treatments leading to improved 5-year survival rates.3,4 Consequently, health care systems need to be able to identify these nodules accurately, in order to categorize and manage them accordingly to the Fleischner radiographic and American College of Chest Physicians clinical guidelines.5,6 Unfortunately, many hospitals struggle to identify patients with incidental lung nodules found during diagnostic chest and abdominal imaging, due in part to poor adherence to Fleischner guidelines among radiologists for categorizing pulmonary nodules.7,8
The Veterans Health Administration (VHA) system is interested in effectively detecting patients with incidental lung nodules. Veterans have a higher risk of developing lung cancer when compared with the entire US population, mainly due to a higher incidence of tobacco use.6 The prevalence of lung nodules among veterans with significant risk factors for lung cancer is about 60% nationwide, and up to 85% in the Midwest, due to the high prevalence of histoplasmosis.7 However, only a small percentage of these nodules represent an early stage primary lung cancer.
Several Veterans Integrated Service Networks (VISNs) in the VHA use a radiology diagnostic code to systematically identify imaging studies with presence of lung nodules. In VISN 23, which includes Minnesota, North Dakota, South Dakota, Iowa, and portions of neighboring states, the code used to identify these radiology studies is 44. However, there is high variability in the reporting and coding of imaging studies among radiologists, which could lead to misclassifying patients with lung nodules.8
Some studies suggest that using an automated text search algorithm within radiology reports can be a highly effective strategy to identify patients with lung nodules.9,10 In this study, we compared the diagnostic performance of a newly developed text search algorithm applied to radiology reports with the current standard practice of using a radiology diagnostic code for identifying patients with lung nodules at the Iowa City US Department of Veterans Affairs (VA) Health Care System (ICVAHCS) hospital in Iowa.
Methods
Since 2014, The ICVAHCS has used a radiology diagnostic code to identify any imaging studies with lung nodules. The radiologist enters “44” at the end of the reading process using the Nuance Powerscribe 360 radiation reporting system. The code is uploaded into the VHA Corporate Data Warehouse (CDW), and it is located within the radiology exam domain. This strategy was created and implemented by the Minneapolis VA Health Care System in Minnesota for all the VA hospitals in VISN 23. A lung nodule registry nurse was provided with a list of radiology studies flagged with this radiology diagnostic code every 2 weeks. A chart review was then performed for all these studies to determine the presence of a lung nodule. When detected, the ordering health care provider was alerted and given recommendations for managing the nodule.
We initially searched for the radiology studies with a presumptive lung nodule using the radiology code 44 within the CDW. Separately, we applied the text search strategy only to radiology reports from chest and abdomen studies (ie, X-rays, CT, magnetic resonance imaging [MRI], and PET) that contained any of the keyword phrases. The text search strategy was modeled based on a natural language processing (NLP) algorithm developed by the Puget Sound VA Healthcare System in Seattle, Washington to identify lung nodules on radiology reports.9 Our algorithm included a series of text searches using Microsoft SQL. After several simulations using a random group of radiology reports, we chose the keywords: “lung AND nodul”; “pulm AND nodul”; “pulm AND mass”; “lung AND mass”; and “ground glass”. We selected only chest and abdomen studies because on several simulations using a random group of radiology reports, the vast majority of lung nodules were identified on chest and abdomen imaging studies. Also, it would not have been feasible to chart review the approximately 30,000 total radiology reports that were generated during the study period.
From January 1, 2016 through November 30, 2016, we applied both search strategies independently: radiology diagnostic code for lung nodules to all imaging studies, and text search to all radiology reports of chest and abdomen imaging studies in the CDW (Figure). We also collected demographic (eg, age, sex, race, rurality) and clinical (eg, medical comorbidities, tobacco use) information that were uploaded to the database automatically from CDW using International Statistical Classification of Diseases, Tenth Edition and demographic codes. The VHA uses the Rural-Urban Commuting Areas (RUCA) system to define rurality, which takes into account population density and how closely a community is linked socioeconomically to larger urban centers.11 The protocol was reviewed and approved by the institutional review board of ICVAHCS and the University of Iowa.
The presence of a lung nodule was established by having the lung nodule registry nurse manually review the charts of every patient with a radiology report identified by either code 44 or the text search algorithm. The goal was to ensure that our text search strategy identified all reports with a code 44 to be compliant with VISN expectations. Cases in which a lung nodule was described in the radiology report were considered true positives, and those without a lung nodule description were considered false positives.
We compared the sociodemographic and clinical characteristics of patients with lung nodules between those identified with both code 44 and the text search and those identified with the text search alone. We used χ2 tests for categorical variables (eg, age, gender, RUCA, chronic obstructive pulmonary disease (COPD), smoking status) and t tests for continuous variables (eg, Charlson comorbidity score). A P value ≤ .05 was considered statistically significant. To assess the yield of each search strategy, we determined the number of patients with lung nodules detected by the text search and the radiology diagnostic code. We also calculated the positive predictive value (PPV) and 95% CI of each search strategy.
Results
We identified 12,983 radiology studies that required manual review during the study period. We confirmed that 8,516 imaging studies had lung nodules, representing 2,912 patients. Subjects with lung nodules were predominantly male (96%), aged between 60 and 79 years (71%), and lived in a rural area (72%). More than 50% of these patients had COPD and over a third were current smokers (Table 1). The text search algorithm identified all of the patients identified by the radiology diagnostic code (n = 1,251). It also identified an additional 1,661 patients with lung nodules that otherwise would have been missed by the radiology code. Compared with those identified only by the text search, those identified by both the radiology coding and text search were older, had lower Charlson comorbidity scores, and were more likely to be a current smoker.
The text search algorithm identified more than twice as many patients with potential lung nodules compared with the radiology diagnostic code (4,071 vs 1,363) (Table 2). However, the text search algorithm was associated with a much higher number of false positives than was the diagnostic code (1,159 vs 112) and a lower PPV (72% [95% CI, 70.6-73.4] vs 92% [95% CI, 90.6-93.4], respectively). The text search algorithm identified 130 patients with lung nodules of moderate to high risk for malignancy (> 8 mm diameter) that were not identified by the radiology code. When the PPV of each search strategy was calculated based on imaging studies with nodules (most patients had > 1 imaging study), the results remained similar (98% for radiology code and 66% for text search). A larger proportion of the lung nodules detected by code 44 vs the text search algorithm were from CT chest studies.
Discussion
In a population of predominantly older male veterans with significant risk factors for lung cancer and high incidence of incidental lung nodules, applying a text search algorithm on radiology reports identified a substantial number of patients with lung nodules, including some with nodules > 8 mm, that were missed by the radiologist-generated code.9,10 Improving the yield of detection for lung nodules in a population with high risk for lung cancer would increase the likelihood of detecting patients with potentially curable early-stage lung cancers, decreasing lung cancer mortality.
The reasons for the high number of patients with lung nodules missed by the radiology code are unclear. Potential explanations may include the lack of standardization of imaging reports by the radiologists (ie, only 21% of chest CTs used a standardized template describing a lung nodule in our study), a problem well recognized both within and outside VHA.8,12
The text search algorithm identified more patients with lung nodules but had a higher rate of false positives when compared with the diagnostic code. The high rate of false positives resulted in more charts to review and an increased workload for the lung nodule registry team. The challenges presented by an increased workload should be balanced against the potential harms of missing nodules that develop into advanced cancer.
Text Search Adjustments
Refining the text search criteria algorithm and the chart review process may decrease the rate of false positives significantly without affecting detection of lung nodules. In subsequent simulations, we found that by adding an exclusion criteria to text search algorithm to remove reports with specific keywords we could substantially reduce the number of false positive reports without affecting the detection rate of the lung nodules. These exclusion criteria would exclude any reports that: (1) contain “nodul” within the next 8 words after mentioning “no”; (2) contain “clear” within the next 8 words after mentioning “lung” in the text (eg, “lungs appear to be clear”); (3) contain “clear” within the next 4 words after mentioning “otherwise” in the text (eg, “otherwise appear to be clear”). Based on our study results, we further refined the text search strategy by limiting the search to only chest imaging studies. When we applied the revised algorithm to a random sample of imaging reports, we found all the code 44 radiology reports were still captured, but we were able to reduce the number of radiology reports needing review by about 80%.
Although classification approaches are being refined to improve radiology performance in multiple categories of nodules, this study suggests that alternative approaches based on text algorithms can improve the capture of pulmonary nodules that require surveillance. These algorithms also can be used to augment radiologist reporting systems. This represents an investment in resources to build a team that should include a bioinformatics specialist, lung nodule registry personnel (review charts of the detected imaging studies with lung nodules, populating the lung nodule database, and determining and tracking the need of imaging follow up), a lung nodule clinic nurse coordinator, and a dedicated lung nodule clinic pulmonologist.
Radiology departments could employ this text search approach to identify missed nodules and use an audit and feedback system to train radiologists to code lung nodules consistently at the time of the initial reading to avoid delays in identifying patients with nodules. Alternatively, the more widespread use of a standardized CT chest radiology reports using Fleischner or the American College of Radiology Lung Imaging Reporting and Data System (Lung RADS) templates might improve the detection of patients with lung nodules.5,13,14
The VHA system should have an effective strategy for identifying incidental lung nodules during routine radiology examinations. Relying only on radiologists to identify and code pulmonary nodules can lead to missing a significant number of patients with lung nodules and some patients with early stage lung cancer who could receive curative therapy.12,14-16 The use of a standardized algorithm, like a text search strategy, might decrease the risk of variation in the execution and result in a more sensitive detection of patients with lung nodules. The text search strategy might be easily implemented and shared with other hospitals both within and outside the VHA.
Limitations
This study was performed in a single VHA hospital and the findings may not be generalizable to other settings of care. Second, our study design is susceptible to work-up bias because the results of a diagnostic test (eg, chest or abdomen imaging) affected whether the chart review was used to verify the test result. It was not feasible to review the patient records of all radiology studies done at the facility during the study period, consequently complete 2 × 2 tables could not be created to calculate sensitivity, specificity, and negative predictive value.
Conclusion
A text search algorithm of radiology reports increased the detection of patients with lung nodules when compared with radiology diagnostic coding alone. However, the improved detection was associated with a higher rate of false positives, which requires manually reviewing a larger number of patient’s chart reports. Future research and quality improvement should focus on standardizing the radiology reporting process and improving the efficiency and reliability of follow up and tracking of incidental lung nodules.
Acknowledgments
The work reported here was supported by a grant from the Office of Rural Health (N32-FY16Q1-S1-P01577), US Department of Veterans Affairs, Veterans Health Administration. We also had the support from the Veterans Rural Health Resource Center-Iowa City, and the Health Services Research and Development (HSR&D) Service through the Comprehensive Access and Delivery Research and Evaluation (CADRE) Center (REA 09-220).
1. Jacobs PC, Mali WP, Grobbee DE, van der Graaf Y. Prevalence of incidental findings in computed tomographic screening of the chest: a systematic review. Journal of computer assisted tomography. 2008;32(2):214-221.
2. Frank L, Quint LE. Chest CT incidentalomas: thyroid lesions, enlarged mediastinal lymph nodes, and lung nodules. Cancer Imaging. 2012;12(1):41-48.
3. National Institutes of Health, National Cancer Institute, Surveillance, Epidemiology, and End Results Program. Cancer stat facts: lung and bronchus cancer. https://seer.cancer.gov/statfacts/html/lungb.html. Accessed April 8, 2020.
4. Alberg AJ, Brock MV, Ford JG, Samet JM, Spivack SD. Epidemiology of lung cancer: Diagnosis and management of lung cancer, 3rd ed: American College of Chest Physicians evidence-based clinical practice guidelines. Chest. 2013;143(5 Suppl):e1S-e29S.
5. MacMahon H, Naidich DP, Goo JM, et al. Guidelines for Management of Incidental Pulmonary Nodules Detected on CT Images: From the Fleischner Society 2017. Radiology. 2017;284(1):228-243.
6. Zullig LL, Jackson GL, Dorn RA, et al. Cancer incidence among patients of the U.S. Veterans Affairs Health Care System. Mil Med. 2012;177(6):693-701.
7. Kinsinger LS, Anderson C, Kim J, et al. Implementation of lung cancer screening in the Veterans Health Administration. JAMA Intern Med. 2017;177(3):399-406.
8. Iqbal MN, Stott E, Huml AM, et al. What’s in a name? Factors associated with documentation and evaluation of incidental pulmonary nodules. Ann Am Thorac Soc. 2016;13(10):1704-1711.
9. Farjah F, Halgrim S, Buist DS, et al. An automated method for identifying individuals with a lung nodule can be feasibly implemented across health systems. Egems (Wash DC). 2016;4(1):1254.
10. Danforth KN, Early MI, Ngan S, Kosco AE, Zheng C, Gould MK. Automated identification of patients with pulmonary nodules in an integrated health system using administrative health plan data, radiology reports, and natural language processing. J Thorac Oncol. 2012;7(8):1257-1262.
11. US Department of Veterans Affairs, Office of Rural Health. https://www.ruralhealth.va.gov/aboutus/ruralvets.asp. Updated January 28, 2020. Accessed April 8, 2020.
12. Blagev DP, Lloyd JF, Conner K, et al. Follow-up of incidental pulmonary nodules and the radiology report. J Am Coll Radiol. 2016;13(2 suppl):R18-R24.
13. Eisenberg RL, Fleischner S. Ways to improve radiologists’ adherence to Fleischner Society guidelines for management of pulmonary nodules. J Am Coll Radiol. 2013;10(6):439-441.
14. Aberle DR. Implementing lung cancer screening: the US experience. Clin Radiol. 2017;72(5):401-406.
15. Gould MK, Donington J, Lynch WR, et al. Evaluation of individuals with pulmonary nodules: when is it lung cancer? Diagnosis and management of lung cancer, 3rd ed: American College of Chest Physicians evidence-based clinical practice guidelines. Chest. 2013;143(5 Suppl):e93S-e120S.
16. Callister ME, Baldwin DR. How should pulmonary nodules be optimally investigated and managed? Lung Cancer. 2016;91:48-55.
Is a telehospitalist service right for you and your group?
Telemedicine “ripe for adoption” by hospitalists
For medical inpatients, the advent of virtual care began decades ago with telephones and the ability of physicians to give “verbal orders” while outside the hospital. It evolved into widespread adoption of pagers and is now ubiquitous through smart phones, texting, and HIPPA-compliant applications. In the past few years, inpatient telemedicine programs have been developed and studied including tele-ICU, telestroke, and now the telehospitalist.

Telemedicine is not new and has seen rapid adoption in the outpatient setting over the past decade,1 especially since the passing of telemedicine parity laws in 35 states to support equal reimbursement with face-to-face visits.2 In addition, 24 states have joined the Interstate Medical Licensure Compact (IMLC).3 This voluntary program provides an expedited pathway to licensure for qualified physicians who practice in multiple states. The goal is to increase access to care for patients in underserved and rural areas and to allow easier consultation through telemedicine. Combined, these two federal initiatives have lowered two major barriers to entry for telemedicine: reimbursement and credentialing.
Only a handful of papers have been published on the telehospitalist model with one of the first in 2007 in The Hospitalist reporting on the intersection between tele-ICU and telehospitalist care.4 More recent work describes the implementation of a telehospitalist program between a large university hospitalist program and a rural, critical access hospital.5 A key goal of this program, developed by Dr. Ethan Kuperman and colleagues at the University of Iowa, was to keep patients at the critical access hospital that previously would have been transferred. This has obvious benefits for patients, the critical access hospital, and the local community. It also benefited the tertiary care referral center, which was dealing with high occupancy rates. Keeping lower acuity patients at the critical access hospital helps maintain access for more complex patients at the referral center. This same principle has applied to the use of the tele-ICU where lower acuity ICU patients could remain in the small, rural ICU, and only those patients who the intensivist believes would benefit from a higher level of care in a tertiary center would be transferred.
As this study and others have shown, telemedicine is ripe for adoption by hospitalists. The bigger question is how should it fit into the current model of hospital medicine? There are several different applications we are familiar with and each has unique considerations. The first model, as applied in the Kuperman paper, is for a larger hospitalist program to provide a telehospitalist service to a smaller, unaffiliated hospital (for example, critical access hospitals) that employs nurse practitioners or physician assistants on site but can’t recruit or retain full-time hospitalist coverage. In this collaborative model of care, the local provider performs the physical exam but provides care under the guidance and supervision of a hospital medicine specialist. This is expected to improve outcomes and bring the benefits of hospital medicine, including improved outcomes and decreased hospital spending, to smaller communities.6 In this model, the critical access hospital pays a fee for the service and retains the billing to third party payers.
A variation on that model would provide telehospitalist services to other hospitals within an existing health care network (such as Kaiser Permanente, Intermountain Healthcare, government hospitals) that have different financial models with incentives to collaborate. The Veterans Health Administration is embarking on a pilot through the VA Office of Rural Health to provide a telehospitalist service to small rural VA hospitals using the consultative model during the day with a nurse practitioner at the local site and physician backup from the emergency department. Although existing night cross-coverage will be maintained by a physician on call, this telehospitalist service may also evolve into providing cross-coverage on nights and weekends.
A third would be like a locum tenens model in which telehospitalist services are contracted for short periods of time when coverage is needed for vacations or staff shortages. A fourth model of telehospitalist care would be to international areas in need of hospitalist expertise, like a medical mission model but without the expense or time required to travel. Other models will likely evolve based on the demand for services, supply of hospitalists, changes in regulations, and reimbursement.
Another important consideration is how this will evolve for the practicing hospitalist. Will we have dedicated virtual hospitalists, akin to the “nocturnist” who covers nights and weekends? Or will working on the telehospitalist service be in the rotation of duties like many programs have with teaching and “nonteaching” services, medical consultation, and even transition clinics and emergency department triage responsibilities? It could serve as a lower-intensity service that can be staffed during office-based time that would include scholarly work, quality improvement, and administrative duties. If financially viable, it could be mutually beneficial for both the provider and recipient sides of telehospitalist care.
For any of these models to work, technical aspects must be ironed-out. It is indispensable for the provider to have remote access to the electronic health record for data review, documentation, and placing orders if needed. Adequate broadband for effective video connection, accompanied by the appropriate HIPPA-compliant software and hardware must be in place. Although highly specialized hardware has been developed, including remote stethoscopes and otoscopes, the key component is a good camera and video screen on each end of the interaction. Based upon prior experience with telemedicine programs, establishment of trusting relationships with the receiving hospital staff, physicians, and nurse practitioners is also critical. Optimally, the telehospitalist would have an opportunity to travel to the remote site to meet with the local care team and learn about the local resources and community. Many other operational and logistical issues need to be considered and will be supported by the Society of Hospital Medicine through publications, online resources, and national and regional meeting educational content on telehospitalist programs.
As hospital medicine adopts the telehospitalist model, it brings with it important considerations. First, is how we embrace the concept of the medical virtualist, a term used to describe physicians who spend the majority or all of their time caring for patients using a virtual medium.7 We find it difficult to imagine spending all or the majority of our time as a virtual hospitalist, but years ago many could not imagine someone being a full-time hospitalist or nocturnist. Some individuals will see this as a career opportunity that allows them to work as a hospitalist regardless of where they live or where the hospital is located. That has obvious advantages for both career choice and the provision of hospital medicine expertise to low-resourced or low-volume settings, such as rural or international locations and nights and weekends.
Second, the telehospitalist model will require professional standards, training, reimbursement and coding adjustments, hardware and software development, and managing patient expectations for care.
Lastly, hospitals, health care systems, hospitalist groups, and even individual hospitalists will have to determine how best to take advantage of this innovative model of care to provide the highest possible quality, in a cost-efficient manner, that supports professional satisfaction and development.
Dr. Kaboli and Dr. Gutierrez are based at the Center for Access and Delivery Research and Evaluation (CADRE) at the Iowa City VA Healthcare System, the Veterans Rural Health Resource Center-Iowa City, VA Office of Rural Health, and the department of internal medicine, University of Iowa, both in Iowa City.
References
1. Barnett ML et al. Trends in telemedicine use in a large commercially insured population, 2005-2017. JAMA. 2018;320(20):2147-9.
2. American Telemedicine Association State Policy Resource Center. 2018; http://www.americantelemed.org/main/policy-page/state-policy-resource-center. Accessed 2018 Dec 14.
3. Interstate Medical Licensure Compact 2018; https://imlcc.org/. Accessed 2018 Dec 14.
4. Hengehold D. The telehospitalist. The Hospitalist. 2007;7(July). https://www.the-hospitalist.org/hospitalist/article/123381/telehospitalist. Accessed 2018 Dec 14.
5. Kuperman EF et al. The virtual hospitalist: A single-site implementation bringing hospitalist coverage to critical access hospitals. J Hosp Med. 2018;13(11):759-63.
6. Peterson MC. A systematic review of outcomes and quality measures in adult patients cared for by hospitalists vs nonhospitalists. Mayo Clinic proceedings. 2009;84(3):248-54.
7. Nochomovitz M, Sharma R. Is it time for a new medical specialty?: The medical virtualist. JAMA. 2018;319(5):437-8.
Telemedicine “ripe for adoption” by hospitalists
Telemedicine “ripe for adoption” by hospitalists
For medical inpatients, the advent of virtual care began decades ago with telephones and the ability of physicians to give “verbal orders” while outside the hospital. It evolved into widespread adoption of pagers and is now ubiquitous through smart phones, texting, and HIPPA-compliant applications. In the past few years, inpatient telemedicine programs have been developed and studied including tele-ICU, telestroke, and now the telehospitalist.
Telemedicine is not new and has seen rapid adoption in the outpatient setting over the past decade,1 especially since the passing of telemedicine parity laws in 35 states to support equal reimbursement with face-to-face visits.2 In addition, 24 states have joined the Interstate Medical Licensure Compact (IMLC).3 This voluntary program provides an expedited pathway to licensure for qualified physicians who practice in multiple states. The goal is to increase access to care for patients in underserved and rural areas and to allow easier consultation through telemedicine. Combined, these two federal initiatives have lowered two major barriers to entry for telemedicine: reimbursement and credentialing.
Only a handful of papers have been published on the telehospitalist model with one of the first in 2007 in The Hospitalist reporting on the intersection between tele-ICU and telehospitalist care.4 More recent work describes the implementation of a telehospitalist program between a large university hospitalist program and a rural, critical access hospital.5 A key goal of this program, developed by Dr. Ethan Kuperman and colleagues at the University of Iowa, was to keep patients at the critical access hospital that previously would have been transferred. This has obvious benefits for patients, the critical access hospital, and the local community. It also benefited the tertiary care referral center, which was dealing with high occupancy rates. Keeping lower acuity patients at the critical access hospital helps maintain access for more complex patients at the referral center. This same principle has applied to the use of the tele-ICU where lower acuity ICU patients could remain in the small, rural ICU, and only those patients who the intensivist believes would benefit from a higher level of care in a tertiary center would be transferred.
As this study and others have shown, telemedicine is ripe for adoption by hospitalists. The bigger question is how should it fit into the current model of hospital medicine? There are several different applications we are familiar with and each has unique considerations. The first model, as applied in the Kuperman paper, is for a larger hospitalist program to provide a telehospitalist service to a smaller, unaffiliated hospital (for example, critical access hospitals) that employs nurse practitioners or physician assistants on site but can’t recruit or retain full-time hospitalist coverage. In this collaborative model of care, the local provider performs the physical exam but provides care under the guidance and supervision of a hospital medicine specialist. This is expected to improve outcomes and bring the benefits of hospital medicine, including improved outcomes and decreased hospital spending, to smaller communities.6 In this model, the critical access hospital pays a fee for the service and retains the billing to third party payers.
A variation on that model would provide telehospitalist services to other hospitals within an existing health care network (such as Kaiser Permanente, Intermountain Healthcare, government hospitals) that have different financial models with incentives to collaborate. The Veterans Health Administration is embarking on a pilot through the VA Office of Rural Health to provide a telehospitalist service to small rural VA hospitals using the consultative model during the day with a nurse practitioner at the local site and physician backup from the emergency department. Although existing night cross-coverage will be maintained by a physician on call, this telehospitalist service may also evolve into providing cross-coverage on nights and weekends.
A third would be like a locum tenens model in which telehospitalist services are contracted for short periods of time when coverage is needed for vacations or staff shortages. A fourth model of telehospitalist care would be to international areas in need of hospitalist expertise, like a medical mission model but without the expense or time required to travel. Other models will likely evolve based on the demand for services, supply of hospitalists, changes in regulations, and reimbursement.
Another important consideration is how this will evolve for the practicing hospitalist. Will we have dedicated virtual hospitalists, akin to the “nocturnist” who covers nights and weekends? Or will working on the telehospitalist service be in the rotation of duties like many programs have with teaching and “nonteaching” services, medical consultation, and even transition clinics and emergency department triage responsibilities? It could serve as a lower-intensity service that can be staffed during office-based time that would include scholarly work, quality improvement, and administrative duties. If financially viable, it could be mutually beneficial for both the provider and recipient sides of telehospitalist care.
For any of these models to work, technical aspects must be ironed-out. It is indispensable for the provider to have remote access to the electronic health record for data review, documentation, and placing orders if needed. Adequate broadband for effective video connection, accompanied by the appropriate HIPPA-compliant software and hardware must be in place. Although highly specialized hardware has been developed, including remote stethoscopes and otoscopes, the key component is a good camera and video screen on each end of the interaction. Based upon prior experience with telemedicine programs, establishment of trusting relationships with the receiving hospital staff, physicians, and nurse practitioners is also critical. Optimally, the telehospitalist would have an opportunity to travel to the remote site to meet with the local care team and learn about the local resources and community. Many other operational and logistical issues need to be considered and will be supported by the Society of Hospital Medicine through publications, online resources, and national and regional meeting educational content on telehospitalist programs.
As hospital medicine adopts the telehospitalist model, it brings with it important considerations. First, is how we embrace the concept of the medical virtualist, a term used to describe physicians who spend the majority or all of their time caring for patients using a virtual medium.7 We find it difficult to imagine spending all or the majority of our time as a virtual hospitalist, but years ago many could not imagine someone being a full-time hospitalist or nocturnist. Some individuals will see this as a career opportunity that allows them to work as a hospitalist regardless of where they live or where the hospital is located. That has obvious advantages for both career choice and the provision of hospital medicine expertise to low-resourced or low-volume settings, such as rural or international locations and nights and weekends.
Second, the telehospitalist model will require professional standards, training, reimbursement and coding adjustments, hardware and software development, and managing patient expectations for care.
Lastly, hospitals, health care systems, hospitalist groups, and even individual hospitalists will have to determine how best to take advantage of this innovative model of care to provide the highest possible quality, in a cost-efficient manner, that supports professional satisfaction and development.
Dr. Kaboli and Dr. Gutierrez are based at the Center for Access and Delivery Research and Evaluation (CADRE) at the Iowa City VA Healthcare System, the Veterans Rural Health Resource Center-Iowa City, VA Office of Rural Health, and the department of internal medicine, University of Iowa, both in Iowa City.
References
1. Barnett ML et al. Trends in telemedicine use in a large commercially insured population, 2005-2017. JAMA. 2018;320(20):2147-9.
2. American Telemedicine Association State Policy Resource Center. 2018; http://www.americantelemed.org/main/policy-page/state-policy-resource-center. Accessed 2018 Dec 14.
3. Interstate Medical Licensure Compact 2018; https://imlcc.org/. Accessed 2018 Dec 14.
4. Hengehold D. The telehospitalist. The Hospitalist. 2007;7(July). https://www.the-hospitalist.org/hospitalist/article/123381/telehospitalist. Accessed 2018 Dec 14.
5. Kuperman EF et al. The virtual hospitalist: A single-site implementation bringing hospitalist coverage to critical access hospitals. J Hosp Med. 2018;13(11):759-63.
6. Peterson MC. A systematic review of outcomes and quality measures in adult patients cared for by hospitalists vs nonhospitalists. Mayo Clinic proceedings. 2009;84(3):248-54.
7. Nochomovitz M, Sharma R. Is it time for a new medical specialty?: The medical virtualist. JAMA. 2018;319(5):437-8.
NP and PA Scope of Practice
Nurse practitioners (NPs) and physician assistants (PAs) provide healthcare in numerous environments internationally and in the United States.[1, 2] However, their role in the inpatient medicine setting is not well described.[2] In the United States, there are more than 157,000 NPs and 85,000 PAs with projected increases.[3, 4] Although both professions provide direct medical care, there are key differences.[1, 3, 4, 5] NPs typically complete a master's or doctoral degree with advanced clinical training beyond nursing. PAs complete at least 2 years of college courses similar to premedical school requirements. PA programs use a medical school‐based curriculum and train for about 2 years before awarding a master's degree. NPs are regulated through state nursing boards, whereas PAs are regulated through state licensing or medical boards. NPs and PAs have different, yet overlapping scopes of practice. A key difference is that PAs can only practice collaborating with a physician.[5, 6] Overall, both have been shown to provide healthcare that is similar in quality to physicians in specific primary care and surgical settings.[2]
NPs and PAs, often referred to as advanced practice providers (APPs), are employed primarily in outpatient clinic settings providing direct patient care. Most APP studies have focused on the outpatient setting, despite nearly a third of US healthcare expenditure for hospital care.[2, 7] Little is known about APP involvement, specific roles, or impact on outcomes in inpatient medicine settings where they are often referred to as NP or PA hospitalists.[2, 8, 9, 10]
The Veterans Health Administration (VHA) is 1 of the largest employers of APPs, with 3.6% of all NPs and 2.1% of all PAs reported to practice in the VHA.[11, 12, 13] As the largest fully integrated healthcare system in the US, the VHA had 8.8 million veterans enrolled and 703,500 inpatient admissions in 2012.[14] Although this makes the VHA an ideal environment to study the role of APPs, few studies have done so.[13, 15, 16, 17, 18, 19] Although studies have compared NPs and PAs to physicians, very little is known about how NPs differ from PAs when practicing in the same environment.
Our objective was to describe the scope of practice, defined as activities that an individual healthcare practitioner is licensed to perform, of NPs and PAs in the inpatient medicine setting and in the VHA. A secondary objective was to explore important outcomes that could potentially be affected by the presence of NPs and PAs on inpatient medicine.
METHODS
The Organizational Factors and Inpatient Medical Care Quality and Efficiency (OFIM) study provides a basis for this study with detail published elsewhere.[20] The OFIM study was conducted between 2010 and 2011 to evaluate quality of care in VHA inpatient medicine surveying chiefs of medicine (COM), inpatient medicine nurse managers (NM), attending physicians, and extant VHA survey data. The COM is the senior attending physician in charge of departments of medicine that include most medical subspecialties within the VHA medical centers. We used the subset of questions specific to NPs and PAs from the COM and NM surveys. Both COMs and NMs answered identical questions for NPs and PAs in 2 separate sections to avoid overlap of responses. NM survey responses were only used for the coordination of care regression model. Surveys were conducted by e‐mail with up to 4 reminders and a subsequent paper mailing. The inpatient medicine service included adult general internal medicine, medical subspecialties, and critical care. The study was approved by the institutional review boards of the VA Boston Healthcare System, the University of Iowa, and the Iowa City VA Healthcare System.
Measurements
To create our primary variable of interestNP and PA employmentwe used the COM survey. Respondents indicated the number and full‐time employee equivalent (FTEE) values for APPs on inpatient medicine. Based on responses, we created a categorical variable with 4 options: (1) facilities with NPs only, (2) facilities with PAs only, (3) facilities with both NPs and PAs, and (4) facilities with neither NPs nor PAs. We selected 3 outcomes that could potentially be affected by the presence of NPs and PAs on inpatient medicine: patient satisfaction, registered nurse (RN) satisfaction, and coordination of care. Patient satisfaction has been shown to improve with NPs and PAs in prior studies, and improving coordination of care has been a stated goal of medical centers in hiring NPs and PAs.[2, 9] Based on our personal experience and previous studies that have shown that nurses report better communication with NPs than physicians,[21] and that NPs retain a visible nursing component in their NP role,[22] we hypothesized that nurse satisfaction on inpatient medicine would improve with the presence of NPs and PAs.
Patient satisfaction was obtained from the 2010 VHA Survey of Healthcare Experiences of Patients (SHEP).[23] The average response rate was 45%. Approximately half the questions on the SHEP are identical to the Hospital Consumer Assessment of Healthcare Providers and Systems survey (HCAHPS).[24] We examined 2 items: an overall rating and willingness to recommend the facility. For the overall rating, patients rated their hospitalization on a scale from 0 (worst hospital possible) to 10 (best hospital possible). Following HCAHPS guidelines, responses of either 9 or 10 were coded as positive and all other nonmissing responses were coded 0. For willingness to recommend, patients were asked Would you recommend this hospital to your friends and family? using a 4‐point response scale. Responses of definitely and probably no were coded as 0, and probably and definitely yes were coded as 1.
Nurse satisfaction was obtained from the 2011 Veterans Administration Nursing Outcomes Database, an annual survey of VHA nurses that includes demographic, work environment and satisfaction data.[25] The survey, a modified version of the Practice Environment Scale,[26] had a response rate of 52.9% (out of 51,870). For this analysis, we selected only inpatient medicine RNs. We used 2 measures: overall job satisfaction and collegial RN/MD (physician) relations. The former was assessed using the item Compared to what you think it should be, what is your current overall level of satisfaction with your job? The RN/MD relations scale had 3 items, including Physicians and nurses have good working relationships. Both items were evaluated on a similar 5‐point response scale.
Coordination of care was assessed from COM and NM surveys. Overall coordination was evaluated from the COM survey using 1 of 8 items in a question about care coordination, In the past month, how would you rate the following aspects of coordination of patient care inpatient coordination overall. Overall coordination was also evaluated from the NM survey using a similar item. Discharge coordination was evaluated only from the NM survey using 1 of 8 items, Thinking about your experiences during the past month, how would you rate the following aspects of the coordination of patient care related to the discharge process on your inpatient medicine unit discharge coordination overall. When a service had more than 1 response from the NM survey, we took an average of responses to represent the mean score. Responses for all questions ranged from 1 for poor to 5 for excellent (for all of the questions see Supporting Information, Appendix 1, in the online version of this article).
Last, we modeled for several contextual features that could influence outcomes: geographic region as a 4‐item categorical variable; teaching affiliation as a dichotomous variable based on whether the hospital was a member of the Council of Teaching Hospitals, urban or rural status, and facility size as a continuous variable using the number of inpatient medicine service beds.
Statistical Analysis
Descriptive bivariate analyses used t tests, 2, or 2‐tailed Fisher tests when appropriate to compare NP and PA autonomy, tasks, location of care, work schedule, clinical workload, organizational characteristics (ie, academic, urban, facility complexity, inpatient medicine team structure), and performance evaluations.
Next, we examined whether any of the contextual characteristics were associated with use of NPs or PAs using inferential statistics. For patient satisfaction, we developed a hierarchical linear model (HLM) that nested patients within facilities. We controlled for patient age, sex, health status, and length of stay. For nurse satisfaction, individual responses of RNs also were analyzed using the HLM. We controlled for whether the nurse had a leadership position, worked during the daily shift, and job tenure. Ordinary least squares regression was used to examine the 3 measures of coordination from the COM and NM surveys. All analyses were performed using Stata version 12 (StataCorp, College Station, TX) and SAS version 9.2 (SAS Institute Inc., Cary, NC).
RESULTS
Of 123 inpatient medicine services that we surveyed, we included responses from the COMs of 118 services (response rate 95.2%); 5 responses were incomplete. Across 123 inpatient medicine services, we surveyed 264 nurse managers and received 198 responses (75.0%) from 114 inpatient medicine services. In the only model using NM responsesthe care coordination model104 inpatient medicine services had responses from both COM and NM surveys.
Of 118 VHA inpatient medicine services, 56 (47.5%) had APPs, of which 27 (48.2%) had NPs only, 15 (26.8%) had PAs only, and 14 (25.0%) had both NPs and PAs. FTEEs for NPs ranged from 0.5 to 7 (mean=2.22) and for PAs from 1 to 9 (mean=2.23) on the inpatient medicine service per hospital.
There were no significant differences on use of NPs and PAs by teaching affiliation, urban or rural setting, and geography. A significant difference was observed based on bed size (F[3,109]=5.13, P<0.001); facilities with both NPs and PAs had, on average, a larger number of inpatient beds (mean=79.0, standard deviation [SD]=32.3) compared to those without NPs or PAs (mean=50.1, SD=29.4) or with PAs only (mean=44.2, SD=20.5) using Tukey post hoc analysis.
The most common staffing model used staff (attending) physicians only working directly with APPs (N=29, 24.6%). Next most common was an academic model with staff physicians, housestaff, and APPs working together in teams (N=16, 13.4%). For performance evaluations, COMs contributed for both NPs (60.2%) and PAs (56.4%); in fewer cases, COMs completed evaluations of NPs (12.9%) and of PAs (29.0%) without input from other service managers (P=0.02).
Table 1 shows the differences reported by COMs between NPs and PAs scope of practice. Overall, 58.9% of NPs and 65.4% of PAs functioned somewhat or completely autonomously; 23.1% of NPs and 30.8% of PAs worked in a role closer to a ward assistant (eg, work directly with a physician, cowriting orders, and making care decisions with physician oversight). Tasks frequently performed by the majority of NPs and PAs included writing orders (87.9%), coordinating discharge plans (86.7%), communicating with consultants (83.1%), performing history and physicals (82.5%), writing daily progress notes (80.7%), communicating with primary care providers (73.5%), and working directly with hospitalists (72.8%). Less common tasks included serving on committees (46.4%), championing quality improvement activities (40.6%), and research (2.9%). There were no statistically significant differences between tasks, except for a higher proportion of services reporting PAs rather than NPs performing procedures (50.0% vs 22.0%, P=0.02) and teaching nonphysicians (50.0% vs 24.4%, P=0.04).
| Services With NPs, | Services With PAs, | P Value | |
|---|---|---|---|
| |||
| How do NPs and PAs function in conjunction with inpatient medicine staff (attending) physicians in the day‐to‐day care of patients (ie, scope of practice)? | N=39 (%)* | N=26 (%)* | |
| Autonomously, in a manner similar to physicians | 10 (25.6%) | 5 (19.2%) | 0.77 |
| Somewhat autonomously, but with limitations | 13 (33.3%) | 12 (46.2%) | 0.31 |
| In a role closer to a ward assistant | 9 (23.1%) | 8 (30.8%) | 0.57 |
| Administrative | 2 (5.1%) | 0 (0.0%) | 0.51 |
| Other | 6 (15.4%) | 1 (3.8%) | 0.23 |
| What types of tasks do NPs and PAs perform? | N=41 (%)* | N=28 (%)* | |
| Write orders | 34 (82.9%) | 26 (92.9%) | 0.29 |
| Coordinate discharge plans | 33 (80.5%) | 26 (92.9%) | 0.18 |
| Communicate with consultants | 33 (80.5%) | 24 (85.7%) | 0.75 |
| History and physicals | 31 (75.6%) | 25 (89.3%) | 0.22 |
| Daily progress notes | 31 (75.6%) | 24 (85.7%) | 0.37 |
| Communicate with primary care providers | 31 (75.6%) | 20 (71.4% | 0.78 |
| Work directly with hospitalists | 26 (63.4%) | 23 (82.1%) | 0.18 |
| Committees | 16 (39.0%) | 16 (57.1%) | 0.15 |
| Champion quality improvement activities | 14 (34.1%) | 14 (50.0%) | 0.22 |
| Teach nonphysician students | 10 (24.4%) | 14 (50.0%) | 0.04 |
| Perform procedures | 9 (22.0%) | 14 (50.0%) | 0.02 |
| Research | 1 (2.4%) | 1 (3.6%) | 1.00 |
| Other | 6 (14.6%) | 0 (0.0%) | 0.04 |
Table 2 reports location of practice in the hospital and workload. There were no significant differences in locations where NPs and PAs provided care. Overall, 81.9% of APPs worked in inpatient wards, 23.1% in step‐down units, 18.6% in intensive care units, 13.8% in skilled care units, and 4.9% in other locations. In addition, 97.4% of NPs and 89.3% of PAs worked weekdays, whereas only 7.9% of NPs and 17.9% of PAs worked nights. More PAs than NPs worked federal holidays (32.1% vs 7.9%, P=0.02) and weekends (32.1% vs 13.2%, P=0.08). Most NPs and PAs handled a caseload of 4 to 10 patients with a mean of 6.5, with no difference between the 2. The minority, 27.0% of NPs and 23.1% of PAs, were not assigned specific patients.
| Services With NPs | Services With PAs | P Value | |
|---|---|---|---|
| |||
| Where do NPs and PAs provide care? | N=38 (%)* | N=28 (%)* | |
| Wards | 31 (81.6%) | 23 (82.1%) | 1.00 |
| Step‐down unit | 8 (21.1%) | 7 (25.0%) | 0.77 |
| Intensive care unit | 6 (15.8%) | 6 (21.4%) | 0.75 |
| Skilled care units | 5 (13.2%) | 4 (14.3%) | 1.00 |
| Other | 1 (2.6%) | 2 (7.1%) | 0.57 |
| What are NPs and PAs tours of duty? | N=38 (%)* | N=28 (%)* | |
| Weekdays | 37 (97.4%) | 25 (89.3%) | 0.30 |
| Weekends | 5 (13.2%) | 9 (32.1%) | 0.08 |
| Nights | 3 (7.9%) | 5 (17.9%) | 0.27 |
| Federal holidays | 3 (7.9%) | 9 (32.1%) | 0.02 |
| Other | 2 (5.3%) | 1 (3.6%) | 1.00 |
| What is the average clinical workload for NPs and PAs? | N=37 (%)* | N=26 (%)* | |
| Mean no. of patients | 6.81 | 6.18 | 0.45 |
| N/A | 10 (27.0%) | 6 (23.1%) | 0.56 |
| Other | 1 (2.7%) | 0 (0.0%) | |
In multivariable adjusted analyses evaluating the association between patient satisfaction and use of APPs (Table 3), no significant differences were observed for patients' rating of the hospital (F[3,95]=0.19; P=0.90) or willingness to recommend the hospital (F[3,95]=0.54; P=0.65). Similarly, no significant differences were observed based on use of APPs for nurse overall job satisfaction (F[3,101]=1.85; P=0.14) or collegial relations with physicians (F[3,101]=0.96; P=0.41).
| Patient Satisfaction | Nurse Satisfaction | Coordination of Care | |||||
|---|---|---|---|---|---|---|---|
| Overall Rating | Willingness to Recommend | RN Overall Job Satisfaction | RN/MD Relations | Chief of Medicine: Inpatient Coordination | Nurse Manager: Inpatient Coordination | Nurse Manager: Discharge Coordination | |
| |||||||
| Intercept | 0.67 (0.14) | 10.20 (0.15) | 30.41 (0.13) | 20.89 (0.07) | 30.78 (0.26) | 30.67 (0.24) | 30.23 (0.26) |
| Facilities with NPs only | 0.06 (0.10) | 0.12 (0.09) | 0.14 (0.09) | 0.02 (0.05) | 10.63 (0.91) | 0.00 (0.19) | 0.42 (0.20)* |
| Facilities with PAs only | 0.06 (0.09) | 0.10 (0.11) | 0.10 (0.10) | 0.06 (0.05) | 10.08 (0.87) | 0.41 (0.22) | 0.36 (0.25) |
| Facilities with both NPs and PAs | 0.02 (0.12) | 0.11 (0.130 | 0.17 (0.11) | 0.00 (0.00) | 0.31 (0.92) | 0.03 (0.27) | 0.21 (0.30) |
| Facilities with neither NPs nor PAs | |||||||
COM ratings of overall inpatient coordination were also nonsignificant (F[3, 100]=2.01; P=0.12), but their ratings of coordination were higher in facilities with NPs only than in those without either NPs or PAs (=1.63, P=0.08). Nurse manager ratings of overall inpatient coordination were not associated with APP use (F[3,91]=1.24; P=0.30), but were marginally lower with facilities using only PAs (=1.48; P=0.06). Nurse manager ratings of discharge coordination showed a significant effect for APP use (F[3,90]=3.30; P=0.02) with facilities having NPs only significantly higher than places without either NPs or PAs (=1.84, P=0.04).
DISCUSSION
Little evidence exists regarding the role of APPs in the inpatient medicine setting,[2] and important deficit concerns in medical knowledge, technical skills, and clinical experience have been raised.[27, 28] These concerns have called into question the appropriateness of involving APPs in the care of medical inpatients with extensive differential diagnoses and complex care requirements.[27, 28] In spite of these concerns, we found widespread use of APPs with almost half of the VHA inpatient medicine services reporting use, which stands in contrast to prior research.[9, 10, 22, 29, 30, 31, 32, 33, 34, 35] APPs practice in a variety of acute and subacute inpatient medicine settings including academic, community, rural, and urban settings without many discernable differences. The spectrum of activities performed by APPs in the VHA is similar to those reported in these inpatient medicine studies, although their scope of practice appears to be much broader than in these few small single academic center studies.[10, 22, 29, 30, 31, 32, 33, 34, 35, 36] For example, only 11% of hospitalist PAs did procedures in a 2006 Society of Hospital Medicine survey, whereas 50% did in our study.[36]
Interestingly, we found that VHA NPs and PAs perform very similar tasks with similar caseloads despite differences in their background, training, regulation, reimbursement, and the longstanding observation that nurse practitioners are not physician assistants.[1, 3, 4, 5] These findings may reflect that APP scope can be more extensive in the VHA. For example, PAs in the VHA practice under federal jurisdiction and can bypass state legislation of scope of practice.[13] It also may reflect ongoing expansion of the role of APPs in the healthcare system since prior studies.[33, 36]
We did, however, note a few significant differences in NP and PA scope. PAs are twice as likely to perform procedures as NPs in inpatient medicine. It is unclear why PAs may do more procedures, as acute care NPs also are commonly taught and perform similar procedures.[33] We also found that PAs teach nonphysician students twice as often as NPs. This may reflect the deep commitment shown by the VHA to PA education dating back to the 1960s.[13] Finally, we found that PAs were significantly more likely to work weekends and federal holidays, a finding that may have implications for inpatient medicine services hiring APPs. Although not statistically significant, PAs, in general, performed more clinically oriented tasks like history and physicals and more often worked directly with hospitalists.
We found no difference in patient satisfaction or nurse satisfaction related to the presence of APPs, consistent with prior studies, where higher levels of satisfaction with APPs are observed in primary care but not hospital settings.[2, 10] However, it is surprising that no differences were observed for nurse satisfaction. NPs traditionally have a nursing focus, which might foster better relationships with nurses.[22] Expecting changes in either patient or nurse satisfaction with just the addition of APPs in the inpatient medicine setting without addressing other factors may be unrealistic. Patient satisfaction is a complex amalgam of various factors including patient expectations, sociodemographics, emotional and physical state, quality of care, and physician communication.[24] Similarly, nurse satisfaction depends on many factors including job stress, nursephysician collaboration, autonomy, staffing, and support.[37]
Finally, we found higher perception of both overall coordination of inpatient care and discharge coordination on services with NPs. A primary reason stated by medical centers to hire APPs is to improve continuity of care.[9] Prior research has shown better communication and collaboration between nurses, physicians, and NPs on inpatient medicine services.[21] NPs may feel that coordination of care is a major focus for their profession and may spend more time than physicians on care coordination activities.[38] Moreover, their background in both nursing and medicine may better lend itself to coordinating care between disciplines.[39] However, we were surprised to find that services with PAs had lower ratings of overall coordination by nurse managers given that care coordination also is a core competency of PA practice and a primary reason for medical centers to employ them.[9] The lack of a nursing background for PAs and potentially less overall medical experience than NPs possibly may contribute to this finding. However, our study does not suggest a direct explanation for this finding, and we had no measure of prior clinical experience, and thus it should be an area for further research.
There are a number of limitations to our study. First, findings from the VHA may not be generalizable to other healthcare systems.[39] However, VHA inpatient medicine services are, in general, structured similarly to non‐VHA settings and are often affiliated with academic medical centers. Further, this is the largest study to our knowledge to look at the specific roles and perceptions of care provided by both NPs and PAs in inpatient medicine. Second, we did not measure other outcomes of care that may be affected by the use of APPs, such as clinical outcomes, process of care measures, or cost‐effectiveness, some of which have been shown in small studies to be impacted by APPs in inpatient medicine.[10, 22, 29, 30, 31, 32, 33, 34, 35] Third, we are unable to attribute causality to our findings and may not have accounted for all the differences between services. Ideally, a randomized controlled trial of APPs in inpatient medicine would be helpful to address these concerns, but no such trials have been conducted. Finally, we did not survey APPs directly, but surveyed the chiefs of their service instead. The chiefs, however, are directly responsible for the scope of practice of all providers on their service and were directly involved in performance evaluations of most of these practitioners.
In conclusion, we found that NPs and PAs, functioning as APP hospitalists are more widely used and have a broader scope of practice on inpatient medicine than previously known or appreciated, at least in the VHA. In spite of their different backgrounds, training, regulations, and reimbursements, they appear to have a similar scope of practice with few differences in roles or perceived impact. Their impact on inpatient healthcare should be a subject of future research. In the meantime, inpatient medicine services should factor these findings into their decision making as they rapidly expand the use of APPs to provide better care to their patients and to address challenges in healthcare reform.[3, 27, 28, 40]
Acknowledgments
Disclosures: The work reported here was supported by the Department of Veterans Affairs, Veterans Health Administration, Health Services Research and Development Service (IIR 08067) and the Comprehensive Access & Delivery Research and Evaluation (CADRE) Center at the Iowa City VAMC (CIN 13412), and the Center for Healthcare Organization and Implementation Research (CHOIR) at the Boston VA Healthcare System (HFP 04145). The funders did not play any role in the design and conduct of the study; in the collection, analysis, and interpretation of data; and in preparation, review, and approval of the manuscript. The authors do not have any conflicts of interest or financial relationships related to the content of this manuscript. The authors had full access to and take full responsibility for the integrity of the data and the accuracy of the data analysis. The views expressed in this article are those of the authors and do not necessarily represent the views of the Department of Veterans Affairs.
- . Advanced nurse practitioners and physician assistants: what is the difference? Comparing the USA and UK. Hosp Med. 2001;62:169–171.
- , , , , , . The impact of nonphysician clinicians: do they improve the quality and cost‐effectiveness of health care services? Med Care Res Rev. 2009;66(6 suppl):36S–89S.
- . Will the NP workforce grow in the future? New forecasts and implications for healthcare delivery. Med Care. 2012;50(7):606–610.
- , , . The certified physician assistant iin the United States: a 2011 snapshot. JAAPA. 2012;25(4):58.
- , , . The use of nonphysician providers in adult intensive care units. Am J Respir Crit Care Med. 2012;185(6):600–605.
- American Academy of Physician Assistants. State law issues: supervision of PAs: access and excellence in patient care. October 2011. Available at: http://www.aapa.org/WorkArea/DownloadAsset.aspx?id=632. Accessed on June 22, 2014.
- Centers for Medicare 5(2):99–102.
- , , , . Physician assistant and nurse practitioner utilization in academic medical centers. Am J Med Qual. 2011;26(6):452–460.
- , , , et al. Implementation of a physician assistant/hospitalist service in an academic medical center: impact on efficiency and patient outcomes. J Hosp Med. 2008;3(5):361–368.
- American Academy of Physician Assistants. 2010 AAPA Physician Assistant Census. Alexandria, VA, 2011. Available at: http://www.aapa.org/WorkArea/DownloadAsset.aspx?id=838. Accessed on June 22, 2014.
- . 2009–2010 AANP national nurse practitioner sample survey: an overview. J Am Acad Nurse Pract. 2011;23(5):266–268.
- , . Physician assistants working in the Department of Veterans Affairs. JAAPA 2010;23(11):41–44.
- National Center for Veterans Analysis and Statistics. Selected Veterans Health Administration Characteristics: FY2002 to FY2012. 2013; http://www.va.gov/vetdata/docs/Utilization/VHAStats.xls. Accessed January 7, 2014.
- , , , . The physician assistant profession and military veterans. Mil Med. 2011;176(2):197–203.
- , , , . Veterans' perceptions of care by nurse practitioners, physician assistants, and physicians: a comparison from satisfaction surveys. J Am Acad Nurse Pract. 2010;22(3):170–176.
- , , , . Nurse practitioners as primary care providers within the VA. Mil Med. 2011;176(7):791–797.
- . Federally employed physician assistants. Mil Med. 2008;173(9):895–899.
- , , , , . Variations in nurse practitioner use in Veterans Affairs primary care practices. Health Serv Res. 2004;39(4 pt 1):887–904.
- , , , , . The association of hospital characteristics and quality improvement activities in inpatient medical services. J Gen Intern Med. 2014;29(5):715–722.
- , , , . Effect of a multidisciplinary intervention on communication and collaboration among physicians and nurses. Am J Crit Care. 2005;14(1):71–77.
- , , , , . Utilization‐focused evaluation of acute care nurse practitioner role. Outcomes Manag Nurs Pract. 1998;2(4):152–160; quiz 160–151.
- , , , , . Factors affecting the use of patient survey data for quality improvement in the Veterans Health Administration. BMC Health Serv Res. 2011;11:334.
- , , , . Patients' perception of hospital care in the United States. N Engl J Med. 2008;359(18):1921–1931.
- , , , et al. Nurse staffing and patient outcomes in Veterans Affairs hospitals. J Nurs Adm. 2005;35(10):459–466.
- . Development of the practice environment scale of the Nursing Work Index. Res Nurs Health. 2002;25(3):176–188.
- , , , . Broadening the scope of nursing practice. N Engl J Med. 2011;364(3):193–196.
- . Expanding the role of advanced nurse practitioners—risks and rewards. N Engl J Med. 2013;368(20):1935–1941.
- , , , et al. The effect of a multidisciplinary hospitalist/physician and advanced practice nurse collaboration on hospital costs. J Nurs Adm. 2006;36(2):79–85.
- , , , . Description of a nurse practitioner inpatient service in a public teaching hospital. J Gen Intern Med. 1993;8(1):29–30.
- , . Acute care nurse practitioners: creating and implementing a model of care for an inpatient general medical service. Am J Crit Care. 2002;11(5):448–458.
- , , , , . Improving resource utilization in a teaching hospital: development of a nonteaching service for chest pain admissions. Acad Med. 2006;81(5):432–435.
- , , , et al. Care activities and outcomes of patients cared for by acute care nurse practitioners, physician assistants, and resident physicians: a comparison. Am J Crit Care. 1998;7(4):267–281.
- , , , et al. Impact of localizing general medical teams to a single nursing unit. J Hosp Med. 2012;7(7):551–556.
- , , . Resource use by physician assistant services versus teaching services. JAAPA 2002;15(1):33–38, 40, 42.
- . Physician assistants in hospital medicine. In: Ballweg R, Sullivan EM, Brown D, Vetrosky D, eds. Physician Assistant: A Guide to Clinical Practice. 5th ed. Philadelphia, PA: W.B. Saunders; 2013:450–455.
- , , . Factors contributing to nurse job satisfaction in the acute hospital setting: a review of recent literature. J Nurs Manage. 2010;18(7):804–814.
- , , , , . Outcomes of care managed by an acute care nurse practitioner/attending physician team in a subacute medical intensive care unit. Am J Crit Care. 2005;14(2):121–130; quiz 131–132.
- , . The organizational and performance effects of nurse practitioner roles. J Adv Nurs. 2004;47(6):672–681.
- , , . Gaps in the supply of physicians, advance practice nurses, and physician assistants. J Am Coll Surg. 2011;212(6):991–999.
Nurse practitioners (NPs) and physician assistants (PAs) provide healthcare in numerous environments internationally and in the United States.[1, 2] However, their role in the inpatient medicine setting is not well described.[2] In the United States, there are more than 157,000 NPs and 85,000 PAs with projected increases.[3, 4] Although both professions provide direct medical care, there are key differences.[1, 3, 4, 5] NPs typically complete a master's or doctoral degree with advanced clinical training beyond nursing. PAs complete at least 2 years of college courses similar to premedical school requirements. PA programs use a medical school‐based curriculum and train for about 2 years before awarding a master's degree. NPs are regulated through state nursing boards, whereas PAs are regulated through state licensing or medical boards. NPs and PAs have different, yet overlapping scopes of practice. A key difference is that PAs can only practice collaborating with a physician.[5, 6] Overall, both have been shown to provide healthcare that is similar in quality to physicians in specific primary care and surgical settings.[2]
NPs and PAs, often referred to as advanced practice providers (APPs), are employed primarily in outpatient clinic settings providing direct patient care. Most APP studies have focused on the outpatient setting, despite nearly a third of US healthcare expenditure for hospital care.[2, 7] Little is known about APP involvement, specific roles, or impact on outcomes in inpatient medicine settings where they are often referred to as NP or PA hospitalists.[2, 8, 9, 10]
The Veterans Health Administration (VHA) is 1 of the largest employers of APPs, with 3.6% of all NPs and 2.1% of all PAs reported to practice in the VHA.[11, 12, 13] As the largest fully integrated healthcare system in the US, the VHA had 8.8 million veterans enrolled and 703,500 inpatient admissions in 2012.[14] Although this makes the VHA an ideal environment to study the role of APPs, few studies have done so.[13, 15, 16, 17, 18, 19] Although studies have compared NPs and PAs to physicians, very little is known about how NPs differ from PAs when practicing in the same environment.
Our objective was to describe the scope of practice, defined as activities that an individual healthcare practitioner is licensed to perform, of NPs and PAs in the inpatient medicine setting and in the VHA. A secondary objective was to explore important outcomes that could potentially be affected by the presence of NPs and PAs on inpatient medicine.
METHODS
The Organizational Factors and Inpatient Medical Care Quality and Efficiency (OFIM) study provides a basis for this study with detail published elsewhere.[20] The OFIM study was conducted between 2010 and 2011 to evaluate quality of care in VHA inpatient medicine surveying chiefs of medicine (COM), inpatient medicine nurse managers (NM), attending physicians, and extant VHA survey data. The COM is the senior attending physician in charge of departments of medicine that include most medical subspecialties within the VHA medical centers. We used the subset of questions specific to NPs and PAs from the COM and NM surveys. Both COMs and NMs answered identical questions for NPs and PAs in 2 separate sections to avoid overlap of responses. NM survey responses were only used for the coordination of care regression model. Surveys were conducted by e‐mail with up to 4 reminders and a subsequent paper mailing. The inpatient medicine service included adult general internal medicine, medical subspecialties, and critical care. The study was approved by the institutional review boards of the VA Boston Healthcare System, the University of Iowa, and the Iowa City VA Healthcare System.
Measurements
To create our primary variable of interestNP and PA employmentwe used the COM survey. Respondents indicated the number and full‐time employee equivalent (FTEE) values for APPs on inpatient medicine. Based on responses, we created a categorical variable with 4 options: (1) facilities with NPs only, (2) facilities with PAs only, (3) facilities with both NPs and PAs, and (4) facilities with neither NPs nor PAs. We selected 3 outcomes that could potentially be affected by the presence of NPs and PAs on inpatient medicine: patient satisfaction, registered nurse (RN) satisfaction, and coordination of care. Patient satisfaction has been shown to improve with NPs and PAs in prior studies, and improving coordination of care has been a stated goal of medical centers in hiring NPs and PAs.[2, 9] Based on our personal experience and previous studies that have shown that nurses report better communication with NPs than physicians,[21] and that NPs retain a visible nursing component in their NP role,[22] we hypothesized that nurse satisfaction on inpatient medicine would improve with the presence of NPs and PAs.
Patient satisfaction was obtained from the 2010 VHA Survey of Healthcare Experiences of Patients (SHEP).[23] The average response rate was 45%. Approximately half the questions on the SHEP are identical to the Hospital Consumer Assessment of Healthcare Providers and Systems survey (HCAHPS).[24] We examined 2 items: an overall rating and willingness to recommend the facility. For the overall rating, patients rated their hospitalization on a scale from 0 (worst hospital possible) to 10 (best hospital possible). Following HCAHPS guidelines, responses of either 9 or 10 were coded as positive and all other nonmissing responses were coded 0. For willingness to recommend, patients were asked Would you recommend this hospital to your friends and family? using a 4‐point response scale. Responses of definitely and probably no were coded as 0, and probably and definitely yes were coded as 1.
Nurse satisfaction was obtained from the 2011 Veterans Administration Nursing Outcomes Database, an annual survey of VHA nurses that includes demographic, work environment and satisfaction data.[25] The survey, a modified version of the Practice Environment Scale,[26] had a response rate of 52.9% (out of 51,870). For this analysis, we selected only inpatient medicine RNs. We used 2 measures: overall job satisfaction and collegial RN/MD (physician) relations. The former was assessed using the item Compared to what you think it should be, what is your current overall level of satisfaction with your job? The RN/MD relations scale had 3 items, including Physicians and nurses have good working relationships. Both items were evaluated on a similar 5‐point response scale.
Coordination of care was assessed from COM and NM surveys. Overall coordination was evaluated from the COM survey using 1 of 8 items in a question about care coordination, In the past month, how would you rate the following aspects of coordination of patient care inpatient coordination overall. Overall coordination was also evaluated from the NM survey using a similar item. Discharge coordination was evaluated only from the NM survey using 1 of 8 items, Thinking about your experiences during the past month, how would you rate the following aspects of the coordination of patient care related to the discharge process on your inpatient medicine unit discharge coordination overall. When a service had more than 1 response from the NM survey, we took an average of responses to represent the mean score. Responses for all questions ranged from 1 for poor to 5 for excellent (for all of the questions see Supporting Information, Appendix 1, in the online version of this article).
Last, we modeled for several contextual features that could influence outcomes: geographic region as a 4‐item categorical variable; teaching affiliation as a dichotomous variable based on whether the hospital was a member of the Council of Teaching Hospitals, urban or rural status, and facility size as a continuous variable using the number of inpatient medicine service beds.
Statistical Analysis
Descriptive bivariate analyses used t tests, 2, or 2‐tailed Fisher tests when appropriate to compare NP and PA autonomy, tasks, location of care, work schedule, clinical workload, organizational characteristics (ie, academic, urban, facility complexity, inpatient medicine team structure), and performance evaluations.
Next, we examined whether any of the contextual characteristics were associated with use of NPs or PAs using inferential statistics. For patient satisfaction, we developed a hierarchical linear model (HLM) that nested patients within facilities. We controlled for patient age, sex, health status, and length of stay. For nurse satisfaction, individual responses of RNs also were analyzed using the HLM. We controlled for whether the nurse had a leadership position, worked during the daily shift, and job tenure. Ordinary least squares regression was used to examine the 3 measures of coordination from the COM and NM surveys. All analyses were performed using Stata version 12 (StataCorp, College Station, TX) and SAS version 9.2 (SAS Institute Inc., Cary, NC).
RESULTS
Of 123 inpatient medicine services that we surveyed, we included responses from the COMs of 118 services (response rate 95.2%); 5 responses were incomplete. Across 123 inpatient medicine services, we surveyed 264 nurse managers and received 198 responses (75.0%) from 114 inpatient medicine services. In the only model using NM responsesthe care coordination model104 inpatient medicine services had responses from both COM and NM surveys.
Of 118 VHA inpatient medicine services, 56 (47.5%) had APPs, of which 27 (48.2%) had NPs only, 15 (26.8%) had PAs only, and 14 (25.0%) had both NPs and PAs. FTEEs for NPs ranged from 0.5 to 7 (mean=2.22) and for PAs from 1 to 9 (mean=2.23) on the inpatient medicine service per hospital.
There were no significant differences on use of NPs and PAs by teaching affiliation, urban or rural setting, and geography. A significant difference was observed based on bed size (F[3,109]=5.13, P<0.001); facilities with both NPs and PAs had, on average, a larger number of inpatient beds (mean=79.0, standard deviation [SD]=32.3) compared to those without NPs or PAs (mean=50.1, SD=29.4) or with PAs only (mean=44.2, SD=20.5) using Tukey post hoc analysis.
The most common staffing model used staff (attending) physicians only working directly with APPs (N=29, 24.6%). Next most common was an academic model with staff physicians, housestaff, and APPs working together in teams (N=16, 13.4%). For performance evaluations, COMs contributed for both NPs (60.2%) and PAs (56.4%); in fewer cases, COMs completed evaluations of NPs (12.9%) and of PAs (29.0%) without input from other service managers (P=0.02).
Table 1 shows the differences reported by COMs between NPs and PAs scope of practice. Overall, 58.9% of NPs and 65.4% of PAs functioned somewhat or completely autonomously; 23.1% of NPs and 30.8% of PAs worked in a role closer to a ward assistant (eg, work directly with a physician, cowriting orders, and making care decisions with physician oversight). Tasks frequently performed by the majority of NPs and PAs included writing orders (87.9%), coordinating discharge plans (86.7%), communicating with consultants (83.1%), performing history and physicals (82.5%), writing daily progress notes (80.7%), communicating with primary care providers (73.5%), and working directly with hospitalists (72.8%). Less common tasks included serving on committees (46.4%), championing quality improvement activities (40.6%), and research (2.9%). There were no statistically significant differences between tasks, except for a higher proportion of services reporting PAs rather than NPs performing procedures (50.0% vs 22.0%, P=0.02) and teaching nonphysicians (50.0% vs 24.4%, P=0.04).
| Services With NPs, | Services With PAs, | P Value | |
|---|---|---|---|
| |||
| How do NPs and PAs function in conjunction with inpatient medicine staff (attending) physicians in the day‐to‐day care of patients (ie, scope of practice)? | N=39 (%)* | N=26 (%)* | |
| Autonomously, in a manner similar to physicians | 10 (25.6%) | 5 (19.2%) | 0.77 |
| Somewhat autonomously, but with limitations | 13 (33.3%) | 12 (46.2%) | 0.31 |
| In a role closer to a ward assistant | 9 (23.1%) | 8 (30.8%) | 0.57 |
| Administrative | 2 (5.1%) | 0 (0.0%) | 0.51 |
| Other | 6 (15.4%) | 1 (3.8%) | 0.23 |
| What types of tasks do NPs and PAs perform? | N=41 (%)* | N=28 (%)* | |
| Write orders | 34 (82.9%) | 26 (92.9%) | 0.29 |
| Coordinate discharge plans | 33 (80.5%) | 26 (92.9%) | 0.18 |
| Communicate with consultants | 33 (80.5%) | 24 (85.7%) | 0.75 |
| History and physicals | 31 (75.6%) | 25 (89.3%) | 0.22 |
| Daily progress notes | 31 (75.6%) | 24 (85.7%) | 0.37 |
| Communicate with primary care providers | 31 (75.6%) | 20 (71.4% | 0.78 |
| Work directly with hospitalists | 26 (63.4%) | 23 (82.1%) | 0.18 |
| Committees | 16 (39.0%) | 16 (57.1%) | 0.15 |
| Champion quality improvement activities | 14 (34.1%) | 14 (50.0%) | 0.22 |
| Teach nonphysician students | 10 (24.4%) | 14 (50.0%) | 0.04 |
| Perform procedures | 9 (22.0%) | 14 (50.0%) | 0.02 |
| Research | 1 (2.4%) | 1 (3.6%) | 1.00 |
| Other | 6 (14.6%) | 0 (0.0%) | 0.04 |
Table 2 reports location of practice in the hospital and workload. There were no significant differences in locations where NPs and PAs provided care. Overall, 81.9% of APPs worked in inpatient wards, 23.1% in step‐down units, 18.6% in intensive care units, 13.8% in skilled care units, and 4.9% in other locations. In addition, 97.4% of NPs and 89.3% of PAs worked weekdays, whereas only 7.9% of NPs and 17.9% of PAs worked nights. More PAs than NPs worked federal holidays (32.1% vs 7.9%, P=0.02) and weekends (32.1% vs 13.2%, P=0.08). Most NPs and PAs handled a caseload of 4 to 10 patients with a mean of 6.5, with no difference between the 2. The minority, 27.0% of NPs and 23.1% of PAs, were not assigned specific patients.
| Services With NPs | Services With PAs | P Value | |
|---|---|---|---|
| |||
| Where do NPs and PAs provide care? | N=38 (%)* | N=28 (%)* | |
| Wards | 31 (81.6%) | 23 (82.1%) | 1.00 |
| Step‐down unit | 8 (21.1%) | 7 (25.0%) | 0.77 |
| Intensive care unit | 6 (15.8%) | 6 (21.4%) | 0.75 |
| Skilled care units | 5 (13.2%) | 4 (14.3%) | 1.00 |
| Other | 1 (2.6%) | 2 (7.1%) | 0.57 |
| What are NPs and PAs tours of duty? | N=38 (%)* | N=28 (%)* | |
| Weekdays | 37 (97.4%) | 25 (89.3%) | 0.30 |
| Weekends | 5 (13.2%) | 9 (32.1%) | 0.08 |
| Nights | 3 (7.9%) | 5 (17.9%) | 0.27 |
| Federal holidays | 3 (7.9%) | 9 (32.1%) | 0.02 |
| Other | 2 (5.3%) | 1 (3.6%) | 1.00 |
| What is the average clinical workload for NPs and PAs? | N=37 (%)* | N=26 (%)* | |
| Mean no. of patients | 6.81 | 6.18 | 0.45 |
| N/A | 10 (27.0%) | 6 (23.1%) | 0.56 |
| Other | 1 (2.7%) | 0 (0.0%) | |
In multivariable adjusted analyses evaluating the association between patient satisfaction and use of APPs (Table 3), no significant differences were observed for patients' rating of the hospital (F[3,95]=0.19; P=0.90) or willingness to recommend the hospital (F[3,95]=0.54; P=0.65). Similarly, no significant differences were observed based on use of APPs for nurse overall job satisfaction (F[3,101]=1.85; P=0.14) or collegial relations with physicians (F[3,101]=0.96; P=0.41).
| Patient Satisfaction | Nurse Satisfaction | Coordination of Care | |||||
|---|---|---|---|---|---|---|---|
| Overall Rating | Willingness to Recommend | RN Overall Job Satisfaction | RN/MD Relations | Chief of Medicine: Inpatient Coordination | Nurse Manager: Inpatient Coordination | Nurse Manager: Discharge Coordination | |
| |||||||
| Intercept | 0.67 (0.14) | 10.20 (0.15) | 30.41 (0.13) | 20.89 (0.07) | 30.78 (0.26) | 30.67 (0.24) | 30.23 (0.26) |
| Facilities with NPs only | 0.06 (0.10) | 0.12 (0.09) | 0.14 (0.09) | 0.02 (0.05) | 10.63 (0.91) | 0.00 (0.19) | 0.42 (0.20)* |
| Facilities with PAs only | 0.06 (0.09) | 0.10 (0.11) | 0.10 (0.10) | 0.06 (0.05) | 10.08 (0.87) | 0.41 (0.22) | 0.36 (0.25) |
| Facilities with both NPs and PAs | 0.02 (0.12) | 0.11 (0.130 | 0.17 (0.11) | 0.00 (0.00) | 0.31 (0.92) | 0.03 (0.27) | 0.21 (0.30) |
| Facilities with neither NPs nor PAs | |||||||
COM ratings of overall inpatient coordination were also nonsignificant (F[3, 100]=2.01; P=0.12), but their ratings of coordination were higher in facilities with NPs only than in those without either NPs or PAs (=1.63, P=0.08). Nurse manager ratings of overall inpatient coordination were not associated with APP use (F[3,91]=1.24; P=0.30), but were marginally lower with facilities using only PAs (=1.48; P=0.06). Nurse manager ratings of discharge coordination showed a significant effect for APP use (F[3,90]=3.30; P=0.02) with facilities having NPs only significantly higher than places without either NPs or PAs (=1.84, P=0.04).
DISCUSSION
Little evidence exists regarding the role of APPs in the inpatient medicine setting,[2] and important deficit concerns in medical knowledge, technical skills, and clinical experience have been raised.[27, 28] These concerns have called into question the appropriateness of involving APPs in the care of medical inpatients with extensive differential diagnoses and complex care requirements.[27, 28] In spite of these concerns, we found widespread use of APPs with almost half of the VHA inpatient medicine services reporting use, which stands in contrast to prior research.[9, 10, 22, 29, 30, 31, 32, 33, 34, 35] APPs practice in a variety of acute and subacute inpatient medicine settings including academic, community, rural, and urban settings without many discernable differences. The spectrum of activities performed by APPs in the VHA is similar to those reported in these inpatient medicine studies, although their scope of practice appears to be much broader than in these few small single academic center studies.[10, 22, 29, 30, 31, 32, 33, 34, 35, 36] For example, only 11% of hospitalist PAs did procedures in a 2006 Society of Hospital Medicine survey, whereas 50% did in our study.[36]
Interestingly, we found that VHA NPs and PAs perform very similar tasks with similar caseloads despite differences in their background, training, regulation, reimbursement, and the longstanding observation that nurse practitioners are not physician assistants.[1, 3, 4, 5] These findings may reflect that APP scope can be more extensive in the VHA. For example, PAs in the VHA practice under federal jurisdiction and can bypass state legislation of scope of practice.[13] It also may reflect ongoing expansion of the role of APPs in the healthcare system since prior studies.[33, 36]
We did, however, note a few significant differences in NP and PA scope. PAs are twice as likely to perform procedures as NPs in inpatient medicine. It is unclear why PAs may do more procedures, as acute care NPs also are commonly taught and perform similar procedures.[33] We also found that PAs teach nonphysician students twice as often as NPs. This may reflect the deep commitment shown by the VHA to PA education dating back to the 1960s.[13] Finally, we found that PAs were significantly more likely to work weekends and federal holidays, a finding that may have implications for inpatient medicine services hiring APPs. Although not statistically significant, PAs, in general, performed more clinically oriented tasks like history and physicals and more often worked directly with hospitalists.
We found no difference in patient satisfaction or nurse satisfaction related to the presence of APPs, consistent with prior studies, where higher levels of satisfaction with APPs are observed in primary care but not hospital settings.[2, 10] However, it is surprising that no differences were observed for nurse satisfaction. NPs traditionally have a nursing focus, which might foster better relationships with nurses.[22] Expecting changes in either patient or nurse satisfaction with just the addition of APPs in the inpatient medicine setting without addressing other factors may be unrealistic. Patient satisfaction is a complex amalgam of various factors including patient expectations, sociodemographics, emotional and physical state, quality of care, and physician communication.[24] Similarly, nurse satisfaction depends on many factors including job stress, nursephysician collaboration, autonomy, staffing, and support.[37]
Finally, we found higher perception of both overall coordination of inpatient care and discharge coordination on services with NPs. A primary reason stated by medical centers to hire APPs is to improve continuity of care.[9] Prior research has shown better communication and collaboration between nurses, physicians, and NPs on inpatient medicine services.[21] NPs may feel that coordination of care is a major focus for their profession and may spend more time than physicians on care coordination activities.[38] Moreover, their background in both nursing and medicine may better lend itself to coordinating care between disciplines.[39] However, we were surprised to find that services with PAs had lower ratings of overall coordination by nurse managers given that care coordination also is a core competency of PA practice and a primary reason for medical centers to employ them.[9] The lack of a nursing background for PAs and potentially less overall medical experience than NPs possibly may contribute to this finding. However, our study does not suggest a direct explanation for this finding, and we had no measure of prior clinical experience, and thus it should be an area for further research.
There are a number of limitations to our study. First, findings from the VHA may not be generalizable to other healthcare systems.[39] However, VHA inpatient medicine services are, in general, structured similarly to non‐VHA settings and are often affiliated with academic medical centers. Further, this is the largest study to our knowledge to look at the specific roles and perceptions of care provided by both NPs and PAs in inpatient medicine. Second, we did not measure other outcomes of care that may be affected by the use of APPs, such as clinical outcomes, process of care measures, or cost‐effectiveness, some of which have been shown in small studies to be impacted by APPs in inpatient medicine.[10, 22, 29, 30, 31, 32, 33, 34, 35] Third, we are unable to attribute causality to our findings and may not have accounted for all the differences between services. Ideally, a randomized controlled trial of APPs in inpatient medicine would be helpful to address these concerns, but no such trials have been conducted. Finally, we did not survey APPs directly, but surveyed the chiefs of their service instead. The chiefs, however, are directly responsible for the scope of practice of all providers on their service and were directly involved in performance evaluations of most of these practitioners.
In conclusion, we found that NPs and PAs, functioning as APP hospitalists are more widely used and have a broader scope of practice on inpatient medicine than previously known or appreciated, at least in the VHA. In spite of their different backgrounds, training, regulations, and reimbursements, they appear to have a similar scope of practice with few differences in roles or perceived impact. Their impact on inpatient healthcare should be a subject of future research. In the meantime, inpatient medicine services should factor these findings into their decision making as they rapidly expand the use of APPs to provide better care to their patients and to address challenges in healthcare reform.[3, 27, 28, 40]
Acknowledgments
Disclosures: The work reported here was supported by the Department of Veterans Affairs, Veterans Health Administration, Health Services Research and Development Service (IIR 08067) and the Comprehensive Access & Delivery Research and Evaluation (CADRE) Center at the Iowa City VAMC (CIN 13412), and the Center for Healthcare Organization and Implementation Research (CHOIR) at the Boston VA Healthcare System (HFP 04145). The funders did not play any role in the design and conduct of the study; in the collection, analysis, and interpretation of data; and in preparation, review, and approval of the manuscript. The authors do not have any conflicts of interest or financial relationships related to the content of this manuscript. The authors had full access to and take full responsibility for the integrity of the data and the accuracy of the data analysis. The views expressed in this article are those of the authors and do not necessarily represent the views of the Department of Veterans Affairs.
- . Advanced nurse practitioners and physician assistants: what is the difference? Comparing the USA and UK. Hosp Med. 2001;62:169–171.
- , , , , , . The impact of nonphysician clinicians: do they improve the quality and cost‐effectiveness of health care services? Med Care Res Rev. 2009;66(6 suppl):36S–89S.
- . Will the NP workforce grow in the future? New forecasts and implications for healthcare delivery. Med Care. 2012;50(7):606–610.
- , , . The certified physician assistant iin the United States: a 2011 snapshot. JAAPA. 2012;25(4):58.
- , , . The use of nonphysician providers in adult intensive care units. Am J Respir Crit Care Med. 2012;185(6):600–605.
- American Academy of Physician Assistants. State law issues: supervision of PAs: access and excellence in patient care. October 2011. Available at: http://www.aapa.org/WorkArea/DownloadAsset.aspx?id=632. Accessed on June 22, 2014.
- Centers for Medicare 5(2):99–102.
- , , , . Physician assistant and nurse practitioner utilization in academic medical centers. Am J Med Qual. 2011;26(6):452–460.
- , , , et al. Implementation of a physician assistant/hospitalist service in an academic medical center: impact on efficiency and patient outcomes. J Hosp Med. 2008;3(5):361–368.
- American Academy of Physician Assistants. 2010 AAPA Physician Assistant Census. Alexandria, VA, 2011. Available at: http://www.aapa.org/WorkArea/DownloadAsset.aspx?id=838. Accessed on June 22, 2014.
- . 2009–2010 AANP national nurse practitioner sample survey: an overview. J Am Acad Nurse Pract. 2011;23(5):266–268.
- , . Physician assistants working in the Department of Veterans Affairs. JAAPA 2010;23(11):41–44.
- National Center for Veterans Analysis and Statistics. Selected Veterans Health Administration Characteristics: FY2002 to FY2012. 2013; http://www.va.gov/vetdata/docs/Utilization/VHAStats.xls. Accessed January 7, 2014.
- , , , . The physician assistant profession and military veterans. Mil Med. 2011;176(2):197–203.
- , , , . Veterans' perceptions of care by nurse practitioners, physician assistants, and physicians: a comparison from satisfaction surveys. J Am Acad Nurse Pract. 2010;22(3):170–176.
- , , , . Nurse practitioners as primary care providers within the VA. Mil Med. 2011;176(7):791–797.
- . Federally employed physician assistants. Mil Med. 2008;173(9):895–899.
- , , , , . Variations in nurse practitioner use in Veterans Affairs primary care practices. Health Serv Res. 2004;39(4 pt 1):887–904.
- , , , , . The association of hospital characteristics and quality improvement activities in inpatient medical services. J Gen Intern Med. 2014;29(5):715–722.
- , , , . Effect of a multidisciplinary intervention on communication and collaboration among physicians and nurses. Am J Crit Care. 2005;14(1):71–77.
- , , , , . Utilization‐focused evaluation of acute care nurse practitioner role. Outcomes Manag Nurs Pract. 1998;2(4):152–160; quiz 160–151.
- , , , , . Factors affecting the use of patient survey data for quality improvement in the Veterans Health Administration. BMC Health Serv Res. 2011;11:334.
- , , , . Patients' perception of hospital care in the United States. N Engl J Med. 2008;359(18):1921–1931.
- , , , et al. Nurse staffing and patient outcomes in Veterans Affairs hospitals. J Nurs Adm. 2005;35(10):459–466.
- . Development of the practice environment scale of the Nursing Work Index. Res Nurs Health. 2002;25(3):176–188.
- , , , . Broadening the scope of nursing practice. N Engl J Med. 2011;364(3):193–196.
- . Expanding the role of advanced nurse practitioners—risks and rewards. N Engl J Med. 2013;368(20):1935–1941.
- , , , et al. The effect of a multidisciplinary hospitalist/physician and advanced practice nurse collaboration on hospital costs. J Nurs Adm. 2006;36(2):79–85.
- , , , . Description of a nurse practitioner inpatient service in a public teaching hospital. J Gen Intern Med. 1993;8(1):29–30.
- , . Acute care nurse practitioners: creating and implementing a model of care for an inpatient general medical service. Am J Crit Care. 2002;11(5):448–458.
- , , , , . Improving resource utilization in a teaching hospital: development of a nonteaching service for chest pain admissions. Acad Med. 2006;81(5):432–435.
- , , , et al. Care activities and outcomes of patients cared for by acute care nurse practitioners, physician assistants, and resident physicians: a comparison. Am J Crit Care. 1998;7(4):267–281.
- , , , et al. Impact of localizing general medical teams to a single nursing unit. J Hosp Med. 2012;7(7):551–556.
- , , . Resource use by physician assistant services versus teaching services. JAAPA 2002;15(1):33–38, 40, 42.
- . Physician assistants in hospital medicine. In: Ballweg R, Sullivan EM, Brown D, Vetrosky D, eds. Physician Assistant: A Guide to Clinical Practice. 5th ed. Philadelphia, PA: W.B. Saunders; 2013:450–455.
- , , . Factors contributing to nurse job satisfaction in the acute hospital setting: a review of recent literature. J Nurs Manage. 2010;18(7):804–814.
- , , , , . Outcomes of care managed by an acute care nurse practitioner/attending physician team in a subacute medical intensive care unit. Am J Crit Care. 2005;14(2):121–130; quiz 131–132.
- , . The organizational and performance effects of nurse practitioner roles. J Adv Nurs. 2004;47(6):672–681.
- , , . Gaps in the supply of physicians, advance practice nurses, and physician assistants. J Am Coll Surg. 2011;212(6):991–999.
© 2014 Society of Hospital Medicine
Refining Transitions of Care: A Quality Improvement Project to Improve the Timeliness of Discharge Documentation
Prior Opioid use Among Veterans
Recent trends show a marked increase in outpatient use of chronic opioid therapy (COT) for chronic noncancer pain (CNCP)[1, 2] without decreases in reported CNCP,[3] raising concerns about the efficacy and risk‐to‐benefit ratio of opioids in this population.[4, 5, 6, 7, 8] Increasing rates of outpatient use likely are accompanied by increasing rates of opioid exposure among patients admitted to the hospital. To our knowledge there are no published data regarding the prevalence of COT during the months preceding hospitalization.
Opioid use has been linked to increased emergency room utilization[9, 10] and emergency hospitalization,[11] but associations between opioid use and inpatient metrics (eg, mortality, readmission) have not been explored. Furthermore, lack of knowledge about the prevalence of opioid use prior to hospitalization may impede efforts to improve inpatient pain management and satisfaction with care. Although there is reason to expect that strategies to safely and effectively treat acute pain during the inpatient stay differ between opioid‐nave patients and opioid‐exposed patients, evidence regarding treatment strategies is limited.[12, 13, 14] Opioid pain medications are associated with hospital adverse events, with both prior opioid exposure and lack of opioid use as proposed risk factors.[15] A better understanding of the prevalence and characteristics of hospitalized COT patients is fundamental to future work to achieve safer and more effective inpatient pain management.
The primary purpose of this study was to determine the prevalence of prior COT among hospitalized medical patients. Additionally, we aimed to characterize inpatients with occasional and chronic opioid therapy prior to admission in comparison to opioid‐nave inpatients, as differences between these groups may suggest directions for further investigation into the distinct needs or challenges of hospitalized opioid‐exposed patients.
METHODS
We used inpatient and outpatient administrative data from the Department of Veterans Affairs (VA) Healthcare System. The primary data source to identify acute medical admissions was the VA Patient Treatment File, a national administrative database of all inpatient admissions, including patient demographic characteristics, primary and secondary diagnoses (using International Classification of Diseases, 9th Revision, Clinical Modification [ICD‐9‐CM], codes), and hospitalization characteristics. Outpatient pharmacy data were from the VA Pharmacy Prescription Data Files. The VA Vital Status Files provided dates of death.
We identified all first acute medical admissions to 129 VA hospitals during fiscal years (FYs) 2009 to 2011 (October 2009September 2011). We defined first admissions as the initial medical hospitalization occurring following a minimum 365‐day hospitalization‐free period. Patients were required to demonstrate pharmacy use by receipt of any outpatient medication from the VA on 2 separate occasions within 270 days preceding the first admission, to avoid misclassification of patients who routinely obtained medications only from a non‐VA provider. Patients admitted from extended care facilities were excluded.
We grouped patients by opioid‐use status based on outpatient prescription records: (1) no opioid use, defined as no opioid prescriptions in the 6 months prior to hospitalization; (2) occasional opioid use, defined as patients who received any opioid prescription during the 6 months prior but did not meet definition of chronic use; and (3) chronic opioid therapy, defined as 90 or more days' supply of opioids received within 6 months preceding hospitalization. We did not specify continuous prescribing. Opioids included in the definition were codeine, dihydrocodeine, fentanyl (mucosal and topical), hydrocodone, hydromorphone, meperidine, methadone, morphine, oxycodone, oxymorphone, pentazocine, propoxyphene, tapentadol, and tramadol.[16, 17]
We compared groups by demographic variables including age, sex, race, income, rural vs urban residence (determined from Rural‐Urban Commuting Area codes), region based on hospital location; overall comorbidity using the Charlson Comorbidity Index (CCI);[18] and 10 selected conditions to characterize comorbidity (see Supporting Information, Appendix A, in the online version of this article). These 10 conditions were chosen based on probable associations with chronic opioid use or high prevalence among hospitalized veterans.[9, 19, 20]
We used a CNCP definition based on ICD‐9‐CM codes.[9] This definition did not include episodic conditions such as migraine[2] or a measure of pain intensity.[21] All conditions were determined from diagnoses coded during any encounter in the year prior to hospitalization, exclusive of the first (ie, index) admission. We also determined the frequency of palliative care use, defined as presence of ICD‐9‐CM code V667 during index hospitalization or within the past year. Patients with palliative care use (n=3070) were excluded from further analyses.
We compared opioid use groups by baseline characteristics using the [2] statistic to determine if the distribution was nonrandom. We used analysis of variance to compare hospital length of stay between groups. We used the [2] statistic to compare rates of 4 outcomes of interest: intensive care unit (ICU) admission during the index hospitalization, discharge disposition other than home, 30‐day readmission rate, and in‐hospital or 30‐day mortality.
To assess the association between opioid‐use status and the 4 outcomes of interest, we constructed 2 multivariable regression models; the first was adjusted only for admission diagnosis using the Clinical Classification Software (CCS),[22] and the second was adjusted for demographics, CCI, and the 10 selected comorbidities in addition to admission diagnosis.
The authors had full access to and take full responsibility for the integrity of the data. All analyses were conducted using SAS statistical software version 9.2 (SAS Institute, Cary, NC). The study was approved by the University of Iowa institutional review board and the Iowa City VA Health Care System Research and Development Committee.
RESULTS
Patient Demographics
Demographic characteristics of patients differed by opioid‐use group (Table 1). Hospitalized patients who received COT in the 6 months prior to admission tended to be younger than their comparators, more often female, white, have a rural residence, and live in the South or West.
| Variables | No Opioids, n=66,899 (54.5%) | Occasional Opioids, n=24,093 (19.6%) | Chronic Opioids, n=31,802 (25.9%) |
|---|---|---|---|
| |||
| Age, y, mean (SD) | 68.7 (12.8) | 66.5 (12.7) | 64.5 (11.5) |
| Age, n (%) | |||
| 59 (reference) | 15,170 (22.7) | 6,703 (27.8) | 10,334 (32.5) |
| 6065 | 15,076 (22.5) | 5,973 (24.8) | 8,983 (28.3) |
| 6677 | 17,226 (25.8) | 5,871 (24.4) | 7,453 (23.4) |
| 78 | 19,427 (29.0) | 5,546 (23.0) | 5,032 (15.8) |
| Male, n (%) | 64,673 (96.7) | 22,964 (95.3) | 30,200 (95.0) |
| Race, n (%) | |||
| White | 48,888 (73.1) | 17,358 (72.1) | 25,087 (78.9) |
| Black | 14,480 (21.6) | 5,553 (23.1) | 5,089 (16.0) |
| Other | 1,172 (1.8) | 450 (1.9) | 645 (2.0) |
| Unknown | 2,359 (3.5) | 732 (3.0) | 981 (3.1) |
| Income $20,000, n (%) | 40,414 (60.4) | 14,105 (58.5) | 18,945 (59.6) |
| Rural residence, n (%) | 16,697 (25.0) | 6,277 (26.1) | 9,356 (29.4) |
| Region, n (%) | |||
| Northeast | 15,053 (22.5) | 4,437 (18.4) | 5,231 (16.5) |
| South | 24,083 (36.0) | 9,390 (39.0) | 12,720 (40.0) |
| Midwest | 16,000 (23.9) | 5,714 (23.7) | 7,762 (24.4) |
| West | 11,763 (17.6) | 4,552 (18.9) | 6,089 (19.2) |
| Charlson Comorbidity Index, mean (SD) | 2.3 (2.0) | 2.6 (2.3) | 2.7 (2.3) |
| Comorbidities, n (%) | |||
| Cancer (not metastatic) | 11,818 (17.7) | 5,549 (23.0) | 6,874 (21.6) |
| Metastatic cancer | 866 (1.3) | 733 (3.0) | 1,104 (3.5) |
| Chronic pain | 25,748 (38.5) | 14,811 (61.5) | 23,894 (75.1) |
| COPD | 20,750 (31.0) | 7,876 (32.7) | 12,117 (38.1) |
| Diabetes, complicated | 10,917 (16.3) | 4,620 (19.2) | 6,304 (19.8) |
| Heart failure | 14,267 (21.3) | 5,035 (20.9) | 6,501 (20.4) |
| Renal disease | 11,311 (16.9) | 4,586 (19.0) | 4,981 (15.7) |
| Dementia | 2,180 (3.3) | 459 (1.9) | 453 (1.4) |
| Mental health other than PTSD | 33,390 (49.9) | 13,657 (56.7) | 20,726 (65.2) |
| PTSD | 7,216 (10.8) | 3,607 (15.0) | 5,938 (18.7) |
| Palliative care use, n (%) | 1,407 (2.1) | 639 (2.7) | 1,024 (3.2) |
Prevalence of Opioid Use
Among the cohort (N=122,794) of hospitalized veterans, 66,899 (54.5%) received no opioids from the VA during the 6‐month period prior to hospitalization; 31,802 (25.9%) received COT in the 6 months prior to admission. An additional 24,093 (19.6%) had occasional opioid therapy (Table 1). A total of 257,623 opioid prescriptions were provided to patients in the 6‐month period prior to their index hospitalization. Of these, 100,379 (39.0%) were for hydrocodone, 48,584 (18.9%) for oxycodone, 36,658 (14.2%) for tramadol, and 35,471 (13.8%) for morphine. These 4 medications accounted for 85.8% of total opioid prescriptions (see Supporting Information, Appendix B, in the online version of this article).
Among the COT group, 3610 (11.4%) received opioids 90 days, 10,110 (31.8%) received opioids between 91 and 179 days, and 18,082 (56.9%) patients received opioids 180 days in the prior 6 months (see Supporting Information, Appendix C, in the online version of this article).
Among the subset of patients with cancer (metastatic and nonmetastatic, n=26,944), 29.6% were prescribed COT, and 23.3% had occasional opioid use. Among the subset of patients with CNCP (n=64,453), 37.1% were prescribed COT, and 23.0% had occasional opioid use.
Comorbid Conditions
Compared to patients not receiving opioids, a larger proportion of patients receiving both occasional and chronic opioids had diagnoses of cancer and of CNCP. Diagnoses more common in COT patients included chronic obstructive pulmonary disease (COPD), complicated diabetes, post‐traumatic stress disorder (PTSD), and other mental health disorders. In contrast, COT patients were less likely than no‐opioid and occasional opioid patients to have heart failure (HF), renal disease, and dementia. Palliative care was used by 2.1% of patients in the no‐opioid group, and 3.2% of patients in the COT group (Table 1). Renal disease was most common among the occasional‐use group.
Unadjusted Hospitalization Outcomes
Unadjusted hospitalization outcomes differed between opioid‐exposure groups (Table 2). Patients receiving occasional or chronic opioids had shorter length of stay and lower rates of non‐home discharge than did patients without any opioid use. The rate of death during hospitalization or within 30 days did not differ between groups. The occasional‐use and COT groups had higher 30‐day readmission rates than did the no‐use group.
| No Opioids, n=65,492 | Occasional Opioids, n=23,454 | Chronic Opioids, n=30,778 | P | |
|---|---|---|---|---|
| ||||
| Hospital length of stay, d, mean (SD) | 4.7 (5.1) | 4.5 (4.8) | 4.5 (4.8) | 0.0003 |
| ICU stay, n (%) | 10,281 (15.7) | 3,299 (14.1) | 4,570 (14.9) | <0.0001 |
| Non‐home discharge, n (%) | 2,944 (4.5) | 997 (4.3) | 1,233 (4.0) | 0.0020 |
| 30‐day readmission, n (%) | 9,023 (13.8) | 3,629 (15.5) | 4,773 (15.5) | <0.0001 |
| Death during hospitalization or within 30 days, n (%) | 2,532 (3.9) | 863 (3.7) | 1,191 (3.9) | 0.4057 |
Multivariable Models
In the fully adjusted multivariable models, opioid exposure (in the form of either chronic or occasional use) had no significant association with ICU stay during index admission or non‐home discharge (Table 3). Both the occasional‐opioid use and COT groups were more likely to experience 30‐day hospital readmission, a relationship that remained consistent across the partially and fully adjusted models. The occasional‐opioid use group saw no increased mortality risk. In the model adjusted only for admission diagnosis, COT was not associated with increased mortality risk. When additionally adjusted for demographic variables, CCI, and selected comorbidities, however, COT was associated with increased risk of death during hospitalization or within 30 days (odds ratio: 1.19, 90% confidence interval: 1.10‐1.29).
| Occasional Opioid Use | Chronic Opioid Therapy | |||
|---|---|---|---|---|
| Model 1, OR (95% CI) | Model 2, OR (95% CI) | Model 1, OR (95% CI) | Model 2, OR (95% CI) | |
| ||||
| ICU stay | 0.94 (0.90‐0.99) | 0.95 (0.91‐1.00) | 1.00 (0.96‐1.04) | 1.01 (0.97‐1.05) |
| Non‐home discharge | 0.92 (0.85‐0.99) | 0.97 (0.90‐1.05) | 0.85 (0.80‐0.92) | 0.95 (0.88‐1.03) |
| 30‐day readmission | 1.14 (1.09‐1.19) | 1.14 (1.09‐1.19) | 1.14 (1.10‐1.19) | 1.15 (1.10‐1.20) |
| Death during hospitalization or within 30 days | 0.96 (0.88‐1.04) | 1.04 (0.95‐1.13) | 0.96 (0.90‐1.04) | 1.19 (1.10‐1.29) |
DISCUSSION
This observational study is, to our knowledge, the first to report prevalence of and characteristics associated with prior opioid use among hospitalized medical patients. The prevalence of any opioid use and of COT was substantially higher in this hospitalized cohort than reported in outpatient settings. The prevalence of any opioid use during 1 year (FY 2009) among all veterans with VA primary care use was 26.1%.[23] A study of incident prescribing rates among veterans with new diagnoses of noncancer‐related pain demonstrated 11% received an opioid prescription within 1 year.[24] Using a definition of 90 consecutive prescription days to define COT, Dobscha et al.[25] found that 5% of veterans with persistent elevated pain intensity and no previous opioid prescriptions subsequently received COT within 12 months. The high prevalence we found likely reflects cumulative effects of incident use as well as an increased symptom burden in a population defined by need for medical hospitalization.
Although a veteran population may not be generalizable to a nonveteran setting, we do note prior studies reporting prevalence of any opioid use in outpatient cohorts (in 2000 and 2005) of between 18% and 30%, with higher rates among women and patients over 65 years of age.[1, 2]
Our work was purposefully inclusive of cancer patients so that we might assess the degree to which cancer diagnoses accounted for prior opioid use in hospitalized patients. Surprisingly, the rate of COT for patients with cancer was lower than that for patients with CNCP, perhaps reflecting that a cancer condition defined in administrative data may not constitute a pain‐causing disease.
Recognition of the prevalence of opioid therapy is important as we work to understand and improve safety, satisfaction, utilization, and long‐term health outcomes associated with hospitalization. Our finding that over half of medical inpatients have preexisting CNCP diagnoses, and a not entirely overlapping proportion has prior opioid exposure, implies a need for future work to refine expectations and strategies for inpatient management, potentially tailored to prior opioid use and presence of CNCP.
A recent Joint Commission sentinel event alert[26] highlights opioid adverse events in the hospital and identifies both lack of previous opioid therapy and prior opioid therapy as factors increasing risk. ICU admission during the hospital stay may reflect adverse events such as opioid‐induced respiratory depression; in our study, patients with no opioid use prior to admission were more likely to have an ICU stay, although the effect was small. One might speculate that clinicians, accustomed to treating pain in opioid‐exposed patients, are using inappropriately large starting dosages of narcotics for inpatients without first assessing prior opioid exposure. Another possible explanation is that patients on COT are admitted to the hospital with less severe illness, potentially reflecting functional, social, or access limitations that compromise ability to manage illness in the outpatient setting. More detailed comparison of illness severity is beyond the scope of the present work.
Patient satisfaction with pain management is reflected in 2 of the Hospital Consumer Assessment of Healthcare Providers and Systems (HCAHPS) questions, and is publically reported.[27] HCAHPS results also figure in the formula for the Centers for Medicare and Medicaid Services value‐based purchasing.[28] Preadmission pain is predictive of postoperative pain[29, 30] and may shape patient expectations; how preadmission opioid use modulates nonsurgical pain and satisfaction with management in the medical inpatient remains to be studied. The high prevalence of prior COT underscores the importance of understanding characteristics of patients on COT, and potential differences and disparities in pain management, when designing interventions to augment patient satisfaction with pain management.
Although the age distribution and patterns of comorbidities differed between the opioid‐use groups, opioid therapy remained a small but significant predictor of hospital readmission; this association was independent of CNCP diagnosis. Functional outcomes are recognized as important measures of efficacy of outpatient pain management strategies,[31] with some evidence that opioids are associated with worse functioning.[32, 33] Functional limitations, as well as inadequately or inappropriately treated pain, may drive both admissions and readmissions. Alternately, COT may be a marker for unmeasured factors that increase a patient's risk of returning to the hospital. Further work is needed to elucidate the relationship between COT and healthcare utilization associated with the inpatient stay.
Our finding that patients on COT have an increased mortality risk is concerning, given the rapid expansion in use of these medications. Although pain is increasingly prevalent toward end of life,[34] we did not observe an association between either CNCP (data not shown) or occasional opioid use and mortality. COT may complicate chronic disease through adverse drug effects including respiratory depression, apnea, or endocrine or immune alteration. Complex chronically ill patients with conditions such as COPD, HF, or diabetes may be particularly susceptible to these effects. Incident use of morphine is associated with increased mortality in acute coronary syndrome and HF[35, 36]: we are not aware of any work describing the relationship between prior opioid use and incident use during hospitalization in medical patients.
Limitations
Our work focuses on hospitalized veterans, a population that remains predominately male, limiting generalizability of the findings. Rates of mental health diagnoses and PTSD, associated with CNCP and COT,[24, 37] are higher in this population than would be expected in a general hospitalized population. Because our outcomes included readmission, and our definition of opioid exposure was designed to reflect outpatient prescribing, we included only patients without recent hospitalization. Therefore, our results may not be generalizable to patients with frequent and recurring hospitalization.
Our definition of opioid exposure depended on pharmacy dispensing records; we are not able to confirm if veterans were taking the medications as prescribed. Further, we were not able to capture data on opioids prescribed by non‐VA providers, which may have led to underestimation of prevalence.
Our definitions of COT and CNCP are imperfect, and should be noted when comparing to other studies. Because we did not specify continuous 90‐day prescribing, we may have misclassified occasional opioid therapy as COT in comparison to other authors. That continuous prescribing is equivalent to continuous use assumes that patients take medications exactly as prescribed. We used occasional opioid therapy as a comparison group, and detailed the distribution of days prescribed among the COT group (see Supporting Information, Appendix C, in the online version of this article), to augment interpretability of these results. Our CNCP diagnosis was less inclusive than others,[2] as we omitted episodic pain (eg, migraine and sprains) and human immunodeficiency virus‐related pain. As COT for CNCP conditions lacks a robust evidence base,[38] defining pain diagnoses using administrative data to reflect conditions for which COT is used in a guideline‐concordant way remains difficult.
Last, differences observed between opioid‐use groups may be due to an unmeasured confounder not captured by the variables we included. Specifically, we did not include other long‐term outpatient medications in our models. It is possible that COT is part of a larger context of inappropriate prescribing, rather than a single‐medication effect on outcomes studied.
CONCLUSION
Nearly 1 in 4 hospitalized veterans has current or recent COT at the time of hospital admission for nonsurgical conditions; nearly half have been prescribed any opioids. Practitioners designing interventions to improve pain management in the inpatient setting should account for prior opioid use. Patients who are on COT prior to hospitalization differ in age and comorbidities from their counterparts who are not on COT. Further elucidation of differences between opioid‐use groups may help providers address care needs during the transition to posthospitalization care. CNCP diagnoses and chronic opioid exposure are different entities and cannot serve as proxies in administrative data. Additional work on utilization and outcomes in specific patient populations may improve our understanding of the long‐term health effects of chronic opioid therapy.
Disclosures: Dr. Mosher is supported by the Veterans Administration (VA) Quality Scholars Fellowship, Office of Academic Affiliations, Department of Veterans Affairs. Dr. Cram is supported by a K24 award from NIAMS (AR062133) at the National Institutes of Health. The preliminary results of this article were presented at the Society of General Internal Medicine Annual Meeting in Denver, Colordao, April 2013. The views expressed in this article are those of the authors and do not necessarily represent the views of the Department of Veterans Affairs. Data are available to researchers with VA accreditation, the statistical code and the protocol are available to interested readers by contacting Dr. Mosher. The authors report no conflict of interest in regard to this study.
- , , , et al. Age and gender trends in long‐term opioid analgesic use for noncancer pain. Am J Public Health. 2010;100:2541–2547.
- , , , , , . Trends in use of opioids for non‐cancer pain conditions 2000–2005 in commercial and Medicaid insurance plans: the TROUP study. Pain. 2008;138:440–449.
- Institute of Medicine (US) Committee on Advancing Pain Research, Care, and Education. Relieving pain in America: a blueprint for transforming prevention, care, education, and research. Washington, DC: National Academies Press; 2011.
- , , , . Long‐term opioid therapy reconsidered. Ann Intern Med. 2011;155:325–328.
- , . What are we treating with long‐term opioid therapy? Arch Intern Med. 2012;172:433–434.
- , , , . Opioids for chronic noncancer pain: a meta‐analysis of effectiveness and side effects. CMAJ. 2006;174:1589–1594.
- , , , . Opioids in chronic non‐cancer pain: systematic review of efficacy and safety. Pain. 2004;112:372–380.
- , , , et al. A systematic review of randomized trials of long‐term opioid management for chronic non‐cancer pain. Pain Physician. 2011;14:91–121.
- , , , , , . Rates of adverse events of long‐acting opioids in a state Medicaid program. Ann Pharmacother. 2007;41:921–928.
- , , , et al. Emergency department visits among recipients of chronic opioid therapy. Arch Intern Med. 2010;170:1425–1432.
- , , , . Emergency hospitalizations for adverse drug events in older Americans. N Engl J Med. 2011;365:2002–2012.
- , . Assessment and management of acute pain in adult medical inpatients: a systematic review. Pain Med. 2009;10:1183–1199.
- , , , . Acute pain management in opioid‐tolerant patients: a growing challenge. Anaesth Intensive Care. 2011;39:804–823.
- , , , . Acute pain management of the chronic pain patient on opiates: a survey of caregivers at University of Washington Medical Center. Clin J Pain. 1994;10:133–138.
- The Joint Commission and the FDA take steps to curb adverse events related to the use and misuse of opioid drugs. ED Manag. 2012;24:112–116.
- , . Tramadol. CMAJ. 2013;185:E352.
- , , , , . Prescription opioid abuse in the United Kingdom. Br J Clin Pharmacol. 2013;76:823–824.
- , , , . Validation of a combined comorbidity index. J Clin Epidemiol. 1994;47:1245–1251.
- , , , , . Bringing the war back home: mental health disorders among 103,788 US veterans returning from Iraq and Afghanistan seen at Department of Veterans Affairs facilities. Arch Intern Med. 2007;167:476–482.
- , , , et al. Coding algorithms for defining comorbidities in ICD‐9‐CM and ICD‐10 administrative data. Med Care. 2005;43:1130–1139.
- , , , , , . Sex Differences in the medical care of VA patients with chronic non‐cancer pain [published online ahead of print June 26, 2013]. Pain Med. doi: 10.1111/pme.12177.
- Agency for Healthcare Research and Quality. Clinical Classifications Software (CCS) for ICD‐9‐CM. Available at: http://www.hcup‐us.ahrq.gov/toolssoftware/ccs/ccs.jsp. Accessed October 17, 2013.
- , , , et al. Predicting risk of hospitalization or death among patients receiving primary care in the Veterans Health Administration. Med Care. 2013;51:368–373.
- , , , et al. Association of mental health disorders with prescription opioids and high‐risk opioid use in US veterans of Iraq and Afghanistan. JAMA. 2012;307:940–947.
- , , , , . Correlates of prescription opioid initiation and long‐term opioid use in veterans with persistent pain. Clin J Pain. 2013;29:102–108.
- Safe use of opioids in hospitals. Sentinel Event Alert. 2012;49:1–5.
- Centers for Medicare (2):2–9.
- , , , , , . The risk of severe postoperative pain: modification and validation of a clinical prediction rule. Anesth Analg. 2008;107:1330–1339.
- , , , et al. Preoperative predictors of moderate to intense acute postoperative pain in patients undergoing abdominal surgery. Acta Anaesthesiol Scand. 2002;46:1265–1271.
- , , , , , . Successful and unsuccessful outcomes with long‐term opioid therapy: a survey of physicians' opinions. J Palliat Med. 2006;9:50–56.
- , , , . Opioid use among low back pain patients in primary care: is opioid prescription associated with disability at 6‐month follow‐up? Pain. 2013;154:1038–1044.
- , , , , ; Disability Risk Identification Study Cohort. Early opioid prescription and subsequent disability among workers with back injuries: the Disability Risk Identification Study Cohort. Spine (Phila Pa 1976). 2008;33:199–204.
- , , , et al. The epidemiology of pain during the last 2 years of life. Ann Intern Med. 2010;153:563–569.
- , , , et al. Association of intravenous morphine use and outcomes in acute coronary syndromes: results from the CRUSADE Quality Improvement Initiative. Am Heart J. 2005;149:1043–1049.
- , , , et al. Use of intravenous morphine for acute decompensated heart failure in patients with and without acute coronary syndromes. Acute Card Care. 2011;13:76–80.
- , , , et al. VA mental health services utilization in Iraq and Afghanistan veterans in the first year of receiving new mental health diagnoses. J Trauma Stress. 2010;23:5–16.
- , , , et al. Long‐term opioid management for chronic noncancer pain. Cochrane Database Syst Rev. 2010;(1):CD006605.
Recent trends show a marked increase in outpatient use of chronic opioid therapy (COT) for chronic noncancer pain (CNCP)[1, 2] without decreases in reported CNCP,[3] raising concerns about the efficacy and risk‐to‐benefit ratio of opioids in this population.[4, 5, 6, 7, 8] Increasing rates of outpatient use likely are accompanied by increasing rates of opioid exposure among patients admitted to the hospital. To our knowledge there are no published data regarding the prevalence of COT during the months preceding hospitalization.
Opioid use has been linked to increased emergency room utilization[9, 10] and emergency hospitalization,[11] but associations between opioid use and inpatient metrics (eg, mortality, readmission) have not been explored. Furthermore, lack of knowledge about the prevalence of opioid use prior to hospitalization may impede efforts to improve inpatient pain management and satisfaction with care. Although there is reason to expect that strategies to safely and effectively treat acute pain during the inpatient stay differ between opioid‐nave patients and opioid‐exposed patients, evidence regarding treatment strategies is limited.[12, 13, 14] Opioid pain medications are associated with hospital adverse events, with both prior opioid exposure and lack of opioid use as proposed risk factors.[15] A better understanding of the prevalence and characteristics of hospitalized COT patients is fundamental to future work to achieve safer and more effective inpatient pain management.
The primary purpose of this study was to determine the prevalence of prior COT among hospitalized medical patients. Additionally, we aimed to characterize inpatients with occasional and chronic opioid therapy prior to admission in comparison to opioid‐nave inpatients, as differences between these groups may suggest directions for further investigation into the distinct needs or challenges of hospitalized opioid‐exposed patients.
METHODS
We used inpatient and outpatient administrative data from the Department of Veterans Affairs (VA) Healthcare System. The primary data source to identify acute medical admissions was the VA Patient Treatment File, a national administrative database of all inpatient admissions, including patient demographic characteristics, primary and secondary diagnoses (using International Classification of Diseases, 9th Revision, Clinical Modification [ICD‐9‐CM], codes), and hospitalization characteristics. Outpatient pharmacy data were from the VA Pharmacy Prescription Data Files. The VA Vital Status Files provided dates of death.
We identified all first acute medical admissions to 129 VA hospitals during fiscal years (FYs) 2009 to 2011 (October 2009September 2011). We defined first admissions as the initial medical hospitalization occurring following a minimum 365‐day hospitalization‐free period. Patients were required to demonstrate pharmacy use by receipt of any outpatient medication from the VA on 2 separate occasions within 270 days preceding the first admission, to avoid misclassification of patients who routinely obtained medications only from a non‐VA provider. Patients admitted from extended care facilities were excluded.
We grouped patients by opioid‐use status based on outpatient prescription records: (1) no opioid use, defined as no opioid prescriptions in the 6 months prior to hospitalization; (2) occasional opioid use, defined as patients who received any opioid prescription during the 6 months prior but did not meet definition of chronic use; and (3) chronic opioid therapy, defined as 90 or more days' supply of opioids received within 6 months preceding hospitalization. We did not specify continuous prescribing. Opioids included in the definition were codeine, dihydrocodeine, fentanyl (mucosal and topical), hydrocodone, hydromorphone, meperidine, methadone, morphine, oxycodone, oxymorphone, pentazocine, propoxyphene, tapentadol, and tramadol.[16, 17]
We compared groups by demographic variables including age, sex, race, income, rural vs urban residence (determined from Rural‐Urban Commuting Area codes), region based on hospital location; overall comorbidity using the Charlson Comorbidity Index (CCI);[18] and 10 selected conditions to characterize comorbidity (see Supporting Information, Appendix A, in the online version of this article). These 10 conditions were chosen based on probable associations with chronic opioid use or high prevalence among hospitalized veterans.[9, 19, 20]
We used a CNCP definition based on ICD‐9‐CM codes.[9] This definition did not include episodic conditions such as migraine[2] or a measure of pain intensity.[21] All conditions were determined from diagnoses coded during any encounter in the year prior to hospitalization, exclusive of the first (ie, index) admission. We also determined the frequency of palliative care use, defined as presence of ICD‐9‐CM code V667 during index hospitalization or within the past year. Patients with palliative care use (n=3070) were excluded from further analyses.
We compared opioid use groups by baseline characteristics using the [2] statistic to determine if the distribution was nonrandom. We used analysis of variance to compare hospital length of stay between groups. We used the [2] statistic to compare rates of 4 outcomes of interest: intensive care unit (ICU) admission during the index hospitalization, discharge disposition other than home, 30‐day readmission rate, and in‐hospital or 30‐day mortality.
To assess the association between opioid‐use status and the 4 outcomes of interest, we constructed 2 multivariable regression models; the first was adjusted only for admission diagnosis using the Clinical Classification Software (CCS),[22] and the second was adjusted for demographics, CCI, and the 10 selected comorbidities in addition to admission diagnosis.
The authors had full access to and take full responsibility for the integrity of the data. All analyses were conducted using SAS statistical software version 9.2 (SAS Institute, Cary, NC). The study was approved by the University of Iowa institutional review board and the Iowa City VA Health Care System Research and Development Committee.
RESULTS
Patient Demographics
Demographic characteristics of patients differed by opioid‐use group (Table 1). Hospitalized patients who received COT in the 6 months prior to admission tended to be younger than their comparators, more often female, white, have a rural residence, and live in the South or West.
| Variables | No Opioids, n=66,899 (54.5%) | Occasional Opioids, n=24,093 (19.6%) | Chronic Opioids, n=31,802 (25.9%) |
|---|---|---|---|
| |||
| Age, y, mean (SD) | 68.7 (12.8) | 66.5 (12.7) | 64.5 (11.5) |
| Age, n (%) | |||
| 59 (reference) | 15,170 (22.7) | 6,703 (27.8) | 10,334 (32.5) |
| 6065 | 15,076 (22.5) | 5,973 (24.8) | 8,983 (28.3) |
| 6677 | 17,226 (25.8) | 5,871 (24.4) | 7,453 (23.4) |
| 78 | 19,427 (29.0) | 5,546 (23.0) | 5,032 (15.8) |
| Male, n (%) | 64,673 (96.7) | 22,964 (95.3) | 30,200 (95.0) |
| Race, n (%) | |||
| White | 48,888 (73.1) | 17,358 (72.1) | 25,087 (78.9) |
| Black | 14,480 (21.6) | 5,553 (23.1) | 5,089 (16.0) |
| Other | 1,172 (1.8) | 450 (1.9) | 645 (2.0) |
| Unknown | 2,359 (3.5) | 732 (3.0) | 981 (3.1) |
| Income $20,000, n (%) | 40,414 (60.4) | 14,105 (58.5) | 18,945 (59.6) |
| Rural residence, n (%) | 16,697 (25.0) | 6,277 (26.1) | 9,356 (29.4) |
| Region, n (%) | |||
| Northeast | 15,053 (22.5) | 4,437 (18.4) | 5,231 (16.5) |
| South | 24,083 (36.0) | 9,390 (39.0) | 12,720 (40.0) |
| Midwest | 16,000 (23.9) | 5,714 (23.7) | 7,762 (24.4) |
| West | 11,763 (17.6) | 4,552 (18.9) | 6,089 (19.2) |
| Charlson Comorbidity Index, mean (SD) | 2.3 (2.0) | 2.6 (2.3) | 2.7 (2.3) |
| Comorbidities, n (%) | |||
| Cancer (not metastatic) | 11,818 (17.7) | 5,549 (23.0) | 6,874 (21.6) |
| Metastatic cancer | 866 (1.3) | 733 (3.0) | 1,104 (3.5) |
| Chronic pain | 25,748 (38.5) | 14,811 (61.5) | 23,894 (75.1) |
| COPD | 20,750 (31.0) | 7,876 (32.7) | 12,117 (38.1) |
| Diabetes, complicated | 10,917 (16.3) | 4,620 (19.2) | 6,304 (19.8) |
| Heart failure | 14,267 (21.3) | 5,035 (20.9) | 6,501 (20.4) |
| Renal disease | 11,311 (16.9) | 4,586 (19.0) | 4,981 (15.7) |
| Dementia | 2,180 (3.3) | 459 (1.9) | 453 (1.4) |
| Mental health other than PTSD | 33,390 (49.9) | 13,657 (56.7) | 20,726 (65.2) |
| PTSD | 7,216 (10.8) | 3,607 (15.0) | 5,938 (18.7) |
| Palliative care use, n (%) | 1,407 (2.1) | 639 (2.7) | 1,024 (3.2) |
Prevalence of Opioid Use
Among the cohort (N=122,794) of hospitalized veterans, 66,899 (54.5%) received no opioids from the VA during the 6‐month period prior to hospitalization; 31,802 (25.9%) received COT in the 6 months prior to admission. An additional 24,093 (19.6%) had occasional opioid therapy (Table 1). A total of 257,623 opioid prescriptions were provided to patients in the 6‐month period prior to their index hospitalization. Of these, 100,379 (39.0%) were for hydrocodone, 48,584 (18.9%) for oxycodone, 36,658 (14.2%) for tramadol, and 35,471 (13.8%) for morphine. These 4 medications accounted for 85.8% of total opioid prescriptions (see Supporting Information, Appendix B, in the online version of this article).
Among the COT group, 3610 (11.4%) received opioids 90 days, 10,110 (31.8%) received opioids between 91 and 179 days, and 18,082 (56.9%) patients received opioids 180 days in the prior 6 months (see Supporting Information, Appendix C, in the online version of this article).
Among the subset of patients with cancer (metastatic and nonmetastatic, n=26,944), 29.6% were prescribed COT, and 23.3% had occasional opioid use. Among the subset of patients with CNCP (n=64,453), 37.1% were prescribed COT, and 23.0% had occasional opioid use.
Comorbid Conditions
Compared to patients not receiving opioids, a larger proportion of patients receiving both occasional and chronic opioids had diagnoses of cancer and of CNCP. Diagnoses more common in COT patients included chronic obstructive pulmonary disease (COPD), complicated diabetes, post‐traumatic stress disorder (PTSD), and other mental health disorders. In contrast, COT patients were less likely than no‐opioid and occasional opioid patients to have heart failure (HF), renal disease, and dementia. Palliative care was used by 2.1% of patients in the no‐opioid group, and 3.2% of patients in the COT group (Table 1). Renal disease was most common among the occasional‐use group.
Unadjusted Hospitalization Outcomes
Unadjusted hospitalization outcomes differed between opioid‐exposure groups (Table 2). Patients receiving occasional or chronic opioids had shorter length of stay and lower rates of non‐home discharge than did patients without any opioid use. The rate of death during hospitalization or within 30 days did not differ between groups. The occasional‐use and COT groups had higher 30‐day readmission rates than did the no‐use group.
| No Opioids, n=65,492 | Occasional Opioids, n=23,454 | Chronic Opioids, n=30,778 | P | |
|---|---|---|---|---|
| ||||
| Hospital length of stay, d, mean (SD) | 4.7 (5.1) | 4.5 (4.8) | 4.5 (4.8) | 0.0003 |
| ICU stay, n (%) | 10,281 (15.7) | 3,299 (14.1) | 4,570 (14.9) | <0.0001 |
| Non‐home discharge, n (%) | 2,944 (4.5) | 997 (4.3) | 1,233 (4.0) | 0.0020 |
| 30‐day readmission, n (%) | 9,023 (13.8) | 3,629 (15.5) | 4,773 (15.5) | <0.0001 |
| Death during hospitalization or within 30 days, n (%) | 2,532 (3.9) | 863 (3.7) | 1,191 (3.9) | 0.4057 |
Multivariable Models
In the fully adjusted multivariable models, opioid exposure (in the form of either chronic or occasional use) had no significant association with ICU stay during index admission or non‐home discharge (Table 3). Both the occasional‐opioid use and COT groups were more likely to experience 30‐day hospital readmission, a relationship that remained consistent across the partially and fully adjusted models. The occasional‐opioid use group saw no increased mortality risk. In the model adjusted only for admission diagnosis, COT was not associated with increased mortality risk. When additionally adjusted for demographic variables, CCI, and selected comorbidities, however, COT was associated with increased risk of death during hospitalization or within 30 days (odds ratio: 1.19, 90% confidence interval: 1.10‐1.29).
| Occasional Opioid Use | Chronic Opioid Therapy | |||
|---|---|---|---|---|
| Model 1, OR (95% CI) | Model 2, OR (95% CI) | Model 1, OR (95% CI) | Model 2, OR (95% CI) | |
| ||||
| ICU stay | 0.94 (0.90‐0.99) | 0.95 (0.91‐1.00) | 1.00 (0.96‐1.04) | 1.01 (0.97‐1.05) |
| Non‐home discharge | 0.92 (0.85‐0.99) | 0.97 (0.90‐1.05) | 0.85 (0.80‐0.92) | 0.95 (0.88‐1.03) |
| 30‐day readmission | 1.14 (1.09‐1.19) | 1.14 (1.09‐1.19) | 1.14 (1.10‐1.19) | 1.15 (1.10‐1.20) |
| Death during hospitalization or within 30 days | 0.96 (0.88‐1.04) | 1.04 (0.95‐1.13) | 0.96 (0.90‐1.04) | 1.19 (1.10‐1.29) |
DISCUSSION
This observational study is, to our knowledge, the first to report prevalence of and characteristics associated with prior opioid use among hospitalized medical patients. The prevalence of any opioid use and of COT was substantially higher in this hospitalized cohort than reported in outpatient settings. The prevalence of any opioid use during 1 year (FY 2009) among all veterans with VA primary care use was 26.1%.[23] A study of incident prescribing rates among veterans with new diagnoses of noncancer‐related pain demonstrated 11% received an opioid prescription within 1 year.[24] Using a definition of 90 consecutive prescription days to define COT, Dobscha et al.[25] found that 5% of veterans with persistent elevated pain intensity and no previous opioid prescriptions subsequently received COT within 12 months. The high prevalence we found likely reflects cumulative effects of incident use as well as an increased symptom burden in a population defined by need for medical hospitalization.
Although a veteran population may not be generalizable to a nonveteran setting, we do note prior studies reporting prevalence of any opioid use in outpatient cohorts (in 2000 and 2005) of between 18% and 30%, with higher rates among women and patients over 65 years of age.[1, 2]
Our work was purposefully inclusive of cancer patients so that we might assess the degree to which cancer diagnoses accounted for prior opioid use in hospitalized patients. Surprisingly, the rate of COT for patients with cancer was lower than that for patients with CNCP, perhaps reflecting that a cancer condition defined in administrative data may not constitute a pain‐causing disease.
Recognition of the prevalence of opioid therapy is important as we work to understand and improve safety, satisfaction, utilization, and long‐term health outcomes associated with hospitalization. Our finding that over half of medical inpatients have preexisting CNCP diagnoses, and a not entirely overlapping proportion has prior opioid exposure, implies a need for future work to refine expectations and strategies for inpatient management, potentially tailored to prior opioid use and presence of CNCP.
A recent Joint Commission sentinel event alert[26] highlights opioid adverse events in the hospital and identifies both lack of previous opioid therapy and prior opioid therapy as factors increasing risk. ICU admission during the hospital stay may reflect adverse events such as opioid‐induced respiratory depression; in our study, patients with no opioid use prior to admission were more likely to have an ICU stay, although the effect was small. One might speculate that clinicians, accustomed to treating pain in opioid‐exposed patients, are using inappropriately large starting dosages of narcotics for inpatients without first assessing prior opioid exposure. Another possible explanation is that patients on COT are admitted to the hospital with less severe illness, potentially reflecting functional, social, or access limitations that compromise ability to manage illness in the outpatient setting. More detailed comparison of illness severity is beyond the scope of the present work.
Patient satisfaction with pain management is reflected in 2 of the Hospital Consumer Assessment of Healthcare Providers and Systems (HCAHPS) questions, and is publically reported.[27] HCAHPS results also figure in the formula for the Centers for Medicare and Medicaid Services value‐based purchasing.[28] Preadmission pain is predictive of postoperative pain[29, 30] and may shape patient expectations; how preadmission opioid use modulates nonsurgical pain and satisfaction with management in the medical inpatient remains to be studied. The high prevalence of prior COT underscores the importance of understanding characteristics of patients on COT, and potential differences and disparities in pain management, when designing interventions to augment patient satisfaction with pain management.
Although the age distribution and patterns of comorbidities differed between the opioid‐use groups, opioid therapy remained a small but significant predictor of hospital readmission; this association was independent of CNCP diagnosis. Functional outcomes are recognized as important measures of efficacy of outpatient pain management strategies,[31] with some evidence that opioids are associated with worse functioning.[32, 33] Functional limitations, as well as inadequately or inappropriately treated pain, may drive both admissions and readmissions. Alternately, COT may be a marker for unmeasured factors that increase a patient's risk of returning to the hospital. Further work is needed to elucidate the relationship between COT and healthcare utilization associated with the inpatient stay.
Our finding that patients on COT have an increased mortality risk is concerning, given the rapid expansion in use of these medications. Although pain is increasingly prevalent toward end of life,[34] we did not observe an association between either CNCP (data not shown) or occasional opioid use and mortality. COT may complicate chronic disease through adverse drug effects including respiratory depression, apnea, or endocrine or immune alteration. Complex chronically ill patients with conditions such as COPD, HF, or diabetes may be particularly susceptible to these effects. Incident use of morphine is associated with increased mortality in acute coronary syndrome and HF[35, 36]: we are not aware of any work describing the relationship between prior opioid use and incident use during hospitalization in medical patients.
Limitations
Our work focuses on hospitalized veterans, a population that remains predominately male, limiting generalizability of the findings. Rates of mental health diagnoses and PTSD, associated with CNCP and COT,[24, 37] are higher in this population than would be expected in a general hospitalized population. Because our outcomes included readmission, and our definition of opioid exposure was designed to reflect outpatient prescribing, we included only patients without recent hospitalization. Therefore, our results may not be generalizable to patients with frequent and recurring hospitalization.
Our definition of opioid exposure depended on pharmacy dispensing records; we are not able to confirm if veterans were taking the medications as prescribed. Further, we were not able to capture data on opioids prescribed by non‐VA providers, which may have led to underestimation of prevalence.
Our definitions of COT and CNCP are imperfect, and should be noted when comparing to other studies. Because we did not specify continuous 90‐day prescribing, we may have misclassified occasional opioid therapy as COT in comparison to other authors. That continuous prescribing is equivalent to continuous use assumes that patients take medications exactly as prescribed. We used occasional opioid therapy as a comparison group, and detailed the distribution of days prescribed among the COT group (see Supporting Information, Appendix C, in the online version of this article), to augment interpretability of these results. Our CNCP diagnosis was less inclusive than others,[2] as we omitted episodic pain (eg, migraine and sprains) and human immunodeficiency virus‐related pain. As COT for CNCP conditions lacks a robust evidence base,[38] defining pain diagnoses using administrative data to reflect conditions for which COT is used in a guideline‐concordant way remains difficult.
Last, differences observed between opioid‐use groups may be due to an unmeasured confounder not captured by the variables we included. Specifically, we did not include other long‐term outpatient medications in our models. It is possible that COT is part of a larger context of inappropriate prescribing, rather than a single‐medication effect on outcomes studied.
CONCLUSION
Nearly 1 in 4 hospitalized veterans has current or recent COT at the time of hospital admission for nonsurgical conditions; nearly half have been prescribed any opioids. Practitioners designing interventions to improve pain management in the inpatient setting should account for prior opioid use. Patients who are on COT prior to hospitalization differ in age and comorbidities from their counterparts who are not on COT. Further elucidation of differences between opioid‐use groups may help providers address care needs during the transition to posthospitalization care. CNCP diagnoses and chronic opioid exposure are different entities and cannot serve as proxies in administrative data. Additional work on utilization and outcomes in specific patient populations may improve our understanding of the long‐term health effects of chronic opioid therapy.
Disclosures: Dr. Mosher is supported by the Veterans Administration (VA) Quality Scholars Fellowship, Office of Academic Affiliations, Department of Veterans Affairs. Dr. Cram is supported by a K24 award from NIAMS (AR062133) at the National Institutes of Health. The preliminary results of this article were presented at the Society of General Internal Medicine Annual Meeting in Denver, Colordao, April 2013. The views expressed in this article are those of the authors and do not necessarily represent the views of the Department of Veterans Affairs. Data are available to researchers with VA accreditation, the statistical code and the protocol are available to interested readers by contacting Dr. Mosher. The authors report no conflict of interest in regard to this study.
- , , , et al. Age and gender trends in long‐term opioid analgesic use for noncancer pain. Am J Public Health. 2010;100:2541–2547.
- , , , , , . Trends in use of opioids for non‐cancer pain conditions 2000–2005 in commercial and Medicaid insurance plans: the TROUP study. Pain. 2008;138:440–449.
- Institute of Medicine (US) Committee on Advancing Pain Research, Care, and Education. Relieving pain in America: a blueprint for transforming prevention, care, education, and research. Washington, DC: National Academies Press; 2011.
- , , , . Long‐term opioid therapy reconsidered. Ann Intern Med. 2011;155:325–328.
- , . What are we treating with long‐term opioid therapy? Arch Intern Med. 2012;172:433–434.
- , , , . Opioids for chronic noncancer pain: a meta‐analysis of effectiveness and side effects. CMAJ. 2006;174:1589–1594.
- , , , . Opioids in chronic non‐cancer pain: systematic review of efficacy and safety. Pain. 2004;112:372–380.
- , , , et al. A systematic review of randomized trials of long‐term opioid management for chronic non‐cancer pain. Pain Physician. 2011;14:91–121.
- , , , , , . Rates of adverse events of long‐acting opioids in a state Medicaid program. Ann Pharmacother. 2007;41:921–928.
- , , , et al. Emergency department visits among recipients of chronic opioid therapy. Arch Intern Med. 2010;170:1425–1432.
- , , , . Emergency hospitalizations for adverse drug events in older Americans. N Engl J Med. 2011;365:2002–2012.
- , . Assessment and management of acute pain in adult medical inpatients: a systematic review. Pain Med. 2009;10:1183–1199.
- , , , . Acute pain management in opioid‐tolerant patients: a growing challenge. Anaesth Intensive Care. 2011;39:804–823.
- , , , . Acute pain management of the chronic pain patient on opiates: a survey of caregivers at University of Washington Medical Center. Clin J Pain. 1994;10:133–138.
- The Joint Commission and the FDA take steps to curb adverse events related to the use and misuse of opioid drugs. ED Manag. 2012;24:112–116.
- , . Tramadol. CMAJ. 2013;185:E352.
- , , , , . Prescription opioid abuse in the United Kingdom. Br J Clin Pharmacol. 2013;76:823–824.
- , , , . Validation of a combined comorbidity index. J Clin Epidemiol. 1994;47:1245–1251.
- , , , , . Bringing the war back home: mental health disorders among 103,788 US veterans returning from Iraq and Afghanistan seen at Department of Veterans Affairs facilities. Arch Intern Med. 2007;167:476–482.
- , , , et al. Coding algorithms for defining comorbidities in ICD‐9‐CM and ICD‐10 administrative data. Med Care. 2005;43:1130–1139.
- , , , , , . Sex Differences in the medical care of VA patients with chronic non‐cancer pain [published online ahead of print June 26, 2013]. Pain Med. doi: 10.1111/pme.12177.
- Agency for Healthcare Research and Quality. Clinical Classifications Software (CCS) for ICD‐9‐CM. Available at: http://www.hcup‐us.ahrq.gov/toolssoftware/ccs/ccs.jsp. Accessed October 17, 2013.
- , , , et al. Predicting risk of hospitalization or death among patients receiving primary care in the Veterans Health Administration. Med Care. 2013;51:368–373.
- , , , et al. Association of mental health disorders with prescription opioids and high‐risk opioid use in US veterans of Iraq and Afghanistan. JAMA. 2012;307:940–947.
- , , , , . Correlates of prescription opioid initiation and long‐term opioid use in veterans with persistent pain. Clin J Pain. 2013;29:102–108.
- Safe use of opioids in hospitals. Sentinel Event Alert. 2012;49:1–5.
- Centers for Medicare (2):2–9.
- , , , , , . The risk of severe postoperative pain: modification and validation of a clinical prediction rule. Anesth Analg. 2008;107:1330–1339.
- , , , et al. Preoperative predictors of moderate to intense acute postoperative pain in patients undergoing abdominal surgery. Acta Anaesthesiol Scand. 2002;46:1265–1271.
- , , , , , . Successful and unsuccessful outcomes with long‐term opioid therapy: a survey of physicians' opinions. J Palliat Med. 2006;9:50–56.
- , , , . Opioid use among low back pain patients in primary care: is opioid prescription associated with disability at 6‐month follow‐up? Pain. 2013;154:1038–1044.
- , , , , ; Disability Risk Identification Study Cohort. Early opioid prescription and subsequent disability among workers with back injuries: the Disability Risk Identification Study Cohort. Spine (Phila Pa 1976). 2008;33:199–204.
- , , , et al. The epidemiology of pain during the last 2 years of life. Ann Intern Med. 2010;153:563–569.
- , , , et al. Association of intravenous morphine use and outcomes in acute coronary syndromes: results from the CRUSADE Quality Improvement Initiative. Am Heart J. 2005;149:1043–1049.
- , , , et al. Use of intravenous morphine for acute decompensated heart failure in patients with and without acute coronary syndromes. Acute Card Care. 2011;13:76–80.
- , , , et al. VA mental health services utilization in Iraq and Afghanistan veterans in the first year of receiving new mental health diagnoses. J Trauma Stress. 2010;23:5–16.
- , , , et al. Long‐term opioid management for chronic noncancer pain. Cochrane Database Syst Rev. 2010;(1):CD006605.
© 2013 Society of Hospital Medicine
Hospitalist Effects on Acute IGIH Patients
Acute upper gastrointestinal hemorrhage (UGIH) is one of the most common hospital admissions for acute care. Estimates indicate that 300,000 patients (100‐150 cases per 100,000 adults) are admitted annually with an associated economic impact of $2.5 billion.15 The current standard management of UGIH requires hospital admission and esophagogastroduodenoscopy (EGD) by a gastroenterologist for diagnosis and/or treatment. This management strategy results in a high consumption of hospital resources and costs.
Simultaneously, hospitalists have dramatically changed the delivery of inpatient care in the United States and are recognized as a location‐driven subspecialty for the care of acute hospitalized patients, similar to emergency medicine. Currently there are 20,000 hospitalists, and more than one‐third of general medicine inpatients are cared for by hospitalists.6, 7
Previous studies have shown that hospitalist care offers better or comparable outcomes, with lower overall length of stay (LOS) and costs compared to traditional providers.810 However, most of these studies were performed in single institutions, had weak designs or little‐to‐no adjustment for severity of illness, or were limited to 7 specific diseases (pneumonia, congestive heart failure [CHF], chest pain, ischemic stroke, urinary tract infection, chronic obstructive lung disease [COPD], and acute myocardial infarction [AMI]).8
Furthermore, less is known about the effect of hospitalists on conditions that may be dependent upon specialist consultation for procedures and/or treatment plans. In this study, gastroenterologists performed diagnostic and/or therapeutic endoscopy work as consultants to the attending physicians in the management of acute inpatient UGIH.
To explore the effects of hospitalists on care of patients with acute UGIH, we examined data from the Multicenter Hospitalist (MCH) trial. The objectives of our study were to compare clinical outcomesin‐hospital mortality and complications (ie, recurrent bleeding, intensive care unit [ICU] transfer, decompensation, transfusion, reendoscopy, 30‐day readmission)and efficiency (LOS and costs) in hospitalized acute UGIH patients cared for by hospitalists and nonhospitalists in 6 academic centers in the United States during a 2‐year period.
Patients and Methods
Study Sites
From July 1, 2001 to June 30, 2003, the MCH trial1113 was a prospective, multicenter, observational trial of the care provided by hospitalists to patients admitted to general medical services at 6 academic medical institutions. There were 31,000 consecutive admissions to the general medical services of these participating sites: University of Chicago (Chicago, IL), University of Wisconsin Hospital (Madison, WI), University of Iowa (Iowa City, IA), University of California at San Francisco (San Francisco, CA), University of New Mexico (Albuquerque, NM), and Brigham and Women's Hospital (Boston, MA). The study was approved by the institutional review boards (IRBs) at each of the 6 participating institutions.
MCH Study Patients
Patients were eligible if they were admitted to the general medical services under the care of a hospitalist or nonhospitalist physician. Regardless of the admitting provider, each medical service was composed of rotating senior and junior resident physicians in all 6 sites. Furthermore, patients were 18 years of age or older, and were able to give consent themselves or had an appropriate proxy. Patients with mini‐mental status score of 17 (out of 22), admitted under their primary care physician or to an inpatient gastroenterology service, or transferred from another hospital, were excluded. The MCH study was designed to study the outcomes and efficiency in patients admitted for CHF, pneumonia, UGIH, and end‐of‐life care.
Acute UGIH Patients
Within the MCH‐eligible patients, we identified those with acute UGIH using the following International Classification of Diseases, 9th edition (ICD‐9) codes assigned at discharge: esophageal varices with hemorrhage (456.0, 456.20); Mallory‐Weiss syndrome (530.7); gastric ulcer with hemorrhage (531.00531.61); duodenal ulcer with hemorrhage (532.00532.61); peptic ulcer, site unspecified, with hemorrhage (533.00533.61); gastrojejunal ulcer with hemorrhage (534.00534.61); gastritis with hemorrhage (535.61); angiodysplasia of stomach/duodenum with hemorrhage (537.83); and hematemesis (578.0, 578.9). We also confirmed the diagnosis of UGIH by reviewing patient medical records for observed hematemesis, nasogastric tube aspirate with gross or hemoccult blood, or clinical history of hematemesis, melena, or hematochezia.14, 15
Data
All data were obtained from the 6 hospitals' administrative records, patient interviews, and medical chart abstractions. Dates of admission and discharge, ICD‐9 diagnosis codes, insurance type, age, race, and gender were obtained from administrative data. One‐month follow‐up telephone interviews assessed whether or not patient had any follow‐up appointment or hospital readmissions. Trained abstractors from each site performed manual chart reviews using a standard data collection sheet. The ICD‐9 code designation and chart abstraction methodology were developed prior to the initiation of the study to ensure consistent data collection and reduce bias.
The following data elements were collected: comorbidities, endoscopic findings, inpatient mortality, clinical evidence of rebleeding, endoscopic treatment or gastrointestinal (GI) surgery to control bleeding, repeat EGD, ICU transfer, decompensated comorbid illness requiring continued hospitalization, and blood transfusion (packed red cells, plasma, platelets). Clinical evidence of rebleeding was defined as either hematemesis or melena with decrease in hemoglobin of 2 g in 24 hours with or without hemodynamic compromise.14, 15 For the purpose of this study, recurrent bleeding was defined as clinical evidence of rebleeding, emergency GI surgery for control of UGIH, or repeat EGD before discharge. Furthermore, a composite endpoint termed total complications encompassed all adverse outcomes related to the UGIH hospitalization. The 30‐day readmission variable was defined using readmission identified in administrative records and a 30‐day follow‐up phone call. To guard against recall bias, self‐report data was only included for nonsite admissions.
We defined efficiency in terms of costs and LOS. Total hospital costs were measured using the TSI cost accounting system (Transition Systems, Inc., Boston, MA; now Eclipsys Corporation)16, 17 at 5 out of the 6 participating sites. TSI is a hospital cost accounting software system that integrates resource utilization and financial data already recorded in other hospital databases (such as the billing system, payroll system, and general ledger system).17 Hospital LOS was defined as the number of days from patient admission to the general medicine service until patient discharge.
Provider Specialization: Hospitalists vs. Nonhospitalists
The study was designed as a natural experiment based on a call cycle. The hospitalist‐led teams at each institution alternated in a 4‐day or 5‐day general medicine call cycle with teams led by traditional academic internal medicine attending physicians. All patients were assigned to teams according to their position in the call cycle without regard to whether the attending physician was a hospitalist or a nonhospitalist. Hospitalists are physicians whose primary professional focus is the general medical care of hospitalized patients.18, 19 As previously reported in a related MCH work,11 a hospitalist was also defined as a provider who spends at least 25% of his or her time on an academic inpatient general medicine service. Nonhospitalist physicians were most often outpatient general internal medicine faculty or subspecialists, who attended 1 month per year. Physicians were classified as hospitalists or nonhospitalists according to the designations provided by each site.
UGIH‐specific Confounders
From chart abstraction, we captured severity of illness, comorbidity, and performance of early EGD, variables that can confound analysis in UGIH. To capture severity of illness, a complete Rockall risk score was calculated for each patient. The complete Rockall uses 3 clinical variables (age, shock, and comorbidity) and 2 endoscopic variables (endoscopic diagnosis and stigmata of recent hemorrhage).5, 20 A complete Rockall score of 2 is considered low‐risk for rebleeding or death following admission.21, 22 The accepted definition of low‐risk is <5% recurrent bleeding and <1% mortality risk. A complete Rockall score of 3 to 5 is considered moderate‐risk while 6 is considered high‐risk. Comorbidity was measured using the Charlson comorbidity index.23 Performance of early endoscopy, usually defined as endoscopy performed within 24 hours from presentation, was previously shown to decrease LOS and need for surgical intervention in patients with acute UGIH.24, 25 Documented times of presentation to the emergency department and time of endoscopy performance were collected to calculate for the rate of early endoscopy in our study population.
Statistical Analysis
All statistical analyses were performed using SAS Version 9.1 for Windows (SAS Institute, Cary, NC).
Differences in baseline demographic characteristics of patients and their endoscopic findings were compared between the 2 types of providers. Univariate analyses were also performed to compare the differences in adverse outcomes, LOS, and costs between patients cared for by hospitalists and nonhospitalists. Chi‐square tests were used for categorical variables; while both Wilcoxon rank sum test and Student's t test were used in the analysis of continuous variables.
Next, we performed multivariable analyses to determine the independent association between hospitalist care and the odds of the patients having certain outcomes. However, to prevent overfitting, we only developed regression models for adverse outcomes that have at least 20% event rate.
Multivariable regression models were developed separately for LOS and costs. In contrast with the models on outcomes, analyses of LOS and costs were restricted to: (1) patients who were discharged alive; and (2) to cases with LOS and costs values within 3 standard deviations (SDs) of the mean because of the skewed nature of these data.
All models were adjusted for age, gender, race, insurance type, complete Rockall risk score, performance of early EGD, Charlson comorbidity index, and study site. Final candidate variables in the models were chosen based on stepwise selection, a method very similar to forward selection except that variables selected for the model do not necessarily remain in the model. Effects were entered into and then removed from the model in such a way that each forward selection step can be followed by 1 or more backward elimination steps. The stepwise selection was terminated if no further effect can be added to the model or if the current model was identical to the previous model. The stepwise selection model was generated using statistical criterion of alpha = 0.05 for entry and elimination from the model. Variables that can be a profound source of variation, such as study site and treating physician, were included in the model irrespective of their statistical significance.
To account for clustering of patients treated by the same physician, we used multilevel modeling with SAS PROC GLIMMIX (with random effects). For outcomes (categorical variables), we utilized models with logit‐link and binomial‐distributed errors. As for efficiency (continuous variables with skewed distribution), the multivariable analyses used a generalized linear model with log‐link and assuming gamma‐distributed errors.
Results
Patient Characteristics and Endoscopic Diagnoses
Out of 31,000 patients, the study identified a total of 566 patients (1.8%) with acute UGIH (Table 1). However, 116 patients transferred from another hospital were excluded as their initial management was provided elsewhere, giving a final study sample of 450 patients. Overall, there are 163 admitting physicians from 6 sites, with 39 (24%) classified as hospitalists and 124 (76%) as nonhospitalists. Forty‐two percent (177/450) of patients were cared for by hospitalists. Compared to nonhospitalists, patients admitted to the hospitalist service were older (62.8 vs. 57.7 years, P < 0.01) and with third‐party payor mix differences (P < 0.01). However, there were no statistical differences between patients attended by hospitalists and nonhospitalists with regard to Complete Rockall risk score, Charlson comorbidity index, performance of early endoscopy, and mean hemoglobin values on admission. Upper endoscopy was performed in all patients with distribution of the 3 most common diagnoses being similar (P > 0.05) between hospitalists and nonhospitalists: erosive disease (49.7% vs. 54.6%), peptic ulcer disease (PUD) (48% vs. 46.9%), and varices (18.6% vs. 14.7%).
| Variable | Admitting Service | P | |
|---|---|---|---|
| Hospitalist (n = 177) | Nonhospitalist (n = 273) | ||
| |||
| Age, years (meanSD) | 62.817.4 | 57.718.5 | <0.01 |
| Male sex, n (%) | 104 (58.8) | 169 (61.9) | 0.50 |
| Ethnicity, n (%) | 0.13 | ||
| White | 83 (46.9) | 102 (37.4) | |
| African‐American | 34 (19.2) | 75 (27.5) | |
| Hispanic | 21 (11.9) | 40 (14.7) | |
| Asian/Pacific Islander | 24 (13.6) | 29 (10.6) | |
| Others/unknown | 15 (8.5) | 27 (9.9) | |
| Insurance, n (%) | <0.01 | ||
| Medicare | 86 (48.6) | 104 (38.1) | |
| Medicaid | 15 (8.5) | 33 (12.1) | |
| No payer | 18 (10.2) | 36 (13.2) | |
| Private | 46 (26) | 52 (19.1) | |
| Unknown | 12 (6.8) | 48 (17.5) | |
| Charlson Comorbidity Index (meanSD) | 1.91.6 | 1.81.7 | 0.51 |
| Complete Rockall, n (%) | 0.11 | ||
| Low‐risk (0‐2) | 82 (46.3) | 103 (37.7) | |
| Moderate‐risk (3‐5) | 71 (40.1) | 137 (50.2) | |
| High‐risk (6) | 24 (14.6) | 33 (12.1) | |
| Early endoscopy (<24 hours) | 82 (46.3) | 133 (48.7) | 0.62 |
| Endoscopic diagnosis, n (%)* | |||
| Erosive disease | 88 (49.7) | 149 (54.6) | 0.31 |
| Peptic ulcer disease | 85 (48.0) | 128 (46.9) | 0.81 |
| Varices | 33 (18.6) | 40 (14.7) | 0.26 |
| Mallory‐Weiss tear | 9 (5.1) | 21 (7.7) | 0.28 |
| Angiodysplasia | 9 (5.1) | 13 (4.8) | 0.88 |
| GI mass | 1 (0.6) | 4 (1.5) | 0.65 |
| Normal | 7 (4.0) | 8 (2.9) | 0.55 |
| Admission hemoglobin values (meanSD) | 10.22.9 | 10.22.9 | 0.78 |
Clinical Outcomes
Between hospitalists and nonhospitalists, unadjusted outcomes were similar (P > 0.05) for mortality (2.3% vs. 0.4%), recurrent bleeding (11% vs. 11%), need for endoscopic therapy (24% vs. 22%), ICU‐transfer and decompensation (15% vs. 15%), as well as an overall composite measure of any complication (79% vs. 72%) (Table 2). However, the hospitalist‐led teams performed more blood transfusions (74% vs. 63%, P = 0.02) and readmission rates were higher (7.3% vs. 3.3%, P = 0.05).
| Outcomes, n (%) | Admitting Service | P | |
|---|---|---|---|
| Hospitalist (n = 177) | Nonhospitalist (n = 273) | ||
| |||
| Inpatient mortality | 4 (2.3) | 1 (0.4) | 0.08 |
| Recurrent bleeding* | 20 (11.3) | 29 (10.6) | 0.88 |
| Endoscopic therapy | 43 (24.3) | 60 (22.0) | 0.57 |
| ICU transfers | 23 (13) | 24 (8.8) | 0.20 |
| Decompensated comorbidities that required continued hospitalization | 26 (14.7) | 41 (15.0) | 0.92 |
| Any transfusion | 131 (74.0) | 172 (63.0) | 0.02 |
| Total complications | 139 (78.5) | 196 (71.8) | 0.11 |
| 30‐day all‐cause readmissions | 13 (7.3) | 9 (3.3) | 0.05 |
| Efficiency | Hospitalist (n = 164) | Nonhospitalist (n = 259) | P |
| LOS, days | |||
| MeanSD | 4.83.5 | 4.53.0 | 0.30 |
| Median (interquartile range) | 4 (36) | 4 (26) | 0.69 |
| Total costs, U.S. $ | |||
| MeanSD | 10,466.669191.00 | 7926.716065.00 | <0.01 |
| Median (interquartile range) | 7359.00 (4,698.0012,550.00) | 6181.00 (3744.0010,344.00) | <0.01 |
Because of the low event rate of certain adverse outcomes (<20%), we were only able to perform adjusted analyses on 4 outcomes: need for endoscopic therapy (odds ratio [OR], 0.82; 95% confidence interval [CI], 0.491.37), ICU transfer and decompensation (OR, 0.82; 95% CI, 0.451.52), blood transfusion (OR, 1.30; 95% CI, 0.822.04), and any complication (OR, 1.18; 95% CI, 0.711.96). Since outcome differences disappeared after controlling for confounders, the data suggest that overall care provided by hospitalists and nonhospitalists might be equivalenteven in certain outcomes that we were unable to substantiate using multivariable methods.
Efficiency
Efficiency, as measured by LOS and costs, are presented both as means and medians in univariate analyses in Table 2. Median LOS was similar for hospitalist‐led and nonhospitalist‐led teams (4 days). Despite having similar LOS, the median costs of acute UGIH in patients cared for by hospitalists were higher ($7,359.00 vs. $6,181.00; P < 0.01).
After adjusting for demographic factors, Rockall risk score, comorbidity, early EGD, and hospital site, LOS remained similar between the 2 groups. On the other hand, the adjusted cost for UGIH patients cared for by hospitalists and nonhospitalists persisted, with hospitalist care costs $1,502.40 more than their nonhospitalist counterparts (Table 3).
| Efficiency | Treatment Provider | P | |
|---|---|---|---|
| Hospitalist (n = 164) | Nonhospitalist (n = 259) | ||
| |||
| Adjusted length of stay, days (mean SD) | 5.2 (4.95.6) | 4.7 (4.55.0) | 0.15 |
| Adjusted total cost, U.S. $ (mean SD) | 9006.50 (8366.609693.60) | 7504.10 (7069.907964.20) | 0.03 |
Discussion
This is the first study that has looked at the effect of hospitalists on clinical outcomes and efficiency in patients admitted for acute UGIH, a condition highly dependent upon another specialty for procedures and management. This is also one of only a few studies on UGIH that adjusted for severity of illness (Rockall score), comorbidity, performance of early endoscopypatient‐level confounders usually unaccounted for in prior research.
We show that hospitalists and nonhospitalists caring for acute UGIH patients had overall similar unadjusted outcomes; except for blood transfusion and 30‐day readmission rates. Unfortunately, due to the small number of events for readmissions, we were unable to perform adjusted analysis for readmission. Differences between hospitalists and nonhospitalists on blood transfusion rates were not substantiated on multivariable adjustments.
As for efficiency, univariable and multivariable analyses revealed that LOS was similar between provider types while costs were greater in UGIH patients attended by hospitalists.
Reductions in resource use, particularly costs, may be achieved by increasing throughput (eg, reducing LOS) or by decreasing service intensity (eg, using fewer ancillary services and specialty consultations).26 Specifically in acute UGIH, LOS is significantly affected by performance of early EGD.27, 28 In these studies, gastroenterologist‐led teams, compared to internists and surgeons, have easier access to endoscopy, thus reducing LOS and overall costs.27, 28
Similarly, prior studies have shown that the mechanism by which hospitalists lower costs is by decreasing LOS.810, 29 There are several hypotheses on how hospitalists affect LOS. Hospitalists, by being available all day, are thought to respond quickly to acute symptoms or new test results, are more efficient in navigating the complex hospital environment, or develop greater expertise as a result of added inpatient experience.8 On the downside, although the hospitalist model reduces overall LOS and costs, they also provide higher intensity of care as reflected by greater costs when broken down per hospital day.29 Thus, the cost differential we found may represent higher intensity of care by hospitalists in their management of acute UGIH, as higher intensity care without decreasing LOS can translate to higher costs.
In addition, patients with acute UGIH are unique in several respects. In contrast to diseases like heart failure, COPD, and pneumonia, in which the admitting provider has the option to request a subspecialist consultation, all patients with acute UGIH need a gastroenterologist to perform endoscopy as part of the management. These patients are usually admitted to general medicine wards, aggressively resuscitated with intravenous fluids, with a nonurgent gastroenterology consult or EGD performed on the next available schedule.
Aside from LOS being greatly affected by performance of early EGD and/or delay in consulting gastroenterology, sicker patients require longer hospitalization and drive LOS and healthcare costs up. It was therefore crucial that we accounted for severity of illness, comorbidity, and performance of early EGD in our regression models for LOS and costs. This approach allows us to acquire a more accurate estimate on the effects of hospitalist on LOS and costs in patients admitted with acute UGIH.
Our findings suggest that the academic hospitalist model of care may not have as great of an impact on hospital efficiency in certain patient groups that require nonurgent subspecialty consultations. Future studies should focus on elucidating these relationships.
Limitations
This study has several limitations. First, clinical data were abstracted at 6 sites by different abstractors so it is possible there were variations in how data were collected. To reduce variation, a standardized abstraction form with instructions was developed and the primary investigator (PI) was available for specific questions during the abstraction process. Second, only 5 out of the 6 sites used TSI accounting systems. Although similar, interhospital costs captured by TSI may vary among sites in terms of classifying direct and indirect costs, potentially resulting in misclassification bias in our cost estimates.17 We addressed these issues by including the hospital site variable in our regression models, regardless of its significance. Third, consent rates across sites vary from 70% to 85%. It is possible that patients who refused enrollment in the MCH trial are systematically different and may introduce bias in our analysis.
Furthermore, the study was designed as a natural experiment based on a rotational call cycle between hospitalist‐led and nonhospitalist‐led teams. It is possible that the order of patient assignment might not be completely naturally random as we intended. However, the study period was for 2 years and we expect the effect of order would have averaged out in time.
There are many hospitalist models of care. In terms of generalizability, the study pertains only to academic hospitalists and may not be applicable to hospitalists practicing in community hospitals. For example, the nonhospitalist comparison group is likely different in the community and academic settings. Community nonhospitalists (traditional practitioners) are usually internists covering both inpatient and outpatient responsibilities at the same time. In contrast, academic nonhospitalists are internists or subspecialists serving as ward attendings for a limited period (usually 1 month) with considerable variation in their nonattending responsibilities (eg, research, clinic, administration). Furthermore, academic nonhospitalist providers might be a self‐selected group by their willingness to serve as a ward attending, making them more hospitalist‐like. Changes and variability of inpatient attendings may also affect our findings when compared to prior work. Finally, it is also possible that having residents at academic medical centers may attenuate the effect of hospitalists more than in community‐based models.
Conclusions/Implications
Compared to nonhospitalists, academic hospitalist care of acute UGIH patients had similar overall clinical outcomes. However, our finding of similar LOS yet higher costs for patients cared for by hospitalists support 1 proposed mechanism in which hospitalists decrease healthcare costs: providing higher intensity of care per day of hospitalization. However, in academic hospitalist models, this higher intensity hypothesis should be revisited, especially in certain patient groups in which timing and involvement of subspecialists may influence discharge decisions, affecting LOS and overall costs.
Due to inherent limitations in this observational study, future studies should focus on verifying and elucidating these relationships further. Lastly, understanding which patient groups receive the greatest potential benefit from this model will help guide both organizational efforts and quality improvement strategies.
- ,.Bleeding peptic ulcer.N Engl J Med.1994;331(11):717–727.
- .Epidemiology of hospitalization for acute upper gastrointestinal hemorrhage: a population‐based study.Am J Gastroenterol.1995;90(2):206–210.
- ,,, et al.Variation in outcome after acute upper gastrointestinal haemorrhage. the national audit of acute upper gastrointestinal haemorrhage.Lancet.1995;346(8971):346–350.
- ,,, et al.Influencing the practice and outcome in acute upper gastrointestinal haemorrhage. Steering committee of the National Audit of Acute Upper Gastrointestinal Haemorrhage.Gut.1997;41(5):606–611.
- ,,, et al.Risk assessment after acute upper gastrointestinal haemorrhage.Gut.1996;38(3):316–321.
- ,,, et al.The potential size of the hospitalist workforce in the united states.Am J Med.1999;106(4):441–445.
- Society of Hospital Medicine. About SHM. Available at: http://www.hospitalmedicine.org/AM/Template.cfm?Section=General_Information357(25):2589–2600.
- ,,, et al.Effects of physician experience on costs and outcomes on an academic general medicine service: results of a trial of hospitalists.Ann Intern Med.2002;137(11):866–874.
- .A systematic review of outcomes and quality measures in adult patients cared for by hospitalists vs nonhospitalists.Mayo Clin Proc.2009;84(3):248–254.
- ,,, et al.Do hospitalists or physicians with greater inpatient HIV experience improve HIV care in the era of highly active antiretroviral therapy? Results from a multicenter trial of academic hospitalists.Clin Infect Dis.2008;46(7):1085–1092.
- ,,, et al.Quality of care for decompensated heart failure: comparable performance between academic hospitalists and non‐hospitalists. J Gen Intern Med.2008;23(9):1399–1406.
- ,,, et al.Factors associated with discussion of care plans and code status at the time of hospital admission: results from the Multicenter Hospitalist Study.J Hosp Med.2008;3(6):437–445.
- ,,, et al.Upper gastrointestinal hemorrhage clinical guideline determining the optimal hospital length of stay.Am J Med.1996;100(3):313–322.
- ,,, et al.Prospective evaluation of a clinical guideline recommending hospital length of stay in upper gastrointestinal tract hemorrhage.JAMA.1997;278(24):2151–2156.
- ,,, et al.In‐hospital cost of abdominal aortic aneurysm repair in Canada and the United States.Arch Intern Med.2003;163(20):2500–2504.
- ,,, et al.The use of transition cost accounting system in health services research.Cost Eff Resour Alloc.2007;5:11.
- Society of Hospital Medicine. Definition of a Hospitalist. Available at: http://www.hospitalmedicine.org/AM/Template.cfm?Section=General_Information335(7):514–517.
- ,,, et al.Selection of patients for early discharge or outpatient care after acute upper gastrointestinal haemorrhage. National Audit of Acute Upper Gastrointestinal Haemorrhage.Lancet.1996;347(9009):1138–1140.
- ,,, et al.Utilization of health care resources for low‐risk patients with acute, nonvariceal upper GI hemorrhage: an historical cohort study.Gastrointest Endosc.2002;55(3):321–327.
- ,.Incremental value of upper endoscopy for triage of patients with acute non‐variceal upper‐GI hemorrhage.Gastrointest Endosc.2004;60(1):9–14.
- ,,, et al.The Charlson comorbidity index is adapted to predict costs of chronic disease in primary care patients.J Clin Epidemiol.2008;61(12):1234–1240.
- ,,, et al.The effectiveness of early endoscopy for upper gastrointestinal hemorrhage: a community‐based analysis.Med Care.1998;36(4):462–474.
- ,,, et al.Early endoscopy in upper gastrointestinal hemorrhage: associations with recurrent bleeding, surgery, and length of hospital stay.Gastrointest Endosc.1999;49(2):145–152.
- ,.The impact of hospitalists on the cost and quality of inpatient care in the united states: a research synthesis.Med Care Res Rev.2005;62(4):379–406.
- ,,, et al.Physician specialty and variations in the cost of treating patients with acute upper gastrointestinal bleeding.Gastroenterology.1997;113(5):1443–1448.
- ,,, et al.Impact of physician specialty on the cost of nonvariceal upper GI bleeding care.Am J Gastroenterol.2002;97(6):1535–1542.
- ,,.Associations with reduced length of stay and costs on an academic hospitalist service.Am J Manag Care.2004;10(8):561–568.
Acute upper gastrointestinal hemorrhage (UGIH) is one of the most common hospital admissions for acute care. Estimates indicate that 300,000 patients (100‐150 cases per 100,000 adults) are admitted annually with an associated economic impact of $2.5 billion.15 The current standard management of UGIH requires hospital admission and esophagogastroduodenoscopy (EGD) by a gastroenterologist for diagnosis and/or treatment. This management strategy results in a high consumption of hospital resources and costs.
Simultaneously, hospitalists have dramatically changed the delivery of inpatient care in the United States and are recognized as a location‐driven subspecialty for the care of acute hospitalized patients, similar to emergency medicine. Currently there are 20,000 hospitalists, and more than one‐third of general medicine inpatients are cared for by hospitalists.6, 7
Previous studies have shown that hospitalist care offers better or comparable outcomes, with lower overall length of stay (LOS) and costs compared to traditional providers.810 However, most of these studies were performed in single institutions, had weak designs or little‐to‐no adjustment for severity of illness, or were limited to 7 specific diseases (pneumonia, congestive heart failure [CHF], chest pain, ischemic stroke, urinary tract infection, chronic obstructive lung disease [COPD], and acute myocardial infarction [AMI]).8
Furthermore, less is known about the effect of hospitalists on conditions that may be dependent upon specialist consultation for procedures and/or treatment plans. In this study, gastroenterologists performed diagnostic and/or therapeutic endoscopy work as consultants to the attending physicians in the management of acute inpatient UGIH.
To explore the effects of hospitalists on care of patients with acute UGIH, we examined data from the Multicenter Hospitalist (MCH) trial. The objectives of our study were to compare clinical outcomesin‐hospital mortality and complications (ie, recurrent bleeding, intensive care unit [ICU] transfer, decompensation, transfusion, reendoscopy, 30‐day readmission)and efficiency (LOS and costs) in hospitalized acute UGIH patients cared for by hospitalists and nonhospitalists in 6 academic centers in the United States during a 2‐year period.
Patients and Methods
Study Sites
From July 1, 2001 to June 30, 2003, the MCH trial1113 was a prospective, multicenter, observational trial of the care provided by hospitalists to patients admitted to general medical services at 6 academic medical institutions. There were 31,000 consecutive admissions to the general medical services of these participating sites: University of Chicago (Chicago, IL), University of Wisconsin Hospital (Madison, WI), University of Iowa (Iowa City, IA), University of California at San Francisco (San Francisco, CA), University of New Mexico (Albuquerque, NM), and Brigham and Women's Hospital (Boston, MA). The study was approved by the institutional review boards (IRBs) at each of the 6 participating institutions.
MCH Study Patients
Patients were eligible if they were admitted to the general medical services under the care of a hospitalist or nonhospitalist physician. Regardless of the admitting provider, each medical service was composed of rotating senior and junior resident physicians in all 6 sites. Furthermore, patients were 18 years of age or older, and were able to give consent themselves or had an appropriate proxy. Patients with mini‐mental status score of 17 (out of 22), admitted under their primary care physician or to an inpatient gastroenterology service, or transferred from another hospital, were excluded. The MCH study was designed to study the outcomes and efficiency in patients admitted for CHF, pneumonia, UGIH, and end‐of‐life care.
Acute UGIH Patients
Within the MCH‐eligible patients, we identified those with acute UGIH using the following International Classification of Diseases, 9th edition (ICD‐9) codes assigned at discharge: esophageal varices with hemorrhage (456.0, 456.20); Mallory‐Weiss syndrome (530.7); gastric ulcer with hemorrhage (531.00531.61); duodenal ulcer with hemorrhage (532.00532.61); peptic ulcer, site unspecified, with hemorrhage (533.00533.61); gastrojejunal ulcer with hemorrhage (534.00534.61); gastritis with hemorrhage (535.61); angiodysplasia of stomach/duodenum with hemorrhage (537.83); and hematemesis (578.0, 578.9). We also confirmed the diagnosis of UGIH by reviewing patient medical records for observed hematemesis, nasogastric tube aspirate with gross or hemoccult blood, or clinical history of hematemesis, melena, or hematochezia.14, 15
Data
All data were obtained from the 6 hospitals' administrative records, patient interviews, and medical chart abstractions. Dates of admission and discharge, ICD‐9 diagnosis codes, insurance type, age, race, and gender were obtained from administrative data. One‐month follow‐up telephone interviews assessed whether or not patient had any follow‐up appointment or hospital readmissions. Trained abstractors from each site performed manual chart reviews using a standard data collection sheet. The ICD‐9 code designation and chart abstraction methodology were developed prior to the initiation of the study to ensure consistent data collection and reduce bias.
The following data elements were collected: comorbidities, endoscopic findings, inpatient mortality, clinical evidence of rebleeding, endoscopic treatment or gastrointestinal (GI) surgery to control bleeding, repeat EGD, ICU transfer, decompensated comorbid illness requiring continued hospitalization, and blood transfusion (packed red cells, plasma, platelets). Clinical evidence of rebleeding was defined as either hematemesis or melena with decrease in hemoglobin of 2 g in 24 hours with or without hemodynamic compromise.14, 15 For the purpose of this study, recurrent bleeding was defined as clinical evidence of rebleeding, emergency GI surgery for control of UGIH, or repeat EGD before discharge. Furthermore, a composite endpoint termed total complications encompassed all adverse outcomes related to the UGIH hospitalization. The 30‐day readmission variable was defined using readmission identified in administrative records and a 30‐day follow‐up phone call. To guard against recall bias, self‐report data was only included for nonsite admissions.
We defined efficiency in terms of costs and LOS. Total hospital costs were measured using the TSI cost accounting system (Transition Systems, Inc., Boston, MA; now Eclipsys Corporation)16, 17 at 5 out of the 6 participating sites. TSI is a hospital cost accounting software system that integrates resource utilization and financial data already recorded in other hospital databases (such as the billing system, payroll system, and general ledger system).17 Hospital LOS was defined as the number of days from patient admission to the general medicine service until patient discharge.
Provider Specialization: Hospitalists vs. Nonhospitalists
The study was designed as a natural experiment based on a call cycle. The hospitalist‐led teams at each institution alternated in a 4‐day or 5‐day general medicine call cycle with teams led by traditional academic internal medicine attending physicians. All patients were assigned to teams according to their position in the call cycle without regard to whether the attending physician was a hospitalist or a nonhospitalist. Hospitalists are physicians whose primary professional focus is the general medical care of hospitalized patients.18, 19 As previously reported in a related MCH work,11 a hospitalist was also defined as a provider who spends at least 25% of his or her time on an academic inpatient general medicine service. Nonhospitalist physicians were most often outpatient general internal medicine faculty or subspecialists, who attended 1 month per year. Physicians were classified as hospitalists or nonhospitalists according to the designations provided by each site.
UGIH‐specific Confounders
From chart abstraction, we captured severity of illness, comorbidity, and performance of early EGD, variables that can confound analysis in UGIH. To capture severity of illness, a complete Rockall risk score was calculated for each patient. The complete Rockall uses 3 clinical variables (age, shock, and comorbidity) and 2 endoscopic variables (endoscopic diagnosis and stigmata of recent hemorrhage).5, 20 A complete Rockall score of 2 is considered low‐risk for rebleeding or death following admission.21, 22 The accepted definition of low‐risk is <5% recurrent bleeding and <1% mortality risk. A complete Rockall score of 3 to 5 is considered moderate‐risk while 6 is considered high‐risk. Comorbidity was measured using the Charlson comorbidity index.23 Performance of early endoscopy, usually defined as endoscopy performed within 24 hours from presentation, was previously shown to decrease LOS and need for surgical intervention in patients with acute UGIH.24, 25 Documented times of presentation to the emergency department and time of endoscopy performance were collected to calculate for the rate of early endoscopy in our study population.
Statistical Analysis
All statistical analyses were performed using SAS Version 9.1 for Windows (SAS Institute, Cary, NC).
Differences in baseline demographic characteristics of patients and their endoscopic findings were compared between the 2 types of providers. Univariate analyses were also performed to compare the differences in adverse outcomes, LOS, and costs between patients cared for by hospitalists and nonhospitalists. Chi‐square tests were used for categorical variables; while both Wilcoxon rank sum test and Student's t test were used in the analysis of continuous variables.
Next, we performed multivariable analyses to determine the independent association between hospitalist care and the odds of the patients having certain outcomes. However, to prevent overfitting, we only developed regression models for adverse outcomes that have at least 20% event rate.
Multivariable regression models were developed separately for LOS and costs. In contrast with the models on outcomes, analyses of LOS and costs were restricted to: (1) patients who were discharged alive; and (2) to cases with LOS and costs values within 3 standard deviations (SDs) of the mean because of the skewed nature of these data.
All models were adjusted for age, gender, race, insurance type, complete Rockall risk score, performance of early EGD, Charlson comorbidity index, and study site. Final candidate variables in the models were chosen based on stepwise selection, a method very similar to forward selection except that variables selected for the model do not necessarily remain in the model. Effects were entered into and then removed from the model in such a way that each forward selection step can be followed by 1 or more backward elimination steps. The stepwise selection was terminated if no further effect can be added to the model or if the current model was identical to the previous model. The stepwise selection model was generated using statistical criterion of alpha = 0.05 for entry and elimination from the model. Variables that can be a profound source of variation, such as study site and treating physician, were included in the model irrespective of their statistical significance.
To account for clustering of patients treated by the same physician, we used multilevel modeling with SAS PROC GLIMMIX (with random effects). For outcomes (categorical variables), we utilized models with logit‐link and binomial‐distributed errors. As for efficiency (continuous variables with skewed distribution), the multivariable analyses used a generalized linear model with log‐link and assuming gamma‐distributed errors.
Results
Patient Characteristics and Endoscopic Diagnoses
Out of 31,000 patients, the study identified a total of 566 patients (1.8%) with acute UGIH (Table 1). However, 116 patients transferred from another hospital were excluded as their initial management was provided elsewhere, giving a final study sample of 450 patients. Overall, there are 163 admitting physicians from 6 sites, with 39 (24%) classified as hospitalists and 124 (76%) as nonhospitalists. Forty‐two percent (177/450) of patients were cared for by hospitalists. Compared to nonhospitalists, patients admitted to the hospitalist service were older (62.8 vs. 57.7 years, P < 0.01) and with third‐party payor mix differences (P < 0.01). However, there were no statistical differences between patients attended by hospitalists and nonhospitalists with regard to Complete Rockall risk score, Charlson comorbidity index, performance of early endoscopy, and mean hemoglobin values on admission. Upper endoscopy was performed in all patients with distribution of the 3 most common diagnoses being similar (P > 0.05) between hospitalists and nonhospitalists: erosive disease (49.7% vs. 54.6%), peptic ulcer disease (PUD) (48% vs. 46.9%), and varices (18.6% vs. 14.7%).
| Variable | Admitting Service | P | |
|---|---|---|---|
| Hospitalist (n = 177) | Nonhospitalist (n = 273) | ||
| |||
| Age, years (meanSD) | 62.817.4 | 57.718.5 | <0.01 |
| Male sex, n (%) | 104 (58.8) | 169 (61.9) | 0.50 |
| Ethnicity, n (%) | 0.13 | ||
| White | 83 (46.9) | 102 (37.4) | |
| African‐American | 34 (19.2) | 75 (27.5) | |
| Hispanic | 21 (11.9) | 40 (14.7) | |
| Asian/Pacific Islander | 24 (13.6) | 29 (10.6) | |
| Others/unknown | 15 (8.5) | 27 (9.9) | |
| Insurance, n (%) | <0.01 | ||
| Medicare | 86 (48.6) | 104 (38.1) | |
| Medicaid | 15 (8.5) | 33 (12.1) | |
| No payer | 18 (10.2) | 36 (13.2) | |
| Private | 46 (26) | 52 (19.1) | |
| Unknown | 12 (6.8) | 48 (17.5) | |
| Charlson Comorbidity Index (meanSD) | 1.91.6 | 1.81.7 | 0.51 |
| Complete Rockall, n (%) | 0.11 | ||
| Low‐risk (0‐2) | 82 (46.3) | 103 (37.7) | |
| Moderate‐risk (3‐5) | 71 (40.1) | 137 (50.2) | |
| High‐risk (6) | 24 (14.6) | 33 (12.1) | |
| Early endoscopy (<24 hours) | 82 (46.3) | 133 (48.7) | 0.62 |
| Endoscopic diagnosis, n (%)* | |||
| Erosive disease | 88 (49.7) | 149 (54.6) | 0.31 |
| Peptic ulcer disease | 85 (48.0) | 128 (46.9) | 0.81 |
| Varices | 33 (18.6) | 40 (14.7) | 0.26 |
| Mallory‐Weiss tear | 9 (5.1) | 21 (7.7) | 0.28 |
| Angiodysplasia | 9 (5.1) | 13 (4.8) | 0.88 |
| GI mass | 1 (0.6) | 4 (1.5) | 0.65 |
| Normal | 7 (4.0) | 8 (2.9) | 0.55 |
| Admission hemoglobin values (meanSD) | 10.22.9 | 10.22.9 | 0.78 |
Clinical Outcomes
Between hospitalists and nonhospitalists, unadjusted outcomes were similar (P > 0.05) for mortality (2.3% vs. 0.4%), recurrent bleeding (11% vs. 11%), need for endoscopic therapy (24% vs. 22%), ICU‐transfer and decompensation (15% vs. 15%), as well as an overall composite measure of any complication (79% vs. 72%) (Table 2). However, the hospitalist‐led teams performed more blood transfusions (74% vs. 63%, P = 0.02) and readmission rates were higher (7.3% vs. 3.3%, P = 0.05).
| Outcomes, n (%) | Admitting Service | P | |
|---|---|---|---|
| Hospitalist (n = 177) | Nonhospitalist (n = 273) | ||
| |||
| Inpatient mortality | 4 (2.3) | 1 (0.4) | 0.08 |
| Recurrent bleeding* | 20 (11.3) | 29 (10.6) | 0.88 |
| Endoscopic therapy | 43 (24.3) | 60 (22.0) | 0.57 |
| ICU transfers | 23 (13) | 24 (8.8) | 0.20 |
| Decompensated comorbidities that required continued hospitalization | 26 (14.7) | 41 (15.0) | 0.92 |
| Any transfusion | 131 (74.0) | 172 (63.0) | 0.02 |
| Total complications | 139 (78.5) | 196 (71.8) | 0.11 |
| 30‐day all‐cause readmissions | 13 (7.3) | 9 (3.3) | 0.05 |
| Efficiency | Hospitalist (n = 164) | Nonhospitalist (n = 259) | P |
| LOS, days | |||
| MeanSD | 4.83.5 | 4.53.0 | 0.30 |
| Median (interquartile range) | 4 (36) | 4 (26) | 0.69 |
| Total costs, U.S. $ | |||
| MeanSD | 10,466.669191.00 | 7926.716065.00 | <0.01 |
| Median (interquartile range) | 7359.00 (4,698.0012,550.00) | 6181.00 (3744.0010,344.00) | <0.01 |
Because of the low event rate of certain adverse outcomes (<20%), we were only able to perform adjusted analyses on 4 outcomes: need for endoscopic therapy (odds ratio [OR], 0.82; 95% confidence interval [CI], 0.491.37), ICU transfer and decompensation (OR, 0.82; 95% CI, 0.451.52), blood transfusion (OR, 1.30; 95% CI, 0.822.04), and any complication (OR, 1.18; 95% CI, 0.711.96). Since outcome differences disappeared after controlling for confounders, the data suggest that overall care provided by hospitalists and nonhospitalists might be equivalenteven in certain outcomes that we were unable to substantiate using multivariable methods.
Efficiency
Efficiency, as measured by LOS and costs, are presented both as means and medians in univariate analyses in Table 2. Median LOS was similar for hospitalist‐led and nonhospitalist‐led teams (4 days). Despite having similar LOS, the median costs of acute UGIH in patients cared for by hospitalists were higher ($7,359.00 vs. $6,181.00; P < 0.01).
After adjusting for demographic factors, Rockall risk score, comorbidity, early EGD, and hospital site, LOS remained similar between the 2 groups. On the other hand, the adjusted cost for UGIH patients cared for by hospitalists and nonhospitalists persisted, with hospitalist care costs $1,502.40 more than their nonhospitalist counterparts (Table 3).
| Efficiency | Treatment Provider | P | |
|---|---|---|---|
| Hospitalist (n = 164) | Nonhospitalist (n = 259) | ||
| |||
| Adjusted length of stay, days (mean SD) | 5.2 (4.95.6) | 4.7 (4.55.0) | 0.15 |
| Adjusted total cost, U.S. $ (mean SD) | 9006.50 (8366.609693.60) | 7504.10 (7069.907964.20) | 0.03 |
Discussion
This is the first study that has looked at the effect of hospitalists on clinical outcomes and efficiency in patients admitted for acute UGIH, a condition highly dependent upon another specialty for procedures and management. This is also one of only a few studies on UGIH that adjusted for severity of illness (Rockall score), comorbidity, performance of early endoscopypatient‐level confounders usually unaccounted for in prior research.
We show that hospitalists and nonhospitalists caring for acute UGIH patients had overall similar unadjusted outcomes; except for blood transfusion and 30‐day readmission rates. Unfortunately, due to the small number of events for readmissions, we were unable to perform adjusted analysis for readmission. Differences between hospitalists and nonhospitalists on blood transfusion rates were not substantiated on multivariable adjustments.
As for efficiency, univariable and multivariable analyses revealed that LOS was similar between provider types while costs were greater in UGIH patients attended by hospitalists.
Reductions in resource use, particularly costs, may be achieved by increasing throughput (eg, reducing LOS) or by decreasing service intensity (eg, using fewer ancillary services and specialty consultations).26 Specifically in acute UGIH, LOS is significantly affected by performance of early EGD.27, 28 In these studies, gastroenterologist‐led teams, compared to internists and surgeons, have easier access to endoscopy, thus reducing LOS and overall costs.27, 28
Similarly, prior studies have shown that the mechanism by which hospitalists lower costs is by decreasing LOS.810, 29 There are several hypotheses on how hospitalists affect LOS. Hospitalists, by being available all day, are thought to respond quickly to acute symptoms or new test results, are more efficient in navigating the complex hospital environment, or develop greater expertise as a result of added inpatient experience.8 On the downside, although the hospitalist model reduces overall LOS and costs, they also provide higher intensity of care as reflected by greater costs when broken down per hospital day.29 Thus, the cost differential we found may represent higher intensity of care by hospitalists in their management of acute UGIH, as higher intensity care without decreasing LOS can translate to higher costs.
In addition, patients with acute UGIH are unique in several respects. In contrast to diseases like heart failure, COPD, and pneumonia, in which the admitting provider has the option to request a subspecialist consultation, all patients with acute UGIH need a gastroenterologist to perform endoscopy as part of the management. These patients are usually admitted to general medicine wards, aggressively resuscitated with intravenous fluids, with a nonurgent gastroenterology consult or EGD performed on the next available schedule.
Aside from LOS being greatly affected by performance of early EGD and/or delay in consulting gastroenterology, sicker patients require longer hospitalization and drive LOS and healthcare costs up. It was therefore crucial that we accounted for severity of illness, comorbidity, and performance of early EGD in our regression models for LOS and costs. This approach allows us to acquire a more accurate estimate on the effects of hospitalist on LOS and costs in patients admitted with acute UGIH.
Our findings suggest that the academic hospitalist model of care may not have as great of an impact on hospital efficiency in certain patient groups that require nonurgent subspecialty consultations. Future studies should focus on elucidating these relationships.
Limitations
This study has several limitations. First, clinical data were abstracted at 6 sites by different abstractors so it is possible there were variations in how data were collected. To reduce variation, a standardized abstraction form with instructions was developed and the primary investigator (PI) was available for specific questions during the abstraction process. Second, only 5 out of the 6 sites used TSI accounting systems. Although similar, interhospital costs captured by TSI may vary among sites in terms of classifying direct and indirect costs, potentially resulting in misclassification bias in our cost estimates.17 We addressed these issues by including the hospital site variable in our regression models, regardless of its significance. Third, consent rates across sites vary from 70% to 85%. It is possible that patients who refused enrollment in the MCH trial are systematically different and may introduce bias in our analysis.
Furthermore, the study was designed as a natural experiment based on a rotational call cycle between hospitalist‐led and nonhospitalist‐led teams. It is possible that the order of patient assignment might not be completely naturally random as we intended. However, the study period was for 2 years and we expect the effect of order would have averaged out in time.
There are many hospitalist models of care. In terms of generalizability, the study pertains only to academic hospitalists and may not be applicable to hospitalists practicing in community hospitals. For example, the nonhospitalist comparison group is likely different in the community and academic settings. Community nonhospitalists (traditional practitioners) are usually internists covering both inpatient and outpatient responsibilities at the same time. In contrast, academic nonhospitalists are internists or subspecialists serving as ward attendings for a limited period (usually 1 month) with considerable variation in their nonattending responsibilities (eg, research, clinic, administration). Furthermore, academic nonhospitalist providers might be a self‐selected group by their willingness to serve as a ward attending, making them more hospitalist‐like. Changes and variability of inpatient attendings may also affect our findings when compared to prior work. Finally, it is also possible that having residents at academic medical centers may attenuate the effect of hospitalists more than in community‐based models.
Conclusions/Implications
Compared to nonhospitalists, academic hospitalist care of acute UGIH patients had similar overall clinical outcomes. However, our finding of similar LOS yet higher costs for patients cared for by hospitalists support 1 proposed mechanism in which hospitalists decrease healthcare costs: providing higher intensity of care per day of hospitalization. However, in academic hospitalist models, this higher intensity hypothesis should be revisited, especially in certain patient groups in which timing and involvement of subspecialists may influence discharge decisions, affecting LOS and overall costs.
Due to inherent limitations in this observational study, future studies should focus on verifying and elucidating these relationships further. Lastly, understanding which patient groups receive the greatest potential benefit from this model will help guide both organizational efforts and quality improvement strategies.
- ,.Bleeding peptic ulcer.N Engl J Med.1994;331(11):717–727.
- .Epidemiology of hospitalization for acute upper gastrointestinal hemorrhage: a population‐based study.Am J Gastroenterol.1995;90(2):206–210.
- ,,, et al.Variation in outcome after acute upper gastrointestinal haemorrhage. the national audit of acute upper gastrointestinal haemorrhage.Lancet.1995;346(8971):346–350.
- ,,, et al.Influencing the practice and outcome in acute upper gastrointestinal haemorrhage. Steering committee of the National Audit of Acute Upper Gastrointestinal Haemorrhage.Gut.1997;41(5):606–611.
- ,,, et al.Risk assessment after acute upper gastrointestinal haemorrhage.Gut.1996;38(3):316–321.
- ,,, et al.The potential size of the hospitalist workforce in the united states.Am J Med.1999;106(4):441–445.
- Society of Hospital Medicine. About SHM. Available at: http://www.hospitalmedicine.org/AM/Template.cfm?Section=General_Information357(25):2589–2600.
- ,,, et al.Effects of physician experience on costs and outcomes on an academic general medicine service: results of a trial of hospitalists.Ann Intern Med.2002;137(11):866–874.
- .A systematic review of outcomes and quality measures in adult patients cared for by hospitalists vs nonhospitalists.Mayo Clin Proc.2009;84(3):248–254.
- ,,, et al.Do hospitalists or physicians with greater inpatient HIV experience improve HIV care in the era of highly active antiretroviral therapy? Results from a multicenter trial of academic hospitalists.Clin Infect Dis.2008;46(7):1085–1092.
- ,,, et al.Quality of care for decompensated heart failure: comparable performance between academic hospitalists and non‐hospitalists. J Gen Intern Med.2008;23(9):1399–1406.
- ,,, et al.Factors associated with discussion of care plans and code status at the time of hospital admission: results from the Multicenter Hospitalist Study.J Hosp Med.2008;3(6):437–445.
- ,,, et al.Upper gastrointestinal hemorrhage clinical guideline determining the optimal hospital length of stay.Am J Med.1996;100(3):313–322.
- ,,, et al.Prospective evaluation of a clinical guideline recommending hospital length of stay in upper gastrointestinal tract hemorrhage.JAMA.1997;278(24):2151–2156.
- ,,, et al.In‐hospital cost of abdominal aortic aneurysm repair in Canada and the United States.Arch Intern Med.2003;163(20):2500–2504.
- ,,, et al.The use of transition cost accounting system in health services research.Cost Eff Resour Alloc.2007;5:11.
- Society of Hospital Medicine. Definition of a Hospitalist. Available at: http://www.hospitalmedicine.org/AM/Template.cfm?Section=General_Information335(7):514–517.
- ,,, et al.Selection of patients for early discharge or outpatient care after acute upper gastrointestinal haemorrhage. National Audit of Acute Upper Gastrointestinal Haemorrhage.Lancet.1996;347(9009):1138–1140.
- ,,, et al.Utilization of health care resources for low‐risk patients with acute, nonvariceal upper GI hemorrhage: an historical cohort study.Gastrointest Endosc.2002;55(3):321–327.
- ,.Incremental value of upper endoscopy for triage of patients with acute non‐variceal upper‐GI hemorrhage.Gastrointest Endosc.2004;60(1):9–14.
- ,,, et al.The Charlson comorbidity index is adapted to predict costs of chronic disease in primary care patients.J Clin Epidemiol.2008;61(12):1234–1240.
- ,,, et al.The effectiveness of early endoscopy for upper gastrointestinal hemorrhage: a community‐based analysis.Med Care.1998;36(4):462–474.
- ,,, et al.Early endoscopy in upper gastrointestinal hemorrhage: associations with recurrent bleeding, surgery, and length of hospital stay.Gastrointest Endosc.1999;49(2):145–152.
- ,.The impact of hospitalists on the cost and quality of inpatient care in the united states: a research synthesis.Med Care Res Rev.2005;62(4):379–406.
- ,,, et al.Physician specialty and variations in the cost of treating patients with acute upper gastrointestinal bleeding.Gastroenterology.1997;113(5):1443–1448.
- ,,, et al.Impact of physician specialty on the cost of nonvariceal upper GI bleeding care.Am J Gastroenterol.2002;97(6):1535–1542.
- ,,.Associations with reduced length of stay and costs on an academic hospitalist service.Am J Manag Care.2004;10(8):561–568.
Copyright © 2010 Society of Hospital Medicine