User login
Burnout and Work‐Life Balance
An increasingly robust body of literature has identified burnout as a substantial problem for physicians across specialties and practice settings.[1, 2, 3, 4] Burnout, a work‐related condition characterized by emotional exhaustion, depersonalization, and lack of a sense of personal accomplishment,[5] has been tied to negative consequences for patients, physicians, and the medical profession including medical errors,[6] poor physician health,[7, 8] and decreased professionalism.[9] Studies of burnout among general internists have pointed to time pressures, lack of work control, and difficult patient encounters as possible contributors.[10, 11]
Burnout has been demonstrated to affect a sizable proportion of hospitalists, with prevalence estimates from prior studies varying from 12.9% to 27.2%, although nearly all studies of US hospitalists have relied on single‐item instruments.[12, 13, 14, 15] Hospital‐based physicians have represented a rapidly expanding segment of the internist workforce for more than a decade,[14] but studies of the impact of inpatient vs outpatient practice location on burnout and career satisfaction are limited. A meta‐analysis of the impact of practice location on burnout relied almost exclusively on noncomparative studies from outside the United States.[15] A recent study of US physician burnout and satisfaction with work‐life balance showed that general internists expressed below average satisfaction with work‐life balance and had the second highest rate of burnout among 24 specialties.[4] However, this report did not differentiate between general internists working in inpatient vs outpatient settings.
We therefore examined burnout, satisfaction with work‐life balance, and other aspects of well‐being among internal medicine hospitalists relative to outpatient general internists, using a national sample developed in partnership with the American Medical Association.
METHODS
Physician Sample
As described previously,[4] the American Medical Association Physician Masterfile, a nearly complete record of US physicians, was used to generate a sample of physicians inclusive of all specialty disciplines. The 27,276 physicians who opened at least 1 invitation e‐mail were considered to have received the invitation to participate in the study. Participation was voluntary, and all responses were anonymous. For this analysis, internal medicine hospitalists were compared with general internists reporting primarily outpatient practices. The physician sample provided information on demographics (age, sex, and relationship status) and on characteristics of their practice. Burnout, symptoms of depression, suicidal ideation in the past 12 months, quality of life (QOL), satisfaction with work‐life balance, and certain health behaviors were evaluated as detailed below.
Burnout
Burnout among physicians was measured using the Maslach Burnout Inventory (MBI), a validated 22‐item questionnaire considered the gold standard tool for measuring burnout.[5, 16] The MBI has subscales to evaluate each domain of burnout: emotional exhaustion, depersonalization, and low personal accomplishment. Because other burnout studies have focused on the presence of high levels of emotional exhaustion or depersonalization as the foundation of burnout in physicians,[17, 18, 19] we considered physicians with a high score on the depersonalization or emotional exhaustion subscales to have at least 1 manifestation of professional burnout.
Symptoms of Depression and Suicidal Ideation
Symptoms of depression were assessed using the 2‐item Primary Care Evaluation of Mental Disorders,[20] a standardized and validated assessment for depression screening that performs as well as longer instruments.[21] Recent suicidal ideation was evaluated by asking participants, During the past 12 months, have you had thoughts of taking your own life? This item was designed to measure somewhat recent, but not necessarily active, suicidal ideation. These questions have been used extensively in other studies.[22, 23, 24, 25]
Quality of Life and Fatigue
Overall QOL and mental, physical, and emotional QOL were measured by a single‐item linear analog scale assessment. This instrument measured QOL on a 0 (as bad as it can be) to 10 (as good as it can be) scale validated across a wide range of medical conditions and populations.[26, 27, 28] Fatigue was measured using a similar standardized linear analog scale assessment question, for which respondents indicated their level of fatigue during the past week.[29] The impact of fatigue on daily activities such as driving was also evaluated.
Satisfaction With Work‐Life Balance and Career Plans
Satisfaction with work‐life balance was assessed by the item, My work schedule leaves me enough time for my personal/family life, with response options strongly agree, agree, neutral, disagree, or strongly disagree. Individuals who indicated strongly agree or agree were considered to be satisfied with their work‐life balance, whereas those who indicated strongly disagree or disagree were considered to be dissatisfied with their work‐life balance. Experience of work‐home conflicts was assessed as in prior research.[4] Participants were also asked about plans to change jobs or careers.
Health Behaviors
A limited set of health and wellness behaviors was addressed in the survey to provide insight into other aspects of physician well‐being. These included whether respondents had a primary care provider and questions concerning routine screening and alcohol and substance use. Alcohol use was assessed using the Alcohol Use Disorders Identification Test, version C (AUDIT‐C).[30] An AUDIT‐C score of at least 4 for men and at least 3 for women indicates alcohol misuse, and a score of at least 5 for men and at least 4 for women indicates alcohol abuse and possible dependence.[30]
Statistical Analysis
Standard descriptive summary statistics were used to characterize the physician samples. Associations between variables were evaluated using the Kruskal‐Wallis test (for continuous variables) or [2] test (for categorical variables). All tests were 2‐sided, with a type I error level of 0.05. Multivariate analysis of differences between hospitalists and outpatient general internists was performed using multiple linear or logistic regression for continuous or categorical data, respectively. Covariates in these models included age, sex, weekly work hours, and practice setting. All of the analyses were performed using SAS version 9.2 (SAS Institute, Inc., Cary, NC).
RESULTS
In the full survey across all specialties, 7288 physicians (26.7%) provided survey responses.[4] There were 448 outpatient internists and 130 internal medicine hospitalists who agreed to participate. Demographically, hospitalists were younger, worked longer hours, and were less likely to work in private practice than outpatient general internists (Table 1).
| Characteristic | Hospitalists (n=130) | Outpatient General Internists (n=448) | P |
|---|---|---|---|
| |||
| Sex, n (%) | 0.56 | ||
| Male | 86 (66.2%) | 284 (63.4%) | |
| Female | 44 (33.8%) | 164 (36.6%) | |
| Age, mean (SD) | 46.9 (12.4) | 53.6 (10.2) | <0.001 |
| Median | 45.0 | 55.0 | |
| Years in practice, mean (SD) | 14.0 (12.0) | 21.6 (10.7) | <0.001 |
| Median | 10.0 | 22.0 | |
| Hours worked per week, mean (SD) | 55.0 (18.1) | 50.0 (15.1) | 0.04 |
| Median | 50.0 | 50.0 | |
| Practice setting, n (%) | <0.001 | ||
| Private practice/hospital | 36 (31.0%) | 303 (69.2%) | |
| Academic medical center | 37 (31.9%) | 41 (9.4%) | |
| Other (including veterans hospital and active military practice) | 43 (37.1%) | 94 (21.5%) | |
Distress and Well‐Being Variables
High levels of emotional exhaustion affected 43.8% of hospitalists and 48.1% of outpatient general internists (odds ratio [OR]: 0.91, 95% confidence interval [CI]: 0.56‐1.48), and high levels of depersonalization affected 42.3% of hospitalists and 32.7% of outpatient general internists (OR: 1.42, 95% CI: 0.86‐2.35). Overall burnout affected 52.3% of hospitalists and 54.5% of outpatient general internists (OR: 0.96, 95% CI: 0.58‐1.57). None of these factors differed statistically in multivariate models adjusted for factors known to be associated with burnout, including sex, age, weekly work hours, and practice setting (P=0.71, 0.17, and 0.86, respectively; Table 2). However, low levels of personal accomplishment were reported by 20.3% of hospitalists and 9.6% of outpatient general internists (OR: 1.93, 95% CI: 1.023.65, P=0.04).
| Variable | Hospitalists (n=130) | Outpatient General Internists (n=448) | Pa |
|---|---|---|---|
| |||
| Burnout | |||
| Emotional exhaustion high (27) | 57/130 (43.8%) | 215/447 (48.1%) | 0.71 |
| Mean (SD) | 24.7 (12.5) | 25.4 (14.0) | |
| Median | 24.9 | 26.0 | |
| Depersonalization high (10) | 55/130 (42.3%) | 146/447 (32.7%) | 0.17 |
| Mean (SD) | 9.1 (6.9) | 7.5 (6.3) | |
| Median | 7.0 | 6.0 | |
| Personal accomplishment low (33) | 26/128 (20.3%) | 43/446 (9.6%) | 0.04 |
| Mean (SD) | 39.0 (7.6) | 41.4 (6.0) | |
| Median | 41.0 | 43.0 | |
| High burnout (EE27 or DP10) | 68/130 (52.3%) | 244/448 (54.5%) | 0.86 |
| Depression | |||
| Depression screen + | 52/129 (40.3%) | 176/440 (40.0%) | 0.73 |
| Suicidal thoughts in past 12 months | 12/130 (9.2%) | 26/445 (5.8%) | 0.15 |
| Quality of life | |||
| Overall mean (SD) | 7.3 (2.0) | 7.4 (1.8) | 0.85 |
| Median | 8.0 | 8.0 | |
| Low (<6) | 21/130 (16.2%) | 73/448 (16.3%) | |
| Mental mean (SD) | 7.2 (2.1) | 7.3 (2.0) | 0.89 |
| Median | 8.0 | 8.0 | |
| Low (<6) | 23/130 (17.7%) | 92/448 (20.5%) | |
| Physical mean (SD) | 6.7 (2.3) | 6.9 (2.1) | 0.45 |
| Median | 7.0 | 7.0 | |
| Low (<6) | 35/130 (26.9%) | 106/448 (23.7%) | |
| Emotional mean (SD) | 7.0 (2.3) | 6.9 (2.2) | 0.37 |
| Median | 7.0 | 7.0 | |
| Low (<6) | 30/130 (23.1%) | 114/448 (25.4%) | |
| Fatigue | |||
| Mean (SD) | 5.8 (2.4) | 5.9 (2.4) | 0.57 |
| Median | 6.0 | 6.0 | |
| Fallen asleep while driving (among regular drivers only) | 11/126 (8.7%) | 19/438 (4.3%) | 0.23 |
Approximately 40% of physicians in both groups screened positive for depression (OR: 0.92, 95% CI: 0.56‐1.51, P=0.73). In addition, 9.2% of hospitalists reported suicidal ideation in the last 12 months compared to 5.8% of outpatient internists (OR: 1.86, 95% CI: 0.80‐4.33, P=0.15) (Table 2).
Overall QOL and QOL in mental, physical, and emotional domains were nearly identical in the 2 groups (Table 2). Fatigue was also similar for hospitalists and outpatient general internists, and 8.5% of hospitalists reported falling asleep in traffic while driving compared to 4.2% of outpatient internists (OR: 1.76, 95% CI: 0.70‐4.44, P=0.23).
Work‐Life Balance and Career Variables
Experience of recent work‐home conflicts was similar for hospitalists and outpatient general internists (Table 3). However, hospitalists were more likely to agree or strongly agree that their work schedule leaves enough time for their personal life and family (50.0% vs 42.0%, OR: 2.06, 95% CI: 1.22‐3.47, P=0.007).
| Variable | Hospitalists (n=130) | Outpatient General Internists (n=448) | Pa |
|---|---|---|---|
| |||
| Work‐home conflict in last 3 weeks | 62/128 (48.4%) | 183/443 (41.3%) | 0.64 |
| Work‐home conflict resolved in favor of: | 0.79 | ||
| Work | 37/118 (31.4%) | 131/405 (32.2%) | |
| Home | 15/118 (12.7%) | 43/405 (10.6%) | |
| Meeting both needs | 66/118 (55.9%) | 231/405 (57.0%) | |
| Work schedule leaves enough time for personal life/family | 0.007 | ||
| Strongly agree | 20 (15.4%) | 70 (15.7%) | |
| Agree | 45 (34.6%) | 117 (26.3%) | |
| Neutral | 21 (16.2%) | 66 (14.8%) | |
| Disagree | 27 (20.8%) | 119 (26.7%) | |
| Strongly disagree | 17 (13.1%) | 73 (16.4%) | |
| Missing | 0 | 3 | |
| Likelihood of leaving current practice | 0.002 | ||
| Definite | 17 (13.1%) | 34 (7.6%) | |
| Likely | 21 (16.2%) | 53 (11.9%) | |
| Moderate | 21 (16.2%) | 67 (15.0%) | |
| Slight | 38 (29.2%) | 128 (28.7%) | |
| None | 33 (25.4%) | 164 (36.8%) | |
| Missing | 0 | 2 | |
| Would choose to become physician again | 81/130 (62.3%) | 306/441 (69.4%) | 0.86 |
Hospitalists were more likely to express interest in leaving their current practice in the next 2 years, with 13.1% vs 7.6% reporting definite plans to leave and 29.2% vs 19.5% reporting at least likely plans to leave (OR: 2.31, 95% CI: 1.35‐3.97, P=0.002). Among those reporting a likely or definite plan to leave, hospitalists were more likely to plan to look for a different practice and continue to work as a physician (63.2% vs 39.1%), whereas outpatient general internists were more likely to plan to leave medical practice (51.9% vs 22.0%, P=0.004). Hospitalists with plans to reduce their work hours were more likely than their outpatient colleagues to express an interest in administrative and leadership roles (19.4% vs 12.1%) or research and educational roles (9.7% vs 4.0%, P=0.05).
Health Behavior Variables
Hospitalists were less likely to report having a primary care provider in the adjusted analyses (55.0% vs 70.3%, OR: 0.49, 95% CI: 0.29‐0.83, P=0.008). Use of illicit substances was uncommon in both groups (94.6% of hospitalists and 96.0% of outpatient general internists reported never using an illicit substance (OR: 0.87, 95% CI: 0.31‐2.49, P=0.80). Symptoms of alcohol abuse were similar between the 2 groups (11.7% and 13.3%, respectively, OR: 0.64, 95% CI: 0.30‐1.35, P=0.24), but symptoms of alcohol misuse were more common among outpatient general internists (34.2% vs 21.9%, OR: 1.75, 95% CI: 1.013.03, P=0.047).
DISCUSSION
The primary result of this national study applying well‐validated metrics is that the overall rates of burnout among hospitalists and outpatient general internal medicine physicians were similar, as were rates of positive depression screening and QOL. Although these groups did not differ, the absolute rates of distress found in this study were high. Prior research has suggested that possible explanations for these high rates of distress include excessive workload, loss of work‐associated control and meaning, and difficulties with work‐home balance.[4] The present study, in the context of prior work showing that general internists have higher rates of burnout than almost any other specialty, suggests that the front‐line nature of the work of both hospitalists and outpatient general internists may exacerbate these previously cited factors. These results suggest that efforts to address physician well‐being are critically needed for both inpatient and outpatient physicians.
Despite the noted similarities, differences between hospitalists and outpatient general internists in certain aspects of well‐being merit further attention. For example, the lower rate of personal accomplishment among hospitalists relative to outpatient generalists is consistent with prior evidence.[15] The reasons for this difference are unknown, but the relative youth and inexperience of the hospitalists may be a factor. US hospitalists have been noted to feel like glorified residents in at least 1 report,[31] a factor that might also negatively impact personal accomplishment.
It is also worthwhile to place the burnout results for both groups in context with prior studies. Although we found high rates of burnout among outpatient physicians, our outpatient sample's mean MBI subset scores are not higher than previous samples of American[32] and Canadian[33] outpatient physicians, suggesting that this finding is neither new nor artifactual. Placing the hospitalist sample in perspective is more difficult, as very few studies have administered the MBI to US hospitalists, and those that have either administered 1 component only to an exclusive academic sample[34] or administered it to a small mixture of hospitalists and intensivists.[35] The prevalence of burnout we report for our hospitalist sample is higher than that reported by studies that utilized single‐item survey items1214; it is likely that the higher prevalence we report relates more to a more detailed assessment of the components of burnout than to a temporal trend, although this cannot be determined definitively from the data available.
The finding that 9.2% of hospitalists and 5.8% of outpatient general internists reported suicidal thoughts in the past 12 months is alarming, though consistent with prior data on US surgeons.[35] Although the higher rate of suicidal thoughts among hospitalists was not statistically significant, a better understanding of the factors associated with physician suicidality should be the focus of additional research.
Hospitalists were more likely than outpatient internists to report plans to leave their current practice in this study, although their plans after leaving differed. The fact that they were more likely to report plans to find a different role in medicine (rather than to leave medicine entirely or retire) is likely a function of age and career stage. The finding that hospitalists with an interest in changing jobs were more likely than their outpatient colleagues to consider administrative, leadership, education, and research roles may partially reflect the greater number of hospitalists at academic medical centers in this study, but suggests that hospitalists may indeed benefit from the availability of opportunities that have been touted as part of hospitalist diastole.[36]
Finally, rates of alcohol misuse and abuse found in this study were consistent with those reported in prior studies.[37, 38, 39] These rates support ongoing efforts to address alcohol‐related issues among physicians. In addition, the proportion of outpatient general internists and hospitalists reporting having a primary care provider was similar to that seen in prior research.[40] The fact that 1 in 3 physicians in this study did not have a primary care provider suggests there is great room for improvement in access to and prioritization of healthcare for physicians in general. However, it is noteworthy that hospitalists were less likely than outpatient general internists to have a primary care provider even after adjusting for their younger age as a group. The reasons behind this discrepancy are unclear but worthy of further investigation.
Several limitations of our study should be considered. The response rate for the entire study sample was 26.7%, which is similar to other US national physician surveys in this topic area.[41, 42, 43] Demographic comparisons with national data suggest the respondents were reasonably representative of physicians nationally,[4] and all analyses were adjusted for recognized demographic factors affecting our outcomes of interest. We found no statistically significant differences in demographics of early responders compared with late responders (a standard approach to evaluate for response bias),[14, 31] further supporting that responders were representative of US physicians. Despite this, response bias remains possible. For example, it is unclear if burned out physicians might be more likely to respond (eg, due to the personal relevance of the survey topic) or less likely to respond (eg, due to being too overwhelmed to open or complete the survey).
A related limitation is the relatively small number of hospitalists included in this sample, which limits the power of the study to detect differences between the study groups. The hospitalists in this study were also relatively experienced, with a median of 10 years in practice, although the overall demographics match closely to a recent national survey of hospitalists. Although age was considered in the analyses, this study may not fully characterize burnout patterns among very junior or very senior hospitalists. In addition, although analyses were adjusted for observed differences between the study groups for a number of covariates, there may be differences between the study groups in other, unmeasured factors that could act as confounders of the observed results. For example, the allocation of each individual's time to different activities (eg, clinical, research, education, administration), workplace flexibility and control, and meaning may all contribute to distress and well‐being, and could not be assessed in this study.
In conclusion, the degree of burnout, depression, and suicidal ideation in both hospitalists and outpatient general internists is similar and substantial. Urgent attention directed at better understanding the causes of distress and identifying solutions for all internists is needed.
Acknowledgements
The authors acknowledge the role of the American Medical Association in completing this study.
Disclosures: The views expressed in this article are those of the authors and do not represent the views of, and should not be attributed to, the American Medical Association. The authors report no conflicts of interest.
- , , , , , . Stress symptoms, burnout and suicidal thoughts in Finnish physicians. Soc Psychiatry Psychiatr Epidemiol. 1990;25:81–86.
- , , , , , ; Society of General Internal Medicine (SGIM) Career Satisfaction Study Group (CSSG). Predicting and preventing physician burnout: results from the United States and the Netherlands. Am J Med. 2001;111:170–175.
- , , , et al. Burnout among psychiatrists in Milan: a multicenter study. Psychiatr Serv. 2009;60:985–988.
- , , , et al. Burnout and satisfaction with work‐life balance among US physicians relative to the general US population. Arch Intern Med. 2012;172:1377–1385.
- , . The measurement of experienced burnout. J Occup Behav. 1981;2:99–113.
- , , , et al. Burnout and medical errors among American surgeons. Ann Surg. 2010;251:995–1000.
- , , . Physician wellness: a missing quality indicator. Lancet. 2009;374:1714–1721.
- , , , , . Changes in mental health of UK hospital consultants since the mid‐1990s. Lancet. 2005;366:742–744.
- , , , et al. Relationship between burnout and professional conduct and attitudes among US medical students. JAMA. 2010;304:1173–1180.
- , , , et al.; MEMO (Minimizing Error, Maximizing Outcomes) Investigators. Working conditions in primary care: physician reactions and care quality. Ann Intern Med. 2009;151:28–36.
- , , , , , ; MEMO Investigators. Burden of difficult encounters in primary care: data from the Minimizing Error, Maximizing Outcomes study. Arch Intern Med. 2009;169:410–414.
- , , , , . Characteristics and work experiences of hospitalists in the United States. Arch Intern Med. 2001;161(6):851–858.
- , , , , , . Career satisfaction and burnout in academic hospital medicine. Arch Intern Med. 2011;25:171(8):782–785.
- , , , , ; Society of Hospital Medicine Career Satisfaction Task Force. Job characteristics, satisfaction, and burnout across hospitalist practice models. J Hosp Med. 2012;7:402–410.
- , , , , . Burnout in inpatient‐based vs outpatient‐based physicians: a systematic review and meta‐analysis. J Hosp Med. 2013;8:653–664.
- , , . Maslach Burnout Inventory Manual. 3rd ed. Palo Alto, CA: Consulting Psychologists Press; 1996.
- . Resident burnout. JAMA. 2004;292(23):2880–2889.
- , , , . Burnout and self‐reported patient care in an internal medicine residency program. Ann Intern Med. 2002;136:358–367.
- , , , . Evolution of sleep quantity, sleep deprivation, mood disturbances, empathy, and burnout among interns. Acad Med. 2006;81:82–85.
- , , , et al. Utility of a new procedure for diagnosing mental disorders in primary care: the PRIME‐MD 1000 study. JAMA. 1994;272:1749–1756.
- , , , . Case‐finding instruments for depression: two questions are as good as many. J Gen Intern Med. 1997;12:439–445.
- , , , . Attempted suicide among young adults: progress toward a meaningful estimate of prevalence. Am J Psychiatry. 1992;149:41–44.
- , , . Prevalence of and risk factors for lifetime suicide attempts in the National Comorbidity Survey. Arch Gen Psychiatry. 1999;56:617–626.
- , , , , . Trends in suicide ideation, plans, gestures, and attempts in the United States, 1990–1992 to 2001–2003. JAMA. 2005;293:2487–2495.
- , , . Identifying suicidal ideation in general medical patients. JAMA. 1994;272:1757–1762.
- , , , . Health state valuations from the general public using the visual analogue scale. Qual Life Res. 1996;5:521–531.
- , , , et al. The well‐being and personal wellness promotion strategies of medical oncologists in the North Central Cancer Treatment Group. Oncology. 2005;68:23–32.
- , , , et al. Impacting quality of life for patients with advanced cancer with a structured multidisciplinary intervention: a randomized controlled trial. J Clin Oncol. 2006;24:635–642.
- , , , , . Association of resident fatigue and distress with perceived medical errors. JAMA. 2009;302:294–300.
- , , , , . The AUDIT alcohol consumption questions (AUDIT‐C): an effective brief screening test for problem drinking. Arch Intern Med. 1998;158:1789–1795.
- , , , , . Worklife and satisfaction of hospitalists: toward flourishing careers. J Gen Intern Med. 2012;27(1):28–36.
- , , , et al. Association of an educational program in mindful communication with burnout, empathy, and attitudes among primary care physicians. JAMA. 2009;302(12):1284–1293.
- , , . Stress, burnout, and strategies for reducing them: what's the situation among Canadian family physicians? Can Fam Physician. 2008;54(2):234–235.
- , , , et al. Emotional exhaustion, life stress, and perceived control among medicine ward attending physicians: a randomized trial of 2‐ versus 4‐week ward rotations [abstract]. J Hosp Med. 2011;6(4 suppl 2):S43–S44.
- , , , et al. Special report: suicidal ideation among American surgeons. Arch Surg. 2011;146:54–62.
- , , , . Preparing for “diastole”: advanced training opportunities for academic hospitalists. J Hosp Med. 2006;1:368–377.
- , , , et al. Prevalence of substance use among US physicians. JAMA. 1992;267:2333–2339.
- , , , , . Preventive, lifestyle, and personal health behaviors among physicians. Acad Psychiatry. 2009;33:289–295.
- , , , et al. Prevalence of alcohol use disorders among American surgeons. Arch Surg. 2012;147:168–174.
- , , , . Physician, heal thyself? Regular source of care and use of preventive health services among physicians. Arch Intern Med. 2000;160:3209–3214.
- , , . Prevalence of burnout in the U.S. oncologic community: results of a 2003 survey. J Oncol Pract. 2005;1(4):140–147.
- , , , et al. Career satisfaction, practice patterns and burnout among surgical oncologists: report on the quality of life of members of the Society of Surgical Oncology. Ann Surg Oncol. 2007;14:3042–3053.
- , , , et al. Burnout and career satisfaction among American surgeons. Ann Surg. 2009;250(3):463–471.
An increasingly robust body of literature has identified burnout as a substantial problem for physicians across specialties and practice settings.[1, 2, 3, 4] Burnout, a work‐related condition characterized by emotional exhaustion, depersonalization, and lack of a sense of personal accomplishment,[5] has been tied to negative consequences for patients, physicians, and the medical profession including medical errors,[6] poor physician health,[7, 8] and decreased professionalism.[9] Studies of burnout among general internists have pointed to time pressures, lack of work control, and difficult patient encounters as possible contributors.[10, 11]
Burnout has been demonstrated to affect a sizable proportion of hospitalists, with prevalence estimates from prior studies varying from 12.9% to 27.2%, although nearly all studies of US hospitalists have relied on single‐item instruments.[12, 13, 14, 15] Hospital‐based physicians have represented a rapidly expanding segment of the internist workforce for more than a decade,[14] but studies of the impact of inpatient vs outpatient practice location on burnout and career satisfaction are limited. A meta‐analysis of the impact of practice location on burnout relied almost exclusively on noncomparative studies from outside the United States.[15] A recent study of US physician burnout and satisfaction with work‐life balance showed that general internists expressed below average satisfaction with work‐life balance and had the second highest rate of burnout among 24 specialties.[4] However, this report did not differentiate between general internists working in inpatient vs outpatient settings.
We therefore examined burnout, satisfaction with work‐life balance, and other aspects of well‐being among internal medicine hospitalists relative to outpatient general internists, using a national sample developed in partnership with the American Medical Association.
METHODS
Physician Sample
As described previously,[4] the American Medical Association Physician Masterfile, a nearly complete record of US physicians, was used to generate a sample of physicians inclusive of all specialty disciplines. The 27,276 physicians who opened at least 1 invitation e‐mail were considered to have received the invitation to participate in the study. Participation was voluntary, and all responses were anonymous. For this analysis, internal medicine hospitalists were compared with general internists reporting primarily outpatient practices. The physician sample provided information on demographics (age, sex, and relationship status) and on characteristics of their practice. Burnout, symptoms of depression, suicidal ideation in the past 12 months, quality of life (QOL), satisfaction with work‐life balance, and certain health behaviors were evaluated as detailed below.
Burnout
Burnout among physicians was measured using the Maslach Burnout Inventory (MBI), a validated 22‐item questionnaire considered the gold standard tool for measuring burnout.[5, 16] The MBI has subscales to evaluate each domain of burnout: emotional exhaustion, depersonalization, and low personal accomplishment. Because other burnout studies have focused on the presence of high levels of emotional exhaustion or depersonalization as the foundation of burnout in physicians,[17, 18, 19] we considered physicians with a high score on the depersonalization or emotional exhaustion subscales to have at least 1 manifestation of professional burnout.
Symptoms of Depression and Suicidal Ideation
Symptoms of depression were assessed using the 2‐item Primary Care Evaluation of Mental Disorders,[20] a standardized and validated assessment for depression screening that performs as well as longer instruments.[21] Recent suicidal ideation was evaluated by asking participants, During the past 12 months, have you had thoughts of taking your own life? This item was designed to measure somewhat recent, but not necessarily active, suicidal ideation. These questions have been used extensively in other studies.[22, 23, 24, 25]
Quality of Life and Fatigue
Overall QOL and mental, physical, and emotional QOL were measured by a single‐item linear analog scale assessment. This instrument measured QOL on a 0 (as bad as it can be) to 10 (as good as it can be) scale validated across a wide range of medical conditions and populations.[26, 27, 28] Fatigue was measured using a similar standardized linear analog scale assessment question, for which respondents indicated their level of fatigue during the past week.[29] The impact of fatigue on daily activities such as driving was also evaluated.
Satisfaction With Work‐Life Balance and Career Plans
Satisfaction with work‐life balance was assessed by the item, My work schedule leaves me enough time for my personal/family life, with response options strongly agree, agree, neutral, disagree, or strongly disagree. Individuals who indicated strongly agree or agree were considered to be satisfied with their work‐life balance, whereas those who indicated strongly disagree or disagree were considered to be dissatisfied with their work‐life balance. Experience of work‐home conflicts was assessed as in prior research.[4] Participants were also asked about plans to change jobs or careers.
Health Behaviors
A limited set of health and wellness behaviors was addressed in the survey to provide insight into other aspects of physician well‐being. These included whether respondents had a primary care provider and questions concerning routine screening and alcohol and substance use. Alcohol use was assessed using the Alcohol Use Disorders Identification Test, version C (AUDIT‐C).[30] An AUDIT‐C score of at least 4 for men and at least 3 for women indicates alcohol misuse, and a score of at least 5 for men and at least 4 for women indicates alcohol abuse and possible dependence.[30]
Statistical Analysis
Standard descriptive summary statistics were used to characterize the physician samples. Associations between variables were evaluated using the Kruskal‐Wallis test (for continuous variables) or [2] test (for categorical variables). All tests were 2‐sided, with a type I error level of 0.05. Multivariate analysis of differences between hospitalists and outpatient general internists was performed using multiple linear or logistic regression for continuous or categorical data, respectively. Covariates in these models included age, sex, weekly work hours, and practice setting. All of the analyses were performed using SAS version 9.2 (SAS Institute, Inc., Cary, NC).
RESULTS
In the full survey across all specialties, 7288 physicians (26.7%) provided survey responses.[4] There were 448 outpatient internists and 130 internal medicine hospitalists who agreed to participate. Demographically, hospitalists were younger, worked longer hours, and were less likely to work in private practice than outpatient general internists (Table 1).
| Characteristic | Hospitalists (n=130) | Outpatient General Internists (n=448) | P |
|---|---|---|---|
| |||
| Sex, n (%) | 0.56 | ||
| Male | 86 (66.2%) | 284 (63.4%) | |
| Female | 44 (33.8%) | 164 (36.6%) | |
| Age, mean (SD) | 46.9 (12.4) | 53.6 (10.2) | <0.001 |
| Median | 45.0 | 55.0 | |
| Years in practice, mean (SD) | 14.0 (12.0) | 21.6 (10.7) | <0.001 |
| Median | 10.0 | 22.0 | |
| Hours worked per week, mean (SD) | 55.0 (18.1) | 50.0 (15.1) | 0.04 |
| Median | 50.0 | 50.0 | |
| Practice setting, n (%) | <0.001 | ||
| Private practice/hospital | 36 (31.0%) | 303 (69.2%) | |
| Academic medical center | 37 (31.9%) | 41 (9.4%) | |
| Other (including veterans hospital and active military practice) | 43 (37.1%) | 94 (21.5%) | |
Distress and Well‐Being Variables
High levels of emotional exhaustion affected 43.8% of hospitalists and 48.1% of outpatient general internists (odds ratio [OR]: 0.91, 95% confidence interval [CI]: 0.56‐1.48), and high levels of depersonalization affected 42.3% of hospitalists and 32.7% of outpatient general internists (OR: 1.42, 95% CI: 0.86‐2.35). Overall burnout affected 52.3% of hospitalists and 54.5% of outpatient general internists (OR: 0.96, 95% CI: 0.58‐1.57). None of these factors differed statistically in multivariate models adjusted for factors known to be associated with burnout, including sex, age, weekly work hours, and practice setting (P=0.71, 0.17, and 0.86, respectively; Table 2). However, low levels of personal accomplishment were reported by 20.3% of hospitalists and 9.6% of outpatient general internists (OR: 1.93, 95% CI: 1.023.65, P=0.04).
| Variable | Hospitalists (n=130) | Outpatient General Internists (n=448) | Pa |
|---|---|---|---|
| |||
| Burnout | |||
| Emotional exhaustion high (27) | 57/130 (43.8%) | 215/447 (48.1%) | 0.71 |
| Mean (SD) | 24.7 (12.5) | 25.4 (14.0) | |
| Median | 24.9 | 26.0 | |
| Depersonalization high (10) | 55/130 (42.3%) | 146/447 (32.7%) | 0.17 |
| Mean (SD) | 9.1 (6.9) | 7.5 (6.3) | |
| Median | 7.0 | 6.0 | |
| Personal accomplishment low (33) | 26/128 (20.3%) | 43/446 (9.6%) | 0.04 |
| Mean (SD) | 39.0 (7.6) | 41.4 (6.0) | |
| Median | 41.0 | 43.0 | |
| High burnout (EE27 or DP10) | 68/130 (52.3%) | 244/448 (54.5%) | 0.86 |
| Depression | |||
| Depression screen + | 52/129 (40.3%) | 176/440 (40.0%) | 0.73 |
| Suicidal thoughts in past 12 months | 12/130 (9.2%) | 26/445 (5.8%) | 0.15 |
| Quality of life | |||
| Overall mean (SD) | 7.3 (2.0) | 7.4 (1.8) | 0.85 |
| Median | 8.0 | 8.0 | |
| Low (<6) | 21/130 (16.2%) | 73/448 (16.3%) | |
| Mental mean (SD) | 7.2 (2.1) | 7.3 (2.0) | 0.89 |
| Median | 8.0 | 8.0 | |
| Low (<6) | 23/130 (17.7%) | 92/448 (20.5%) | |
| Physical mean (SD) | 6.7 (2.3) | 6.9 (2.1) | 0.45 |
| Median | 7.0 | 7.0 | |
| Low (<6) | 35/130 (26.9%) | 106/448 (23.7%) | |
| Emotional mean (SD) | 7.0 (2.3) | 6.9 (2.2) | 0.37 |
| Median | 7.0 | 7.0 | |
| Low (<6) | 30/130 (23.1%) | 114/448 (25.4%) | |
| Fatigue | |||
| Mean (SD) | 5.8 (2.4) | 5.9 (2.4) | 0.57 |
| Median | 6.0 | 6.0 | |
| Fallen asleep while driving (among regular drivers only) | 11/126 (8.7%) | 19/438 (4.3%) | 0.23 |
Approximately 40% of physicians in both groups screened positive for depression (OR: 0.92, 95% CI: 0.56‐1.51, P=0.73). In addition, 9.2% of hospitalists reported suicidal ideation in the last 12 months compared to 5.8% of outpatient internists (OR: 1.86, 95% CI: 0.80‐4.33, P=0.15) (Table 2).
Overall QOL and QOL in mental, physical, and emotional domains were nearly identical in the 2 groups (Table 2). Fatigue was also similar for hospitalists and outpatient general internists, and 8.5% of hospitalists reported falling asleep in traffic while driving compared to 4.2% of outpatient internists (OR: 1.76, 95% CI: 0.70‐4.44, P=0.23).
Work‐Life Balance and Career Variables
Experience of recent work‐home conflicts was similar for hospitalists and outpatient general internists (Table 3). However, hospitalists were more likely to agree or strongly agree that their work schedule leaves enough time for their personal life and family (50.0% vs 42.0%, OR: 2.06, 95% CI: 1.22‐3.47, P=0.007).
| Variable | Hospitalists (n=130) | Outpatient General Internists (n=448) | Pa |
|---|---|---|---|
| |||
| Work‐home conflict in last 3 weeks | 62/128 (48.4%) | 183/443 (41.3%) | 0.64 |
| Work‐home conflict resolved in favor of: | 0.79 | ||
| Work | 37/118 (31.4%) | 131/405 (32.2%) | |
| Home | 15/118 (12.7%) | 43/405 (10.6%) | |
| Meeting both needs | 66/118 (55.9%) | 231/405 (57.0%) | |
| Work schedule leaves enough time for personal life/family | 0.007 | ||
| Strongly agree | 20 (15.4%) | 70 (15.7%) | |
| Agree | 45 (34.6%) | 117 (26.3%) | |
| Neutral | 21 (16.2%) | 66 (14.8%) | |
| Disagree | 27 (20.8%) | 119 (26.7%) | |
| Strongly disagree | 17 (13.1%) | 73 (16.4%) | |
| Missing | 0 | 3 | |
| Likelihood of leaving current practice | 0.002 | ||
| Definite | 17 (13.1%) | 34 (7.6%) | |
| Likely | 21 (16.2%) | 53 (11.9%) | |
| Moderate | 21 (16.2%) | 67 (15.0%) | |
| Slight | 38 (29.2%) | 128 (28.7%) | |
| None | 33 (25.4%) | 164 (36.8%) | |
| Missing | 0 | 2 | |
| Would choose to become physician again | 81/130 (62.3%) | 306/441 (69.4%) | 0.86 |
Hospitalists were more likely to express interest in leaving their current practice in the next 2 years, with 13.1% vs 7.6% reporting definite plans to leave and 29.2% vs 19.5% reporting at least likely plans to leave (OR: 2.31, 95% CI: 1.35‐3.97, P=0.002). Among those reporting a likely or definite plan to leave, hospitalists were more likely to plan to look for a different practice and continue to work as a physician (63.2% vs 39.1%), whereas outpatient general internists were more likely to plan to leave medical practice (51.9% vs 22.0%, P=0.004). Hospitalists with plans to reduce their work hours were more likely than their outpatient colleagues to express an interest in administrative and leadership roles (19.4% vs 12.1%) or research and educational roles (9.7% vs 4.0%, P=0.05).
Health Behavior Variables
Hospitalists were less likely to report having a primary care provider in the adjusted analyses (55.0% vs 70.3%, OR: 0.49, 95% CI: 0.29‐0.83, P=0.008). Use of illicit substances was uncommon in both groups (94.6% of hospitalists and 96.0% of outpatient general internists reported never using an illicit substance (OR: 0.87, 95% CI: 0.31‐2.49, P=0.80). Symptoms of alcohol abuse were similar between the 2 groups (11.7% and 13.3%, respectively, OR: 0.64, 95% CI: 0.30‐1.35, P=0.24), but symptoms of alcohol misuse were more common among outpatient general internists (34.2% vs 21.9%, OR: 1.75, 95% CI: 1.013.03, P=0.047).
DISCUSSION
The primary result of this national study applying well‐validated metrics is that the overall rates of burnout among hospitalists and outpatient general internal medicine physicians were similar, as were rates of positive depression screening and QOL. Although these groups did not differ, the absolute rates of distress found in this study were high. Prior research has suggested that possible explanations for these high rates of distress include excessive workload, loss of work‐associated control and meaning, and difficulties with work‐home balance.[4] The present study, in the context of prior work showing that general internists have higher rates of burnout than almost any other specialty, suggests that the front‐line nature of the work of both hospitalists and outpatient general internists may exacerbate these previously cited factors. These results suggest that efforts to address physician well‐being are critically needed for both inpatient and outpatient physicians.
Despite the noted similarities, differences between hospitalists and outpatient general internists in certain aspects of well‐being merit further attention. For example, the lower rate of personal accomplishment among hospitalists relative to outpatient generalists is consistent with prior evidence.[15] The reasons for this difference are unknown, but the relative youth and inexperience of the hospitalists may be a factor. US hospitalists have been noted to feel like glorified residents in at least 1 report,[31] a factor that might also negatively impact personal accomplishment.
It is also worthwhile to place the burnout results for both groups in context with prior studies. Although we found high rates of burnout among outpatient physicians, our outpatient sample's mean MBI subset scores are not higher than previous samples of American[32] and Canadian[33] outpatient physicians, suggesting that this finding is neither new nor artifactual. Placing the hospitalist sample in perspective is more difficult, as very few studies have administered the MBI to US hospitalists, and those that have either administered 1 component only to an exclusive academic sample[34] or administered it to a small mixture of hospitalists and intensivists.[35] The prevalence of burnout we report for our hospitalist sample is higher than that reported by studies that utilized single‐item survey items1214; it is likely that the higher prevalence we report relates more to a more detailed assessment of the components of burnout than to a temporal trend, although this cannot be determined definitively from the data available.
The finding that 9.2% of hospitalists and 5.8% of outpatient general internists reported suicidal thoughts in the past 12 months is alarming, though consistent with prior data on US surgeons.[35] Although the higher rate of suicidal thoughts among hospitalists was not statistically significant, a better understanding of the factors associated with physician suicidality should be the focus of additional research.
Hospitalists were more likely than outpatient internists to report plans to leave their current practice in this study, although their plans after leaving differed. The fact that they were more likely to report plans to find a different role in medicine (rather than to leave medicine entirely or retire) is likely a function of age and career stage. The finding that hospitalists with an interest in changing jobs were more likely than their outpatient colleagues to consider administrative, leadership, education, and research roles may partially reflect the greater number of hospitalists at academic medical centers in this study, but suggests that hospitalists may indeed benefit from the availability of opportunities that have been touted as part of hospitalist diastole.[36]
Finally, rates of alcohol misuse and abuse found in this study were consistent with those reported in prior studies.[37, 38, 39] These rates support ongoing efforts to address alcohol‐related issues among physicians. In addition, the proportion of outpatient general internists and hospitalists reporting having a primary care provider was similar to that seen in prior research.[40] The fact that 1 in 3 physicians in this study did not have a primary care provider suggests there is great room for improvement in access to and prioritization of healthcare for physicians in general. However, it is noteworthy that hospitalists were less likely than outpatient general internists to have a primary care provider even after adjusting for their younger age as a group. The reasons behind this discrepancy are unclear but worthy of further investigation.
Several limitations of our study should be considered. The response rate for the entire study sample was 26.7%, which is similar to other US national physician surveys in this topic area.[41, 42, 43] Demographic comparisons with national data suggest the respondents were reasonably representative of physicians nationally,[4] and all analyses were adjusted for recognized demographic factors affecting our outcomes of interest. We found no statistically significant differences in demographics of early responders compared with late responders (a standard approach to evaluate for response bias),[14, 31] further supporting that responders were representative of US physicians. Despite this, response bias remains possible. For example, it is unclear if burned out physicians might be more likely to respond (eg, due to the personal relevance of the survey topic) or less likely to respond (eg, due to being too overwhelmed to open or complete the survey).
A related limitation is the relatively small number of hospitalists included in this sample, which limits the power of the study to detect differences between the study groups. The hospitalists in this study were also relatively experienced, with a median of 10 years in practice, although the overall demographics match closely to a recent national survey of hospitalists. Although age was considered in the analyses, this study may not fully characterize burnout patterns among very junior or very senior hospitalists. In addition, although analyses were adjusted for observed differences between the study groups for a number of covariates, there may be differences between the study groups in other, unmeasured factors that could act as confounders of the observed results. For example, the allocation of each individual's time to different activities (eg, clinical, research, education, administration), workplace flexibility and control, and meaning may all contribute to distress and well‐being, and could not be assessed in this study.
In conclusion, the degree of burnout, depression, and suicidal ideation in both hospitalists and outpatient general internists is similar and substantial. Urgent attention directed at better understanding the causes of distress and identifying solutions for all internists is needed.
Acknowledgements
The authors acknowledge the role of the American Medical Association in completing this study.
Disclosures: The views expressed in this article are those of the authors and do not represent the views of, and should not be attributed to, the American Medical Association. The authors report no conflicts of interest.
- , , , , , . Stress symptoms, burnout and suicidal thoughts in Finnish physicians. Soc Psychiatry Psychiatr Epidemiol. 1990;25:81–86.
- , , , , , ; Society of General Internal Medicine (SGIM) Career Satisfaction Study Group (CSSG). Predicting and preventing physician burnout: results from the United States and the Netherlands. Am J Med. 2001;111:170–175.
- , , , et al. Burnout among psychiatrists in Milan: a multicenter study. Psychiatr Serv. 2009;60:985–988.
- , , , et al. Burnout and satisfaction with work‐life balance among US physicians relative to the general US population. Arch Intern Med. 2012;172:1377–1385.
- , . The measurement of experienced burnout. J Occup Behav. 1981;2:99–113.
- , , , et al. Burnout and medical errors among American surgeons. Ann Surg. 2010;251:995–1000.
- , , . Physician wellness: a missing quality indicator. Lancet. 2009;374:1714–1721.
- , , , , . Changes in mental health of UK hospital consultants since the mid‐1990s. Lancet. 2005;366:742–744.
- , , , et al. Relationship between burnout and professional conduct and attitudes among US medical students. JAMA. 2010;304:1173–1180.
- , , , et al.; MEMO (Minimizing Error, Maximizing Outcomes) Investigators. Working conditions in primary care: physician reactions and care quality. Ann Intern Med. 2009;151:28–36.
- , , , , , ; MEMO Investigators. Burden of difficult encounters in primary care: data from the Minimizing Error, Maximizing Outcomes study. Arch Intern Med. 2009;169:410–414.
- , , , , . Characteristics and work experiences of hospitalists in the United States. Arch Intern Med. 2001;161(6):851–858.
- , , , , , . Career satisfaction and burnout in academic hospital medicine. Arch Intern Med. 2011;25:171(8):782–785.
- , , , , ; Society of Hospital Medicine Career Satisfaction Task Force. Job characteristics, satisfaction, and burnout across hospitalist practice models. J Hosp Med. 2012;7:402–410.
- , , , , . Burnout in inpatient‐based vs outpatient‐based physicians: a systematic review and meta‐analysis. J Hosp Med. 2013;8:653–664.
- , , . Maslach Burnout Inventory Manual. 3rd ed. Palo Alto, CA: Consulting Psychologists Press; 1996.
- . Resident burnout. JAMA. 2004;292(23):2880–2889.
- , , , . Burnout and self‐reported patient care in an internal medicine residency program. Ann Intern Med. 2002;136:358–367.
- , , , . Evolution of sleep quantity, sleep deprivation, mood disturbances, empathy, and burnout among interns. Acad Med. 2006;81:82–85.
- , , , et al. Utility of a new procedure for diagnosing mental disorders in primary care: the PRIME‐MD 1000 study. JAMA. 1994;272:1749–1756.
- , , , . Case‐finding instruments for depression: two questions are as good as many. J Gen Intern Med. 1997;12:439–445.
- , , , . Attempted suicide among young adults: progress toward a meaningful estimate of prevalence. Am J Psychiatry. 1992;149:41–44.
- , , . Prevalence of and risk factors for lifetime suicide attempts in the National Comorbidity Survey. Arch Gen Psychiatry. 1999;56:617–626.
- , , , , . Trends in suicide ideation, plans, gestures, and attempts in the United States, 1990–1992 to 2001–2003. JAMA. 2005;293:2487–2495.
- , , . Identifying suicidal ideation in general medical patients. JAMA. 1994;272:1757–1762.
- , , , . Health state valuations from the general public using the visual analogue scale. Qual Life Res. 1996;5:521–531.
- , , , et al. The well‐being and personal wellness promotion strategies of medical oncologists in the North Central Cancer Treatment Group. Oncology. 2005;68:23–32.
- , , , et al. Impacting quality of life for patients with advanced cancer with a structured multidisciplinary intervention: a randomized controlled trial. J Clin Oncol. 2006;24:635–642.
- , , , , . Association of resident fatigue and distress with perceived medical errors. JAMA. 2009;302:294–300.
- , , , , . The AUDIT alcohol consumption questions (AUDIT‐C): an effective brief screening test for problem drinking. Arch Intern Med. 1998;158:1789–1795.
- , , , , . Worklife and satisfaction of hospitalists: toward flourishing careers. J Gen Intern Med. 2012;27(1):28–36.
- , , , et al. Association of an educational program in mindful communication with burnout, empathy, and attitudes among primary care physicians. JAMA. 2009;302(12):1284–1293.
- , , . Stress, burnout, and strategies for reducing them: what's the situation among Canadian family physicians? Can Fam Physician. 2008;54(2):234–235.
- , , , et al. Emotional exhaustion, life stress, and perceived control among medicine ward attending physicians: a randomized trial of 2‐ versus 4‐week ward rotations [abstract]. J Hosp Med. 2011;6(4 suppl 2):S43–S44.
- , , , et al. Special report: suicidal ideation among American surgeons. Arch Surg. 2011;146:54–62.
- , , , . Preparing for “diastole”: advanced training opportunities for academic hospitalists. J Hosp Med. 2006;1:368–377.
- , , , et al. Prevalence of substance use among US physicians. JAMA. 1992;267:2333–2339.
- , , , , . Preventive, lifestyle, and personal health behaviors among physicians. Acad Psychiatry. 2009;33:289–295.
- , , , et al. Prevalence of alcohol use disorders among American surgeons. Arch Surg. 2012;147:168–174.
- , , , . Physician, heal thyself? Regular source of care and use of preventive health services among physicians. Arch Intern Med. 2000;160:3209–3214.
- , , . Prevalence of burnout in the U.S. oncologic community: results of a 2003 survey. J Oncol Pract. 2005;1(4):140–147.
- , , , et al. Career satisfaction, practice patterns and burnout among surgical oncologists: report on the quality of life of members of the Society of Surgical Oncology. Ann Surg Oncol. 2007;14:3042–3053.
- , , , et al. Burnout and career satisfaction among American surgeons. Ann Surg. 2009;250(3):463–471.
© 2014 Society of Hospital Medicine
Evidenced-Based Medicine for the Hospitalist
Editors’ note: We inadvertently published part 2 of the “Statistics in the Literature” (May 2006, p. 15) series installments in May (p. 15) out of order. In fact, the following series installment should have preceded the installment we published in May. Therefore, the following series installment is the last in the EBM series. We apologize for any inconvenience.
Why Do Statistical Methods Matter?
Critical appraisal of the literature does not stop with evaluation of bias and review of results. While it would be nice to simply trust that the reported methods in a paper tell the whole story, this approach would be inconsistent with the core principle of EBM: a global attitude of enlightened skepticism. Statistics in the literature should be subject to the same appraisal as every other aspect of a study.
But is such detail truly necessary? If a paper meets the standard criteria for validity, can’t we assume that the statistics are also valid? Most of us would like to be able to just accept that the P values and confidence intervals we see in a paper are appropriate. Even EBM experts tend to feel this way, as evidenced by the statement in Sackett, et al. (1998) that “if good [study] methods were used, the investigators probably went to the effort to use good statistics.” Unfortunately, repeated studies of the statistical methods reported in literature across many fields suggest that up to 50% of papers contain major statistical flaws, many of which could affect the conclusions of the paper. This occurs even in top-tier journals, so no source is immune.
This problem is compounded by the fact that the statistical knowledge of the average clinician is quite limited. Journals certainly have a responsibility to ensure the presentation of valid research, but how many of us (as reader or reviewer) are qualified to assess the statistical methodology from which a study’s conclusions result? It’s trouble enough to work through the critical appraisal process outlined in the previous installments of this series, let alone dig deeper into how the results were generated.
In fact each reader must act as his or her own judge of a study’s ultimate value, and ignorance of basic statistical principles cannot be an excuse for accepting faulty research. Remember, we make patient care decisions based on our reviews of the literature, so there is a very real incentive to ensure we apply the best evidence both epidemiologically and statistically: Our patients are counting on us. With this in mind, we will conclude this series with a two-part discussion of some of the core statistical concepts to consider when evaluating a paper.
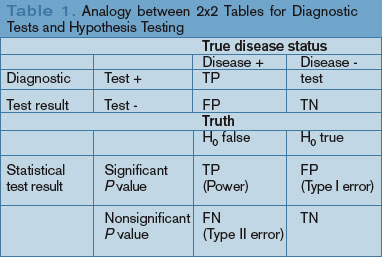
Commonly Reported Statistical Terms
P values: The P value is perhaps the most widely reported yet least understood statistical measure. Consider a comparison of a new treatment with placebo: The null hypothesis (H0) is the hypothesis of null effect, usually meaning that the treatment effect equals the placebo effect. The technical definition of a P value is the probability of observing at least as extreme a result as that found in your study if this null hypothesis were true. The condition in italics is crucial: Remember, we never know if the null hypothesis is true (and if we did, there would be no need for further research).
Usually, however, the P value is interpreted incorrectly as the probability that a study’s results could have occurred due to chance alone, with no mention of the condition. Thus, a P value of 0.05 is thought (wrongly) to mean that there is a 5% chance that the study’s results are wrong.
Of course, rather than the probability of the data we observed assuming the null hypothesis were true (our friend the P value), we want to know the probability that a reported result is true given the data we observed. To illustrate this point, most clinicians have little difficulty with the idea that sensitivity and specificity are only part of the story for a diagnostic test. Recall that specificity is the probability of a negative test result assuming the patient does not have the disease. We need to know the prevalence of disease to be able to convert this into a negative predictive value directly relevant to patient care: the probability of not having the disease given our negative test result (likelihood ratios do this all in one step, but accomplish the same thing).
The analogy between diagnostic test characteristics and statistical test characteristics is presented graphically. (See Table 1, p. 28.) Without the prevalence term (in this case, the probability that the null hypothesis is true) P values do not answer our research question any better than specificity tells us how likely a patient is to be free of a disease. For a patient with a high pre-test probability of disease, a highly specific test that returns a negative result is more likely to represent a false negative than a true negative, despite the high specificity. Similarly, a statistically significant P value from a study in which the hypothesis in question is itself questionable is more likely to represent a false conclusion than a true one. This has resulted in one author’s recent statement that “most published research findings are false.”1 Solutions to these P value issues may lie in the field of Bayesian methods, but to date these approaches have proven too complicated for routine use. P values remain useful and are the common language for reporting results, but it is important to recognize that they do not directly answer the research questions we often think they answer.
Confidence intervals: Confidence intervals provide more information than P values by offering a range of values within which the “truth” is likely to be found. The technical definition of a confidence interval is complicated and confusing even to many statisticians. Generally speaking, however, confidence intervals are derived from the same methodology as P values and correlate with P values as follows: If the confidence interval crosses the point of equivalence (e.g., a relative risk of 1 or an absolute risk reduction of 0), the P value will not be statistically significant at the same level. Therefore, a 95% confidence interval for a relative risk that crosses 1 correlates with a P value greater than 0.05. Conversely, if the confidence interval does not cross this line, the P value will be statistically significant.
The additional information offered by the confidence interval relates to the width of the interval. Wider confidence intervals suggest that less faith should be placed on specific point estimates of a treatment’s effect, while narrower confidence intervals suggest that we can be more sure where the true effect lies (i.e., our estimate of the treatment effect is more precise). However, because confidence intervals are derived from the same statistical methods as P values, they are also subject to the problems previously described for P values.
A dose of common sense: Statistics serve as a way to condense research findings into easily digestible end products; however, the important parts of any paper come well before the first P value is generated. Good research requires good design, and only then can sound statistical approaches provide valid insights into complex study results. In addition, for a study’s results to be applied to our patients, not only must the design and analysis be appropriate, but we must also carefully consider issues beyond the aims of most studies, including value judgments.
Summary
Classically, EBM has focused on careful critical appraisal of study design, with relatively little consideration of the analytic approaches that provide a study’s results. Statistics can clarify study results, but if applied improperly can invalidate even a well-designed study. It is important for clinicians to recognize that statistics should also be evaluated critically when attempting to apply research findings to the care of our patients. TH
Dr. West practices in the Division of General Internal Medicine, Mayo Clinic College of Medicine, Rochester, Minn.
Reference
- Ioannidis JPA. Why most research findings are false. PLoS Med. 2005;2:e124.
Editors’ note: We inadvertently published part 2 of the “Statistics in the Literature” (May 2006, p. 15) series installments in May (p. 15) out of order. In fact, the following series installment should have preceded the installment we published in May. Therefore, the following series installment is the last in the EBM series. We apologize for any inconvenience.
Why Do Statistical Methods Matter?
Critical appraisal of the literature does not stop with evaluation of bias and review of results. While it would be nice to simply trust that the reported methods in a paper tell the whole story, this approach would be inconsistent with the core principle of EBM: a global attitude of enlightened skepticism. Statistics in the literature should be subject to the same appraisal as every other aspect of a study.
But is such detail truly necessary? If a paper meets the standard criteria for validity, can’t we assume that the statistics are also valid? Most of us would like to be able to just accept that the P values and confidence intervals we see in a paper are appropriate. Even EBM experts tend to feel this way, as evidenced by the statement in Sackett, et al. (1998) that “if good [study] methods were used, the investigators probably went to the effort to use good statistics.” Unfortunately, repeated studies of the statistical methods reported in literature across many fields suggest that up to 50% of papers contain major statistical flaws, many of which could affect the conclusions of the paper. This occurs even in top-tier journals, so no source is immune.
This problem is compounded by the fact that the statistical knowledge of the average clinician is quite limited. Journals certainly have a responsibility to ensure the presentation of valid research, but how many of us (as reader or reviewer) are qualified to assess the statistical methodology from which a study’s conclusions result? It’s trouble enough to work through the critical appraisal process outlined in the previous installments of this series, let alone dig deeper into how the results were generated.
In fact each reader must act as his or her own judge of a study’s ultimate value, and ignorance of basic statistical principles cannot be an excuse for accepting faulty research. Remember, we make patient care decisions based on our reviews of the literature, so there is a very real incentive to ensure we apply the best evidence both epidemiologically and statistically: Our patients are counting on us. With this in mind, we will conclude this series with a two-part discussion of some of the core statistical concepts to consider when evaluating a paper.
Commonly Reported Statistical Terms
P values: The P value is perhaps the most widely reported yet least understood statistical measure. Consider a comparison of a new treatment with placebo: The null hypothesis (H0) is the hypothesis of null effect, usually meaning that the treatment effect equals the placebo effect. The technical definition of a P value is the probability of observing at least as extreme a result as that found in your study if this null hypothesis were true. The condition in italics is crucial: Remember, we never know if the null hypothesis is true (and if we did, there would be no need for further research).
Usually, however, the P value is interpreted incorrectly as the probability that a study’s results could have occurred due to chance alone, with no mention of the condition. Thus, a P value of 0.05 is thought (wrongly) to mean that there is a 5% chance that the study’s results are wrong.
Of course, rather than the probability of the data we observed assuming the null hypothesis were true (our friend the P value), we want to know the probability that a reported result is true given the data we observed. To illustrate this point, most clinicians have little difficulty with the idea that sensitivity and specificity are only part of the story for a diagnostic test. Recall that specificity is the probability of a negative test result assuming the patient does not have the disease. We need to know the prevalence of disease to be able to convert this into a negative predictive value directly relevant to patient care: the probability of not having the disease given our negative test result (likelihood ratios do this all in one step, but accomplish the same thing).
The analogy between diagnostic test characteristics and statistical test characteristics is presented graphically. (See Table 1, p. 28.) Without the prevalence term (in this case, the probability that the null hypothesis is true) P values do not answer our research question any better than specificity tells us how likely a patient is to be free of a disease. For a patient with a high pre-test probability of disease, a highly specific test that returns a negative result is more likely to represent a false negative than a true negative, despite the high specificity. Similarly, a statistically significant P value from a study in which the hypothesis in question is itself questionable is more likely to represent a false conclusion than a true one. This has resulted in one author’s recent statement that “most published research findings are false.”1 Solutions to these P value issues may lie in the field of Bayesian methods, but to date these approaches have proven too complicated for routine use. P values remain useful and are the common language for reporting results, but it is important to recognize that they do not directly answer the research questions we often think they answer.
Confidence intervals: Confidence intervals provide more information than P values by offering a range of values within which the “truth” is likely to be found. The technical definition of a confidence interval is complicated and confusing even to many statisticians. Generally speaking, however, confidence intervals are derived from the same methodology as P values and correlate with P values as follows: If the confidence interval crosses the point of equivalence (e.g., a relative risk of 1 or an absolute risk reduction of 0), the P value will not be statistically significant at the same level. Therefore, a 95% confidence interval for a relative risk that crosses 1 correlates with a P value greater than 0.05. Conversely, if the confidence interval does not cross this line, the P value will be statistically significant.
The additional information offered by the confidence interval relates to the width of the interval. Wider confidence intervals suggest that less faith should be placed on specific point estimates of a treatment’s effect, while narrower confidence intervals suggest that we can be more sure where the true effect lies (i.e., our estimate of the treatment effect is more precise). However, because confidence intervals are derived from the same statistical methods as P values, they are also subject to the problems previously described for P values.
A dose of common sense: Statistics serve as a way to condense research findings into easily digestible end products; however, the important parts of any paper come well before the first P value is generated. Good research requires good design, and only then can sound statistical approaches provide valid insights into complex study results. In addition, for a study’s results to be applied to our patients, not only must the design and analysis be appropriate, but we must also carefully consider issues beyond the aims of most studies, including value judgments.
Summary
Classically, EBM has focused on careful critical appraisal of study design, with relatively little consideration of the analytic approaches that provide a study’s results. Statistics can clarify study results, but if applied improperly can invalidate even a well-designed study. It is important for clinicians to recognize that statistics should also be evaluated critically when attempting to apply research findings to the care of our patients. TH
Dr. West practices in the Division of General Internal Medicine, Mayo Clinic College of Medicine, Rochester, Minn.
Reference
- Ioannidis JPA. Why most research findings are false. PLoS Med. 2005;2:e124.
Evidence-Based Medicine for the Hospitalist
In the last installment of this series, we introduced the concept of critical appraisal of the statistical methods used in a paper. The statistical analysis in a study is often the final barrier between the study’s results and application of those results to patient care, so making sure that the findings have been properly evaluated is of obvious importance.
We have previously discussed P values and confidence intervals—two of the most common statistical outcomes upon which clinical decisions are based. In this segment, we will discuss several specific issues that can help a reader decide how much faith to place in a study’s results.
Test Assumptions
Statistical tests generally require that a variety of assumptions be satisfied for the test procedure to be valid. These assumptions vary from test to test, and unfortunately most computer packages do not ask users whether they want to examine these assumptions more closely. This is one of the dangers of “black box” analysis, when researchers with little statistical training run their data through a statistical package without fully understanding how the output is generated.
Many statistical tests are based on the theory of the bell curve, or normal distribution. These tests require a large enough sample size, usually at least 30 subjects per group and sometimes much greater, for this theory to hold. In addition, the data should not be skewed excessively. For example, consider a study comparing two treatments for mild pain for which scores on a continuous 0-10 visual analog scale are expected to be between 0 and 2. Because of the asymmetry of the data, an underlying bell curve isn’t likely to make much sense. Therefore, a two-sample t-test may not be appropriate for this study even with two large samples.
Another commonly violated assumption is that the two groups being compared may need to be independent. The simplest case occurs when the same subjects are measured before and after a procedure. A two-sample statistical test is not appropriate here because the two groups are actually the same, and therefore clearly not independent. In this case, a paired analysis is required. The issue of independence becomes more complicated when we consider tests of multiple variables that may be related to one another, or studies of effects over time. In these instances, additional expertise in selecting the correct analysis approach is usually needed.
The best way to ensure that these assumptions and the many others required for valid statistical testing are met is to plan your analyses with the help of a trained statistician. If this is not an option, it is incumbent upon the researcher to learn about these assumptions and evaluate their study to make sure the appropriate methods are applied.
Negative Study Results
A more straightforward issue concerns interpretation of negative study results. Most clinicians are familiar with statistical power: A small study may yield a negative finding because this is the correct result or because there is not enough power to discern a difference between the groups being tested. Often, the width of the confidence interval provides insight into this problem. If the confidence interval includes a difference that would be clinically meaningful, a negative study should be viewed skeptically. In such cases, a larger study or a meta-analysis may be needed to better address the question. If, on the other hand, the confidence interval suggests that no clinically relevant result is likely, the negative study finding becomes more compelling.
Multiple Statistical Tests
When we perform a statistical test and set the level of significance at 0.05, we are acknowledging a 5% chance that if the null hypothesis were in fact true we would nonetheless falsely reject it with our test. Turned around, this loosely means a 95% chance of “getting it right,” subject to the limitations of P value interpretation described in the previous segment of this series. This seems reasonable for a single test, but what about the typical research study in which dozens of statistical tests are run? For two independent tests, the chance of “getting it right” in both cases would be 0.95 x 0.95 = 90%. For 20 tests, this probability would be only 36%, meaning a more than 50% chance of drawing at least one false conclusion. The trouble is that there is no way to know which of the 20 tests might have yielded a wrong conclusion!
To address this issue, researchers may set their initial level of significance at a stricter level—perhaps 0.01. There are also mathematical ways to adjust the level of significance to help with multiple comparisons. The key point is that the more tests you run, the more chances you have to draw a false conclusion. Neither you nor your patients can know when this occurs, though. The same arguments apply to subgroup analyses and data-driven, or post hoc, analyses. Such analyses should be regarded as hypothesis-generating rather than hypothesis-testing, and any findings from these analyses should be evaluated more directly by additional research.
Sensitivity Analysis
A rarely considered aspect of study interpretation is whether the results would change if only a few data points changed. Studies with rare events and wide confidence intervals are often sensitive to a change in even one data point. For example, a study published in 2000 by Kernan, et al., presented a statistically significant finding of increased risk of hemorrhagic stroke in women using appetite suppressants containing phenylpropanolamine. This result was based on six cases and one control, with an unadjusted odds ratio of 11.9 (95% CI, 1.4-99.4).
Shifting just one patient who had used phenylpropanolamine from the case group to the control group would change the odds ratio to 5.0, with a nonsignificant CI of 0.9-25.8. Such an analysis should make readers question how quickly they wish to apply the study results to their own patients, especially if the benefits of the drug are significant. A result that is sensitive to small changes in the study population is probably not stable enough to warrant application to the entire patient population.
Back to the Common-Sense Test
An excellent way to judge whether a study’s results should be believed is to step back and consider whether they make sense based on current scientific knowledge. If they do not, either the study represents a breakthrough in our understanding of disease or the study’s results are flawed. Remember, if the prevalence of a disease is very low, even a positive diagnostic test with high sensitivity and specificity is likely to be a false positive. Similarly, a small P value may represent a false result if the hypothesis being tested does not meet standard epidemiologic criteria for causality such as biological plausibility. Statistics are primarily a tool to help us make sense of complex study data. They can often suggest when new theories should be evaluated, but they should not determine by themselves which results we apply to patient care.
Series Conclusion
This series has been intended as a brief introduction to many different facets of evidence-based medicine. The primary message of evidence-based medicine is that critical assessment of every aspect of research is necessary to ensure that we make the best possible decisions for our patients. Understanding the important concepts in study design and analysis may seem daunting, but this effort is made worthwhile every time we positively affect patient care.
Hospitalists are uniquely situated at the interface of internal medicine and essentially every other area of medicine and because of this have a tremendous opportunity to broadly impact patient care. My hope is that evidence-based medicine-savvy hospitalists will capitalize on this for the benefit of our patients, will play a prominent role in educating future clinicians on the importance of evidence-based medicine, and will use it to lead the next wave of patient care advances. TH
Dr. West practices in the Division of General Internal Medicine, Mayo Clinic College of Medicine, Rochester, Minn.
References
- Greenhalgh T. How to read a paper. Statistics for the non-statistician. I: Different types of data need different statistical tests. BMJ. 1997;315:364-366.
- Greenhalgh T. How to read a paper. Statistics for the non-statistician. II: “Significant” relations and their pitfalls. BMJ. 1997;315:422-425.
- Guyatt G and Rennie D, eds. Users’ guides to the medical literature. Chicago: AMA Press; 2002.
- Kernan WN, Viscoli CM, Brass LM, et al. Phenylpropanolamine and the risk of hemorrhagic stroke. N Engl J Med. 2000;343:1826-1832.
Evidence-Based Medicine for the Hospitalist
We evaluate the validity of a study before examining its results because it will generally be inappropriate to apply the results of a biased study to our patients. If we cannot trust that the results reflect a reasonable estimation of the truth we seek to address, how can we then use those results to guide patient care? However, if we are satisfied with a study’s validity we need to know what the results mean and what to do with them.
In this segment of the evidence-based medicine series, we discuss several commonly reported study measures and how we can ultimately apply study findings for the good of patients. This is, after all, why we ask clinical questions in the first place.
Measures of Treatment Effect
For many types of clinical questions, the proportion of patients in each group experiencing an outcome is the most commonly reported result. This can be presented in several ways, each with subtly different effects.
For example, suppose a hypothetical trial of perioperative beta-blockade finds a postoperative mortality of 5% in the treatment group and 15% in the control group. In this study, the absolute risk reduction (ARR) is 0.15-0.05 = 0.10, and the relative risk (RR) of death is 0.05/0.15 = 0.33. In other words, the risk of death in the treatment group is one-third the risk of death in the control group, whereas the difference in risk between treated and untreated patients is 0.10, or 10%. The relative risk reduction (RRR) is (1-RR) x 100% = 67%, meaning that perioperative beta-blockers reduce the risk of death by 67%.
Although these numbers all seem quite different from one another, they are derived from the same study results: a difference in the proportion of deaths between the intervention groups. However, taken together they provide far more information than any individual result.
To illustrate this, suppose you knew the relative risk of death found in Study A was 10%, meaning the relative risk reduction was 90%. This may sound quite striking, until you later learn that the risk in the treatment group was 0.0001 and the risk in the control group was 0.001. This is quite different from Study B, in which the risk of death in the treatment group was 10% and the risk in the control group was 100%, even though the RR was still 10%. This difference is captured in the ARR. For the first study, the ARR was 0.0009 (or 0.09%), whereas in the second study the ARR was 0.90 (or 90%).
It can be difficult to communicate these differences clearly using terms such as ARR, but the number needed to treat (NNT) provides a more accessible means of reporting effects. The NNT is the number of patients you would need to treat to prevent one adverse event, or achieve one more successful outcome and is calculated as 1/ARR.
For Study A the NNT is 1,111, meaning we would need to treat more than 1,000 patients to prevent a single death. For many treatments, this would prove prohibitively costly and perhaps even dangerous depending on the frequency and severity of side effects. Study B, on the other hand, has an NNT of just over 1, meaning that nearly every treated case represents an averted death: Even though the relative risks are identical, the full meaning of the results is drastically different.
Other measures of treatment effect include odds ratios, commonly reported in case–control studies but actually appropriate in any comparative study, and hazard ratios, commonly reported in survival studies. We do not address these measures in more detail here, but loosely speaking the same principles discussed for relative risks apply.
Measures from Studies of Diagnostic Tests
When we order a diagnostic study, we are trying to gain information about the patient’s underlying probability of a disorder. That is, the diagnostic test moves us from a pre-test probability to a post-test probability. Historically, terms such as sensitivity and specificity have been used to describe the properties of a diagnostic test. But these terms have significant limitations, one of which is that they do not consider the pre-test probability at all.
Likelihood ratios overcome this limitation. Basically, a likelihood ratio (LR) converts pre-test odds to post-test odds. Because we think in terms of probabilities rather than odds, we can either use a nomogram to make the conversion for us or recall that for a probability p, odds = p/(1 - p) and p = odds/(1 + odds).
For example, suppose we suspect that a patient may have iron-deficiency anemia and quantify this suspicion with a pre-test probability of 25%. If the ferritin is 8 mcg/L, we can apply the likelihood ratio of 55 found from a literature search locating Guyatt, et al. (1992). The pre-test odds is one-third, which when multiplied by the LR of 55 yields a post-test odds of 18.3. This then can be converted back to a post-test probability of 95%. Alternatively, the widely available nomograms give the same result.
Clearly, this diagnostic test has drastically affected our sense of whether the patient has iron-deficiency anemia. Likelihood ratios for many common problems may be found in the recommended readings.
Perhaps the greatest stumbling block to the use of likelihood ratios is how to determine pre-test probabilities. This really should not be a major worry because it is our business to estimate probabilities of disease every time we see a patient. However, this estimation can be strengthened by using evidence-based principles to find literature to support your chosen pre-test probabilities. This further emphasizes that EBM affects all aspects of clinical decision-making.
Measures of Precision
Each of the measures discussed thus far is a point estimate of the true effect based on the study data. Because the true effect for all humans can never be known, we need some way of describing how precise our point estimates are. Statistically, confidence intervals (CIs) provide this information. An accurate definition of this measure of precision is not intuitive, but in practice the CI can provide answers to two key questions. First, does the CI cross the point of no effect (e.g., a relative risk of 1 or an absolute risk reduction of 0)? Second, how wide is the CI?
If the answer to the first question is yes, we cannot state with any certainty that there really is an effect of the treatment: a finding of “no effect” is considered plausible, because it is contained within the CI. If the CI is very wide, the true effect could be any value across a wide range of possibilities. This makes decision making problematic, unless the entire range of the CI represents a clinically important effect.
We will talk in more detail about CIs in a later segment, but the important message here is that a point estimate requires a CI before meaningful conclusions affecting patient care may be reached.
Applying Results to Patient Care
Once validity issues have been addressed and results have been processed, the key determinants of whether a study’s results can be applied to your patient are whether the study population was reasonably similar to your patient and whether the study setting was reasonably similar to your own. This need not be exact, but if a study enrolled only men, application of the results to women may not be supported.
On the other hand, if a study excluded individuals younger than 60 and your patient is 59 you may still feel comfortable applying the findings of this study to your patient’s care. The application of study results to individual patients is often not a simple decision. A general recommendation is to carefully determine whether there is a compelling reason to suggest that the study results might not apply to your patient. If not, generalizing the results is likely reasonable.
Additional considerations include the balance between benefits and risks, costs, and, of course, patient and provider values. If a treatment promotes survival but may have a negative impact on quality of life (for a recent example, see the MADIT II trial of AICD implantation in patients with prior MI and heart failure), patients and providers must carefully evaluate their priorities in determining the best course of action. Also, a costly treatment having a small but significant benefit may not be justified in an era of limited resources. These issues are at the heart of medicine and are best addressed by collaborative decision-making among patients, care providers, insurers, policy makers, and all other members of our healthcare system.
Summary
The results of a study can be reported in many ways, with different measures fitting different clinical questions. The keys to look for are a point estimate and a measure of the precision of that estimate. Applying results to patient care requires complex decisions that go well beyond the numbers from any study. In the upcoming segments of this series, we will focus more attention on how results are evaluated statistically. This will provide additional depth to the discussion of study results and how they inform our clinical decisions. TH
Dr. West practices in the Division of General Internal Medicine, Mayo Clinic College of Medicine, Rochester, Minn.
Evidence Based Medicine for The Hospitalist Installment #4
The previous installments in this series have discussed how to ask answerable clinical questions and then search for the best evidence addressing those questions. Not all evidence is of high enough quality to provide meaningful information for patient care, however, and it is important to evaluate all studies with a critical eye toward study design and analysis.
A study can be flawed in many ways, and while many flaws still allow us to apply study results to patients, we need to understand these limitations. It is also insufficient to trust factors such as a medical journal’s impact factor or prestige: Many examples of suboptimal evidence come from higher-tier journals, and it has been estimated that even in the top internal medicine journals up to 50% of papers contain significant design and analysis errors.
While the growth of EBM has directed increasing attention to these issues, the onus remains on the literature consumer to critically appraise the evidence in order to make treatment decisions in as informed a manner as is possible.
Study Validity
Results from a valid study can be expected to be unbiased. In other words, these results should portray the true underlying effect of interest. There are many threats to a study’s validity. Such factors must be evaluated to ensure that they do not systematically affect results and therefore alter the correct interpretation of study findings.
The primary goal of any unbiased study design is to make the comparison groups as similar as possible for all factors potentially affecting the outcome of interest—except for the intervention or exposure of interest. If the only difference between groups’ histories, comorbidities, study experiences, and so on is the intervention or exposure, we can be more confident that any observed outcome differences are due to the exposure rather than other confounding variables.
For example, consider a trial of treatment options for esophageal cancer in which twice as many control group patients smoked as in the intervention group. If the intervention group had better outcomes, we would not know whether this was due to the intervention or to the lower smoking rates in the treatment arm of the study. A well-designed, valid study will make every effort to minimize such problems. This principle applies to all study designs, including observational designs such as case-control and cohort studies, and experimental designs such as the classic randomized controlled trial. We will briefly present a few of the key threats to study validity in this segment of the series. We will focus on clinical trial designs, but the same principles apply to observational designs as well.
Minimize Bias and Protect Study Validity
Randomization: If we wish to make study groups similar on all variables other than the exposure of interest, and we can assign interventions such as in a clinical trial, we can maximize validity by appropriately randomizing patients to intervention groups. Randomization has the effect of balancing comparison groups with respect to both recognized and unrecognized factors that may affect outcomes.
A key feature to look for in a randomization procedure is that the randomization algorithm is in fact completely random. It should be impossible to predict for any study subject to which group they will be randomized. Therefore, for example, procedures systematically alternating subject assignments among groups (A-B-A-B- … ) are not truly random and do not confer the validity benefits of true randomization. It is also important that the randomization process be separate from all other aspects of the study, so that no other factors may influence group assignment. This is closely related to the concept of blinding.
Blinding: If patients, providers, or anybody else involved in a research study are aware of treatment assignments, conscious or subconscious differences in the experience of study participants can be introduced. This is important at all stages of a study, from randomization as described previously through to data analysis at the conclusion of a study. This is also important for all participants in a study. Practically speaking, it may not be possible to blind everybody involved in a study to the assigned treatment group (consider a study of surgical versus medical therapy, where a sham incision may not be desirable or ethical). However, blinding of patients and outcome assessors is desirable whenever feasible. Again, the goal is to treat all study subjects the same way throughout the study, so that the only difference between groups is the intervention of interest.
Intention-to-treat analysis: An intention-to-treat analysis attributes all patients to the group to which they were originally randomized. This further ensures that we are measuring the effect of the intervention of interest rather than imbalances across other factors that might impact whether patients complete the intended treatment program. This has become a well-accepted procedure in clinical trial practice.
Complete follow-up: Loss to follow-up and missing data in general can lead to bias if patients with missing data systematically differ from study completers. No statistical technique can fully compensate for missing data, and there are no general rules regarding acceptable amounts of missing data.
Unfortunately, it is essentially impossible to entirely eliminate missing data, but sensitivity analyses can be helpful in judging whether the degree of missing data is likely to change study findings. In these analyses, study outcomes for different possible missing data results are reviewed. If the conclusions of the study are consistent across the range of possible missing data points, we have good evidence that the amount of missing data is unlikely to be a major limitation of the study.
Validity for Observational Study Designs
The biases to which case-control and cohort studies are prone differ from those of prospective clinical trials, but identical general principles apply. We will not review these biases in detail. The important point is that the goal remains to keep the groups similar on all variables apart from the explanatory variable of interest.
For example, recall bias, in which cases may often be more likely than controls to recall an exposure, can result in associations between exposure and outcome that may be due either to the exposure itself or to the likelihood of recalling an exposure. This can be a serious validity concern for case-control studies, or any design requiring a retrospective recollection of past experiences. Additional information on many other common biases may be found in the recommended reading sources.
Summary
Once an article addressing your clinical question has been identified, the quality of the evidence must be critically appraised. The first central feature of this appraisal is an evaluation of the validity, or lack of bias, of the reported results. Only a valid unbiased study can be trusted to accurately represent a true underlying effect. The goal of techniques to protect validity is to isolate the intervention or exposure of interest as the only varying factor, so that any observed findings can be attributed to the exposure rather than explained by other variables. Once we have reassured ourselves that a study is reasonably valid, we need to be able to interpret the results and determine whether we can apply the results to the care of our patients. We will address these aspects of critical appraisal in the next installment of this series. TH
Dr. West practices in the Division of General Internal Medicine, Mayo Clinic College of Medicine, Rochester, Minn.
Evidence Based Medicine for The Hospitalist
The first step in finding an answer to a clinical question is to ask an effective question. This was the subject of the previous installment in this series, in which the PICOT question format was introduced (see The Hospitalist, Nov. 2005, p. 32). This format leads naturally to effective search strategies, so we optimize our chances of finding quality answers if they exist. There are many possible sources of information that can be searched, however, and the type of question asked can provide valuable guidance as to which sources should be first up for review.
Types of Questions and Where to Look for Answers
Many clinical questions pertain to basic medical knowledge rather than cutting-edge current research. These so-called background questions typically involve such issues as the underlying pathophysiology of a disease, the incidence of the disease, the general treatment considerations for the disease, and overall prognosis for patients with the disease. These questions usually do not require evaluation of the most recent medical literature and can often be answered by reviewing sources of established medical knowledge such as medical textbooks, MD Consult, or UpToDate. In fact, searching for basic knowledge in the current research literature can be exhausting because the focus of most papers is necessarily narrow and therefore too restrictive to properly address knowledge of a general nature.
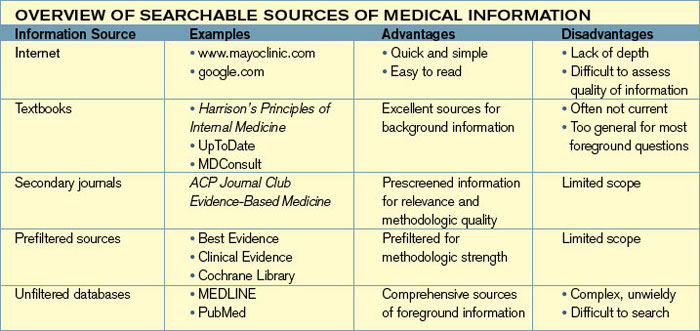
The main limitation of these more general sources is that it takes years for medical knowledge to become established, so the most current results will seldom be incorporated. For background questions this is usually acceptable, but if a major breakthrough in our understanding of a disease occurs it is unlikely to be found in these sources. An additional limitation is that the statements found in these sources are often not truly evidence-based—at least not in a transparent or reproducible manner. These limitations are becoming less problematic as resources such as UpToDate strive to add evidence-based reviews and quality measures to their summaries, and also begin to update information much more rapidly as online materials become more standard.
In contrast to background clinical questions, foreground clinical questions are more likely to relate to the management of an individual patient in a specific clinical setting, and are therefore too narrow in scope to be addressed well by the sources best suited for background questions. For example, consider the question posed in the last installment of this series, “Among men over the age of 65 with Stage II renal cell carcinoma, does post-resection chemotherapy result in greater five-year survival than nephrectomy alone?” No textbook will answer a question with this narrow focus. To find an answer we need to be able to sift through the current medical research literature.

How to Search Research Databases
The number of medical journals has increased dramatically in the past 20 years. As a result, while it may be more likely that your question has been addressed somewhere, it can be more difficult to locate the paper you need. One approach to this problem is to become skilled in developing search strategies. We will return to this, but an alternative is to utilize secondary journals such as ACP Journal Club (www.acponline.org) or prefiltered sources such as the Cochrane Library (www.cochrane.org).
Secondary journals typically screen articles for both clinical relevance and methodologic quality, making them efficient resources for busy clinicians. The Cochrane Library focuses mainly on systematic reviews of controlled trials of therapeutic interventions. The main downside of these sources is that they may not address your particular question. Therefore, one effective search strategy is to first search a secondary journal or prefiltered source and stop if you find what you need. If you don’t find what you are looking for, you will need to enter the world of the large medical research database armed with a search strategy.
Constructing effective search strategies is perhaps even more of an art than constructing effective clinical questions. Luckily, medical librarians are experts at this and should be your first stop. Not only can skilled medical librarians help you with your searches, they can also teach you efficient ways to conduct simple searches yourself. I will mention a few of these strategies, but these are truly only the tip of the iceberg.
The key elements of searching the large medical information databases such as MEDLINE include an understanding of Medical Subject Headings (MeSH), text-word searching, and combining searches. Mapping to a MeSH term and clicking the “explode” option on the search page will gather not just those papers indexed to the term of interest, but also papers referencing more specific aspects of that term. Clicking on the search term itself will reveal the “tree” of terms related to your chosen search term. For example, try searching MEDLINE for “cancer.” You will be mapped to “neoplasms,” and if you click on that term, you will see a tree of related terms. If you select “explode” for your initial search, you will include each of these related terms, expanding your search. You could also narrow your search by selecting “neoplasms by site” or another subheading, and further refining your approach from there.
To begin a search, it is helpful to first enter in relevant keywords from your clinical question. Following our previous example, these could include renal cell carcinoma, chemotherapy, and survival. Then you could perform one search for each term, combining them using the search window options. Alternatively, each term could be linked in one search using the AND/OR operators. Further restrictions such as looking only at randomized controlled trials or for specific authors are also possible. Finally, many MEDLINE sites have a collection of saved search strategies for common clinical question types. For example, a saved search strategy for articles on diagnosis (or therapy, prognosis, or any other question type) can provide an effective searching technique based on the expertise of your resident search professional.
Because many of these approaches rely on the way in which an article has been indexed, searching for synonyms can also be helpful. You may search for temporal arteritis and miss articles indexed only under giant cell arteritis, for example. MEDLINE does a good job of mapping these terms to each other, but this can fall short, particularly if you search by text word alone. Being clever with synonyms can be the difference between finding and missing the one key article that will answer your clinical question.
Searchable Sources of Medical Information
“Overview of Searchable Sources of Medical Information” (p. 18) presents a brief overview of searchable sources of information. Becoming a searching expert takes considerable dedication, but fortunately the basic strategies are not overly complicated. Additionally, significant efforts are being made to simplify the steps needed to answer clinical questions, as can be seen in the growing number of secondary journals available for both general medicine and subspecialties.
Summary
Searching for the answers to well-constructed clinical questions is obviously a crucial step in the EBM process. Well-built questions suggest efficient search strategies, simplifying what can be a complex and daunting process. Many resources are available to help with this step, including medical librarians, prefiltered searches, and saved searches for common query types. Once you locate an article addressing your clinical question, the next step is to critically appraise the article to determine whether its results are applicable to your patient. TH
Dr. West practices in the Division of General Internal Medicine, Mayo Clinic College of Medicine, Rochester, Minn.
The first step in finding an answer to a clinical question is to ask an effective question. This was the subject of the previous installment in this series, in which the PICOT question format was introduced (see The Hospitalist, Nov. 2005, p. 32). This format leads naturally to effective search strategies, so we optimize our chances of finding quality answers if they exist. There are many possible sources of information that can be searched, however, and the type of question asked can provide valuable guidance as to which sources should be first up for review.
Types of Questions and Where to Look for Answers
Many clinical questions pertain to basic medical knowledge rather than cutting-edge current research. These so-called background questions typically involve such issues as the underlying pathophysiology of a disease, the incidence of the disease, the general treatment considerations for the disease, and overall prognosis for patients with the disease. These questions usually do not require evaluation of the most recent medical literature and can often be answered by reviewing sources of established medical knowledge such as medical textbooks, MD Consult, or UpToDate. In fact, searching for basic knowledge in the current research literature can be exhausting because the focus of most papers is necessarily narrow and therefore too restrictive to properly address knowledge of a general nature.
The main limitation of these more general sources is that it takes years for medical knowledge to become established, so the most current results will seldom be incorporated. For background questions this is usually acceptable, but if a major breakthrough in our understanding of a disease occurs it is unlikely to be found in these sources. An additional limitation is that the statements found in these sources are often not truly evidence-based—at least not in a transparent or reproducible manner. These limitations are becoming less problematic as resources such as UpToDate strive to add evidence-based reviews and quality measures to their summaries, and also begin to update information much more rapidly as online materials become more standard.
In contrast to background clinical questions, foreground clinical questions are more likely to relate to the management of an individual patient in a specific clinical setting, and are therefore too narrow in scope to be addressed well by the sources best suited for background questions. For example, consider the question posed in the last installment of this series, “Among men over the age of 65 with Stage II renal cell carcinoma, does post-resection chemotherapy result in greater five-year survival than nephrectomy alone?” No textbook will answer a question with this narrow focus. To find an answer we need to be able to sift through the current medical research literature.
How to Search Research Databases
The number of medical journals has increased dramatically in the past 20 years. As a result, while it may be more likely that your question has been addressed somewhere, it can be more difficult to locate the paper you need. One approach to this problem is to become skilled in developing search strategies. We will return to this, but an alternative is to utilize secondary journals such as ACP Journal Club (www.acponline.org) or prefiltered sources such as the Cochrane Library (www.cochrane.org).
Secondary journals typically screen articles for both clinical relevance and methodologic quality, making them efficient resources for busy clinicians. The Cochrane Library focuses mainly on systematic reviews of controlled trials of therapeutic interventions. The main downside of these sources is that they may not address your particular question. Therefore, one effective search strategy is to first search a secondary journal or prefiltered source and stop if you find what you need. If you don’t find what you are looking for, you will need to enter the world of the large medical research database armed with a search strategy.
Constructing effective search strategies is perhaps even more of an art than constructing effective clinical questions. Luckily, medical librarians are experts at this and should be your first stop. Not only can skilled medical librarians help you with your searches, they can also teach you efficient ways to conduct simple searches yourself. I will mention a few of these strategies, but these are truly only the tip of the iceberg.
The key elements of searching the large medical information databases such as MEDLINE include an understanding of Medical Subject Headings (MeSH), text-word searching, and combining searches. Mapping to a MeSH term and clicking the “explode” option on the search page will gather not just those papers indexed to the term of interest, but also papers referencing more specific aspects of that term. Clicking on the search term itself will reveal the “tree” of terms related to your chosen search term. For example, try searching MEDLINE for “cancer.” You will be mapped to “neoplasms,” and if you click on that term, you will see a tree of related terms. If you select “explode” for your initial search, you will include each of these related terms, expanding your search. You could also narrow your search by selecting “neoplasms by site” or another subheading, and further refining your approach from there.
To begin a search, it is helpful to first enter in relevant keywords from your clinical question. Following our previous example, these could include renal cell carcinoma, chemotherapy, and survival. Then you could perform one search for each term, combining them using the search window options. Alternatively, each term could be linked in one search using the AND/OR operators. Further restrictions such as looking only at randomized controlled trials or for specific authors are also possible. Finally, many MEDLINE sites have a collection of saved search strategies for common clinical question types. For example, a saved search strategy for articles on diagnosis (or therapy, prognosis, or any other question type) can provide an effective searching technique based on the expertise of your resident search professional.
Because many of these approaches rely on the way in which an article has been indexed, searching for synonyms can also be helpful. You may search for temporal arteritis and miss articles indexed only under giant cell arteritis, for example. MEDLINE does a good job of mapping these terms to each other, but this can fall short, particularly if you search by text word alone. Being clever with synonyms can be the difference between finding and missing the one key article that will answer your clinical question.
Searchable Sources of Medical Information
“Overview of Searchable Sources of Medical Information” (p. 18) presents a brief overview of searchable sources of information. Becoming a searching expert takes considerable dedication, but fortunately the basic strategies are not overly complicated. Additionally, significant efforts are being made to simplify the steps needed to answer clinical questions, as can be seen in the growing number of secondary journals available for both general medicine and subspecialties.
Summary
Searching for the answers to well-constructed clinical questions is obviously a crucial step in the EBM process. Well-built questions suggest efficient search strategies, simplifying what can be a complex and daunting process. Many resources are available to help with this step, including medical librarians, prefiltered searches, and saved searches for common query types. Once you locate an article addressing your clinical question, the next step is to critically appraise the article to determine whether its results are applicable to your patient. TH
Dr. West practices in the Division of General Internal Medicine, Mayo Clinic College of Medicine, Rochester, Minn.
Evidence Based Medicine for The Hospitalist
Each of us asks dozens of clinical questions every day. Sometimes the answers are clear: If our question is “Which statin is on formulary?” the answer will be provided to us by a patient’s insurance plan or by our own hospital pharmacy. Many times, however, the answers to our questions aren’t so well defined. Further, these are often the questions that most affect patient care: This is precisely why we ask them in the first place. Many of us give little thought to how we state our questions, but the format of a question can have a dramatic effect on whether or not we will be able to locate an answer. There is an art to asking clinical questions in a manner that maximizes our ability to find a meaningful answer in an efficient way.
Consider an example: We are seeing a 72-year-old man newly diagnosed with a stage II (T2M0N0) renal cell carcinoma. We are curious about treatment options, so we might ask, “Should all cancer patients receive chemotherapy?” It is intuitively clear that the answer to this question depends on a multitude of variables not clarified in the question.
For example, different types of cancer respond differently to chemotherapy and there are innumerable chemotherapy regimens, each having differing mechanisms of action. The patient’s age and gender may matter, and the patient’s medical history will almost certainly affect treatment options. As stated the question is essentially impossible to answer.
A better question might be, “Among men over age 65 with stage II renal cell carcinoma, does post-resection chemotherapy prolong survival compared with nephrectomy alone?” This question is far more specific and therefore more relevant to our individual patient. It is also more likely to yield an answer when we search for one. The point of this somewhat extreme example is that a clear, focused clinical question will usually lead to more precise answers. A vague question will often lead only to frustration.
Construct an Effective Clinical Question
How, then, can we phrase questions to optimize our chances of obtaining clinically helpful answers? One approach is to adopt the PICO or PICOT format. (See “Illustration of PICOT Approach to Clinical Questions,” p. 32.) This format provides a structure for question formation that emphasizes the elements most questions are designed to address: the patients of interest, the intervention in question, what it will be compared with, and what outcome we wish to assess.
The first element (P) represents the patient or population of interest. The aim is to define a group of patients similar to the one prompting the question. For example, our patient is a 72-year-old man with stage II renal cell carcinoma, so we would like to find information on patients that at least approximately fit this description.
The second element (I) represents the intervention, which is usually fairly straightforward to determine if the question relates to a choice of treatments. However, this can also be the prognostic factor or exposure of interest, depending on the type of study and specific question. In our example, the intervention is post-resection chemotherapy, and our clinical question needs to incorporate this information.
The third element (C) is the comparison of interest, if appropriate. For some questions there may not be a comparison, such as when we simply want to know how often a certain side effect occurs. In our example, though, the comparison group is patients treated with surgical resection alone.
The final element (O) is the outcome. The aim here is to define the specific result you are interested in. This will be patient survival in many cases, but it can also be incidence of side effects, correct diagnosis of disease, or any number of other possibilities. In the example, the outcome of interest is survival. We might wish to further refine this by imposing a time at which we would like to assess survival, leading us to look at five-year survival rates, for instance.
An additional element that can be helpful to consider at this stage of the EBM process is what type (T) of question you are asking or what type of study would answer your question. Questions regarding treatment interventions are often questions of therapy and may suggest a search for randomized controlled trials or meta-analyses. Questions regarding the most appropriate diagnostic tests will be best answered by different types of studies. There are many possible types of questions and quite a few types of studies (the Guyatt and Rennie text in “Recommended Reading”(this page, top left) provides many excellent examples), but taking a moment to consider your options can further refine your subsequent search strategy and is well worth the time.
Advantages of the PICOT Question Format
The PICOT approach to constructing clinical questions focuses questions, allowing us to clarify exactly what we hope to answer. This format also provides insight into possible sources that may yield the answers we seek. For example, the question, “How are the stages of renal cell carcinoma defined?” This is a so-called background medical knowledge question and may be answerable by simply reviewing a textbook rather than conducting a complex and exhaustive literature search.
On the other hand, the more specific foreground question outlined in “Illustration of PICOT Approach to Clinical Questions” will likely require a more detailed search of the latest clinical trials.
Finally, this format facilitates the terms we will actually use when conducting the literature search. In many cases, the search terms may be lifted directly from the clinical question, and the PICOT approach typically suggests multiple search terms that can narrow your search. We will explore this further in the next entry of this series.
Summary
Constructing effective clinical questions is an important step in the EBM process. The well-built question makes searching for answers simpler, saving time and effort. The PICOT approach provides a structure flexible enough to accommodate almost any question, and leads directly to more effective search strategies. We will explore search strategies further in the next installment of this series. TH
Dr. West practices in the Division of General Internal Medicine, Mayo Clinic College of Medicine, Rochester, Minn.
Evidence Based Medicine for The Hospitalist
While the idea of applying current knowledge to patient care dates back as far as medicine itself, the modern concept of evidence-based medicine (EBM) has developed in response to the ever-increasing need for clinicians to make patient care decisions in a reasoned and rational manner. It is the application of evidence gleaned from careful research, merged with clinical experience, patient values, and the unique features of every individual case, for the purpose of making the most effective patient care decisions.
It must be noted that the search for and use of the best evidence does not by itself constitute the appropriate practice of EBM: Patient care requires a more global balance of many factors, and true EBM attempts to address this. While there are general themes to an EBM approach to clinical problems, it would be a mistake to view EBM as a search for a “script” to follow in deciding how to handle a clinical presentation. EBM is not meant to exclude the individualized approach to medicine, but rather to enhance and refine it.
Perhaps the best way to think of EBM comes from McMaster University (Hamilton, Ontario, Canada), where in the 1970s the scholarly pursuit of EBM began to flourish. Researchers at McMaster describe EBM as the development of an attitude of enlightened skepticism toward the evidence behind daily clinical decisions. Clinical evidence should be viewed through the lens of epidemiologic principles, and rather than accepting all that we are told, we should require a careful evaluation of the evidence. Our patients demand the best possible care, and we owe it to ourselves, our patients, and our profession to determine the best possible care for each individual.
HOW IS EBM RELEVANT TO THE HOSPITALIST?
To make effective patient care decisions, hospitalists are no different than other clinicians. In fact, every practicing hospitalist asks and answers dozens of clinical questions each day, and many of these decisions immediately affect the well-being of patients.
For example, should an otherwise healthy 60-year-old patient receive perioperative beta-blocker therapy prior to laparoscopic cholecystectomy? What is the best way to evaluate this diabetic woman’s nonhealing leg ulcer for osteomyelitis? What is the prognosis for this young man newly diagnosed with glioblastoma multiforme?
Each of these is an example of a clinical question many of us may have already asked ourselves today. Hospital medicine moves quickly, and it is important to find the best answers to these questions as rapidly as possible. EBM provides a framework to help get to these answers and ultimately it helps us manage patients most effectively.

An additional aspect of hospitalist practice that is somewhat unique is the central role the hospitalist plays in the complete care of patients. The hospitalist is often called upon to bring specialists together for a patient’s care, and EBM can be important in ensuring that these specialists make the best decisions for the patient.
For example, a careful review of the literature suggests that low molecular weight heparin is preferable to aspirin for postoperative deep vein thrombosis prophylaxis for most hip replacement patients. If an orthopedic service nevertheless writes orders for aspirin in such a patient, the informed hospitalist would want to clarify the rationale behind this choice and if appropriate recommend the use of low molecular weight heparin instead. Thus, hospitalists may need to anticipate not only their own clinical questions but also any clinical question relevant to the care of any of their patients.
THE ELEMENTS OF EBM?
At its essence, EBM means applying the best evidence available for the benefit of patients. In this series, we will review the basic elements of EBM:
- Constructing an answerable clinical question;
- Searching for the best evidence for the question at hand;
- Critically appraising the evidence for its validity, importance, and relevance to your patient; and
- Applying the best evidence to your clinical practice.
Each of these deserves a brief comment. To find the information most relevant to a clinical question, it is helpful to have a well-defined query of appropriately narrow scope. If we
want information on perioperative beta-blockade in the scenario outlined above, it may not be helpful to apply evidence derived from vascular surgery patients over age 65 with known coronary artery disease. If information were available on outcomes in younger patients undergoing lower-risk procedures, this might be more relevant to our question. Thus, an approach to constructing effective clinical questions is a critical skill for EBM.
The best clinical question cannot help us if we don’t know how to find the evidence relating to that question, however. Therefore, EBM requires some understanding of the relative benefits of sources such as Ovid MEDLINE (www.medscape.com) or UpToDate (www.uptodate.com), in addition to how to navigate through these sources to get to the evidence. Thankfully, these databases are becoming more powerful all the time, while also working to remain user-friendly. An approach to effective searches is clearly an important skill for EBM.
Once we have found the evidence for our question, we need to know how to evaluate the quality of the evidence. There are many guides available for individual types of clinical questions, but there are consistent themes across all types of questions, including assessment for potential bias, proper interpretation of study results, and deciding whether the results can be applied to your patient. Understanding these themes and then taking the evidence back to the bedside is the culmination of the EBM process for our patients.
SUMMARY
EBM is an approach to making patient care decisions incorporating the highest quality available evidence. This is of great relevance to hospitalists, especially given the central role hospitalists play in the care of patients across multiple disciplines. This series will serve as an introduction to the many facets of EBM, focused to a practicing hospitalist audience. TH
Dr. West practices in the Division of General Internal Medicine, Mayo Clinic College of Medicine, Rochester, Minn.
While the idea of applying current knowledge to patient care dates back as far as medicine itself, the modern concept of evidence-based medicine (EBM) has developed in response to the ever-increasing need for clinicians to make patient care decisions in a reasoned and rational manner. It is the application of evidence gleaned from careful research, merged with clinical experience, patient values, and the unique features of every individual case, for the purpose of making the most effective patient care decisions.
It must be noted that the search for and use of the best evidence does not by itself constitute the appropriate practice of EBM: Patient care requires a more global balance of many factors, and true EBM attempts to address this. While there are general themes to an EBM approach to clinical problems, it would be a mistake to view EBM as a search for a “script” to follow in deciding how to handle a clinical presentation. EBM is not meant to exclude the individualized approach to medicine, but rather to enhance and refine it.
Perhaps the best way to think of EBM comes from McMaster University (Hamilton, Ontario, Canada), where in the 1970s the scholarly pursuit of EBM began to flourish. Researchers at McMaster describe EBM as the development of an attitude of enlightened skepticism toward the evidence behind daily clinical decisions. Clinical evidence should be viewed through the lens of epidemiologic principles, and rather than accepting all that we are told, we should require a careful evaluation of the evidence. Our patients demand the best possible care, and we owe it to ourselves, our patients, and our profession to determine the best possible care for each individual.
HOW IS EBM RELEVANT TO THE HOSPITALIST?
To make effective patient care decisions, hospitalists are no different than other clinicians. In fact, every practicing hospitalist asks and answers dozens of clinical questions each day, and many of these decisions immediately affect the well-being of patients.
For example, should an otherwise healthy 60-year-old patient receive perioperative beta-blocker therapy prior to laparoscopic cholecystectomy? What is the best way to evaluate this diabetic woman’s nonhealing leg ulcer for osteomyelitis? What is the prognosis for this young man newly diagnosed with glioblastoma multiforme?
Each of these is an example of a clinical question many of us may have already asked ourselves today. Hospital medicine moves quickly, and it is important to find the best answers to these questions as rapidly as possible. EBM provides a framework to help get to these answers and ultimately it helps us manage patients most effectively.
An additional aspect of hospitalist practice that is somewhat unique is the central role the hospitalist plays in the complete care of patients. The hospitalist is often called upon to bring specialists together for a patient’s care, and EBM can be important in ensuring that these specialists make the best decisions for the patient.
For example, a careful review of the literature suggests that low molecular weight heparin is preferable to aspirin for postoperative deep vein thrombosis prophylaxis for most hip replacement patients. If an orthopedic service nevertheless writes orders for aspirin in such a patient, the informed hospitalist would want to clarify the rationale behind this choice and if appropriate recommend the use of low molecular weight heparin instead. Thus, hospitalists may need to anticipate not only their own clinical questions but also any clinical question relevant to the care of any of their patients.
THE ELEMENTS OF EBM?
At its essence, EBM means applying the best evidence available for the benefit of patients. In this series, we will review the basic elements of EBM:
- Constructing an answerable clinical question;
- Searching for the best evidence for the question at hand;
- Critically appraising the evidence for its validity, importance, and relevance to your patient; and
- Applying the best evidence to your clinical practice.
Each of these deserves a brief comment. To find the information most relevant to a clinical question, it is helpful to have a well-defined query of appropriately narrow scope. If we
want information on perioperative beta-blockade in the scenario outlined above, it may not be helpful to apply evidence derived from vascular surgery patients over age 65 with known coronary artery disease. If information were available on outcomes in younger patients undergoing lower-risk procedures, this might be more relevant to our question. Thus, an approach to constructing effective clinical questions is a critical skill for EBM.
The best clinical question cannot help us if we don’t know how to find the evidence relating to that question, however. Therefore, EBM requires some understanding of the relative benefits of sources such as Ovid MEDLINE (www.medscape.com) or UpToDate (www.uptodate.com), in addition to how to navigate through these sources to get to the evidence. Thankfully, these databases are becoming more powerful all the time, while also working to remain user-friendly. An approach to effective searches is clearly an important skill for EBM.
Once we have found the evidence for our question, we need to know how to evaluate the quality of the evidence. There are many guides available for individual types of clinical questions, but there are consistent themes across all types of questions, including assessment for potential bias, proper interpretation of study results, and deciding whether the results can be applied to your patient. Understanding these themes and then taking the evidence back to the bedside is the culmination of the EBM process for our patients.
SUMMARY
EBM is an approach to making patient care decisions incorporating the highest quality available evidence. This is of great relevance to hospitalists, especially given the central role hospitalists play in the care of patients across multiple disciplines. This series will serve as an introduction to the many facets of EBM, focused to a practicing hospitalist audience. TH
Dr. West practices in the Division of General Internal Medicine, Mayo Clinic College of Medicine, Rochester, Minn.