User login
Editors’ note: We inadvertently published part 2 of the “Statistics in the Literature” (May 2006, p. 15) series installments in May (p. 15) out of order. In fact, the following series installment should have preceded the installment we published in May. Therefore, the following series installment is the last in the EBM series. We apologize for any inconvenience.
Why Do Statistical Methods Matter?
Critical appraisal of the literature does not stop with evaluation of bias and review of results. While it would be nice to simply trust that the reported methods in a paper tell the whole story, this approach would be inconsistent with the core principle of EBM: a global attitude of enlightened skepticism. Statistics in the literature should be subject to the same appraisal as every other aspect of a study.
But is such detail truly necessary? If a paper meets the standard criteria for validity, can’t we assume that the statistics are also valid? Most of us would like to be able to just accept that the P values and confidence intervals we see in a paper are appropriate. Even EBM experts tend to feel this way, as evidenced by the statement in Sackett, et al. (1998) that “if good [study] methods were used, the investigators probably went to the effort to use good statistics.” Unfortunately, repeated studies of the statistical methods reported in literature across many fields suggest that up to 50% of papers contain major statistical flaws, many of which could affect the conclusions of the paper. This occurs even in top-tier journals, so no source is immune.
This problem is compounded by the fact that the statistical knowledge of the average clinician is quite limited. Journals certainly have a responsibility to ensure the presentation of valid research, but how many of us (as reader or reviewer) are qualified to assess the statistical methodology from which a study’s conclusions result? It’s trouble enough to work through the critical appraisal process outlined in the previous installments of this series, let alone dig deeper into how the results were generated.
In fact each reader must act as his or her own judge of a study’s ultimate value, and ignorance of basic statistical principles cannot be an excuse for accepting faulty research. Remember, we make patient care decisions based on our reviews of the literature, so there is a very real incentive to ensure we apply the best evidence both epidemiologically and statistically: Our patients are counting on us. With this in mind, we will conclude this series with a two-part discussion of some of the core statistical concepts to consider when evaluating a paper.
Commonly Reported Statistical Terms
P values: The P value is perhaps the most widely reported yet least understood statistical measure. Consider a comparison of a new treatment with placebo: The null hypothesis (H0) is the hypothesis of null effect, usually meaning that the treatment effect equals the placebo effect. The technical definition of a P value is the probability of observing at least as extreme a result as that found in your study if this null hypothesis were true. The condition in italics is crucial: Remember, we never know if the null hypothesis is true (and if we did, there would be no need for further research).
Usually, however, the P value is interpreted incorrectly as the probability that a study’s results could have occurred due to chance alone, with no mention of the condition. Thus, a P value of 0.05 is thought (wrongly) to mean that there is a 5% chance that the study’s results are wrong.
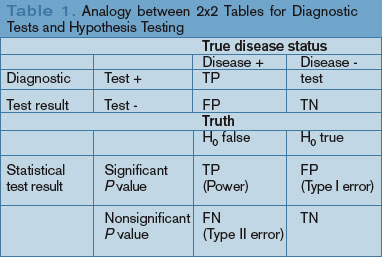
Of course, rather than the probability of the data we observed assuming the null hypothesis were true (our friend the P value), we want to know the probability that a reported result is true given the data we observed. To illustrate this point, most clinicians have little difficulty with the idea that sensitivity and specificity are only part of the story for a diagnostic test. Recall that specificity is the probability of a negative test result assuming the patient does not have the disease. We need to know the prevalence of disease to be able to convert this into a negative predictive value directly relevant to patient care: the probability of not having the disease given our negative test result (likelihood ratios do this all in one step, but accomplish the same thing).
The analogy between diagnostic test characteristics and statistical test characteristics is presented graphically. (See Table 1, p. 28.) Without the prevalence term (in this case, the probability that the null hypothesis is true) P values do not answer our research question any better than specificity tells us how likely a patient is to be free of a disease. For a patient with a high pre-test probability of disease, a highly specific test that returns a negative result is more likely to represent a false negative than a true negative, despite the high specificity. Similarly, a statistically significant P value from a study in which the hypothesis in question is itself questionable is more likely to represent a false conclusion than a true one. This has resulted in one author’s recent statement that “most published research findings are false.”1 Solutions to these P value issues may lie in the field of Bayesian methods, but to date these approaches have proven too complicated for routine use. P values remain useful and are the common language for reporting results, but it is important to recognize that they do not directly answer the research questions we often think they answer.
Confidence intervals: Confidence intervals provide more information than P values by offering a range of values within which the “truth” is likely to be found. The technical definition of a confidence interval is complicated and confusing even to many statisticians. Generally speaking, however, confidence intervals are derived from the same methodology as P values and correlate with P values as follows: If the confidence interval crosses the point of equivalence (e.g., a relative risk of 1 or an absolute risk reduction of 0), the P value will not be statistically significant at the same level. Therefore, a 95% confidence interval for a relative risk that crosses 1 correlates with a P value greater than 0.05. Conversely, if the confidence interval does not cross this line, the P value will be statistically significant.
The additional information offered by the confidence interval relates to the width of the interval. Wider confidence intervals suggest that less faith should be placed on specific point estimates of a treatment’s effect, while narrower confidence intervals suggest that we can be more sure where the true effect lies (i.e., our estimate of the treatment effect is more precise). However, because confidence intervals are derived from the same statistical methods as P values, they are also subject to the problems previously described for P values.
A dose of common sense: Statistics serve as a way to condense research findings into easily digestible end products; however, the important parts of any paper come well before the first P value is generated. Good research requires good design, and only then can sound statistical approaches provide valid insights into complex study results. In addition, for a study’s results to be applied to our patients, not only must the design and analysis be appropriate, but we must also carefully consider issues beyond the aims of most studies, including value judgments.
Summary
Classically, EBM has focused on careful critical appraisal of study design, with relatively little consideration of the analytic approaches that provide a study’s results. Statistics can clarify study results, but if applied improperly can invalidate even a well-designed study. It is important for clinicians to recognize that statistics should also be evaluated critically when attempting to apply research findings to the care of our patients. TH
Dr. West practices in the Division of General Internal Medicine, Mayo Clinic College of Medicine, Rochester, Minn.
Reference
- Ioannidis JPA. Why most research findings are false. PLoS Med. 2005;2:e124.
Editors’ note: We inadvertently published part 2 of the “Statistics in the Literature” (May 2006, p. 15) series installments in May (p. 15) out of order. In fact, the following series installment should have preceded the installment we published in May. Therefore, the following series installment is the last in the EBM series. We apologize for any inconvenience.
Why Do Statistical Methods Matter?
Critical appraisal of the literature does not stop with evaluation of bias and review of results. While it would be nice to simply trust that the reported methods in a paper tell the whole story, this approach would be inconsistent with the core principle of EBM: a global attitude of enlightened skepticism. Statistics in the literature should be subject to the same appraisal as every other aspect of a study.
But is such detail truly necessary? If a paper meets the standard criteria for validity, can’t we assume that the statistics are also valid? Most of us would like to be able to just accept that the P values and confidence intervals we see in a paper are appropriate. Even EBM experts tend to feel this way, as evidenced by the statement in Sackett, et al. (1998) that “if good [study] methods were used, the investigators probably went to the effort to use good statistics.” Unfortunately, repeated studies of the statistical methods reported in literature across many fields suggest that up to 50% of papers contain major statistical flaws, many of which could affect the conclusions of the paper. This occurs even in top-tier journals, so no source is immune.
This problem is compounded by the fact that the statistical knowledge of the average clinician is quite limited. Journals certainly have a responsibility to ensure the presentation of valid research, but how many of us (as reader or reviewer) are qualified to assess the statistical methodology from which a study’s conclusions result? It’s trouble enough to work through the critical appraisal process outlined in the previous installments of this series, let alone dig deeper into how the results were generated.
In fact each reader must act as his or her own judge of a study’s ultimate value, and ignorance of basic statistical principles cannot be an excuse for accepting faulty research. Remember, we make patient care decisions based on our reviews of the literature, so there is a very real incentive to ensure we apply the best evidence both epidemiologically and statistically: Our patients are counting on us. With this in mind, we will conclude this series with a two-part discussion of some of the core statistical concepts to consider when evaluating a paper.
Commonly Reported Statistical Terms
P values: The P value is perhaps the most widely reported yet least understood statistical measure. Consider a comparison of a new treatment with placebo: The null hypothesis (H0) is the hypothesis of null effect, usually meaning that the treatment effect equals the placebo effect. The technical definition of a P value is the probability of observing at least as extreme a result as that found in your study if this null hypothesis were true. The condition in italics is crucial: Remember, we never know if the null hypothesis is true (and if we did, there would be no need for further research).
Usually, however, the P value is interpreted incorrectly as the probability that a study’s results could have occurred due to chance alone, with no mention of the condition. Thus, a P value of 0.05 is thought (wrongly) to mean that there is a 5% chance that the study’s results are wrong.
Of course, rather than the probability of the data we observed assuming the null hypothesis were true (our friend the P value), we want to know the probability that a reported result is true given the data we observed. To illustrate this point, most clinicians have little difficulty with the idea that sensitivity and specificity are only part of the story for a diagnostic test. Recall that specificity is the probability of a negative test result assuming the patient does not have the disease. We need to know the prevalence of disease to be able to convert this into a negative predictive value directly relevant to patient care: the probability of not having the disease given our negative test result (likelihood ratios do this all in one step, but accomplish the same thing).
The analogy between diagnostic test characteristics and statistical test characteristics is presented graphically. (See Table 1, p. 28.) Without the prevalence term (in this case, the probability that the null hypothesis is true) P values do not answer our research question any better than specificity tells us how likely a patient is to be free of a disease. For a patient with a high pre-test probability of disease, a highly specific test that returns a negative result is more likely to represent a false negative than a true negative, despite the high specificity. Similarly, a statistically significant P value from a study in which the hypothesis in question is itself questionable is more likely to represent a false conclusion than a true one. This has resulted in one author’s recent statement that “most published research findings are false.”1 Solutions to these P value issues may lie in the field of Bayesian methods, but to date these approaches have proven too complicated for routine use. P values remain useful and are the common language for reporting results, but it is important to recognize that they do not directly answer the research questions we often think they answer.
Confidence intervals: Confidence intervals provide more information than P values by offering a range of values within which the “truth” is likely to be found. The technical definition of a confidence interval is complicated and confusing even to many statisticians. Generally speaking, however, confidence intervals are derived from the same methodology as P values and correlate with P values as follows: If the confidence interval crosses the point of equivalence (e.g., a relative risk of 1 or an absolute risk reduction of 0), the P value will not be statistically significant at the same level. Therefore, a 95% confidence interval for a relative risk that crosses 1 correlates with a P value greater than 0.05. Conversely, if the confidence interval does not cross this line, the P value will be statistically significant.
The additional information offered by the confidence interval relates to the width of the interval. Wider confidence intervals suggest that less faith should be placed on specific point estimates of a treatment’s effect, while narrower confidence intervals suggest that we can be more sure where the true effect lies (i.e., our estimate of the treatment effect is more precise). However, because confidence intervals are derived from the same statistical methods as P values, they are also subject to the problems previously described for P values.
A dose of common sense: Statistics serve as a way to condense research findings into easily digestible end products; however, the important parts of any paper come well before the first P value is generated. Good research requires good design, and only then can sound statistical approaches provide valid insights into complex study results. In addition, for a study’s results to be applied to our patients, not only must the design and analysis be appropriate, but we must also carefully consider issues beyond the aims of most studies, including value judgments.
Summary
Classically, EBM has focused on careful critical appraisal of study design, with relatively little consideration of the analytic approaches that provide a study’s results. Statistics can clarify study results, but if applied improperly can invalidate even a well-designed study. It is important for clinicians to recognize that statistics should also be evaluated critically when attempting to apply research findings to the care of our patients. TH
Dr. West practices in the Division of General Internal Medicine, Mayo Clinic College of Medicine, Rochester, Minn.
Reference
- Ioannidis JPA. Why most research findings are false. PLoS Med. 2005;2:e124.