User login
Teaching Cases Perception vs Reality
The advent of work‐hour restrictions and admission limits for teaching services has led many academic hospitals to implement hospitalist‐run staff (ie, nonteaching) services.[1] Although this practice is not new,[2] it is growing in popularity[3] and has been endorsed as a way to protect resident teaching and prevent excessive workload.[4] One potential benefit is the assignment of more educational cases to teaching services, whereas the nonteaching services receive more patients whose care is presumably relatively mundane or routine.[5]
Despite the rapid growth of this system of educational triage,[6] little is known about the factors considered when teaching versus nonteaching decisions are made. Studies of clinical outcomes for patients assigned to teaching versus nonteaching services have understandably used random assignment,[7, 8] whereas a study finding that patients with unhealthy substance use were more likely to be on teaching services than nonteaching services relied on patient assignment based on the identity of the patient's primary care provider or insurer.[9] In 2009, O'Connor et al. reported that implementation of nonteaching services at 2 hospitals had led to unequal distribution of patients in terms of demographics, diagnosis, and illness severity.[10] Triage decisions were made by either a nurse coordinator or a medical chief resident, and sicker patients (and occasionally good teaching cases) were preferentially placed on the teaching services, reportedly out of respect for the comfort level of the midlevel providers who staffed the nonteaching services.
Our institution has used a system of hospitalist educational triage since 1998. Over that time, residents have often expressed concerns about the assignment of patients to the teaching services, reporting in particular that they receive a disproportionate number of complex cases and outside transfers. In 2006, the hospitalist group attempted to address these concerns by collecting real‐time admission data, but the application of the data was limited by suspicion on both sides of a Hawthorne effect (data not published).
If trainee and hospitalist expectations for what constitutes a great teaching case differ substantially, that difference can have significant implications for resident and medical student teaching, self‐perceived roles, and satisfaction. More significantly, an understanding of what faculty perceive as ideal teaching cases would provide valuable information about the strengths and weaknesses of the teachingnonteaching model, which may prove useful to other academic institutions considering such a system. In this study, we endeavored to understand what residents and hospitalists consider an educational admission and to compare these expectations to the actual triage decisions of hospitalists.
METHODS
Mayo Clinic Hospital (Phoenix, Arizona) has used separate teaching and nonteaching services since opening in 1998. At our institution, like many others,[11] a hospitalist is assigned to take all calls for emergency department (ED) admissions, admissions from outpatient clinics, and transfer requests; this physician directs patients to the teaching or nonteaching service. At the time of our study, the 2 teaching services alternated days in which they admitted up to 7 patients, and the 5 nonteaching services admitted all other patients and provided medicine consultative services for the hospital. Teaching services consisted of 1 hospitalist, 2 senior residents, 2 or 3 first‐year residents, and sometimes 1 third‐ or fourth‐year medical student. Nonteaching services consisted of a hospitalist with intermittent assistance from a physician assistant or nurse practitioner.
Although there are no formal guidelines for the hospitalist triage role, hospitalists are encouraged to assign more educational cases to the teaching services and to allow the residents enough time to address the acute needs of the prior admission before receiving the next admission. Residents are not assigned any patients between 4:00 am and 7:00 am. The goals and objectives for the resident rotation on the medicine teaching service include a list of diagnoses with which residents are expected to become familiar during their residency; triage hospitalists have on‐line access to these goals and objectives.
To assess resident and hospitalist opinions about what types of patients should or should not be admitted to teaching services and to compare those characteristics with those of the patients actually admitted to teaching services, we began by administering a simple, open‐ended survey and asked both groups: (1) In an ideal world, what kinds of patients should be admitted to the internal medicine teaching services at Mayo Clinic Hospital? (2) In the real world, what kinds of patients are admitted to the internal medicine teaching services at Mayo Clinic Hospital?
Ample space was provided for free‐text entries. Residents were additionally asked their postgraduate year level. The survey was administered in April 2011, at which time all residents would have rotated on the medicine teaching services several times. Survey responses were anonymous and were compiled and retyped by someone unfamiliar with the subjects' handwriting.
Two authors (D.L.R. and H.R.L.) reviewed the results of the first survey and used conventional content analysis to group responses into categories and tally them.[12] Responses from hospitalists and residents were used to determine the content for a second, quantitative survey that asked respondents to rate specific possible factors that affected triage decisions on a Likert scale from 1 (Argues against teaching admission) to 5 (Argues for teaching admission). The second survey, administered to the same residents and hospitalists in May 2011, asked: (1) In an ideal world, how do these factors contribute to the decision about which patients should be admitted to the internal medicine teaching services at Mayo Clinic Hospital? (2) In the real world, how do these factors contribute to the decision about which patients are admitted to the internal medicine teaching services at Mayo Clinic Hospital?
Assuming a 3:1 ratio of nonteaching to teaching admissions, we calculated that we would need to analyze 1028 admissions to detect a 10% difference in the proportion of a specific trait present in 50% of patients admitted to the nonteaching service, with the use of a 2‐sided test with 80% statistical power and a significance level of 0.05.
We collected data on patient assignment via retrospective chart review to avoid the possibility of a Hawthorne effect. We studied all admissions to the internal medicine services for a 3‐month period before the administration of the first survey (January 1, 2011 through March 31, 2011). The following patient data were collected: service assignment (teaching vs nonteaching), age, sex, source of admission (ED, direct from clinic, outside transfer, internal transfer from another hospital service), first visit to our institution, prior hematology or oncology visit at our institution (as a surrogate for cancer), prior psychiatry visit at our institution (as a surrogate for psychiatric disease), transplantation history, human immunodeficiency virus (HIV) or acquired immune deficiency syndrome (AIDS) history, chronic or functional pain mentioned in ED or admission note, need for translator, and benefactor status. Additionally, an online calculator was used to determine the Charlson Comorbidity Index score for each patient.[13] We collected actual patient data corresponding to factors reported by survey respondents whenever possible and practical, but not every factor reported by survey respondents was amenable to rigorous analysis; for example, no unbiased method could be devised to rigorously categorize patients whose admissions are likely to take more time or difficult patients and families.
Responses to the second (quantitative) survey and patient data were compared using the Pearson [2] and Fisher exact test for categorical variables and the Student t test or Wilcoxon rank sum test for continuous variables. Categorical variables that achieved statistical significance for overall difference were analyzed on a post hoc basis using the Bonferroni method to control for the overall type I error rate. We also examined the differences between actual and ideal triage decisions using the Wilcoxon signed rank test. Data were analyzed using SAS 9.3 (SAS Institute, Inc., Cary, NC). Statistical significance was defined as P<0.05.
The project was deemed exempt by the Mayo Clinic institutional review board.
RESULTS
We surveyed all categorical internal medicine residents (n=30, 10 each from postgraduate year [PGY]‐1, PGY‐2, and PGY‐3) and hospitalists except the authors (n=21; average years since completing training=13.3; range, 129 years). For both surveys, responses were collected from 29 (96.7%) residents. The nonresponding resident was a PGY‐2. The response rate for hospitalists was 20/21 (95.2%) for the first survey and 16/21 (76.2%) for the second survey.
First Survey
Table 1 compares the most frequent resident and faculty responses to the initial, open‐ended survey about what types of patients should or should not be admitted to teaching services. Residents most commonly indicated that ideal patients were traditional medicine cases (ie, bread‐and‐butter admissions, with 13 residents using that exact phrase), and others supplied specific examples of such cases, including chronic obstructive pulmonary disease, pneumonia, diabetic ketoacidosis, congestive heart failure, chest pain, and gastrointestinal tract bleeding. Only 1 faculty member mentioned bread‐and‐butter admissions, although several listed examples like chest pain and pneumonia. A smaller number of residents pointed to the importance of rare cases, whereas faculty considered rare cases to be ideal for teaching services, followed by variety of pathology and complexity.
| Residents (n=29) | Faculty (n=20) | |||
|---|---|---|---|---|
| Question | Characteristic | No. (%) | Characteristic | No. (%) |
| ||||
| In an ideal world, what kinds of patients should be admitted to the internal medicine teaching services at Mayo Clinic Hospital? | Bread‐and butter admissionsb | 14 (44.8) | Rare cases | 9 (45.0) |
| Rare cases | 9 (31.0) | Variety of pathology | 7 (35.0) | |
| No social admissions | 7 (24.1) | Complex cases | 5 (25.0) | |
| New diagnoses instead of chronic management | 4 (13.8) | Variety of complexity | 5 (25.0) | |
| Variety of complexity | 4 (13.8) | Patients with HIV/AIDS | 3 (15.0) | |
| Diagnostic dilemmas | 3 (15.0) | |||
| New diagnoses instead of chronic management | 3 (15.0) | |||
| In the real world, what kinds of patients are admitted to the internal medicine teaching services at Mayo Clinic Hospital? | Patients with cancer | 11 (37.9) | Complex patients | 6 (30.0) |
| Complex patients | 10 (34.5) | Difficult patients | 5 (25.0) | |
| Social admissions | 9 (31.0) | Patients whose admissions are expected to be time consuming | 5 (25.0) | |
| Acutely ill patients | 6 (20.7) | Rare cases | 3 (15.0) | |
| Variety of pathology | 6 (20.7) | Cases determined by the time of day | 3 (15.0) | |
With regard to actual admissions, residents and faculty agreed that they often were complex, but residents were more likely to suggest high rates of patients with cancer (11 residents vs 2 hospitalists) and social admissions (9 residents vs 2 hospitalists). Four residents each believed that they preferentially received elderly patients, outside transfers, and patients with functional pain, and 2 perceived a disproportionate number of patients making their first visit to Mayo Clinic. One hospitalist believed that residents were more likely to receive non‐English speakers.
Second Survey
Table 2 compares the resident and faculty responses to the second, numerical survey regarding ideal admissions to the teaching services. In contrast to the first survey, residents prioritized rare cases as the feature they most associated with ideal teaching admissions. They also placed a premium on variety of pathology, patients with unique findings, and patients likely to be written up or presented. The patients they believed were least appropriate for a teaching service were social admissions or those with placement issues, patients with functional or chronic pain, and benefactors or public figures.
| Factor | Resident, n=29 | Faculty, n=16 | P Value |
|---|---|---|---|
| |||
| Rare diseases | 0.22 | ||
| Mean (SD) | 4.8 (0.5) | 4.9 (0.3) | |
| Median | 5 | 5 | |
| Variety of pathology | 0.22 | ||
| Mean (SD) | 4.7 (0.5) | 4.5 (0.5) | |
| Median | 5 | 5 | |
| Cases that might be written up or presented | 0.35 | ||
| Mean (SD) | 4.7 (0.5) | 4.8 (0.6) | |
| Median | 5 | 5 | |
| Bread‐and‐butter cases | 0.001 | ||
| Mean (SD) | 4.6 (0.7) | 3.7 (0.9) | |
| Median | 5 | 4 | |
| Unique physical findings | 0.67 | ||
| Mean (SD) | 4.6 (0.6) | 4.7 (0.5) | |
| Median | 5 | 5 | |
| Variety of complexity | 0.21 | ||
| Mean (SD) | 4.3 (0.7) | 4.1 (0.6) | |
| Median | 4 | 4 | |
| Variety of acuity | 0.40 | ||
| Mean (SD) | 4.2 (0.7) | 4.1 (0.7) | |
| Median | 4 | 4 | |
| Spectrum of ages | 0.046 | ||
| Mean (SD) | 4.1 (0.8) | 3.6 (0.8) | |
| Median | 4 | 3 | |
| HIV or AIDS | 0.39 | ||
| Mean (SD) | 4.1 (0.9) | 4.4 (0.5) | |
| Median | 4 | 4 | |
| Acutely ill or unstable | 0.54 | ||
| Mean (SD) | 4.0 (0.9) | 3.9 (0.6) | |
| Median | 4 | 4 | |
| Complex patients | 0.94 | ||
| Mean (SD) | 4.0 (0.8) | 3.9 (0.6) | |
| Median | 4 | 4 | |
| Patients at end of life | 0.16 | ||
| Mean (SD) | 3.5 (0.8) | 3.1 (0.6) | |
| Median | 3 | 3 | |
| First‐time Mayo patients | 0.45 | ||
| Mean (SD) | 3.5 (0.7) | 3.3 (0.5) | |
| Median | 3 | 3 | |
| Younger patients | 0.50 | ||
| Mean (SD) | 3.5 (0.9) | 3.3 (0.6) | |
| Median | 3 | 3 | |
| Stable patients | 0.21 | ||
| Mean (SD) | 3.3 (0.8) | 3.1 (0.3) | |
| Median | 3 | 3 | |
| Patients with cancer | 0.67 | ||
| Mean (SD) | 3.3 (0.8) | 3.1 (0.4) | |
| Median | 3 | 3 | |
| Straightforward patients | 0.64 | ||
| Mean (SD) | 3.2 (0.8) | 3.1 (0.8) | |
| Median | 3 | 3 | |
| Older patients | 0.73 | ||
| Mean (SD) | 3.2 (0.7) | 3.1 (0.3) | |
| Median | 3 | 3 | |
| Patients with a history of transplantation | 0.67 | ||
| Mean (SD) | 3.1 (1.1) | 3.3 (0.6) | |
| Median | 3 | 3 | |
| Time of day of admission | 0.71 | ||
| Mean (SD) | 3.1 (1.0) | 3.1 (0.5) | |
| Median | 3 | 3 | |
| Patients with a history of psychiatric illness | 0.59 | ||
| Mean (SD) | 3.1 (1.0) | 3.1 (0.6) | |
| Median | 3 | 3 | |
| Patients who require a translator | 0.49 | ||
| Mean (SD) | 3.0 (0.9) | 3.1 (0.5) | |
| Median | 3 | 3 | |
| Patients whose admissions are expected to take more time | 0.13 | ||
| Mean (SD) | 2.9 (0.8) | 3.2 (0.6) | |
| Median | 3 | 3 | |
| Difficult patients and families | 0.55 | ||
| Mean (SD) | 2.8 (1.0) | 2.6 (0.8) | |
| Median | 3 | 3 | |
| Transfers from other hospitals | 0.11 | ||
| Mean (SD) | 2.7 (1.1) | 3.1 (0.3) | |
| Median | 3 | 3 | |
| Benefactors and public figures | 0.49 | ||
| Mean (SD) | 2.7 (1.0) | 2.5 (0.7) | |
| Median | 3 | 3 | |
| Patients with functional or chronic pain | 0.87 | ||
| Mean (SD) | 2.4 (1.1) | 2.4 (1.0) | |
| Median | 2 | 3 | |
| Social admissions or placement issues | 0.99 | ||
| Mean (SD) | 2.1 (1.1) | 2.0 (1.0) | |
| Median | 2 | 2 | |
Faculty prioritized many of the same features for ideal teaching cases as residents; 4 of their 5 highest‐scoring factors were the same (rare diseases, patients whose cases might be written up or presented, patients with unique physical findings, and variety of pathology). They also agreed on the least ideal features (social admissions or placement issues, patients with functional or chronic pain, and benefactors or public figures). The only significant differences between resident and faculty ratings for ideal teaching cases were for bread‐and‐butter cases and a spectrum of ages.
Discordance between resident and faculty survey responses on actual admission decisions (Table 3) was starker; residents rated several features significantly higher than faculty as features contributing to triage decisions including older patients; patients with functional or chronic pain, social admissions, or placement issues; patients with cancer; transfers from other hospitals; and difficult patients and families. Relative to residents, faculty reported that patients with HIV or AIDS, and patients whose cases were likely to be written up or presented, were more likely to be admitted to teaching services.
| Factor | Resident, n=29 | Faculty, n=16 | P Value |
|---|---|---|---|
| |||
| Rare diseases | 0.14 | ||
| Mean (SD) | 4.4 (0.6) | 4.7 (0.6) | |
| Median | 4 | 5 | |
| Complex patients | 0.83 | ||
| Mean (SD) | 4.3 (0.6) | 4.3 (0.6) | |
| Median | 4 | 4 | |
| Acutely ill or unstable | 0.18 | ||
| Mean (SD) | 4.3 (0.7) | 3.9 (0.9) | |
| Median | 4 | 4 | |
| Unique physical findings | 0.18 | ||
| Mean (SD) | 4.1 (0.8) | 4.5 (0.6) | |
| Median | 4 | 5 | |
| Transfers from other hospitals | 0.003 | ||
| Mean (SD) | 4.1 (1.0) | 3.5 (0.5) | |
| Median | 4 | 3 | |
| Cases that might be written up or presented | 0.03 | ||
| Mean (SD) | 4.1 (0.7) | 4.6 (0.6) | |
| Median | 4 | 5 | |
| Older patients | <0.001 | ||
| Mean (SD) | 3.9 (0.8) | 3.0 (0.7) | |
| Median | 4 | 3 | |
| Time of day of admission | 0.50 | ||
| Mean (SD) | 3.9 (1.1) | 3.7 (0.9) | |
| Median | 4 | 4 | |
| Patients with cancer | 0.01 | ||
| Mean (SD) | 3.9 (0.9) | 3.3 (0.5) | |
| Median | 4 | 3 | |
| Variety of pathology | 0.21 | ||
| Mean (SD) | 3.9 (0.8) | 4.2 (0.7) | |
| Median | 4 | 4 | |
| Patients whose admissions are expected to take more time | 0.13 | ||
| Mean (SD) | 3.9 (1.0) | 3.4 (0.9) | |
| Median | 4 | 3 | |
| HIV or AIDS | 0.008 | ||
| Mean (SD) | 3.8 (0.9) | 4.5 (0.5) | |
| Median | 4 | 4.5 | |
| Variety of complexity | 0.31 | ||
| Mean (SD) | 3.7 (0.9) | 3.9 (0.6) | |
| Median | 3.5 | 4 | |
| Bread‐and‐butter cases | 0.07 | ||
| Mean (SD) | 3.6 (1.0) | 2.9 (1.2) | |
| Median | 3 | 3 | |
| First‐time Mayo patients | 0.82 | ||
| Mean (SD) | 3.6 (0.9) | 3.5 (0.7) | |
| Median | 3 | 3 | |
| Patients with functional or chronic pain | 0.004 | ||
| Mean (SD) | 3.6 (1.0) | 2.8 (0.7) | |
| Median | 4 | 3 | |
| Social admissions or placement issues | 0.03 | ||
| Mean (SD) | 3.5 (1.2) | 2.7 (0.9) | |
| Median | 4 | 3 | |
| Variety of acuity | 0.25 | ||
| Mean (SD) | 3.5 (0.8) | 3.7 (0.6) | |
| Median | 3 | 4 | |
| Difficult patients and families | 0.03 | ||
| Mean (SD) | 3.4 (0.9) | 2.8 (0.7) | |
| Median | 3 | 3 | |
| Patients at end of life | 0.10 | ||
| Mean (SD) | 3.4 (0.8) | 3.0 (0.5) | |
| Median | 3 | 3 | |
| Spectrum of ages | 0.80 | ||
| Mean (SD) | 3.3 (0.7) | 3.3 (0.6) | |
| Median | 3 | 3 | |
| Patients with a history of psychiatric illness | 0.81 | ||
| Mean (SD) | 3.3 (0.9) | 3.1 (0.6) | |
| Median | 3 | 3 | |
| Patients with a history of transplantation | 0.25 | ||
| Mean (SD) | 3.2 (0.9) | 3.5 (0.5) | |
| Median | 3 | 3 | |
| Patients who require a translator | 0.60 | ||
| Mean (SD) | 3.2 (0.7) | 3.2 (0.6) | |
| Median | 3 | 3 | |
| Younger patients | 0.42 | ||
| Mean (SD) | 3.0 (0.9) | 3.1 (0.4) | |
| Median | 3 | 3 | |
| Benefactors and public figures | 0.09 | ||
| Mean (SD) | 2.9 (1.0) | 2.3 (0.7) | |
| Median | 3 | 2 | |
| Straightforward patients | 0.18 | ||
| Mean (SD) | 2.8 (1.0) | 2.4 (1.0) | |
| Median | 2.5 | 2 | |
| Stable patients | 0.53 | ||
| Mean (SD) | 2.7 (1.0) | 2.8 (0.7) | |
| Median | 3 | 3 | |
Comparing resident survey ratings for ideal versus actual triage decisions gave some insight into the features that they thought were inappropriately emphasized or ignored when triage decisions were made. Differences in resident scores for ideal versus actual admissions were significantly different for 16 of 28 items (data available upon request), suggesting a degree of perceived discordance. The largest positive differences (ie, features they valued in teaching admissions but thought were less represented in actual admissions) were for bread‐and‐butter admissions, variety of pathology, a spectrum of ages, and variety of acuity. The largest negative differences (ie, features they thought were well represented in actual admissions but were less valuable) were for social admissions or placement issues, transfers from other hospitals, patients with functional or chronic pain, and patients whose admissions were expected to take more time.
In terms of ideal versus actual triage decisions, faculty reported less discordance than residents; ideal and actual triage behavior differed significantly only for 4 of 28 items (data available upon request). They did agree with residents about the relative lack of bread‐and‐butter admissions and the over‐representation of social admissions or placement issues and transfers from other hospitals. They additionally noted a lack of straightforward cases.
We reviewed records of the 1426 patients admitted to the internal medicine services during the study period. Of these, 359 (25.2%) were assigned to the teaching services. Patient characteristics are summarized in Table 4.
| Characteristic | Teaching Service, n=359 | Nonteaching Service, n=1,067 | P Value |
|---|---|---|---|
| |||
| Age, y, mean (SD) | 66.7 (16.5) | 69.3 (15.7) | 0.008 |
| Admission type, No. (%) | 0.049 | ||
| Admission from the emergency department | 315 (87.7) | 915 (85.8) | 0.34 |
| Direct admission from Mayo outpatient clinic | 27 (7.5) | 114 (10.7) | 0.08 |
| Transfer from another institution | 16 (4.5) | 27 (2.5) | 0.06 |
| Internal transfer from a different hospital service | 1 (0.3) | 11 (1.0) | 0.31 |
| First‐time Mayo patient, No. (%) | 61 (17.0) | 175 (16.4) | 0.79 |
| Prior hematology or oncology visit, No. (%) | 86 (24.0) | 235 (22.0) | 0.45 |
| History of transplantation, No. (%) | 20 (5.6) | 52 (4.9) | 0.60 |
| Prior psychiatry visit, No. (%) | 53 (14.8) | 122 (11.4) | 0.10 |
| History of chronic or functional pain, No. (%) | 122 (34.0) | 330 (30.9) | 0.28 |
| Required translator, No. (%) | 5 (1.4) | 14 (1.3) | 0.91 |
| Benefactor, No. (%) | 5 (1.4) | 24 (2.2) | 0.32 |
| Charlson comorbidity score, mean (SD) | 2.7 (2.5) | 2.6 (2.5) | 0.49 |
DISCUSSION
The results of our qualitative and quantitative surveys showed significant differences between resident and staff perceptions of the faculty triage role. Although both groups similarly valued many features, residents expressed a clear preference for more bread‐and‐butter admissions, whereas the staff prioritized selecting the most complex, challenging, and rare cases from among the day's admissions to give to the residents. (Residents were also very interested in rare cases, suggesting that they saw benefit to admitting patients with a variety of degrees of rarity and complexity.) Residents and faculty seemed to agree that the number of social admissions and outside transfers admitted to teaching services was not ideal.
These perceptions have substantial implications. If the current triage process is to continue, there may be benefit to designing a faculty development project focused on the triage process, which previously has been largely unexamined. Efforts to remove or limit time barriers that prevent perceived educational cases from being admitted to teaching services is also a worthy endeavor (eg, structuring the 2 teams to admit simultaneously so that teaching teams can admit patients back to back without exceeding capacity). In addition, residents may benefit from teaching hospitalists who concentrate educational efforts on the learning that can be extracted from the care of any patient, including admissions that initially seem mundane or purely social.[14] A concerted effort to divert more traditional medicine admissions and fewer unusual cases to the teaching service might improve resident perceptions of the triage process. Further, although the care of any patient can have education benefit, the fact that both groups perceived excessive social admissions in the teaching service suggests that a potential benefit of a nonteaching service (ie, absorbing the most mundane admissions) may not yet be fully realized.
Despite the perceived differences noted on the surveys, we found remarkably few differences between patients admitted to the teaching and nonteaching services. Although both groups rated complexity; outside transfers; being seen at the institution for the first time; and histories of transplantation, cancer, chronic or functional pain, and psychiatric disease as increasing the likelihood of admission to a teaching service, no differences were observed for these factors or their quantifiable surrogates. (Although the overall test for admission type achieved marginal statistical significance, none of the individual admission types were significantly different in post hoc analysis.) Residents, but not faculty, thought that older patients were over‐represented on the teaching service, but their assigned patients were significantly younger than those on the nonteaching service.
These findings have several possible explanations. First, although most hospitalists spend time on teaching and nonteaching services (and therefore are familiar with the patient composition of each), residents get very little exposure to the nonteaching services (until they are senior residents with a rotation on a consulting service). Their impression of inequity may be due to misunderstanding the patient composition of the nonteaching services. Second, the mere existence of a triage role may create false expectations about patient composition; that is, simply by knowing that every admission was chosen for its educational merit, residents may have disproportionate perceptions about those cases judged to have less educational value, even ifas our data suggestassignments to teaching versus nonteaching services are occurring fairly equitably.
Study Limitations
We acknowledge several limitations of our study. First, many factors that were reported as important in the qualitative survey did not lend themselves to objective abstraction from patient records. For example, providers did not specifically document when an admission is purely social, nor was there an objective way to identify difficult patients or families or admissions that were expected to take more time. We attempted to limit the analysis to objective patient metrics that were (1) not influenced by the teaching or nonteaching assignment itself (eg, we avoided discharge diagnoses, which might be entered differently by residents and staff hospitalists) and (2) easily available to triage hospitalists. For the latter reason, we used a prior appointment in the hematology or oncology clinic as a surrogate for cancer patients and a prior psychiatry visit as a surrogate for patients with a history of psychiatric disease. These are naturally inexact surrogates, but they reflect the information a busy hospitalist is likely to access when making patient assignment decisions.
Second, it may well be that assigning patients equitably according to a certain trait is not the same as assigning patients ideally for the educational needs of residents. The patients admitted to our medicine services (teaching and nonteaching) were generally older than 60 years, had complex diagnoses, and had substantial pain. Residents on the teaching services potentially would benefit from an intentionally unbalanced admission policy that shunted patients to the teaching services on the basis of features other than individual perceived educational merit. It must also be borne in mind that resident, and for that matter faculty, perceptions of ideal teaching cases are likely inexact correlates of educational best practices; the ideal role of the triage hospitalist is to admit to the teaching services those patients that will best advance the education of the learners, including a consideration of the goals and objectives of the rotation. Future studies correlating different triage practices to actual educational outcomes would be very helpful.
Third, the analysis could not reliably eliminate patients whose admissions did not represent genuine triage decisions (eg, those assigned to the hospitalist service after the teaching service had reached its capacity or immediately after they had received a complex case). Studying admission decisions prospectively could eliminate this variability, but it could introduce a Hawthorne effect, the negative effects of which likely would outweigh this benefit.
CONCLUSION
Triage hospitalists distributed patients fairly evenly between teaching and nonteaching services, but residents and faculty alike perceived that residents would benefit from more bread‐and‐butter cases. Hospitals considering the addition of a nonteaching service may want to incorporate a faculty development project focused on the triage process to ensure that these traditional medicine cases are assigned to resident services and to ensure that the great teaching case is not considered such because of complexity and acuity alone.
Acknowledgements
The authors thank Elizabeth Jones and Lois Bell for their assistance with survey collection and collation.
Disclosures: This study (institutional review board application #11‐3;002635) was deemed exempt by the Mayo Clinic institutional review board on May 16, 2011. The authors report no conflicts of interest.
- . Duty hours for resident physicians: tough choices for teaching hospitals. N Engl J Med. 2002;347(16):1275–1278.
- , , , , . A randomized, controlled trial of an attending staff service in general internal medicine. Med Care. 1991;29(7 suppl):JS31–JS40.
- , , , , . Non‐housestaff medicine services in academic centers: models and challenges. J Hosp Med. 2008;3(3):247–255.
- , , ; Education Committee of the American College of Physicians. Redesigning training for internal medicine. Ann Intern Med. 2006;144(12):927–932.
- , , , , . Improving resource utilization in a teaching hospital: development of a nonteaching service for chest pain admissions. Acad Med. 2006;81(5):432–435.
- , , . Hospitalists and an innovative emergency department admission process. J Gen Intern Med. 2004;19(3):266–268.
- , , , , . Comparison of resource utilization and clinical outcomes between teaching and nonteaching medical services. J Hosp Med. 2007;2(3):150–157.
- , , , . A comparative study of unscheduled hospital readmissions in a resident‐staffed teaching service and a hospitalist‐based service. South Med J. 2009;102(2):145–149.
- , , , et al. Prevalence of unhealthy substance use on teaching and hospitalist medical services: implications for education. Am J Addict. 2012;21(2):111–119.
- , , , et al. The effect of nonteaching services on the distribution of inpatient cases for internal medicine residents. Acad Med. 2009;84(2):220–225.
- Teaching and nonteaching services: separate no more? Today's Hospitalist website. Available at: http://www.todayshospita list.com/index.php?b=articles_read15(9):1277–1288.
- Charlson comorbidity scoring system: estimating prognosis for dialysis patients. Touchcalc website. Available at: http://www.touchcalc.com/calculators/cci_js#t2_probability. Accessed January 15, 2014.
- . Curiosity. Ann Intern Med. 1999;130(1):70–71.
The advent of work‐hour restrictions and admission limits for teaching services has led many academic hospitals to implement hospitalist‐run staff (ie, nonteaching) services.[1] Although this practice is not new,[2] it is growing in popularity[3] and has been endorsed as a way to protect resident teaching and prevent excessive workload.[4] One potential benefit is the assignment of more educational cases to teaching services, whereas the nonteaching services receive more patients whose care is presumably relatively mundane or routine.[5]
Despite the rapid growth of this system of educational triage,[6] little is known about the factors considered when teaching versus nonteaching decisions are made. Studies of clinical outcomes for patients assigned to teaching versus nonteaching services have understandably used random assignment,[7, 8] whereas a study finding that patients with unhealthy substance use were more likely to be on teaching services than nonteaching services relied on patient assignment based on the identity of the patient's primary care provider or insurer.[9] In 2009, O'Connor et al. reported that implementation of nonteaching services at 2 hospitals had led to unequal distribution of patients in terms of demographics, diagnosis, and illness severity.[10] Triage decisions were made by either a nurse coordinator or a medical chief resident, and sicker patients (and occasionally good teaching cases) were preferentially placed on the teaching services, reportedly out of respect for the comfort level of the midlevel providers who staffed the nonteaching services.
Our institution has used a system of hospitalist educational triage since 1998. Over that time, residents have often expressed concerns about the assignment of patients to the teaching services, reporting in particular that they receive a disproportionate number of complex cases and outside transfers. In 2006, the hospitalist group attempted to address these concerns by collecting real‐time admission data, but the application of the data was limited by suspicion on both sides of a Hawthorne effect (data not published).
If trainee and hospitalist expectations for what constitutes a great teaching case differ substantially, that difference can have significant implications for resident and medical student teaching, self‐perceived roles, and satisfaction. More significantly, an understanding of what faculty perceive as ideal teaching cases would provide valuable information about the strengths and weaknesses of the teachingnonteaching model, which may prove useful to other academic institutions considering such a system. In this study, we endeavored to understand what residents and hospitalists consider an educational admission and to compare these expectations to the actual triage decisions of hospitalists.
METHODS
Mayo Clinic Hospital (Phoenix, Arizona) has used separate teaching and nonteaching services since opening in 1998. At our institution, like many others,[11] a hospitalist is assigned to take all calls for emergency department (ED) admissions, admissions from outpatient clinics, and transfer requests; this physician directs patients to the teaching or nonteaching service. At the time of our study, the 2 teaching services alternated days in which they admitted up to 7 patients, and the 5 nonteaching services admitted all other patients and provided medicine consultative services for the hospital. Teaching services consisted of 1 hospitalist, 2 senior residents, 2 or 3 first‐year residents, and sometimes 1 third‐ or fourth‐year medical student. Nonteaching services consisted of a hospitalist with intermittent assistance from a physician assistant or nurse practitioner.
Although there are no formal guidelines for the hospitalist triage role, hospitalists are encouraged to assign more educational cases to the teaching services and to allow the residents enough time to address the acute needs of the prior admission before receiving the next admission. Residents are not assigned any patients between 4:00 am and 7:00 am. The goals and objectives for the resident rotation on the medicine teaching service include a list of diagnoses with which residents are expected to become familiar during their residency; triage hospitalists have on‐line access to these goals and objectives.
To assess resident and hospitalist opinions about what types of patients should or should not be admitted to teaching services and to compare those characteristics with those of the patients actually admitted to teaching services, we began by administering a simple, open‐ended survey and asked both groups: (1) In an ideal world, what kinds of patients should be admitted to the internal medicine teaching services at Mayo Clinic Hospital? (2) In the real world, what kinds of patients are admitted to the internal medicine teaching services at Mayo Clinic Hospital?
Ample space was provided for free‐text entries. Residents were additionally asked their postgraduate year level. The survey was administered in April 2011, at which time all residents would have rotated on the medicine teaching services several times. Survey responses were anonymous and were compiled and retyped by someone unfamiliar with the subjects' handwriting.
Two authors (D.L.R. and H.R.L.) reviewed the results of the first survey and used conventional content analysis to group responses into categories and tally them.[12] Responses from hospitalists and residents were used to determine the content for a second, quantitative survey that asked respondents to rate specific possible factors that affected triage decisions on a Likert scale from 1 (Argues against teaching admission) to 5 (Argues for teaching admission). The second survey, administered to the same residents and hospitalists in May 2011, asked: (1) In an ideal world, how do these factors contribute to the decision about which patients should be admitted to the internal medicine teaching services at Mayo Clinic Hospital? (2) In the real world, how do these factors contribute to the decision about which patients are admitted to the internal medicine teaching services at Mayo Clinic Hospital?
Assuming a 3:1 ratio of nonteaching to teaching admissions, we calculated that we would need to analyze 1028 admissions to detect a 10% difference in the proportion of a specific trait present in 50% of patients admitted to the nonteaching service, with the use of a 2‐sided test with 80% statistical power and a significance level of 0.05.
We collected data on patient assignment via retrospective chart review to avoid the possibility of a Hawthorne effect. We studied all admissions to the internal medicine services for a 3‐month period before the administration of the first survey (January 1, 2011 through March 31, 2011). The following patient data were collected: service assignment (teaching vs nonteaching), age, sex, source of admission (ED, direct from clinic, outside transfer, internal transfer from another hospital service), first visit to our institution, prior hematology or oncology visit at our institution (as a surrogate for cancer), prior psychiatry visit at our institution (as a surrogate for psychiatric disease), transplantation history, human immunodeficiency virus (HIV) or acquired immune deficiency syndrome (AIDS) history, chronic or functional pain mentioned in ED or admission note, need for translator, and benefactor status. Additionally, an online calculator was used to determine the Charlson Comorbidity Index score for each patient.[13] We collected actual patient data corresponding to factors reported by survey respondents whenever possible and practical, but not every factor reported by survey respondents was amenable to rigorous analysis; for example, no unbiased method could be devised to rigorously categorize patients whose admissions are likely to take more time or difficult patients and families.
Responses to the second (quantitative) survey and patient data were compared using the Pearson [2] and Fisher exact test for categorical variables and the Student t test or Wilcoxon rank sum test for continuous variables. Categorical variables that achieved statistical significance for overall difference were analyzed on a post hoc basis using the Bonferroni method to control for the overall type I error rate. We also examined the differences between actual and ideal triage decisions using the Wilcoxon signed rank test. Data were analyzed using SAS 9.3 (SAS Institute, Inc., Cary, NC). Statistical significance was defined as P<0.05.
The project was deemed exempt by the Mayo Clinic institutional review board.
RESULTS
We surveyed all categorical internal medicine residents (n=30, 10 each from postgraduate year [PGY]‐1, PGY‐2, and PGY‐3) and hospitalists except the authors (n=21; average years since completing training=13.3; range, 129 years). For both surveys, responses were collected from 29 (96.7%) residents. The nonresponding resident was a PGY‐2. The response rate for hospitalists was 20/21 (95.2%) for the first survey and 16/21 (76.2%) for the second survey.
First Survey
Table 1 compares the most frequent resident and faculty responses to the initial, open‐ended survey about what types of patients should or should not be admitted to teaching services. Residents most commonly indicated that ideal patients were traditional medicine cases (ie, bread‐and‐butter admissions, with 13 residents using that exact phrase), and others supplied specific examples of such cases, including chronic obstructive pulmonary disease, pneumonia, diabetic ketoacidosis, congestive heart failure, chest pain, and gastrointestinal tract bleeding. Only 1 faculty member mentioned bread‐and‐butter admissions, although several listed examples like chest pain and pneumonia. A smaller number of residents pointed to the importance of rare cases, whereas faculty considered rare cases to be ideal for teaching services, followed by variety of pathology and complexity.
| Residents (n=29) | Faculty (n=20) | |||
|---|---|---|---|---|
| Question | Characteristic | No. (%) | Characteristic | No. (%) |
| ||||
| In an ideal world, what kinds of patients should be admitted to the internal medicine teaching services at Mayo Clinic Hospital? | Bread‐and butter admissionsb | 14 (44.8) | Rare cases | 9 (45.0) |
| Rare cases | 9 (31.0) | Variety of pathology | 7 (35.0) | |
| No social admissions | 7 (24.1) | Complex cases | 5 (25.0) | |
| New diagnoses instead of chronic management | 4 (13.8) | Variety of complexity | 5 (25.0) | |
| Variety of complexity | 4 (13.8) | Patients with HIV/AIDS | 3 (15.0) | |
| Diagnostic dilemmas | 3 (15.0) | |||
| New diagnoses instead of chronic management | 3 (15.0) | |||
| In the real world, what kinds of patients are admitted to the internal medicine teaching services at Mayo Clinic Hospital? | Patients with cancer | 11 (37.9) | Complex patients | 6 (30.0) |
| Complex patients | 10 (34.5) | Difficult patients | 5 (25.0) | |
| Social admissions | 9 (31.0) | Patients whose admissions are expected to be time consuming | 5 (25.0) | |
| Acutely ill patients | 6 (20.7) | Rare cases | 3 (15.0) | |
| Variety of pathology | 6 (20.7) | Cases determined by the time of day | 3 (15.0) | |
With regard to actual admissions, residents and faculty agreed that they often were complex, but residents were more likely to suggest high rates of patients with cancer (11 residents vs 2 hospitalists) and social admissions (9 residents vs 2 hospitalists). Four residents each believed that they preferentially received elderly patients, outside transfers, and patients with functional pain, and 2 perceived a disproportionate number of patients making their first visit to Mayo Clinic. One hospitalist believed that residents were more likely to receive non‐English speakers.
Second Survey
Table 2 compares the resident and faculty responses to the second, numerical survey regarding ideal admissions to the teaching services. In contrast to the first survey, residents prioritized rare cases as the feature they most associated with ideal teaching admissions. They also placed a premium on variety of pathology, patients with unique findings, and patients likely to be written up or presented. The patients they believed were least appropriate for a teaching service were social admissions or those with placement issues, patients with functional or chronic pain, and benefactors or public figures.
| Factor | Resident, n=29 | Faculty, n=16 | P Value |
|---|---|---|---|
| |||
| Rare diseases | 0.22 | ||
| Mean (SD) | 4.8 (0.5) | 4.9 (0.3) | |
| Median | 5 | 5 | |
| Variety of pathology | 0.22 | ||
| Mean (SD) | 4.7 (0.5) | 4.5 (0.5) | |
| Median | 5 | 5 | |
| Cases that might be written up or presented | 0.35 | ||
| Mean (SD) | 4.7 (0.5) | 4.8 (0.6) | |
| Median | 5 | 5 | |
| Bread‐and‐butter cases | 0.001 | ||
| Mean (SD) | 4.6 (0.7) | 3.7 (0.9) | |
| Median | 5 | 4 | |
| Unique physical findings | 0.67 | ||
| Mean (SD) | 4.6 (0.6) | 4.7 (0.5) | |
| Median | 5 | 5 | |
| Variety of complexity | 0.21 | ||
| Mean (SD) | 4.3 (0.7) | 4.1 (0.6) | |
| Median | 4 | 4 | |
| Variety of acuity | 0.40 | ||
| Mean (SD) | 4.2 (0.7) | 4.1 (0.7) | |
| Median | 4 | 4 | |
| Spectrum of ages | 0.046 | ||
| Mean (SD) | 4.1 (0.8) | 3.6 (0.8) | |
| Median | 4 | 3 | |
| HIV or AIDS | 0.39 | ||
| Mean (SD) | 4.1 (0.9) | 4.4 (0.5) | |
| Median | 4 | 4 | |
| Acutely ill or unstable | 0.54 | ||
| Mean (SD) | 4.0 (0.9) | 3.9 (0.6) | |
| Median | 4 | 4 | |
| Complex patients | 0.94 | ||
| Mean (SD) | 4.0 (0.8) | 3.9 (0.6) | |
| Median | 4 | 4 | |
| Patients at end of life | 0.16 | ||
| Mean (SD) | 3.5 (0.8) | 3.1 (0.6) | |
| Median | 3 | 3 | |
| First‐time Mayo patients | 0.45 | ||
| Mean (SD) | 3.5 (0.7) | 3.3 (0.5) | |
| Median | 3 | 3 | |
| Younger patients | 0.50 | ||
| Mean (SD) | 3.5 (0.9) | 3.3 (0.6) | |
| Median | 3 | 3 | |
| Stable patients | 0.21 | ||
| Mean (SD) | 3.3 (0.8) | 3.1 (0.3) | |
| Median | 3 | 3 | |
| Patients with cancer | 0.67 | ||
| Mean (SD) | 3.3 (0.8) | 3.1 (0.4) | |
| Median | 3 | 3 | |
| Straightforward patients | 0.64 | ||
| Mean (SD) | 3.2 (0.8) | 3.1 (0.8) | |
| Median | 3 | 3 | |
| Older patients | 0.73 | ||
| Mean (SD) | 3.2 (0.7) | 3.1 (0.3) | |
| Median | 3 | 3 | |
| Patients with a history of transplantation | 0.67 | ||
| Mean (SD) | 3.1 (1.1) | 3.3 (0.6) | |
| Median | 3 | 3 | |
| Time of day of admission | 0.71 | ||
| Mean (SD) | 3.1 (1.0) | 3.1 (0.5) | |
| Median | 3 | 3 | |
| Patients with a history of psychiatric illness | 0.59 | ||
| Mean (SD) | 3.1 (1.0) | 3.1 (0.6) | |
| Median | 3 | 3 | |
| Patients who require a translator | 0.49 | ||
| Mean (SD) | 3.0 (0.9) | 3.1 (0.5) | |
| Median | 3 | 3 | |
| Patients whose admissions are expected to take more time | 0.13 | ||
| Mean (SD) | 2.9 (0.8) | 3.2 (0.6) | |
| Median | 3 | 3 | |
| Difficult patients and families | 0.55 | ||
| Mean (SD) | 2.8 (1.0) | 2.6 (0.8) | |
| Median | 3 | 3 | |
| Transfers from other hospitals | 0.11 | ||
| Mean (SD) | 2.7 (1.1) | 3.1 (0.3) | |
| Median | 3 | 3 | |
| Benefactors and public figures | 0.49 | ||
| Mean (SD) | 2.7 (1.0) | 2.5 (0.7) | |
| Median | 3 | 3 | |
| Patients with functional or chronic pain | 0.87 | ||
| Mean (SD) | 2.4 (1.1) | 2.4 (1.0) | |
| Median | 2 | 3 | |
| Social admissions or placement issues | 0.99 | ||
| Mean (SD) | 2.1 (1.1) | 2.0 (1.0) | |
| Median | 2 | 2 | |
Faculty prioritized many of the same features for ideal teaching cases as residents; 4 of their 5 highest‐scoring factors were the same (rare diseases, patients whose cases might be written up or presented, patients with unique physical findings, and variety of pathology). They also agreed on the least ideal features (social admissions or placement issues, patients with functional or chronic pain, and benefactors or public figures). The only significant differences between resident and faculty ratings for ideal teaching cases were for bread‐and‐butter cases and a spectrum of ages.
Discordance between resident and faculty survey responses on actual admission decisions (Table 3) was starker; residents rated several features significantly higher than faculty as features contributing to triage decisions including older patients; patients with functional or chronic pain, social admissions, or placement issues; patients with cancer; transfers from other hospitals; and difficult patients and families. Relative to residents, faculty reported that patients with HIV or AIDS, and patients whose cases were likely to be written up or presented, were more likely to be admitted to teaching services.
| Factor | Resident, n=29 | Faculty, n=16 | P Value |
|---|---|---|---|
| |||
| Rare diseases | 0.14 | ||
| Mean (SD) | 4.4 (0.6) | 4.7 (0.6) | |
| Median | 4 | 5 | |
| Complex patients | 0.83 | ||
| Mean (SD) | 4.3 (0.6) | 4.3 (0.6) | |
| Median | 4 | 4 | |
| Acutely ill or unstable | 0.18 | ||
| Mean (SD) | 4.3 (0.7) | 3.9 (0.9) | |
| Median | 4 | 4 | |
| Unique physical findings | 0.18 | ||
| Mean (SD) | 4.1 (0.8) | 4.5 (0.6) | |
| Median | 4 | 5 | |
| Transfers from other hospitals | 0.003 | ||
| Mean (SD) | 4.1 (1.0) | 3.5 (0.5) | |
| Median | 4 | 3 | |
| Cases that might be written up or presented | 0.03 | ||
| Mean (SD) | 4.1 (0.7) | 4.6 (0.6) | |
| Median | 4 | 5 | |
| Older patients | <0.001 | ||
| Mean (SD) | 3.9 (0.8) | 3.0 (0.7) | |
| Median | 4 | 3 | |
| Time of day of admission | 0.50 | ||
| Mean (SD) | 3.9 (1.1) | 3.7 (0.9) | |
| Median | 4 | 4 | |
| Patients with cancer | 0.01 | ||
| Mean (SD) | 3.9 (0.9) | 3.3 (0.5) | |
| Median | 4 | 3 | |
| Variety of pathology | 0.21 | ||
| Mean (SD) | 3.9 (0.8) | 4.2 (0.7) | |
| Median | 4 | 4 | |
| Patients whose admissions are expected to take more time | 0.13 | ||
| Mean (SD) | 3.9 (1.0) | 3.4 (0.9) | |
| Median | 4 | 3 | |
| HIV or AIDS | 0.008 | ||
| Mean (SD) | 3.8 (0.9) | 4.5 (0.5) | |
| Median | 4 | 4.5 | |
| Variety of complexity | 0.31 | ||
| Mean (SD) | 3.7 (0.9) | 3.9 (0.6) | |
| Median | 3.5 | 4 | |
| Bread‐and‐butter cases | 0.07 | ||
| Mean (SD) | 3.6 (1.0) | 2.9 (1.2) | |
| Median | 3 | 3 | |
| First‐time Mayo patients | 0.82 | ||
| Mean (SD) | 3.6 (0.9) | 3.5 (0.7) | |
| Median | 3 | 3 | |
| Patients with functional or chronic pain | 0.004 | ||
| Mean (SD) | 3.6 (1.0) | 2.8 (0.7) | |
| Median | 4 | 3 | |
| Social admissions or placement issues | 0.03 | ||
| Mean (SD) | 3.5 (1.2) | 2.7 (0.9) | |
| Median | 4 | 3 | |
| Variety of acuity | 0.25 | ||
| Mean (SD) | 3.5 (0.8) | 3.7 (0.6) | |
| Median | 3 | 4 | |
| Difficult patients and families | 0.03 | ||
| Mean (SD) | 3.4 (0.9) | 2.8 (0.7) | |
| Median | 3 | 3 | |
| Patients at end of life | 0.10 | ||
| Mean (SD) | 3.4 (0.8) | 3.0 (0.5) | |
| Median | 3 | 3 | |
| Spectrum of ages | 0.80 | ||
| Mean (SD) | 3.3 (0.7) | 3.3 (0.6) | |
| Median | 3 | 3 | |
| Patients with a history of psychiatric illness | 0.81 | ||
| Mean (SD) | 3.3 (0.9) | 3.1 (0.6) | |
| Median | 3 | 3 | |
| Patients with a history of transplantation | 0.25 | ||
| Mean (SD) | 3.2 (0.9) | 3.5 (0.5) | |
| Median | 3 | 3 | |
| Patients who require a translator | 0.60 | ||
| Mean (SD) | 3.2 (0.7) | 3.2 (0.6) | |
| Median | 3 | 3 | |
| Younger patients | 0.42 | ||
| Mean (SD) | 3.0 (0.9) | 3.1 (0.4) | |
| Median | 3 | 3 | |
| Benefactors and public figures | 0.09 | ||
| Mean (SD) | 2.9 (1.0) | 2.3 (0.7) | |
| Median | 3 | 2 | |
| Straightforward patients | 0.18 | ||
| Mean (SD) | 2.8 (1.0) | 2.4 (1.0) | |
| Median | 2.5 | 2 | |
| Stable patients | 0.53 | ||
| Mean (SD) | 2.7 (1.0) | 2.8 (0.7) | |
| Median | 3 | 3 | |
Comparing resident survey ratings for ideal versus actual triage decisions gave some insight into the features that they thought were inappropriately emphasized or ignored when triage decisions were made. Differences in resident scores for ideal versus actual admissions were significantly different for 16 of 28 items (data available upon request), suggesting a degree of perceived discordance. The largest positive differences (ie, features they valued in teaching admissions but thought were less represented in actual admissions) were for bread‐and‐butter admissions, variety of pathology, a spectrum of ages, and variety of acuity. The largest negative differences (ie, features they thought were well represented in actual admissions but were less valuable) were for social admissions or placement issues, transfers from other hospitals, patients with functional or chronic pain, and patients whose admissions were expected to take more time.
In terms of ideal versus actual triage decisions, faculty reported less discordance than residents; ideal and actual triage behavior differed significantly only for 4 of 28 items (data available upon request). They did agree with residents about the relative lack of bread‐and‐butter admissions and the over‐representation of social admissions or placement issues and transfers from other hospitals. They additionally noted a lack of straightforward cases.
We reviewed records of the 1426 patients admitted to the internal medicine services during the study period. Of these, 359 (25.2%) were assigned to the teaching services. Patient characteristics are summarized in Table 4.
| Characteristic | Teaching Service, n=359 | Nonteaching Service, n=1,067 | P Value |
|---|---|---|---|
| |||
| Age, y, mean (SD) | 66.7 (16.5) | 69.3 (15.7) | 0.008 |
| Admission type, No. (%) | 0.049 | ||
| Admission from the emergency department | 315 (87.7) | 915 (85.8) | 0.34 |
| Direct admission from Mayo outpatient clinic | 27 (7.5) | 114 (10.7) | 0.08 |
| Transfer from another institution | 16 (4.5) | 27 (2.5) | 0.06 |
| Internal transfer from a different hospital service | 1 (0.3) | 11 (1.0) | 0.31 |
| First‐time Mayo patient, No. (%) | 61 (17.0) | 175 (16.4) | 0.79 |
| Prior hematology or oncology visit, No. (%) | 86 (24.0) | 235 (22.0) | 0.45 |
| History of transplantation, No. (%) | 20 (5.6) | 52 (4.9) | 0.60 |
| Prior psychiatry visit, No. (%) | 53 (14.8) | 122 (11.4) | 0.10 |
| History of chronic or functional pain, No. (%) | 122 (34.0) | 330 (30.9) | 0.28 |
| Required translator, No. (%) | 5 (1.4) | 14 (1.3) | 0.91 |
| Benefactor, No. (%) | 5 (1.4) | 24 (2.2) | 0.32 |
| Charlson comorbidity score, mean (SD) | 2.7 (2.5) | 2.6 (2.5) | 0.49 |
DISCUSSION
The results of our qualitative and quantitative surveys showed significant differences between resident and staff perceptions of the faculty triage role. Although both groups similarly valued many features, residents expressed a clear preference for more bread‐and‐butter admissions, whereas the staff prioritized selecting the most complex, challenging, and rare cases from among the day's admissions to give to the residents. (Residents were also very interested in rare cases, suggesting that they saw benefit to admitting patients with a variety of degrees of rarity and complexity.) Residents and faculty seemed to agree that the number of social admissions and outside transfers admitted to teaching services was not ideal.
These perceptions have substantial implications. If the current triage process is to continue, there may be benefit to designing a faculty development project focused on the triage process, which previously has been largely unexamined. Efforts to remove or limit time barriers that prevent perceived educational cases from being admitted to teaching services is also a worthy endeavor (eg, structuring the 2 teams to admit simultaneously so that teaching teams can admit patients back to back without exceeding capacity). In addition, residents may benefit from teaching hospitalists who concentrate educational efforts on the learning that can be extracted from the care of any patient, including admissions that initially seem mundane or purely social.[14] A concerted effort to divert more traditional medicine admissions and fewer unusual cases to the teaching service might improve resident perceptions of the triage process. Further, although the care of any patient can have education benefit, the fact that both groups perceived excessive social admissions in the teaching service suggests that a potential benefit of a nonteaching service (ie, absorbing the most mundane admissions) may not yet be fully realized.
Despite the perceived differences noted on the surveys, we found remarkably few differences between patients admitted to the teaching and nonteaching services. Although both groups rated complexity; outside transfers; being seen at the institution for the first time; and histories of transplantation, cancer, chronic or functional pain, and psychiatric disease as increasing the likelihood of admission to a teaching service, no differences were observed for these factors or their quantifiable surrogates. (Although the overall test for admission type achieved marginal statistical significance, none of the individual admission types were significantly different in post hoc analysis.) Residents, but not faculty, thought that older patients were over‐represented on the teaching service, but their assigned patients were significantly younger than those on the nonteaching service.
These findings have several possible explanations. First, although most hospitalists spend time on teaching and nonteaching services (and therefore are familiar with the patient composition of each), residents get very little exposure to the nonteaching services (until they are senior residents with a rotation on a consulting service). Their impression of inequity may be due to misunderstanding the patient composition of the nonteaching services. Second, the mere existence of a triage role may create false expectations about patient composition; that is, simply by knowing that every admission was chosen for its educational merit, residents may have disproportionate perceptions about those cases judged to have less educational value, even ifas our data suggestassignments to teaching versus nonteaching services are occurring fairly equitably.
Study Limitations
We acknowledge several limitations of our study. First, many factors that were reported as important in the qualitative survey did not lend themselves to objective abstraction from patient records. For example, providers did not specifically document when an admission is purely social, nor was there an objective way to identify difficult patients or families or admissions that were expected to take more time. We attempted to limit the analysis to objective patient metrics that were (1) not influenced by the teaching or nonteaching assignment itself (eg, we avoided discharge diagnoses, which might be entered differently by residents and staff hospitalists) and (2) easily available to triage hospitalists. For the latter reason, we used a prior appointment in the hematology or oncology clinic as a surrogate for cancer patients and a prior psychiatry visit as a surrogate for patients with a history of psychiatric disease. These are naturally inexact surrogates, but they reflect the information a busy hospitalist is likely to access when making patient assignment decisions.
Second, it may well be that assigning patients equitably according to a certain trait is not the same as assigning patients ideally for the educational needs of residents. The patients admitted to our medicine services (teaching and nonteaching) were generally older than 60 years, had complex diagnoses, and had substantial pain. Residents on the teaching services potentially would benefit from an intentionally unbalanced admission policy that shunted patients to the teaching services on the basis of features other than individual perceived educational merit. It must also be borne in mind that resident, and for that matter faculty, perceptions of ideal teaching cases are likely inexact correlates of educational best practices; the ideal role of the triage hospitalist is to admit to the teaching services those patients that will best advance the education of the learners, including a consideration of the goals and objectives of the rotation. Future studies correlating different triage practices to actual educational outcomes would be very helpful.
Third, the analysis could not reliably eliminate patients whose admissions did not represent genuine triage decisions (eg, those assigned to the hospitalist service after the teaching service had reached its capacity or immediately after they had received a complex case). Studying admission decisions prospectively could eliminate this variability, but it could introduce a Hawthorne effect, the negative effects of which likely would outweigh this benefit.
CONCLUSION
Triage hospitalists distributed patients fairly evenly between teaching and nonteaching services, but residents and faculty alike perceived that residents would benefit from more bread‐and‐butter cases. Hospitals considering the addition of a nonteaching service may want to incorporate a faculty development project focused on the triage process to ensure that these traditional medicine cases are assigned to resident services and to ensure that the great teaching case is not considered such because of complexity and acuity alone.
Acknowledgements
The authors thank Elizabeth Jones and Lois Bell for their assistance with survey collection and collation.
Disclosures: This study (institutional review board application #11‐3;002635) was deemed exempt by the Mayo Clinic institutional review board on May 16, 2011. The authors report no conflicts of interest.
- . Duty hours for resident physicians: tough choices for teaching hospitals. N Engl J Med. 2002;347(16):1275–1278.
- , , , , . A randomized, controlled trial of an attending staff service in general internal medicine. Med Care. 1991;29(7 suppl):JS31–JS40.
- , , , , . Non‐housestaff medicine services in academic centers: models and challenges. J Hosp Med. 2008;3(3):247–255.
- , , ; Education Committee of the American College of Physicians. Redesigning training for internal medicine. Ann Intern Med. 2006;144(12):927–932.
- , , , , . Improving resource utilization in a teaching hospital: development of a nonteaching service for chest pain admissions. Acad Med. 2006;81(5):432–435.
- , , . Hospitalists and an innovative emergency department admission process. J Gen Intern Med. 2004;19(3):266–268.
- , , , , . Comparison of resource utilization and clinical outcomes between teaching and nonteaching medical services. J Hosp Med. 2007;2(3):150–157.
- , , , . A comparative study of unscheduled hospital readmissions in a resident‐staffed teaching service and a hospitalist‐based service. South Med J. 2009;102(2):145–149.
- , , , et al. Prevalence of unhealthy substance use on teaching and hospitalist medical services: implications for education. Am J Addict. 2012;21(2):111–119.
- , , , et al. The effect of nonteaching services on the distribution of inpatient cases for internal medicine residents. Acad Med. 2009;84(2):220–225.
- Teaching and nonteaching services: separate no more? Today's Hospitalist website. Available at: http://www.todayshospita list.com/index.php?b=articles_read15(9):1277–1288.
- Charlson comorbidity scoring system: estimating prognosis for dialysis patients. Touchcalc website. Available at: http://www.touchcalc.com/calculators/cci_js#t2_probability. Accessed January 15, 2014.
- . Curiosity. Ann Intern Med. 1999;130(1):70–71.
© 2014 Society of Hospital Medicine
Burnout and Work‐Life Balance
An increasingly robust body of literature has identified burnout as a substantial problem for physicians across specialties and practice settings.[1, 2, 3, 4] Burnout, a work‐related condition characterized by emotional exhaustion, depersonalization, and lack of a sense of personal accomplishment,[5] has been tied to negative consequences for patients, physicians, and the medical profession including medical errors,[6] poor physician health,[7, 8] and decreased professionalism.[9] Studies of burnout among general internists have pointed to time pressures, lack of work control, and difficult patient encounters as possible contributors.[10, 11]
Burnout has been demonstrated to affect a sizable proportion of hospitalists, with prevalence estimates from prior studies varying from 12.9% to 27.2%, although nearly all studies of US hospitalists have relied on single‐item instruments.[12, 13, 14, 15] Hospital‐based physicians have represented a rapidly expanding segment of the internist workforce for more than a decade,[14] but studies of the impact of inpatient vs outpatient practice location on burnout and career satisfaction are limited. A meta‐analysis of the impact of practice location on burnout relied almost exclusively on noncomparative studies from outside the United States.[15] A recent study of US physician burnout and satisfaction with work‐life balance showed that general internists expressed below average satisfaction with work‐life balance and had the second highest rate of burnout among 24 specialties.[4] However, this report did not differentiate between general internists working in inpatient vs outpatient settings.
We therefore examined burnout, satisfaction with work‐life balance, and other aspects of well‐being among internal medicine hospitalists relative to outpatient general internists, using a national sample developed in partnership with the American Medical Association.
METHODS
Physician Sample
As described previously,[4] the American Medical Association Physician Masterfile, a nearly complete record of US physicians, was used to generate a sample of physicians inclusive of all specialty disciplines. The 27,276 physicians who opened at least 1 invitation e‐mail were considered to have received the invitation to participate in the study. Participation was voluntary, and all responses were anonymous. For this analysis, internal medicine hospitalists were compared with general internists reporting primarily outpatient practices. The physician sample provided information on demographics (age, sex, and relationship status) and on characteristics of their practice. Burnout, symptoms of depression, suicidal ideation in the past 12 months, quality of life (QOL), satisfaction with work‐life balance, and certain health behaviors were evaluated as detailed below.
Burnout
Burnout among physicians was measured using the Maslach Burnout Inventory (MBI), a validated 22‐item questionnaire considered the gold standard tool for measuring burnout.[5, 16] The MBI has subscales to evaluate each domain of burnout: emotional exhaustion, depersonalization, and low personal accomplishment. Because other burnout studies have focused on the presence of high levels of emotional exhaustion or depersonalization as the foundation of burnout in physicians,[17, 18, 19] we considered physicians with a high score on the depersonalization or emotional exhaustion subscales to have at least 1 manifestation of professional burnout.
Symptoms of Depression and Suicidal Ideation
Symptoms of depression were assessed using the 2‐item Primary Care Evaluation of Mental Disorders,[20] a standardized and validated assessment for depression screening that performs as well as longer instruments.[21] Recent suicidal ideation was evaluated by asking participants, During the past 12 months, have you had thoughts of taking your own life? This item was designed to measure somewhat recent, but not necessarily active, suicidal ideation. These questions have been used extensively in other studies.[22, 23, 24, 25]
Quality of Life and Fatigue
Overall QOL and mental, physical, and emotional QOL were measured by a single‐item linear analog scale assessment. This instrument measured QOL on a 0 (as bad as it can be) to 10 (as good as it can be) scale validated across a wide range of medical conditions and populations.[26, 27, 28] Fatigue was measured using a similar standardized linear analog scale assessment question, for which respondents indicated their level of fatigue during the past week.[29] The impact of fatigue on daily activities such as driving was also evaluated.
Satisfaction With Work‐Life Balance and Career Plans
Satisfaction with work‐life balance was assessed by the item, My work schedule leaves me enough time for my personal/family life, with response options strongly agree, agree, neutral, disagree, or strongly disagree. Individuals who indicated strongly agree or agree were considered to be satisfied with their work‐life balance, whereas those who indicated strongly disagree or disagree were considered to be dissatisfied with their work‐life balance. Experience of work‐home conflicts was assessed as in prior research.[4] Participants were also asked about plans to change jobs or careers.
Health Behaviors
A limited set of health and wellness behaviors was addressed in the survey to provide insight into other aspects of physician well‐being. These included whether respondents had a primary care provider and questions concerning routine screening and alcohol and substance use. Alcohol use was assessed using the Alcohol Use Disorders Identification Test, version C (AUDIT‐C).[30] An AUDIT‐C score of at least 4 for men and at least 3 for women indicates alcohol misuse, and a score of at least 5 for men and at least 4 for women indicates alcohol abuse and possible dependence.[30]
Statistical Analysis
Standard descriptive summary statistics were used to characterize the physician samples. Associations between variables were evaluated using the Kruskal‐Wallis test (for continuous variables) or [2] test (for categorical variables). All tests were 2‐sided, with a type I error level of 0.05. Multivariate analysis of differences between hospitalists and outpatient general internists was performed using multiple linear or logistic regression for continuous or categorical data, respectively. Covariates in these models included age, sex, weekly work hours, and practice setting. All of the analyses were performed using SAS version 9.2 (SAS Institute, Inc., Cary, NC).
RESULTS
In the full survey across all specialties, 7288 physicians (26.7%) provided survey responses.[4] There were 448 outpatient internists and 130 internal medicine hospitalists who agreed to participate. Demographically, hospitalists were younger, worked longer hours, and were less likely to work in private practice than outpatient general internists (Table 1).
| Characteristic | Hospitalists (n=130) | Outpatient General Internists (n=448) | P |
|---|---|---|---|
| |||
| Sex, n (%) | 0.56 | ||
| Male | 86 (66.2%) | 284 (63.4%) | |
| Female | 44 (33.8%) | 164 (36.6%) | |
| Age, mean (SD) | 46.9 (12.4) | 53.6 (10.2) | <0.001 |
| Median | 45.0 | 55.0 | |
| Years in practice, mean (SD) | 14.0 (12.0) | 21.6 (10.7) | <0.001 |
| Median | 10.0 | 22.0 | |
| Hours worked per week, mean (SD) | 55.0 (18.1) | 50.0 (15.1) | 0.04 |
| Median | 50.0 | 50.0 | |
| Practice setting, n (%) | <0.001 | ||
| Private practice/hospital | 36 (31.0%) | 303 (69.2%) | |
| Academic medical center | 37 (31.9%) | 41 (9.4%) | |
| Other (including veterans hospital and active military practice) | 43 (37.1%) | 94 (21.5%) | |
Distress and Well‐Being Variables
High levels of emotional exhaustion affected 43.8% of hospitalists and 48.1% of outpatient general internists (odds ratio [OR]: 0.91, 95% confidence interval [CI]: 0.56‐1.48), and high levels of depersonalization affected 42.3% of hospitalists and 32.7% of outpatient general internists (OR: 1.42, 95% CI: 0.86‐2.35). Overall burnout affected 52.3% of hospitalists and 54.5% of outpatient general internists (OR: 0.96, 95% CI: 0.58‐1.57). None of these factors differed statistically in multivariate models adjusted for factors known to be associated with burnout, including sex, age, weekly work hours, and practice setting (P=0.71, 0.17, and 0.86, respectively; Table 2). However, low levels of personal accomplishment were reported by 20.3% of hospitalists and 9.6% of outpatient general internists (OR: 1.93, 95% CI: 1.023.65, P=0.04).
| Variable | Hospitalists (n=130) | Outpatient General Internists (n=448) | Pa |
|---|---|---|---|
| |||
| Burnout | |||
| Emotional exhaustion high (27) | 57/130 (43.8%) | 215/447 (48.1%) | 0.71 |
| Mean (SD) | 24.7 (12.5) | 25.4 (14.0) | |
| Median | 24.9 | 26.0 | |
| Depersonalization high (10) | 55/130 (42.3%) | 146/447 (32.7%) | 0.17 |
| Mean (SD) | 9.1 (6.9) | 7.5 (6.3) | |
| Median | 7.0 | 6.0 | |
| Personal accomplishment low (33) | 26/128 (20.3%) | 43/446 (9.6%) | 0.04 |
| Mean (SD) | 39.0 (7.6) | 41.4 (6.0) | |
| Median | 41.0 | 43.0 | |
| High burnout (EE27 or DP10) | 68/130 (52.3%) | 244/448 (54.5%) | 0.86 |
| Depression | |||
| Depression screen + | 52/129 (40.3%) | 176/440 (40.0%) | 0.73 |
| Suicidal thoughts in past 12 months | 12/130 (9.2%) | 26/445 (5.8%) | 0.15 |
| Quality of life | |||
| Overall mean (SD) | 7.3 (2.0) | 7.4 (1.8) | 0.85 |
| Median | 8.0 | 8.0 | |
| Low (<6) | 21/130 (16.2%) | 73/448 (16.3%) | |
| Mental mean (SD) | 7.2 (2.1) | 7.3 (2.0) | 0.89 |
| Median | 8.0 | 8.0 | |
| Low (<6) | 23/130 (17.7%) | 92/448 (20.5%) | |
| Physical mean (SD) | 6.7 (2.3) | 6.9 (2.1) | 0.45 |
| Median | 7.0 | 7.0 | |
| Low (<6) | 35/130 (26.9%) | 106/448 (23.7%) | |
| Emotional mean (SD) | 7.0 (2.3) | 6.9 (2.2) | 0.37 |
| Median | 7.0 | 7.0 | |
| Low (<6) | 30/130 (23.1%) | 114/448 (25.4%) | |
| Fatigue | |||
| Mean (SD) | 5.8 (2.4) | 5.9 (2.4) | 0.57 |
| Median | 6.0 | 6.0 | |
| Fallen asleep while driving (among regular drivers only) | 11/126 (8.7%) | 19/438 (4.3%) | 0.23 |
Approximately 40% of physicians in both groups screened positive for depression (OR: 0.92, 95% CI: 0.56‐1.51, P=0.73). In addition, 9.2% of hospitalists reported suicidal ideation in the last 12 months compared to 5.8% of outpatient internists (OR: 1.86, 95% CI: 0.80‐4.33, P=0.15) (Table 2).
Overall QOL and QOL in mental, physical, and emotional domains were nearly identical in the 2 groups (Table 2). Fatigue was also similar for hospitalists and outpatient general internists, and 8.5% of hospitalists reported falling asleep in traffic while driving compared to 4.2% of outpatient internists (OR: 1.76, 95% CI: 0.70‐4.44, P=0.23).
Work‐Life Balance and Career Variables
Experience of recent work‐home conflicts was similar for hospitalists and outpatient general internists (Table 3). However, hospitalists were more likely to agree or strongly agree that their work schedule leaves enough time for their personal life and family (50.0% vs 42.0%, OR: 2.06, 95% CI: 1.22‐3.47, P=0.007).
| Variable | Hospitalists (n=130) | Outpatient General Internists (n=448) | Pa |
|---|---|---|---|
| |||
| Work‐home conflict in last 3 weeks | 62/128 (48.4%) | 183/443 (41.3%) | 0.64 |
| Work‐home conflict resolved in favor of: | 0.79 | ||
| Work | 37/118 (31.4%) | 131/405 (32.2%) | |
| Home | 15/118 (12.7%) | 43/405 (10.6%) | |
| Meeting both needs | 66/118 (55.9%) | 231/405 (57.0%) | |
| Work schedule leaves enough time for personal life/family | 0.007 | ||
| Strongly agree | 20 (15.4%) | 70 (15.7%) | |
| Agree | 45 (34.6%) | 117 (26.3%) | |
| Neutral | 21 (16.2%) | 66 (14.8%) | |
| Disagree | 27 (20.8%) | 119 (26.7%) | |
| Strongly disagree | 17 (13.1%) | 73 (16.4%) | |
| Missing | 0 | 3 | |
| Likelihood of leaving current practice | 0.002 | ||
| Definite | 17 (13.1%) | 34 (7.6%) | |
| Likely | 21 (16.2%) | 53 (11.9%) | |
| Moderate | 21 (16.2%) | 67 (15.0%) | |
| Slight | 38 (29.2%) | 128 (28.7%) | |
| None | 33 (25.4%) | 164 (36.8%) | |
| Missing | 0 | 2 | |
| Would choose to become physician again | 81/130 (62.3%) | 306/441 (69.4%) | 0.86 |
Hospitalists were more likely to express interest in leaving their current practice in the next 2 years, with 13.1% vs 7.6% reporting definite plans to leave and 29.2% vs 19.5% reporting at least likely plans to leave (OR: 2.31, 95% CI: 1.35‐3.97, P=0.002). Among those reporting a likely or definite plan to leave, hospitalists were more likely to plan to look for a different practice and continue to work as a physician (63.2% vs 39.1%), whereas outpatient general internists were more likely to plan to leave medical practice (51.9% vs 22.0%, P=0.004). Hospitalists with plans to reduce their work hours were more likely than their outpatient colleagues to express an interest in administrative and leadership roles (19.4% vs 12.1%) or research and educational roles (9.7% vs 4.0%, P=0.05).
Health Behavior Variables
Hospitalists were less likely to report having a primary care provider in the adjusted analyses (55.0% vs 70.3%, OR: 0.49, 95% CI: 0.29‐0.83, P=0.008). Use of illicit substances was uncommon in both groups (94.6% of hospitalists and 96.0% of outpatient general internists reported never using an illicit substance (OR: 0.87, 95% CI: 0.31‐2.49, P=0.80). Symptoms of alcohol abuse were similar between the 2 groups (11.7% and 13.3%, respectively, OR: 0.64, 95% CI: 0.30‐1.35, P=0.24), but symptoms of alcohol misuse were more common among outpatient general internists (34.2% vs 21.9%, OR: 1.75, 95% CI: 1.013.03, P=0.047).
DISCUSSION
The primary result of this national study applying well‐validated metrics is that the overall rates of burnout among hospitalists and outpatient general internal medicine physicians were similar, as were rates of positive depression screening and QOL. Although these groups did not differ, the absolute rates of distress found in this study were high. Prior research has suggested that possible explanations for these high rates of distress include excessive workload, loss of work‐associated control and meaning, and difficulties with work‐home balance.[4] The present study, in the context of prior work showing that general internists have higher rates of burnout than almost any other specialty, suggests that the front‐line nature of the work of both hospitalists and outpatient general internists may exacerbate these previously cited factors. These results suggest that efforts to address physician well‐being are critically needed for both inpatient and outpatient physicians.
Despite the noted similarities, differences between hospitalists and outpatient general internists in certain aspects of well‐being merit further attention. For example, the lower rate of personal accomplishment among hospitalists relative to outpatient generalists is consistent with prior evidence.[15] The reasons for this difference are unknown, but the relative youth and inexperience of the hospitalists may be a factor. US hospitalists have been noted to feel like glorified residents in at least 1 report,[31] a factor that might also negatively impact personal accomplishment.
It is also worthwhile to place the burnout results for both groups in context with prior studies. Although we found high rates of burnout among outpatient physicians, our outpatient sample's mean MBI subset scores are not higher than previous samples of American[32] and Canadian[33] outpatient physicians, suggesting that this finding is neither new nor artifactual. Placing the hospitalist sample in perspective is more difficult, as very few studies have administered the MBI to US hospitalists, and those that have either administered 1 component only to an exclusive academic sample[34] or administered it to a small mixture of hospitalists and intensivists.[35] The prevalence of burnout we report for our hospitalist sample is higher than that reported by studies that utilized single‐item survey items1214; it is likely that the higher prevalence we report relates more to a more detailed assessment of the components of burnout than to a temporal trend, although this cannot be determined definitively from the data available.
The finding that 9.2% of hospitalists and 5.8% of outpatient general internists reported suicidal thoughts in the past 12 months is alarming, though consistent with prior data on US surgeons.[35] Although the higher rate of suicidal thoughts among hospitalists was not statistically significant, a better understanding of the factors associated with physician suicidality should be the focus of additional research.
Hospitalists were more likely than outpatient internists to report plans to leave their current practice in this study, although their plans after leaving differed. The fact that they were more likely to report plans to find a different role in medicine (rather than to leave medicine entirely or retire) is likely a function of age and career stage. The finding that hospitalists with an interest in changing jobs were more likely than their outpatient colleagues to consider administrative, leadership, education, and research roles may partially reflect the greater number of hospitalists at academic medical centers in this study, but suggests that hospitalists may indeed benefit from the availability of opportunities that have been touted as part of hospitalist diastole.[36]
Finally, rates of alcohol misuse and abuse found in this study were consistent with those reported in prior studies.[37, 38, 39] These rates support ongoing efforts to address alcohol‐related issues among physicians. In addition, the proportion of outpatient general internists and hospitalists reporting having a primary care provider was similar to that seen in prior research.[40] The fact that 1 in 3 physicians in this study did not have a primary care provider suggests there is great room for improvement in access to and prioritization of healthcare for physicians in general. However, it is noteworthy that hospitalists were less likely than outpatient general internists to have a primary care provider even after adjusting for their younger age as a group. The reasons behind this discrepancy are unclear but worthy of further investigation.
Several limitations of our study should be considered. The response rate for the entire study sample was 26.7%, which is similar to other US national physician surveys in this topic area.[41, 42, 43] Demographic comparisons with national data suggest the respondents were reasonably representative of physicians nationally,[4] and all analyses were adjusted for recognized demographic factors affecting our outcomes of interest. We found no statistically significant differences in demographics of early responders compared with late responders (a standard approach to evaluate for response bias),[14, 31] further supporting that responders were representative of US physicians. Despite this, response bias remains possible. For example, it is unclear if burned out physicians might be more likely to respond (eg, due to the personal relevance of the survey topic) or less likely to respond (eg, due to being too overwhelmed to open or complete the survey).
A related limitation is the relatively small number of hospitalists included in this sample, which limits the power of the study to detect differences between the study groups. The hospitalists in this study were also relatively experienced, with a median of 10 years in practice, although the overall demographics match closely to a recent national survey of hospitalists. Although age was considered in the analyses, this study may not fully characterize burnout patterns among very junior or very senior hospitalists. In addition, although analyses were adjusted for observed differences between the study groups for a number of covariates, there may be differences between the study groups in other, unmeasured factors that could act as confounders of the observed results. For example, the allocation of each individual's time to different activities (eg, clinical, research, education, administration), workplace flexibility and control, and meaning may all contribute to distress and well‐being, and could not be assessed in this study.
In conclusion, the degree of burnout, depression, and suicidal ideation in both hospitalists and outpatient general internists is similar and substantial. Urgent attention directed at better understanding the causes of distress and identifying solutions for all internists is needed.
Acknowledgements
The authors acknowledge the role of the American Medical Association in completing this study.
Disclosures: The views expressed in this article are those of the authors and do not represent the views of, and should not be attributed to, the American Medical Association. The authors report no conflicts of interest.
- , , , , , . Stress symptoms, burnout and suicidal thoughts in Finnish physicians. Soc Psychiatry Psychiatr Epidemiol. 1990;25:81–86.
- , , , , , ; Society of General Internal Medicine (SGIM) Career Satisfaction Study Group (CSSG). Predicting and preventing physician burnout: results from the United States and the Netherlands. Am J Med. 2001;111:170–175.
- , , , et al. Burnout among psychiatrists in Milan: a multicenter study. Psychiatr Serv. 2009;60:985–988.
- , , , et al. Burnout and satisfaction with work‐life balance among US physicians relative to the general US population. Arch Intern Med. 2012;172:1377–1385.
- , . The measurement of experienced burnout. J Occup Behav. 1981;2:99–113.
- , , , et al. Burnout and medical errors among American surgeons. Ann Surg. 2010;251:995–1000.
- , , . Physician wellness: a missing quality indicator. Lancet. 2009;374:1714–1721.
- , , , , . Changes in mental health of UK hospital consultants since the mid‐1990s. Lancet. 2005;366:742–744.
- , , , et al. Relationship between burnout and professional conduct and attitudes among US medical students. JAMA. 2010;304:1173–1180.
- , , , et al.; MEMO (Minimizing Error, Maximizing Outcomes) Investigators. Working conditions in primary care: physician reactions and care quality. Ann Intern Med. 2009;151:28–36.
- , , , , , ; MEMO Investigators. Burden of difficult encounters in primary care: data from the Minimizing Error, Maximizing Outcomes study. Arch Intern Med. 2009;169:410–414.
- , , , , . Characteristics and work experiences of hospitalists in the United States. Arch Intern Med. 2001;161(6):851–858.
- , , , , , . Career satisfaction and burnout in academic hospital medicine. Arch Intern Med. 2011;25:171(8):782–785.
- , , , , ; Society of Hospital Medicine Career Satisfaction Task Force. Job characteristics, satisfaction, and burnout across hospitalist practice models. J Hosp Med. 2012;7:402–410.
- , , , , . Burnout in inpatient‐based vs outpatient‐based physicians: a systematic review and meta‐analysis. J Hosp Med. 2013;8:653–664.
- , , . Maslach Burnout Inventory Manual. 3rd ed. Palo Alto, CA: Consulting Psychologists Press; 1996.
- . Resident burnout. JAMA. 2004;292(23):2880–2889.
- , , , . Burnout and self‐reported patient care in an internal medicine residency program. Ann Intern Med. 2002;136:358–367.
- , , , . Evolution of sleep quantity, sleep deprivation, mood disturbances, empathy, and burnout among interns. Acad Med. 2006;81:82–85.
- , , , et al. Utility of a new procedure for diagnosing mental disorders in primary care: the PRIME‐MD 1000 study. JAMA. 1994;272:1749–1756.
- , , , . Case‐finding instruments for depression: two questions are as good as many. J Gen Intern Med. 1997;12:439–445.
- , , , . Attempted suicide among young adults: progress toward a meaningful estimate of prevalence. Am J Psychiatry. 1992;149:41–44.
- , , . Prevalence of and risk factors for lifetime suicide attempts in the National Comorbidity Survey. Arch Gen Psychiatry. 1999;56:617–626.
- , , , , . Trends in suicide ideation, plans, gestures, and attempts in the United States, 1990–1992 to 2001–2003. JAMA. 2005;293:2487–2495.
- , , . Identifying suicidal ideation in general medical patients. JAMA. 1994;272:1757–1762.
- , , , . Health state valuations from the general public using the visual analogue scale. Qual Life Res. 1996;5:521–531.
- , , , et al. The well‐being and personal wellness promotion strategies of medical oncologists in the North Central Cancer Treatment Group. Oncology. 2005;68:23–32.
- , , , et al. Impacting quality of life for patients with advanced cancer with a structured multidisciplinary intervention: a randomized controlled trial. J Clin Oncol. 2006;24:635–642.
- , , , , . Association of resident fatigue and distress with perceived medical errors. JAMA. 2009;302:294–300.
- , , , , . The AUDIT alcohol consumption questions (AUDIT‐C): an effective brief screening test for problem drinking. Arch Intern Med. 1998;158:1789–1795.
- , , , , . Worklife and satisfaction of hospitalists: toward flourishing careers. J Gen Intern Med. 2012;27(1):28–36.
- , , , et al. Association of an educational program in mindful communication with burnout, empathy, and attitudes among primary care physicians. JAMA. 2009;302(12):1284–1293.
- , , . Stress, burnout, and strategies for reducing them: what's the situation among Canadian family physicians? Can Fam Physician. 2008;54(2):234–235.
- , , , et al. Emotional exhaustion, life stress, and perceived control among medicine ward attending physicians: a randomized trial of 2‐ versus 4‐week ward rotations [abstract]. J Hosp Med. 2011;6(4 suppl 2):S43–S44.
- , , , et al. Special report: suicidal ideation among American surgeons. Arch Surg. 2011;146:54–62.
- , , , . Preparing for “diastole”: advanced training opportunities for academic hospitalists. J Hosp Med. 2006;1:368–377.
- , , , et al. Prevalence of substance use among US physicians. JAMA. 1992;267:2333–2339.
- , , , , . Preventive, lifestyle, and personal health behaviors among physicians. Acad Psychiatry. 2009;33:289–295.
- , , , et al. Prevalence of alcohol use disorders among American surgeons. Arch Surg. 2012;147:168–174.
- , , , . Physician, heal thyself? Regular source of care and use of preventive health services among physicians. Arch Intern Med. 2000;160:3209–3214.
- , , . Prevalence of burnout in the U.S. oncologic community: results of a 2003 survey. J Oncol Pract. 2005;1(4):140–147.
- , , , et al. Career satisfaction, practice patterns and burnout among surgical oncologists: report on the quality of life of members of the Society of Surgical Oncology. Ann Surg Oncol. 2007;14:3042–3053.
- , , , et al. Burnout and career satisfaction among American surgeons. Ann Surg. 2009;250(3):463–471.
An increasingly robust body of literature has identified burnout as a substantial problem for physicians across specialties and practice settings.[1, 2, 3, 4] Burnout, a work‐related condition characterized by emotional exhaustion, depersonalization, and lack of a sense of personal accomplishment,[5] has been tied to negative consequences for patients, physicians, and the medical profession including medical errors,[6] poor physician health,[7, 8] and decreased professionalism.[9] Studies of burnout among general internists have pointed to time pressures, lack of work control, and difficult patient encounters as possible contributors.[10, 11]
Burnout has been demonstrated to affect a sizable proportion of hospitalists, with prevalence estimates from prior studies varying from 12.9% to 27.2%, although nearly all studies of US hospitalists have relied on single‐item instruments.[12, 13, 14, 15] Hospital‐based physicians have represented a rapidly expanding segment of the internist workforce for more than a decade,[14] but studies of the impact of inpatient vs outpatient practice location on burnout and career satisfaction are limited. A meta‐analysis of the impact of practice location on burnout relied almost exclusively on noncomparative studies from outside the United States.[15] A recent study of US physician burnout and satisfaction with work‐life balance showed that general internists expressed below average satisfaction with work‐life balance and had the second highest rate of burnout among 24 specialties.[4] However, this report did not differentiate between general internists working in inpatient vs outpatient settings.
We therefore examined burnout, satisfaction with work‐life balance, and other aspects of well‐being among internal medicine hospitalists relative to outpatient general internists, using a national sample developed in partnership with the American Medical Association.
METHODS
Physician Sample
As described previously,[4] the American Medical Association Physician Masterfile, a nearly complete record of US physicians, was used to generate a sample of physicians inclusive of all specialty disciplines. The 27,276 physicians who opened at least 1 invitation e‐mail were considered to have received the invitation to participate in the study. Participation was voluntary, and all responses were anonymous. For this analysis, internal medicine hospitalists were compared with general internists reporting primarily outpatient practices. The physician sample provided information on demographics (age, sex, and relationship status) and on characteristics of their practice. Burnout, symptoms of depression, suicidal ideation in the past 12 months, quality of life (QOL), satisfaction with work‐life balance, and certain health behaviors were evaluated as detailed below.
Burnout
Burnout among physicians was measured using the Maslach Burnout Inventory (MBI), a validated 22‐item questionnaire considered the gold standard tool for measuring burnout.[5, 16] The MBI has subscales to evaluate each domain of burnout: emotional exhaustion, depersonalization, and low personal accomplishment. Because other burnout studies have focused on the presence of high levels of emotional exhaustion or depersonalization as the foundation of burnout in physicians,[17, 18, 19] we considered physicians with a high score on the depersonalization or emotional exhaustion subscales to have at least 1 manifestation of professional burnout.
Symptoms of Depression and Suicidal Ideation
Symptoms of depression were assessed using the 2‐item Primary Care Evaluation of Mental Disorders,[20] a standardized and validated assessment for depression screening that performs as well as longer instruments.[21] Recent suicidal ideation was evaluated by asking participants, During the past 12 months, have you had thoughts of taking your own life? This item was designed to measure somewhat recent, but not necessarily active, suicidal ideation. These questions have been used extensively in other studies.[22, 23, 24, 25]
Quality of Life and Fatigue
Overall QOL and mental, physical, and emotional QOL were measured by a single‐item linear analog scale assessment. This instrument measured QOL on a 0 (as bad as it can be) to 10 (as good as it can be) scale validated across a wide range of medical conditions and populations.[26, 27, 28] Fatigue was measured using a similar standardized linear analog scale assessment question, for which respondents indicated their level of fatigue during the past week.[29] The impact of fatigue on daily activities such as driving was also evaluated.
Satisfaction With Work‐Life Balance and Career Plans
Satisfaction with work‐life balance was assessed by the item, My work schedule leaves me enough time for my personal/family life, with response options strongly agree, agree, neutral, disagree, or strongly disagree. Individuals who indicated strongly agree or agree were considered to be satisfied with their work‐life balance, whereas those who indicated strongly disagree or disagree were considered to be dissatisfied with their work‐life balance. Experience of work‐home conflicts was assessed as in prior research.[4] Participants were also asked about plans to change jobs or careers.
Health Behaviors
A limited set of health and wellness behaviors was addressed in the survey to provide insight into other aspects of physician well‐being. These included whether respondents had a primary care provider and questions concerning routine screening and alcohol and substance use. Alcohol use was assessed using the Alcohol Use Disorders Identification Test, version C (AUDIT‐C).[30] An AUDIT‐C score of at least 4 for men and at least 3 for women indicates alcohol misuse, and a score of at least 5 for men and at least 4 for women indicates alcohol abuse and possible dependence.[30]
Statistical Analysis
Standard descriptive summary statistics were used to characterize the physician samples. Associations between variables were evaluated using the Kruskal‐Wallis test (for continuous variables) or [2] test (for categorical variables). All tests were 2‐sided, with a type I error level of 0.05. Multivariate analysis of differences between hospitalists and outpatient general internists was performed using multiple linear or logistic regression for continuous or categorical data, respectively. Covariates in these models included age, sex, weekly work hours, and practice setting. All of the analyses were performed using SAS version 9.2 (SAS Institute, Inc., Cary, NC).
RESULTS
In the full survey across all specialties, 7288 physicians (26.7%) provided survey responses.[4] There were 448 outpatient internists and 130 internal medicine hospitalists who agreed to participate. Demographically, hospitalists were younger, worked longer hours, and were less likely to work in private practice than outpatient general internists (Table 1).
| Characteristic | Hospitalists (n=130) | Outpatient General Internists (n=448) | P |
|---|---|---|---|
| |||
| Sex, n (%) | 0.56 | ||
| Male | 86 (66.2%) | 284 (63.4%) | |
| Female | 44 (33.8%) | 164 (36.6%) | |
| Age, mean (SD) | 46.9 (12.4) | 53.6 (10.2) | <0.001 |
| Median | 45.0 | 55.0 | |
| Years in practice, mean (SD) | 14.0 (12.0) | 21.6 (10.7) | <0.001 |
| Median | 10.0 | 22.0 | |
| Hours worked per week, mean (SD) | 55.0 (18.1) | 50.0 (15.1) | 0.04 |
| Median | 50.0 | 50.0 | |
| Practice setting, n (%) | <0.001 | ||
| Private practice/hospital | 36 (31.0%) | 303 (69.2%) | |
| Academic medical center | 37 (31.9%) | 41 (9.4%) | |
| Other (including veterans hospital and active military practice) | 43 (37.1%) | 94 (21.5%) | |
Distress and Well‐Being Variables
High levels of emotional exhaustion affected 43.8% of hospitalists and 48.1% of outpatient general internists (odds ratio [OR]: 0.91, 95% confidence interval [CI]: 0.56‐1.48), and high levels of depersonalization affected 42.3% of hospitalists and 32.7% of outpatient general internists (OR: 1.42, 95% CI: 0.86‐2.35). Overall burnout affected 52.3% of hospitalists and 54.5% of outpatient general internists (OR: 0.96, 95% CI: 0.58‐1.57). None of these factors differed statistically in multivariate models adjusted for factors known to be associated with burnout, including sex, age, weekly work hours, and practice setting (P=0.71, 0.17, and 0.86, respectively; Table 2). However, low levels of personal accomplishment were reported by 20.3% of hospitalists and 9.6% of outpatient general internists (OR: 1.93, 95% CI: 1.023.65, P=0.04).
| Variable | Hospitalists (n=130) | Outpatient General Internists (n=448) | Pa |
|---|---|---|---|
| |||
| Burnout | |||
| Emotional exhaustion high (27) | 57/130 (43.8%) | 215/447 (48.1%) | 0.71 |
| Mean (SD) | 24.7 (12.5) | 25.4 (14.0) | |
| Median | 24.9 | 26.0 | |
| Depersonalization high (10) | 55/130 (42.3%) | 146/447 (32.7%) | 0.17 |
| Mean (SD) | 9.1 (6.9) | 7.5 (6.3) | |
| Median | 7.0 | 6.0 | |
| Personal accomplishment low (33) | 26/128 (20.3%) | 43/446 (9.6%) | 0.04 |
| Mean (SD) | 39.0 (7.6) | 41.4 (6.0) | |
| Median | 41.0 | 43.0 | |
| High burnout (EE27 or DP10) | 68/130 (52.3%) | 244/448 (54.5%) | 0.86 |
| Depression | |||
| Depression screen + | 52/129 (40.3%) | 176/440 (40.0%) | 0.73 |
| Suicidal thoughts in past 12 months | 12/130 (9.2%) | 26/445 (5.8%) | 0.15 |
| Quality of life | |||
| Overall mean (SD) | 7.3 (2.0) | 7.4 (1.8) | 0.85 |
| Median | 8.0 | 8.0 | |
| Low (<6) | 21/130 (16.2%) | 73/448 (16.3%) | |
| Mental mean (SD) | 7.2 (2.1) | 7.3 (2.0) | 0.89 |
| Median | 8.0 | 8.0 | |
| Low (<6) | 23/130 (17.7%) | 92/448 (20.5%) | |
| Physical mean (SD) | 6.7 (2.3) | 6.9 (2.1) | 0.45 |
| Median | 7.0 | 7.0 | |
| Low (<6) | 35/130 (26.9%) | 106/448 (23.7%) | |
| Emotional mean (SD) | 7.0 (2.3) | 6.9 (2.2) | 0.37 |
| Median | 7.0 | 7.0 | |
| Low (<6) | 30/130 (23.1%) | 114/448 (25.4%) | |
| Fatigue | |||
| Mean (SD) | 5.8 (2.4) | 5.9 (2.4) | 0.57 |
| Median | 6.0 | 6.0 | |
| Fallen asleep while driving (among regular drivers only) | 11/126 (8.7%) | 19/438 (4.3%) | 0.23 |
Approximately 40% of physicians in both groups screened positive for depression (OR: 0.92, 95% CI: 0.56‐1.51, P=0.73). In addition, 9.2% of hospitalists reported suicidal ideation in the last 12 months compared to 5.8% of outpatient internists (OR: 1.86, 95% CI: 0.80‐4.33, P=0.15) (Table 2).
Overall QOL and QOL in mental, physical, and emotional domains were nearly identical in the 2 groups (Table 2). Fatigue was also similar for hospitalists and outpatient general internists, and 8.5% of hospitalists reported falling asleep in traffic while driving compared to 4.2% of outpatient internists (OR: 1.76, 95% CI: 0.70‐4.44, P=0.23).
Work‐Life Balance and Career Variables
Experience of recent work‐home conflicts was similar for hospitalists and outpatient general internists (Table 3). However, hospitalists were more likely to agree or strongly agree that their work schedule leaves enough time for their personal life and family (50.0% vs 42.0%, OR: 2.06, 95% CI: 1.22‐3.47, P=0.007).
| Variable | Hospitalists (n=130) | Outpatient General Internists (n=448) | Pa |
|---|---|---|---|
| |||
| Work‐home conflict in last 3 weeks | 62/128 (48.4%) | 183/443 (41.3%) | 0.64 |
| Work‐home conflict resolved in favor of: | 0.79 | ||
| Work | 37/118 (31.4%) | 131/405 (32.2%) | |
| Home | 15/118 (12.7%) | 43/405 (10.6%) | |
| Meeting both needs | 66/118 (55.9%) | 231/405 (57.0%) | |
| Work schedule leaves enough time for personal life/family | 0.007 | ||
| Strongly agree | 20 (15.4%) | 70 (15.7%) | |
| Agree | 45 (34.6%) | 117 (26.3%) | |
| Neutral | 21 (16.2%) | 66 (14.8%) | |
| Disagree | 27 (20.8%) | 119 (26.7%) | |
| Strongly disagree | 17 (13.1%) | 73 (16.4%) | |
| Missing | 0 | 3 | |
| Likelihood of leaving current practice | 0.002 | ||
| Definite | 17 (13.1%) | 34 (7.6%) | |
| Likely | 21 (16.2%) | 53 (11.9%) | |
| Moderate | 21 (16.2%) | 67 (15.0%) | |
| Slight | 38 (29.2%) | 128 (28.7%) | |
| None | 33 (25.4%) | 164 (36.8%) | |
| Missing | 0 | 2 | |
| Would choose to become physician again | 81/130 (62.3%) | 306/441 (69.4%) | 0.86 |
Hospitalists were more likely to express interest in leaving their current practice in the next 2 years, with 13.1% vs 7.6% reporting definite plans to leave and 29.2% vs 19.5% reporting at least likely plans to leave (OR: 2.31, 95% CI: 1.35‐3.97, P=0.002). Among those reporting a likely or definite plan to leave, hospitalists were more likely to plan to look for a different practice and continue to work as a physician (63.2% vs 39.1%), whereas outpatient general internists were more likely to plan to leave medical practice (51.9% vs 22.0%, P=0.004). Hospitalists with plans to reduce their work hours were more likely than their outpatient colleagues to express an interest in administrative and leadership roles (19.4% vs 12.1%) or research and educational roles (9.7% vs 4.0%, P=0.05).
Health Behavior Variables
Hospitalists were less likely to report having a primary care provider in the adjusted analyses (55.0% vs 70.3%, OR: 0.49, 95% CI: 0.29‐0.83, P=0.008). Use of illicit substances was uncommon in both groups (94.6% of hospitalists and 96.0% of outpatient general internists reported never using an illicit substance (OR: 0.87, 95% CI: 0.31‐2.49, P=0.80). Symptoms of alcohol abuse were similar between the 2 groups (11.7% and 13.3%, respectively, OR: 0.64, 95% CI: 0.30‐1.35, P=0.24), but symptoms of alcohol misuse were more common among outpatient general internists (34.2% vs 21.9%, OR: 1.75, 95% CI: 1.013.03, P=0.047).
DISCUSSION
The primary result of this national study applying well‐validated metrics is that the overall rates of burnout among hospitalists and outpatient general internal medicine physicians were similar, as were rates of positive depression screening and QOL. Although these groups did not differ, the absolute rates of distress found in this study were high. Prior research has suggested that possible explanations for these high rates of distress include excessive workload, loss of work‐associated control and meaning, and difficulties with work‐home balance.[4] The present study, in the context of prior work showing that general internists have higher rates of burnout than almost any other specialty, suggests that the front‐line nature of the work of both hospitalists and outpatient general internists may exacerbate these previously cited factors. These results suggest that efforts to address physician well‐being are critically needed for both inpatient and outpatient physicians.
Despite the noted similarities, differences between hospitalists and outpatient general internists in certain aspects of well‐being merit further attention. For example, the lower rate of personal accomplishment among hospitalists relative to outpatient generalists is consistent with prior evidence.[15] The reasons for this difference are unknown, but the relative youth and inexperience of the hospitalists may be a factor. US hospitalists have been noted to feel like glorified residents in at least 1 report,[31] a factor that might also negatively impact personal accomplishment.
It is also worthwhile to place the burnout results for both groups in context with prior studies. Although we found high rates of burnout among outpatient physicians, our outpatient sample's mean MBI subset scores are not higher than previous samples of American[32] and Canadian[33] outpatient physicians, suggesting that this finding is neither new nor artifactual. Placing the hospitalist sample in perspective is more difficult, as very few studies have administered the MBI to US hospitalists, and those that have either administered 1 component only to an exclusive academic sample[34] or administered it to a small mixture of hospitalists and intensivists.[35] The prevalence of burnout we report for our hospitalist sample is higher than that reported by studies that utilized single‐item survey items1214; it is likely that the higher prevalence we report relates more to a more detailed assessment of the components of burnout than to a temporal trend, although this cannot be determined definitively from the data available.
The finding that 9.2% of hospitalists and 5.8% of outpatient general internists reported suicidal thoughts in the past 12 months is alarming, though consistent with prior data on US surgeons.[35] Although the higher rate of suicidal thoughts among hospitalists was not statistically significant, a better understanding of the factors associated with physician suicidality should be the focus of additional research.
Hospitalists were more likely than outpatient internists to report plans to leave their current practice in this study, although their plans after leaving differed. The fact that they were more likely to report plans to find a different role in medicine (rather than to leave medicine entirely or retire) is likely a function of age and career stage. The finding that hospitalists with an interest in changing jobs were more likely than their outpatient colleagues to consider administrative, leadership, education, and research roles may partially reflect the greater number of hospitalists at academic medical centers in this study, but suggests that hospitalists may indeed benefit from the availability of opportunities that have been touted as part of hospitalist diastole.[36]
Finally, rates of alcohol misuse and abuse found in this study were consistent with those reported in prior studies.[37, 38, 39] These rates support ongoing efforts to address alcohol‐related issues among physicians. In addition, the proportion of outpatient general internists and hospitalists reporting having a primary care provider was similar to that seen in prior research.[40] The fact that 1 in 3 physicians in this study did not have a primary care provider suggests there is great room for improvement in access to and prioritization of healthcare for physicians in general. However, it is noteworthy that hospitalists were less likely than outpatient general internists to have a primary care provider even after adjusting for their younger age as a group. The reasons behind this discrepancy are unclear but worthy of further investigation.
Several limitations of our study should be considered. The response rate for the entire study sample was 26.7%, which is similar to other US national physician surveys in this topic area.[41, 42, 43] Demographic comparisons with national data suggest the respondents were reasonably representative of physicians nationally,[4] and all analyses were adjusted for recognized demographic factors affecting our outcomes of interest. We found no statistically significant differences in demographics of early responders compared with late responders (a standard approach to evaluate for response bias),[14, 31] further supporting that responders were representative of US physicians. Despite this, response bias remains possible. For example, it is unclear if burned out physicians might be more likely to respond (eg, due to the personal relevance of the survey topic) or less likely to respond (eg, due to being too overwhelmed to open or complete the survey).
A related limitation is the relatively small number of hospitalists included in this sample, which limits the power of the study to detect differences between the study groups. The hospitalists in this study were also relatively experienced, with a median of 10 years in practice, although the overall demographics match closely to a recent national survey of hospitalists. Although age was considered in the analyses, this study may not fully characterize burnout patterns among very junior or very senior hospitalists. In addition, although analyses were adjusted for observed differences between the study groups for a number of covariates, there may be differences between the study groups in other, unmeasured factors that could act as confounders of the observed results. For example, the allocation of each individual's time to different activities (eg, clinical, research, education, administration), workplace flexibility and control, and meaning may all contribute to distress and well‐being, and could not be assessed in this study.
In conclusion, the degree of burnout, depression, and suicidal ideation in both hospitalists and outpatient general internists is similar and substantial. Urgent attention directed at better understanding the causes of distress and identifying solutions for all internists is needed.
Acknowledgements
The authors acknowledge the role of the American Medical Association in completing this study.
Disclosures: The views expressed in this article are those of the authors and do not represent the views of, and should not be attributed to, the American Medical Association. The authors report no conflicts of interest.
- , , , , , . Stress symptoms, burnout and suicidal thoughts in Finnish physicians. Soc Psychiatry Psychiatr Epidemiol. 1990;25:81–86.
- , , , , , ; Society of General Internal Medicine (SGIM) Career Satisfaction Study Group (CSSG). Predicting and preventing physician burnout: results from the United States and the Netherlands. Am J Med. 2001;111:170–175.
- , , , et al. Burnout among psychiatrists in Milan: a multicenter study. Psychiatr Serv. 2009;60:985–988.
- , , , et al. Burnout and satisfaction with work‐life balance among US physicians relative to the general US population. Arch Intern Med. 2012;172:1377–1385.
- , . The measurement of experienced burnout. J Occup Behav. 1981;2:99–113.
- , , , et al. Burnout and medical errors among American surgeons. Ann Surg. 2010;251:995–1000.
- , , . Physician wellness: a missing quality indicator. Lancet. 2009;374:1714–1721.
- , , , , . Changes in mental health of UK hospital consultants since the mid‐1990s. Lancet. 2005;366:742–744.
- , , , et al. Relationship between burnout and professional conduct and attitudes among US medical students. JAMA. 2010;304:1173–1180.
- , , , et al.; MEMO (Minimizing Error, Maximizing Outcomes) Investigators. Working conditions in primary care: physician reactions and care quality. Ann Intern Med. 2009;151:28–36.
- , , , , , ; MEMO Investigators. Burden of difficult encounters in primary care: data from the Minimizing Error, Maximizing Outcomes study. Arch Intern Med. 2009;169:410–414.
- , , , , . Characteristics and work experiences of hospitalists in the United States. Arch Intern Med. 2001;161(6):851–858.
- , , , , , . Career satisfaction and burnout in academic hospital medicine. Arch Intern Med. 2011;25:171(8):782–785.
- , , , , ; Society of Hospital Medicine Career Satisfaction Task Force. Job characteristics, satisfaction, and burnout across hospitalist practice models. J Hosp Med. 2012;7:402–410.
- , , , , . Burnout in inpatient‐based vs outpatient‐based physicians: a systematic review and meta‐analysis. J Hosp Med. 2013;8:653–664.
- , , . Maslach Burnout Inventory Manual. 3rd ed. Palo Alto, CA: Consulting Psychologists Press; 1996.
- . Resident burnout. JAMA. 2004;292(23):2880–2889.
- , , , . Burnout and self‐reported patient care in an internal medicine residency program. Ann Intern Med. 2002;136:358–367.
- , , , . Evolution of sleep quantity, sleep deprivation, mood disturbances, empathy, and burnout among interns. Acad Med. 2006;81:82–85.
- , , , et al. Utility of a new procedure for diagnosing mental disorders in primary care: the PRIME‐MD 1000 study. JAMA. 1994;272:1749–1756.
- , , , . Case‐finding instruments for depression: two questions are as good as many. J Gen Intern Med. 1997;12:439–445.
- , , , . Attempted suicide among young adults: progress toward a meaningful estimate of prevalence. Am J Psychiatry. 1992;149:41–44.
- , , . Prevalence of and risk factors for lifetime suicide attempts in the National Comorbidity Survey. Arch Gen Psychiatry. 1999;56:617–626.
- , , , , . Trends in suicide ideation, plans, gestures, and attempts in the United States, 1990–1992 to 2001–2003. JAMA. 2005;293:2487–2495.
- , , . Identifying suicidal ideation in general medical patients. JAMA. 1994;272:1757–1762.
- , , , . Health state valuations from the general public using the visual analogue scale. Qual Life Res. 1996;5:521–531.
- , , , et al. The well‐being and personal wellness promotion strategies of medical oncologists in the North Central Cancer Treatment Group. Oncology. 2005;68:23–32.
- , , , et al. Impacting quality of life for patients with advanced cancer with a structured multidisciplinary intervention: a randomized controlled trial. J Clin Oncol. 2006;24:635–642.
- , , , , . Association of resident fatigue and distress with perceived medical errors. JAMA. 2009;302:294–300.
- , , , , . The AUDIT alcohol consumption questions (AUDIT‐C): an effective brief screening test for problem drinking. Arch Intern Med. 1998;158:1789–1795.
- , , , , . Worklife and satisfaction of hospitalists: toward flourishing careers. J Gen Intern Med. 2012;27(1):28–36.
- , , , et al. Association of an educational program in mindful communication with burnout, empathy, and attitudes among primary care physicians. JAMA. 2009;302(12):1284–1293.
- , , . Stress, burnout, and strategies for reducing them: what's the situation among Canadian family physicians? Can Fam Physician. 2008;54(2):234–235.
- , , , et al. Emotional exhaustion, life stress, and perceived control among medicine ward attending physicians: a randomized trial of 2‐ versus 4‐week ward rotations [abstract]. J Hosp Med. 2011;6(4 suppl 2):S43–S44.
- , , , et al. Special report: suicidal ideation among American surgeons. Arch Surg. 2011;146:54–62.
- , , , . Preparing for “diastole”: advanced training opportunities for academic hospitalists. J Hosp Med. 2006;1:368–377.
- , , , et al. Prevalence of substance use among US physicians. JAMA. 1992;267:2333–2339.
- , , , , . Preventive, lifestyle, and personal health behaviors among physicians. Acad Psychiatry. 2009;33:289–295.
- , , , et al. Prevalence of alcohol use disorders among American surgeons. Arch Surg. 2012;147:168–174.
- , , , . Physician, heal thyself? Regular source of care and use of preventive health services among physicians. Arch Intern Med. 2000;160:3209–3214.
- , , . Prevalence of burnout in the U.S. oncologic community: results of a 2003 survey. J Oncol Pract. 2005;1(4):140–147.
- , , , et al. Career satisfaction, practice patterns and burnout among surgical oncologists: report on the quality of life of members of the Society of Surgical Oncology. Ann Surg Oncol. 2007;14:3042–3053.
- , , , et al. Burnout and career satisfaction among American surgeons. Ann Surg. 2009;250(3):463–471.
© 2014 Society of Hospital Medicine
Physician Burnout Meta‐analysis
Hospital medicine is a rapidly growing field of US clinical practice.[1] Almost since its advent, concerns have been expressed about the potential for hospitalists to burn out.[2] Hospitalists are not unique in this; similar concerns heralded the arrival of other location‐defined specialties, including emergency medicine[3] and the full‐time intensivist model,[4] a fact that has not gone unnoted in the literature about hospitalists.[5]
The existing international literature on physician burnout provides good reason for this concern. Inpatient‐based physicians tend to work unpredictable schedules, with substantial impact on home life.[6] They tend to be young, and much burnout literature suggests a higher risk among younger, less‐experienced physicians.[7] When surveyed, hospitalists have expressed more concerns about their potential for burnout than their outpatient‐based colleagues.[8]
In fact, data suggesting a correlation between inpatient practice and burnout predate the advent of the US hospitalist movement. Increased hospital time was reported to correlate with higher rates of burnout in internists,[9] family practitioners,[10] palliative physicians,[11] junior doctors,[12] radiologists,[13] and cystic fibrosis caregivers.[14] In 1987, Keinan and Melamed[15] noted, Hospital work by its very nature, as compared to the work of a general practitioner, deals with the more severe and complicated illnesses, coupled with continuous daily contacts with patients and their anxious families. In addition, these physicians may find themselves embroiled in the power struggles and competition so common in their work environment.
There are other features, however, that may protect inpatient physicians from burnout. Hospital practice can facilitate favorable social relations involving colleagues, co‐workers, and patients,[16] a factor that may be protective.[17] A hospitalist schedule also can allow more focused time for continuing medical education, research, and teaching,[18] which have all been associated with reduced risk of burnout in some studies.[17] Studies of psychiatrists[19] and pediatricians[20] have shown a lower rate of burnout among physicians with more inpatient duties. Finally, a practice model involving a seemingly stable cadre of inpatient physicians has existed in Europe for decades,[2] indicating at least a degree of sustainability.
Information suggesting a higher rate of burnout among inpatient physicians could be used to target therapeutic interventions and to adjust schedules, whereas the opposite outcome could refute a pervasive myth. We therefore endeavored to summarize the literature on burnout among inpatient versus outpatient physicians in a systematic fashion, and to include data not only from the US hospitalist experience but also from other countries that have used a similar model for decades. Our primary hypothesis was that inpatient physicians experience more burnout than outpatient physicians.
It is important to distinguish burnout from depression, job dissatisfaction, and occupational stress, all of which have been studied extensively in physicians. Burnout, as introduced by Freudenberger[21] and further characterized by Maslach,[22] is a condition in which emotional exhaustion, depersonalization, and a low sense of personal accomplishment combine to negatively affect work life (as opposed to clinical depression, which affects all aspects of life). Job satisfaction can correlate inversely with burnout, but it is a separate process[23] and the subject of a recent systematic review.[24] The importance of distinguishing burnout from job dissatisfaction is illustrated by a survey of head and neck surgeons, in which 97% of those surveyed indicated satisfaction with their jobs and 34% of the same group answered in the affirmative when asked if they felt burned out.[25]
One obstacle to the meaningful comparison of burnout prevalence across time, geography, and specialty is the myriad ways in which burnout is measured and reported. The oldest and most commonly used instrument to measure burnout is the Maslach Burnout Inventory (MBI), which contains 22 items assessing 3 components of burnout (emotional exhaustion, depersonalization, and low personal accomplishment).[26] Other measures include the Copenhagen Burnout Inventory[27] (19 items with the components personal burnout, work‐related burnout, and client‐related burnout), Utrecht Burnout Inventory[28] (20‐item modification of the MBI), Boudreau Burnout Questionnaire[29] (30 items), Arbeitsbezogenes Verhaltens und Erlebensmuster[30] (66‐item questionnaire assessing professional commitment, resistance to stress, and emotional well‐being), Shirom‐Melamed Burnout Measure[31] (22 items with subscales for physical fatigue, cognitive weariness, tension, and listlessness), and a validated single‐item questionnaire.[32]
METHODS
Electronic searches of MEDLINE, EMBASE, PsycINFO, SCOPUS, and PubMed were undertaken for articles published from January 1, 1974 (the year in which burnout was first described by Freudenberger[21]) to 2012 (last accessed, September 12, 2012) using the Medical Subject Headings (MeSH) terms stress, psychological; burnout, professional; adaptation, psychological; and the keyword burnout. The same sources were searched to create another set for the MeSH terms hospitalists, physician's practice patterns, physicians/px, professional practice location, and the keyword hospitalist#. Where exact subject headings did not exist in databases, comparable subject headings or keywords were used. The 2 sets were then combined using the operator and. Abstracts from the Society of Hospital Medicine annual conferences were hand‐searched, as were reference lists from identified articles. To ensure that pertinent international literature was captured, there was no language restriction in the search.
A 2‐stage screening process was used. The titles and abstracts of all articles identified in the search were independently reviewed by 2 investigators (D.L.R. and K.J.C.) who had no knowledge of each other's results. An article was obtained when either reviewer deemed it worthy of full‐text review.
All full‐text articles were independently reviewed by the same 2 investigators. The inclusion criterion was the measurement of burnout in physicians who are stated to or can be reasonably assumed to spend the substantial majority of their clinical practice exclusively in either the inpatient or the outpatient setting. Studies of emergency department physicians or specialists who invariably spend substantial amounts of time in both settings (eg, surgeons, anesthesiologists) were excluded. Studies limited to trainees or nonphysicians were also excluded. For both stages of review, agreement between the 2 investigators was assessed by calculating the statistic. Disagreements about inclusion were adjudicated by a third investigator (A.I.B.).
Because our goal was to establish and compare the rate of burnout among US hospitalists and other inpatient physicians around the world, we included studies of hospitalists according to the definition in use at the time of the individual study, noting that the formal definition of a hospitalist has changed over the years.[33] Because practice patterns for physicians described as primary care physicians, family doctors, hospital doctors, and others differ substantially from country to country, we otherwise included only the studies where the practice location was stated explicitly or where the authors confirmed that their study participants either are known or can be reasonably assumed to spend more than 75% of their time caring for hospital inpatients, or are known or can be reasonably assumed to spend the vast majority of their time caring for outpatients.
Data were abstracted using a standardized form and included the measure of burnout used in the study, results, practice location of study subjects, and total number of study subjects. When data were not clear (eg, burnout measured but not reported by the authors, practice location of study subjects not clear), authors were contacted by email, or when no current email address could be located or no response was received, by telephone or letter. In instances where burnout was measured repeatedly over time or before and after a specific intervention, only the baseline measurement was recorded. Because all studies were expected to be nonrandomized, methodological quality was assessed using a version of the tool of Downs and Black,[34] adapted where necessary by omitting questions not applicable to the specific study type (eg randomization for survey studies)[35] and giving a maximum of 1 point for the inclusion of a power calculation.
Two a priori analyses were planned: (1) a statistical comparison of articles directly comparing burnout among inpatient and outpatient physicians, and (2) a statistical comparison of articles measuring burnout among inpatient physicians with articles measuring burnout among outpatient physicians by the most frequently reported measuremean subset scores for emotional exhaustion, depersonalization, and personal accomplishment on the MBI.
The primary outcome measures were the differences between mean subset scores for emotional exhaustion, depersonalization, and personal accomplishment on the MBI. All differences are expressed as (outpatient meaninpatient mean). The variance of each outcome was calculated with standard formulas.[36] To calculate the overall estimate, each study was weighted by the reciprocal of its variance. Studies with fewer than 10 subjects were excluded from statistical analysis but retained in the systematic review.
For studies that reported data for both inpatient and outpatient physicians (double‐armed studies), Cochran Q test and the I2 value were used to assess heterogeneity.[37, 38] Substantial heterogeneity was expected because these individual studies were conducted for different populations in different settings with different study designs, and this expectation was confirmed statistically. Therefore, we used a random effects model to estimate the overall effect, providing a conservative approach that accounted for heterogeneity among studies.[39]
To assess the durability of our findings, we performed separate multivariate meta‐regression analyses by including single‐armed studies only and including both single‐armed and double‐armed studies. For these meta‐regressions, means were again weighted by the reciprocal of their variances, and the arms of 2‐armed studies were considered separately. This approach allowed us to generate an estimate of the differences between MBI subset scores from studies that did not include such an estimate when analyzed separately.[40]
We examined the potential for publication bias in double‐armed studies by constructing a funnel plot, in which mean scores were plotted against their standard errors.[41] The trim‐and‐fill method was used to determine whether adjustment for publication bias was necessary. In addition, Begg's rank correlation test[42] was completed to test for statistically significant publication bias.
Stata 10.0 statistical software (StataCorp, College Station, TX) was used for data analyses. A P value of 0.05 or less was deemed statistically significant. The Preferred Reporting Items for Systematic Reviews and Meta‐analysis checklist was used for the design and execution of the systematic review and meta‐analysis.[43]
Subgroup analyses based on location were undertaken a posteriori. All data (double‐armed meta‐analysis, meta‐regression of single‐armed studies, and meta‐regression of single‐ and double‐armed studies) were analyzed by location (United States vs other; United States vs Europe vs other).
RESULTS
The search results are outlined in Figure 1. In total, 1704 articles met the criteria for full‐text review. A review of pertinent reference lists and author contacts led to the addition of 149 articles. Twenty‐nine references could not be located by any means, despite repeated attempts. Therefore, 1824 articles were subjected to full‐text review by the 2 investigators.

Initially, 57 articles were found that met criteria for inclusion. Of these, 2 articles reported data in formats that could not be interpreted.[44, 45] When efforts to clarify the data with the authors were unsuccessful, these studies were excluded. A study specifically designed to assess the response of physicians to a recent series of terrorist attacks[46] was excluded a posteriori because of lack of generalizability. Of the other 54 studies, 15 reported burnout data on both outpatient physicians and inpatient physicians, 22 reported data on outpatient physicians only, and 17 reported data on inpatient physicians only. Table 1 summarizes the results of the 37 studies involving outpatient physicians; Table 2 summarizes the 32 studies involving inpatient physicians.
| Lead Author, Publication Year | Study Population and Location | Instrument | No. of Participants | EE Score (SD)a | DP Score (SD) | PA Score (SD) | Other Results |
|---|---|---|---|---|---|---|---|
| |||||||
| Schweitzer, 1994[12] | Young physicians of various specialties in South Africa | Single‐item survey | 7 | 6 (83%) endorsed burnout | |||
| Aasland, 1997 [54]b | General practitioners in Norway | Modified MBI (22 items; scale, 15) | 298 | 2.65 (0.80) | 1.90 (0.59) | 3.45 (0.40) | |
| Grassi, 2000 [58] | General practitioners in Italy | MBI | 182 | 18.49 (11.49) | 6.11 (5.86) | 38.52 (7.60) | |
| McManus, 2000 [59]b | General practitioners in United Kingdom | Modified MBI (9 items; scale, 06) | 800 | 8.34 (4.39) | 3.18 (3.40) | 14.16 (2.95) | |
| Yaman, 2002 [60] | General practitioners in 8 European nations | MBI | 98 | 25.1 (8.50) | 7.3 (4.92) | 34.5 (7.67) | |
| Cathbras, 2004 [61] | General practitioners in France | MBI | 306 | 21.85 (12.4) | 9.13 (6.7) | 38.7 (7.1) | |
| Goehring, 2005 [63] | General practitioners, general internists, pediatricians in Switzerland | MBI | 1755 | 17.9 (9.8) | 6.5 (4.7) | 39.6 (6.5) | |
| Esteva, 2006 [64] | General practitioners, pediatricians in Spain | MBI | 261 | 27.4 (11.8) | 10.07 (6.4) | 35.9 (7.06) | |
| Gandini, 2006 [65]b | Physicians of various specialties in Argentina | MBI | 67 | 31.0 (13.8) | 10.2 (6.6) | 38.4 (6.8) | |
| Ozyurt, 2006 [66] | General practitioners in Turkey | Modified MBI (22 items; scale, 04) | 55 | 15.23 (5.80) | 4.47 (3.31) | 23.38 (4.29) | |
| Deighton, 2007 [67]b | Psychiatrists in several German‐speaking nations | MBI | 19 | 30.68 (9.92) | 13.42 (4.23) | 37.16 (3.39) | |
| Dunwoodie, 2007 [68]b | Palliative care physicians in Australia | MBI | 21 | 14.95 (9.14) | 3.95 (3.40) | 38.90 (2.88) | |
| Srgaard, 2007 [69]b | Psychiatrists in 5 European nations | MBI | 22 | 19.41 (8.08) | 6.68 (4.93) | 39.00 (4.40) | |
| Sosa Oberlin, 2007 [56]b | Physicians of various specialties in Argentina | Author‐designed instrument | 33 | 26 (78.8%) had 4 burnout symptoms, 6.15 symptoms per physician | |||
| Voltmer, 2007 [57]b | Physicians of various specialties in Germany | AVEM | 46 | 11 (23.9%) exhibited burnout (type B) pattern | |||
| dm, 2008 [70]b | Physicians of various specialties in Hungary | MBI | 163 | 17.45 (11.12) | 4.86 (4.91) | 36.56 (7.03) | |
| Di Iorio, 2008 [71]b | Dialysis physicians in Italy | Author‐designed instrument | 54 | Work: 2.6 (1.5), Material: 3.1 (2.1), Climate: 3.0 (1.1), Objectives: 3.4 (1.6), Quality: 2.2 (1.5), Justification: 3.2 (2.0) | |||
| Lee, 2008 [49]b | Family physicians in Canada | MBI | 123 | 26.26 (9.53) | 10.20 (5.22) | 38.43 (7.34) | |
| Truchot, 2008 [72] | General practitioners in France | MBI | 259 | 25.4 (11.7) | 7.5 (5.5) | 36.5 (7.1) | |
| Twellaar, 2008 [73]b | General practitioners in the Netherlands | Utrecht Burnout Inventory | 349 | 2.06 (1.11) | 1.71 (1.05) | 5.08 (0.77) | |
| Arigoni, 2009 [17] | General practitioners, pediatricians in Switzerland | MBI | 258 | 22.8 (12.0) | 6.9 (6.1) | 39.0 (7.2) | |
| Bernhardt, 2009 [75] | Clinical geneticists in United States | MBI | 72 | 25.8 (10.01)c | 10.9 (4.16)c | 34.8 (5.43)c | |
| Bressi, 2009 [76]b | Psychiatrists in Italy | MBI | 53 | 23.15 (11.99) | 7.02 (6.29) | 36.41 (7.54) | |
| Krasner, 2009 [77] | General practitioners in United States | MBI | 60 | 26.8 (10.9)d | 8.4 (5.1)d | 40.2 (5.3)d | |
| Lasalvia, 2009 [55]b | Psychiatrists in Italy | Modified MBI (16 items; scale, 06) | 38 | 2.37 (1.27) | 1.51 (1.15) | 4.46 (0.87) | |
| Peisah, 2009 [79]b | Physicians of various specialties in Australia | MBI | 28 | 13.92 (9.24) | 3.66 (3.95) | 39.34 (8.55) | |
| Shanafelt, 2009 [80]b | Physicians of various specialties in United States | MBI | 408 | 20.5 (11.10) | 4.3 (4.74) | 40.8 (6.26) | |
| Zantinge, 2009 [81] | General practitioners in the Netherlands | Utrecht Burnout Inventory | 126 | 1.58 (0.79) | 1.32 (0.72) | 4.27 (0.77) | |
| Voltmer, 2010 [83]b | Psychiatrists in Germany | AVEM | 526 | 114 (21.7%) exhibited burnout (type B) pattern | |||
| Maccacaro, 2011 [85]b | Physicians of various specialties in Italy | MBI | 42 | 14.31 (11.98) | 3.62 (4.95) | 38.24 (6.22) | |
| Lucas, 2011 [84]b | Outpatient physicians periodically staffing an academic hospital teaching service in United States | MBI (EE only) | 30 | 24.37 (14.95) | |||
| Shanafelt, 2012 [87]b | General internists in United States | MBI | 447 | 25.4 (14.0) | 7.5 (6.3) | 41.4 (6.0) | |
| Kushnir, 2004 [62] | General practitioners and pediatricians in Israel | MBI (DP only) and SMBM | 309 | 9.15 (3.95) | SMBM mean (SD), 2.73 per item (0.86) | ||
| Vela‐Bueno, 2008 [74]b | General practitioners in Spain | MBI | 240 | 26.91 (11.61) | 9.20 (6.35) | 35.92 (7.92) | |
| Lesic, 2009 [78]b | General practitioners in Serbia | MBI | 38 | 24.71 (10.81) | 7.47 (5.51) | 37.21 (7.44) | |
| Demirci, 2010 [82]b | Medical specialists related to oncology practice in Hungary | MBI | 26 | 23.31 (11.2) | 6.46 (5.7) | 37.7 (8.14) | |
| Putnik, 2011 [86]b | General practitioners in Hungary | MBI | 370 | 22.22 (11.75) | 3.66 (4.40) | 41.40 (6.85) | |
| Lead Author, Publication Year | Study Population and Location | Instrument | No. of Participants | EE Score (SD)a | DP Score (SD) | PA Score (SD) | Other Results |
|---|---|---|---|---|---|---|---|
| |||||||
| Varga, 1996 [88] | Hospital doctors in Spain | MBI | 179 | 21.61b | 7.33b | 35.28b | |
| Aasland, 1997 [54] | Hospital doctors in Norway | Modified MBI (22 items; scale, 15) | 582 | 2.39 (0.80) | 1.81 (0.65) | 3.51 (0.46) | |
| Bargellini, 2000 [89] | Hospital doctors in Italy | MBI | 51 | 17.45 (9.87) | 7.06 (5.54) | 35.33 (7.90) | |
| Grassi, 2000 [58] | Hospital doctors in Italy | MBI | 146 | 16.17 (9.64) | 5.32 (4.76) | 38.71 (7.28) | |
| Hoff, 2001 [33] | Hospitalists in United States | Single‐item surveyc | 393 | 12.9% burned out (>4/5), 24.9% at risk for burnout (34/5), 62.2% at no current risk (mean, 2.86 on 15 scale) | |||
| Trichard, 2005 [90] | Hospital doctors in France | MBI | 199 | 16 (10.7) | 6.6 (5.7) | 38.5 (6.5) | |
| Gandini, 2006 [65]d | Hospital doctors in Argentina | MBI | 290 | 25.0 (12.7) | 7.9 (6.2) | 40.1 (7.0) | |
| Dunwoodie, 2007 [68]d | Palliative care doctors in Australia | MBI | 14 | 18.29 (14.24) | 5.29 (5.89) | 38.86 (3.42) | |
| Srgaard, 2007 [69]d | Psychiatrists in 5 European nations | MBI | 18 | 18.56 (9.32) | 5.50 (3.79) | 39.08 (5.39) | |
| Sosa Oberlin, 2007 [56]d | Hospital doctors in Argentina | Author‐designed instrument | 3 | 3 (100%) had 4 burnout symptoms, 8.67 symptoms per physician | |||
| Voltmer, 2007 [57]d | Hospital doctors in Germany | AVEM | 271 | 77 (28.4%) exhibited burnout (type B) pattern | |||
| dm, 2008 [70]b | Physicians of various specialties in Hungary | MBI | 194 | 19.23 (10.79) | 4.88 (4.61) | 35.26 (8.42) | |
| Di Iorio, 2008 [71]d | Dialysis physicians in Italy | Author‐designed instrument | 62 | Work, mean (SD), 3.1 (1.4); Material, mean (SD), 3.3 (1.5); Climate, mean (SD), 2.9 (1.1); Objectives, mean (SD), 2.5 (1.5); Quality, mean (SD), 3.0 (1.1); Justification, mean (SD), 3.1 (2.1) | |||
| Fuss, 2008 [91]d | Hospital doctors in Germany | Copenhagen Burnout Inventory | 292 | Mean Copenhagen Burnout Inventory, mean (SD), 46.90 (18.45) | |||
| Marner, 2008 [92]d | Psychiatrists and 1 generalist in United States | MBI | 9 | 20.67 (9.75) | 7.78 (5.14) | 35.33 (6.44) | |
| Shehabi, 2008 [93]d | Intensivists in Australia | Modified MBI (6 items; scale, 15) | 86 | 2.85 (0.93) | 2.64 (0.85) | 2.58 (0.83) | |
| Bressi, 2009 [76]d | Psychiatrists in Italy | MBI | 28 | 17.89 (14.46) | 5.32 (7.01) | 34.57 (11.27) | |
| Brown, 2009 [94] | Hospital doctors in Australia | MBI | 12 | 22.25 (8.59) | 6.33 (2.71) | 39.83 (7.31) | |
| Lasalvia, 2009 [55]d | Psychiatrists in Italy | Modified MBI (16 items; scale, 06) | 21 | 1.95 (1.04) | 1.35 (0.85) | 4.46 (1.04) | |
| Peisah, 2009 [79]d | Hospital doctors in Australia | MBI | 62 | 20.09 (9.91) | 6.34 (4.90) | 35.06 (7.33) | |
| Shanafelt, 2009 [80]d | Hospitalists and intensivists in United States | MBI | 19 | 25.2 (11.59) | 4.4 (3.79) | 38.5 (8.04) | |
| Tunc, 2009 [95] | Hospital doctors in Turkey | Modified MBI (22 items; scale, 04) | 62 | 1.18 (0.78) | 0.81 (0.73) | 3.10 (0.59)e | |
| Cocco, 2010 [96]d | Hospital geriatricians in Italy | MBI | 38 | 16.21 (11.56) | 4.53 (4.63) | 39.13 (7.09) | |
| Doppia, 2011 [97]d | Hospital doctors in France | Copenhagen Burnout Inventory | 1,684 | Mean work‐related burnout score, 2.72 (0.75) | |||
| Glasheen, 2011 [98] | Hospitalists in United States | Single‐item survey | 265 | Mean, 2.08 on 15 scale 62 (23.4%) burned out | |||
| Lucas, 2011 [84]d | Academic hospitalists in United States | MBI (EE only) | 26 | 19.54 (12.85) | |||
| Thorsen, 2011 [99] | Hospital doctors in Malawi | MBI | 2 | 25.5 (4.95) | 8.5 (6.36) | 25.0 (5.66) | |
| Hinami, 2012 [50]d | Hospital doctors in United States | Single‐item survey | 793 | Mean, 2.24 on 15 scale 261 (27.2%) burned out | |||
| Quenot, 2012 [100]d | Intensivists in France | MBI | 4 | 33.25 (4.57) | 13.50 (5.45) | 35.25 (4.86) | |
| Ruitenburg, 2012 [101] | Hospital doctors in the Netherlands | MBI (EE and DP only) | 214 | 13.3 (8.0) | 4.5 (4.1) | ||
| Seibt, 2012 [102]d | Hospital doctors in Germany | Modified MBI (16 items; scale, 06, reported per item rather than totals) | 2,154 | 2.2 (1.4) | 1.4 (1.2) | 5.1 (0.9) | |
| Shanafelt, 2012 [87]d | Hospitalists in United States | MBI | 130 | 24.7 (12.5) | 9.1 (6.9) | 39.0 (7.6) | |
Table 3 summarizes the results of the 15 studies that reported burnout data for both inpatient and outpatient physicians, allowing direct comparisons to be made. Nine studies reported MBI subset totals with standard deviations, 2 used different modifications of the MBI, 2 used different author‐derived measures, 1 used only the emotional exhaustion subscale of the MBI, and 1 used the Arbeitsbezogenes Verhaltens und Erlebensmuster. Therefore, statistical comparison was attempted only for the 9 studies reporting comparable MBI data, comprising burnout data on 1390 outpatient physicians and 899 inpatient physicians.
| Lead Author, Publication Year | Location | Instrument | Inpatient‐Based Physicians | Outpatient‐Based Physicians | ||
|---|---|---|---|---|---|---|
| No. | Results, Score (SD)a | No. | Results, Score (SD)a | |||
| ||||||
| Aasland, 1997 [54]b | Norway | Modified MBI (22 items; scale, 15) | 582 | EE, 2.39 (0.80); DP, 1.81 (0.65); PA, 3.51 (0.46) | 298 | EE, 2.65 (0.80); DP, 1.90 (0.59); PA, 3.45 (0.40) |
| Grassi, 2000 [58] | Italy | MBI | 146 | EE, 16.17 (9.64); DP, 5.32 (4.76); PA, 38.71 (7.28) | 182 | EE, 18.49 (11.49); DP, 6.11 (5.86); PA, 38.52 (7.60) |
| Gandini, 2006 [65]b | Argentina | MBI | 290 | EE, 25.0 (12.7);DP, 7.9 (6.2); PA, 40.1 (7.0) | 67 | EE, 31.0 (13.8); DP, 10.2 (6.6); PA, 38.4 (6.8) |
| Dunwoodie, 2007 [68]b | Australia | MBI | 14 | EE, 18.29 (14.24); DP, 5.29 (5.89); PA, 38.86 (3.42) | 21 | EE, 14.95 (9.14); DP, 3.95 (3.40); PA, 38.90 (2.88) |
| Srgaard, 2007 [69]b | 5 European nations | MBI | 18 | EE, 18.56 (9.32); DP, 5.50 (3.79); PA, 39.08 (5.39) | 22 | EE, 19.41 (8.08); DP, 6.68 (4.93); PA, 39.00 (4.40) |
| Sosa Oberlin, 2007 [56]b | Argentina | Author‐designed instrument | 3 | 3 (100%) had 4 burnout symptoms, 8.67 symptoms per physician | 33 | 26 (78.8%) had 4 burnout symptoms, 6.15 symptoms per physician |
| Voltmer, 2007 [57]b | Germany | AVEM | 271 | 77 (28.4%) exhibited burnout (type B) pattern | 46 | 11 (23.9%) exhibited burnout (type B) pattern |
| dm, 2008 [70]b | Hungary | MBI | 194 | EE, 19.23 (10.79); DP, 4.88 (4.61); PA, 35.26 (8.42) | 163 | EE, 17.45 (11.12); DP, 4.86 (4.91); PA, 36.56 (7.03) |
| Di Iorio, 2008 [71]b | Italy | Author‐designed instrument | 62 | Work: 3.1 (1.4); material: 3.3 (1.5); climate: 2.9 (1.1); objectives: 2.5 (1.5); quality: 3.0 (1.1); justification: 3.1 (2.1) | 54 | Work: 2.6 (1.5); material: 3.1 (2.1); climate: 3.0 (1.1); objectives: 3.4 (1.6); quality: 2.2 (1.5); justification: 3.2 (2.0) |
| Bressi, 2009 [76]b | Italy | MBI | 28 | EE, 17.89 (14.46); DP, 5.32 (7.01); PA, 34.57 (11.27) | 53 | EE, 23.15 (11.99); DP, 7.02 (6.29); PA, 36.41 (7.54) |
| Lasalvia, 2009[55]b | Italy | Modified MBI (16 items; scale, 06) | 21 | EE, 1.95 (1.04); DP, 1.35 (0.85); PA, 4.46 (1.04) | 38 | EE, 2.37 (1.27); DP, 1.51 (1.15); PA, 4.46 (0.87) |
| Peisah, 2009 [79]b | Australia | MBI | 62 | EE, 20.09 (9.91); DP, 6.34 (4.90); PA, 35.06 (7.33) | 28 | EE, 13.92 (9.24); DP, 3.66 (3.95); PA, 39.34 (8.55) |
| Shanafelt, 2009 [80]b | United States | MBI | 19 | EE, 25.2 (11.59); DP, 4.4 (3.79); PA, 38.5 (8.04) | 408 | EE, 20.5 (11.10); DP, 4.3 (4.74); PA, 40.8 (6.26) |
| Lucas, 2011 [84]b | United States | MBI (EE only) | 26 | EE, 19.54 (12.85) | 30 | EE, 24.37 (14.95) |
| Shanafelt, 2012 [87]b | United States | MBI | 130 | EE, 24.7 (12.5); DP, 9.1 (6.9); PA, 39.0 (7.6) | 447 | EE, 25.4 (14.0); DP, 7.5 (6.3); PA, 41.4 (6.0) |
Figure 2 shows that no significant difference existed between the groups regarding emotional exhaustion (mean difference, 0.11 points on a 54‐point scale; 95% confidence interval [CI], 2.40 to 2.61; P=0.94). In addition, there was no significant difference between the groups regarding depersonalization (Figure 3; mean difference, 0.00 points on a 30‐point scale; 95% CI, 1.03 to 1.02; P=0.99) and personal accomplishment (Figure 4; mean difference, 0.93 points on a 48‐point scale; 95% CI, 0.23 to 2.09; P=0.11).
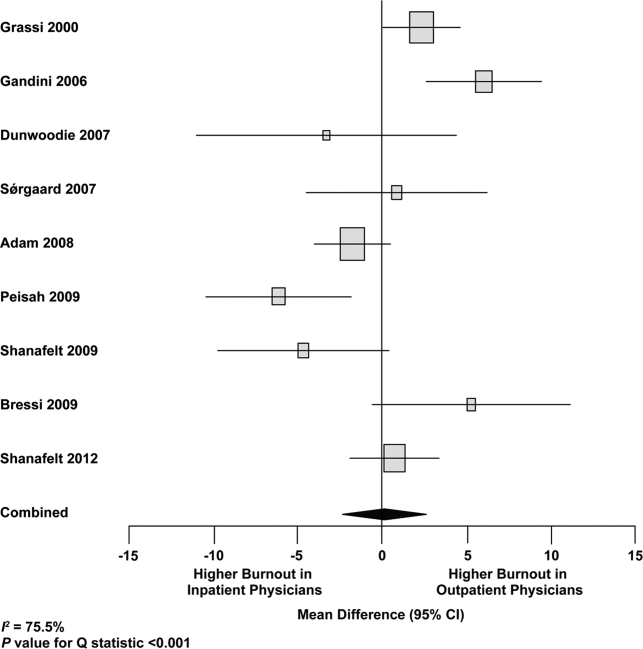

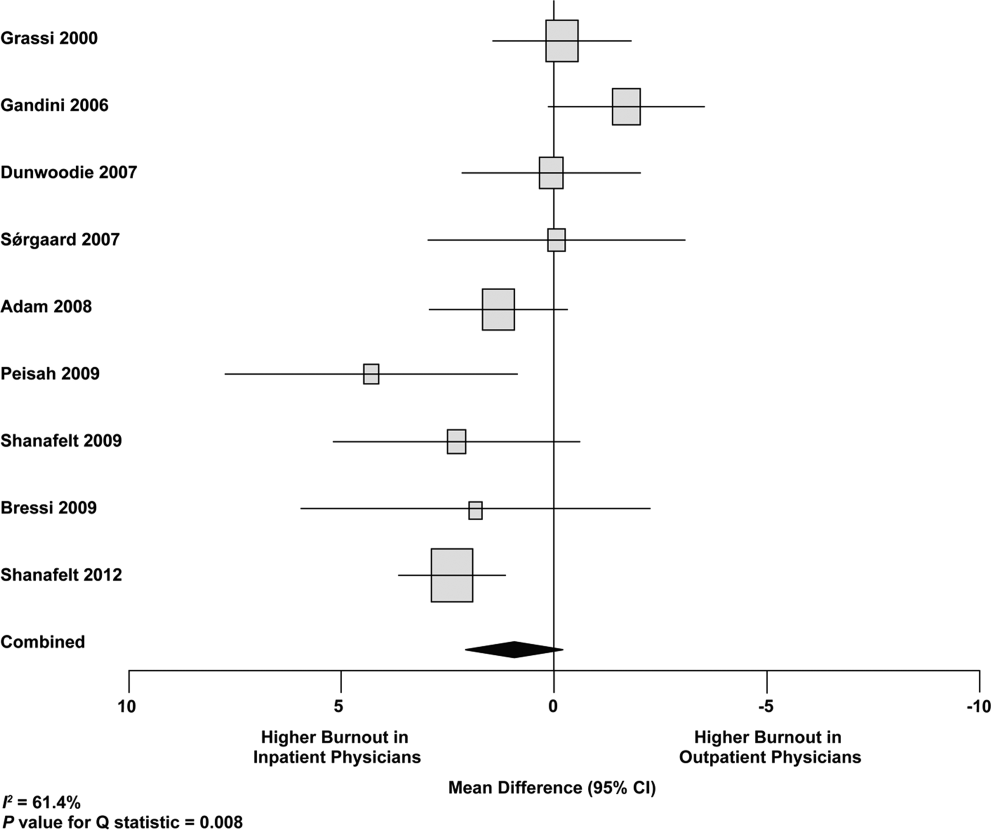
We used meta‐regression to allow the incorporation of single‐armed MBI studies. Whether single‐armed studies were analyzed separately (15 outpatient studies comprising 3927 physicians, 4 inpatient studies comprising 300 physicians) or analyzed with double‐armed studies (24 outpatient arms comprising 5318 physicians, 13 inpatient arms comprising 1301 physicians), the lack of a significant difference between the groups persisted for the depersonalization and personal accomplishment scales (Figure 5). Emotional exhaustion was significantly higher in outpatient physicians when single‐armed studies were considered separately (mean difference, 6.36 points; 95% CI, 2.24 to 10.48; P=0.002), and this difference persisted when all studies were combined (mean difference, 3.00 points; 95% CI, 0.05 to 5.94, P=0.046).
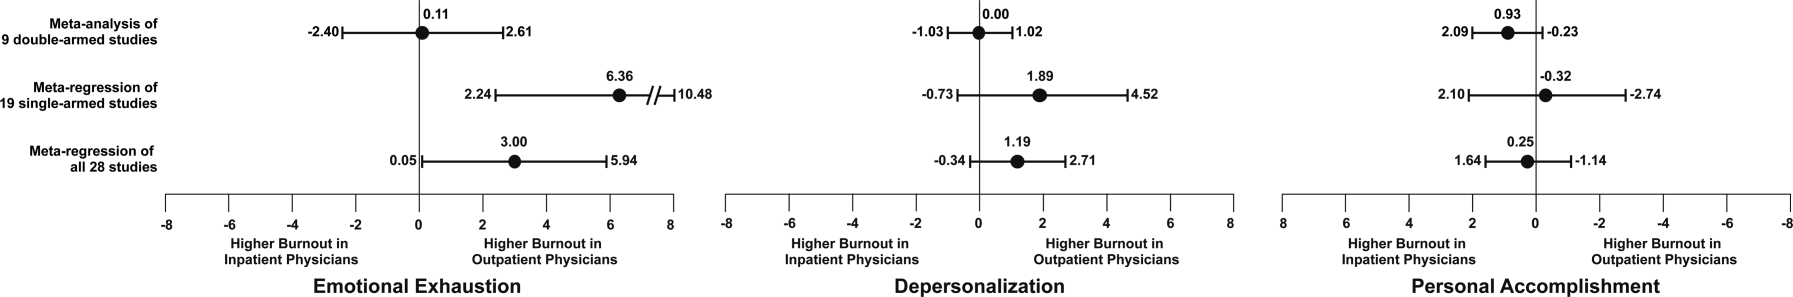
Subgroup analysis by geographic location showed US outpatient physicians had a significantly higher personal accomplishment score than US inpatient physicians (mean difference, 2.38 points; 95% CI, 1.22 to 3.55; P<0.001) in double‐armed studies. This difference did not persist when single‐armed studies were included through meta‐regression (mean difference, 0.55 points, 95% CI, 4.30 to 5.40, P=0.83).
Table 4 demonstrates that methodological quality was generally good from the standpoint of the reporting and bias subsections of the Downs and Black tool. External validity was scored lower for many studies due to the use of convenience samples and lack of information about physicians who declined to participate.
| Lead Author, Publication Year | Reporting | External Validity | Internal Validity: Bias | Internal Validity: Confounding | Power |
|---|---|---|---|---|---|
| Schweitzer, 1994 [12] | 5 of 6 points | 1 of 2 points | 3 of 4 points | 0 of 1 point | 0 of 1 point |
| Varga, 1996 [88] | 5 of 6 points | 1 of 2 points | 3 of 4 points | 1 of 1 point | 0 of 1 point |
| Aasland, 1997 [54] | 3 of 6 points | 2 of 2 points | 3 of 4 points | 1 of 1 point | 0 of 1 point |
| Bargellini, 2000 [89] | 5 of 6 points | 0 of 2 points | 4 of 4 points | 1 of 1 point | 0 of 1 point |
| Grassi, 2000 [58] | 6 of 6 points | 0 of 2 points | 3 of 4 points | 0 of 1 point | 0 of 1 point |
| McManus, 2000 [59] | 5 of 6 points | 2 of 2 points | 4 of 4 points | 1 of 1 point | 0 of 1 point |
| Hoff, 2001 [33] | 6 of 6 points | 2 of 2 points | 2 of 4 points | 1 of 1 point | 0 of 1 point |
| Yaman, 2002 [60] | 5 of 6 points | 0 of 2 points | 4 of 4 points | 0 of 1 point | 0 of 1 point |
| Cathbras, 2004 [61] | 6 of 6 points | 0 of 2 points | 4 of 4 points | 0 of 1 point | 0 of 1 point |
| Kushnir, 2004 [62] | 5 of 6 points | 0 of 2 points | 3 of 4 points | 0 of 1 point | 0 of 1 point |
| Goehring, 2005 [63] | 6 of 6 points | 1 of 2 points | 3 of 4 points | 1 of 1 point | 0 of 1 point |
| Trichard, 2005 [90] | 3 of 6 points | 1 of 2 points | 3 of 4 points | 0 of 1 point | 0 of 1 point |
| Esteva, 2006 [64] | 6 of 6 points | 2 of 2 points | 4 of 4 points | 1 of 1 point | 0 of 1 point |
| Gandini, 2006 [65] | 6 of 6 points | 1 of 2 points | 3 of 4 points | 1 of 1 point | 0 of 1 point |
| Ozyurt, 2006 [66] | 6 of 6 points | 2 of 2 points | 4 of 4 points | 1 of 1 point | 0 of 1 point |
| Deighton, 2007 [67] | 5 of 6 points | 0 of 2 points | 4 of 4 points | 0 of 1 point | 0 of 1 point |
| Dunwoodie, 2007 [68] | 5 of 6 points | 2 of 2 points | 4 of 4 points | 0 of 1 point | 0 of 1 point |
| Srgaard, 2007 [69] | 6 of 6 points | 0 of 2 points | 3 of 4 points | 1 of 1 point | 1 of 1 point |
| Sosa Oberlin, 2007 [56] | 4 of 6 points | 0 of 2 points | 3 of 4 points | 0 of 1 point | 0 of 1 point |
| Voltmer, 2007 [57] | 4 of 6 points | 0 of 2 points | 4 of 4 points | 0 of 1 point | 0 of 1 point |
| dm, 2008 [70] | 5 of 6 points | 2 of 2 points | 3 of 4 points | 1 of 1 point | 0 of 1 point |
| Di Iorio, 2008 [71] | 6 of 6 points | 0 of 2 points | 2 of 4 points | 0 of 1 point | 0 of 1 point |
| Fuss, 2008 [91] | 6 of 6 points | 0 of 2 points | 3 of 4 points | 0 of 1 point | 0 of 1 point |
| Lee, 2008 [49] | 4 of 6 points | 2 of 2 points | 4 of 4 points | 0 of 1 point | 1 of 1 point |
| Marner, 2008 [92] | 6 of 6 points | 0 of 2 points | 4 of 4 points | 0 of 1 point | 0 of 1 point |
| Shehabi, 2008 [93] | 3 of 6 points | 1 of 2 points | 3 of 4 points | 0 of 1 point | 0 of 1 point |
| Truchot, 2008 [72] | 5 of 6 points | 1 of 2 points | 3 of 4 points | 0 of 1 point | 0 of 1 point |
| Twellaar, 2008 [73] | 6 of 6 points | 2 of 2 points | 3 of 4 points | 0 of 1 point | 0 of 1 point |
| Vela‐Bueno, 2008 [74] | 5 of 6 points | 2 of 2 points | 4 of 4 points | 1 of 1 point | 0 of 1 point |
| Arigoni, 2009 [17] | 6 of 6 points | 2 of 2 points | 4 of 4 points | 1 of 1 point | 0 of 1 point |
| Bernhardt, 2009 [75] | 6 of 6 points | 2 of 2 points | 4 of 4 points | 1 of 1 point | 0 of 1 point |
| Bressi, 2009 [76] | 6 of 6 points | 0 of 2 points | 3 of 4 points | 1 of 1 point | 0 of 1 point |
| Brown, 2009 [94] | 6 of 6 points | 0 of 2 points | 4 of 4 points | 0 of 1 point | 0 of 1 point |
| Krasner, 2009 [77] | 9 of 11 points | 0 of 3 points | 6 of 7 points | 1 of 2 points | 1 of 1 point |
| Lasalvia, 2009 [55] | 6 of 6 points | 2 of 2 points | 4 of 4 points | 1 of 1 point | 0 of 1 point |
| Lesic, 2009 [78] | 5 of 6 points | 0 of 2 points | 4 of 4 points | 0 of 1 point | 0 of 1 point |
| Peisah, 2009 [79] | 6 of 6 points | 2 of 2 points | 3 of 4 points | 1 of 1 point | 0 of 1 point |
| Shanafelt, 2009 [80] | 6 of 6 points | 2 of 2 points | 4 of 4 points | 1 of 1 point | 0 of 1 point |
| Tunc, 2009 [95] | 6 of 6 points | 2 of 2 points | 4 of 4 points | 1 of 1 point | 0 of 1 point |
| Zantinge, 2009 [81] | 5 of 6 points | 0 of 2 points | 3 of 4 points | 1 of 1 point | 0 of 1 point |
| Cocco, 2010 [96] | 4 of 6 points | 0 of 2 points | 4 of 4 points | 0 of 1 point | 0 of 1 point |
| Demirci, 2010 [82] | 6 of 6 points | 0 of 2 points | 4 of 4 points | 0 of 1 point | 0 of 1 point |
| Voltmer, 2010 [83] | 6 of 6 points | 2 of 2 points | 4 of 4 points | 1 of 1 point | 0 of 1 point |
| Doppia, 2011 [97] | 5 of 6 points | 2 of 2 points | 4 of 4 points | 1 of 1 point | 0 of 1 point |
| Glasheen, 2011 [98] | 5 of 6 points | 0 of 2 points | 4 of 4 points | 1 of 1 point | 0 of 1 point |
| Lucas, 2011 [84] | 10 of 11 points | 2 of 3 points | 7 of 7 points | 5 of 6 points | 1 of 1 point |
| Maccacaro, 2011 [85] | 5 of 6 points | 0 of 2 points | 4 of 4 points | 1 of 1 point | 0 of 1 point |
| Putnik, 2011 [86] | 6 of 6 points | 1 of 2 points | 4 of 4 points | 0 of 1 point | 0 of 1 point |
| Thorsen, 2011 [99] | 6 of 6 points | 0 of 2 points | 4 of 4 points | 0 of 1 point | 0 of 1 point |
| Hinami, 2012 [50] | 6 of 6 points | 2 of 2 points | 4 of 4 points | 1 of 1 point | 1 of 1 point |
| Quenot, 2012 [100] | 8 of 11 points | 1 of 3 points | 6 of 7 points | 1 of 2 points | 0 of 1 point |
| Ruitenburg, 2012 [101] | 6 of 6 points | 2 of 2 points | 4 of 4 points | 0 of 1 point | 0 of 1 point |
| Seibt, 2012 [102] | 6 of 6 points | 0 of 2 points | 4 of 4 points | 1 of 1 point | 0 of 1 point |
| Shanafelt, 2012 [87] | 6 of 6 points | 2 of 2 points | 4 of 4 points | 1 of 1 point | 0 of 1 point |
Funnel plots were used to evaluate for publication bias in the meta‐analysis of the 8 double‐armed studies (Figure 6). We found no significant evidence of bias, which was supported by Begg's test P values of 0.90 for emotional exhaustion, >0.99 for depersonalization, and 0.54 for personal accomplishment. A trim‐and‐fill analysis determined that no adjustment was necessary.
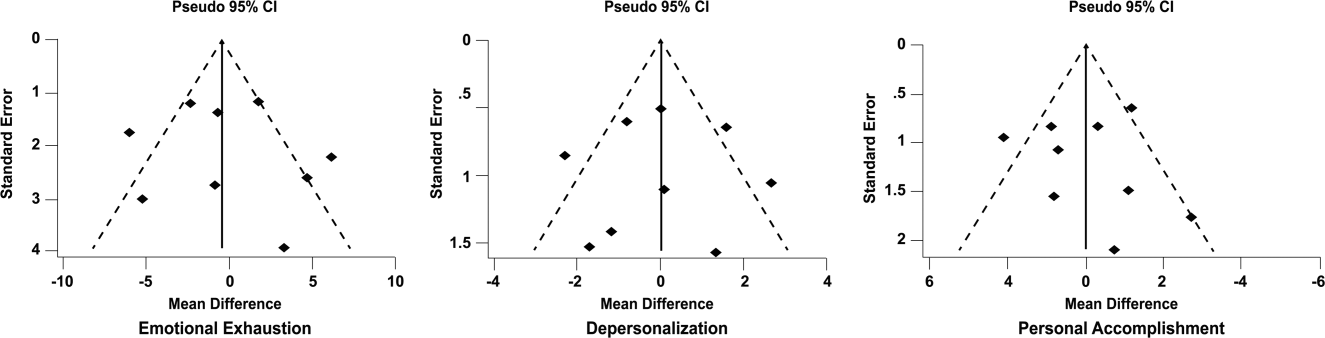
DISCUSSION
There appears to be no support for the long‐held belief that inpatient physicians are particularly prone to burnout. Among studies for which practice location was stated explicitly or could be obtained from the authors, and who used the MBI, no differences were found among inpatient and outpatient physicians with regard to depersonalization or personal accomplishment. This finding persisted whether double‐armed studies were compared directly, single‐armed studies were incorporated into this analysis, or single‐armed studies were analyzed separately. Outpatient physicians had a higher degree of emotional exhaustion when all studies were considered.
There are several reasons why outpatient physicians may be more prone to emotional exhaustion than their inpatient colleagues. Although it is by no means true that all inpatient physicians work in shifts, the increased availability of shift work may allow some inpatient physicians to better balance their professional and personal lives, a factor of work with which some outpatient physicians have struggled.[47] Inpatient practice may also afford more opportunity for teamwork, a factor that has been shown to correlate with reduced burnout.[48] When surveyed about burnout, outpatient physicians have cited patient volumes, paperwork, medicolegal concerns, and lack of community support as factors.[49] Inpatient physicians are not immune to these forces, but they arguably experience them to different degrees.
The absence of a higher rate of depersonalization among inpatient physicians is particularly reassuring in light of concerns expressed with the advent of US hospital medicinethat some hospitalists would be prone to viewing patients as an impediment to the efficient running of the hospital,[2] the very definition of depersonalization.
Although the difference in the whole sample was not statistically significant, the consistent tendency toward a greater sense of personal accomplishment among outpatient physicians is also noteworthy, particularly because post hoc subgroup analysis of US physicians did show statistical significance in both 2‐armed studies. Without detailed age data for the physicians in each study, we could not separate the possible impact of age on personal accomplishment; hospital medicine is a newer specialty staffed by generally younger physicians, and hospitalists may not have had time to develop a sense of accomplishment. When surveyed about job satisfaction, hospitalists have also reported the feeling that they were treated as glorified residents,[50] a factor that, if shared by other inpatient physicians, must surely affect their sense of personal accomplishment. The lack of longitudinal care for patients and the substantial provision of end‐of‐life care also may diminish the sense of personal accomplishment among inpatient physicians.
Another important finding from this systematic review is the marked heterogeneity of the instruments used to measure physician burnout. Many of the identified studies could not be subjected to meta‐analysis because of their use of differing burnout measures. Drawing more substantial conclusions about burnout and practice location is limited by the fact that, although the majority of studies used the full MBI, the largest study of European hospital doctors used the Copenhagen Burnout Inventory, and the studies thus far of US hospitalists have used single‐item surveys or portions of the MBI. Not reflected in this review is the fact that a large study of US burnout and job satisfaction[51] did not formally address practice location (M. Linzer, personal communication, August 2012). Similarly, a large study of British hospital doctors[52] is not included herein because many of the physicians involved had substantial outpatient duties (C. Taylor, personal communication, July 2012). Varying burnout measures have complicated a previous systematic review of burnout in oncologists.[53] Two studies that directly compared inpatient and outpatient physicians but that were excluded from our statistical analysis because of their modified versions of the MBI,[54, 55] showed higher burnout scores in outpatient physicians. Two other studies that provided direct inpatient versus outpatient comparisons but that used alternative burnout measures[56, 57] showed a greater frequency of burnout in inpatient physicians, but of these, 1 study[56] involved only 3 inpatient physicians.
Several limitations of our study should be considered. Although we endeavored to obtain information from authors (with some success) about specific local practice patterns and eliminated many studies because of incomplete data or mixed practice patterns (eg, general practitioners who take frequent hospital calls, hospital physicians with extensive outpatient duties in a clinic attached to their hospital), it remains likely that many physicians identified as outpatient provided some inpatient care (attending a few weeks per year on a teaching service, for example) and that some physicians identified as inpatient have minimal outpatient duties.
More importantly, the dataset analyzed is heterogeneous. Studies of the incidence of burnout are naturally observational and therefore not randomized. Inclusion of international studies is necessary to answer the research question (because published data on US hospitalists are sparse) but naturally introduces differences in practice settings, local factors, and other factors for which we cannot possibly account fully.
Our meta‐analysis therefore addressed a broad question about burnout among inpatient and outpatient physicians in various diverse settings. Applying it to any 1 population (including US hospitalists) is, by necessity, imprecise.
Post hoc analysis should be viewed with caution. For example, the finding of a statistical difference between US inpatient and outpatient physicians with regard to personal accomplishment score is compelling from the standpoint of hypothesis generation. However, it is worth bearing in mind that this analysis contained only 2 studies, both by the same primary author, and compared 855 outpatient physicians to only 149 hospitalists. This difference was no longer significant when 2 outpatient studies were added through meta‐regression.
Finally, the specific focus of this study on practice location precluded comparison with emergency physicians and anesthesiologists, 2 specialist types that have been the subject of particularly robust burnout literature. As the literature on hospitalist burnout becomes more extensive, comparative studies with these groups and with intensivists might prove instructive.
In summary, analysis of 24 studies comprising data on 5318 outpatient physicians and 1301 inpatient physicians provides no support for the commonly held belief that hospital‐based physicians are particularly prone to burnout. Outpatient physicians reported higher emotional exhaustion. Further studies of the incidence and severity of burnout according to practice location are indicated. We propose that in future studies, to avoid the difficulties with statistical analysis summarized herein, investigators ask about and explicitly report practice location (inpatient vs outpatient vs both) and report mean MBI subset data and standard deviations. Such information about US hospitalists would allow comparison with a robust (if heterogeneous) international literature on burnout.
Acknowledgments
The authors gratefully acknowledge all of the study authors who contributed clarification and guidance for this project, particularly the following authors who provided unpublished data for further analysis: Olaf Aasland, MD; Szilvia dm, PhD; Annalisa Bargellini, PhD; Cinzia Bressi, MD, PhD; Darrell Campbell Jr, MD; Ennio Cocco, MD; Russell Deighton, PhD; Senem Demirci Alanyali, MD; Biagio Di Iorio, MD, PhD; David Dunwoodie, MBBS; Sharon Einav, MD; Madeleine Estryn‐Behar, PhD; Bernardo Gandini, MD; Keiki Hinami, MD; Antonio Lasalvia, MD, PhD; Joseph Lee, MD; Guido Maccacaro, MD; Swati Marner, EdD; Chris McManus, MD, PhD; Carmelle Peisah, MBBS, MD; Katarina Putnik, MSc; Alfredo Rodrguez‐Muoz, PhD; Yahya Shehabi, MD; Evelyn Sosa Oberlin, MD; Jean Karl Soler, MD, MSc; Knut Srgaard, PhD; Cath Taylor; Viva Thorsen, MPH; Mascha Twellaar, MD; Edgar Voltmer, MD; Colin West, MD, PhD; and Deborah Whippen. The authors also thank the following colleagues for their help with translation: Dusanka Anastasijevic (Norwegian); Joyce Cheung‐Flynn, PhD (simplified Chinese); Ales Hlubocky, MD (Czech); Lena Jungheim, RN (Swedish); Erez Kessler (Hebrew); Kanae Mukai, MD (Japanese); Eliane Purchase (French); Aaron Shmookler, MD (Russian); Jan Stepanek, MD (German); Fernando Tondato, MD (Portuguese); Laszlo Vaszar, MD (Hungarian); and Joseph Verheidje, PhD (Dutch). Finally, the authors thank Cynthia Heltne and Diana Rogers for their expert and tireless library assistance, Bonnie Schimek for her help with figures, and Cindy Laureano and Elizabeth Jones for their help with author contact.
- . Just because you can, doesn't mean that you should: a call for the rational application of hospitalist comanagement. J Hosp Med. 2008;3(5):398–402.
- . Hospitalists. Hospitalist. 1998;1(4):5–6.
- , . The occupational hazards of emergency physicians. Am J Emerg Med. 2000;18(3):300–311.
- , , , et al. Physician burnout in pediatric critical care medicine. Crit Care Med. 1995;23(8):1425–1429.
- , . The hospitalist: new boon for internal medicine or retreat from primary care? Ann Intern Med. 1999;130(4 pt 2): 382–387.
- , , , et al. Enquete sur les horaires et la charge de travail des medecins dans un establissement de l'Assitance Publique‐Hopitaux de Paris. Arch Mal Prof. 1996;57:438–444.
- , , , , . Burn‐out of urologists in the county of Schleswig‐Holstein, Germany: a comparison of hospital and private practice urologists. J Urol. 2001;165(4): 1158–1161.
- , , , et al. Satisfaction and worklife of academic hospitalist and non‐hospitalist attendings on general medical inpatient rotations. J Gen Internal Med. 2006;21(S4):128.
- , , , , , ; SGIM Career Satisfaction Group. What effect does increasing inpatient time have on outpatient‐oriented internist satisfaction? J Gen Intern Med. 2003;18(9):725–729.
- , , . Burnout and career‐choice regret among family practice physicians in early practice. Fam Pract Res J. 1994;14(3):213–222.
- , , , , , . Job stress and satisfaction among palliative physicians. Palliat Med. 1996; 10(3):185–194.
- . Stress and burnout in junior doctors. S Afr Med J. 1994; 84(6):352–354.
- , . Work stress, satisfaction and burnout in New Zealand radiologists: comparison of public hospital and private practice in New Zealand. J Med Imaging Radiat Oncol. 2009;53(2):194–199.
- , , . Measurement of hypothetical burnout in cystic fibrosis caregivers. Acta Paediatr Scand. 1981; 70(6):935–939.
- , . Personality characteristics and proneness to burnout: a study among internists. Stress Med. 1987;3(4):307–315.
- , , . Thriving and surviving in a new medical career: the case of hospitalist physicians. J Health Soc Behav. 2002;43(1):72–91.
- , , , , . Prevalence of burnout among Swiss cancer clinicians, paediatricians and general practitioners: who are most at risk? Support Care Cancer. 2009;17(1): 75–81.
- , , , . Preparing for “diastole”: advanced training opportunities for academic hospitalists. J Hosp Med. 2006;1(6):368–377.
- , , , , , . Mental health, “burnout” and job satisfaction among hospital and community‐based mental health staff. Br J Psychiatry. 1996;169(3):334–337.
- , , , . Role of a pediatric department chair: factors leading to satisfaction and burnout. J Pediatr. 2007;151(4):425–430.
- . Staff burn‐out. J Soc Iss. 1974;30(1):159–165.
- . Burned‐out. Hum Behav. 1976;5(9):16–22.
- . Underpaid women, stressed out men, satisfied emergency physicians. Ann Emerg Med. 2008;51(6):729–731.
- , , , . U.S. physician satisfaction: a systematic review. J Hosp Med. 2009;4(9):560–568.
- , , , . Professional burnout among head and neck surgeons: results of a survey. Head Neck. 1993;15(6):557–560.
- , . The measurement of experienced burnout. J Occup Behav. 1981;2(2):99–113.
- , , , . The Copenhagen Burnout Inventory: a new tool for the assessment of burnout. Work Stress. 2005;19(3):192–207.
- , . Handleiding van de Utrechtse Burnout Schaal (UBOS). Lisse, the Netherlands: Swets Test Services; 2000.
- . Alberta Physician Burnout [master's thesis]. Alberta, Canada: The University of Lethbridge; 2003.
- , . Arbeitsbezogenes Verhaltensund Erlebensmuster AVEM. Frankfurt, Germany: Swets Test Services; 2003.
- , , , . Internal construct validity of the Shirom‐Melamed Burnout Questionnaire (SMBQ). BMC Public Health. 2012;12:1.
- , , . Validation of a single‐item measure of burnout against the Maslach Burnout Inventory among physicians. Stress Health. 2004;20(2):75–79.
- , , , , . Characteristics and work experiences of hospitalists in the United States. Arch Intern Med. 2001;161(6):851–858.
- , . The feasibility of creating a checklist for the assessment of the methodological quality both of randomised and non‐randomised studies of health care interventions. J Epidemiol Community Health. 1998;52(6):377–384.
- , , , . Including nonrandomized studies. In: Higgins JPT, Green S, eds. Cochrane Handbook for Systematic Reviews of Interventions. Version 5.0.1. The Cochrane Collaboration; 2008. Available at: www.cochrane‐handbook. org. Accessed July 24, 2013.
- , . Statistical Methods in Epidemiology. New York, NY: Oxford University Press; 1989.
- , . Quantifying heterogeneity in a meta‐analysis. Stat Med. 2002;21(11):1539–1558.
- , , , . Measuring inconsistency in meta‐analyses. BMJ. 2003;327(7414):557–560.
- , , . Can we individualize the “number needed to treat”? An empirical study of summary effect measures in meta‐analyses. Int J Epidemiol. 2002;31(1):72–76.
- , . Applications of estimating treatment effects in metaanalyses with missing data. Technical Report No. 2000‐25, 2000. Available at: http://statistics.stanford.edu/_ckirby/techreports/GEN/2000/2000‐25.pdf. Accessed July 22, 2013.
- , , . Publication and related bias in meta‐analysis: power of statistical tests and prevalence in the literature. J Clin Epidemiol. 2000;53(11):1119–1129.
- , . Operating characteristics of a rank correlation test for publication bias. Biometrics. 1994;50(4):1088–1101.
- , , , et al. The PRISMA statement for reporting systematic reviews and meta‐analyses of studies that evaluate healthcare interventions: explanation and elaboration. BMJ. 2009; 339:b2700.
- , , , , , . Job satisfaction and burnout in general practitioners [in Spanish]. Aten Primaria. 2003;31(4):227–233.
- , , . Burnout syndrome among health staff [in Spanish]. Rev Med Inst Mex Seguro Soc. 2006;44(3):221–226.
- , , , , , . Differences in psychological effects in hospital doctors with and without post‐traumatic stress disorder. Br J Psychiatry. 2008;193(2):165–166.
- , , , , . Crossing boundaries: family physicians' struggles to protect their private lives. Can Fam Physician. 2009;55(3):286–287.e5.
- , , , , , , et al. Emergency physicians accumulate more stress factors than other physicians: results from the French SESMAT study. Emerg Med J. 2011 May;28(5):397–410. Epub 2010 Dec 1.
- , , . Stress, burnout, and strategies for reducing them: what's the situation among Canadian family physicians? Can Fam Physician. 2008;54(2):234–235.
- , , , , . Worklife and satisfaction of hospitalists: toward flourishing careers. J Gen Intern Med. 2012;27(1):28–36.
- , , , , , , et al; MEMO (Minimizing Error, Maximizing Outcome) Investigators. Working conditions in primary care: physician reactions and care quality. Ann Intern Med. 2009 Jul 7;151(1):28–36.
- , , , , . Mental health of hospital consultants: the effects of stress and satisfaction at work. Lancet. 1996 Mar 16;347(9003):724–8.
- , , , . Burnout, psychiatric morbidity, and work‐related sources of stress in paediatric oncology staff: a review of the literature. Psycho‐Oncology. 2009 Oct;18(10):1019–28.
- , , , , . Health complaints and job stress in Norwegian physicians: the use of an overlapping questionnaire design. Soc Sci Med. 1997;45(11):1615–1629.
- , , , et al. Influence of perceived organisational factors on job burnout: survey of community mental health staff. Br J Psychiatry. 2009;195(6):537–544.
- . Frecuencia de los sintomas del syndrome de burnout en profesionales medicos. Rev Med Rosario. 2007;73:12–20.
- , , . Work‐related behaviour and experience patterns of physicians compared to other professions. Swiss Med Wkly. 2007;137(31‐32):448–453.
- , . Psychiatric morbidity and burnout in the medical profession: an Italian study of general practitioners and hospital physicians. Psychother Psychosom. 2000;69(6):329–334.
- , , . Duties of a doctor: UK doctors and good medical practice. Qual Health Care. 2000;9(1):14–22.
- , . The job related burnout questionnaire: a multinational pilot study. Aust Fam Physician. 2002;31(11):1055–1056.
- , , , , . Burn out among French general practitioners [in French]. Presse Med. 2004;33(22): 1569–1574.
- , , . Are burnout levels increasing? The experience of Israeli primary care physicians. Isr Med Assoc J. 2004; 6(8):451–455.
- , , , . Psychosocial and professional characteristics of burnout in Swiss primary care practitioners: a cross‐sectional survey. Swiss Med Wkly. 2005;135(7‐8):101–108.
- , , . Mental health in family doctors: effects of satisfaction and stress at work [in Spanish]. Rev Clin Esp. 2006;206(2):77–83.
- , , , , . The professional wearing down or syndrome of welfare labor stress (“burnout”) among health professionals in the city of Cordoba [in Spanish]. Rev Fac Cien Med Univ Nac Cordoba. 2006;63(1):18–25.
- , , . Predictors of burnout and job satisfaction among Turkish physicians. QJM. 2006;99(3):161–169.
- , , . Factors affecting burnout and compassion fatigue in psychotherapists treating torture survivors: is the therapist's attitude to working through trauma relevant? J Trauma Stress. 2007;20(1):63–75.
- , . Psychological morbidity and burnout in palliative care doctors in Western Australia. Intern Med J. 2007;37(10): 693–698.
- , , , ; OSCAR Group. Sources of stress and burnout in acute psychiatric care: inpatient vs. community staff. Soc Psychiatry Psychiatr Epidemiol. 2007;42(10):794–802.
- , , . Physician burnout in Hungary: a potential role for work‐family conflict. J Health Psychol. 2008;13:847–856.
- , , , . Burn‐out in the dialysis unit. J Nephrol. 2008;21(suppl 13):S158–S162.
- . Career orientation and burnout in French general practitioners. Psychol Rep. 2008;103(3):875–881.
- , , . How healthy are Dutch general practitioners? Self‐reported (mental) health among Dutch general practitioners. Eur J Gen Pract. 2008;14(1):4–9.
- , , , et al. Insomnia and sleep quality among primary care physicians with low and high burnout levels. J Psychosom Res. 2008;64(4):435–442.
- , , , , , . Distress and burnout among genetic service providers. Genet Med. 2009;11(7):527–535.
- , , , et al. Burnout among psychiatrists in Milan: a multicenter survey. Psychiatr Serv. 2009;60(7):985–988.
- , , , et al. Association of an educational program in mindful communication with burnout, empathy, and attitudes among primary care physicians. JAMA. 2009;302(12): 1284–1293.
- , , , , , . Burnout in Belgrade orthopaedic surgeons and general practitioners, a preliminary report. Acta Chir Iugosl. 2009; 56(2):53–59.
- , , , . Secrets to psychological success: why older doctors might have lower psychological distress and burnout than younger doctors. Aging Ment Health. 2009;13(2):300–307.
- , , , et al. Career fit and burnout among academic faculty. Arch Intern Med. 2009;169(10):990–995.
- , , , , . Does burnout among doctors affect their involvement in patients' mental health problems? A study of videotaped consultations. BMC Fam Pract. 2009;10:60.
- , , , , , . Evaluation of burnout syndrome in oncology employees. Med Oncol. 2010;27(3):968–974.
- , , , , . Workrelated behavior and experience patterns and predictors of mental health in German physicians in medical practice. Fam Med. 2010; 42(6):433–439.
- , , , et al. Emotional exhaustion, life stress, and perceived control among medicine ward attending physicians: a randomized trial of 2‐ versus 4‐week ward rotations [abstract]. J Hosp Med. 2011; 6(4 suppl 2):S43–S44.
- , , , , , . The effort of being male: a survey on gender and burnout [in Italian]. Med Lav. 2011;102(3):286–296.
- , . Word related characteristics, work‐home and home‐work interference and burnout among primary healthcare physicians: a gender perspective in a Serbian context. BMC Public Health. 2011;11:716.
- , , , et al. Burnout and satisfaction with work‐life balance among US physicians relative to the general US population. Arch Intern Med. 2012;172(18):1377–1385.
- , , . Burnout syndrome in general hospital doctors. Eur J Psychiat. 1996;10:207–213.
- , , , , , . Relation between immune variables and burnout in a sample of physicians. Occup Environ Med. 2000;57(7):453–457.
- , , . Epuisement professionnel et consummation de psychotropes chez les medecins hospitaliers. Alcoologie et Addictologie. 2005;27(4):303–308.
- , , , , . Working conditions and Work‐Family Conflict in German hospital physicians: psychosocial and organisational predictors and consequences. BMC Public Health. 2008;8:353.
- . The Role of Empathy and Witnessed Aggression in Stress Reactions Among Staff Working in a Psychiatric Hospital [dissertation]. New Brunswick, NJ: Rutgers University; 2008.
- , , , , , . Burnout syndrome among Australian intensivists: a survey. Crit Care Resusc. 2008;10(4):312–315.
- , , , , , . Doctors' stress responses and poor communication performance in simulated bad‐news consultations. Acad Med. 2009;84(11):1595–1602.
- , . Role conflict, role ambiguity, and burnout in nurses and physicians at a university hospital in Turkey. Nurs Health Sci. 2009;11(4):410–416.
- . How much is geriatric caregivers burnout caring‐specific? Questions from a questionnaire survey. Clin Pract Epidemiol Ment Health. 2010;6:66–71.
- , , , , ; comite de pilotage de l'enquete SESMAT. Burnout in French doctors: a comparative study among anaesthesiologists and other specialists in French hospitals (SESMAT study) [in French]. Ann Fr Anesth Reanim. 2011;30(11):782–794.
- , , , , , . Career satisfaction and burnout in academic hospital medicine. Arch Intern Med. 2011;171(8):782–785.
- , , . High rates of burnout among maternal health staff at a referral hospital in Malawi: a cross‐sectional study. BMC Nurs. 2011;10:9.
- , , , et al. Suffering among careers working in critical care can be reduced by an intensive communication strategy on end‐of‐life practices. Intensive Care Med. 2012;38:55–61.
- , , . The prevalence of common mental disorders among hospital physicians and their association with self‐reported work ability: a cross‐sectional study. BMC Health Serv Res. 2012;12:292–298.
- , , , . Effort‐reward‐ratio and burnout risk among female teachers and hospital‐employed female physicians: a comparison between professions [in German]. Arbeitsmed Sozialmed Umweltmed. 2012;47:396–406.
Hospital medicine is a rapidly growing field of US clinical practice.[1] Almost since its advent, concerns have been expressed about the potential for hospitalists to burn out.[2] Hospitalists are not unique in this; similar concerns heralded the arrival of other location‐defined specialties, including emergency medicine[3] and the full‐time intensivist model,[4] a fact that has not gone unnoted in the literature about hospitalists.[5]
The existing international literature on physician burnout provides good reason for this concern. Inpatient‐based physicians tend to work unpredictable schedules, with substantial impact on home life.[6] They tend to be young, and much burnout literature suggests a higher risk among younger, less‐experienced physicians.[7] When surveyed, hospitalists have expressed more concerns about their potential for burnout than their outpatient‐based colleagues.[8]
In fact, data suggesting a correlation between inpatient practice and burnout predate the advent of the US hospitalist movement. Increased hospital time was reported to correlate with higher rates of burnout in internists,[9] family practitioners,[10] palliative physicians,[11] junior doctors,[12] radiologists,[13] and cystic fibrosis caregivers.[14] In 1987, Keinan and Melamed[15] noted, Hospital work by its very nature, as compared to the work of a general practitioner, deals with the more severe and complicated illnesses, coupled with continuous daily contacts with patients and their anxious families. In addition, these physicians may find themselves embroiled in the power struggles and competition so common in their work environment.
There are other features, however, that may protect inpatient physicians from burnout. Hospital practice can facilitate favorable social relations involving colleagues, co‐workers, and patients,[16] a factor that may be protective.[17] A hospitalist schedule also can allow more focused time for continuing medical education, research, and teaching,[18] which have all been associated with reduced risk of burnout in some studies.[17] Studies of psychiatrists[19] and pediatricians[20] have shown a lower rate of burnout among physicians with more inpatient duties. Finally, a practice model involving a seemingly stable cadre of inpatient physicians has existed in Europe for decades,[2] indicating at least a degree of sustainability.
Information suggesting a higher rate of burnout among inpatient physicians could be used to target therapeutic interventions and to adjust schedules, whereas the opposite outcome could refute a pervasive myth. We therefore endeavored to summarize the literature on burnout among inpatient versus outpatient physicians in a systematic fashion, and to include data not only from the US hospitalist experience but also from other countries that have used a similar model for decades. Our primary hypothesis was that inpatient physicians experience more burnout than outpatient physicians.
It is important to distinguish burnout from depression, job dissatisfaction, and occupational stress, all of which have been studied extensively in physicians. Burnout, as introduced by Freudenberger[21] and further characterized by Maslach,[22] is a condition in which emotional exhaustion, depersonalization, and a low sense of personal accomplishment combine to negatively affect work life (as opposed to clinical depression, which affects all aspects of life). Job satisfaction can correlate inversely with burnout, but it is a separate process[23] and the subject of a recent systematic review.[24] The importance of distinguishing burnout from job dissatisfaction is illustrated by a survey of head and neck surgeons, in which 97% of those surveyed indicated satisfaction with their jobs and 34% of the same group answered in the affirmative when asked if they felt burned out.[25]
One obstacle to the meaningful comparison of burnout prevalence across time, geography, and specialty is the myriad ways in which burnout is measured and reported. The oldest and most commonly used instrument to measure burnout is the Maslach Burnout Inventory (MBI), which contains 22 items assessing 3 components of burnout (emotional exhaustion, depersonalization, and low personal accomplishment).[26] Other measures include the Copenhagen Burnout Inventory[27] (19 items with the components personal burnout, work‐related burnout, and client‐related burnout), Utrecht Burnout Inventory[28] (20‐item modification of the MBI), Boudreau Burnout Questionnaire[29] (30 items), Arbeitsbezogenes Verhaltens und Erlebensmuster[30] (66‐item questionnaire assessing professional commitment, resistance to stress, and emotional well‐being), Shirom‐Melamed Burnout Measure[31] (22 items with subscales for physical fatigue, cognitive weariness, tension, and listlessness), and a validated single‐item questionnaire.[32]
METHODS
Electronic searches of MEDLINE, EMBASE, PsycINFO, SCOPUS, and PubMed were undertaken for articles published from January 1, 1974 (the year in which burnout was first described by Freudenberger[21]) to 2012 (last accessed, September 12, 2012) using the Medical Subject Headings (MeSH) terms stress, psychological; burnout, professional; adaptation, psychological; and the keyword burnout. The same sources were searched to create another set for the MeSH terms hospitalists, physician's practice patterns, physicians/px, professional practice location, and the keyword hospitalist#. Where exact subject headings did not exist in databases, comparable subject headings or keywords were used. The 2 sets were then combined using the operator and. Abstracts from the Society of Hospital Medicine annual conferences were hand‐searched, as were reference lists from identified articles. To ensure that pertinent international literature was captured, there was no language restriction in the search.
A 2‐stage screening process was used. The titles and abstracts of all articles identified in the search were independently reviewed by 2 investigators (D.L.R. and K.J.C.) who had no knowledge of each other's results. An article was obtained when either reviewer deemed it worthy of full‐text review.
All full‐text articles were independently reviewed by the same 2 investigators. The inclusion criterion was the measurement of burnout in physicians who are stated to or can be reasonably assumed to spend the substantial majority of their clinical practice exclusively in either the inpatient or the outpatient setting. Studies of emergency department physicians or specialists who invariably spend substantial amounts of time in both settings (eg, surgeons, anesthesiologists) were excluded. Studies limited to trainees or nonphysicians were also excluded. For both stages of review, agreement between the 2 investigators was assessed by calculating the statistic. Disagreements about inclusion were adjudicated by a third investigator (A.I.B.).
Because our goal was to establish and compare the rate of burnout among US hospitalists and other inpatient physicians around the world, we included studies of hospitalists according to the definition in use at the time of the individual study, noting that the formal definition of a hospitalist has changed over the years.[33] Because practice patterns for physicians described as primary care physicians, family doctors, hospital doctors, and others differ substantially from country to country, we otherwise included only the studies where the practice location was stated explicitly or where the authors confirmed that their study participants either are known or can be reasonably assumed to spend more than 75% of their time caring for hospital inpatients, or are known or can be reasonably assumed to spend the vast majority of their time caring for outpatients.
Data were abstracted using a standardized form and included the measure of burnout used in the study, results, practice location of study subjects, and total number of study subjects. When data were not clear (eg, burnout measured but not reported by the authors, practice location of study subjects not clear), authors were contacted by email, or when no current email address could be located or no response was received, by telephone or letter. In instances where burnout was measured repeatedly over time or before and after a specific intervention, only the baseline measurement was recorded. Because all studies were expected to be nonrandomized, methodological quality was assessed using a version of the tool of Downs and Black,[34] adapted where necessary by omitting questions not applicable to the specific study type (eg randomization for survey studies)[35] and giving a maximum of 1 point for the inclusion of a power calculation.
Two a priori analyses were planned: (1) a statistical comparison of articles directly comparing burnout among inpatient and outpatient physicians, and (2) a statistical comparison of articles measuring burnout among inpatient physicians with articles measuring burnout among outpatient physicians by the most frequently reported measuremean subset scores for emotional exhaustion, depersonalization, and personal accomplishment on the MBI.
The primary outcome measures were the differences between mean subset scores for emotional exhaustion, depersonalization, and personal accomplishment on the MBI. All differences are expressed as (outpatient meaninpatient mean). The variance of each outcome was calculated with standard formulas.[36] To calculate the overall estimate, each study was weighted by the reciprocal of its variance. Studies with fewer than 10 subjects were excluded from statistical analysis but retained in the systematic review.
For studies that reported data for both inpatient and outpatient physicians (double‐armed studies), Cochran Q test and the I2 value were used to assess heterogeneity.[37, 38] Substantial heterogeneity was expected because these individual studies were conducted for different populations in different settings with different study designs, and this expectation was confirmed statistically. Therefore, we used a random effects model to estimate the overall effect, providing a conservative approach that accounted for heterogeneity among studies.[39]
To assess the durability of our findings, we performed separate multivariate meta‐regression analyses by including single‐armed studies only and including both single‐armed and double‐armed studies. For these meta‐regressions, means were again weighted by the reciprocal of their variances, and the arms of 2‐armed studies were considered separately. This approach allowed us to generate an estimate of the differences between MBI subset scores from studies that did not include such an estimate when analyzed separately.[40]
We examined the potential for publication bias in double‐armed studies by constructing a funnel plot, in which mean scores were plotted against their standard errors.[41] The trim‐and‐fill method was used to determine whether adjustment for publication bias was necessary. In addition, Begg's rank correlation test[42] was completed to test for statistically significant publication bias.
Stata 10.0 statistical software (StataCorp, College Station, TX) was used for data analyses. A P value of 0.05 or less was deemed statistically significant. The Preferred Reporting Items for Systematic Reviews and Meta‐analysis checklist was used for the design and execution of the systematic review and meta‐analysis.[43]
Subgroup analyses based on location were undertaken a posteriori. All data (double‐armed meta‐analysis, meta‐regression of single‐armed studies, and meta‐regression of single‐ and double‐armed studies) were analyzed by location (United States vs other; United States vs Europe vs other).
RESULTS
The search results are outlined in Figure 1. In total, 1704 articles met the criteria for full‐text review. A review of pertinent reference lists and author contacts led to the addition of 149 articles. Twenty‐nine references could not be located by any means, despite repeated attempts. Therefore, 1824 articles were subjected to full‐text review by the 2 investigators.
Initially, 57 articles were found that met criteria for inclusion. Of these, 2 articles reported data in formats that could not be interpreted.[44, 45] When efforts to clarify the data with the authors were unsuccessful, these studies were excluded. A study specifically designed to assess the response of physicians to a recent series of terrorist attacks[46] was excluded a posteriori because of lack of generalizability. Of the other 54 studies, 15 reported burnout data on both outpatient physicians and inpatient physicians, 22 reported data on outpatient physicians only, and 17 reported data on inpatient physicians only. Table 1 summarizes the results of the 37 studies involving outpatient physicians; Table 2 summarizes the 32 studies involving inpatient physicians.
| Lead Author, Publication Year | Study Population and Location | Instrument | No. of Participants | EE Score (SD)a | DP Score (SD) | PA Score (SD) | Other Results |
|---|---|---|---|---|---|---|---|
| |||||||
| Schweitzer, 1994[12] | Young physicians of various specialties in South Africa | Single‐item survey | 7 | 6 (83%) endorsed burnout | |||
| Aasland, 1997 [54]b | General practitioners in Norway | Modified MBI (22 items; scale, 15) | 298 | 2.65 (0.80) | 1.90 (0.59) | 3.45 (0.40) | |
| Grassi, 2000 [58] | General practitioners in Italy | MBI | 182 | 18.49 (11.49) | 6.11 (5.86) | 38.52 (7.60) | |
| McManus, 2000 [59]b | General practitioners in United Kingdom | Modified MBI (9 items; scale, 06) | 800 | 8.34 (4.39) | 3.18 (3.40) | 14.16 (2.95) | |
| Yaman, 2002 [60] | General practitioners in 8 European nations | MBI | 98 | 25.1 (8.50) | 7.3 (4.92) | 34.5 (7.67) | |
| Cathbras, 2004 [61] | General practitioners in France | MBI | 306 | 21.85 (12.4) | 9.13 (6.7) | 38.7 (7.1) | |
| Goehring, 2005 [63] | General practitioners, general internists, pediatricians in Switzerland | MBI | 1755 | 17.9 (9.8) | 6.5 (4.7) | 39.6 (6.5) | |
| Esteva, 2006 [64] | General practitioners, pediatricians in Spain | MBI | 261 | 27.4 (11.8) | 10.07 (6.4) | 35.9 (7.06) | |
| Gandini, 2006 [65]b | Physicians of various specialties in Argentina | MBI | 67 | 31.0 (13.8) | 10.2 (6.6) | 38.4 (6.8) | |
| Ozyurt, 2006 [66] | General practitioners in Turkey | Modified MBI (22 items; scale, 04) | 55 | 15.23 (5.80) | 4.47 (3.31) | 23.38 (4.29) | |
| Deighton, 2007 [67]b | Psychiatrists in several German‐speaking nations | MBI | 19 | 30.68 (9.92) | 13.42 (4.23) | 37.16 (3.39) | |
| Dunwoodie, 2007 [68]b | Palliative care physicians in Australia | MBI | 21 | 14.95 (9.14) | 3.95 (3.40) | 38.90 (2.88) | |
| Srgaard, 2007 [69]b | Psychiatrists in 5 European nations | MBI | 22 | 19.41 (8.08) | 6.68 (4.93) | 39.00 (4.40) | |
| Sosa Oberlin, 2007 [56]b | Physicians of various specialties in Argentina | Author‐designed instrument | 33 | 26 (78.8%) had 4 burnout symptoms, 6.15 symptoms per physician | |||
| Voltmer, 2007 [57]b | Physicians of various specialties in Germany | AVEM | 46 | 11 (23.9%) exhibited burnout (type B) pattern | |||
| dm, 2008 [70]b | Physicians of various specialties in Hungary | MBI | 163 | 17.45 (11.12) | 4.86 (4.91) | 36.56 (7.03) | |
| Di Iorio, 2008 [71]b | Dialysis physicians in Italy | Author‐designed instrument | 54 | Work: 2.6 (1.5), Material: 3.1 (2.1), Climate: 3.0 (1.1), Objectives: 3.4 (1.6), Quality: 2.2 (1.5), Justification: 3.2 (2.0) | |||
| Lee, 2008 [49]b | Family physicians in Canada | MBI | 123 | 26.26 (9.53) | 10.20 (5.22) | 38.43 (7.34) | |
| Truchot, 2008 [72] | General practitioners in France | MBI | 259 | 25.4 (11.7) | 7.5 (5.5) | 36.5 (7.1) | |
| Twellaar, 2008 [73]b | General practitioners in the Netherlands | Utrecht Burnout Inventory | 349 | 2.06 (1.11) | 1.71 (1.05) | 5.08 (0.77) | |
| Arigoni, 2009 [17] | General practitioners, pediatricians in Switzerland | MBI | 258 | 22.8 (12.0) | 6.9 (6.1) | 39.0 (7.2) | |
| Bernhardt, 2009 [75] | Clinical geneticists in United States | MBI | 72 | 25.8 (10.01)c | 10.9 (4.16)c | 34.8 (5.43)c | |
| Bressi, 2009 [76]b | Psychiatrists in Italy | MBI | 53 | 23.15 (11.99) | 7.02 (6.29) | 36.41 (7.54) | |
| Krasner, 2009 [77] | General practitioners in United States | MBI | 60 | 26.8 (10.9)d | 8.4 (5.1)d | 40.2 (5.3)d | |
| Lasalvia, 2009 [55]b | Psychiatrists in Italy | Modified MBI (16 items; scale, 06) | 38 | 2.37 (1.27) | 1.51 (1.15) | 4.46 (0.87) | |
| Peisah, 2009 [79]b | Physicians of various specialties in Australia | MBI | 28 | 13.92 (9.24) | 3.66 (3.95) | 39.34 (8.55) | |
| Shanafelt, 2009 [80]b | Physicians of various specialties in United States | MBI | 408 | 20.5 (11.10) | 4.3 (4.74) | 40.8 (6.26) | |
| Zantinge, 2009 [81] | General practitioners in the Netherlands | Utrecht Burnout Inventory | 126 | 1.58 (0.79) | 1.32 (0.72) | 4.27 (0.77) | |
| Voltmer, 2010 [83]b | Psychiatrists in Germany | AVEM | 526 | 114 (21.7%) exhibited burnout (type B) pattern | |||
| Maccacaro, 2011 [85]b | Physicians of various specialties in Italy | MBI | 42 | 14.31 (11.98) | 3.62 (4.95) | 38.24 (6.22) | |
| Lucas, 2011 [84]b | Outpatient physicians periodically staffing an academic hospital teaching service in United States | MBI (EE only) | 30 | 24.37 (14.95) | |||
| Shanafelt, 2012 [87]b | General internists in United States | MBI | 447 | 25.4 (14.0) | 7.5 (6.3) | 41.4 (6.0) | |
| Kushnir, 2004 [62] | General practitioners and pediatricians in Israel | MBI (DP only) and SMBM | 309 | 9.15 (3.95) | SMBM mean (SD), 2.73 per item (0.86) | ||
| Vela‐Bueno, 2008 [74]b | General practitioners in Spain | MBI | 240 | 26.91 (11.61) | 9.20 (6.35) | 35.92 (7.92) | |
| Lesic, 2009 [78]b | General practitioners in Serbia | MBI | 38 | 24.71 (10.81) | 7.47 (5.51) | 37.21 (7.44) | |
| Demirci, 2010 [82]b | Medical specialists related to oncology practice in Hungary | MBI | 26 | 23.31 (11.2) | 6.46 (5.7) | 37.7 (8.14) | |
| Putnik, 2011 [86]b | General practitioners in Hungary | MBI | 370 | 22.22 (11.75) | 3.66 (4.40) | 41.40 (6.85) | |
| Lead Author, Publication Year | Study Population and Location | Instrument | No. of Participants | EE Score (SD)a | DP Score (SD) | PA Score (SD) | Other Results |
|---|---|---|---|---|---|---|---|
| |||||||
| Varga, 1996 [88] | Hospital doctors in Spain | MBI | 179 | 21.61b | 7.33b | 35.28b | |
| Aasland, 1997 [54] | Hospital doctors in Norway | Modified MBI (22 items; scale, 15) | 582 | 2.39 (0.80) | 1.81 (0.65) | 3.51 (0.46) | |
| Bargellini, 2000 [89] | Hospital doctors in Italy | MBI | 51 | 17.45 (9.87) | 7.06 (5.54) | 35.33 (7.90) | |
| Grassi, 2000 [58] | Hospital doctors in Italy | MBI | 146 | 16.17 (9.64) | 5.32 (4.76) | 38.71 (7.28) | |
| Hoff, 2001 [33] | Hospitalists in United States | Single‐item surveyc | 393 | 12.9% burned out (>4/5), 24.9% at risk for burnout (34/5), 62.2% at no current risk (mean, 2.86 on 15 scale) | |||
| Trichard, 2005 [90] | Hospital doctors in France | MBI | 199 | 16 (10.7) | 6.6 (5.7) | 38.5 (6.5) | |
| Gandini, 2006 [65]d | Hospital doctors in Argentina | MBI | 290 | 25.0 (12.7) | 7.9 (6.2) | 40.1 (7.0) | |
| Dunwoodie, 2007 [68]d | Palliative care doctors in Australia | MBI | 14 | 18.29 (14.24) | 5.29 (5.89) | 38.86 (3.42) | |
| Srgaard, 2007 [69]d | Psychiatrists in 5 European nations | MBI | 18 | 18.56 (9.32) | 5.50 (3.79) | 39.08 (5.39) | |
| Sosa Oberlin, 2007 [56]d | Hospital doctors in Argentina | Author‐designed instrument | 3 | 3 (100%) had 4 burnout symptoms, 8.67 symptoms per physician | |||
| Voltmer, 2007 [57]d | Hospital doctors in Germany | AVEM | 271 | 77 (28.4%) exhibited burnout (type B) pattern | |||
| dm, 2008 [70]b | Physicians of various specialties in Hungary | MBI | 194 | 19.23 (10.79) | 4.88 (4.61) | 35.26 (8.42) | |
| Di Iorio, 2008 [71]d | Dialysis physicians in Italy | Author‐designed instrument | 62 | Work, mean (SD), 3.1 (1.4); Material, mean (SD), 3.3 (1.5); Climate, mean (SD), 2.9 (1.1); Objectives, mean (SD), 2.5 (1.5); Quality, mean (SD), 3.0 (1.1); Justification, mean (SD), 3.1 (2.1) | |||
| Fuss, 2008 [91]d | Hospital doctors in Germany | Copenhagen Burnout Inventory | 292 | Mean Copenhagen Burnout Inventory, mean (SD), 46.90 (18.45) | |||
| Marner, 2008 [92]d | Psychiatrists and 1 generalist in United States | MBI | 9 | 20.67 (9.75) | 7.78 (5.14) | 35.33 (6.44) | |
| Shehabi, 2008 [93]d | Intensivists in Australia | Modified MBI (6 items; scale, 15) | 86 | 2.85 (0.93) | 2.64 (0.85) | 2.58 (0.83) | |
| Bressi, 2009 [76]d | Psychiatrists in Italy | MBI | 28 | 17.89 (14.46) | 5.32 (7.01) | 34.57 (11.27) | |
| Brown, 2009 [94] | Hospital doctors in Australia | MBI | 12 | 22.25 (8.59) | 6.33 (2.71) | 39.83 (7.31) | |
| Lasalvia, 2009 [55]d | Psychiatrists in Italy | Modified MBI (16 items; scale, 06) | 21 | 1.95 (1.04) | 1.35 (0.85) | 4.46 (1.04) | |
| Peisah, 2009 [79]d | Hospital doctors in Australia | MBI | 62 | 20.09 (9.91) | 6.34 (4.90) | 35.06 (7.33) | |
| Shanafelt, 2009 [80]d | Hospitalists and intensivists in United States | MBI | 19 | 25.2 (11.59) | 4.4 (3.79) | 38.5 (8.04) | |
| Tunc, 2009 [95] | Hospital doctors in Turkey | Modified MBI (22 items; scale, 04) | 62 | 1.18 (0.78) | 0.81 (0.73) | 3.10 (0.59)e | |
| Cocco, 2010 [96]d | Hospital geriatricians in Italy | MBI | 38 | 16.21 (11.56) | 4.53 (4.63) | 39.13 (7.09) | |
| Doppia, 2011 [97]d | Hospital doctors in France | Copenhagen Burnout Inventory | 1,684 | Mean work‐related burnout score, 2.72 (0.75) | |||
| Glasheen, 2011 [98] | Hospitalists in United States | Single‐item survey | 265 | Mean, 2.08 on 15 scale 62 (23.4%) burned out | |||
| Lucas, 2011 [84]d | Academic hospitalists in United States | MBI (EE only) | 26 | 19.54 (12.85) | |||
| Thorsen, 2011 [99] | Hospital doctors in Malawi | MBI | 2 | 25.5 (4.95) | 8.5 (6.36) | 25.0 (5.66) | |
| Hinami, 2012 [50]d | Hospital doctors in United States | Single‐item survey | 793 | Mean, 2.24 on 15 scale 261 (27.2%) burned out | |||
| Quenot, 2012 [100]d | Intensivists in France | MBI | 4 | 33.25 (4.57) | 13.50 (5.45) | 35.25 (4.86) | |
| Ruitenburg, 2012 [101] | Hospital doctors in the Netherlands | MBI (EE and DP only) | 214 | 13.3 (8.0) | 4.5 (4.1) | ||
| Seibt, 2012 [102]d | Hospital doctors in Germany | Modified MBI (16 items; scale, 06, reported per item rather than totals) | 2,154 | 2.2 (1.4) | 1.4 (1.2) | 5.1 (0.9) | |
| Shanafelt, 2012 [87]d | Hospitalists in United States | MBI | 130 | 24.7 (12.5) | 9.1 (6.9) | 39.0 (7.6) | |
Table 3 summarizes the results of the 15 studies that reported burnout data for both inpatient and outpatient physicians, allowing direct comparisons to be made. Nine studies reported MBI subset totals with standard deviations, 2 used different modifications of the MBI, 2 used different author‐derived measures, 1 used only the emotional exhaustion subscale of the MBI, and 1 used the Arbeitsbezogenes Verhaltens und Erlebensmuster. Therefore, statistical comparison was attempted only for the 9 studies reporting comparable MBI data, comprising burnout data on 1390 outpatient physicians and 899 inpatient physicians.
| Lead Author, Publication Year | Location | Instrument | Inpatient‐Based Physicians | Outpatient‐Based Physicians | ||
|---|---|---|---|---|---|---|
| No. | Results, Score (SD)a | No. | Results, Score (SD)a | |||
| ||||||
| Aasland, 1997 [54]b | Norway | Modified MBI (22 items; scale, 15) | 582 | EE, 2.39 (0.80); DP, 1.81 (0.65); PA, 3.51 (0.46) | 298 | EE, 2.65 (0.80); DP, 1.90 (0.59); PA, 3.45 (0.40) |
| Grassi, 2000 [58] | Italy | MBI | 146 | EE, 16.17 (9.64); DP, 5.32 (4.76); PA, 38.71 (7.28) | 182 | EE, 18.49 (11.49); DP, 6.11 (5.86); PA, 38.52 (7.60) |
| Gandini, 2006 [65]b | Argentina | MBI | 290 | EE, 25.0 (12.7);DP, 7.9 (6.2); PA, 40.1 (7.0) | 67 | EE, 31.0 (13.8); DP, 10.2 (6.6); PA, 38.4 (6.8) |
| Dunwoodie, 2007 [68]b | Australia | MBI | 14 | EE, 18.29 (14.24); DP, 5.29 (5.89); PA, 38.86 (3.42) | 21 | EE, 14.95 (9.14); DP, 3.95 (3.40); PA, 38.90 (2.88) |
| Srgaard, 2007 [69]b | 5 European nations | MBI | 18 | EE, 18.56 (9.32); DP, 5.50 (3.79); PA, 39.08 (5.39) | 22 | EE, 19.41 (8.08); DP, 6.68 (4.93); PA, 39.00 (4.40) |
| Sosa Oberlin, 2007 [56]b | Argentina | Author‐designed instrument | 3 | 3 (100%) had 4 burnout symptoms, 8.67 symptoms per physician | 33 | 26 (78.8%) had 4 burnout symptoms, 6.15 symptoms per physician |
| Voltmer, 2007 [57]b | Germany | AVEM | 271 | 77 (28.4%) exhibited burnout (type B) pattern | 46 | 11 (23.9%) exhibited burnout (type B) pattern |
| dm, 2008 [70]b | Hungary | MBI | 194 | EE, 19.23 (10.79); DP, 4.88 (4.61); PA, 35.26 (8.42) | 163 | EE, 17.45 (11.12); DP, 4.86 (4.91); PA, 36.56 (7.03) |
| Di Iorio, 2008 [71]b | Italy | Author‐designed instrument | 62 | Work: 3.1 (1.4); material: 3.3 (1.5); climate: 2.9 (1.1); objectives: 2.5 (1.5); quality: 3.0 (1.1); justification: 3.1 (2.1) | 54 | Work: 2.6 (1.5); material: 3.1 (2.1); climate: 3.0 (1.1); objectives: 3.4 (1.6); quality: 2.2 (1.5); justification: 3.2 (2.0) |
| Bressi, 2009 [76]b | Italy | MBI | 28 | EE, 17.89 (14.46); DP, 5.32 (7.01); PA, 34.57 (11.27) | 53 | EE, 23.15 (11.99); DP, 7.02 (6.29); PA, 36.41 (7.54) |
| Lasalvia, 2009[55]b | Italy | Modified MBI (16 items; scale, 06) | 21 | EE, 1.95 (1.04); DP, 1.35 (0.85); PA, 4.46 (1.04) | 38 | EE, 2.37 (1.27); DP, 1.51 (1.15); PA, 4.46 (0.87) |
| Peisah, 2009 [79]b | Australia | MBI | 62 | EE, 20.09 (9.91); DP, 6.34 (4.90); PA, 35.06 (7.33) | 28 | EE, 13.92 (9.24); DP, 3.66 (3.95); PA, 39.34 (8.55) |
| Shanafelt, 2009 [80]b | United States | MBI | 19 | EE, 25.2 (11.59); DP, 4.4 (3.79); PA, 38.5 (8.04) | 408 | EE, 20.5 (11.10); DP, 4.3 (4.74); PA, 40.8 (6.26) |
| Lucas, 2011 [84]b | United States | MBI (EE only) | 26 | EE, 19.54 (12.85) | 30 | EE, 24.37 (14.95) |
| Shanafelt, 2012 [87]b | United States | MBI | 130 | EE, 24.7 (12.5); DP, 9.1 (6.9); PA, 39.0 (7.6) | 447 | EE, 25.4 (14.0); DP, 7.5 (6.3); PA, 41.4 (6.0) |
Figure 2 shows that no significant difference existed between the groups regarding emotional exhaustion (mean difference, 0.11 points on a 54‐point scale; 95% confidence interval [CI], 2.40 to 2.61; P=0.94). In addition, there was no significant difference between the groups regarding depersonalization (Figure 3; mean difference, 0.00 points on a 30‐point scale; 95% CI, 1.03 to 1.02; P=0.99) and personal accomplishment (Figure 4; mean difference, 0.93 points on a 48‐point scale; 95% CI, 0.23 to 2.09; P=0.11).
We used meta‐regression to allow the incorporation of single‐armed MBI studies. Whether single‐armed studies were analyzed separately (15 outpatient studies comprising 3927 physicians, 4 inpatient studies comprising 300 physicians) or analyzed with double‐armed studies (24 outpatient arms comprising 5318 physicians, 13 inpatient arms comprising 1301 physicians), the lack of a significant difference between the groups persisted for the depersonalization and personal accomplishment scales (Figure 5). Emotional exhaustion was significantly higher in outpatient physicians when single‐armed studies were considered separately (mean difference, 6.36 points; 95% CI, 2.24 to 10.48; P=0.002), and this difference persisted when all studies were combined (mean difference, 3.00 points; 95% CI, 0.05 to 5.94, P=0.046).
Subgroup analysis by geographic location showed US outpatient physicians had a significantly higher personal accomplishment score than US inpatient physicians (mean difference, 2.38 points; 95% CI, 1.22 to 3.55; P<0.001) in double‐armed studies. This difference did not persist when single‐armed studies were included through meta‐regression (mean difference, 0.55 points, 95% CI, 4.30 to 5.40, P=0.83).
Table 4 demonstrates that methodological quality was generally good from the standpoint of the reporting and bias subsections of the Downs and Black tool. External validity was scored lower for many studies due to the use of convenience samples and lack of information about physicians who declined to participate.
| Lead Author, Publication Year | Reporting | External Validity | Internal Validity: Bias | Internal Validity: Confounding | Power |
|---|---|---|---|---|---|
| Schweitzer, 1994 [12] | 5 of 6 points | 1 of 2 points | 3 of 4 points | 0 of 1 point | 0 of 1 point |
| Varga, 1996 [88] | 5 of 6 points | 1 of 2 points | 3 of 4 points | 1 of 1 point | 0 of 1 point |
| Aasland, 1997 [54] | 3 of 6 points | 2 of 2 points | 3 of 4 points | 1 of 1 point | 0 of 1 point |
| Bargellini, 2000 [89] | 5 of 6 points | 0 of 2 points | 4 of 4 points | 1 of 1 point | 0 of 1 point |
| Grassi, 2000 [58] | 6 of 6 points | 0 of 2 points | 3 of 4 points | 0 of 1 point | 0 of 1 point |
| McManus, 2000 [59] | 5 of 6 points | 2 of 2 points | 4 of 4 points | 1 of 1 point | 0 of 1 point |
| Hoff, 2001 [33] | 6 of 6 points | 2 of 2 points | 2 of 4 points | 1 of 1 point | 0 of 1 point |
| Yaman, 2002 [60] | 5 of 6 points | 0 of 2 points | 4 of 4 points | 0 of 1 point | 0 of 1 point |
| Cathbras, 2004 [61] | 6 of 6 points | 0 of 2 points | 4 of 4 points | 0 of 1 point | 0 of 1 point |
| Kushnir, 2004 [62] | 5 of 6 points | 0 of 2 points | 3 of 4 points | 0 of 1 point | 0 of 1 point |
| Goehring, 2005 [63] | 6 of 6 points | 1 of 2 points | 3 of 4 points | 1 of 1 point | 0 of 1 point |
| Trichard, 2005 [90] | 3 of 6 points | 1 of 2 points | 3 of 4 points | 0 of 1 point | 0 of 1 point |
| Esteva, 2006 [64] | 6 of 6 points | 2 of 2 points | 4 of 4 points | 1 of 1 point | 0 of 1 point |
| Gandini, 2006 [65] | 6 of 6 points | 1 of 2 points | 3 of 4 points | 1 of 1 point | 0 of 1 point |
| Ozyurt, 2006 [66] | 6 of 6 points | 2 of 2 points | 4 of 4 points | 1 of 1 point | 0 of 1 point |
| Deighton, 2007 [67] | 5 of 6 points | 0 of 2 points | 4 of 4 points | 0 of 1 point | 0 of 1 point |
| Dunwoodie, 2007 [68] | 5 of 6 points | 2 of 2 points | 4 of 4 points | 0 of 1 point | 0 of 1 point |
| Srgaard, 2007 [69] | 6 of 6 points | 0 of 2 points | 3 of 4 points | 1 of 1 point | 1 of 1 point |
| Sosa Oberlin, 2007 [56] | 4 of 6 points | 0 of 2 points | 3 of 4 points | 0 of 1 point | 0 of 1 point |
| Voltmer, 2007 [57] | 4 of 6 points | 0 of 2 points | 4 of 4 points | 0 of 1 point | 0 of 1 point |
| dm, 2008 [70] | 5 of 6 points | 2 of 2 points | 3 of 4 points | 1 of 1 point | 0 of 1 point |
| Di Iorio, 2008 [71] | 6 of 6 points | 0 of 2 points | 2 of 4 points | 0 of 1 point | 0 of 1 point |
| Fuss, 2008 [91] | 6 of 6 points | 0 of 2 points | 3 of 4 points | 0 of 1 point | 0 of 1 point |
| Lee, 2008 [49] | 4 of 6 points | 2 of 2 points | 4 of 4 points | 0 of 1 point | 1 of 1 point |
| Marner, 2008 [92] | 6 of 6 points | 0 of 2 points | 4 of 4 points | 0 of 1 point | 0 of 1 point |
| Shehabi, 2008 [93] | 3 of 6 points | 1 of 2 points | 3 of 4 points | 0 of 1 point | 0 of 1 point |
| Truchot, 2008 [72] | 5 of 6 points | 1 of 2 points | 3 of 4 points | 0 of 1 point | 0 of 1 point |
| Twellaar, 2008 [73] | 6 of 6 points | 2 of 2 points | 3 of 4 points | 0 of 1 point | 0 of 1 point |
| Vela‐Bueno, 2008 [74] | 5 of 6 points | 2 of 2 points | 4 of 4 points | 1 of 1 point | 0 of 1 point |
| Arigoni, 2009 [17] | 6 of 6 points | 2 of 2 points | 4 of 4 points | 1 of 1 point | 0 of 1 point |
| Bernhardt, 2009 [75] | 6 of 6 points | 2 of 2 points | 4 of 4 points | 1 of 1 point | 0 of 1 point |
| Bressi, 2009 [76] | 6 of 6 points | 0 of 2 points | 3 of 4 points | 1 of 1 point | 0 of 1 point |
| Brown, 2009 [94] | 6 of 6 points | 0 of 2 points | 4 of 4 points | 0 of 1 point | 0 of 1 point |
| Krasner, 2009 [77] | 9 of 11 points | 0 of 3 points | 6 of 7 points | 1 of 2 points | 1 of 1 point |
| Lasalvia, 2009 [55] | 6 of 6 points | 2 of 2 points | 4 of 4 points | 1 of 1 point | 0 of 1 point |
| Lesic, 2009 [78] | 5 of 6 points | 0 of 2 points | 4 of 4 points | 0 of 1 point | 0 of 1 point |
| Peisah, 2009 [79] | 6 of 6 points | 2 of 2 points | 3 of 4 points | 1 of 1 point | 0 of 1 point |
| Shanafelt, 2009 [80] | 6 of 6 points | 2 of 2 points | 4 of 4 points | 1 of 1 point | 0 of 1 point |
| Tunc, 2009 [95] | 6 of 6 points | 2 of 2 points | 4 of 4 points | 1 of 1 point | 0 of 1 point |
| Zantinge, 2009 [81] | 5 of 6 points | 0 of 2 points | 3 of 4 points | 1 of 1 point | 0 of 1 point |
| Cocco, 2010 [96] | 4 of 6 points | 0 of 2 points | 4 of 4 points | 0 of 1 point | 0 of 1 point |
| Demirci, 2010 [82] | 6 of 6 points | 0 of 2 points | 4 of 4 points | 0 of 1 point | 0 of 1 point |
| Voltmer, 2010 [83] | 6 of 6 points | 2 of 2 points | 4 of 4 points | 1 of 1 point | 0 of 1 point |
| Doppia, 2011 [97] | 5 of 6 points | 2 of 2 points | 4 of 4 points | 1 of 1 point | 0 of 1 point |
| Glasheen, 2011 [98] | 5 of 6 points | 0 of 2 points | 4 of 4 points | 1 of 1 point | 0 of 1 point |
| Lucas, 2011 [84] | 10 of 11 points | 2 of 3 points | 7 of 7 points | 5 of 6 points | 1 of 1 point |
| Maccacaro, 2011 [85] | 5 of 6 points | 0 of 2 points | 4 of 4 points | 1 of 1 point | 0 of 1 point |
| Putnik, 2011 [86] | 6 of 6 points | 1 of 2 points | 4 of 4 points | 0 of 1 point | 0 of 1 point |
| Thorsen, 2011 [99] | 6 of 6 points | 0 of 2 points | 4 of 4 points | 0 of 1 point | 0 of 1 point |
| Hinami, 2012 [50] | 6 of 6 points | 2 of 2 points | 4 of 4 points | 1 of 1 point | 1 of 1 point |
| Quenot, 2012 [100] | 8 of 11 points | 1 of 3 points | 6 of 7 points | 1 of 2 points | 0 of 1 point |
| Ruitenburg, 2012 [101] | 6 of 6 points | 2 of 2 points | 4 of 4 points | 0 of 1 point | 0 of 1 point |
| Seibt, 2012 [102] | 6 of 6 points | 0 of 2 points | 4 of 4 points | 1 of 1 point | 0 of 1 point |
| Shanafelt, 2012 [87] | 6 of 6 points | 2 of 2 points | 4 of 4 points | 1 of 1 point | 0 of 1 point |
Funnel plots were used to evaluate for publication bias in the meta‐analysis of the 8 double‐armed studies (Figure 6). We found no significant evidence of bias, which was supported by Begg's test P values of 0.90 for emotional exhaustion, >0.99 for depersonalization, and 0.54 for personal accomplishment. A trim‐and‐fill analysis determined that no adjustment was necessary.
DISCUSSION
There appears to be no support for the long‐held belief that inpatient physicians are particularly prone to burnout. Among studies for which practice location was stated explicitly or could be obtained from the authors, and who used the MBI, no differences were found among inpatient and outpatient physicians with regard to depersonalization or personal accomplishment. This finding persisted whether double‐armed studies were compared directly, single‐armed studies were incorporated into this analysis, or single‐armed studies were analyzed separately. Outpatient physicians had a higher degree of emotional exhaustion when all studies were considered.
There are several reasons why outpatient physicians may be more prone to emotional exhaustion than their inpatient colleagues. Although it is by no means true that all inpatient physicians work in shifts, the increased availability of shift work may allow some inpatient physicians to better balance their professional and personal lives, a factor of work with which some outpatient physicians have struggled.[47] Inpatient practice may also afford more opportunity for teamwork, a factor that has been shown to correlate with reduced burnout.[48] When surveyed about burnout, outpatient physicians have cited patient volumes, paperwork, medicolegal concerns, and lack of community support as factors.[49] Inpatient physicians are not immune to these forces, but they arguably experience them to different degrees.
The absence of a higher rate of depersonalization among inpatient physicians is particularly reassuring in light of concerns expressed with the advent of US hospital medicinethat some hospitalists would be prone to viewing patients as an impediment to the efficient running of the hospital,[2] the very definition of depersonalization.
Although the difference in the whole sample was not statistically significant, the consistent tendency toward a greater sense of personal accomplishment among outpatient physicians is also noteworthy, particularly because post hoc subgroup analysis of US physicians did show statistical significance in both 2‐armed studies. Without detailed age data for the physicians in each study, we could not separate the possible impact of age on personal accomplishment; hospital medicine is a newer specialty staffed by generally younger physicians, and hospitalists may not have had time to develop a sense of accomplishment. When surveyed about job satisfaction, hospitalists have also reported the feeling that they were treated as glorified residents,[50] a factor that, if shared by other inpatient physicians, must surely affect their sense of personal accomplishment. The lack of longitudinal care for patients and the substantial provision of end‐of‐life care also may diminish the sense of personal accomplishment among inpatient physicians.
Another important finding from this systematic review is the marked heterogeneity of the instruments used to measure physician burnout. Many of the identified studies could not be subjected to meta‐analysis because of their use of differing burnout measures. Drawing more substantial conclusions about burnout and practice location is limited by the fact that, although the majority of studies used the full MBI, the largest study of European hospital doctors used the Copenhagen Burnout Inventory, and the studies thus far of US hospitalists have used single‐item surveys or portions of the MBI. Not reflected in this review is the fact that a large study of US burnout and job satisfaction[51] did not formally address practice location (M. Linzer, personal communication, August 2012). Similarly, a large study of British hospital doctors[52] is not included herein because many of the physicians involved had substantial outpatient duties (C. Taylor, personal communication, July 2012). Varying burnout measures have complicated a previous systematic review of burnout in oncologists.[53] Two studies that directly compared inpatient and outpatient physicians but that were excluded from our statistical analysis because of their modified versions of the MBI,[54, 55] showed higher burnout scores in outpatient physicians. Two other studies that provided direct inpatient versus outpatient comparisons but that used alternative burnout measures[56, 57] showed a greater frequency of burnout in inpatient physicians, but of these, 1 study[56] involved only 3 inpatient physicians.
Several limitations of our study should be considered. Although we endeavored to obtain information from authors (with some success) about specific local practice patterns and eliminated many studies because of incomplete data or mixed practice patterns (eg, general practitioners who take frequent hospital calls, hospital physicians with extensive outpatient duties in a clinic attached to their hospital), it remains likely that many physicians identified as outpatient provided some inpatient care (attending a few weeks per year on a teaching service, for example) and that some physicians identified as inpatient have minimal outpatient duties.
More importantly, the dataset analyzed is heterogeneous. Studies of the incidence of burnout are naturally observational and therefore not randomized. Inclusion of international studies is necessary to answer the research question (because published data on US hospitalists are sparse) but naturally introduces differences in practice settings, local factors, and other factors for which we cannot possibly account fully.
Our meta‐analysis therefore addressed a broad question about burnout among inpatient and outpatient physicians in various diverse settings. Applying it to any 1 population (including US hospitalists) is, by necessity, imprecise.
Post hoc analysis should be viewed with caution. For example, the finding of a statistical difference between US inpatient and outpatient physicians with regard to personal accomplishment score is compelling from the standpoint of hypothesis generation. However, it is worth bearing in mind that this analysis contained only 2 studies, both by the same primary author, and compared 855 outpatient physicians to only 149 hospitalists. This difference was no longer significant when 2 outpatient studies were added through meta‐regression.
Finally, the specific focus of this study on practice location precluded comparison with emergency physicians and anesthesiologists, 2 specialist types that have been the subject of particularly robust burnout literature. As the literature on hospitalist burnout becomes more extensive, comparative studies with these groups and with intensivists might prove instructive.
In summary, analysis of 24 studies comprising data on 5318 outpatient physicians and 1301 inpatient physicians provides no support for the commonly held belief that hospital‐based physicians are particularly prone to burnout. Outpatient physicians reported higher emotional exhaustion. Further studies of the incidence and severity of burnout according to practice location are indicated. We propose that in future studies, to avoid the difficulties with statistical analysis summarized herein, investigators ask about and explicitly report practice location (inpatient vs outpatient vs both) and report mean MBI subset data and standard deviations. Such information about US hospitalists would allow comparison with a robust (if heterogeneous) international literature on burnout.
Acknowledgments
The authors gratefully acknowledge all of the study authors who contributed clarification and guidance for this project, particularly the following authors who provided unpublished data for further analysis: Olaf Aasland, MD; Szilvia dm, PhD; Annalisa Bargellini, PhD; Cinzia Bressi, MD, PhD; Darrell Campbell Jr, MD; Ennio Cocco, MD; Russell Deighton, PhD; Senem Demirci Alanyali, MD; Biagio Di Iorio, MD, PhD; David Dunwoodie, MBBS; Sharon Einav, MD; Madeleine Estryn‐Behar, PhD; Bernardo Gandini, MD; Keiki Hinami, MD; Antonio Lasalvia, MD, PhD; Joseph Lee, MD; Guido Maccacaro, MD; Swati Marner, EdD; Chris McManus, MD, PhD; Carmelle Peisah, MBBS, MD; Katarina Putnik, MSc; Alfredo Rodrguez‐Muoz, PhD; Yahya Shehabi, MD; Evelyn Sosa Oberlin, MD; Jean Karl Soler, MD, MSc; Knut Srgaard, PhD; Cath Taylor; Viva Thorsen, MPH; Mascha Twellaar, MD; Edgar Voltmer, MD; Colin West, MD, PhD; and Deborah Whippen. The authors also thank the following colleagues for their help with translation: Dusanka Anastasijevic (Norwegian); Joyce Cheung‐Flynn, PhD (simplified Chinese); Ales Hlubocky, MD (Czech); Lena Jungheim, RN (Swedish); Erez Kessler (Hebrew); Kanae Mukai, MD (Japanese); Eliane Purchase (French); Aaron Shmookler, MD (Russian); Jan Stepanek, MD (German); Fernando Tondato, MD (Portuguese); Laszlo Vaszar, MD (Hungarian); and Joseph Verheidje, PhD (Dutch). Finally, the authors thank Cynthia Heltne and Diana Rogers for their expert and tireless library assistance, Bonnie Schimek for her help with figures, and Cindy Laureano and Elizabeth Jones for their help with author contact.
- . Just because you can, doesn't mean that you should: a call for the rational application of hospitalist comanagement. J Hosp Med. 2008;3(5):398–402.
- . Hospitalists. Hospitalist. 1998;1(4):5–6.
- , . The occupational hazards of emergency physicians. Am J Emerg Med. 2000;18(3):300–311.
- , , , et al. Physician burnout in pediatric critical care medicine. Crit Care Med. 1995;23(8):1425–1429.
- , . The hospitalist: new boon for internal medicine or retreat from primary care? Ann Intern Med. 1999;130(4 pt 2): 382–387.
- , , , et al. Enquete sur les horaires et la charge de travail des medecins dans un establissement de l'Assitance Publique‐Hopitaux de Paris. Arch Mal Prof. 1996;57:438–444.
- , , , , . Burn‐out of urologists in the county of Schleswig‐Holstein, Germany: a comparison of hospital and private practice urologists. J Urol. 2001;165(4): 1158–1161.
- , , , et al. Satisfaction and worklife of academic hospitalist and non‐hospitalist attendings on general medical inpatient rotations. J Gen Internal Med. 2006;21(S4):128.
- , , , , , ; SGIM Career Satisfaction Group. What effect does increasing inpatient time have on outpatient‐oriented internist satisfaction? J Gen Intern Med. 2003;18(9):725–729.
- , , . Burnout and career‐choice regret among family practice physicians in early practice. Fam Pract Res J. 1994;14(3):213–222.
- , , , , , . Job stress and satisfaction among palliative physicians. Palliat Med. 1996; 10(3):185–194.
- . Stress and burnout in junior doctors. S Afr Med J. 1994; 84(6):352–354.
- , . Work stress, satisfaction and burnout in New Zealand radiologists: comparison of public hospital and private practice in New Zealand. J Med Imaging Radiat Oncol. 2009;53(2):194–199.
- , , . Measurement of hypothetical burnout in cystic fibrosis caregivers. Acta Paediatr Scand. 1981; 70(6):935–939.
- , . Personality characteristics and proneness to burnout: a study among internists. Stress Med. 1987;3(4):307–315.
- , , . Thriving and surviving in a new medical career: the case of hospitalist physicians. J Health Soc Behav. 2002;43(1):72–91.
- , , , , . Prevalence of burnout among Swiss cancer clinicians, paediatricians and general practitioners: who are most at risk? Support Care Cancer. 2009;17(1): 75–81.
- , , , . Preparing for “diastole”: advanced training opportunities for academic hospitalists. J Hosp Med. 2006;1(6):368–377.
- , , , , , . Mental health, “burnout” and job satisfaction among hospital and community‐based mental health staff. Br J Psychiatry. 1996;169(3):334–337.
- , , , . Role of a pediatric department chair: factors leading to satisfaction and burnout. J Pediatr. 2007;151(4):425–430.
- . Staff burn‐out. J Soc Iss. 1974;30(1):159–165.
- . Burned‐out. Hum Behav. 1976;5(9):16–22.
- . Underpaid women, stressed out men, satisfied emergency physicians. Ann Emerg Med. 2008;51(6):729–731.
- , , , . U.S. physician satisfaction: a systematic review. J Hosp Med. 2009;4(9):560–568.
- , , , . Professional burnout among head and neck surgeons: results of a survey. Head Neck. 1993;15(6):557–560.
- , . The measurement of experienced burnout. J Occup Behav. 1981;2(2):99–113.
- , , , . The Copenhagen Burnout Inventory: a new tool for the assessment of burnout. Work Stress. 2005;19(3):192–207.
- , . Handleiding van de Utrechtse Burnout Schaal (UBOS). Lisse, the Netherlands: Swets Test Services; 2000.
- . Alberta Physician Burnout [master's thesis]. Alberta, Canada: The University of Lethbridge; 2003.
- , . Arbeitsbezogenes Verhaltensund Erlebensmuster AVEM. Frankfurt, Germany: Swets Test Services; 2003.
- , , , . Internal construct validity of the Shirom‐Melamed Burnout Questionnaire (SMBQ). BMC Public Health. 2012;12:1.
- , , . Validation of a single‐item measure of burnout against the Maslach Burnout Inventory among physicians. Stress Health. 2004;20(2):75–79.
- , , , , . Characteristics and work experiences of hospitalists in the United States. Arch Intern Med. 2001;161(6):851–858.
- , . The feasibility of creating a checklist for the assessment of the methodological quality both of randomised and non‐randomised studies of health care interventions. J Epidemiol Community Health. 1998;52(6):377–384.
- , , , . Including nonrandomized studies. In: Higgins JPT, Green S, eds. Cochrane Handbook for Systematic Reviews of Interventions. Version 5.0.1. The Cochrane Collaboration; 2008. Available at: www.cochrane‐handbook. org. Accessed July 24, 2013.
- , . Statistical Methods in Epidemiology. New York, NY: Oxford University Press; 1989.
- , . Quantifying heterogeneity in a meta‐analysis. Stat Med. 2002;21(11):1539–1558.
- , , , . Measuring inconsistency in meta‐analyses. BMJ. 2003;327(7414):557–560.
- , , . Can we individualize the “number needed to treat”? An empirical study of summary effect measures in meta‐analyses. Int J Epidemiol. 2002;31(1):72–76.
- , . Applications of estimating treatment effects in metaanalyses with missing data. Technical Report No. 2000‐25, 2000. Available at: http://statistics.stanford.edu/_ckirby/techreports/GEN/2000/2000‐25.pdf. Accessed July 22, 2013.
- , , . Publication and related bias in meta‐analysis: power of statistical tests and prevalence in the literature. J Clin Epidemiol. 2000;53(11):1119–1129.
- , . Operating characteristics of a rank correlation test for publication bias. Biometrics. 1994;50(4):1088–1101.
- , , , et al. The PRISMA statement for reporting systematic reviews and meta‐analyses of studies that evaluate healthcare interventions: explanation and elaboration. BMJ. 2009; 339:b2700.
- , , , , , . Job satisfaction and burnout in general practitioners [in Spanish]. Aten Primaria. 2003;31(4):227–233.
- , , . Burnout syndrome among health staff [in Spanish]. Rev Med Inst Mex Seguro Soc. 2006;44(3):221–226.
- , , , , , . Differences in psychological effects in hospital doctors with and without post‐traumatic stress disorder. Br J Psychiatry. 2008;193(2):165–166.
- , , , , . Crossing boundaries: family physicians' struggles to protect their private lives. Can Fam Physician. 2009;55(3):286–287.e5.
- , , , , , , et al. Emergency physicians accumulate more stress factors than other physicians: results from the French SESMAT study. Emerg Med J. 2011 May;28(5):397–410. Epub 2010 Dec 1.
- , , . Stress, burnout, and strategies for reducing them: what's the situation among Canadian family physicians? Can Fam Physician. 2008;54(2):234–235.
- , , , , . Worklife and satisfaction of hospitalists: toward flourishing careers. J Gen Intern Med. 2012;27(1):28–36.
- , , , , , , et al; MEMO (Minimizing Error, Maximizing Outcome) Investigators. Working conditions in primary care: physician reactions and care quality. Ann Intern Med. 2009 Jul 7;151(1):28–36.
- , , , , . Mental health of hospital consultants: the effects of stress and satisfaction at work. Lancet. 1996 Mar 16;347(9003):724–8.
- , , , . Burnout, psychiatric morbidity, and work‐related sources of stress in paediatric oncology staff: a review of the literature. Psycho‐Oncology. 2009 Oct;18(10):1019–28.
- , , , , . Health complaints and job stress in Norwegian physicians: the use of an overlapping questionnaire design. Soc Sci Med. 1997;45(11):1615–1629.
- , , , et al. Influence of perceived organisational factors on job burnout: survey of community mental health staff. Br J Psychiatry. 2009;195(6):537–544.
- . Frecuencia de los sintomas del syndrome de burnout en profesionales medicos. Rev Med Rosario. 2007;73:12–20.
- , , . Work‐related behaviour and experience patterns of physicians compared to other professions. Swiss Med Wkly. 2007;137(31‐32):448–453.
- , . Psychiatric morbidity and burnout in the medical profession: an Italian study of general practitioners and hospital physicians. Psychother Psychosom. 2000;69(6):329–334.
- , , . Duties of a doctor: UK doctors and good medical practice. Qual Health Care. 2000;9(1):14–22.
- , . The job related burnout questionnaire: a multinational pilot study. Aust Fam Physician. 2002;31(11):1055–1056.
- , , , , . Burn out among French general practitioners [in French]. Presse Med. 2004;33(22): 1569–1574.
- , , . Are burnout levels increasing? The experience of Israeli primary care physicians. Isr Med Assoc J. 2004; 6(8):451–455.
- , , , . Psychosocial and professional characteristics of burnout in Swiss primary care practitioners: a cross‐sectional survey. Swiss Med Wkly. 2005;135(7‐8):101–108.
- , , . Mental health in family doctors: effects of satisfaction and stress at work [in Spanish]. Rev Clin Esp. 2006;206(2):77–83.
- , , , , . The professional wearing down or syndrome of welfare labor stress (“burnout”) among health professionals in the city of Cordoba [in Spanish]. Rev Fac Cien Med Univ Nac Cordoba. 2006;63(1):18–25.
- , , . Predictors of burnout and job satisfaction among Turkish physicians. QJM. 2006;99(3):161–169.
- , , . Factors affecting burnout and compassion fatigue in psychotherapists treating torture survivors: is the therapist's attitude to working through trauma relevant? J Trauma Stress. 2007;20(1):63–75.
- , . Psychological morbidity and burnout in palliative care doctors in Western Australia. Intern Med J. 2007;37(10): 693–698.
- , , , ; OSCAR Group. Sources of stress and burnout in acute psychiatric care: inpatient vs. community staff. Soc Psychiatry Psychiatr Epidemiol. 2007;42(10):794–802.
- , , . Physician burnout in Hungary: a potential role for work‐family conflict. J Health Psychol. 2008;13:847–856.
- , , , . Burn‐out in the dialysis unit. J Nephrol. 2008;21(suppl 13):S158–S162.
- . Career orientation and burnout in French general practitioners. Psychol Rep. 2008;103(3):875–881.
- , , . How healthy are Dutch general practitioners? Self‐reported (mental) health among Dutch general practitioners. Eur J Gen Pract. 2008;14(1):4–9.
- , , , et al. Insomnia and sleep quality among primary care physicians with low and high burnout levels. J Psychosom Res. 2008;64(4):435–442.
- , , , , , . Distress and burnout among genetic service providers. Genet Med. 2009;11(7):527–535.
- , , , et al. Burnout among psychiatrists in Milan: a multicenter survey. Psychiatr Serv. 2009;60(7):985–988.
- , , , et al. Association of an educational program in mindful communication with burnout, empathy, and attitudes among primary care physicians. JAMA. 2009;302(12): 1284–1293.
- , , , , , . Burnout in Belgrade orthopaedic surgeons and general practitioners, a preliminary report. Acta Chir Iugosl. 2009; 56(2):53–59.
- , , , . Secrets to psychological success: why older doctors might have lower psychological distress and burnout than younger doctors. Aging Ment Health. 2009;13(2):300–307.
- , , , et al. Career fit and burnout among academic faculty. Arch Intern Med. 2009;169(10):990–995.
- , , , , . Does burnout among doctors affect their involvement in patients' mental health problems? A study of videotaped consultations. BMC Fam Pract. 2009;10:60.
- , , , , , . Evaluation of burnout syndrome in oncology employees. Med Oncol. 2010;27(3):968–974.
- , , , , . Workrelated behavior and experience patterns and predictors of mental health in German physicians in medical practice. Fam Med. 2010; 42(6):433–439.
- , , , et al. Emotional exhaustion, life stress, and perceived control among medicine ward attending physicians: a randomized trial of 2‐ versus 4‐week ward rotations [abstract]. J Hosp Med. 2011; 6(4 suppl 2):S43–S44.
- , , , , , . The effort of being male: a survey on gender and burnout [in Italian]. Med Lav. 2011;102(3):286–296.
- , . Word related characteristics, work‐home and home‐work interference and burnout among primary healthcare physicians: a gender perspective in a Serbian context. BMC Public Health. 2011;11:716.
- , , , et al. Burnout and satisfaction with work‐life balance among US physicians relative to the general US population. Arch Intern Med. 2012;172(18):1377–1385.
- , , . Burnout syndrome in general hospital doctors. Eur J Psychiat. 1996;10:207–213.
- , , , , , . Relation between immune variables and burnout in a sample of physicians. Occup Environ Med. 2000;57(7):453–457.
- , , . Epuisement professionnel et consummation de psychotropes chez les medecins hospitaliers. Alcoologie et Addictologie. 2005;27(4):303–308.
- , , , , . Working conditions and Work‐Family Conflict in German hospital physicians: psychosocial and organisational predictors and consequences. BMC Public Health. 2008;8:353.
- . The Role of Empathy and Witnessed Aggression in Stress Reactions Among Staff Working in a Psychiatric Hospital [dissertation]. New Brunswick, NJ: Rutgers University; 2008.
- , , , , , . Burnout syndrome among Australian intensivists: a survey. Crit Care Resusc. 2008;10(4):312–315.
- , , , , , . Doctors' stress responses and poor communication performance in simulated bad‐news consultations. Acad Med. 2009;84(11):1595–1602.
- , . Role conflict, role ambiguity, and burnout in nurses and physicians at a university hospital in Turkey. Nurs Health Sci. 2009;11(4):410–416.
- . How much is geriatric caregivers burnout caring‐specific? Questions from a questionnaire survey. Clin Pract Epidemiol Ment Health. 2010;6:66–71.
- , , , , ; comite de pilotage de l'enquete SESMAT. Burnout in French doctors: a comparative study among anaesthesiologists and other specialists in French hospitals (SESMAT study) [in French]. Ann Fr Anesth Reanim. 2011;30(11):782–794.
- , , , , , . Career satisfaction and burnout in academic hospital medicine. Arch Intern Med. 2011;171(8):782–785.
- , , . High rates of burnout among maternal health staff at a referral hospital in Malawi: a cross‐sectional study. BMC Nurs. 2011;10:9.
- , , , et al. Suffering among careers working in critical care can be reduced by an intensive communication strategy on end‐of‐life practices. Intensive Care Med. 2012;38:55–61.
- , , . The prevalence of common mental disorders among hospital physicians and their association with self‐reported work ability: a cross‐sectional study. BMC Health Serv Res. 2012;12:292–298.
- , , , . Effort‐reward‐ratio and burnout risk among female teachers and hospital‐employed female physicians: a comparison between professions [in German]. Arbeitsmed Sozialmed Umweltmed. 2012;47:396–406.