User login
Trends in Risk-Adjusted 28-Day Mortality Rates for Patients Hospitalized with COVID-19 in England
The early phase of the coronavirus disease 2019 (COVID-19) pandemic in the United Kingdom (UK) was characterized by uncertainty as clinicians grappled to understand and manage an unfamiliar disease that affected very high numbers of patients amid radically evolving working environments, with little evidence to support their efforts. Early reports indicated high mortality in patients hospitalized with COVID-19.
As the disease became better understood, treatment evolved and the mortality appears to have decreased. For example, two recent papers, a national study of critical care patients in the UK and a single-site study from New York, have demonstrated a significant reduction in adjusted mortality between the pre- and post-peak periods.1,2 However, the UK study was restricted to patients receiving critical care, potentially introducing bias due to varying critical care admission thresholds over time, while the single-site US study may not be generalizable. Moreover, both studies measured only in-hospital mortality. It remains uncertain therefore whether overall mortality has decreased on a broad scale after accounting for changes in patient characteristics.
The aim of this study was to use a national dataset to assess the
METHODS
We conducted a retrospective, secondary analysis of English National Health Services (NHS) hospitals’ admissions of patients at least 18 years of age between March 1 and July 31, 2020. Data were obtained from the Hospital Episode Statistics (HES) admitted patient care dataset.3 This is an administrative dataset that contains data on diagnoses and procedures as well as organizational characteristics and patient demographics for all NHS activity in England. We included all patients with an International Statistical Classification of Diseases, Tenth Revision (ICD-10) diagnosis of U07.1 (COVID-19, virus identified) and U07.2 (COVID-19, virus not identified).
The primary outcome of death within 28 days of admission was obtained by linking to the Civil Registrations (Deaths) - Secondary Care Cut - Information dataset, which includes the date, place, and cause of death from the Office for National Statistics4 and which was complete through September 31, 2020. The time horizon of 28 days from admission was chosen to approximate the Public Health England definition of a death from COVID-19 as being within 28 days of testing positive.5 We restricted our analysis to emergency admissions of persons age >18 years. If a patient had multiple emergency admissions, we restricted our analysis to the first admission to ensure comparability across hospitalizations and to best represent outcomes from the earliest onset of COVID-19.
We estimated a modified Poisson regression6 to predict death at 28 days, with month of admission, region, source of admission, age, deprivation, gender, ethnic group, and the 29 comorbidities in the Elixhauser comorbidity measure as variables in the regression.7 The derivation of each of these variables from the HES dataset is shown in Appendix Table 1.
Deprivation was measured by the Index of Multiple Deprivation, a methodology used widely within the UK to classify relative deprivation.8 To control for clustering, hospital system (known as Trust) was added as a random effect. Robust errors were estimated using the sandwich package.9 Modified Poisson regression was chosen in preference to the more common logistic regression because the coefficients can be interpreted as relative risks and not odds ratios. The model was fitted using R, version 4.0.3, geepack library.10 We carried out three sensitivity analyses, restricting to laboratory-confirmed COVID-19, length of stay ≥3 days, and primary respiratory disease.
For each month, we obtained a standardized mortality ratio (SMR) by fixing the month to the reference month of March 2020 and repredicting the outcome using the existing model. We calculated the ratio of the sum of observed and expected deaths (obtained from the model) in each month, comparing observed deaths to the number we would have expected had those patients been hospitalized in March. We then multiplied each period’s SMR by the March crude mortality to generate monthly adjusted mortality rates. We calculated Poisson confidence intervals around the SMR and used these to obtain confidence intervals for the adjusted rate. The binomial exact method was used to obtain confidence intervals for the crude rate. Multicollinearity was assessed using both the variance inflation factor (VIF) and the condition number test.7 All analyses used two-sided statistical tests, and we considered a P value < .05 to be statistically significant without adjustment for multiple testing. The study was exempt from UK National Research Ethics Committee approval because it involved secondary analysis of anonymized data.
RESULTS
The dataset included 115,643 emergency admissions from 179 healthcare systems, of which 103,202 were first admissions eligible for inclusion. A total of 592 patients were excluded due to missing demographic data (0.5%), resulting in 102,610 admissions included in the analysis. Peak hospitalizations occurred in late March to mid April, accounting for 44% of the hospitalizations (Table). Median length of stay for patients who died was 7 days (interquartile range, 3-12). The median age and number of Elixhauser comorbidities decreased in July. The proportion of men decreased between May and July. 
The modified Poisson regression had a C statistic of 0.743 (95% CI, 0.740-0.746) (Appendix Table 4). The VIF and condition number test found no evidence of multicollinearity.11
Adjusted mortality decreased each month, from 33.4% in March to 17.4% in July (Figure). The relative risk of death declined progressively to a minimum of 0.52 (95% CI, 0.34-0.80) in July, compared to March.
Admission from another hospital and being female were associated with reduced risk of death. Admission from a skilled nursing facility and being >75 years were associated with increased risk of death. Ten of the 29 Elixhauser comorbidities were associated with increased risk of mortality (cardiac arrhythmia, peripheral vascular disease, other neurologic disorders, renal failure, lymphoma, metastatic cancer, solid tumor without metastasis, coagulopathy, fluid and electrolyte disorders, and anemia). Deprivation and ethnic group were not associated with death among hospitalized patients.
DISCUSSION
Our study of all emergency hospital admissions in England during the first wave of the COVID-19 pandemic demonstrated that, even after adjusting for patient comorbidity and risk factors, the mortality rate decreased by approximately half over the first 5 months. Although the demographics of hospitalized patients changed over that period (with both the median age and the number of comorbidities decreasing), this does not fully explain the decrease in mortality. It is therefore likely that the decrease is due, at least in part, to an improvement in treatment and/or a reduction in hospital strain.
For example, initially the use of corticosteroids was controversial, in part due to previous experience with severe acute respiratory syndrome and Middle East respiratory syndrome (in which a Cochrane review demonstrated no benefit but potential harm). However, this changed as a result of the Randomized Evaluation of Covid-19 Therapy (RECOVERY) trial,12 which showed a significant survival benefit.One of the positive defining characteristics of the COVID-19 pandemic has been the intensive collaborative research effort combined with the rapid dissemination and discussion of new management protocols. The RECOVERY trial randomly assigned >11,000 participants in just 3 months, amounting to approximately 15% of all patients hospitalized with COVID-19 in the UK. Its results were widely publicized via professional networks and rapidly adopted into widespread clinical practice.
Examples of other changes include a higher threshold for mechanical ventilation (and a lower threshold for noninvasive ventilation), increased clinician experience, and, potentially, a reduced viral load arising from increased social distancing and mask wearing. Finally, the hospitals and staff themselves were under enormous physical and mental strain in the early months from multiple factors, including unfamiliar working environments, the large-scale redeployment of inexperienced staff, and very high numbers of patients with an unfamiliar disease. These factors all lessened as the initial peak passed. It is therefore likely that the reduction in adjusted mortality we observed arises from a combination of all these factors, as well as other incremental benefits.
The factors associated with increased mortality risk in our study (increasing age, male gender, certain comorbidities, and frailty [with care home residency acting as a proxy in our study]) are consistent with multiple previous reports. Although not the focus of our analysis, we found no effect of ethnicity or deprivation on mortality. This is consistent with many US studies that demonstrate that the widely reported effect of these factors is likely due to differences in exposure to the disease. Once patients are hospitalized, adjusted mortality risks are similar across ethnic groups and deprivation levels.
The strengths of this study include complete capture of hospitalizations across all hospitals and areas in England. Likewise, linking the hospital data to death data from the Office for National Statistics allows complete capture of outcomes, irrespective of where the patient died. This is a significant strength compared to prior studies, which only included in-hospital mortality. Our results are therefore likely robust and a true observation of the mortality trend.
Limitations include the lack of physiologic and laboratory data; having these would have allowed us to adjust for disease severity on admission and strengthened the risk stratification. Likewise, although the complete national coverage is overall a significant strength, aggregating data from numerous areas that might be at different stages of local outbreaks, have different management strategies, and have differing data quality introduces its own biases.
Furthermore, these results predate the second wave in the UK, so we cannot distinguish whether the reduced mortality is due to improved treatment, a seasonal effect, evolution of the virus itself, or a reduction in the strain on hospitals.
CONCLUSION
This nationwide study indicates that, even after accounting for changing patient characteristics, the mortality of patients hospitalized with COVID-19 in England decreased significantly as the outbreak progressed. This is likely due to a combination of incremental treatment improvements.
1. Horwitz LI, Jones SA, Cerfolio RJ, et al. Trends in COVID-19 risk-adjusted mortality rates. J Hosp Med. 2020;16(2):90-92. https://doi.org/10.12788/jhm.3552
2. Dennis JM, McGovern AP, Vollmer SJ, Mateen BA. Improving survival of critical care patients with coronavirus disease 2019 in England: a national cohort study, March to June 2020. Crit Care Med. 2021;49(2):209-214. https://doi.org/10.1097/CCM.0000000000004747
3. NHS Digital. Hospital Episode Statistics Data Dictionary. Published March 2018. Accessed October 15, 2020. https://digital.nhs.uk/data-and-information/data-tools-and-services/data-services/hospital-episode-statistics/hospital-episode-statistics-data-dictionary
4. NHS Digital. HES-ONS Linked Mortality Data Dictionary. Accessed October 15, 2020. https://digital.nhs.uk/binaries/content/assets/legacy/word/i/p/hes-ons_linked_mortality_data_dictionary_-_mar_20181.docx
5. Public Health England. Technical summary: Public Health England data series on deaths in people with COVID-19. Accessed November 11, 2020. https://assets.publishing.service.gov.uk/government/uploads/system/uploads/attachment_data/file/916035/RA_Technical_Summary_-_PHE_Data_Series_COVID_19_Deaths_20200812.pdf
6. Zou G. A modified Poisson regression approach to prospective studies with binary data. Am J Epidemiol. 2004;159(7):702-706. https://doi.org/10.1093/aje/kwh090
7. van Walraven C, Austin PC, Jennings A, et al. A modification of the Elixhauser comorbidity measures into a point system for hospital death using administrative data. Med Care. 2009;47(6):626-633. https://doi.org /10.1097/MLR.0b013e31819432e5
8. Ministry of Housing Communities & Local Government. The English Indices of Deprivation 2019 (IoD2019). Published September 26, 2020. Accessed January 15, 2021. https://assets.publishing.service.gov.uk/government/uploads/system/uploads/attachment_data/file/835115/IoD2019_Statistical_Release.pdf
9. Zeileis A. Object-oriented computation of sandwich estimators. J Stat Software. 2006;16:1-16. https://doi.org/10.18637/jss.v016.i09
10. Højsgaard S, Halekoh U, Yan J. The R package geepack for generalized estimating equations. J Stat Software. 2006;15:1-11. https://doi.org/10.18637/jss.v015.i02
11. Belsley DA, Kuh E, Welsch RE. Diagnostics: Identifying Influential Data and Sources of Collinearity. John Wiley & Sons; 1980.
12. RECOVERY Collaborative Group, Horby P, Lim WS, Emberson JR, et al. Dexamethasone in hospitalized patients with covid-19 - preliminary report. N Engl J Med. 2020:NEJMoa2021436. https://doi.org/10.1056/NEJMoa2021436
The early phase of the coronavirus disease 2019 (COVID-19) pandemic in the United Kingdom (UK) was characterized by uncertainty as clinicians grappled to understand and manage an unfamiliar disease that affected very high numbers of patients amid radically evolving working environments, with little evidence to support their efforts. Early reports indicated high mortality in patients hospitalized with COVID-19.
As the disease became better understood, treatment evolved and the mortality appears to have decreased. For example, two recent papers, a national study of critical care patients in the UK and a single-site study from New York, have demonstrated a significant reduction in adjusted mortality between the pre- and post-peak periods.1,2 However, the UK study was restricted to patients receiving critical care, potentially introducing bias due to varying critical care admission thresholds over time, while the single-site US study may not be generalizable. Moreover, both studies measured only in-hospital mortality. It remains uncertain therefore whether overall mortality has decreased on a broad scale after accounting for changes in patient characteristics.
The aim of this study was to use a national dataset to assess the
METHODS
We conducted a retrospective, secondary analysis of English National Health Services (NHS) hospitals’ admissions of patients at least 18 years of age between March 1 and July 31, 2020. Data were obtained from the Hospital Episode Statistics (HES) admitted patient care dataset.3 This is an administrative dataset that contains data on diagnoses and procedures as well as organizational characteristics and patient demographics for all NHS activity in England. We included all patients with an International Statistical Classification of Diseases, Tenth Revision (ICD-10) diagnosis of U07.1 (COVID-19, virus identified) and U07.2 (COVID-19, virus not identified).
The primary outcome of death within 28 days of admission was obtained by linking to the Civil Registrations (Deaths) - Secondary Care Cut - Information dataset, which includes the date, place, and cause of death from the Office for National Statistics4 and which was complete through September 31, 2020. The time horizon of 28 days from admission was chosen to approximate the Public Health England definition of a death from COVID-19 as being within 28 days of testing positive.5 We restricted our analysis to emergency admissions of persons age >18 years. If a patient had multiple emergency admissions, we restricted our analysis to the first admission to ensure comparability across hospitalizations and to best represent outcomes from the earliest onset of COVID-19.
We estimated a modified Poisson regression6 to predict death at 28 days, with month of admission, region, source of admission, age, deprivation, gender, ethnic group, and the 29 comorbidities in the Elixhauser comorbidity measure as variables in the regression.7 The derivation of each of these variables from the HES dataset is shown in Appendix Table 1.
Deprivation was measured by the Index of Multiple Deprivation, a methodology used widely within the UK to classify relative deprivation.8 To control for clustering, hospital system (known as Trust) was added as a random effect. Robust errors were estimated using the sandwich package.9 Modified Poisson regression was chosen in preference to the more common logistic regression because the coefficients can be interpreted as relative risks and not odds ratios. The model was fitted using R, version 4.0.3, geepack library.10 We carried out three sensitivity analyses, restricting to laboratory-confirmed COVID-19, length of stay ≥3 days, and primary respiratory disease.
For each month, we obtained a standardized mortality ratio (SMR) by fixing the month to the reference month of March 2020 and repredicting the outcome using the existing model. We calculated the ratio of the sum of observed and expected deaths (obtained from the model) in each month, comparing observed deaths to the number we would have expected had those patients been hospitalized in March. We then multiplied each period’s SMR by the March crude mortality to generate monthly adjusted mortality rates. We calculated Poisson confidence intervals around the SMR and used these to obtain confidence intervals for the adjusted rate. The binomial exact method was used to obtain confidence intervals for the crude rate. Multicollinearity was assessed using both the variance inflation factor (VIF) and the condition number test.7 All analyses used two-sided statistical tests, and we considered a P value < .05 to be statistically significant without adjustment for multiple testing. The study was exempt from UK National Research Ethics Committee approval because it involved secondary analysis of anonymized data.
RESULTS
The dataset included 115,643 emergency admissions from 179 healthcare systems, of which 103,202 were first admissions eligible for inclusion. A total of 592 patients were excluded due to missing demographic data (0.5%), resulting in 102,610 admissions included in the analysis. Peak hospitalizations occurred in late March to mid April, accounting for 44% of the hospitalizations (Table). Median length of stay for patients who died was 7 days (interquartile range, 3-12). The median age and number of Elixhauser comorbidities decreased in July. The proportion of men decreased between May and July.
The modified Poisson regression had a C statistic of 0.743 (95% CI, 0.740-0.746) (Appendix Table 4). The VIF and condition number test found no evidence of multicollinearity.11
Adjusted mortality decreased each month, from 33.4% in March to 17.4% in July (Figure). The relative risk of death declined progressively to a minimum of 0.52 (95% CI, 0.34-0.80) in July, compared to March.
Admission from another hospital and being female were associated with reduced risk of death. Admission from a skilled nursing facility and being >75 years were associated with increased risk of death. Ten of the 29 Elixhauser comorbidities were associated with increased risk of mortality (cardiac arrhythmia, peripheral vascular disease, other neurologic disorders, renal failure, lymphoma, metastatic cancer, solid tumor without metastasis, coagulopathy, fluid and electrolyte disorders, and anemia). Deprivation and ethnic group were not associated with death among hospitalized patients.
DISCUSSION
Our study of all emergency hospital admissions in England during the first wave of the COVID-19 pandemic demonstrated that, even after adjusting for patient comorbidity and risk factors, the mortality rate decreased by approximately half over the first 5 months. Although the demographics of hospitalized patients changed over that period (with both the median age and the number of comorbidities decreasing), this does not fully explain the decrease in mortality. It is therefore likely that the decrease is due, at least in part, to an improvement in treatment and/or a reduction in hospital strain.
For example, initially the use of corticosteroids was controversial, in part due to previous experience with severe acute respiratory syndrome and Middle East respiratory syndrome (in which a Cochrane review demonstrated no benefit but potential harm). However, this changed as a result of the Randomized Evaluation of Covid-19 Therapy (RECOVERY) trial,12 which showed a significant survival benefit.One of the positive defining characteristics of the COVID-19 pandemic has been the intensive collaborative research effort combined with the rapid dissemination and discussion of new management protocols. The RECOVERY trial randomly assigned >11,000 participants in just 3 months, amounting to approximately 15% of all patients hospitalized with COVID-19 in the UK. Its results were widely publicized via professional networks and rapidly adopted into widespread clinical practice.
Examples of other changes include a higher threshold for mechanical ventilation (and a lower threshold for noninvasive ventilation), increased clinician experience, and, potentially, a reduced viral load arising from increased social distancing and mask wearing. Finally, the hospitals and staff themselves were under enormous physical and mental strain in the early months from multiple factors, including unfamiliar working environments, the large-scale redeployment of inexperienced staff, and very high numbers of patients with an unfamiliar disease. These factors all lessened as the initial peak passed. It is therefore likely that the reduction in adjusted mortality we observed arises from a combination of all these factors, as well as other incremental benefits.
The factors associated with increased mortality risk in our study (increasing age, male gender, certain comorbidities, and frailty [with care home residency acting as a proxy in our study]) are consistent with multiple previous reports. Although not the focus of our analysis, we found no effect of ethnicity or deprivation on mortality. This is consistent with many US studies that demonstrate that the widely reported effect of these factors is likely due to differences in exposure to the disease. Once patients are hospitalized, adjusted mortality risks are similar across ethnic groups and deprivation levels.
The strengths of this study include complete capture of hospitalizations across all hospitals and areas in England. Likewise, linking the hospital data to death data from the Office for National Statistics allows complete capture of outcomes, irrespective of where the patient died. This is a significant strength compared to prior studies, which only included in-hospital mortality. Our results are therefore likely robust and a true observation of the mortality trend.
Limitations include the lack of physiologic and laboratory data; having these would have allowed us to adjust for disease severity on admission and strengthened the risk stratification. Likewise, although the complete national coverage is overall a significant strength, aggregating data from numerous areas that might be at different stages of local outbreaks, have different management strategies, and have differing data quality introduces its own biases.
Furthermore, these results predate the second wave in the UK, so we cannot distinguish whether the reduced mortality is due to improved treatment, a seasonal effect, evolution of the virus itself, or a reduction in the strain on hospitals.
CONCLUSION
This nationwide study indicates that, even after accounting for changing patient characteristics, the mortality of patients hospitalized with COVID-19 in England decreased significantly as the outbreak progressed. This is likely due to a combination of incremental treatment improvements.
1. Horwitz LI, Jones SA, Cerfolio RJ, et al. Trends in COVID-19 risk-adjusted mortality rates. J Hosp Med. 2020;16(2):90-92. https://doi.org/10.12788/jhm.3552
2. Dennis JM, McGovern AP, Vollmer SJ, Mateen BA. Improving survival of critical care patients with coronavirus disease 2019 in England: a national cohort study, March to June 2020. Crit Care Med. 2021;49(2):209-214. https://doi.org/10.1097/CCM.0000000000004747
3. NHS Digital. Hospital Episode Statistics Data Dictionary. Published March 2018. Accessed October 15, 2020. https://digital.nhs.uk/data-and-information/data-tools-and-services/data-services/hospital-episode-statistics/hospital-episode-statistics-data-dictionary
4. NHS Digital. HES-ONS Linked Mortality Data Dictionary. Accessed October 15, 2020. https://digital.nhs.uk/binaries/content/assets/legacy/word/i/p/hes-ons_linked_mortality_data_dictionary_-_mar_20181.docx
5. Public Health England. Technical summary: Public Health England data series on deaths in people with COVID-19. Accessed November 11, 2020. https://assets.publishing.service.gov.uk/government/uploads/system/uploads/attachment_data/file/916035/RA_Technical_Summary_-_PHE_Data_Series_COVID_19_Deaths_20200812.pdf
6. Zou G. A modified Poisson regression approach to prospective studies with binary data. Am J Epidemiol. 2004;159(7):702-706. https://doi.org/10.1093/aje/kwh090
7. van Walraven C, Austin PC, Jennings A, et al. A modification of the Elixhauser comorbidity measures into a point system for hospital death using administrative data. Med Care. 2009;47(6):626-633. https://doi.org /10.1097/MLR.0b013e31819432e5
8. Ministry of Housing Communities & Local Government. The English Indices of Deprivation 2019 (IoD2019). Published September 26, 2020. Accessed January 15, 2021. https://assets.publishing.service.gov.uk/government/uploads/system/uploads/attachment_data/file/835115/IoD2019_Statistical_Release.pdf
9. Zeileis A. Object-oriented computation of sandwich estimators. J Stat Software. 2006;16:1-16. https://doi.org/10.18637/jss.v016.i09
10. Højsgaard S, Halekoh U, Yan J. The R package geepack for generalized estimating equations. J Stat Software. 2006;15:1-11. https://doi.org/10.18637/jss.v015.i02
11. Belsley DA, Kuh E, Welsch RE. Diagnostics: Identifying Influential Data and Sources of Collinearity. John Wiley & Sons; 1980.
12. RECOVERY Collaborative Group, Horby P, Lim WS, Emberson JR, et al. Dexamethasone in hospitalized patients with covid-19 - preliminary report. N Engl J Med. 2020:NEJMoa2021436. https://doi.org/10.1056/NEJMoa2021436
© 2021 Society of Hospital Medicine
Effect of Hospital Readmission Reduction on Patients at Low, Medium, and High Risk of Readmission in the Medicare Population
Given the high cost of readmissions to the healthcare system, there has been a substantial push to reduce readmissions by policymakers.1 Among these is the Hospital Readmissions Reduction Program (HRRP), in which hospitals with higher than expected readmission rates receive reduced payments from Medicare.2 Recent evidence has suggested the success of such policy changes, with multiple reports demonstrating a decrease in 30-day readmission rates in the Medicare population starting in 2010.3-8
Initiatives to reduce readmissions can also have an effect on total number of admissions.9,10 Indeed, along with the recent reduction in readmission, there has been a reduction in all admissions among Medicare beneficiaries.11,12 Some studies have found that as admissions have decreased, the burden of comorbidity has increased among hospitalized patients,3,11 suggesting that hospitals may be increasingly filled with patients at high risk of readmission. However, whether readmission risk among hospitalized patients has changed remains unknown, and understanding changes in risk profile could help inform which patients to target with future interventions to reduce readmissions.
Hospital efforts to reduce readmissions may have differential effects on types of patients by risk. For instance, low-intensity, system-wide interventions such as standardized discharge instructions or medicine reconciliation may have a stronger effect on patients at relatively low risk of readmission who may have a few important drivers of readmission that are easily overcome. Alternatively, the impact of intensive care transitions management might be greatest for high-risk patients, who have the most need for postdischarge medications, follow-up, and self-care.
The purpose of this study was therefore twofold: (1) to observe changes in average monthly risk of readmission among hospitalized Medicare patients and (2) to examine changes in readmission rates for Medicare patients at various risk of readmission. We hypothesized that readmission risk in the Medicare population would increase in recent years, as overall number of admissions and readmissions have fallen.7,11 Additionally, we hypothesized that standardized readmission rates would decline less in highest risk patients as compared with the lowest risk patients because transitional care interventions may not be able to mitigate the large burden of comorbidity and social issues present in many high-risk patients.13,14
METHODS
We performed a retrospective cohort study of hospitalizations to US nonfederal short-term acute care facilities by Medicare beneficiaries between January 2009 and June 2015. The design involved 4 steps. First, we estimated a predictive model for unplanned readmissions within 30 days of discharge. Second, we assigned each hospitalization a predicted risk of readmission based on the model. Third, we studied trends in mean predicted risk of readmission during the study period. Fourth, we examined trends in observed to expected (O/E) readmission for hospitalizations in the lowest, middle, and highest categories of predicted risk of readmission to determine whether reductions in readmissions were more substantial in certain risk groups than in others.
Data were obtained from the Centers for Medicare and Medicaid Services (CMS) Inpatient Standard Analytic File and the Medicare Enrollment Data Base. We included hospitalizations of fee-for-service Medicare beneficiaries age ≥65 with continuous enrollment in Part A Medicare fee-for-service for at least 1 year prior and 30 days after the hospitalization.15 Hospitalizations with a discharge disposition of death, transfer to another acute hospital, and left against medical advice (AMA) were excluded. We also excluded patients with enrollment in hospice care prior to hospitalization. We excluded hospitalizations in June 2012 because of an irregularity in data availability for that month.
Hospitalizations were categorized into 5 specialty cohorts according to service line. The 5 cohorts were those used for the CMS hospital-wide readmission measure and included surgery/gynecology, medicine, cardiovascular, cardiorespiratory, and neurology.15 Among the 3 clinical conditions tracked as part of HRRP, heart failure and pneumonia were a subset of the cardiorespiratory cohort, while acute myocardial infarction was a subset of the cardiovascular cohort. Our use of cohorts was threefold: first, the average risk of readmission differs substantially across these cohorts, so pooling them produces heterogeneous risk strata; second, risk variables perform differently in different cohorts, so one single model may not be as accurate for calculating risk; and, third, the use of disease cohorts makes our results comparable to the CMS model and similar to other readmission studies in Medicare.7,8,15
For development of the risk model, the outcome was 30-day unplanned hospital readmission. Planned readmissions were excluded; these were defined by the CMS algorithm as readmissions in which a typically planned procedure occurred in a hospitalization with a nonacute principal diagnosis.16 Independent variables included age and comorbidities in the final hospital-wide readmission models for each of the 5 specialty cohorts.15 In order to produce the best possible individual risk prediction for each patient, we added additional independent variables that CMS avoids for hospital quality measurement purposes but that contribute to risk of readmission: sex, race, dual eligibility status, number of prior AMA discharges, intensive care unit stay during current hospitalization, coronary care unit stay during current hospitalization, and hospitalization in the prior 30, 90, and 180 days. We also included an indicator variable for hospitalizations with more than 9 discharge diagnosis codes on or after January 2011, the time at which Medicare allowed an increase of the number of International Classification of Diseases, 9th Revision-Clinical Modification diagnosis billing codes from 9 to 25.17 This indicator adjusts for the increased availability of comorbidity codes, which might otherwise inflate the predicted risk relative to hospitalizations prior to that date.
Based on the risk models, each hospitalization was assigned a predicted risk of readmission. For each specialty cohort, we pooled all hospitalizations across all study years and divided them into risk quintiles. We categorized hospitalizations as high risk if in the highest quintile, medium risk if in the middle 3 quintiles, and low risk if in the lowest quintile of predicted risk for all study hospitalizations in a given specialty cohort.
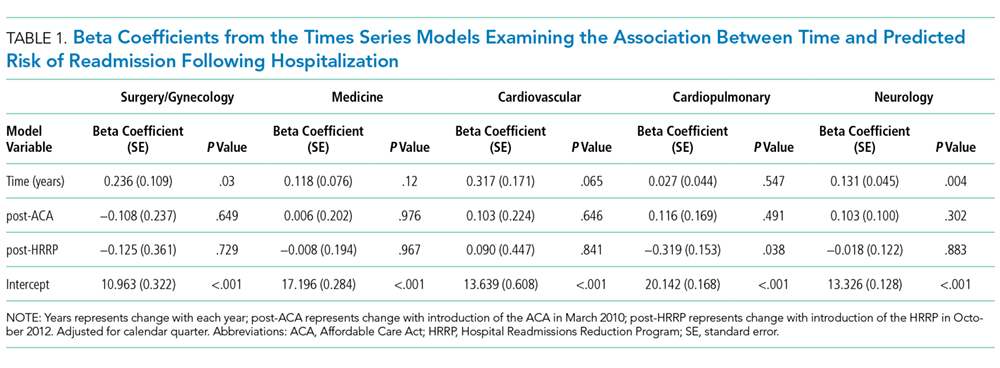
For our time trend analyses, we studied 2 outcomes: monthly mean predicted risk and monthly ratio of observed readmissions to expected readmissions for patients in the lowest, middle, and highest categories of predicted risk of readmission. We studied monthly predicted risk to determine whether the average readmission risk of patients was changing over time as admission and readmission rates were declining. We studied the ratio of O/E readmissions to determine whether the decline in overall readmissions was more substantial in particular risk strata; we used the ratio of O/E readmissions, which measures number of readmissions divided by number of readmissions predicted by the model, rather than crude observed readmissions, as O/E readmissions account for any changes in risk profiles over time within each risk stratum. Independent variables in our trend analyses were year—entered as a continuous variable—and indicators for postintroduction of the Affordable Care Act (ACA, March 2010) and for postintroduction of HRRP (October 2012); these time indicators were included because of prior studies demonstrating that the introduction of ACA was associated with a decrease from baseline in readmission rates, which leveled off after introduction of HRRP.7 We also included an indicator for calendar quarter to account for seasonal effects.
Statistical Analysis
We developed generalized estimating equation models to predict 30-day unplanned readmission for each of the 5 specialty cohorts. The 5 models were fit using all patients in each cohort for the included time period and were adjusted for clustering by hospital. We assessed discrimination by calculating area under the receiver operating characteristic curve (AUC) for the 5 models; the AUCs measured the models’ ability to distinguish patients who were readmitted versus those who were not.18 We also calculated AUCs for each year to examine model performance over time.
Using these models, we calculated predicted risk for each hospitalization and averaged these to obtain mean predicted risk for each specialty cohort for each month. To test for trends in mean risk, we estimated 5 time series models, one for each cohort, with the dependent variable of monthly mean predicted risk. For each cohort, we first estimated a series of 12 empty autoregressive models, each with a different autoregressive term (1, 2...12). For each model, we calculated χ2 for the test that the autocorrelation was 0; based on a comparison of chi-squared values, we specified an autocorrelation of 1 month for all models. Accordingly, a 1-month lag was used to estimate one final model for each cohort. Independent variables included year and indicators for post-ACA and post-HRRP; these variables captured the effect of trends over time and the introduction of these policy changes, respectively.19
To determine whether changes in risk over time were a result of changes in particular risk groups, we categorized hospitalizations into risk strata based on quintiles of predicted risk for each specialty cohort for the entire study period. For each individual year, we calculated the proportion of hospitalizations in the highest, middle, and lowest readmission risk strata for each cohort.
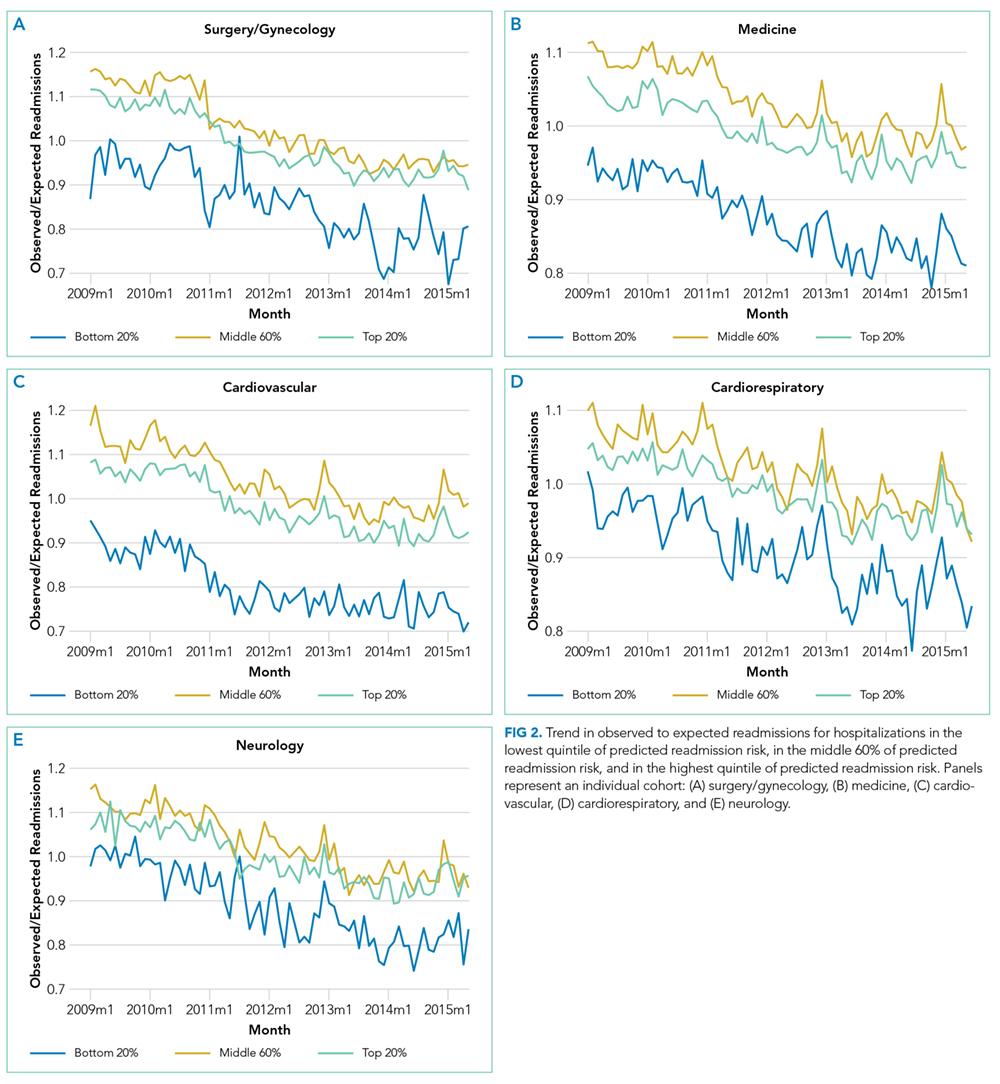
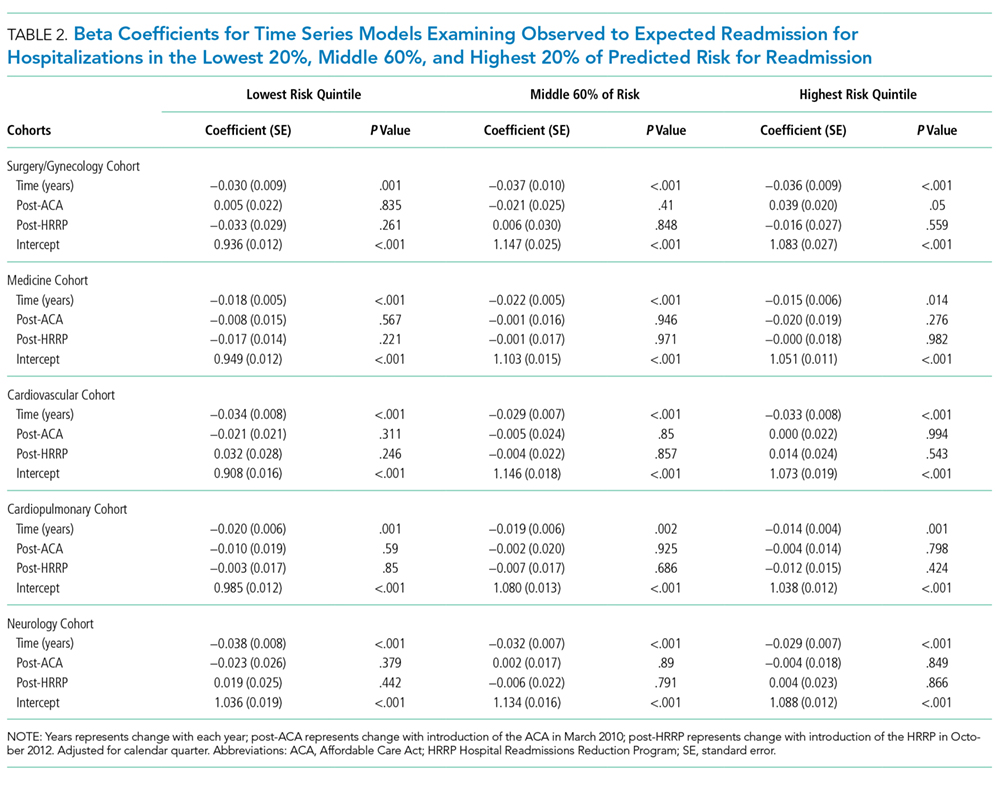
We calculated the monthly ratio of O/E readmission for hospitalizations in the lowest 20%, middle 60%, and highest 20% of readmission risk by month; O/E reflects the excess or deficit observed events relative to the number predicted by the model. Using this monthly O/E as the dependent variable, we developed autoregressive time series models as above, again with a 1-month lag, for each of these 3 risk strata in each cohort. As before, independent variables were year as a continuous variable, indicator variables for post-ACA and post-HRRP, and a categorical variable for calendar quarter.
All analyses were done in SAS version 9.3 (SAS Institute Inc., Cary, NC) and Stata version 14.2 (StataCorp LLC, College Station, TX).
RESULTS
We included 47,288,961 hospitalizations in the study, of which 11,231,242 (23.8%) were in the surgery/gynecology cohort, 19,548,711 (41.3%) were in the medicine cohort, 5,433,125 (11.5%) were in the cardiovascular cohort, 8,179,691 (17.3%) were in the cardiorespiratory cohort, and 2,896,192 (6.1%) were in the neurology cohort. The readmission rate was 16.2% (n = 7,642,161) overall, with the highest rates observed in the cardiorespiratory (20.5%) and medicine (17.6%) cohorts and the lowest rates observed in the surgery/gynecology (11.8%) and neurology (13.8%) cohorts.
The final predictive models for each cohort ranged in number of parameters from 56 for the cardiorespiratory cohort to 264 for the surgery/gynecology cohort. The models had AUCs of 0.70, 0.65, 0.67, 0.65, and 0.63 for the surgery/gynecology, medicine, cardiovascular, cardiorespiratory, and neurology cohorts, respectively; AUCs remained fairly stable over time for all disease cohorts (Appendix Table 1).
DISCUSSION
A number of mechanisms may account for the across-the-board improvements in readmission reduction. Many hospitals have instituted system-wide interventions, including patient education, medicine reconciliation, and early postdischarge follow-up,20 which may have reduced readmissions across all patient risk strata. Alternatively, hospitals may have implemented interventions that disproportionally benefited low-risk patients while simultaneously utilizing interventions that only benefited high-risk patients. For instance, increasing threshold for admission7 may have the greatest effect on low-risk patients who could be most easily managed at home, while many intensive transitional care interventions have been developed to target only high-risk patients.21,22
With the introduction of HRRP, there have been a number of concerns about the readmission measure used to penalize hospitals for high readmission rates. One major concern has been that the readmission metric may be flawed in its ability to capture continued improvement related to readmission.23 Some have suggested that with better population health management, admissions will decrease, patient risk of the remaining patients will increase, and hospitals will be increasingly filled with patients who have high likelihood of readmission. This potential for increased risk with HRRP was suggested by a recent study that found that comorbidities increased in hospitalized Medicare beneficiaries between 2010 and 2013.11 Our results were mixed in supporting this potential phenomenon because we examined global risk of readmission and found that some of the cohorts had increased risk over time while others did not. Others have expressed concern that readmission measure does not account for socioeconomic status, which has been associated with readmission rates.24-27 Although we did not directly examine socioeconomic status in our study, we found that hospitals have been able to reduce readmission across all levels of risk, which includes markers of socioeconomic status, including race and Medicaid eligibility status.
Although we hypothesized that readmission risk would increase as number of hospitalizations decreased over time, we found no increase in readmission risk among the cohorts with HRRP diagnoses that had the largest decrease in readmission rates.7,8 Conversely, readmission risk did increase—with a concurrent increase in the proportion of high-risk hospitalizations—in the surgery/gynecology and neurology cohorts that were not subject to HRRP penalties. Nonetheless, rehospitalizations were reduced for all risk categories in these 2 cohorts. Notably, surgery/gynecology and neurology had the lowest readmission rates overall. These findings suggest that initiatives to prevent initial hospitalizations, such as increasing the threshold for postoperative admission, may have had a greater effect on low- versus high-risk patients in low-risk hospitalizations. However, once a patient is hospitalized, multidisciplinary strategies appear to be effective at reducing readmissions for all risk classes in these cohorts.
For the 3 cohorts in which we observed an increase in readmission risk among hospitalized patients, the risk appeared to increase in early 2011. This time was about 10 months after passage of ACA, the timing of which was previously associated with a drop in readmission rates,7,8 but well before HRRP went into effect in October 2012. The increase in readmission risk coincided with an increase in the number of diagnostic codes that could be included on a hospital claim to Medicare.17 This increase in allowable codes allowed us to capture more diagnoses for some patients, potentially resulting in an increase in apparent predicted risk of readmissions. While we adjusted for this in our predictive models, we may not have fully accounted for differences in risk related to coding change. As a result, some of the observed differences in risk in our study may be attributable to coding differences. More broadly, studies demonstrating the success of HRRP have typically examined risk-adjusted rates of readmission.3,7 It is possible that a small portion of the observed reduction in risk-adjusted readmission rates may be related to the increase in predicted risk of readmission observed in our study. Future assessment of trends in readmission during this period should consider accounting for change in the number of allowed billing codes.
Other limitations should be considered in the interpretation of this study. First, like many predictive models for readmission,14 ours had imperfect discrimination, which could affect our results. Second, our study was based on older Medicare patients, so findings may not be applicable to younger patients. Third, while we accounted for surrogates for socioeconomic status, including dual eligibility and race, our models lacked other socioeconomic and community factors that can influence readmission.24-26 Nonetheless, 1 study suggested that easily measured socioeconomic factors may not have a strong influence on the readmission metric used by Medicare.28 Fourth, while our study included over 47 million hospitalizations, our time trend analyses used calendar month as the primary independent variable. As our study included 77 months, we may not have had sufficient power to detect small changes in risk over time.
Medicare readmissions have declined steadily in recent years, presumably at least partly in response to policy changes including HRRP. We found that hospitals have been effective at reducing readmissions across a range of patient risk strata and clinical conditions. As a result, the overall risk of readmission for hospitalized patients has remained constant for some but not all conditions. Whether institutions can continue to reduce readmission rates for most types of patients remains to be seen.
Acknowledgments
This study was supported by the Agency for Healthcare Research and Quality (AHRQ) grant R01HS022882. Dr. Blecker was supported by the AHRQ grant K08HS23683. The authors would like to thank Shawn Hoke and Jane Padikkala for administrative support.
Disclosure
This study was supported by the Agency for Healthcare Research and Quality (AHRQ) grants R01HS022882 and K08HS23683. The authors have no conflicts to report.
1. Jha AK. Seeking Rational Approaches to Fixing Hospital Readmissions. JAMA. 2015;314(16):1681-1682. PubMed
2. Centers for Medicare & Medicaid Services. Readmissions Reduction Program. https://www.cms.gov/Medicare/Medicare-Fee-for-Service-Payment/AcuteInpatientPPS/Readmissions-Reduction-Program.html. Accessed on January 17, 2017.
3. Suter LG, Li SX, Grady JN, et al. National patterns of risk-standardized mortality and readmission after hospitalization for acute myocardial infarction, heart failure, and pneumonia: update on publicly reported outcomes measures based on the 2013 release. J Gen Intern Med. 2014;29(10):1333-1340. PubMed
4. Gerhardt G, Yemane A, Hickman P, Oelschlaeger A, Rollins E, Brennan N. Medicare readmission rates showed meaningful decline in 2012. Medicare Medicaid Res Rev. 2013;3(2):pii:mmrr.003.02.b01. PubMed
5. Centers for Medicare and Medicaid Services. New Data Shows Affordable Care Act Reforms Are Leading to Lower Hospital Readmission Rates for Medicare Beneficiaries. http://blog.cms.gov/2013/12/06/new-data-shows-affordable-care-act-reforms-are-leading-to-lower-hospital-readmission-rates-for-medicare-beneficiaries/. Accessed on January 17, 2017.
6. Krumholz HM, Normand SL, Wang Y. Trends in hospitalizations and outcomes for acute cardiovascular disease and stroke, 1999-2011. Circulation. 2014;130(12):966-975. PubMed
7. Zuckerman RB, Sheingold SH, Orav EJ, Ruhter J, Epstein AM. Readmissions, Observation, and the Hospital Readmissions Reduction Program. N Engl J Med. 2016;374(16):1543-1551. PubMed
8. Desai NR, Ross JS, Kwon JY, et al. Association Between Hospital Penalty Status Under the Hospital Readmission Reduction Program and Readmission Rates for Target and Nontarget Conditions. JAMA. 2016;316(24):2647-2656. PubMed
9. Brock J, Mitchell J, Irby K, et al. Association between quality improvement for care transitions in communities and rehospitalizations among Medicare beneficiaries. JAMA. 2013;309(4):381-391. PubMed
10. Jencks S. Protecting Hospitals That Improve Population Health. http://medicaring.org/2014/12/16/protecting-hospitals/. Accessed on January 5, 2017.
11. Dharmarajan K, Qin L, Lin Z, et al. Declining Admission Rates And Thirty-Day Readmission Rates Positively Associated Even Though Patients Grew Sicker Over Time. Health Aff (Millwood). 2016;35(7):1294-1302. PubMed
12. Krumholz HM, Nuti SV, Downing NS, Normand SL, Wang Y. Mortality, Hospitalizations, and Expenditures for the Medicare Population Aged 65 Years or Older, 1999-2013. JAMA. 2015;314(4):355-365. PubMed
13. Amarasingham R, Moore BJ, Tabak YP, et al. An automated model to identify heart failure patients at risk for 30-day readmission or death using electronic medical record data. Med Care. 2010;48(11):981-988. PubMed
14. Kansagara D, Englander H, Salanitro A, et al. Risk prediction models for hospital readmission: a systematic review. JAMA. 2011;306(15):1688-1698. PubMed
15. Horwitz LI, Partovian C, Lin Z, et al. Development and use of an administrative claims measure for profiling hospital-wide performance on 30-day unplanned readmission. Ann Intern Med. 2014;161(10 Suppl):S66-S75. PubMed
16. 2016 Condition-Specific Measures Updates and Specifications Report Hospital-Level 30-Day Risk-Standardized Readmission Measures. https://www.cms.gov/Medicare/Quality-Initiatives-Patient-Assessment-Instruments/HospitalQualityInits/Downloads/AMI-HF-PN-COPD-and-Stroke-Readmission-Updates.zip. Accessed on January 19, 2017.
17. Centers for Medicare & Medicaid Services. Pub 100-04 Medicare Claims Processing, Transmittal 2028. https://www.cms.gov/Regulations-and-Guidance/Guidance/Transmittals/downloads/R2028CP.pdf. Accessed on November 28, 2016.
18. Martens FK, Tonk EC, Kers JG, Janssens AC. Small improvement in the area under the receiver operating characteristic curve indicated small changes in predicted risks. J Clin Epidemiol. 2016;79:159-164. PubMed
19. Blecker S, Goldfeld K, Park H, et al. Impact of an Intervention to Improve Weekend Hospital Care at an Academic Medical Center: An Observational Study. J Gen Intern Med. 2015;30(11):1657-1664. PubMed
20. Hansen LO, Young RS, Hinami K, Leung A, Williams MV. Interventions to reduce 30-day rehospitalization: a systematic review. Ann Intern Med. 2011;155(8):520-528. PubMed
21. Cavanaugh JJ, Jones CD, Embree G, et al. Implementation Science Workshop: primary care-based multidisciplinary readmission prevention program. J Gen Intern Med. 2014;29(5):798-804. PubMed
22. Jenq GY, Doyle MM, Belton BM, Herrin J, Horwitz LI. Quasi-Experimental Evaluation of the Effectiveness of a Large-Scale Readmission Reduction Program. JAMA Intern Med. 2016;176(5):681-690. PubMed
23. Lynn J, Jencks S. A Dangerous Malfunction in the Measure of Readmission Reduction. http://medicaring.org/2014/08/26/malfunctioning-metrics/. Accessed on January 17, 2017.
24. Calvillo-King L, Arnold D, Eubank KJ, et al. Impact of social factors on risk of readmission or mortality in pneumonia and heart failure: systematic review. J Gen Intern Med. 2013;28(2):269-282. PubMed
25. Barnett ML, Hsu J, McWilliams JM. Patient Characteristics and Differences in Hospital Readmission Rates. JAMA Intern Med. 2015;175(11):1803-1812. PubMed
26. Singh S, Lin YL, Kuo YF, Nattinger AB, Goodwin JS. Variation in the risk of readmission among hospitals: the relative contribution of patient, hospital and inpatient provider characteristics. J Gen Intern Med. 2014;29(4):572-578. PubMed
27. American Hospital Association. American Hospital Association (AHA) Detailed Comments on the Inpatient Prospective Payment System (PPS) Proposed Rule for Fiscal Year (FY) 2016. http://www.aha.org/advocacy-issues/letter/2015/150616-cl-cms1632-p-ipps.pdf. Accessed on January 10, 2017.
28. Bernheim SM, Parzynski CS, Horwitz L, et al. Accounting For Patients’ Socioeconomic Status Does Not Change Hospital Readmission Rates. Health Aff (Millwood). 2016;35(8):1461-1470. PubMed
Given the high cost of readmissions to the healthcare system, there has been a substantial push to reduce readmissions by policymakers.1 Among these is the Hospital Readmissions Reduction Program (HRRP), in which hospitals with higher than expected readmission rates receive reduced payments from Medicare.2 Recent evidence has suggested the success of such policy changes, with multiple reports demonstrating a decrease in 30-day readmission rates in the Medicare population starting in 2010.3-8
Initiatives to reduce readmissions can also have an effect on total number of admissions.9,10 Indeed, along with the recent reduction in readmission, there has been a reduction in all admissions among Medicare beneficiaries.11,12 Some studies have found that as admissions have decreased, the burden of comorbidity has increased among hospitalized patients,3,11 suggesting that hospitals may be increasingly filled with patients at high risk of readmission. However, whether readmission risk among hospitalized patients has changed remains unknown, and understanding changes in risk profile could help inform which patients to target with future interventions to reduce readmissions.
Hospital efforts to reduce readmissions may have differential effects on types of patients by risk. For instance, low-intensity, system-wide interventions such as standardized discharge instructions or medicine reconciliation may have a stronger effect on patients at relatively low risk of readmission who may have a few important drivers of readmission that are easily overcome. Alternatively, the impact of intensive care transitions management might be greatest for high-risk patients, who have the most need for postdischarge medications, follow-up, and self-care.
The purpose of this study was therefore twofold: (1) to observe changes in average monthly risk of readmission among hospitalized Medicare patients and (2) to examine changes in readmission rates for Medicare patients at various risk of readmission. We hypothesized that readmission risk in the Medicare population would increase in recent years, as overall number of admissions and readmissions have fallen.7,11 Additionally, we hypothesized that standardized readmission rates would decline less in highest risk patients as compared with the lowest risk patients because transitional care interventions may not be able to mitigate the large burden of comorbidity and social issues present in many high-risk patients.13,14
METHODS
We performed a retrospective cohort study of hospitalizations to US nonfederal short-term acute care facilities by Medicare beneficiaries between January 2009 and June 2015. The design involved 4 steps. First, we estimated a predictive model for unplanned readmissions within 30 days of discharge. Second, we assigned each hospitalization a predicted risk of readmission based on the model. Third, we studied trends in mean predicted risk of readmission during the study period. Fourth, we examined trends in observed to expected (O/E) readmission for hospitalizations in the lowest, middle, and highest categories of predicted risk of readmission to determine whether reductions in readmissions were more substantial in certain risk groups than in others.
Data were obtained from the Centers for Medicare and Medicaid Services (CMS) Inpatient Standard Analytic File and the Medicare Enrollment Data Base. We included hospitalizations of fee-for-service Medicare beneficiaries age ≥65 with continuous enrollment in Part A Medicare fee-for-service for at least 1 year prior and 30 days after the hospitalization.15 Hospitalizations with a discharge disposition of death, transfer to another acute hospital, and left against medical advice (AMA) were excluded. We also excluded patients with enrollment in hospice care prior to hospitalization. We excluded hospitalizations in June 2012 because of an irregularity in data availability for that month.
Hospitalizations were categorized into 5 specialty cohorts according to service line. The 5 cohorts were those used for the CMS hospital-wide readmission measure and included surgery/gynecology, medicine, cardiovascular, cardiorespiratory, and neurology.15 Among the 3 clinical conditions tracked as part of HRRP, heart failure and pneumonia were a subset of the cardiorespiratory cohort, while acute myocardial infarction was a subset of the cardiovascular cohort. Our use of cohorts was threefold: first, the average risk of readmission differs substantially across these cohorts, so pooling them produces heterogeneous risk strata; second, risk variables perform differently in different cohorts, so one single model may not be as accurate for calculating risk; and, third, the use of disease cohorts makes our results comparable to the CMS model and similar to other readmission studies in Medicare.7,8,15
For development of the risk model, the outcome was 30-day unplanned hospital readmission. Planned readmissions were excluded; these were defined by the CMS algorithm as readmissions in which a typically planned procedure occurred in a hospitalization with a nonacute principal diagnosis.16 Independent variables included age and comorbidities in the final hospital-wide readmission models for each of the 5 specialty cohorts.15 In order to produce the best possible individual risk prediction for each patient, we added additional independent variables that CMS avoids for hospital quality measurement purposes but that contribute to risk of readmission: sex, race, dual eligibility status, number of prior AMA discharges, intensive care unit stay during current hospitalization, coronary care unit stay during current hospitalization, and hospitalization in the prior 30, 90, and 180 days. We also included an indicator variable for hospitalizations with more than 9 discharge diagnosis codes on or after January 2011, the time at which Medicare allowed an increase of the number of International Classification of Diseases, 9th Revision-Clinical Modification diagnosis billing codes from 9 to 25.17 This indicator adjusts for the increased availability of comorbidity codes, which might otherwise inflate the predicted risk relative to hospitalizations prior to that date.
Based on the risk models, each hospitalization was assigned a predicted risk of readmission. For each specialty cohort, we pooled all hospitalizations across all study years and divided them into risk quintiles. We categorized hospitalizations as high risk if in the highest quintile, medium risk if in the middle 3 quintiles, and low risk if in the lowest quintile of predicted risk for all study hospitalizations in a given specialty cohort.
For our time trend analyses, we studied 2 outcomes: monthly mean predicted risk and monthly ratio of observed readmissions to expected readmissions for patients in the lowest, middle, and highest categories of predicted risk of readmission. We studied monthly predicted risk to determine whether the average readmission risk of patients was changing over time as admission and readmission rates were declining. We studied the ratio of O/E readmissions to determine whether the decline in overall readmissions was more substantial in particular risk strata; we used the ratio of O/E readmissions, which measures number of readmissions divided by number of readmissions predicted by the model, rather than crude observed readmissions, as O/E readmissions account for any changes in risk profiles over time within each risk stratum. Independent variables in our trend analyses were year—entered as a continuous variable—and indicators for postintroduction of the Affordable Care Act (ACA, March 2010) and for postintroduction of HRRP (October 2012); these time indicators were included because of prior studies demonstrating that the introduction of ACA was associated with a decrease from baseline in readmission rates, which leveled off after introduction of HRRP.7 We also included an indicator for calendar quarter to account for seasonal effects.
Statistical Analysis
We developed generalized estimating equation models to predict 30-day unplanned readmission for each of the 5 specialty cohorts. The 5 models were fit using all patients in each cohort for the included time period and were adjusted for clustering by hospital. We assessed discrimination by calculating area under the receiver operating characteristic curve (AUC) for the 5 models; the AUCs measured the models’ ability to distinguish patients who were readmitted versus those who were not.18 We also calculated AUCs for each year to examine model performance over time.
Using these models, we calculated predicted risk for each hospitalization and averaged these to obtain mean predicted risk for each specialty cohort for each month. To test for trends in mean risk, we estimated 5 time series models, one for each cohort, with the dependent variable of monthly mean predicted risk. For each cohort, we first estimated a series of 12 empty autoregressive models, each with a different autoregressive term (1, 2...12). For each model, we calculated χ2 for the test that the autocorrelation was 0; based on a comparison of chi-squared values, we specified an autocorrelation of 1 month for all models. Accordingly, a 1-month lag was used to estimate one final model for each cohort. Independent variables included year and indicators for post-ACA and post-HRRP; these variables captured the effect of trends over time and the introduction of these policy changes, respectively.19
To determine whether changes in risk over time were a result of changes in particular risk groups, we categorized hospitalizations into risk strata based on quintiles of predicted risk for each specialty cohort for the entire study period. For each individual year, we calculated the proportion of hospitalizations in the highest, middle, and lowest readmission risk strata for each cohort.
We calculated the monthly ratio of O/E readmission for hospitalizations in the lowest 20%, middle 60%, and highest 20% of readmission risk by month; O/E reflects the excess or deficit observed events relative to the number predicted by the model. Using this monthly O/E as the dependent variable, we developed autoregressive time series models as above, again with a 1-month lag, for each of these 3 risk strata in each cohort. As before, independent variables were year as a continuous variable, indicator variables for post-ACA and post-HRRP, and a categorical variable for calendar quarter.
All analyses were done in SAS version 9.3 (SAS Institute Inc., Cary, NC) and Stata version 14.2 (StataCorp LLC, College Station, TX).
RESULTS
We included 47,288,961 hospitalizations in the study, of which 11,231,242 (23.8%) were in the surgery/gynecology cohort, 19,548,711 (41.3%) were in the medicine cohort, 5,433,125 (11.5%) were in the cardiovascular cohort, 8,179,691 (17.3%) were in the cardiorespiratory cohort, and 2,896,192 (6.1%) were in the neurology cohort. The readmission rate was 16.2% (n = 7,642,161) overall, with the highest rates observed in the cardiorespiratory (20.5%) and medicine (17.6%) cohorts and the lowest rates observed in the surgery/gynecology (11.8%) and neurology (13.8%) cohorts.
The final predictive models for each cohort ranged in number of parameters from 56 for the cardiorespiratory cohort to 264 for the surgery/gynecology cohort. The models had AUCs of 0.70, 0.65, 0.67, 0.65, and 0.63 for the surgery/gynecology, medicine, cardiovascular, cardiorespiratory, and neurology cohorts, respectively; AUCs remained fairly stable over time for all disease cohorts (Appendix Table 1).
DISCUSSION
A number of mechanisms may account for the across-the-board improvements in readmission reduction. Many hospitals have instituted system-wide interventions, including patient education, medicine reconciliation, and early postdischarge follow-up,20 which may have reduced readmissions across all patient risk strata. Alternatively, hospitals may have implemented interventions that disproportionally benefited low-risk patients while simultaneously utilizing interventions that only benefited high-risk patients. For instance, increasing threshold for admission7 may have the greatest effect on low-risk patients who could be most easily managed at home, while many intensive transitional care interventions have been developed to target only high-risk patients.21,22
With the introduction of HRRP, there have been a number of concerns about the readmission measure used to penalize hospitals for high readmission rates. One major concern has been that the readmission metric may be flawed in its ability to capture continued improvement related to readmission.23 Some have suggested that with better population health management, admissions will decrease, patient risk of the remaining patients will increase, and hospitals will be increasingly filled with patients who have high likelihood of readmission. This potential for increased risk with HRRP was suggested by a recent study that found that comorbidities increased in hospitalized Medicare beneficiaries between 2010 and 2013.11 Our results were mixed in supporting this potential phenomenon because we examined global risk of readmission and found that some of the cohorts had increased risk over time while others did not. Others have expressed concern that readmission measure does not account for socioeconomic status, which has been associated with readmission rates.24-27 Although we did not directly examine socioeconomic status in our study, we found that hospitals have been able to reduce readmission across all levels of risk, which includes markers of socioeconomic status, including race and Medicaid eligibility status.
Although we hypothesized that readmission risk would increase as number of hospitalizations decreased over time, we found no increase in readmission risk among the cohorts with HRRP diagnoses that had the largest decrease in readmission rates.7,8 Conversely, readmission risk did increase—with a concurrent increase in the proportion of high-risk hospitalizations—in the surgery/gynecology and neurology cohorts that were not subject to HRRP penalties. Nonetheless, rehospitalizations were reduced for all risk categories in these 2 cohorts. Notably, surgery/gynecology and neurology had the lowest readmission rates overall. These findings suggest that initiatives to prevent initial hospitalizations, such as increasing the threshold for postoperative admission, may have had a greater effect on low- versus high-risk patients in low-risk hospitalizations. However, once a patient is hospitalized, multidisciplinary strategies appear to be effective at reducing readmissions for all risk classes in these cohorts.
For the 3 cohorts in which we observed an increase in readmission risk among hospitalized patients, the risk appeared to increase in early 2011. This time was about 10 months after passage of ACA, the timing of which was previously associated with a drop in readmission rates,7,8 but well before HRRP went into effect in October 2012. The increase in readmission risk coincided with an increase in the number of diagnostic codes that could be included on a hospital claim to Medicare.17 This increase in allowable codes allowed us to capture more diagnoses for some patients, potentially resulting in an increase in apparent predicted risk of readmissions. While we adjusted for this in our predictive models, we may not have fully accounted for differences in risk related to coding change. As a result, some of the observed differences in risk in our study may be attributable to coding differences. More broadly, studies demonstrating the success of HRRP have typically examined risk-adjusted rates of readmission.3,7 It is possible that a small portion of the observed reduction in risk-adjusted readmission rates may be related to the increase in predicted risk of readmission observed in our study. Future assessment of trends in readmission during this period should consider accounting for change in the number of allowed billing codes.
Other limitations should be considered in the interpretation of this study. First, like many predictive models for readmission,14 ours had imperfect discrimination, which could affect our results. Second, our study was based on older Medicare patients, so findings may not be applicable to younger patients. Third, while we accounted for surrogates for socioeconomic status, including dual eligibility and race, our models lacked other socioeconomic and community factors that can influence readmission.24-26 Nonetheless, 1 study suggested that easily measured socioeconomic factors may not have a strong influence on the readmission metric used by Medicare.28 Fourth, while our study included over 47 million hospitalizations, our time trend analyses used calendar month as the primary independent variable. As our study included 77 months, we may not have had sufficient power to detect small changes in risk over time.
Medicare readmissions have declined steadily in recent years, presumably at least partly in response to policy changes including HRRP. We found that hospitals have been effective at reducing readmissions across a range of patient risk strata and clinical conditions. As a result, the overall risk of readmission for hospitalized patients has remained constant for some but not all conditions. Whether institutions can continue to reduce readmission rates for most types of patients remains to be seen.
Acknowledgments
This study was supported by the Agency for Healthcare Research and Quality (AHRQ) grant R01HS022882. Dr. Blecker was supported by the AHRQ grant K08HS23683. The authors would like to thank Shawn Hoke and Jane Padikkala for administrative support.
Disclosure
This study was supported by the Agency for Healthcare Research and Quality (AHRQ) grants R01HS022882 and K08HS23683. The authors have no conflicts to report.
1. Jha AK. Seeking Rational Approaches to Fixing Hospital Readmissions. JAMA. 2015;314(16):1681-1682. PubMed
2. Centers for Medicare & Medicaid Services. Readmissions Reduction Program. https://www.cms.gov/Medicare/Medicare-Fee-for-Service-Payment/AcuteInpatientPPS/Readmissions-Reduction-Program.html. Accessed on January 17, 2017.
3. Suter LG, Li SX, Grady JN, et al. National patterns of risk-standardized mortality and readmission after hospitalization for acute myocardial infarction, heart failure, and pneumonia: update on publicly reported outcomes measures based on the 2013 release. J Gen Intern Med. 2014;29(10):1333-1340. PubMed
4. Gerhardt G, Yemane A, Hickman P, Oelschlaeger A, Rollins E, Brennan N. Medicare readmission rates showed meaningful decline in 2012. Medicare Medicaid Res Rev. 2013;3(2):pii:mmrr.003.02.b01. PubMed
5. Centers for Medicare and Medicaid Services. New Data Shows Affordable Care Act Reforms Are Leading to Lower Hospital Readmission Rates for Medicare Beneficiaries. http://blog.cms.gov/2013/12/06/new-data-shows-affordable-care-act-reforms-are-leading-to-lower-hospital-readmission-rates-for-medicare-beneficiaries/. Accessed on January 17, 2017.
6. Krumholz HM, Normand SL, Wang Y. Trends in hospitalizations and outcomes for acute cardiovascular disease and stroke, 1999-2011. Circulation. 2014;130(12):966-975. PubMed
7. Zuckerman RB, Sheingold SH, Orav EJ, Ruhter J, Epstein AM. Readmissions, Observation, and the Hospital Readmissions Reduction Program. N Engl J Med. 2016;374(16):1543-1551. PubMed
8. Desai NR, Ross JS, Kwon JY, et al. Association Between Hospital Penalty Status Under the Hospital Readmission Reduction Program and Readmission Rates for Target and Nontarget Conditions. JAMA. 2016;316(24):2647-2656. PubMed
9. Brock J, Mitchell J, Irby K, et al. Association between quality improvement for care transitions in communities and rehospitalizations among Medicare beneficiaries. JAMA. 2013;309(4):381-391. PubMed
10. Jencks S. Protecting Hospitals That Improve Population Health. http://medicaring.org/2014/12/16/protecting-hospitals/. Accessed on January 5, 2017.
11. Dharmarajan K, Qin L, Lin Z, et al. Declining Admission Rates And Thirty-Day Readmission Rates Positively Associated Even Though Patients Grew Sicker Over Time. Health Aff (Millwood). 2016;35(7):1294-1302. PubMed
12. Krumholz HM, Nuti SV, Downing NS, Normand SL, Wang Y. Mortality, Hospitalizations, and Expenditures for the Medicare Population Aged 65 Years or Older, 1999-2013. JAMA. 2015;314(4):355-365. PubMed
13. Amarasingham R, Moore BJ, Tabak YP, et al. An automated model to identify heart failure patients at risk for 30-day readmission or death using electronic medical record data. Med Care. 2010;48(11):981-988. PubMed
14. Kansagara D, Englander H, Salanitro A, et al. Risk prediction models for hospital readmission: a systematic review. JAMA. 2011;306(15):1688-1698. PubMed
15. Horwitz LI, Partovian C, Lin Z, et al. Development and use of an administrative claims measure for profiling hospital-wide performance on 30-day unplanned readmission. Ann Intern Med. 2014;161(10 Suppl):S66-S75. PubMed
16. 2016 Condition-Specific Measures Updates and Specifications Report Hospital-Level 30-Day Risk-Standardized Readmission Measures. https://www.cms.gov/Medicare/Quality-Initiatives-Patient-Assessment-Instruments/HospitalQualityInits/Downloads/AMI-HF-PN-COPD-and-Stroke-Readmission-Updates.zip. Accessed on January 19, 2017.
17. Centers for Medicare & Medicaid Services. Pub 100-04 Medicare Claims Processing, Transmittal 2028. https://www.cms.gov/Regulations-and-Guidance/Guidance/Transmittals/downloads/R2028CP.pdf. Accessed on November 28, 2016.
18. Martens FK, Tonk EC, Kers JG, Janssens AC. Small improvement in the area under the receiver operating characteristic curve indicated small changes in predicted risks. J Clin Epidemiol. 2016;79:159-164. PubMed
19. Blecker S, Goldfeld K, Park H, et al. Impact of an Intervention to Improve Weekend Hospital Care at an Academic Medical Center: An Observational Study. J Gen Intern Med. 2015;30(11):1657-1664. PubMed
20. Hansen LO, Young RS, Hinami K, Leung A, Williams MV. Interventions to reduce 30-day rehospitalization: a systematic review. Ann Intern Med. 2011;155(8):520-528. PubMed
21. Cavanaugh JJ, Jones CD, Embree G, et al. Implementation Science Workshop: primary care-based multidisciplinary readmission prevention program. J Gen Intern Med. 2014;29(5):798-804. PubMed
22. Jenq GY, Doyle MM, Belton BM, Herrin J, Horwitz LI. Quasi-Experimental Evaluation of the Effectiveness of a Large-Scale Readmission Reduction Program. JAMA Intern Med. 2016;176(5):681-690. PubMed
23. Lynn J, Jencks S. A Dangerous Malfunction in the Measure of Readmission Reduction. http://medicaring.org/2014/08/26/malfunctioning-metrics/. Accessed on January 17, 2017.
24. Calvillo-King L, Arnold D, Eubank KJ, et al. Impact of social factors on risk of readmission or mortality in pneumonia and heart failure: systematic review. J Gen Intern Med. 2013;28(2):269-282. PubMed
25. Barnett ML, Hsu J, McWilliams JM. Patient Characteristics and Differences in Hospital Readmission Rates. JAMA Intern Med. 2015;175(11):1803-1812. PubMed
26. Singh S, Lin YL, Kuo YF, Nattinger AB, Goodwin JS. Variation in the risk of readmission among hospitals: the relative contribution of patient, hospital and inpatient provider characteristics. J Gen Intern Med. 2014;29(4):572-578. PubMed
27. American Hospital Association. American Hospital Association (AHA) Detailed Comments on the Inpatient Prospective Payment System (PPS) Proposed Rule for Fiscal Year (FY) 2016. http://www.aha.org/advocacy-issues/letter/2015/150616-cl-cms1632-p-ipps.pdf. Accessed on January 10, 2017.
28. Bernheim SM, Parzynski CS, Horwitz L, et al. Accounting For Patients’ Socioeconomic Status Does Not Change Hospital Readmission Rates. Health Aff (Millwood). 2016;35(8):1461-1470. PubMed
© 2018 Society of Hospital Medicine