User login
Adverse GERD Outcomes Rare After ALTE
Apparent life‐threatening events (ALTEs) are frightening for the parent/guardian and represent a challenge for the healthcare provider. ALTEs are defined as worrisome episodes of any combination of apnea, color change, change in muscle tone, choking or gagging.1 ALTEs account for 0.6% to 0.8% of emergency department (ED) visits for children <12 months old,2, 3 have an average length of stay (LOS) of 4.4 days and an average cost of $15,000 per hospitalization.4
Gastroesophageal reflux disease (GERD) is common in infancy11 and also is the most commonly (in 31%55% of ALTE cases) attributed cause of ALTE.2, 4, 5 It has been speculated that chemosensitivity to gastric acid results in laryngospasm, bronchospasm, and apnea. However, several small studies have failed to prove a causal link between reflux episodes and apnea.69 Furthermore, although consensus guidelines for GERD have been developed,14 the clinical use of testing for GERD remains highly variable. A study of infants discharged with an ALTE (n = 12,067) from 36 children's hospitals in the United States revealed extensive variability in the use of pH probes and upper gastrointestinal x‐ray series to diagnose GERD.4
The incidence of adverse outcomes associated with GERD after an ALTE remains unknown. It is also unknown whether an association exists between long‐term gastrointestinal (GI) outcomes and testing demonstrative of GERD or a diagnosis of GERD during hospitalization for ALTE. The primary objective of our study was to determine, in patients with an ALTE, the adverse outcomes associated with GERD (failure‐to‐thrive, aspiration pneumonia, and/or anti‐reflux surgery), the incidence of readmission for second ALTE, and death. Our secondary objective was to determine risk factors for adverse outcomes associated with GERD following an ALTE.
METHODS
Design
This was a retrospective cohort study. We reviewed electronic and paper medical charts of all infants <12 months of age admitted for ALTE between January 1, 1999 and December 31, 2003 to Primary Children's Medical Center in Salt Lake City, UT, which serves as the tertiary pediatric center for >1 million children and the primary facility for >270,000 children in Salt Lake County, UT.10 Primary Children's Medical Center is operated by a vertically integrated not‐for‐profit healthcare system (Intermountain Healthcare), which has 20 affiliated hospitals and EDs. The study was approved by the institutional review boards of the University of Utah and Intermountain Healthcare, and the privacy board of Intermountain Healthcare.
Participants
Patients were included if a computer search of ED chief complaint or hospital discharge diagnoses found one or more of the following keywords (or corresponding International Classification of Diseases, Ninth Revision [ICD‐9] codes if applicable): ALTE, altered mental status, apnea, breath‐holding spell, choking, GERD, hypotonia, lethargy, other convulsions, other neurologic diagnosis, other respiratory diagnosis, pallor, seizures, sleep apnea, stiff, syncope, and unresponsiveness. These diagnoses were chosen as potential proxy diagnoses or codes for possible ALTE, as ALTE did not have a corresponding ICD‐9 code at the time of this study.
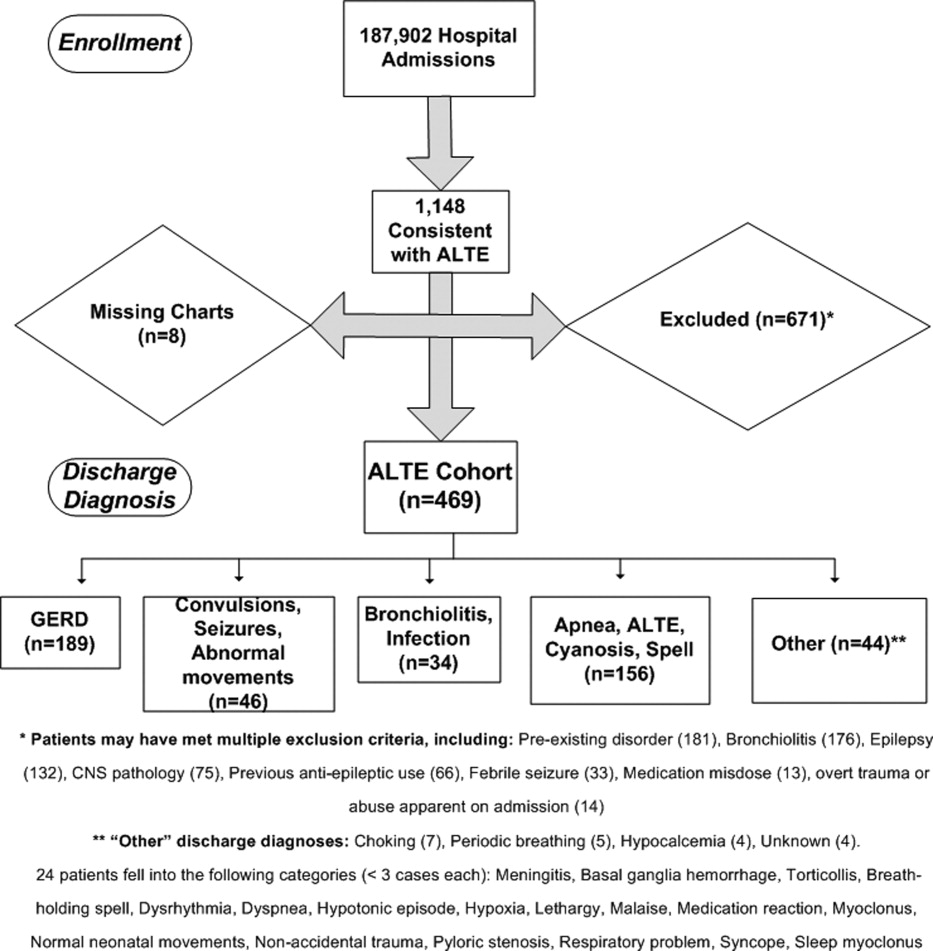
Detailed review of the medical record included infants who were <12 months old at admission with a history consistent with ALTE, defined as an episode frightening to the observer with any combination of apnea, color change, change in muscle tone, choking, or gagging. Infants were excluded from the study if they had a previously documented underlying medical condition to explain the ALTE (such as a known seizure disorder) or had a clearly apparent diagnosis upon initial history and physical examination (such as bronchiolitis diagnosed in the emergency department) that would explain the event. Patients with unstable vital signs (eg, hypotension), trauma clearly apparent on admission, documented medication dosing error, or febrile seizure were also excluded. A complete list of exclusion criteria is found in Figure 1.
All hospital admissions, ED visits, and Pediatric GI clinic notes were reviewed for adverse outcomes associated with GERD, second ALTE admission, and death. The follow‐up time period included the original enrollment period (January 1, 1999 through December 31, 2003) through August 31, 2009.
Outcomes
Adverse outcomes associated with GERD were defined as aspiration pneumonia, failure‐to‐thrive (FTT; either admission or discharge diagnosis of FTT at another hospitalization, or follow‐up to gastroenterology clinic for FTT) and/or anti‐reflux surgery (Nissen fundoplication or gastrojejunal tube placement) as these are potential clinical consequences of having severe and uncontrolled GERD. We further collected readmission data for a second ALTE. Deaths and the attributed reasons were also collected.
Risk Factors
Potential risk factors for adverse outcomes associated with GERD (all during index hospitalization) included: age; prematurity; gender; previous event (as described by the parent, without previous ALTE hospitalization); primary discharge diagnosis of GERD; testing positive for reflux on index ALTE admission (upper GI x‐ray series, esophageal pH probe, swallow study, endoscopy, and/or consultation of pediatric gastroenterologist with results or assessments indicating gastroesophageal reflux); any anti‐reflux medication prescribed upon discharge; and LOS. We also considered diagnosis of neurologic impairment during follow‐up, which was defined as seizures or diagnosis of developmental delay from any etiology not recognized on index ALTE admission. We examined these risk factors as we postulated they might indicate higher risk for both ALTE and adverse outcomes associated with GERD, or might indicate a higher severity of initial event.
Analyses
Summary statistics were performed for adverse outcomes associated with GERD, readmission, and death. Univariate analyses were performed for risk factors using chi‐square tests for dichotomous predictors and Wilcoxon rank sum tests for nonparametric continuous predictors for any of the 3 adverse outcomes (FTT, aspiration pneumonia [AP], and/or anti‐reflux surgery) associated with GERD. All analyses were performed using SAS 9.13 (Carey, NC).
RESULTS
Eleven hundred forty‐eight infants with ALTE met inclusion criteria, from 187,903 patients meeting initial search criteria. Six hundred seventy‐one patients were excluded and 8 patients had missing charts. The study population of the 469‐patient cohort is shown in Figure 1.
Demographics are displayed in Table 1. The mean age was 65 days. One hundred three (22%) were premature. One hundred eighty‐nine patients (40%) had a primary discharge diagnosis of GERD; details of the diagnoses for the remaining patients are in Figure 1. Median length of follow‐up for the cohort was 7.8 years. The entire study period was 10.7 years.
| ALTE Cohort | |
|---|---|
| N = 469 | |
| |
| Female | 233 (49.7%) |
| Race | |
| Caucasian | 371 (79.1%) |
| Hispanic | 64 (13.6%) |
| Pacific Islander | 6 (1.3%) |
| Black | 4 (0.8%) |
| Other/unknown | 24 (5.1%) |
| Mean age in days (SD) | 65.2 (69.5) |
| Prematurity | 103 (22%) |
| Underwent testing for gastroesophageal reflux | 214 (45.6%) |
| Discharged on anti‐reflux medication | 238 (50.7%) |
| Previous event | 127 (27.1%) |
| Mean length of stay in days (SD) | 2.4 (2.4) |
| Later neurologic impairment (seizures or developmental delay) | 23 (4.9%) |
| Primary discharge diagnosis of GERD | 189 (40%) |
Eighteen patients (3.8%) had an adverse outcome associated with GERD. Four (0.9%) had aspiration pneumonia, 9 (1.9%) had failure‐to‐thrive, and 7 (1.5%) had a Nissen fundoplication (no patients had a gastrojejunal tube placed). Five patients had a gastrostomy tube placed at the time of fundoplication. Two patients had more than 1 adverse GI outcome; 1 patient had aspiration pneumonia and another had failure‐to‐thrive prior to their Nissen fundoplications.
Fifty‐six patients (11.9%) were readmitted for a second ALTE. Median time from index ALTE to second ALTE admission was 16.5 days (interquartile range: Q1, 8Q3, 32). Two (0.4%) patients died. Both (occurring at 18 months and 5.5 years after the initial ALTE hospitalization) were related to the children first developing seizure disorders and severe developmental delay. Neither of the patients who died had an index discharge diagnoses of GERD.
There was no significance of the following variables in predicting adverse outcomes associated with GERD: age, prematurity, gender, previous event, testing positive for reflux, primary discharge diagnosis of GERD, or discharge on anti‐reflux medications (see Table 2). Patients with adverse outcomes associated with GERD had longer mean LOS on the index ALTE hospitalization (4.3 days vs 2.4 days; P = 0.03) and a higher rate of neurologic impairment diagnosed in follow‐up (16.7% vs 4.4%; P = 0.02) than patients without long‐term adverse GI outcomes. Patients with neurological impairment diagnosed in follow‐up were more likely to eventually develop an adverse outcome associated with GERD, compared to patients without neurological impairment (odds ratio 8.4; 95% confidence interval 1.1516.1).
| AP, FTT, or Surgery | No Long‐Term Adverse GI Outcome | P Value | |
|---|---|---|---|
| N = 18 | N = 451 | ||
| |||
| Mean age in days (SD) | 51.9 (76.4) | 65.8 (69.3) | 0.27 |
| Prematurity | 1 (5.6%) | 102 (22.6%) | 0.08 |
| Male gender | 12 (66.7%) | 220 (48.8%) | 0.14 |
| Previous ALTE‐like event (no hospitalization) | 8 (44.4%) | 119 (26.4%) | 0.09 |
| Testing positive for reflux | 9 (50%) | 177 (39.3%) | 0.36 |
| Discharge diagnosis GERD | 9 (50%) | 180 (39.9%) | 0.39 |
| Discharged on anti‐reflux medication | 9 (50%) | 229 (50.7%) | 0.95 |
| Mean length of stay in days (SD) | 4.3 (4.7) | 2.4 (2.3) | 0.03 |
| Neurologic impairment diagnosed in follow‐up | 3 (16.7%) | 20 (4.4%) | 0.02 |
DISCUSSION
Our study had 2 main findings. First, infants admitted for an ALTE had a low percentage (3.8%) of adverse outcomes associated with GERD. Review of the literature provides little context to interpret this percentage. One study reports 9 per 100,000 of the general population <18 years of age having anti‐reflux surgery.24 The percentage of adverse outcomes associated with GERD converted to a rate in our study would likely reflect the bias of our center serving as a referral population for Utah and 5 surrounding states. Furthermore, there may be an additional bias of ALTE being a potential indication for anti‐reflux surgery for some clinicians, as well as confounding additional diagnoses (such as later neurologic impairment which might independently increase risk of study outcomes).
The second main finding of our study is that the development of neurologic impairment was predictive of developing adverse GI outcomes. As previous studies have shown that neurological impairment cannot be predicted during the initial ALTE hospitalization,14 adverse outcomes associated with GERD are similarly not predictable with current clinical approaches. Furthermore, the exact nature of the relationship between neurologic impairment and ALTEs remains unclear. While previous studies have described the increased prevalence of adverse neurological outcomes (such as seizures, developmental delay) in children who have had an ALTE, it is unclear what the precipitating reason for ALTE is in these infants (seizure, central apnea, GERD, etc).14
There is ongoing debate in the literature surrounding the optimal diagnosis of GERD in infants with ALTE. Recent guidelines state that investigations aimed to prove GERD causing an ALTE should include pH probe or impedance monitor testing, in combination with a sleep study, and discourages a GERD diagnosis based on upper GI‐series alone.14 Given the low use of pH probe and impedance monitoring at our institution during the study period (86% of the patients who had GI‐related testing had an upper GI‐series), we did not attempt to find the sensitivity or specificity of the different GI testing modalities for GERD in the setting of ALTE. The high use of upper‐GI series is not unique to our institutionone large study examining practice variation from 12,067 ALTE admissions in 36 children's hospitals, with 36.9% of infants (n = 4453) having a primary discharge diagnosis of gastroesophageal reflux, revealed that only 8.9% (SD 28%) received an esophageal pH probe, while 25.6% (SD 43.6%) had an upper GI‐series or swallow study.4
Given the difficulties in assigning a GERD diagnosis for ALTE infants, we focused on the long‐term adverse outcomes associated with GERD for the entire ALTE infant cohort. The 3 adverse outcomes we chose deserve some mention. Aspiration pneumonia is generally due to either primary aspiration (from dysfunctional swallowing) or secondary aspiration (from GERD). Failure‐to‐thrive can be due to ongoing GERD. Anti‐reflux surgery is often performed for severe GERD. While we believe that a prospective study with better diagnostic evaluations for GERD and apnea (such as pH probe or impedance monitor in combination with a sleep study) might help elucidate the unclear relationship between reflux episodes and ALTE, the low percentage of adverse outcomes associated with GERD after ALTE may suggest that such a study would be difficult both in terms of sample size and an unnecessary use of resources.
We also found that a high percentage (11.9%) of all patients had readmission for a second ALTE. This was substantially higher than the 2.5% readmission rate for second ALTE reported in a previous study of short‐term follow‐up (30 days).4 The number of readmissions in our study might be higher due to our comprehensive follow‐up, both in length of time and number of additional EDs and hospitals captured. Unfortunately, the retrospective nature of our study makes it difficult to determine if any interventions (prescription of anti‐reflux medication, education on reflux precautions) impacted the rate of readmission, as compliance was not measurable. Further studies should address why patients return with recurrent ALTE.
Interestingly, several potential risk factors did not predict long‐term adverse GI outcomes. For example, prematurity, a discharge diagnosis of GERD, or prescription of an anti‐reflux medication, were not associated with adverse GI outcomes. These findings support the concept that a diagnosis of GERD, at least as is commonly applied, is not meaningful in the setting of an ALTE. We did find associations with longer length of stay (LOS), and with eventual development of neurological impairment. Longer LOS might be a proxy for other subtle predictors that could influence adverse outcomes, such as requiring additional diagnostic tests prolonging hospitalization, or continued ALTEs while inpatient. The neurologic outcomes of patients with ALTE have been previously published, and the strong correlation between neurologic impairment and GERD has been well described.14, 25
There are several strengths of this study. This is the first study, to our knowledge, to look at adverse outcomes associated with GERD following ALTE, despite GERD being the most commonly attributed cause. The use of Intermountain Healthcare's electronic medical record system allowed for comprehensive tracking, over an extensive follow‐up period (median of 7.8 years), across 20 hospitals and EDs which care for the vast majority of pediatric patients in Utah. Finally, this large cohort of ALTE patients used clinical data from medical records and not only administrative data.
There are limitations of this study. This is a retrospective cohort study. Some of our study outcomes may be a result of pathophysiology other than GERD and, conversely, GERD may be a result of other issues (neurologic impairment). The small sample size and low percentage of the study outcomes make it possible that we did not detect true risk factors. Patients were lost to follow‐up if they moved or presented to a hospital not within the Intermountain Healthcare system. This study has slightly different patient numbers from 3 previously published studies for different outcomes on this cohort, as exclusion criteria for the different cohorts were different.14, 26, 27 Six patients had only their electronic medical record reviewed because the paper chart was missing.
IMPLICATIONS
The results of this study extend previous work of various outcomes regarding well‐appearing infants following an ALTE.14, 26, 27 In these studies, 3.9% and 3% were ultimately diagnosed with epilepsy and developmental delay, respectively; 1.4% were diagnosed with abusive head trauma; and 0.6% required otolaryngologic surgical intervention. In these previous studies, there were few predictors of these outcomes, with testing demonstrating largely normal results during the index ALTE admission.
Our study helps clinicians place the outcomes of aspiration pneumonia, failure‐to‐thrive, and anti‐reflux surgery into the context of these other studies when discharging infants from the hospital after an ALTE. Collectively, these studies provide clinicians with the information that, in the setting of a well‐appearing infant, few diagnostic tests in their ALTE patients will yield a definitive diagnosis. Ultimately, close follow‐up with further investigations if symptoms recur will be an important part of diagnosing the etiology of the ALTE in these infants.
We found that well‐appearing infants with ALTE, regardless of attributed cause, are at low risk for adverse outcomes associated with GERD. Only the eventual development of neurologic impairment or an increased length of stay during index ALTE hospitalization was found to be predictive of these outcomes.
Acknowledgements
The following individuals have made substantive intellectual contributions to this study: conception and design (G.Z., J.L.B., W.D.J., C.G.M., R.S.), acquisition of data (G.Z., J.L.B.), analysis (G.Z., RS) and interpretation of data (G.Z., J.L.B., W.D.J., C.G.M., R.S.). In addition, all listed authors have contributed to either drafting the article or revising it critically for important intellectual content. Finally, all listed authors have given final approval of this version submitted for publication. The authors also acknowledge Chelsea Welch for her assistance in data collection.
Disclosures: This study was presented in part at the national Pediatric Academic Societies meetings in Vancouver, Canada, May 2010 and in Denver, CO, May 2011. This study was supported by a National Institutes of Child Health and Human Development (NICHD) grant for Dr Srivastava (K23 HD052553), and a National Institute on Drug Abuse (NIDA) grant for Dr Bonkowsky (K08 DA24753). This research was supported in part by the Children's Health Research Center, University of Utah. There are no conflicts of interest.
- Infantile apnea and home monitoring.NIH Consensus Statement 1986 Sep 29‐Oct 1.Pediatrics.1987;79(2):292–299.
- ,.Causes of apparent life threatening events in infants: a systematic review.Arch Dis Child.2004;89:1043–1048.
- ,.Parental reported apnea, admissions to hospital and sudden infant death syndrome.Acta Paediatr.2001;90(4):417–422.
- ,,,.Variation in inpatient resource utilization and management of apparent life‐threatening events.J Pediatr.2008;152(5):629–635.
- ,,,,,.Discharge diagnoses in infants with apparent life‐threatening event.Pediatr Int.2003;45:560–563.
- ,,,,,.Lack of temporal relation between acid reflux in the proximal oesophagus and cardiorespiratory events in sleeping infants.Eur J Pediatr.1992;151(3):208–212.
- ,,, et al.Patterns of gastroesophageal reflux (GER) in patients with apparent life‐threatening events.J Pediatr Gastroenterol Nutr.1989;8(2):157–160.
- ,,, et al.Characteristics of continuous esophageal pH‐metering in infants with gastroesophageal reflux and apparent life‐threatening events.Eur J Pediatr Surg.1995;5(3);136–138.
- ,,,,.Apnea is not prolonged by acid gastroesophageal reflux in preterm infants.Pediatrics.2005;116:1059–1063.
- ,.Organizational responses to managed care: issues for academic health centers and implications for pediatric programs.Pediatrics.1998;101(4):805–811.
- ,,, et al.Pediatric gastroesophageal reflux clinical practice guidelines: joint recommendations of the North American Society for Pediatric Gastroenterology, Hepatology and Nutrition (NASPGHAN) and the European Society for Pediatric Gastroenterology, Hepatology and Nutrition (ESPGHAN).J Pediatr Gastroenterol Nutr.2009;49:498–547.
- ,,, et al.Prevalence and natural history of gastroesophageal reflux: pediatric prospective study.Pediatrics.2009;123(3):779–783.
- ,.Systematic review: the estra‐oesophageal symptoms of gastro‐oesophageal reflux disease in children.Aliment Pharmacol Ther.2009;29:258–272.
- ,,,.Death, child abuse, and adverse neurological outcomes of infants after an apparent life‐threatening event.Pediatrics.2008;122:125–131.
- ,,, et al.Abusive head injury as a cause of apparent life‐threatening events in infancy.Arch Pediatr Adolesc Med.2003;157:1011–1015.
- ,,.Accidental and nonaccidental poisonings as a cause of apparent life‐threatening events in infants.Pediatrics.2008;122:e359–e362.
- ,,,.Yield of diagnostic testing in infants who have had an apparent life‐threatening event.Pediatrics.2005;115:885–893.
- ,,, et al.Guidelines for evaluation and treatment of gastroesophageal reflux in infants and children: recommendations of the North American Society for Pediatric Gastroenterology and Nutrition.J Pediatr Gastroenterol Nutr.2001;32(suppl 2):S1–S31.
- ,,,.Comparison of barium radiology with esophageal pH monitoring in the diagnosis of gastroesophageal reflux disease.Am J Gastroenterol.1996;91(6):1181–1195.
- ,,, et al.Gastroesophageal reflux disease: correlation of esophageal pH testing and radiographic finding.Radiology.1992;185:483–486.
- ,,, et al.Gastro‐esophageal reflux demonstrated by radiography in infants less than 1 year of age. Comparison with pH monitoring.Acta Radiol.2003;44:136–138.
- ,,, et al.Double‐blind placebo controlled trial of omeprazole in irritable infants with gastroesophageal reflux.J Pediatr.2003;143:219–223.
- ,,, et al.Clinical predictors of pathological gastro‐oesophageal reflux in infants with persistant distress.J Paediatr Child Health.2006;42:134–139.
- ,,.National trends in the use of anti‐reflux procedures for children.Pediatrics.2006;118:1828–1835.
- ,,, et al.Prevalence and severity of feeding and nutritional problems in children with neurological impairment: Oxford feeding study.Dev Med Child Neurol.2000;42:674–680.
- ,,.Abusive head trauma in children presenting with an apparent life‐threatening event.J Pediatr.2010;157(5):821–825.
- ,,.Usefulness of airway evaluation in children initially seen with apparent life‐threatening event.Arch Otolaryngol Head Neck Surg.2011;137(4):359–362.
Apparent life‐threatening events (ALTEs) are frightening for the parent/guardian and represent a challenge for the healthcare provider. ALTEs are defined as worrisome episodes of any combination of apnea, color change, change in muscle tone, choking or gagging.1 ALTEs account for 0.6% to 0.8% of emergency department (ED) visits for children <12 months old,2, 3 have an average length of stay (LOS) of 4.4 days and an average cost of $15,000 per hospitalization.4
Gastroesophageal reflux disease (GERD) is common in infancy11 and also is the most commonly (in 31%55% of ALTE cases) attributed cause of ALTE.2, 4, 5 It has been speculated that chemosensitivity to gastric acid results in laryngospasm, bronchospasm, and apnea. However, several small studies have failed to prove a causal link between reflux episodes and apnea.69 Furthermore, although consensus guidelines for GERD have been developed,14 the clinical use of testing for GERD remains highly variable. A study of infants discharged with an ALTE (n = 12,067) from 36 children's hospitals in the United States revealed extensive variability in the use of pH probes and upper gastrointestinal x‐ray series to diagnose GERD.4
The incidence of adverse outcomes associated with GERD after an ALTE remains unknown. It is also unknown whether an association exists between long‐term gastrointestinal (GI) outcomes and testing demonstrative of GERD or a diagnosis of GERD during hospitalization for ALTE. The primary objective of our study was to determine, in patients with an ALTE, the adverse outcomes associated with GERD (failure‐to‐thrive, aspiration pneumonia, and/or anti‐reflux surgery), the incidence of readmission for second ALTE, and death. Our secondary objective was to determine risk factors for adverse outcomes associated with GERD following an ALTE.
METHODS
Design
This was a retrospective cohort study. We reviewed electronic and paper medical charts of all infants <12 months of age admitted for ALTE between January 1, 1999 and December 31, 2003 to Primary Children's Medical Center in Salt Lake City, UT, which serves as the tertiary pediatric center for >1 million children and the primary facility for >270,000 children in Salt Lake County, UT.10 Primary Children's Medical Center is operated by a vertically integrated not‐for‐profit healthcare system (Intermountain Healthcare), which has 20 affiliated hospitals and EDs. The study was approved by the institutional review boards of the University of Utah and Intermountain Healthcare, and the privacy board of Intermountain Healthcare.
Participants
Patients were included if a computer search of ED chief complaint or hospital discharge diagnoses found one or more of the following keywords (or corresponding International Classification of Diseases, Ninth Revision [ICD‐9] codes if applicable): ALTE, altered mental status, apnea, breath‐holding spell, choking, GERD, hypotonia, lethargy, other convulsions, other neurologic diagnosis, other respiratory diagnosis, pallor, seizures, sleep apnea, stiff, syncope, and unresponsiveness. These diagnoses were chosen as potential proxy diagnoses or codes for possible ALTE, as ALTE did not have a corresponding ICD‐9 code at the time of this study.
Detailed review of the medical record included infants who were <12 months old at admission with a history consistent with ALTE, defined as an episode frightening to the observer with any combination of apnea, color change, change in muscle tone, choking, or gagging. Infants were excluded from the study if they had a previously documented underlying medical condition to explain the ALTE (such as a known seizure disorder) or had a clearly apparent diagnosis upon initial history and physical examination (such as bronchiolitis diagnosed in the emergency department) that would explain the event. Patients with unstable vital signs (eg, hypotension), trauma clearly apparent on admission, documented medication dosing error, or febrile seizure were also excluded. A complete list of exclusion criteria is found in Figure 1.
All hospital admissions, ED visits, and Pediatric GI clinic notes were reviewed for adverse outcomes associated with GERD, second ALTE admission, and death. The follow‐up time period included the original enrollment period (January 1, 1999 through December 31, 2003) through August 31, 2009.
Outcomes
Adverse outcomes associated with GERD were defined as aspiration pneumonia, failure‐to‐thrive (FTT; either admission or discharge diagnosis of FTT at another hospitalization, or follow‐up to gastroenterology clinic for FTT) and/or anti‐reflux surgery (Nissen fundoplication or gastrojejunal tube placement) as these are potential clinical consequences of having severe and uncontrolled GERD. We further collected readmission data for a second ALTE. Deaths and the attributed reasons were also collected.
Risk Factors
Potential risk factors for adverse outcomes associated with GERD (all during index hospitalization) included: age; prematurity; gender; previous event (as described by the parent, without previous ALTE hospitalization); primary discharge diagnosis of GERD; testing positive for reflux on index ALTE admission (upper GI x‐ray series, esophageal pH probe, swallow study, endoscopy, and/or consultation of pediatric gastroenterologist with results or assessments indicating gastroesophageal reflux); any anti‐reflux medication prescribed upon discharge; and LOS. We also considered diagnosis of neurologic impairment during follow‐up, which was defined as seizures or diagnosis of developmental delay from any etiology not recognized on index ALTE admission. We examined these risk factors as we postulated they might indicate higher risk for both ALTE and adverse outcomes associated with GERD, or might indicate a higher severity of initial event.
Analyses
Summary statistics were performed for adverse outcomes associated with GERD, readmission, and death. Univariate analyses were performed for risk factors using chi‐square tests for dichotomous predictors and Wilcoxon rank sum tests for nonparametric continuous predictors for any of the 3 adverse outcomes (FTT, aspiration pneumonia [AP], and/or anti‐reflux surgery) associated with GERD. All analyses were performed using SAS 9.13 (Carey, NC).
RESULTS
Eleven hundred forty‐eight infants with ALTE met inclusion criteria, from 187,903 patients meeting initial search criteria. Six hundred seventy‐one patients were excluded and 8 patients had missing charts. The study population of the 469‐patient cohort is shown in Figure 1.
Demographics are displayed in Table 1. The mean age was 65 days. One hundred three (22%) were premature. One hundred eighty‐nine patients (40%) had a primary discharge diagnosis of GERD; details of the diagnoses for the remaining patients are in Figure 1. Median length of follow‐up for the cohort was 7.8 years. The entire study period was 10.7 years.
| ALTE Cohort | |
|---|---|
| N = 469 | |
| |
| Female | 233 (49.7%) |
| Race | |
| Caucasian | 371 (79.1%) |
| Hispanic | 64 (13.6%) |
| Pacific Islander | 6 (1.3%) |
| Black | 4 (0.8%) |
| Other/unknown | 24 (5.1%) |
| Mean age in days (SD) | 65.2 (69.5) |
| Prematurity | 103 (22%) |
| Underwent testing for gastroesophageal reflux | 214 (45.6%) |
| Discharged on anti‐reflux medication | 238 (50.7%) |
| Previous event | 127 (27.1%) |
| Mean length of stay in days (SD) | 2.4 (2.4) |
| Later neurologic impairment (seizures or developmental delay) | 23 (4.9%) |
| Primary discharge diagnosis of GERD | 189 (40%) |
Eighteen patients (3.8%) had an adverse outcome associated with GERD. Four (0.9%) had aspiration pneumonia, 9 (1.9%) had failure‐to‐thrive, and 7 (1.5%) had a Nissen fundoplication (no patients had a gastrojejunal tube placed). Five patients had a gastrostomy tube placed at the time of fundoplication. Two patients had more than 1 adverse GI outcome; 1 patient had aspiration pneumonia and another had failure‐to‐thrive prior to their Nissen fundoplications.
Fifty‐six patients (11.9%) were readmitted for a second ALTE. Median time from index ALTE to second ALTE admission was 16.5 days (interquartile range: Q1, 8Q3, 32). Two (0.4%) patients died. Both (occurring at 18 months and 5.5 years after the initial ALTE hospitalization) were related to the children first developing seizure disorders and severe developmental delay. Neither of the patients who died had an index discharge diagnoses of GERD.
There was no significance of the following variables in predicting adverse outcomes associated with GERD: age, prematurity, gender, previous event, testing positive for reflux, primary discharge diagnosis of GERD, or discharge on anti‐reflux medications (see Table 2). Patients with adverse outcomes associated with GERD had longer mean LOS on the index ALTE hospitalization (4.3 days vs 2.4 days; P = 0.03) and a higher rate of neurologic impairment diagnosed in follow‐up (16.7% vs 4.4%; P = 0.02) than patients without long‐term adverse GI outcomes. Patients with neurological impairment diagnosed in follow‐up were more likely to eventually develop an adverse outcome associated with GERD, compared to patients without neurological impairment (odds ratio 8.4; 95% confidence interval 1.1516.1).
| AP, FTT, or Surgery | No Long‐Term Adverse GI Outcome | P Value | |
|---|---|---|---|
| N = 18 | N = 451 | ||
| |||
| Mean age in days (SD) | 51.9 (76.4) | 65.8 (69.3) | 0.27 |
| Prematurity | 1 (5.6%) | 102 (22.6%) | 0.08 |
| Male gender | 12 (66.7%) | 220 (48.8%) | 0.14 |
| Previous ALTE‐like event (no hospitalization) | 8 (44.4%) | 119 (26.4%) | 0.09 |
| Testing positive for reflux | 9 (50%) | 177 (39.3%) | 0.36 |
| Discharge diagnosis GERD | 9 (50%) | 180 (39.9%) | 0.39 |
| Discharged on anti‐reflux medication | 9 (50%) | 229 (50.7%) | 0.95 |
| Mean length of stay in days (SD) | 4.3 (4.7) | 2.4 (2.3) | 0.03 |
| Neurologic impairment diagnosed in follow‐up | 3 (16.7%) | 20 (4.4%) | 0.02 |
DISCUSSION
Our study had 2 main findings. First, infants admitted for an ALTE had a low percentage (3.8%) of adverse outcomes associated with GERD. Review of the literature provides little context to interpret this percentage. One study reports 9 per 100,000 of the general population <18 years of age having anti‐reflux surgery.24 The percentage of adverse outcomes associated with GERD converted to a rate in our study would likely reflect the bias of our center serving as a referral population for Utah and 5 surrounding states. Furthermore, there may be an additional bias of ALTE being a potential indication for anti‐reflux surgery for some clinicians, as well as confounding additional diagnoses (such as later neurologic impairment which might independently increase risk of study outcomes).
The second main finding of our study is that the development of neurologic impairment was predictive of developing adverse GI outcomes. As previous studies have shown that neurological impairment cannot be predicted during the initial ALTE hospitalization,14 adverse outcomes associated with GERD are similarly not predictable with current clinical approaches. Furthermore, the exact nature of the relationship between neurologic impairment and ALTEs remains unclear. While previous studies have described the increased prevalence of adverse neurological outcomes (such as seizures, developmental delay) in children who have had an ALTE, it is unclear what the precipitating reason for ALTE is in these infants (seizure, central apnea, GERD, etc).14
There is ongoing debate in the literature surrounding the optimal diagnosis of GERD in infants with ALTE. Recent guidelines state that investigations aimed to prove GERD causing an ALTE should include pH probe or impedance monitor testing, in combination with a sleep study, and discourages a GERD diagnosis based on upper GI‐series alone.14 Given the low use of pH probe and impedance monitoring at our institution during the study period (86% of the patients who had GI‐related testing had an upper GI‐series), we did not attempt to find the sensitivity or specificity of the different GI testing modalities for GERD in the setting of ALTE. The high use of upper‐GI series is not unique to our institutionone large study examining practice variation from 12,067 ALTE admissions in 36 children's hospitals, with 36.9% of infants (n = 4453) having a primary discharge diagnosis of gastroesophageal reflux, revealed that only 8.9% (SD 28%) received an esophageal pH probe, while 25.6% (SD 43.6%) had an upper GI‐series or swallow study.4
Given the difficulties in assigning a GERD diagnosis for ALTE infants, we focused on the long‐term adverse outcomes associated with GERD for the entire ALTE infant cohort. The 3 adverse outcomes we chose deserve some mention. Aspiration pneumonia is generally due to either primary aspiration (from dysfunctional swallowing) or secondary aspiration (from GERD). Failure‐to‐thrive can be due to ongoing GERD. Anti‐reflux surgery is often performed for severe GERD. While we believe that a prospective study with better diagnostic evaluations for GERD and apnea (such as pH probe or impedance monitor in combination with a sleep study) might help elucidate the unclear relationship between reflux episodes and ALTE, the low percentage of adverse outcomes associated with GERD after ALTE may suggest that such a study would be difficult both in terms of sample size and an unnecessary use of resources.
We also found that a high percentage (11.9%) of all patients had readmission for a second ALTE. This was substantially higher than the 2.5% readmission rate for second ALTE reported in a previous study of short‐term follow‐up (30 days).4 The number of readmissions in our study might be higher due to our comprehensive follow‐up, both in length of time and number of additional EDs and hospitals captured. Unfortunately, the retrospective nature of our study makes it difficult to determine if any interventions (prescription of anti‐reflux medication, education on reflux precautions) impacted the rate of readmission, as compliance was not measurable. Further studies should address why patients return with recurrent ALTE.
Interestingly, several potential risk factors did not predict long‐term adverse GI outcomes. For example, prematurity, a discharge diagnosis of GERD, or prescription of an anti‐reflux medication, were not associated with adverse GI outcomes. These findings support the concept that a diagnosis of GERD, at least as is commonly applied, is not meaningful in the setting of an ALTE. We did find associations with longer length of stay (LOS), and with eventual development of neurological impairment. Longer LOS might be a proxy for other subtle predictors that could influence adverse outcomes, such as requiring additional diagnostic tests prolonging hospitalization, or continued ALTEs while inpatient. The neurologic outcomes of patients with ALTE have been previously published, and the strong correlation between neurologic impairment and GERD has been well described.14, 25
There are several strengths of this study. This is the first study, to our knowledge, to look at adverse outcomes associated with GERD following ALTE, despite GERD being the most commonly attributed cause. The use of Intermountain Healthcare's electronic medical record system allowed for comprehensive tracking, over an extensive follow‐up period (median of 7.8 years), across 20 hospitals and EDs which care for the vast majority of pediatric patients in Utah. Finally, this large cohort of ALTE patients used clinical data from medical records and not only administrative data.
There are limitations of this study. This is a retrospective cohort study. Some of our study outcomes may be a result of pathophysiology other than GERD and, conversely, GERD may be a result of other issues (neurologic impairment). The small sample size and low percentage of the study outcomes make it possible that we did not detect true risk factors. Patients were lost to follow‐up if they moved or presented to a hospital not within the Intermountain Healthcare system. This study has slightly different patient numbers from 3 previously published studies for different outcomes on this cohort, as exclusion criteria for the different cohorts were different.14, 26, 27 Six patients had only their electronic medical record reviewed because the paper chart was missing.
IMPLICATIONS
The results of this study extend previous work of various outcomes regarding well‐appearing infants following an ALTE.14, 26, 27 In these studies, 3.9% and 3% were ultimately diagnosed with epilepsy and developmental delay, respectively; 1.4% were diagnosed with abusive head trauma; and 0.6% required otolaryngologic surgical intervention. In these previous studies, there were few predictors of these outcomes, with testing demonstrating largely normal results during the index ALTE admission.
Our study helps clinicians place the outcomes of aspiration pneumonia, failure‐to‐thrive, and anti‐reflux surgery into the context of these other studies when discharging infants from the hospital after an ALTE. Collectively, these studies provide clinicians with the information that, in the setting of a well‐appearing infant, few diagnostic tests in their ALTE patients will yield a definitive diagnosis. Ultimately, close follow‐up with further investigations if symptoms recur will be an important part of diagnosing the etiology of the ALTE in these infants.
We found that well‐appearing infants with ALTE, regardless of attributed cause, are at low risk for adverse outcomes associated with GERD. Only the eventual development of neurologic impairment or an increased length of stay during index ALTE hospitalization was found to be predictive of these outcomes.
Acknowledgements
The following individuals have made substantive intellectual contributions to this study: conception and design (G.Z., J.L.B., W.D.J., C.G.M., R.S.), acquisition of data (G.Z., J.L.B.), analysis (G.Z., RS) and interpretation of data (G.Z., J.L.B., W.D.J., C.G.M., R.S.). In addition, all listed authors have contributed to either drafting the article or revising it critically for important intellectual content. Finally, all listed authors have given final approval of this version submitted for publication. The authors also acknowledge Chelsea Welch for her assistance in data collection.
Disclosures: This study was presented in part at the national Pediatric Academic Societies meetings in Vancouver, Canada, May 2010 and in Denver, CO, May 2011. This study was supported by a National Institutes of Child Health and Human Development (NICHD) grant for Dr Srivastava (K23 HD052553), and a National Institute on Drug Abuse (NIDA) grant for Dr Bonkowsky (K08 DA24753). This research was supported in part by the Children's Health Research Center, University of Utah. There are no conflicts of interest.
- Infantile apnea and home monitoring.NIH Consensus Statement 1986 Sep 29‐Oct 1.Pediatrics.1987;79(2):292–299.
- ,.Causes of apparent life threatening events in infants: a systematic review.Arch Dis Child.2004;89:1043–1048.
- ,.Parental reported apnea, admissions to hospital and sudden infant death syndrome.Acta Paediatr.2001;90(4):417–422.
- ,,,.Variation in inpatient resource utilization and management of apparent life‐threatening events.J Pediatr.2008;152(5):629–635.
- ,,,,,.Discharge diagnoses in infants with apparent life‐threatening event.Pediatr Int.2003;45:560–563.
- ,,,,,.Lack of temporal relation between acid reflux in the proximal oesophagus and cardiorespiratory events in sleeping infants.Eur J Pediatr.1992;151(3):208–212.
- ,,, et al.Patterns of gastroesophageal reflux (GER) in patients with apparent life‐threatening events.J Pediatr Gastroenterol Nutr.1989;8(2):157–160.
- ,,, et al.Characteristics of continuous esophageal pH‐metering in infants with gastroesophageal reflux and apparent life‐threatening events.Eur J Pediatr Surg.1995;5(3);136–138.
- ,,,,.Apnea is not prolonged by acid gastroesophageal reflux in preterm infants.Pediatrics.2005;116:1059–1063.
- ,.Organizational responses to managed care: issues for academic health centers and implications for pediatric programs.Pediatrics.1998;101(4):805–811.
- ,,, et al.Pediatric gastroesophageal reflux clinical practice guidelines: joint recommendations of the North American Society for Pediatric Gastroenterology, Hepatology and Nutrition (NASPGHAN) and the European Society for Pediatric Gastroenterology, Hepatology and Nutrition (ESPGHAN).J Pediatr Gastroenterol Nutr.2009;49:498–547.
- ,,, et al.Prevalence and natural history of gastroesophageal reflux: pediatric prospective study.Pediatrics.2009;123(3):779–783.
- ,.Systematic review: the estra‐oesophageal symptoms of gastro‐oesophageal reflux disease in children.Aliment Pharmacol Ther.2009;29:258–272.
- ,,,.Death, child abuse, and adverse neurological outcomes of infants after an apparent life‐threatening event.Pediatrics.2008;122:125–131.
- ,,, et al.Abusive head injury as a cause of apparent life‐threatening events in infancy.Arch Pediatr Adolesc Med.2003;157:1011–1015.
- ,,.Accidental and nonaccidental poisonings as a cause of apparent life‐threatening events in infants.Pediatrics.2008;122:e359–e362.
- ,,,.Yield of diagnostic testing in infants who have had an apparent life‐threatening event.Pediatrics.2005;115:885–893.
- ,,, et al.Guidelines for evaluation and treatment of gastroesophageal reflux in infants and children: recommendations of the North American Society for Pediatric Gastroenterology and Nutrition.J Pediatr Gastroenterol Nutr.2001;32(suppl 2):S1–S31.
- ,,,.Comparison of barium radiology with esophageal pH monitoring in the diagnosis of gastroesophageal reflux disease.Am J Gastroenterol.1996;91(6):1181–1195.
- ,,, et al.Gastroesophageal reflux disease: correlation of esophageal pH testing and radiographic finding.Radiology.1992;185:483–486.
- ,,, et al.Gastro‐esophageal reflux demonstrated by radiography in infants less than 1 year of age. Comparison with pH monitoring.Acta Radiol.2003;44:136–138.
- ,,, et al.Double‐blind placebo controlled trial of omeprazole in irritable infants with gastroesophageal reflux.J Pediatr.2003;143:219–223.
- ,,, et al.Clinical predictors of pathological gastro‐oesophageal reflux in infants with persistant distress.J Paediatr Child Health.2006;42:134–139.
- ,,.National trends in the use of anti‐reflux procedures for children.Pediatrics.2006;118:1828–1835.
- ,,, et al.Prevalence and severity of feeding and nutritional problems in children with neurological impairment: Oxford feeding study.Dev Med Child Neurol.2000;42:674–680.
- ,,.Abusive head trauma in children presenting with an apparent life‐threatening event.J Pediatr.2010;157(5):821–825.
- ,,.Usefulness of airway evaluation in children initially seen with apparent life‐threatening event.Arch Otolaryngol Head Neck Surg.2011;137(4):359–362.
Copyright © 2012 Society of Hospital Medicine

Delays in Pediatric Discharge
Inpatient pediatrics is undergoing a paradigm shift in at least 3 ways. First, more children with chronic disease are being cared for in the hospital over time.1 Second, previous inpatient conditions are treated at home with advancing technology such as peripherally‐inserted catheters.2 Third, there are new areas of growing specialization, such as hospital medicine, in which the practitioners deliver more efficient care.3, 4
Nationwide, there is increasing pressure to improve inpatient quality of care. The Institute of Medicine defines 6 aims for improvement, including timeliness (reducing waits and sometimes harmful delays for both those who receive and those who give care) and efficiency of care (avoiding waste, including waste of equipment, supplies, ideas, and energy).5 Reducing unnecessary stays in the hospital is a potential quality measure that hospitals may use to address the timeliness and efficiency of care delivered to hospitalized children.
Delays in discharge have been used as markers of unnecessary stays in the hospital for inpatient adult and pediatric care,6, 7 but these are limited to inpatient systems from almost 20 years ago. Current reasons why patients are delayed from discharge, if at all, are not well described. We undertook this study to describe delays in hospital discharges at a tertiary‐care children's hospital in terms of number of patients, length of days of delay, and type of delay. In addition, we sought to characterize the impact of discharge delays on overall length of stay (LOS) and costs.
Methods
Patient Population/Study Design
All children cared for on 2 pediatric medical teams at Primary Children's Medical Center during the month of August 2004 were eligible for the study. Two research assistants independently attended team rounds and collected data relating to: the reasons for ongoing hospitalization, pending items (eg, consultations, tests), and the plan of care for that day. The research assistants each attended daily team rounds for the entire month of August (1 for each team, switching to the opposite team after 2 weeks). This was combined with information available in the Patient Tracker, a software tool developed to improve communication between caregivers and improve discharge efficiency.8 This software tool details diagnoses, daily medical care plans, discharge criteria, and ongoing medical interventions while tracking daily changes in interventions and the medical care plan for each patient cared for on a pediatric medical team.
The research assistants subsequently presented their observations along with information from Patient Tracker to 2 experienced physicians (R.S. and B.S.) who independently determined if a delay occurred, the number of delay days extending discharge, and the cause of the delay, if present, categorized according to the taxonomy of the Delay Tool.6, 7 If there was not enough information for either of the physicians to identify and classify a delay, the electronic medical record of the patient was also reviewed. Discrepancies between physicians assigning delays were discussed until consensus was reached.
The study was approved by the Institutional Review Board of the University of Utah Health Sciences Center and Primary Children's Medical Center (PCMC).
Setting
PCMC is a 233‐bed tertiary‐care children's hospital, owned and operated by Intermountain Healthcare (a not‐for‐profit vertically integrated managed care organization) in the Intermountain West, which serves as both the primary hospital for Salt Lake County and as a tertiary‐care children's hospital for 5 states (UT, MT, WY, ID, and NV).9
Study Definitions
Delay and Length of Delay
Delays in discharge were measured using a validated and reliable instrument, the Delay Tool.6, 7 A discharge was classified as delayed if there was no medical reason for the patient to be in the hospital on a given day, identical to the definition used in the original studies to validate the tool. Delays were recorded as whole days, not fractions of days or hours, as described in the original validation of the tool. For example, if the medical team requested a consultation, and the consultant's opinion was rendered late, but the patient would have remained in the hospital anyway, then this period of time would not count as a delay. However, if the medical team did not receive a consultant's opinion within the standard time (24 hours as defined for this study and in validating studies for the Delay Tool), and the patient's sole reason for being in the hospital during that day was waiting for that opinion, then that period of time would count toward a delay due to a late consultative opinion. Delays of less than 1 day, due to the mechanics of discharging a patient from the hospital (providing prescriptions, follow up, communication, arranging home health, and transportation) were not measured in this study, to match the original methodology of the Delay Tool.
Type of Delay
Primary reason for delay was assigned according to the taxonomy of the Delay Tool.6, 7 Delays were categorized to 1 of the following: (1) test scheduling; (2) obtaining test results; (3) surgery; (4) consultation; (5) patient (eg, family unavailable for decision‐making); (6) physician responsibility; (7) education, training. or research; (8) discharge planning or scheduling; and (9) availability of outside care and resources. There are 166 subcategories that clarify why a delay occurred. For example, within the main category of obtaining test results (2), there are 3 subcategories of delays related to problem in executing the test (2.1), return of results is delayed (2.2), and test results not reviewed within standard time of return (2.3). Subcategories are further divided to provide detail on the cause of delay. For example, a delay categorized as a 2.1:1 [(2) obtaining test results; (2.1) problem in executing the test; and 2.1:1 test to be done by MD is delayed beyond day desired], or 2.3:1 [(2) obtaining test results; (2.3) test results not reviewed within standard time of return; and 2.3:1 delay because physician did not review results]) both relate to physician causes of delays within the general category of obtaining test results. Some delays had more than 1 cause. A secondary cause of delay was assigned if applicable; however, the number of days delayed was attributed to the primary cause for analysis purposes.
Exemptions to Delay and Special Populations
Certain subpopulations of patients presented unique issues that led to them being unlikely to be classified as having a delay. For example, patients with a diagnosis of new onset of type 1 diabetes are historically admitted for 3 days at our hospital, which includes a specific education program; delays were not considered until this minimum period had passed. Children with medically complex care (eg, multisystem disease, multiple specialists involved, multiple medications) were included in this study.10 However, these children with frequent hospital admission were often fragile at discharge, and could meet criteria for readmission even on the date of their discharge, hence assigning a delay day was usually not indicated because of easily justified ongoing medical need for hospitalization.
Study Variables
The LOS, total costs, and routine demographic and administrative data for each study patient were extracted from Intermountain Healthcare's Enterprise Data Warehouse (EDW). The EDW contains detailed data about the cost of providing health care. Costs were derived from the hospital's cost accounting program, the Standard Cost Master, which is a transaction‐based microcosting accounting system.1113
For patients whose LOS extended before August 1 or after August 31, total hospital costs were averaged per day, and only days falling inside the month of August were counted in calculating the impact the delays in discharge had on the total costs of hospitalization. Hospital days that extended outside of August were not counted in either the numerator for potential days of delay or in the denominator for total days in the hospital.
Analyses
Descriptive statistics were calculated for the number, length of days of delay, and type of delay. Interrater reliability to assign a delay was ascertained for the 2 physicians. Mean LOS, mean total costs, and standard deviations (SDs) were calculated. All analyses were performed using Statistical Analytical Software version 9.13 (SAS Institute, Cary, NC).
Results
During the 31 days of the study, 171 patients occupied hospital beds an average of 7.3 days on the 2 inpatient medical teams, for a total of 911 inpatient days. Seven patients were admitted prior to August 1; 6 of these were discharged during the month of August and 1 stayed through the entire month and was discharged in September. Three additional patients were admitted in August and discharged in September. There were 6 readmissions during the month of August, and 1 patient was excluded from the study because of lack of sufficient information. All patients with delays were able to be classified according to the Delay Tool taxonomy. Interrater reliability for the 2 study physicians was 98%.
The characteristics between the patients who did and did not experience a delay in discharge are shown in Table 1. Thirty‐nine of 171 patients (22.8%), experienced at least 1 delay day. Eighteen of 39 patients had only 1 delay day (46.2%) and 11 patients experienced 2 delayed days (28.2%) (Figure 1). The average length of delay was 2.1 days.

| Nondelayed Patients (N = 132) | Delayed Patients (N = 39) | P Value | |
|---|---|---|---|
| |||
| Age (months), mean (SD)* | 22.6 (14.4) | 15.0 (14.6) | 0.009 |
| LOS during August (days), mean (SD)* | 4.64 (6.1) | 7.64 (7.15) | <0.001 |
| Total costs during August ($), mean (SD)* | 10,451 (19,254) | 14,341 (16,241) | 0.002 |
| Number of ICD‐9 CM diagnoses codes, mean (SD)* | 7.1 (7.4) | 8.5 (7.3) | 0.056 |
| Number of ICD‐9 CM procedure codes, mean (SD)* | 1.7 (3.8) | 1.6 (2.6) | 0.068 |
| Number of Patients with APR‐DRG SOI 3 (%) | 59 (44.7%) | 19 (48.7%) | 0.65 |
Delays attributed to physician responsibility accounted for 42.3% (16.5/39) of patient delays (conservative management or clinical decision‐making), with discharge planning delays accounting for 21.8% (family‐related, patient‐related, and hospital‐related problems), consultation for 14.1% (delay in obtaining or lack of follow‐up), test scheduling for 12.8%, and obtaining test results for 5.1% (ordering and weekend scheduling). There were no primary delays due to surgery, education and research, or unavailability of outside resources such as a skilled nursing bed. Four patients had a single additional secondary cause of delay assigned to them, related to physician responsibility, consultation, surgery and test scheduling; these were split, attributing 0.5 patients to each delay type (thus, the 17/39 patients delayed for physician responsibility was analyzed as 16.5/39) (Table 2).
| Delay Category | Number of Patients Experiencing Delays* | Percentage of All Patients Experiencing Delays (%) | Percentage of Study Patients Observed (%) | Total Delay Days | Average Length of Delays (days) | Percentage of Hospital Days That Were Delay Days (%) |
|---|---|---|---|---|---|---|
| ||||||
| 1. Scheduling | 5 | 12.8 | 2.92 | 16 | 3.20 | 1.76 |
| 2. Obtaining results | 2 | 5.1 | 1.17 | 3 | 1.50 | 0.33 |
| 3. Surgery | 0.5 | 1.3 | 0.29 | 1.5 | 3.00 | 0.16 |
| 4. Consultation | 5.5 | 14.1 | 3.22 | 10.5 | 1.91 | 1.15 |
| 5. Patient | 1 | 2.6 | 0.58 | 2 | 2.00 | 0.22 |
| 6. Physician | 16.5 | 42.3 | 9.65 | 33.5 | 2.03 | 3.68 |
| 7. Education | 0 | 0 | 0.00 | 0 | 0 | 0.00 |
| 8. Discharge | 8.5 | 21.8 | 4.97 | 15.5 | 1.82 | 1.70 |
| 9. Outside | 0 | 0 | 0.00 | 0 | 0 | 0.00 |
| Total | 39 | 100 | 22.81 | 82 | 2.10 | 9.00 |
There were 82 delay‐related hospital days of 911 total inpatient days on the 2 medical teams for August 2004 (9%). More than $170,000 in excess costs was incurred due to delay days from a total of approximately 1.9 million dollars in patient costs for the month (8.9%).
Discussion
This study finds that discharge delays in a tertiary care children's hospital are common; almost 1 in 4 patients experienced a medically unnecessary excess hospital stay of at least 1 day. The average length of a delay was 2.1 days, and overall, delays consumed 9% of pediatric hospital days and 8.9% of total costs. The most common reason for a delay was related to physician clinical care, including excessively conservative management and variability in clinical decision‐making.
Our study results are similar to the other 2 published studies that use the Delay Tool. In the adult and pediatric studies, between 10% and 30% of patients experienced a delay in discharge, with the average length of delay between 2.9 and 3 days.6, 7 Although both studies were conducted at teaching hospitals, what is particularly interesting is that they were conducted almost 20 years ago. During this period of time, there has been a shift in the inpatient pediatric patient population. In recent years, children who are cared for in the hospital have more chronic illnesses.1 In addition, there has been a shift in the types of conditions that may be cared for at home and those that now require inpatient stay.2 Despite this, delays continue at a similar proportion, but the cause of delays have shifted from scheduling and consultation to physician responsibility.
There is another tool in the literature which is more widely used, the Pediatric Appropriateness Evaluation Protocol (PAEP), which is based on the Appropriateness Evaluation Protocol for adults.1417 This tool is used to determine the appropriateness of ongoing hospitalization, not the cause of delay if ongoing hospitalization is inappropriate. The 3 areas that are evaluated (medical services, nursing and ancillary services, and patient's condition) have objective criteria that dictate if the hospitalization is appropriate or not (eg, parenteral (intravenous) therapy for at least 8 hours on that day, under nursing and ancillary services). The PAEP may be less sensitive given today's healthcare resource utilization climate. Many clinicians and families would agree that insertion of a peripheral central catheter is an acceptable form of outpatient treatment for many pediatric conditions. In conjunction with the Delay Tool, the PAEP could be used to determine if a delay occurred, then the Delay Tool used to categorize the cause of the delay. We choose to use expert clinician judgment to determine if a delay had occurred. We were more interested in why patients who are admitted (appropriately or inappropriately) cannot be discharged sooner, thus allowing for future intervention studies targeted to impact delays in discharge, as elucidated in this study. The Delay Tool specifically allowed us to categorize the reasons for delays. Given that the average LOS for patients in the nondelayed group was over 4 days, despite not using a tool such as the PAEP, we believe that these were likely to be appropriate admissions.
A recent study reported the first use of the Medical Care Appropriateness Protocol (MCAP) in a tertiary‐care children's hospital. The authors used the MCAP to determine the impact of an intervention on reducing inappropriate hospitals days for children. This tool is similarly labor‐intensive to the Delay Tool. Interestingly, this Canadian study found a high rate of inappropriate hospital days (47%), which may be in part attributable to a different outcome measurement tool and/or a different health care system.18
There are several limitations to our study that deserve mention. The Delay Tool requires clinician judgment regarding whether or not there was a delay in discharge for that day. We may have introduced some bias in our study, as hospitalist investigators assigned the delay and blinding to the attending physician specialty of record was not feasible. However, our results are similar to the other 2 published studies that have used this tool, and we specifically chose not to analyze or report results in terms of hospitalist and nonhospitalist attending physicians. The Delay Tool is not designed to differentiate shorter delays in terms of hours instead of days (eg, due to the inability for the patient to get a ride home). Shorter delays may be of particular importance depending on the occupancy rate of the hospital, the demand for beds, and other patient and hospital factors. We could not capture these shorter delays (although they did occur frequently) due to the original description of the Delay Tool. In addition, we would not have been able to report data on the impact on LOS and costs, as these are attributed to whole days in the hospital. However, if we had been able to differentiate shorter delays, this would bias our results to show a greater percentage of delays over smaller increments of time. Generalizability is an issue, given that this was a single‐center study. This study sample included over 80 different attending physicians participating in community pediatrician, subspecialty, and hospitalist practice groups. However, the patient population at PCMC is similar to other medium and large children's hospitals in the United States. The month observed may not reflect the entire year of hospitalizationsthere may be seasonal variations with delays depending on the volume and type of illness seen. The study was conducted in August, when there are newer house staff present. However, physician responsibility, which was the largest source of delays in our study, had little attribution to house staff. Most of the decisions were those of attending physicians, which would largely be unaffected by the time of year of the study. Finally, we were unable to assess the safety of the potential earlier discharge, as this was an observational study. However, in any future intervention studies examining processes to discharge patients sooner, measures of safety to the patient are a necessity. Finally, given the potential of ongoing admission, even on the date of discharge of our most fragile patients, this approach to discovering causes of delay may not apply to this important group, which is responsible for significant and growing resource utilization.
Despite these limitations, our findings demonstrate that in an era of children staying in the hospital less, and more medically‐complex children being admitted,10 a substantial number of children who are hospitalized at a children's hospital may have been discharged sooner. The majority of these decisions were directly related to physician responsibility. As consumers, providers, and hospitals work together to develop quality measures that are reflective of inpatient pediatric care, the Delay Tool may be able to highlight 2 aims of quality (ie, timeliness and efficiency of care) that could be used to assess the impact of interventions designed to safely discharge patients sooner. Interventions such as audit‐feedback,18 clinical guideline deployment,19 and hospitalist systems of care4 continue to hold the promise of earlier discharge; however, tools designed to measure inappropriate use of hospital days should be employed to demonstrate their effectiveness. Our study demonstrates ongoing waste in children's hospitals.
Conclusions
Almost 1 out of 4 patients in this 1‐month period could have been discharged sooner than they were. The impact of delays on costs and LOS are substantial and should provide strong incentives to develop effective interventions. Such interventions will need to address variations in physician criteria for discharge, more efficient discharge planning, and timely scheduling of consultation and diagnostic testing.
Acknowledgements
The authors thank Joni R. Beshanky and Harry Selker for their help and training in the use of the Delay Tool.
- .The transformation of child health in the United States: social disparities in child health persistent despite dramatic improvement in child health overall.Health Aff (Millwood).2004;23(5):9–25.
- , , , .Hospitalist care of medically complex children.Pediatr Res.2004;55(4):314A–315A.
- , , , .Pediatric hospitalists: a systematic review of the literature.Pediatrics.2006;117(5):1736–1744.
- , , , et al.Pediatric hospitalists: report of a leadership conference.Pediatrics.2006;117(4):1122–1130.
- Institute of Medicine.Crossing the Quality Chasm: A New Health System for the Twenty‐first Century.Washington, DC:National Academy Press;2001.
- , , .Using the Delay Tool to attribute causes for unnecessary pediatric hospital days.Med Care.1990;28(10):982–989.
- , , , .The epidemiology of delays in a teaching hospital. The development and use of a tool that detects unnecessary hospital days.Med Care.1989;27(2):112–129.
- , , , , .A tool for improving patient discharge process and hospital communication practices: the Patient Tracker.AMIA Annu Symp Proc.2007;11:493–497.
- , .Organizational responses to managed care: issues for academic health centers and implications for pediatric programs.Pediatrics.1998;101(4 Pt 2):805–811; discussion 811–802.
- , , .Hospitalist care of the medically complex child.Pediatr Clin North Am.2005;52(4):1165–1187.
- , , , et al.Epidemiology, complications, and cost of hospitalization in children with laboratory‐confirmed influenza infection.Pediatrics.2006;118(6):2409–2417.
- , , , , , .Clinical and economic outcomes of conventional amphotericin B‐associated nephrotoxicity.Clin Infect Dis.2002;35(12):e120–e127.
- , , , et al.Using a hospital information system to assess the effects of adverse drug events.Proc Annu Symp Comput Appl Med Care.1993;1993:161–165.
- , , .Appropriateness of hospitalization in a Canadian pediatric hospital.Pediatrics.1993;91(1):70–74.
- , , , .The appropriateness evaluation protocol: application in an Australian children's hospital.Aust Clin Rev.1991;11(4):123–131.
- , .Assessing the need to hospitalize children: pediatric appropriateness evaluation protocol.Pediatrics.1989;84(2):242–247.
- .Medically inappropriate hospital use in a pediatric population.N Engl J Med.1988;318(16):1033–1037.
- , , , , .Reducing inappropriate hospital use on a general pediatric inpatient unit.Pediatrics.2008;121(5):e1068–e1073.
- , .Reliable implementation of clinical pathways: what will it take—that is the question.J Pediatr.2008;152(3):303–304.
Inpatient pediatrics is undergoing a paradigm shift in at least 3 ways. First, more children with chronic disease are being cared for in the hospital over time.1 Second, previous inpatient conditions are treated at home with advancing technology such as peripherally‐inserted catheters.2 Third, there are new areas of growing specialization, such as hospital medicine, in which the practitioners deliver more efficient care.3, 4
Nationwide, there is increasing pressure to improve inpatient quality of care. The Institute of Medicine defines 6 aims for improvement, including timeliness (reducing waits and sometimes harmful delays for both those who receive and those who give care) and efficiency of care (avoiding waste, including waste of equipment, supplies, ideas, and energy).5 Reducing unnecessary stays in the hospital is a potential quality measure that hospitals may use to address the timeliness and efficiency of care delivered to hospitalized children.
Delays in discharge have been used as markers of unnecessary stays in the hospital for inpatient adult and pediatric care,6, 7 but these are limited to inpatient systems from almost 20 years ago. Current reasons why patients are delayed from discharge, if at all, are not well described. We undertook this study to describe delays in hospital discharges at a tertiary‐care children's hospital in terms of number of patients, length of days of delay, and type of delay. In addition, we sought to characterize the impact of discharge delays on overall length of stay (LOS) and costs.
Methods
Patient Population/Study Design
All children cared for on 2 pediatric medical teams at Primary Children's Medical Center during the month of August 2004 were eligible for the study. Two research assistants independently attended team rounds and collected data relating to: the reasons for ongoing hospitalization, pending items (eg, consultations, tests), and the plan of care for that day. The research assistants each attended daily team rounds for the entire month of August (1 for each team, switching to the opposite team after 2 weeks). This was combined with information available in the Patient Tracker, a software tool developed to improve communication between caregivers and improve discharge efficiency.8 This software tool details diagnoses, daily medical care plans, discharge criteria, and ongoing medical interventions while tracking daily changes in interventions and the medical care plan for each patient cared for on a pediatric medical team.
The research assistants subsequently presented their observations along with information from Patient Tracker to 2 experienced physicians (R.S. and B.S.) who independently determined if a delay occurred, the number of delay days extending discharge, and the cause of the delay, if present, categorized according to the taxonomy of the Delay Tool.6, 7 If there was not enough information for either of the physicians to identify and classify a delay, the electronic medical record of the patient was also reviewed. Discrepancies between physicians assigning delays were discussed until consensus was reached.
The study was approved by the Institutional Review Board of the University of Utah Health Sciences Center and Primary Children's Medical Center (PCMC).
Setting
PCMC is a 233‐bed tertiary‐care children's hospital, owned and operated by Intermountain Healthcare (a not‐for‐profit vertically integrated managed care organization) in the Intermountain West, which serves as both the primary hospital for Salt Lake County and as a tertiary‐care children's hospital for 5 states (UT, MT, WY, ID, and NV).9
Study Definitions
Delay and Length of Delay
Delays in discharge were measured using a validated and reliable instrument, the Delay Tool.6, 7 A discharge was classified as delayed if there was no medical reason for the patient to be in the hospital on a given day, identical to the definition used in the original studies to validate the tool. Delays were recorded as whole days, not fractions of days or hours, as described in the original validation of the tool. For example, if the medical team requested a consultation, and the consultant's opinion was rendered late, but the patient would have remained in the hospital anyway, then this period of time would not count as a delay. However, if the medical team did not receive a consultant's opinion within the standard time (24 hours as defined for this study and in validating studies for the Delay Tool), and the patient's sole reason for being in the hospital during that day was waiting for that opinion, then that period of time would count toward a delay due to a late consultative opinion. Delays of less than 1 day, due to the mechanics of discharging a patient from the hospital (providing prescriptions, follow up, communication, arranging home health, and transportation) were not measured in this study, to match the original methodology of the Delay Tool.
Type of Delay
Primary reason for delay was assigned according to the taxonomy of the Delay Tool.6, 7 Delays were categorized to 1 of the following: (1) test scheduling; (2) obtaining test results; (3) surgery; (4) consultation; (5) patient (eg, family unavailable for decision‐making); (6) physician responsibility; (7) education, training. or research; (8) discharge planning or scheduling; and (9) availability of outside care and resources. There are 166 subcategories that clarify why a delay occurred. For example, within the main category of obtaining test results (2), there are 3 subcategories of delays related to problem in executing the test (2.1), return of results is delayed (2.2), and test results not reviewed within standard time of return (2.3). Subcategories are further divided to provide detail on the cause of delay. For example, a delay categorized as a 2.1:1 [(2) obtaining test results; (2.1) problem in executing the test; and 2.1:1 test to be done by MD is delayed beyond day desired], or 2.3:1 [(2) obtaining test results; (2.3) test results not reviewed within standard time of return; and 2.3:1 delay because physician did not review results]) both relate to physician causes of delays within the general category of obtaining test results. Some delays had more than 1 cause. A secondary cause of delay was assigned if applicable; however, the number of days delayed was attributed to the primary cause for analysis purposes.
Exemptions to Delay and Special Populations
Certain subpopulations of patients presented unique issues that led to them being unlikely to be classified as having a delay. For example, patients with a diagnosis of new onset of type 1 diabetes are historically admitted for 3 days at our hospital, which includes a specific education program; delays were not considered until this minimum period had passed. Children with medically complex care (eg, multisystem disease, multiple specialists involved, multiple medications) were included in this study.10 However, these children with frequent hospital admission were often fragile at discharge, and could meet criteria for readmission even on the date of their discharge, hence assigning a delay day was usually not indicated because of easily justified ongoing medical need for hospitalization.
Study Variables
The LOS, total costs, and routine demographic and administrative data for each study patient were extracted from Intermountain Healthcare's Enterprise Data Warehouse (EDW). The EDW contains detailed data about the cost of providing health care. Costs were derived from the hospital's cost accounting program, the Standard Cost Master, which is a transaction‐based microcosting accounting system.1113
For patients whose LOS extended before August 1 or after August 31, total hospital costs were averaged per day, and only days falling inside the month of August were counted in calculating the impact the delays in discharge had on the total costs of hospitalization. Hospital days that extended outside of August were not counted in either the numerator for potential days of delay or in the denominator for total days in the hospital.
Analyses
Descriptive statistics were calculated for the number, length of days of delay, and type of delay. Interrater reliability to assign a delay was ascertained for the 2 physicians. Mean LOS, mean total costs, and standard deviations (SDs) were calculated. All analyses were performed using Statistical Analytical Software version 9.13 (SAS Institute, Cary, NC).
Results
During the 31 days of the study, 171 patients occupied hospital beds an average of 7.3 days on the 2 inpatient medical teams, for a total of 911 inpatient days. Seven patients were admitted prior to August 1; 6 of these were discharged during the month of August and 1 stayed through the entire month and was discharged in September. Three additional patients were admitted in August and discharged in September. There were 6 readmissions during the month of August, and 1 patient was excluded from the study because of lack of sufficient information. All patients with delays were able to be classified according to the Delay Tool taxonomy. Interrater reliability for the 2 study physicians was 98%.
The characteristics between the patients who did and did not experience a delay in discharge are shown in Table 1. Thirty‐nine of 171 patients (22.8%), experienced at least 1 delay day. Eighteen of 39 patients had only 1 delay day (46.2%) and 11 patients experienced 2 delayed days (28.2%) (Figure 1). The average length of delay was 2.1 days.
| Nondelayed Patients (N = 132) | Delayed Patients (N = 39) | P Value | |
|---|---|---|---|
| |||
| Age (months), mean (SD)* | 22.6 (14.4) | 15.0 (14.6) | 0.009 |
| LOS during August (days), mean (SD)* | 4.64 (6.1) | 7.64 (7.15) | <0.001 |
| Total costs during August ($), mean (SD)* | 10,451 (19,254) | 14,341 (16,241) | 0.002 |
| Number of ICD‐9 CM diagnoses codes, mean (SD)* | 7.1 (7.4) | 8.5 (7.3) | 0.056 |
| Number of ICD‐9 CM procedure codes, mean (SD)* | 1.7 (3.8) | 1.6 (2.6) | 0.068 |
| Number of Patients with APR‐DRG SOI 3 (%) | 59 (44.7%) | 19 (48.7%) | 0.65 |
Delays attributed to physician responsibility accounted for 42.3% (16.5/39) of patient delays (conservative management or clinical decision‐making), with discharge planning delays accounting for 21.8% (family‐related, patient‐related, and hospital‐related problems), consultation for 14.1% (delay in obtaining or lack of follow‐up), test scheduling for 12.8%, and obtaining test results for 5.1% (ordering and weekend scheduling). There were no primary delays due to surgery, education and research, or unavailability of outside resources such as a skilled nursing bed. Four patients had a single additional secondary cause of delay assigned to them, related to physician responsibility, consultation, surgery and test scheduling; these were split, attributing 0.5 patients to each delay type (thus, the 17/39 patients delayed for physician responsibility was analyzed as 16.5/39) (Table 2).
| Delay Category | Number of Patients Experiencing Delays* | Percentage of All Patients Experiencing Delays (%) | Percentage of Study Patients Observed (%) | Total Delay Days | Average Length of Delays (days) | Percentage of Hospital Days That Were Delay Days (%) |
|---|---|---|---|---|---|---|
| ||||||
| 1. Scheduling | 5 | 12.8 | 2.92 | 16 | 3.20 | 1.76 |
| 2. Obtaining results | 2 | 5.1 | 1.17 | 3 | 1.50 | 0.33 |
| 3. Surgery | 0.5 | 1.3 | 0.29 | 1.5 | 3.00 | 0.16 |
| 4. Consultation | 5.5 | 14.1 | 3.22 | 10.5 | 1.91 | 1.15 |
| 5. Patient | 1 | 2.6 | 0.58 | 2 | 2.00 | 0.22 |
| 6. Physician | 16.5 | 42.3 | 9.65 | 33.5 | 2.03 | 3.68 |
| 7. Education | 0 | 0 | 0.00 | 0 | 0 | 0.00 |
| 8. Discharge | 8.5 | 21.8 | 4.97 | 15.5 | 1.82 | 1.70 |
| 9. Outside | 0 | 0 | 0.00 | 0 | 0 | 0.00 |
| Total | 39 | 100 | 22.81 | 82 | 2.10 | 9.00 |
There were 82 delay‐related hospital days of 911 total inpatient days on the 2 medical teams for August 2004 (9%). More than $170,000 in excess costs was incurred due to delay days from a total of approximately 1.9 million dollars in patient costs for the month (8.9%).
Discussion
This study finds that discharge delays in a tertiary care children's hospital are common; almost 1 in 4 patients experienced a medically unnecessary excess hospital stay of at least 1 day. The average length of a delay was 2.1 days, and overall, delays consumed 9% of pediatric hospital days and 8.9% of total costs. The most common reason for a delay was related to physician clinical care, including excessively conservative management and variability in clinical decision‐making.
Our study results are similar to the other 2 published studies that use the Delay Tool. In the adult and pediatric studies, between 10% and 30% of patients experienced a delay in discharge, with the average length of delay between 2.9 and 3 days.6, 7 Although both studies were conducted at teaching hospitals, what is particularly interesting is that they were conducted almost 20 years ago. During this period of time, there has been a shift in the inpatient pediatric patient population. In recent years, children who are cared for in the hospital have more chronic illnesses.1 In addition, there has been a shift in the types of conditions that may be cared for at home and those that now require inpatient stay.2 Despite this, delays continue at a similar proportion, but the cause of delays have shifted from scheduling and consultation to physician responsibility.
There is another tool in the literature which is more widely used, the Pediatric Appropriateness Evaluation Protocol (PAEP), which is based on the Appropriateness Evaluation Protocol for adults.1417 This tool is used to determine the appropriateness of ongoing hospitalization, not the cause of delay if ongoing hospitalization is inappropriate. The 3 areas that are evaluated (medical services, nursing and ancillary services, and patient's condition) have objective criteria that dictate if the hospitalization is appropriate or not (eg, parenteral (intravenous) therapy for at least 8 hours on that day, under nursing and ancillary services). The PAEP may be less sensitive given today's healthcare resource utilization climate. Many clinicians and families would agree that insertion of a peripheral central catheter is an acceptable form of outpatient treatment for many pediatric conditions. In conjunction with the Delay Tool, the PAEP could be used to determine if a delay occurred, then the Delay Tool used to categorize the cause of the delay. We choose to use expert clinician judgment to determine if a delay had occurred. We were more interested in why patients who are admitted (appropriately or inappropriately) cannot be discharged sooner, thus allowing for future intervention studies targeted to impact delays in discharge, as elucidated in this study. The Delay Tool specifically allowed us to categorize the reasons for delays. Given that the average LOS for patients in the nondelayed group was over 4 days, despite not using a tool such as the PAEP, we believe that these were likely to be appropriate admissions.
A recent study reported the first use of the Medical Care Appropriateness Protocol (MCAP) in a tertiary‐care children's hospital. The authors used the MCAP to determine the impact of an intervention on reducing inappropriate hospitals days for children. This tool is similarly labor‐intensive to the Delay Tool. Interestingly, this Canadian study found a high rate of inappropriate hospital days (47%), which may be in part attributable to a different outcome measurement tool and/or a different health care system.18
There are several limitations to our study that deserve mention. The Delay Tool requires clinician judgment regarding whether or not there was a delay in discharge for that day. We may have introduced some bias in our study, as hospitalist investigators assigned the delay and blinding to the attending physician specialty of record was not feasible. However, our results are similar to the other 2 published studies that have used this tool, and we specifically chose not to analyze or report results in terms of hospitalist and nonhospitalist attending physicians. The Delay Tool is not designed to differentiate shorter delays in terms of hours instead of days (eg, due to the inability for the patient to get a ride home). Shorter delays may be of particular importance depending on the occupancy rate of the hospital, the demand for beds, and other patient and hospital factors. We could not capture these shorter delays (although they did occur frequently) due to the original description of the Delay Tool. In addition, we would not have been able to report data on the impact on LOS and costs, as these are attributed to whole days in the hospital. However, if we had been able to differentiate shorter delays, this would bias our results to show a greater percentage of delays over smaller increments of time. Generalizability is an issue, given that this was a single‐center study. This study sample included over 80 different attending physicians participating in community pediatrician, subspecialty, and hospitalist practice groups. However, the patient population at PCMC is similar to other medium and large children's hospitals in the United States. The month observed may not reflect the entire year of hospitalizationsthere may be seasonal variations with delays depending on the volume and type of illness seen. The study was conducted in August, when there are newer house staff present. However, physician responsibility, which was the largest source of delays in our study, had little attribution to house staff. Most of the decisions were those of attending physicians, which would largely be unaffected by the time of year of the study. Finally, we were unable to assess the safety of the potential earlier discharge, as this was an observational study. However, in any future intervention studies examining processes to discharge patients sooner, measures of safety to the patient are a necessity. Finally, given the potential of ongoing admission, even on the date of discharge of our most fragile patients, this approach to discovering causes of delay may not apply to this important group, which is responsible for significant and growing resource utilization.
Despite these limitations, our findings demonstrate that in an era of children staying in the hospital less, and more medically‐complex children being admitted,10 a substantial number of children who are hospitalized at a children's hospital may have been discharged sooner. The majority of these decisions were directly related to physician responsibility. As consumers, providers, and hospitals work together to develop quality measures that are reflective of inpatient pediatric care, the Delay Tool may be able to highlight 2 aims of quality (ie, timeliness and efficiency of care) that could be used to assess the impact of interventions designed to safely discharge patients sooner. Interventions such as audit‐feedback,18 clinical guideline deployment,19 and hospitalist systems of care4 continue to hold the promise of earlier discharge; however, tools designed to measure inappropriate use of hospital days should be employed to demonstrate their effectiveness. Our study demonstrates ongoing waste in children's hospitals.
Conclusions
Almost 1 out of 4 patients in this 1‐month period could have been discharged sooner than they were. The impact of delays on costs and LOS are substantial and should provide strong incentives to develop effective interventions. Such interventions will need to address variations in physician criteria for discharge, more efficient discharge planning, and timely scheduling of consultation and diagnostic testing.
Acknowledgements
The authors thank Joni R. Beshanky and Harry Selker for their help and training in the use of the Delay Tool.
- .The transformation of child health in the United States: social disparities in child health persistent despite dramatic improvement in child health overall.Health Aff (Millwood).2004;23(5):9–25.
- , , , .Hospitalist care of medically complex children.Pediatr Res.2004;55(4):314A–315A.
- , , , .Pediatric hospitalists: a systematic review of the literature.Pediatrics.2006;117(5):1736–1744.
- , , , et al.Pediatric hospitalists: report of a leadership conference.Pediatrics.2006;117(4):1122–1130.
- Institute of Medicine.Crossing the Quality Chasm: A New Health System for the Twenty‐first Century.Washington, DC:National Academy Press;2001.
- , , .Using the Delay Tool to attribute causes for unnecessary pediatric hospital days.Med Care.1990;28(10):982–989.
- , , , .The epidemiology of delays in a teaching hospital. The development and use of a tool that detects unnecessary hospital days.Med Care.1989;27(2):112–129.
- , , , , .A tool for improving patient discharge process and hospital communication practices: the Patient Tracker.AMIA Annu Symp Proc.2007;11:493–497.
- , .Organizational responses to managed care: issues for academic health centers and implications for pediatric programs.Pediatrics.1998;101(4 Pt 2):805–811; discussion 811–802.
- , , .Hospitalist care of the medically complex child.Pediatr Clin North Am.2005;52(4):1165–1187.
- , , , et al.Epidemiology, complications, and cost of hospitalization in children with laboratory‐confirmed influenza infection.Pediatrics.2006;118(6):2409–2417.
- , , , , , .Clinical and economic outcomes of conventional amphotericin B‐associated nephrotoxicity.Clin Infect Dis.2002;35(12):e120–e127.
- , , , et al.Using a hospital information system to assess the effects of adverse drug events.Proc Annu Symp Comput Appl Med Care.1993;1993:161–165.
- , , .Appropriateness of hospitalization in a Canadian pediatric hospital.Pediatrics.1993;91(1):70–74.
- , , , .The appropriateness evaluation protocol: application in an Australian children's hospital.Aust Clin Rev.1991;11(4):123–131.
- , .Assessing the need to hospitalize children: pediatric appropriateness evaluation protocol.Pediatrics.1989;84(2):242–247.
- .Medically inappropriate hospital use in a pediatric population.N Engl J Med.1988;318(16):1033–1037.
- , , , , .Reducing inappropriate hospital use on a general pediatric inpatient unit.Pediatrics.2008;121(5):e1068–e1073.
- , .Reliable implementation of clinical pathways: what will it take—that is the question.J Pediatr.2008;152(3):303–304.
Copyright © 2009 Society of Hospital Medicine
Evaluation of Clerkship Structure
The third‐year pediatric clerkship at the University of Utah School of Medicine has a relatively unique inpatient service, the Glasgow Service, which consists of an academic attending, a third‐year pediatric resident, and 4 third‐year medical students, but no interns. (This service was named in honor of Lowell Glasgow, chair of pediatrics, 1972‐82.) This structure was introduced in 1992 by the chair of pediatrics, Michael Simmons, the residency program director, Richard Molteni, and the clerkship director, Karen Hansen. These individuals desired to improve students' inpatient experience by providing greater responsibility for patient care. An additional motive was to increase the total number of patients followed by house staff without increasing the size of the residency program.
This inpatient service is a part of a 6‐week pediatric clerkship. All students perform the 3‐week inpatient portion of their clerkship at Primary Children's Medical Center, a tertiary‐care, freestanding children's hospital. (The students also spend 1 week each in a newborn nursery, an outpatient clinic, and a subspecialty setting). The academic attendings include generalists, hospitalists, and specialists who concurrently have other clinical responsibilities. The students take in‐house call every fourth night, supervised by senior residents who are not necessarily members of their service. All students share the same formal teaching activities, including morning report, a noon conference, and a student conference.
Patients are assigned to the ward services by a senior admitting resident. The admitting resident distributes patients among the services based on the complexity and acuity of the patients' conditions as well as the census on the various services. The senior resident supervising a particular service then assigns patients among the members of that service. Each third‐year medical student is expected to care for 2 or 3 patients at a time.
In addition to the intervention service, students also rotate on 2 similar traditional services. These services are traditional in the sense that they are composed of an academic attending, a community attending, a third‐year pediatric resident, 4 interns, and up to 2 fourth‐year and 2 third‐year medical students. Faculty preferences regarding service assignments were accommodated when possible. Therefore, some faculty attended only on one type of service, intervention or traditional, and others attended on both types. Because they have more members and because interns are capable of caring for more patients than are medical students, the traditional services cared for more patients than the intervention service. Although identical in composition, the 2 traditional services differ with each other in several ways. One service typically admits children 3 years old and younger, whereas the other admits children who are between 3 and 12 years old. The service that admits older children also admits most of the hematology‐oncology patients.
Although other authors have described similar inpatient clerkship structures, to our knowledge, none have evaluated them through a prospective randomized controlled trial.1, 2 The recent literature on ambulatory experiences during third‐year clerkships provided a methodological framework for this study. Collectively, such studies have evaluated outcomes with a variety of measures, including patient logs,35 evaluations,3, 4, 6, 7 examinations,37 surveys,3, 5, 7, 8 and career choices.4, 68 Additional outcomes, such as the effect of educational interventions on patient care, have been emphasized.9
In the light of this research, we conducted a prospective, randomized controlled trial to compare outcomes on the intervention service with those on the traditional services. We hypothesized that, compared with the traditional services, the intervention service would show:
improved process measures in terms of increased number of patients admitted, number of key diagnoses encountered in the patients cared for, and range of ages of the patients admitted;
similar or improved student performance, as measured by faculty and resident evaluations and a National Board of Medical Examiners (NBME) subject examination;
increased student satisfaction, as assessed by an end‐of‐rotation questionnaire;
increased interest in pediatric and, more broadly, primary care careers, as measured by subinternship and internship selections; and
comparable or improved resource utilization in terms of length of stay and total charges.
METHODS
All students enrolled in the third‐year pediatric rotation during the 2001‐2003 academic years were individually randomized by the clerkship assistant to the intervention service or 1 of the 2 traditional services without respect to career preference. A 5:3 student randomization ratio was used to fulfill the requirement that 4 students be assigned to the intervention service during every 3‐week block. This permitted the service to have call every fourth night.
To evaluate the adequacy of the randomization process, we obtained baseline student characteristics on age, sex, and United States Medical Licensing Examination (USMLE) Step 1 score from the Dean of Student Affairs. The dean also reported the discipline each student enrolled in for the required fourth‐year subinternship(s) and matched in for internship. These data were reported anonymously and linked to the service to which the student was assigned. In this study, pediatrics, internal medicine, and family practice were all considered primary care, but preliminary or transitional internships were not.
Process Measures
Students were required to submit logs at the end of their rotations, recording patients' names, ages, diagnoses, and admission dates. The accuracy and completeness of these logs were not independently verified.
As there was no authoritative list of key diagnoses third‐year medical students should encounter in the patients they care for during their inpatient rotations, we relied on expert opinion at our institution. The Council on Medical Student Education in Pediatrics' curriculum was not used because it did not differentiate between inpatient and ambulatory contexts. A preliminary list of 93 diagnoses was developed from the table of contents of Pediatric Hospital Medicine.10 This list was distributed to the 26 clinical faculty members in the Divisions of Pediatric Inpatient Medicine and General Pediatrics who were asked to select the 10 most important diagnoses. Surveys were numerically coded to permit 1 reminder.
The survey had a response rate of 92.3% (24 of 26 surveys). One survey was excluded because the respondent significantly deviated from the instructions. The 10 key diagnoses and the percentages of respondents who selected each individual diagnosis are: asthma (100%), febrile infant (95.6%), diarrhea and dehydration (91.3%), bronchiolitis (78.2%), diabetes mellitus and diabetic ketoacidemia (60.9%), failure to thrive (56.5%), urinary tract infections (52.1%), pneumonia (47.8%), upper airway infections such as croup (43.5%), and seizures and status epilepticus (43.5%).
Two of the authors independently coded the diagnoses on the students' patient logs in terms of these 93 diagnoses. The authors were blinded to the students' service assignment. As many students reported more than 1 diagnosis, the authors prioritized primary, secondary, and tertiary diagnoses to simplify the evaluation. The most likely cause of admission was listed as the primary diagnosis. If the authors could not reconcile divergent views, a third party was consulted.
Student Performance
Students were evaluated by both the attending physician(s) and senior resident(s) using a standardized evaluation form available from the corresponding author. The evaluation contained 18 items in 7 categories: data gathering, data recording/reporting, knowledge, data interpretation, clinical performance, professional attitudes, and professional demeanor. The student was rated exceptional, above expectations, meets expectations, below expectations, unacceptable, or not observed on each item. A short narrative description illustrated each rating. The ratings were converted to a 5‐point scale, with exceptional being 5. If the evaluator marked the line between 2 ratings, it was recorded as half. When multiple attendings or residents evaluated a student, the scores for a given item were collapsed into an average score.
Students also completed a NBME pediatric subject examination on the last day of their rotation.
Additionally, students were requested to complete a questionnaire during the final week of the clerkship. The items on the questionnaire were meant to access students' perceptions of the quality of their attendings' and residents' teaching, a potentially confounding variable. The survey was piloted on a group of similar subjects. Informed consent was obtained for survey completion. The survey was anonymous and required approximately 7 minutes to complete.
Resource Utilization
Last, resource utilization data, length of stay and total charges, for the 4 most common primary diagnoses were compared between the intervention and the traditional services. The 4 most common primary diagnoses and the percentage of total diagnoses (n = 2047) that each represents were bronchiolitis, 13%; febrile infant, 8.6%; pneumonia, 7.1%; and asthma, 6.5% (the diagnosis other accounted for 12% of the total diagnoses). Unique patient identifiers were used to obtain length of stay and total charges from the hospital's database. All‐Patient‐Refined Diagnosis‐Related Groups Severity of Illness (APR‐DRG‐SOI) were also obtained and used to construct multivariate models. Patients who were admitted to the pediatric intensive care unit (PICU) were excluded from the analysis.
Statistical Analysis
Statistical analyses were conducted and frequencies and percentages were calculated using Stata SE version 8.0 (College Station, TX). For all interval and ratio‐scaled variables, distributions were tested for normality using the Shapiro‐Wilks test to determine whether to use parametric or nonparametric statistical tests. For distributions meeting the normality assumption, the unpaired t test was used to compare the intervention service with traditional services. Where the normality assumption was not met, the Mann‐Whitney test was used. Categorically scaled data were compared using Pearson's chi‐square test. The standardized mean differences, reported as d values, were calculated to determine the effect size. Small, medium, and large effect sizes were defined as d values of 0.20, 0.50, and 0.80, respectively.11 Teaching quality, an effect modifier, was entered as a covariate into a linear regression model. Analyses of length of stay and total charges were conducted using multivariate linear regression controlling for patient age and severity of illness.
This study was approved by the University of Utah and Primary Children's Medical Center's Institutional Review Board.
RESULTS
Two hundred and three students enrolled in the third‐year pediatric clerkship during the study period, and all students completed the clerkship on their assigned services. One hundred and twenty‐eight were randomized to the intervention service and 75 to the traditional services. There were no statistically significant differences in median age, percentage of male students, or mean USMLE Step 1 score between the students randomized to the intervention service and those randomized to the traditional services (Table 1).
| Intervention service | Traditional services | P value | |
|---|---|---|---|
| |||
| Age (median) | 28 | 28 | .76* |
| Sex (% male) | 58.6 | 62.7 | .57 |
| USMLE Step 1 score | 217 | 217 | .94 |
Process Measures
Overall, 96.6% of students (196 of 203) submitted patient logs; 97.7% of students (125 of 128) on the intervention service and 94.7% of students (71 of 75) on the traditional services. The students on the intervention service admitted a median of 10 patients, whereas the students on the traditional services admitted a median of 11 patients (d = 0.45, P < .01). Age data were recorded on 137 patient logs (69.9% of submitted logs, 72.0% of students on the intervention service vs. 66.2% of students on the traditional services). The percentage of students who saw at least 1 newborn (birth‐23 months), child (2‐12 years), and adolescent (12‐18 years) was 34.8% on the intervention service and 33.3% on the traditional services (P = .87) (Table 2).
| Intervention service | Traditional services | d | P value | |
|---|---|---|---|---|
| ||||
| Median number of patients | 10 | 11 | 0.45 | < .01* |
| Percent of students who saw 1 newborn, child, and adolescent | 34.8% | 33.3% | 0.03 | .87 |
| Top 10 diagnoses cared for (n) | 4.4 | 3.6 | 0.48 | < .01 |
| Percent of patients cared for whose diagnoses were in top 10 | 59.3% | 46.8% | 0.62# | < .01 |
| Percent of unique diagnoses (median) | 80.0% | 80.0% | 0.02 | .62 |
Students on the intervention service encountered, on average, a larger number of the 10 key diagnoses (4.4 vs. 3.6, d = 0.48, P < .01) and a higher percentage of their patients had clinical conditions among the key diagnoses (59.3 vs. 46.8, d = 0.62, P < .01). To determine if this higher percentage was the result of admitting multiple patients with the same diagnosis, we examined the percentage of unique primary diagnosesthe number of different primary diagnoses divided by the total number of patientsand found no differences (Table 2).
Student Performance
The faculty and resident evaluations of the students showed statistically significant differences between those in the intervention service and those in the traditional services in only 2 of the 18 items. These items were analysis in the data interpretation category (3.81 vs. 3.64, d = 0.35, P = .02) and patient interaction in the professional demeanor category (3.89 vs. 3.76, d = 0.31, P < .05). Both differences favored the intervention service. There were no statistical differences by service in student performance on the NBME subject examination (73.2 vs. 72.3, P = .39).
Student Satisfaction
Overall, 87.2% of students (177 of 203) completed the survey; 87.5% of students (112 of 124) on the intervention service and 86.7% of students (65 of 75) on the traditional services. The students on the intervention service both had a more positive overall attitude about their rotation and were more likely to find it a satisfying educational experience. Students on the intervention service also reported greater participation in patient care. Effect sizes ranged from small to medium (Table 3). The internal consistency of answers about participation in patient care was high (Pearson correlation coefficient r = 0.80).
| Intervention service | Traditional services | d | P value | |
|---|---|---|---|---|
| ||||
| My overall attitude toward this rotation is: 1. highly negative to 5. highly positive | 4.48 | 4.26 | 0.26 | .02* |
| I found this rotation a satisfying educational experience: 1. strongly disagree to 5. strongly agree | 4.49 | 4.22 | 0.35 | < .01* |
| My role on this rotation was that of an: 1. observer, 3. participant, 5. director | 3.77 | 3.33 | 0.60# | < .01 |
| My supervising interns/residents were _____ teachers: 1. poor, 3. good, 5. exemplary | 3.91 | 3.75 | 0.17 | .26* |
| My input into patient care decisions was: 1. strongly discouraged to 5. strongly encouraged | 4.45 | 3.98 | 0.66# | < .01* |
| I was able to make a significant contribution to patient care: 1. strongly disagree to 5. strongly agree | 4.19 | 3.92 | 0.34 | .02* |
| I had direct responsibility for patient care: 1. strongly disagree to 5. strongly agree | 4.33 | 3.95 | 0.46 | .01* |
| My attendings were _____ teachers: 1. poor, 3. good, 5. exemplary | 4.09 | 3.75 | 0.40 | < .01* |
| I found the feedback I received during this rotation to be: 1. insufficient, 3. appropriate, 5. excessive | 2.84 | 2.65 | 0.22 | .17* |
| The following best describes the quality of my supervision during this rotation: 1. I was expected to do things beyond my competence unsupervised 3. The degree of supervision was appropriate for my level of training 5. I was excessively supervised on skills I had already demonstrated | 2.95 | 3.06 | 0.18 | .19 |
| During this rotation: 1. I was expected to see too many patients 3. I was expected to see an appropriate number of patients 5. I expected to see more patients | 3.46 | 3.31 | 0.18 | .33* |
| Before this rotation I _____ pediatrics as a career choice: 1. had rejected, 3. was considering, 5. had decided on | 2.37 | 2.14 | 0.22 | .11* |
| This rotation increased my interest in pursuing pediatrics as a career: 1. strongly disagree to 5. strongly agree | 3.74 | 3.60 | 0.14 | .32* |
Students on the intervention service rated the teaching of their attendings, but not of their residents, higher than did students on the traditional services. Controlling for the perceived quality of the attending, 3 of 6 satisfaction outcomes remained statistically significant: role on rotation (P < .01), input into patient care decisions (P < .01), and direct responsibility for patient care (P = .04). Students on both services believed they were appropriately supervised (P = .19). Despite the students on the traditional services on average admitting more patients, there was no significant difference by service in the students' rating of patient load (P = .33).
Career Choice
The odds ratio and 95% confidence interval for students enrolling in a pediatric subinternship was 1.94 (0.83‐4.49) and matching in a pediatric residency was 2.52 (0.99‐6.37). There were no statistically significant differences by service in the percentage of students enrolling in primary care (pediatric, internal medicine, and family practice) subinternships or residencies (Table 4).
| Intervention service | Traditional services | Odds ratio (95% CI) | |
|---|---|---|---|
| Pediatric subinternship | 19.5% | 11.1% | 1.94 (0.83‐4.49) |
| Primary care subinternship | 68.3% | 70.8% | 0.89 (0.47‐1.67) |
| Pediatric residency | 18.6% | 8.3% | 2.52 (0.99‐6.37) |
| Primary care residency | 40.7% | 31.9% | 1.46 (0.79‐2.70) |
Resource Utilization
One hundred and thirty‐five patients were excluded from the resource utilization analysis (n = 594) because their unique identifiers could not be found or they had been admitted to the PICU. Univariate analysis demonstrated statistically significant differences for patients with asthma, but not patients with bronchiolitis, febrile infants, or patients with pneumonia, favoring the intervention service. Patients with asthma admitted to the intervention service had a shorter length of stay (49.9 vs. 70.1 hours, P = .02) and lower total charges ($3600 vs. $4600, P = .02), as shown in Table 5. Of 4 multivariate models controlling for age and severity of illness, each with length of stay and total charges as the dependant variables, length of stay was significantly less for patients with asthma admitted to the intervention service only. Such patients were discharged an average of 23.3 hours earlier than patients with asthma admitted to the traditional services (P = .02).
| Diagnosis (n) | n | Length of stay (hours) | P value | Total charges | ||||
|---|---|---|---|---|---|---|---|---|
| Intervention service | Traditional services | Intervention service | Traditional services | Intervention service | Traditional services | P value | ||
| ||||||||
| Bronchiolitis (210) | 159 | 51 | 63.7 | 70.5 | .20* | $4300 | $4800 | .20* |
| Febrile infant (152) | 105 | 47 | 58.8 | 58.9 | .50* | $4800 | $4900 | .28* |
| Pneumonia (123) | 82 | 41 | 84.3 | 116.8 | .71* | $6300 | $9200 | .63* |
| Asthma (109) | 80 | 29 | 49.9 | 70.1 | .02* | $3600 | $4600 | .02* |
DISCUSSION
This study's objective was to evaluate a third‐year pediatric clerkship structure that focuses on students, using multiple outcome parameters. Utilizing a robust design, the results of this study have demonstrated that the intervention service is more successful than the traditional services in several outcomes. Students assigned to the intervention service were more satisfied and more likely to select pediatrics as a career. These improvements were accomplished while maintaining similar process measures, student performance, and resource utilization compared with those of the traditional services.
Methods
The methods used in this study compare favorably with other evaluations of educational interventions. The present study incorporated a randomized controlled design.12 Although several studies of ambulatory clerkships used a randomized design, few randomized all eligible students.7, 8 The others used some form of selection prior to randomization. For example, in the Pangaro et al. study, students selected their clerkship site by lottery, with students selecting a certain site then offered the opportunity to participate in the intervention.6 The present study manifested several additional strengths. Multiple outcomes, including effects on patient care, were evaluated. Moreover, this study had a relatively large intervention group and total sample size compared with those in other medical education studies. Finally, because the intervention service had been in place for several years prior to its evaluation, the confounding influence of difficulties working out its implementation was minimized.
Results
Few studies of ambulatory experiences demonstrated statistically significant, let alone clinically significant, results. Most studies showed no statistically significant differences in student evaluations or examination scores. An exception is Grum et al., who showed improvements on 3 of 5 examinations.4 A few studies have found improved student satisfaction.3 None of the randomized controlled trials demonstrate increases in students matching in internal medicine or primary care residencies.4, 68 In contrast, this study produced statistically or programmatically significant results in process measures, evaluations, satisfaction, and career choices.
Several of our specific findings deserve additional comment. Although the admitting residents were instructed to assign patients to the intervention service based on their acuity and complexity, it is important to examine these residents' actual behavior. Several of our hypotheses were not validated. The students on the intervention service admitted fewer patients and were no more likely to see at least 1 patient in each age category. The admitting resident may have limited the number of patients admitted to the intervention service based on the workload of the supervising resident not that of the student. The supervising resident on the intervention service must round on all the patients, whereas the oversight of patients seen by students on the traditional services is shared with the interns. Having the attending on the intervention service share this supervising responsibility might improve this outcome.
Students on the intervention service had more positive attitudes toward the rotation. In addition, potentially negative attitudes were not manifest. For example, it might be argued that third‐year medical students are not prepared to bear this increased responsibility. However, there was not a significant difference in students' perception of the quality of supervision or the workload.
Although the goal of medical education is the production of competent physicians, it is important that the process not place undo burdens on patients and the health care system. Univariate analysis showed similar resource utilization. It might be contended that the admitting resident assigned the intervention service patients who were less acutely ill. Therefore, we performed multivariate analysis using APR‐DRG‐SOI to control for severity of illness. Of 8 comparisons, the only statistically significant difference, length of stay of patients with asthma, favored the intervention service.
Limitations
Although this study had numerous strengths, it also had several limitations. The primary limitations were lack of generalizability, difficulty in obtaining authentic assessments, the potential difference between statistical and educational significance, and inability to identify which components of the intervention service were responsible for the outcomes. This study's findings may not be generalizable to other institutions. For example, institutions without age or organ systembased teams may not observe increases in the number of key diagnoses encountered in the patients cared for. Regarding the assessments, there may be better measures of clinical competence, such as an objective structured clinical examination (OSCE),13 than those used in this study. However, there were not sufficient resources to implement an OSCE at the end of the rotation.
Some might question whether the statistically significant differences have educational significance. Although that is an important concern, this study should be compared with other educational interventions that found few statistically significant, let alone educationally significant, differences. To address this concern, we calculated effect sizes. The differences in student satisfaction were small to moderate. Although the lower limit of the 95% confidence interval of the odds ratio for matching in a pediatric residency was 0.99, the magnitude was programmatically important.
Finally, this study was an evaluation of an existing program. The authors were unable to control some potential confounders including patient allocation, average daily census, and quality of teaching. For example, Griffith and colleagues have shown that working with the best teachers improves student performance.14 We were not able to randomly assign the faculty among the services, and unequal distribution of better teachers could have biased this study's outcomes. The students on the intervention service rated their attendings, but not their residents, higher than did the students on the other services. However, the linear regression model showed that the perceived quality of the attending did not account for all the differences in student satisfaction. It was not possible to control for this factor in comparing student performance or subinternship or residency selection because the survey, which included the faculty evaluations, was anonymous and therefore could not be linked to the other data sets.
The perceived differences in the quality of teaching may not have been the result of differences in the attendings but instead of differences in the structure of the services. Accessibility is one of the characteristics of excellent clinical teachers.15 The intervention structure may permit faculty to spend more time with students, and this may increase the perceived quality of the teaching. However, it is not possible to resolve this issue with the available data.
CONCLUSIONS
The intervention service is a structure for the pediatric inpatient rotation of third‐year medical students that, instead of dividing the faculty and supervising resident's attention between interns and students, focuses their attention on the students. Although it has been difficult to demonstrate improvements as a result of the educational interventions, we have shown several improvements in the evaluations of the students. Moreover, the pattern of increased student satisfaction and a tendency toward more student selecting careers in pediatrics are remarkable. This was accomplished with similar resource utilization. Therefore, this program merits being continued at our institution and possibly adopted at other medical schools. Further research is needed to determine which aspects of the intervention are responsible for its effects. Some components, such as focused time with students, may be applicable to traditional services.
Acknowledgements
The authors thank Ronald Bloom for encouraging us to conduct this study; Kathy Bailey, Alice Dowling, and Margie Thompson for their assistance in the data collection; and Elizabeth Allen, Ronald Bloom, Flory Nkoy, Louis Pangaro, Stephanie Richardson, and Rajendu Srivastava for manuscript review.
- ,,.The role of the student ward in the medical clerkships.J Med Educ.1985;60:524–529.
- .Changing the fourth‐year medicine clerkship structure: A successful model for a teaching service without housestaff.J Gen Intern Med.1993;8:31–32.
- ,.A randomized, controlled pilot study of placing third‐year medical clerks in a continuity clinic.Acad Med.1993;68:845–847.
- ,,.Consequences of shifting medical‐student education to the outpatient setting: effects on performance and experiences.Acad Med.1996;71(suppl 1):S99–S101.
- ,.Learning outcomes of an ambulatory care rotation in internal medicine for junior medical students.J Gen Intern Med.1993;8:189–192.
- ,,,,.A prospective, randomized trial of a six‐week ambulatory medicine rotation.Acad Med.1995;70:537–541.
- ,,,,.Ambulatory versus inpatient rotations in teaching third‐year students internal medicine.J Gen Intern Med.1998;13:327–330.
- ,,,,.The effect of an ambulatory internal medicine rotation on students' career choices.Acad Med.1997;72:147–149.
- .Theme issue on medical education: Call for papers.JAMA.2005;293:742.
- Perkin RM,Swift JD,Newton DA, eds.Pediatric Hospital Medicine: Textbook of Inpatient Management.Philadelphia:Lippincott Williams 2003.
- .Call for greater emphasis on effect‐size measures in published articles in Teaching and Learning in Medicine.Teach Learn Med.2002;14:206–210.
- .Educational research and randomised trials.Med Educ.2002;36:1002–1003.
- ,.The objective structured clinical examination.Arch Pediatr Adolesc Med.2000;154:736–741.
- ,,,.Relationship of how well attending physicians teach to their student's performances and residency choices.Acad Med.1997;72(suppl 1):S118–S120.
- ,.Assessing quality and costs of education in the ambulatory setting: A review of the literature.Acad Med.2002;77:621–680.
The third‐year pediatric clerkship at the University of Utah School of Medicine has a relatively unique inpatient service, the Glasgow Service, which consists of an academic attending, a third‐year pediatric resident, and 4 third‐year medical students, but no interns. (This service was named in honor of Lowell Glasgow, chair of pediatrics, 1972‐82.) This structure was introduced in 1992 by the chair of pediatrics, Michael Simmons, the residency program director, Richard Molteni, and the clerkship director, Karen Hansen. These individuals desired to improve students' inpatient experience by providing greater responsibility for patient care. An additional motive was to increase the total number of patients followed by house staff without increasing the size of the residency program.
This inpatient service is a part of a 6‐week pediatric clerkship. All students perform the 3‐week inpatient portion of their clerkship at Primary Children's Medical Center, a tertiary‐care, freestanding children's hospital. (The students also spend 1 week each in a newborn nursery, an outpatient clinic, and a subspecialty setting). The academic attendings include generalists, hospitalists, and specialists who concurrently have other clinical responsibilities. The students take in‐house call every fourth night, supervised by senior residents who are not necessarily members of their service. All students share the same formal teaching activities, including morning report, a noon conference, and a student conference.
Patients are assigned to the ward services by a senior admitting resident. The admitting resident distributes patients among the services based on the complexity and acuity of the patients' conditions as well as the census on the various services. The senior resident supervising a particular service then assigns patients among the members of that service. Each third‐year medical student is expected to care for 2 or 3 patients at a time.
In addition to the intervention service, students also rotate on 2 similar traditional services. These services are traditional in the sense that they are composed of an academic attending, a community attending, a third‐year pediatric resident, 4 interns, and up to 2 fourth‐year and 2 third‐year medical students. Faculty preferences regarding service assignments were accommodated when possible. Therefore, some faculty attended only on one type of service, intervention or traditional, and others attended on both types. Because they have more members and because interns are capable of caring for more patients than are medical students, the traditional services cared for more patients than the intervention service. Although identical in composition, the 2 traditional services differ with each other in several ways. One service typically admits children 3 years old and younger, whereas the other admits children who are between 3 and 12 years old. The service that admits older children also admits most of the hematology‐oncology patients.
Although other authors have described similar inpatient clerkship structures, to our knowledge, none have evaluated them through a prospective randomized controlled trial.1, 2 The recent literature on ambulatory experiences during third‐year clerkships provided a methodological framework for this study. Collectively, such studies have evaluated outcomes with a variety of measures, including patient logs,35 evaluations,3, 4, 6, 7 examinations,37 surveys,3, 5, 7, 8 and career choices.4, 68 Additional outcomes, such as the effect of educational interventions on patient care, have been emphasized.9
In the light of this research, we conducted a prospective, randomized controlled trial to compare outcomes on the intervention service with those on the traditional services. We hypothesized that, compared with the traditional services, the intervention service would show:
improved process measures in terms of increased number of patients admitted, number of key diagnoses encountered in the patients cared for, and range of ages of the patients admitted;
similar or improved student performance, as measured by faculty and resident evaluations and a National Board of Medical Examiners (NBME) subject examination;
increased student satisfaction, as assessed by an end‐of‐rotation questionnaire;
increased interest in pediatric and, more broadly, primary care careers, as measured by subinternship and internship selections; and
comparable or improved resource utilization in terms of length of stay and total charges.
METHODS
All students enrolled in the third‐year pediatric rotation during the 2001‐2003 academic years were individually randomized by the clerkship assistant to the intervention service or 1 of the 2 traditional services without respect to career preference. A 5:3 student randomization ratio was used to fulfill the requirement that 4 students be assigned to the intervention service during every 3‐week block. This permitted the service to have call every fourth night.
To evaluate the adequacy of the randomization process, we obtained baseline student characteristics on age, sex, and United States Medical Licensing Examination (USMLE) Step 1 score from the Dean of Student Affairs. The dean also reported the discipline each student enrolled in for the required fourth‐year subinternship(s) and matched in for internship. These data were reported anonymously and linked to the service to which the student was assigned. In this study, pediatrics, internal medicine, and family practice were all considered primary care, but preliminary or transitional internships were not.
Process Measures
Students were required to submit logs at the end of their rotations, recording patients' names, ages, diagnoses, and admission dates. The accuracy and completeness of these logs were not independently verified.
As there was no authoritative list of key diagnoses third‐year medical students should encounter in the patients they care for during their inpatient rotations, we relied on expert opinion at our institution. The Council on Medical Student Education in Pediatrics' curriculum was not used because it did not differentiate between inpatient and ambulatory contexts. A preliminary list of 93 diagnoses was developed from the table of contents of Pediatric Hospital Medicine.10 This list was distributed to the 26 clinical faculty members in the Divisions of Pediatric Inpatient Medicine and General Pediatrics who were asked to select the 10 most important diagnoses. Surveys were numerically coded to permit 1 reminder.
The survey had a response rate of 92.3% (24 of 26 surveys). One survey was excluded because the respondent significantly deviated from the instructions. The 10 key diagnoses and the percentages of respondents who selected each individual diagnosis are: asthma (100%), febrile infant (95.6%), diarrhea and dehydration (91.3%), bronchiolitis (78.2%), diabetes mellitus and diabetic ketoacidemia (60.9%), failure to thrive (56.5%), urinary tract infections (52.1%), pneumonia (47.8%), upper airway infections such as croup (43.5%), and seizures and status epilepticus (43.5%).
Two of the authors independently coded the diagnoses on the students' patient logs in terms of these 93 diagnoses. The authors were blinded to the students' service assignment. As many students reported more than 1 diagnosis, the authors prioritized primary, secondary, and tertiary diagnoses to simplify the evaluation. The most likely cause of admission was listed as the primary diagnosis. If the authors could not reconcile divergent views, a third party was consulted.
Student Performance
Students were evaluated by both the attending physician(s) and senior resident(s) using a standardized evaluation form available from the corresponding author. The evaluation contained 18 items in 7 categories: data gathering, data recording/reporting, knowledge, data interpretation, clinical performance, professional attitudes, and professional demeanor. The student was rated exceptional, above expectations, meets expectations, below expectations, unacceptable, or not observed on each item. A short narrative description illustrated each rating. The ratings were converted to a 5‐point scale, with exceptional being 5. If the evaluator marked the line between 2 ratings, it was recorded as half. When multiple attendings or residents evaluated a student, the scores for a given item were collapsed into an average score.
Students also completed a NBME pediatric subject examination on the last day of their rotation.
Additionally, students were requested to complete a questionnaire during the final week of the clerkship. The items on the questionnaire were meant to access students' perceptions of the quality of their attendings' and residents' teaching, a potentially confounding variable. The survey was piloted on a group of similar subjects. Informed consent was obtained for survey completion. The survey was anonymous and required approximately 7 minutes to complete.
Resource Utilization
Last, resource utilization data, length of stay and total charges, for the 4 most common primary diagnoses were compared between the intervention and the traditional services. The 4 most common primary diagnoses and the percentage of total diagnoses (n = 2047) that each represents were bronchiolitis, 13%; febrile infant, 8.6%; pneumonia, 7.1%; and asthma, 6.5% (the diagnosis other accounted for 12% of the total diagnoses). Unique patient identifiers were used to obtain length of stay and total charges from the hospital's database. All‐Patient‐Refined Diagnosis‐Related Groups Severity of Illness (APR‐DRG‐SOI) were also obtained and used to construct multivariate models. Patients who were admitted to the pediatric intensive care unit (PICU) were excluded from the analysis.
Statistical Analysis
Statistical analyses were conducted and frequencies and percentages were calculated using Stata SE version 8.0 (College Station, TX). For all interval and ratio‐scaled variables, distributions were tested for normality using the Shapiro‐Wilks test to determine whether to use parametric or nonparametric statistical tests. For distributions meeting the normality assumption, the unpaired t test was used to compare the intervention service with traditional services. Where the normality assumption was not met, the Mann‐Whitney test was used. Categorically scaled data were compared using Pearson's chi‐square test. The standardized mean differences, reported as d values, were calculated to determine the effect size. Small, medium, and large effect sizes were defined as d values of 0.20, 0.50, and 0.80, respectively.11 Teaching quality, an effect modifier, was entered as a covariate into a linear regression model. Analyses of length of stay and total charges were conducted using multivariate linear regression controlling for patient age and severity of illness.
This study was approved by the University of Utah and Primary Children's Medical Center's Institutional Review Board.
RESULTS
Two hundred and three students enrolled in the third‐year pediatric clerkship during the study period, and all students completed the clerkship on their assigned services. One hundred and twenty‐eight were randomized to the intervention service and 75 to the traditional services. There were no statistically significant differences in median age, percentage of male students, or mean USMLE Step 1 score between the students randomized to the intervention service and those randomized to the traditional services (Table 1).
| Intervention service | Traditional services | P value | |
|---|---|---|---|
| |||
| Age (median) | 28 | 28 | .76* |
| Sex (% male) | 58.6 | 62.7 | .57 |
| USMLE Step 1 score | 217 | 217 | .94 |
Process Measures
Overall, 96.6% of students (196 of 203) submitted patient logs; 97.7% of students (125 of 128) on the intervention service and 94.7% of students (71 of 75) on the traditional services. The students on the intervention service admitted a median of 10 patients, whereas the students on the traditional services admitted a median of 11 patients (d = 0.45, P < .01). Age data were recorded on 137 patient logs (69.9% of submitted logs, 72.0% of students on the intervention service vs. 66.2% of students on the traditional services). The percentage of students who saw at least 1 newborn (birth‐23 months), child (2‐12 years), and adolescent (12‐18 years) was 34.8% on the intervention service and 33.3% on the traditional services (P = .87) (Table 2).
| Intervention service | Traditional services | d | P value | |
|---|---|---|---|---|
| ||||
| Median number of patients | 10 | 11 | 0.45 | < .01* |
| Percent of students who saw 1 newborn, child, and adolescent | 34.8% | 33.3% | 0.03 | .87 |
| Top 10 diagnoses cared for (n) | 4.4 | 3.6 | 0.48 | < .01 |
| Percent of patients cared for whose diagnoses were in top 10 | 59.3% | 46.8% | 0.62# | < .01 |
| Percent of unique diagnoses (median) | 80.0% | 80.0% | 0.02 | .62 |
Students on the intervention service encountered, on average, a larger number of the 10 key diagnoses (4.4 vs. 3.6, d = 0.48, P < .01) and a higher percentage of their patients had clinical conditions among the key diagnoses (59.3 vs. 46.8, d = 0.62, P < .01). To determine if this higher percentage was the result of admitting multiple patients with the same diagnosis, we examined the percentage of unique primary diagnosesthe number of different primary diagnoses divided by the total number of patientsand found no differences (Table 2).
Student Performance
The faculty and resident evaluations of the students showed statistically significant differences between those in the intervention service and those in the traditional services in only 2 of the 18 items. These items were analysis in the data interpretation category (3.81 vs. 3.64, d = 0.35, P = .02) and patient interaction in the professional demeanor category (3.89 vs. 3.76, d = 0.31, P < .05). Both differences favored the intervention service. There were no statistical differences by service in student performance on the NBME subject examination (73.2 vs. 72.3, P = .39).
Student Satisfaction
Overall, 87.2% of students (177 of 203) completed the survey; 87.5% of students (112 of 124) on the intervention service and 86.7% of students (65 of 75) on the traditional services. The students on the intervention service both had a more positive overall attitude about their rotation and were more likely to find it a satisfying educational experience. Students on the intervention service also reported greater participation in patient care. Effect sizes ranged from small to medium (Table 3). The internal consistency of answers about participation in patient care was high (Pearson correlation coefficient r = 0.80).
| Intervention service | Traditional services | d | P value | |
|---|---|---|---|---|
| ||||
| My overall attitude toward this rotation is: 1. highly negative to 5. highly positive | 4.48 | 4.26 | 0.26 | .02* |
| I found this rotation a satisfying educational experience: 1. strongly disagree to 5. strongly agree | 4.49 | 4.22 | 0.35 | < .01* |
| My role on this rotation was that of an: 1. observer, 3. participant, 5. director | 3.77 | 3.33 | 0.60# | < .01 |
| My supervising interns/residents were _____ teachers: 1. poor, 3. good, 5. exemplary | 3.91 | 3.75 | 0.17 | .26* |
| My input into patient care decisions was: 1. strongly discouraged to 5. strongly encouraged | 4.45 | 3.98 | 0.66# | < .01* |
| I was able to make a significant contribution to patient care: 1. strongly disagree to 5. strongly agree | 4.19 | 3.92 | 0.34 | .02* |
| I had direct responsibility for patient care: 1. strongly disagree to 5. strongly agree | 4.33 | 3.95 | 0.46 | .01* |
| My attendings were _____ teachers: 1. poor, 3. good, 5. exemplary | 4.09 | 3.75 | 0.40 | < .01* |
| I found the feedback I received during this rotation to be: 1. insufficient, 3. appropriate, 5. excessive | 2.84 | 2.65 | 0.22 | .17* |
| The following best describes the quality of my supervision during this rotation: 1. I was expected to do things beyond my competence unsupervised 3. The degree of supervision was appropriate for my level of training 5. I was excessively supervised on skills I had already demonstrated | 2.95 | 3.06 | 0.18 | .19 |
| During this rotation: 1. I was expected to see too many patients 3. I was expected to see an appropriate number of patients 5. I expected to see more patients | 3.46 | 3.31 | 0.18 | .33* |
| Before this rotation I _____ pediatrics as a career choice: 1. had rejected, 3. was considering, 5. had decided on | 2.37 | 2.14 | 0.22 | .11* |
| This rotation increased my interest in pursuing pediatrics as a career: 1. strongly disagree to 5. strongly agree | 3.74 | 3.60 | 0.14 | .32* |
Students on the intervention service rated the teaching of their attendings, but not of their residents, higher than did students on the traditional services. Controlling for the perceived quality of the attending, 3 of 6 satisfaction outcomes remained statistically significant: role on rotation (P < .01), input into patient care decisions (P < .01), and direct responsibility for patient care (P = .04). Students on both services believed they were appropriately supervised (P = .19). Despite the students on the traditional services on average admitting more patients, there was no significant difference by service in the students' rating of patient load (P = .33).
Career Choice
The odds ratio and 95% confidence interval for students enrolling in a pediatric subinternship was 1.94 (0.83‐4.49) and matching in a pediatric residency was 2.52 (0.99‐6.37). There were no statistically significant differences by service in the percentage of students enrolling in primary care (pediatric, internal medicine, and family practice) subinternships or residencies (Table 4).
| Intervention service | Traditional services | Odds ratio (95% CI) | |
|---|---|---|---|
| Pediatric subinternship | 19.5% | 11.1% | 1.94 (0.83‐4.49) |
| Primary care subinternship | 68.3% | 70.8% | 0.89 (0.47‐1.67) |
| Pediatric residency | 18.6% | 8.3% | 2.52 (0.99‐6.37) |
| Primary care residency | 40.7% | 31.9% | 1.46 (0.79‐2.70) |
Resource Utilization
One hundred and thirty‐five patients were excluded from the resource utilization analysis (n = 594) because their unique identifiers could not be found or they had been admitted to the PICU. Univariate analysis demonstrated statistically significant differences for patients with asthma, but not patients with bronchiolitis, febrile infants, or patients with pneumonia, favoring the intervention service. Patients with asthma admitted to the intervention service had a shorter length of stay (49.9 vs. 70.1 hours, P = .02) and lower total charges ($3600 vs. $4600, P = .02), as shown in Table 5. Of 4 multivariate models controlling for age and severity of illness, each with length of stay and total charges as the dependant variables, length of stay was significantly less for patients with asthma admitted to the intervention service only. Such patients were discharged an average of 23.3 hours earlier than patients with asthma admitted to the traditional services (P = .02).
| Diagnosis (n) | n | Length of stay (hours) | P value | Total charges | ||||
|---|---|---|---|---|---|---|---|---|
| Intervention service | Traditional services | Intervention service | Traditional services | Intervention service | Traditional services | P value | ||
| ||||||||
| Bronchiolitis (210) | 159 | 51 | 63.7 | 70.5 | .20* | $4300 | $4800 | .20* |
| Febrile infant (152) | 105 | 47 | 58.8 | 58.9 | .50* | $4800 | $4900 | .28* |
| Pneumonia (123) | 82 | 41 | 84.3 | 116.8 | .71* | $6300 | $9200 | .63* |
| Asthma (109) | 80 | 29 | 49.9 | 70.1 | .02* | $3600 | $4600 | .02* |
DISCUSSION
This study's objective was to evaluate a third‐year pediatric clerkship structure that focuses on students, using multiple outcome parameters. Utilizing a robust design, the results of this study have demonstrated that the intervention service is more successful than the traditional services in several outcomes. Students assigned to the intervention service were more satisfied and more likely to select pediatrics as a career. These improvements were accomplished while maintaining similar process measures, student performance, and resource utilization compared with those of the traditional services.
Methods
The methods used in this study compare favorably with other evaluations of educational interventions. The present study incorporated a randomized controlled design.12 Although several studies of ambulatory clerkships used a randomized design, few randomized all eligible students.7, 8 The others used some form of selection prior to randomization. For example, in the Pangaro et al. study, students selected their clerkship site by lottery, with students selecting a certain site then offered the opportunity to participate in the intervention.6 The present study manifested several additional strengths. Multiple outcomes, including effects on patient care, were evaluated. Moreover, this study had a relatively large intervention group and total sample size compared with those in other medical education studies. Finally, because the intervention service had been in place for several years prior to its evaluation, the confounding influence of difficulties working out its implementation was minimized.
Results
Few studies of ambulatory experiences demonstrated statistically significant, let alone clinically significant, results. Most studies showed no statistically significant differences in student evaluations or examination scores. An exception is Grum et al., who showed improvements on 3 of 5 examinations.4 A few studies have found improved student satisfaction.3 None of the randomized controlled trials demonstrate increases in students matching in internal medicine or primary care residencies.4, 68 In contrast, this study produced statistically or programmatically significant results in process measures, evaluations, satisfaction, and career choices.
Several of our specific findings deserve additional comment. Although the admitting residents were instructed to assign patients to the intervention service based on their acuity and complexity, it is important to examine these residents' actual behavior. Several of our hypotheses were not validated. The students on the intervention service admitted fewer patients and were no more likely to see at least 1 patient in each age category. The admitting resident may have limited the number of patients admitted to the intervention service based on the workload of the supervising resident not that of the student. The supervising resident on the intervention service must round on all the patients, whereas the oversight of patients seen by students on the traditional services is shared with the interns. Having the attending on the intervention service share this supervising responsibility might improve this outcome.
Students on the intervention service had more positive attitudes toward the rotation. In addition, potentially negative attitudes were not manifest. For example, it might be argued that third‐year medical students are not prepared to bear this increased responsibility. However, there was not a significant difference in students' perception of the quality of supervision or the workload.
Although the goal of medical education is the production of competent physicians, it is important that the process not place undo burdens on patients and the health care system. Univariate analysis showed similar resource utilization. It might be contended that the admitting resident assigned the intervention service patients who were less acutely ill. Therefore, we performed multivariate analysis using APR‐DRG‐SOI to control for severity of illness. Of 8 comparisons, the only statistically significant difference, length of stay of patients with asthma, favored the intervention service.
Limitations
Although this study had numerous strengths, it also had several limitations. The primary limitations were lack of generalizability, difficulty in obtaining authentic assessments, the potential difference between statistical and educational significance, and inability to identify which components of the intervention service were responsible for the outcomes. This study's findings may not be generalizable to other institutions. For example, institutions without age or organ systembased teams may not observe increases in the number of key diagnoses encountered in the patients cared for. Regarding the assessments, there may be better measures of clinical competence, such as an objective structured clinical examination (OSCE),13 than those used in this study. However, there were not sufficient resources to implement an OSCE at the end of the rotation.
Some might question whether the statistically significant differences have educational significance. Although that is an important concern, this study should be compared with other educational interventions that found few statistically significant, let alone educationally significant, differences. To address this concern, we calculated effect sizes. The differences in student satisfaction were small to moderate. Although the lower limit of the 95% confidence interval of the odds ratio for matching in a pediatric residency was 0.99, the magnitude was programmatically important.
Finally, this study was an evaluation of an existing program. The authors were unable to control some potential confounders including patient allocation, average daily census, and quality of teaching. For example, Griffith and colleagues have shown that working with the best teachers improves student performance.14 We were not able to randomly assign the faculty among the services, and unequal distribution of better teachers could have biased this study's outcomes. The students on the intervention service rated their attendings, but not their residents, higher than did the students on the other services. However, the linear regression model showed that the perceived quality of the attending did not account for all the differences in student satisfaction. It was not possible to control for this factor in comparing student performance or subinternship or residency selection because the survey, which included the faculty evaluations, was anonymous and therefore could not be linked to the other data sets.
The perceived differences in the quality of teaching may not have been the result of differences in the attendings but instead of differences in the structure of the services. Accessibility is one of the characteristics of excellent clinical teachers.15 The intervention structure may permit faculty to spend more time with students, and this may increase the perceived quality of the teaching. However, it is not possible to resolve this issue with the available data.
CONCLUSIONS
The intervention service is a structure for the pediatric inpatient rotation of third‐year medical students that, instead of dividing the faculty and supervising resident's attention between interns and students, focuses their attention on the students. Although it has been difficult to demonstrate improvements as a result of the educational interventions, we have shown several improvements in the evaluations of the students. Moreover, the pattern of increased student satisfaction and a tendency toward more student selecting careers in pediatrics are remarkable. This was accomplished with similar resource utilization. Therefore, this program merits being continued at our institution and possibly adopted at other medical schools. Further research is needed to determine which aspects of the intervention are responsible for its effects. Some components, such as focused time with students, may be applicable to traditional services.
Acknowledgements
The authors thank Ronald Bloom for encouraging us to conduct this study; Kathy Bailey, Alice Dowling, and Margie Thompson for their assistance in the data collection; and Elizabeth Allen, Ronald Bloom, Flory Nkoy, Louis Pangaro, Stephanie Richardson, and Rajendu Srivastava for manuscript review.
- ,,.The role of the student ward in the medical clerkships.J Med Educ.1985;60:524–529.
- .Changing the fourth‐year medicine clerkship structure: A successful model for a teaching service without housestaff.J Gen Intern Med.1993;8:31–32.
- ,.A randomized, controlled pilot study of placing third‐year medical clerks in a continuity clinic.Acad Med.1993;68:845–847.
- ,,.Consequences of shifting medical‐student education to the outpatient setting: effects on performance and experiences.Acad Med.1996;71(suppl 1):S99–S101.
- ,.Learning outcomes of an ambulatory care rotation in internal medicine for junior medical students.J Gen Intern Med.1993;8:189–192.
- ,,,,.A prospective, randomized trial of a six‐week ambulatory medicine rotation.Acad Med.1995;70:537–541.
- ,,,,.Ambulatory versus inpatient rotations in teaching third‐year students internal medicine.J Gen Intern Med.1998;13:327–330.
- ,,,,.The effect of an ambulatory internal medicine rotation on students' career choices.Acad Med.1997;72:147–149.
- .Theme issue on medical education: Call for papers.JAMA.2005;293:742.
- Perkin RM,Swift JD,Newton DA, eds.Pediatric Hospital Medicine: Textbook of Inpatient Management.Philadelphia:Lippincott Williams 2003.
- .Call for greater emphasis on effect‐size measures in published articles in Teaching and Learning in Medicine.Teach Learn Med.2002;14:206–210.
- .Educational research and randomised trials.Med Educ.2002;36:1002–1003.
- ,.The objective structured clinical examination.Arch Pediatr Adolesc Med.2000;154:736–741.
- ,,,.Relationship of how well attending physicians teach to their student's performances and residency choices.Acad Med.1997;72(suppl 1):S118–S120.
- ,.Assessing quality and costs of education in the ambulatory setting: A review of the literature.Acad Med.2002;77:621–680.
Copyright © 2007 Society of Hospital Medicine