User login
Delays in Pediatric Discharge
Inpatient pediatrics is undergoing a paradigm shift in at least 3 ways. First, more children with chronic disease are being cared for in the hospital over time.1 Second, previous inpatient conditions are treated at home with advancing technology such as peripherally‐inserted catheters.2 Third, there are new areas of growing specialization, such as hospital medicine, in which the practitioners deliver more efficient care.3, 4
Nationwide, there is increasing pressure to improve inpatient quality of care. The Institute of Medicine defines 6 aims for improvement, including timeliness (reducing waits and sometimes harmful delays for both those who receive and those who give care) and efficiency of care (avoiding waste, including waste of equipment, supplies, ideas, and energy).5 Reducing unnecessary stays in the hospital is a potential quality measure that hospitals may use to address the timeliness and efficiency of care delivered to hospitalized children.
Delays in discharge have been used as markers of unnecessary stays in the hospital for inpatient adult and pediatric care,6, 7 but these are limited to inpatient systems from almost 20 years ago. Current reasons why patients are delayed from discharge, if at all, are not well described. We undertook this study to describe delays in hospital discharges at a tertiary‐care children's hospital in terms of number of patients, length of days of delay, and type of delay. In addition, we sought to characterize the impact of discharge delays on overall length of stay (LOS) and costs.
Methods
Patient Population/Study Design
All children cared for on 2 pediatric medical teams at Primary Children's Medical Center during the month of August 2004 were eligible for the study. Two research assistants independently attended team rounds and collected data relating to: the reasons for ongoing hospitalization, pending items (eg, consultations, tests), and the plan of care for that day. The research assistants each attended daily team rounds for the entire month of August (1 for each team, switching to the opposite team after 2 weeks). This was combined with information available in the Patient Tracker, a software tool developed to improve communication between caregivers and improve discharge efficiency.8 This software tool details diagnoses, daily medical care plans, discharge criteria, and ongoing medical interventions while tracking daily changes in interventions and the medical care plan for each patient cared for on a pediatric medical team.
The research assistants subsequently presented their observations along with information from Patient Tracker to 2 experienced physicians (R.S. and B.S.) who independently determined if a delay occurred, the number of delay days extending discharge, and the cause of the delay, if present, categorized according to the taxonomy of the Delay Tool.6, 7 If there was not enough information for either of the physicians to identify and classify a delay, the electronic medical record of the patient was also reviewed. Discrepancies between physicians assigning delays were discussed until consensus was reached.
The study was approved by the Institutional Review Board of the University of Utah Health Sciences Center and Primary Children's Medical Center (PCMC).
Setting
PCMC is a 233‐bed tertiary‐care children's hospital, owned and operated by Intermountain Healthcare (a not‐for‐profit vertically integrated managed care organization) in the Intermountain West, which serves as both the primary hospital for Salt Lake County and as a tertiary‐care children's hospital for 5 states (UT, MT, WY, ID, and NV).9
Study Definitions
Delay and Length of Delay
Delays in discharge were measured using a validated and reliable instrument, the Delay Tool.6, 7 A discharge was classified as delayed if there was no medical reason for the patient to be in the hospital on a given day, identical to the definition used in the original studies to validate the tool. Delays were recorded as whole days, not fractions of days or hours, as described in the original validation of the tool. For example, if the medical team requested a consultation, and the consultant's opinion was rendered late, but the patient would have remained in the hospital anyway, then this period of time would not count as a delay. However, if the medical team did not receive a consultant's opinion within the standard time (24 hours as defined for this study and in validating studies for the Delay Tool), and the patient's sole reason for being in the hospital during that day was waiting for that opinion, then that period of time would count toward a delay due to a late consultative opinion. Delays of less than 1 day, due to the mechanics of discharging a patient from the hospital (providing prescriptions, follow up, communication, arranging home health, and transportation) were not measured in this study, to match the original methodology of the Delay Tool.
Type of Delay
Primary reason for delay was assigned according to the taxonomy of the Delay Tool.6, 7 Delays were categorized to 1 of the following: (1) test scheduling; (2) obtaining test results; (3) surgery; (4) consultation; (5) patient (eg, family unavailable for decision‐making); (6) physician responsibility; (7) education, training. or research; (8) discharge planning or scheduling; and (9) availability of outside care and resources. There are 166 subcategories that clarify why a delay occurred. For example, within the main category of obtaining test results (2), there are 3 subcategories of delays related to problem in executing the test (2.1), return of results is delayed (2.2), and test results not reviewed within standard time of return (2.3). Subcategories are further divided to provide detail on the cause of delay. For example, a delay categorized as a 2.1:1 [(2) obtaining test results; (2.1) problem in executing the test; and 2.1:1 test to be done by MD is delayed beyond day desired], or 2.3:1 [(2) obtaining test results; (2.3) test results not reviewed within standard time of return; and 2.3:1 delay because physician did not review results]) both relate to physician causes of delays within the general category of obtaining test results. Some delays had more than 1 cause. A secondary cause of delay was assigned if applicable; however, the number of days delayed was attributed to the primary cause for analysis purposes.
Exemptions to Delay and Special Populations
Certain subpopulations of patients presented unique issues that led to them being unlikely to be classified as having a delay. For example, patients with a diagnosis of new onset of type 1 diabetes are historically admitted for 3 days at our hospital, which includes a specific education program; delays were not considered until this minimum period had passed. Children with medically complex care (eg, multisystem disease, multiple specialists involved, multiple medications) were included in this study.10 However, these children with frequent hospital admission were often fragile at discharge, and could meet criteria for readmission even on the date of their discharge, hence assigning a delay day was usually not indicated because of easily justified ongoing medical need for hospitalization.
Study Variables
The LOS, total costs, and routine demographic and administrative data for each study patient were extracted from Intermountain Healthcare's Enterprise Data Warehouse (EDW). The EDW contains detailed data about the cost of providing health care. Costs were derived from the hospital's cost accounting program, the Standard Cost Master, which is a transaction‐based microcosting accounting system.1113
For patients whose LOS extended before August 1 or after August 31, total hospital costs were averaged per day, and only days falling inside the month of August were counted in calculating the impact the delays in discharge had on the total costs of hospitalization. Hospital days that extended outside of August were not counted in either the numerator for potential days of delay or in the denominator for total days in the hospital.
Analyses
Descriptive statistics were calculated for the number, length of days of delay, and type of delay. Interrater reliability to assign a delay was ascertained for the 2 physicians. Mean LOS, mean total costs, and standard deviations (SDs) were calculated. All analyses were performed using Statistical Analytical Software version 9.13 (SAS Institute, Cary, NC).
Results
During the 31 days of the study, 171 patients occupied hospital beds an average of 7.3 days on the 2 inpatient medical teams, for a total of 911 inpatient days. Seven patients were admitted prior to August 1; 6 of these were discharged during the month of August and 1 stayed through the entire month and was discharged in September. Three additional patients were admitted in August and discharged in September. There were 6 readmissions during the month of August, and 1 patient was excluded from the study because of lack of sufficient information. All patients with delays were able to be classified according to the Delay Tool taxonomy. Interrater reliability for the 2 study physicians was 98%.
The characteristics between the patients who did and did not experience a delay in discharge are shown in Table 1. Thirty‐nine of 171 patients (22.8%), experienced at least 1 delay day. Eighteen of 39 patients had only 1 delay day (46.2%) and 11 patients experienced 2 delayed days (28.2%) (Figure 1). The average length of delay was 2.1 days.

| Nondelayed Patients (N = 132) | Delayed Patients (N = 39) | P Value | |
|---|---|---|---|
| |||
| Age (months), mean (SD)* | 22.6 (14.4) | 15.0 (14.6) | 0.009 |
| LOS during August (days), mean (SD)* | 4.64 (6.1) | 7.64 (7.15) | <0.001 |
| Total costs during August ($), mean (SD)* | 10,451 (19,254) | 14,341 (16,241) | 0.002 |
| Number of ICD‐9 CM diagnoses codes, mean (SD)* | 7.1 (7.4) | 8.5 (7.3) | 0.056 |
| Number of ICD‐9 CM procedure codes, mean (SD)* | 1.7 (3.8) | 1.6 (2.6) | 0.068 |
| Number of Patients with APR‐DRG SOI 3 (%) | 59 (44.7%) | 19 (48.7%) | 0.65 |
Delays attributed to physician responsibility accounted for 42.3% (16.5/39) of patient delays (conservative management or clinical decision‐making), with discharge planning delays accounting for 21.8% (family‐related, patient‐related, and hospital‐related problems), consultation for 14.1% (delay in obtaining or lack of follow‐up), test scheduling for 12.8%, and obtaining test results for 5.1% (ordering and weekend scheduling). There were no primary delays due to surgery, education and research, or unavailability of outside resources such as a skilled nursing bed. Four patients had a single additional secondary cause of delay assigned to them, related to physician responsibility, consultation, surgery and test scheduling; these were split, attributing 0.5 patients to each delay type (thus, the 17/39 patients delayed for physician responsibility was analyzed as 16.5/39) (Table 2).
| Delay Category | Number of Patients Experiencing Delays* | Percentage of All Patients Experiencing Delays (%) | Percentage of Study Patients Observed (%) | Total Delay Days | Average Length of Delays (days) | Percentage of Hospital Days That Were Delay Days (%) |
|---|---|---|---|---|---|---|
| ||||||
| 1. Scheduling | 5 | 12.8 | 2.92 | 16 | 3.20 | 1.76 |
| 2. Obtaining results | 2 | 5.1 | 1.17 | 3 | 1.50 | 0.33 |
| 3. Surgery | 0.5 | 1.3 | 0.29 | 1.5 | 3.00 | 0.16 |
| 4. Consultation | 5.5 | 14.1 | 3.22 | 10.5 | 1.91 | 1.15 |
| 5. Patient | 1 | 2.6 | 0.58 | 2 | 2.00 | 0.22 |
| 6. Physician | 16.5 | 42.3 | 9.65 | 33.5 | 2.03 | 3.68 |
| 7. Education | 0 | 0 | 0.00 | 0 | 0 | 0.00 |
| 8. Discharge | 8.5 | 21.8 | 4.97 | 15.5 | 1.82 | 1.70 |
| 9. Outside | 0 | 0 | 0.00 | 0 | 0 | 0.00 |
| Total | 39 | 100 | 22.81 | 82 | 2.10 | 9.00 |
There were 82 delay‐related hospital days of 911 total inpatient days on the 2 medical teams for August 2004 (9%). More than $170,000 in excess costs was incurred due to delay days from a total of approximately 1.9 million dollars in patient costs for the month (8.9%).
Discussion
This study finds that discharge delays in a tertiary care children's hospital are common; almost 1 in 4 patients experienced a medically unnecessary excess hospital stay of at least 1 day. The average length of a delay was 2.1 days, and overall, delays consumed 9% of pediatric hospital days and 8.9% of total costs. The most common reason for a delay was related to physician clinical care, including excessively conservative management and variability in clinical decision‐making.
Our study results are similar to the other 2 published studies that use the Delay Tool. In the adult and pediatric studies, between 10% and 30% of patients experienced a delay in discharge, with the average length of delay between 2.9 and 3 days.6, 7 Although both studies were conducted at teaching hospitals, what is particularly interesting is that they were conducted almost 20 years ago. During this period of time, there has been a shift in the inpatient pediatric patient population. In recent years, children who are cared for in the hospital have more chronic illnesses.1 In addition, there has been a shift in the types of conditions that may be cared for at home and those that now require inpatient stay.2 Despite this, delays continue at a similar proportion, but the cause of delays have shifted from scheduling and consultation to physician responsibility.
There is another tool in the literature which is more widely used, the Pediatric Appropriateness Evaluation Protocol (PAEP), which is based on the Appropriateness Evaluation Protocol for adults.1417 This tool is used to determine the appropriateness of ongoing hospitalization, not the cause of delay if ongoing hospitalization is inappropriate. The 3 areas that are evaluated (medical services, nursing and ancillary services, and patient's condition) have objective criteria that dictate if the hospitalization is appropriate or not (eg, parenteral (intravenous) therapy for at least 8 hours on that day, under nursing and ancillary services). The PAEP may be less sensitive given today's healthcare resource utilization climate. Many clinicians and families would agree that insertion of a peripheral central catheter is an acceptable form of outpatient treatment for many pediatric conditions. In conjunction with the Delay Tool, the PAEP could be used to determine if a delay occurred, then the Delay Tool used to categorize the cause of the delay. We choose to use expert clinician judgment to determine if a delay had occurred. We were more interested in why patients who are admitted (appropriately or inappropriately) cannot be discharged sooner, thus allowing for future intervention studies targeted to impact delays in discharge, as elucidated in this study. The Delay Tool specifically allowed us to categorize the reasons for delays. Given that the average LOS for patients in the nondelayed group was over 4 days, despite not using a tool such as the PAEP, we believe that these were likely to be appropriate admissions.
A recent study reported the first use of the Medical Care Appropriateness Protocol (MCAP) in a tertiary‐care children's hospital. The authors used the MCAP to determine the impact of an intervention on reducing inappropriate hospitals days for children. This tool is similarly labor‐intensive to the Delay Tool. Interestingly, this Canadian study found a high rate of inappropriate hospital days (47%), which may be in part attributable to a different outcome measurement tool and/or a different health care system.18
There are several limitations to our study that deserve mention. The Delay Tool requires clinician judgment regarding whether or not there was a delay in discharge for that day. We may have introduced some bias in our study, as hospitalist investigators assigned the delay and blinding to the attending physician specialty of record was not feasible. However, our results are similar to the other 2 published studies that have used this tool, and we specifically chose not to analyze or report results in terms of hospitalist and nonhospitalist attending physicians. The Delay Tool is not designed to differentiate shorter delays in terms of hours instead of days (eg, due to the inability for the patient to get a ride home). Shorter delays may be of particular importance depending on the occupancy rate of the hospital, the demand for beds, and other patient and hospital factors. We could not capture these shorter delays (although they did occur frequently) due to the original description of the Delay Tool. In addition, we would not have been able to report data on the impact on LOS and costs, as these are attributed to whole days in the hospital. However, if we had been able to differentiate shorter delays, this would bias our results to show a greater percentage of delays over smaller increments of time. Generalizability is an issue, given that this was a single‐center study. This study sample included over 80 different attending physicians participating in community pediatrician, subspecialty, and hospitalist practice groups. However, the patient population at PCMC is similar to other medium and large children's hospitals in the United States. The month observed may not reflect the entire year of hospitalizationsthere may be seasonal variations with delays depending on the volume and type of illness seen. The study was conducted in August, when there are newer house staff present. However, physician responsibility, which was the largest source of delays in our study, had little attribution to house staff. Most of the decisions were those of attending physicians, which would largely be unaffected by the time of year of the study. Finally, we were unable to assess the safety of the potential earlier discharge, as this was an observational study. However, in any future intervention studies examining processes to discharge patients sooner, measures of safety to the patient are a necessity. Finally, given the potential of ongoing admission, even on the date of discharge of our most fragile patients, this approach to discovering causes of delay may not apply to this important group, which is responsible for significant and growing resource utilization.
Despite these limitations, our findings demonstrate that in an era of children staying in the hospital less, and more medically‐complex children being admitted,10 a substantial number of children who are hospitalized at a children's hospital may have been discharged sooner. The majority of these decisions were directly related to physician responsibility. As consumers, providers, and hospitals work together to develop quality measures that are reflective of inpatient pediatric care, the Delay Tool may be able to highlight 2 aims of quality (ie, timeliness and efficiency of care) that could be used to assess the impact of interventions designed to safely discharge patients sooner. Interventions such as audit‐feedback,18 clinical guideline deployment,19 and hospitalist systems of care4 continue to hold the promise of earlier discharge; however, tools designed to measure inappropriate use of hospital days should be employed to demonstrate their effectiveness. Our study demonstrates ongoing waste in children's hospitals.
Conclusions
Almost 1 out of 4 patients in this 1‐month period could have been discharged sooner than they were. The impact of delays on costs and LOS are substantial and should provide strong incentives to develop effective interventions. Such interventions will need to address variations in physician criteria for discharge, more efficient discharge planning, and timely scheduling of consultation and diagnostic testing.
Acknowledgements
The authors thank Joni R. Beshanky and Harry Selker for their help and training in the use of the Delay Tool.
- .The transformation of child health in the United States: social disparities in child health persistent despite dramatic improvement in child health overall.Health Aff (Millwood).2004;23(5):9–25.
- , , , .Hospitalist care of medically complex children.Pediatr Res.2004;55(4):314A–315A.
- , , , .Pediatric hospitalists: a systematic review of the literature.Pediatrics.2006;117(5):1736–1744.
- , , , et al.Pediatric hospitalists: report of a leadership conference.Pediatrics.2006;117(4):1122–1130.
- Institute of Medicine.Crossing the Quality Chasm: A New Health System for the Twenty‐first Century.Washington, DC:National Academy Press;2001.
- , , .Using the Delay Tool to attribute causes for unnecessary pediatric hospital days.Med Care.1990;28(10):982–989.
- , , , .The epidemiology of delays in a teaching hospital. The development and use of a tool that detects unnecessary hospital days.Med Care.1989;27(2):112–129.
- , , , , .A tool for improving patient discharge process and hospital communication practices: the Patient Tracker.AMIA Annu Symp Proc.2007;11:493–497.
- , .Organizational responses to managed care: issues for academic health centers and implications for pediatric programs.Pediatrics.1998;101(4 Pt 2):805–811; discussion 811–802.
- , , .Hospitalist care of the medically complex child.Pediatr Clin North Am.2005;52(4):1165–1187.
- , , , et al.Epidemiology, complications, and cost of hospitalization in children with laboratory‐confirmed influenza infection.Pediatrics.2006;118(6):2409–2417.
- , , , , , .Clinical and economic outcomes of conventional amphotericin B‐associated nephrotoxicity.Clin Infect Dis.2002;35(12):e120–e127.
- , , , et al.Using a hospital information system to assess the effects of adverse drug events.Proc Annu Symp Comput Appl Med Care.1993;1993:161–165.
- , , .Appropriateness of hospitalization in a Canadian pediatric hospital.Pediatrics.1993;91(1):70–74.
- , , , .The appropriateness evaluation protocol: application in an Australian children's hospital.Aust Clin Rev.1991;11(4):123–131.
- , .Assessing the need to hospitalize children: pediatric appropriateness evaluation protocol.Pediatrics.1989;84(2):242–247.
- .Medically inappropriate hospital use in a pediatric population.N Engl J Med.1988;318(16):1033–1037.
- , , , , .Reducing inappropriate hospital use on a general pediatric inpatient unit.Pediatrics.2008;121(5):e1068–e1073.
- , .Reliable implementation of clinical pathways: what will it take—that is the question.J Pediatr.2008;152(3):303–304.
Inpatient pediatrics is undergoing a paradigm shift in at least 3 ways. First, more children with chronic disease are being cared for in the hospital over time.1 Second, previous inpatient conditions are treated at home with advancing technology such as peripherally‐inserted catheters.2 Third, there are new areas of growing specialization, such as hospital medicine, in which the practitioners deliver more efficient care.3, 4
Nationwide, there is increasing pressure to improve inpatient quality of care. The Institute of Medicine defines 6 aims for improvement, including timeliness (reducing waits and sometimes harmful delays for both those who receive and those who give care) and efficiency of care (avoiding waste, including waste of equipment, supplies, ideas, and energy).5 Reducing unnecessary stays in the hospital is a potential quality measure that hospitals may use to address the timeliness and efficiency of care delivered to hospitalized children.
Delays in discharge have been used as markers of unnecessary stays in the hospital for inpatient adult and pediatric care,6, 7 but these are limited to inpatient systems from almost 20 years ago. Current reasons why patients are delayed from discharge, if at all, are not well described. We undertook this study to describe delays in hospital discharges at a tertiary‐care children's hospital in terms of number of patients, length of days of delay, and type of delay. In addition, we sought to characterize the impact of discharge delays on overall length of stay (LOS) and costs.
Methods
Patient Population/Study Design
All children cared for on 2 pediatric medical teams at Primary Children's Medical Center during the month of August 2004 were eligible for the study. Two research assistants independently attended team rounds and collected data relating to: the reasons for ongoing hospitalization, pending items (eg, consultations, tests), and the plan of care for that day. The research assistants each attended daily team rounds for the entire month of August (1 for each team, switching to the opposite team after 2 weeks). This was combined with information available in the Patient Tracker, a software tool developed to improve communication between caregivers and improve discharge efficiency.8 This software tool details diagnoses, daily medical care plans, discharge criteria, and ongoing medical interventions while tracking daily changes in interventions and the medical care plan for each patient cared for on a pediatric medical team.
The research assistants subsequently presented their observations along with information from Patient Tracker to 2 experienced physicians (R.S. and B.S.) who independently determined if a delay occurred, the number of delay days extending discharge, and the cause of the delay, if present, categorized according to the taxonomy of the Delay Tool.6, 7 If there was not enough information for either of the physicians to identify and classify a delay, the electronic medical record of the patient was also reviewed. Discrepancies between physicians assigning delays were discussed until consensus was reached.
The study was approved by the Institutional Review Board of the University of Utah Health Sciences Center and Primary Children's Medical Center (PCMC).
Setting
PCMC is a 233‐bed tertiary‐care children's hospital, owned and operated by Intermountain Healthcare (a not‐for‐profit vertically integrated managed care organization) in the Intermountain West, which serves as both the primary hospital for Salt Lake County and as a tertiary‐care children's hospital for 5 states (UT, MT, WY, ID, and NV).9
Study Definitions
Delay and Length of Delay
Delays in discharge were measured using a validated and reliable instrument, the Delay Tool.6, 7 A discharge was classified as delayed if there was no medical reason for the patient to be in the hospital on a given day, identical to the definition used in the original studies to validate the tool. Delays were recorded as whole days, not fractions of days or hours, as described in the original validation of the tool. For example, if the medical team requested a consultation, and the consultant's opinion was rendered late, but the patient would have remained in the hospital anyway, then this period of time would not count as a delay. However, if the medical team did not receive a consultant's opinion within the standard time (24 hours as defined for this study and in validating studies for the Delay Tool), and the patient's sole reason for being in the hospital during that day was waiting for that opinion, then that period of time would count toward a delay due to a late consultative opinion. Delays of less than 1 day, due to the mechanics of discharging a patient from the hospital (providing prescriptions, follow up, communication, arranging home health, and transportation) were not measured in this study, to match the original methodology of the Delay Tool.
Type of Delay
Primary reason for delay was assigned according to the taxonomy of the Delay Tool.6, 7 Delays were categorized to 1 of the following: (1) test scheduling; (2) obtaining test results; (3) surgery; (4) consultation; (5) patient (eg, family unavailable for decision‐making); (6) physician responsibility; (7) education, training. or research; (8) discharge planning or scheduling; and (9) availability of outside care and resources. There are 166 subcategories that clarify why a delay occurred. For example, within the main category of obtaining test results (2), there are 3 subcategories of delays related to problem in executing the test (2.1), return of results is delayed (2.2), and test results not reviewed within standard time of return (2.3). Subcategories are further divided to provide detail on the cause of delay. For example, a delay categorized as a 2.1:1 [(2) obtaining test results; (2.1) problem in executing the test; and 2.1:1 test to be done by MD is delayed beyond day desired], or 2.3:1 [(2) obtaining test results; (2.3) test results not reviewed within standard time of return; and 2.3:1 delay because physician did not review results]) both relate to physician causes of delays within the general category of obtaining test results. Some delays had more than 1 cause. A secondary cause of delay was assigned if applicable; however, the number of days delayed was attributed to the primary cause for analysis purposes.
Exemptions to Delay and Special Populations
Certain subpopulations of patients presented unique issues that led to them being unlikely to be classified as having a delay. For example, patients with a diagnosis of new onset of type 1 diabetes are historically admitted for 3 days at our hospital, which includes a specific education program; delays were not considered until this minimum period had passed. Children with medically complex care (eg, multisystem disease, multiple specialists involved, multiple medications) were included in this study.10 However, these children with frequent hospital admission were often fragile at discharge, and could meet criteria for readmission even on the date of their discharge, hence assigning a delay day was usually not indicated because of easily justified ongoing medical need for hospitalization.
Study Variables
The LOS, total costs, and routine demographic and administrative data for each study patient were extracted from Intermountain Healthcare's Enterprise Data Warehouse (EDW). The EDW contains detailed data about the cost of providing health care. Costs were derived from the hospital's cost accounting program, the Standard Cost Master, which is a transaction‐based microcosting accounting system.1113
For patients whose LOS extended before August 1 or after August 31, total hospital costs were averaged per day, and only days falling inside the month of August were counted in calculating the impact the delays in discharge had on the total costs of hospitalization. Hospital days that extended outside of August were not counted in either the numerator for potential days of delay or in the denominator for total days in the hospital.
Analyses
Descriptive statistics were calculated for the number, length of days of delay, and type of delay. Interrater reliability to assign a delay was ascertained for the 2 physicians. Mean LOS, mean total costs, and standard deviations (SDs) were calculated. All analyses were performed using Statistical Analytical Software version 9.13 (SAS Institute, Cary, NC).
Results
During the 31 days of the study, 171 patients occupied hospital beds an average of 7.3 days on the 2 inpatient medical teams, for a total of 911 inpatient days. Seven patients were admitted prior to August 1; 6 of these were discharged during the month of August and 1 stayed through the entire month and was discharged in September. Three additional patients were admitted in August and discharged in September. There were 6 readmissions during the month of August, and 1 patient was excluded from the study because of lack of sufficient information. All patients with delays were able to be classified according to the Delay Tool taxonomy. Interrater reliability for the 2 study physicians was 98%.
The characteristics between the patients who did and did not experience a delay in discharge are shown in Table 1. Thirty‐nine of 171 patients (22.8%), experienced at least 1 delay day. Eighteen of 39 patients had only 1 delay day (46.2%) and 11 patients experienced 2 delayed days (28.2%) (Figure 1). The average length of delay was 2.1 days.
| Nondelayed Patients (N = 132) | Delayed Patients (N = 39) | P Value | |
|---|---|---|---|
| |||
| Age (months), mean (SD)* | 22.6 (14.4) | 15.0 (14.6) | 0.009 |
| LOS during August (days), mean (SD)* | 4.64 (6.1) | 7.64 (7.15) | <0.001 |
| Total costs during August ($), mean (SD)* | 10,451 (19,254) | 14,341 (16,241) | 0.002 |
| Number of ICD‐9 CM diagnoses codes, mean (SD)* | 7.1 (7.4) | 8.5 (7.3) | 0.056 |
| Number of ICD‐9 CM procedure codes, mean (SD)* | 1.7 (3.8) | 1.6 (2.6) | 0.068 |
| Number of Patients with APR‐DRG SOI 3 (%) | 59 (44.7%) | 19 (48.7%) | 0.65 |
Delays attributed to physician responsibility accounted for 42.3% (16.5/39) of patient delays (conservative management or clinical decision‐making), with discharge planning delays accounting for 21.8% (family‐related, patient‐related, and hospital‐related problems), consultation for 14.1% (delay in obtaining or lack of follow‐up), test scheduling for 12.8%, and obtaining test results for 5.1% (ordering and weekend scheduling). There were no primary delays due to surgery, education and research, or unavailability of outside resources such as a skilled nursing bed. Four patients had a single additional secondary cause of delay assigned to them, related to physician responsibility, consultation, surgery and test scheduling; these were split, attributing 0.5 patients to each delay type (thus, the 17/39 patients delayed for physician responsibility was analyzed as 16.5/39) (Table 2).
| Delay Category | Number of Patients Experiencing Delays* | Percentage of All Patients Experiencing Delays (%) | Percentage of Study Patients Observed (%) | Total Delay Days | Average Length of Delays (days) | Percentage of Hospital Days That Were Delay Days (%) |
|---|---|---|---|---|---|---|
| ||||||
| 1. Scheduling | 5 | 12.8 | 2.92 | 16 | 3.20 | 1.76 |
| 2. Obtaining results | 2 | 5.1 | 1.17 | 3 | 1.50 | 0.33 |
| 3. Surgery | 0.5 | 1.3 | 0.29 | 1.5 | 3.00 | 0.16 |
| 4. Consultation | 5.5 | 14.1 | 3.22 | 10.5 | 1.91 | 1.15 |
| 5. Patient | 1 | 2.6 | 0.58 | 2 | 2.00 | 0.22 |
| 6. Physician | 16.5 | 42.3 | 9.65 | 33.5 | 2.03 | 3.68 |
| 7. Education | 0 | 0 | 0.00 | 0 | 0 | 0.00 |
| 8. Discharge | 8.5 | 21.8 | 4.97 | 15.5 | 1.82 | 1.70 |
| 9. Outside | 0 | 0 | 0.00 | 0 | 0 | 0.00 |
| Total | 39 | 100 | 22.81 | 82 | 2.10 | 9.00 |
There were 82 delay‐related hospital days of 911 total inpatient days on the 2 medical teams for August 2004 (9%). More than $170,000 in excess costs was incurred due to delay days from a total of approximately 1.9 million dollars in patient costs for the month (8.9%).
Discussion
This study finds that discharge delays in a tertiary care children's hospital are common; almost 1 in 4 patients experienced a medically unnecessary excess hospital stay of at least 1 day. The average length of a delay was 2.1 days, and overall, delays consumed 9% of pediatric hospital days and 8.9% of total costs. The most common reason for a delay was related to physician clinical care, including excessively conservative management and variability in clinical decision‐making.
Our study results are similar to the other 2 published studies that use the Delay Tool. In the adult and pediatric studies, between 10% and 30% of patients experienced a delay in discharge, with the average length of delay between 2.9 and 3 days.6, 7 Although both studies were conducted at teaching hospitals, what is particularly interesting is that they were conducted almost 20 years ago. During this period of time, there has been a shift in the inpatient pediatric patient population. In recent years, children who are cared for in the hospital have more chronic illnesses.1 In addition, there has been a shift in the types of conditions that may be cared for at home and those that now require inpatient stay.2 Despite this, delays continue at a similar proportion, but the cause of delays have shifted from scheduling and consultation to physician responsibility.
There is another tool in the literature which is more widely used, the Pediatric Appropriateness Evaluation Protocol (PAEP), which is based on the Appropriateness Evaluation Protocol for adults.1417 This tool is used to determine the appropriateness of ongoing hospitalization, not the cause of delay if ongoing hospitalization is inappropriate. The 3 areas that are evaluated (medical services, nursing and ancillary services, and patient's condition) have objective criteria that dictate if the hospitalization is appropriate or not (eg, parenteral (intravenous) therapy for at least 8 hours on that day, under nursing and ancillary services). The PAEP may be less sensitive given today's healthcare resource utilization climate. Many clinicians and families would agree that insertion of a peripheral central catheter is an acceptable form of outpatient treatment for many pediatric conditions. In conjunction with the Delay Tool, the PAEP could be used to determine if a delay occurred, then the Delay Tool used to categorize the cause of the delay. We choose to use expert clinician judgment to determine if a delay had occurred. We were more interested in why patients who are admitted (appropriately or inappropriately) cannot be discharged sooner, thus allowing for future intervention studies targeted to impact delays in discharge, as elucidated in this study. The Delay Tool specifically allowed us to categorize the reasons for delays. Given that the average LOS for patients in the nondelayed group was over 4 days, despite not using a tool such as the PAEP, we believe that these were likely to be appropriate admissions.
A recent study reported the first use of the Medical Care Appropriateness Protocol (MCAP) in a tertiary‐care children's hospital. The authors used the MCAP to determine the impact of an intervention on reducing inappropriate hospitals days for children. This tool is similarly labor‐intensive to the Delay Tool. Interestingly, this Canadian study found a high rate of inappropriate hospital days (47%), which may be in part attributable to a different outcome measurement tool and/or a different health care system.18
There are several limitations to our study that deserve mention. The Delay Tool requires clinician judgment regarding whether or not there was a delay in discharge for that day. We may have introduced some bias in our study, as hospitalist investigators assigned the delay and blinding to the attending physician specialty of record was not feasible. However, our results are similar to the other 2 published studies that have used this tool, and we specifically chose not to analyze or report results in terms of hospitalist and nonhospitalist attending physicians. The Delay Tool is not designed to differentiate shorter delays in terms of hours instead of days (eg, due to the inability for the patient to get a ride home). Shorter delays may be of particular importance depending on the occupancy rate of the hospital, the demand for beds, and other patient and hospital factors. We could not capture these shorter delays (although they did occur frequently) due to the original description of the Delay Tool. In addition, we would not have been able to report data on the impact on LOS and costs, as these are attributed to whole days in the hospital. However, if we had been able to differentiate shorter delays, this would bias our results to show a greater percentage of delays over smaller increments of time. Generalizability is an issue, given that this was a single‐center study. This study sample included over 80 different attending physicians participating in community pediatrician, subspecialty, and hospitalist practice groups. However, the patient population at PCMC is similar to other medium and large children's hospitals in the United States. The month observed may not reflect the entire year of hospitalizationsthere may be seasonal variations with delays depending on the volume and type of illness seen. The study was conducted in August, when there are newer house staff present. However, physician responsibility, which was the largest source of delays in our study, had little attribution to house staff. Most of the decisions were those of attending physicians, which would largely be unaffected by the time of year of the study. Finally, we were unable to assess the safety of the potential earlier discharge, as this was an observational study. However, in any future intervention studies examining processes to discharge patients sooner, measures of safety to the patient are a necessity. Finally, given the potential of ongoing admission, even on the date of discharge of our most fragile patients, this approach to discovering causes of delay may not apply to this important group, which is responsible for significant and growing resource utilization.
Despite these limitations, our findings demonstrate that in an era of children staying in the hospital less, and more medically‐complex children being admitted,10 a substantial number of children who are hospitalized at a children's hospital may have been discharged sooner. The majority of these decisions were directly related to physician responsibility. As consumers, providers, and hospitals work together to develop quality measures that are reflective of inpatient pediatric care, the Delay Tool may be able to highlight 2 aims of quality (ie, timeliness and efficiency of care) that could be used to assess the impact of interventions designed to safely discharge patients sooner. Interventions such as audit‐feedback,18 clinical guideline deployment,19 and hospitalist systems of care4 continue to hold the promise of earlier discharge; however, tools designed to measure inappropriate use of hospital days should be employed to demonstrate their effectiveness. Our study demonstrates ongoing waste in children's hospitals.
Conclusions
Almost 1 out of 4 patients in this 1‐month period could have been discharged sooner than they were. The impact of delays on costs and LOS are substantial and should provide strong incentives to develop effective interventions. Such interventions will need to address variations in physician criteria for discharge, more efficient discharge planning, and timely scheduling of consultation and diagnostic testing.
Acknowledgements
The authors thank Joni R. Beshanky and Harry Selker for their help and training in the use of the Delay Tool.
- .The transformation of child health in the United States: social disparities in child health persistent despite dramatic improvement in child health overall.Health Aff (Millwood).2004;23(5):9–25.
- , , , .Hospitalist care of medically complex children.Pediatr Res.2004;55(4):314A–315A.
- , , , .Pediatric hospitalists: a systematic review of the literature.Pediatrics.2006;117(5):1736–1744.
- , , , et al.Pediatric hospitalists: report of a leadership conference.Pediatrics.2006;117(4):1122–1130.
- Institute of Medicine.Crossing the Quality Chasm: A New Health System for the Twenty‐first Century.Washington, DC:National Academy Press;2001.
- , , .Using the Delay Tool to attribute causes for unnecessary pediatric hospital days.Med Care.1990;28(10):982–989.
- , , , .The epidemiology of delays in a teaching hospital. The development and use of a tool that detects unnecessary hospital days.Med Care.1989;27(2):112–129.
- , , , , .A tool for improving patient discharge process and hospital communication practices: the Patient Tracker.AMIA Annu Symp Proc.2007;11:493–497.
- , .Organizational responses to managed care: issues for academic health centers and implications for pediatric programs.Pediatrics.1998;101(4 Pt 2):805–811; discussion 811–802.
- , , .Hospitalist care of the medically complex child.Pediatr Clin North Am.2005;52(4):1165–1187.
- , , , et al.Epidemiology, complications, and cost of hospitalization in children with laboratory‐confirmed influenza infection.Pediatrics.2006;118(6):2409–2417.
- , , , , , .Clinical and economic outcomes of conventional amphotericin B‐associated nephrotoxicity.Clin Infect Dis.2002;35(12):e120–e127.
- , , , et al.Using a hospital information system to assess the effects of adverse drug events.Proc Annu Symp Comput Appl Med Care.1993;1993:161–165.
- , , .Appropriateness of hospitalization in a Canadian pediatric hospital.Pediatrics.1993;91(1):70–74.
- , , , .The appropriateness evaluation protocol: application in an Australian children's hospital.Aust Clin Rev.1991;11(4):123–131.
- , .Assessing the need to hospitalize children: pediatric appropriateness evaluation protocol.Pediatrics.1989;84(2):242–247.
- .Medically inappropriate hospital use in a pediatric population.N Engl J Med.1988;318(16):1033–1037.
- , , , , .Reducing inappropriate hospital use on a general pediatric inpatient unit.Pediatrics.2008;121(5):e1068–e1073.
- , .Reliable implementation of clinical pathways: what will it take—that is the question.J Pediatr.2008;152(3):303–304.
Copyright © 2009 Society of Hospital Medicine
Quality of Life of Children with NI after Fundoplication for GERD
Aspiration pneumonia is the most common cause of death in children with severe neurological impairment (NI).13 For several reasons (eg, improved survival of extremely low‐birth‐weight infants, technological advances, and changing societal attitudes), the number of children with severe NI is increasing. Many children with severe NI have dysfunctional swallowing and gastroesophageal reflux disease (GERD).46 This combination places them at high risk for recurrent aspiration that, in turn, leads to aspiration pneumonia, repeated hospitalization, respiratory failure, compromised quality of life, and death.7, 8
The most common treatment approach for the combination of dysfunctional swallowing and GERD is surgical fundoplication with a gastrostomy feeding tube. Fundoplication is the third most common procedure performed in children by pediatric surgeons in the United States.9 Fifty percent of the children who receive a fundoplication have neurological impairment.10, 11 The goals of the surgery to treat GERD unresponsive to medical management are to reduce the risk of aspiration pneumonia, improve nutritional status, and improve the quality of life of the children and their families. However, few prospective longitudinal studies have determined whether the quality of life of the children or their caregivers actually improves over time.
The importance of caregiver and child quality of life is increasingly recognized as a critical outcome of any intervention in this population.12, 13 Previous studies of fundoplication in children with NI, GERD, and dysfunctional swallowing reported surgical mortality rates between 1% and 3% and other complications between 4% and 39%, reflecting the medical fragility of these children.5, 1418 Some of these studies had longitudinal follow‐up and reported long‐term data. Recurrence of symptoms was reported in up to 56% of patients, recurrence of AP in up to 39%, further surgical procedures in up to 19%, and mortality in up to 17%.14, 1921 Few case series of children with neurological impairment who have had a fundoplication have addressed child and caregiver quality of life following either a fundoplication or placement of a feeding tube.2224 In their study of 16 patients who had a fundoplication and gastrostomy tube placed, Tawfik et al. found improvements in children's happiness, ease of giving medicines, and time to devote to other children. Sullivan et al. found improvement in caregiver quality of life following placement of a gastrostomy tube in a child; however, they did not specifically identify those children who had been treated with a fundoplication. In their retrospective study, O'Neill et al. found improved child and caregiver quality of life following a fundoplication. Collectively, these studies have found that parents report improvement of both their own and their child's quality of life after either intervention. However, not having baseline measurements, not controlling for degree of functional impairment of the children, small sample sizes, and large loss to follow‐up limit the utility of these studies. In this ongoing, long‐term prospective longitudinal study, we report the initial impact of a fundoplication on the quality of life of both children and their caregivers.
The primary objective of this study was to determine change over time in the quality of life of children with neurological impairment who received surgical treatment of their GERD and of the caregivers of these children, controlling for the degree of functional impairment of the children. We hypothesized that child and caregiver quality of life would both improve after primary fundoplication and gastrostomy tube placement. Secondary objectives included describing rates of complications in this population.
METHODS
Setting and Study Population
We enrolled patients from newborn to 18 years of age who had a diagnosis compatible with neurological impairment and who received their first fundoplication for GERD between January 2005 and July 2006 at Primary Children's Medical Center (PCMC), in Salt Lake City, Utah. PCMC is a 232‐bed children's hospital in the Intermountain West owned and operated by Intermountain Healthcare, Inc., a large vertically integrated health care delivery system that serves as both the primary hospital for Salt Lake County and as the tertiary‐care hospital for 4 additional states (Wyoming, Nevada, Idaho, and Montana).25 Patients who had a previous gastrojejunal feeding tube were excluded as were patients who had a previous fundoplication, as these procedures may have biased their reported quality of life, our main outcome measure.
Patients were included in the study if they had GERD (based on clinical history or testing) that had been refractory to medical management (defined as continued gastroesophageal reflux symptoms despite antireflux medications). GERD was defined using the North American Society for Pediatric Gastroenterology, Hepatology and Nutrition (NASPGHAN) criteria.26 These include: the presence of clinical symptoms and at least 1 abnormal result from an upper gastrointestinal x‐ray series (recognizing that this test is neither sensitive nor specific for reflux), pH probe, upper gastrointestinal endoscopy with biopsy, nuclear medicine scan, or a modified barium swallow. As this was a prospective observational study, physicians were allowed to order testing as their practice dictated. Patients were excluded if they had neurological impairment but lacked objective documentation of GERD using the NASPGHAN recommendations, unless there were obvious clinical indications such as witnessed vomiting and aspiration (N = 3). No patient received a prophylactic fundoplication (fundoplication without documented GERD).
Study Design
This is an ongoing prospective longitudinal study. Patients who had a first fundoplication at PCMC were identified by the surgical service, with weekly lists shared with the research team. Patients were approached by a research assistant during that initial hospitalization to see if they met inclusion criteria for the study using data from the medical records and surgical team when necessary.
Data Variables and Sources
Indications for the fundoplication, performance and results of diagnostic testing for GERD, complications of the fundoplication, and reasons for the neurological impairment were obtained through review of the electronic and paper medical records. Mortality data, subsequent emergency department visits, and admissions to the hospital were obtained using Intermountain Healthcare's electronic data warehouse, which merges clinical, financial, and administrative data including the Utah Vital Statistics database.
Neurological impairment was defined from 2 sources: (1) clinical diagnoses as identified by providers and (2) International Classification of Diseases Codes Modified, version 9 (ICD‐9 CM) identified a priori as indicating neurological impairment.
Instruments and Study Outcomes
Functional status was measured using the WeeFIM. This instrument has been tested and shown to be valid and reliable for children more than 6 months old with neurodevelopmental disabilities including spina bifida and Down syndrome.2732 WeeFIM is a self‐administered parent instrument composed of 18 items and 6 domains (self‐care, sphincter control, transfers, locomotion, communication, and social cognition).33 The WeeFIM allows patients to be stratified into areas of function from severely impaired to normal.
The primary outcome was child quality of life as measured by the Child Health Questionnaire Parental Form 50 (CHQ‐PF50). Caregiver quality of life was measured using the Short‐Form Health Status Survey (SF‐36) and Parenting Stress Index/Short Form (PSI/SF). The CHQ‐PF50 is a self‐administered parent questionnaire of 50 questions that measures 6 domains, including physical function and abilities, pain and discomfort, general health perception, behavior, temperament and moods, and satisfaction with growth and development.34 This instrument has been tested for validity and reliability in children with cerebral palsy.35 The SF‐36 is a widely accepted measure of health status that measures 8 domains of health: physical functioning, role limitations due to physical problems, bodily pain, general health, vitality, social functioning, role limitations due to emotional problems, and mental health. The SF‐36 has been well studied and has been used to measure the effect on a caregiver's quality of life associated with caring for a chronically ill child with significant medical problems.36, 37 Higher scores in each domain of both the CHQPF50 and the SF‐36 reflect better quality of life. Caregiver stress was measured using the PSI/SF (Psychological Assessment Resources Inc, Odessa, FL).38 In the PSI/SF a parent rates the parentchild dyad on 36 items that are summarized in 3 subscales: parental distress, parentchild dysfunctional interaction, and difficult child. A parent scores each item as strongly agree, agree, not sure, disagree, or strongly disagree. The sum of the 3 subscale scores is the total stress score. Higher scores denote a greater degree of stress. The PSI/SF has been validated in several studies for caregivers of children with chronic diseases.3943
The CHQ‐PF50, SF‐36, and PSI/SF questionnaires and the WeeFIM functional status measure were administered to each study patient and caregiver in person at enrollment (baseline) and by mail 1 month after fundoplication. A follow‐up postcard reminder was mailed 1 week after the initial mailing. Second and final mailings were sent to nonresponders 3 and 5 weeks, respectively, after the initial mailing.
Secondary outcomes included rates of complications including failure of the fundoplication. Complications were defined as a subsequent emergency department visit, hospitalization, or death related to the surgery, gastrostomy tube, or aspiration pneumonia. Failures were defined as a second fundoplication or the insertion of a gastrojejunal feeding tube as nonsurgical management of recurrent GERD and/or paraesophageal hernia. Secondary outcomes were followed from the time of the first fundoplication until 1 month after surgery.
Analyses
The differential effect of the fundoplication on the quality of life measures was assessed and quantified through statistical analysis. Because the primary interest was to measure change in baseline characteristics over time, repeated‐measures models were used to compare the group relative to changes in functional status. In particular, changes from baseline values were modeled 1 month after the procedure. The Kenward‐Roger approximation of degrees of freedom was used to compute P values from the overall tests.44 Repeated‐measures models were fit to the data using restricted maximum likelihood estimation. An autoregressive covariance matrix was assumed for the multiple measurements of each individual, thus limiting the number of restrictions forced by the model on the data. The repeated‐measures models used all the available data on participants, including those who dropped out of the study. To obtain the most accurate comparison of the study group, the covariate of functional status at baseline was taken into account in the fitted models. Statistical analyses were performed with SAS statistical software (version 9.13; SAS Institute, Cary NC). Student t tests were performed for comparison of means of the quality‐of‐life domains for the study cohort compared to either the general population or specific groups of patients for comparative purposes.
The study was approved by the institutional review boards of the University of Utah Health Sciences Center and Primary Children's Medical Center.
RESULTS
Sixty‐three children met eligibility criteria. Forty‐four families (70%) initially agreed to participate in the study and completed the baseline questionnaires (see Fig. 1). The mean age of the children was 2.2 years. Twenty‐six parents of children completed the 1‐month postfundoplication quality‐of‐life questionnaires. Thirteen patients were lost to follow‐up, 5 of whom had not reached the 1‐month postfundoplication time point. The median WeeFIM (functional status) score of the whole group was 31.2 (95% confidence interval [CI] 11‐71) compared with a childhood matched‐age norm of 83 (95% CI 60‐110), P = .001. WeeFIM scores did not change significantly from baseline to 1 month, P = .98 (Kruskall‐Wallis test).
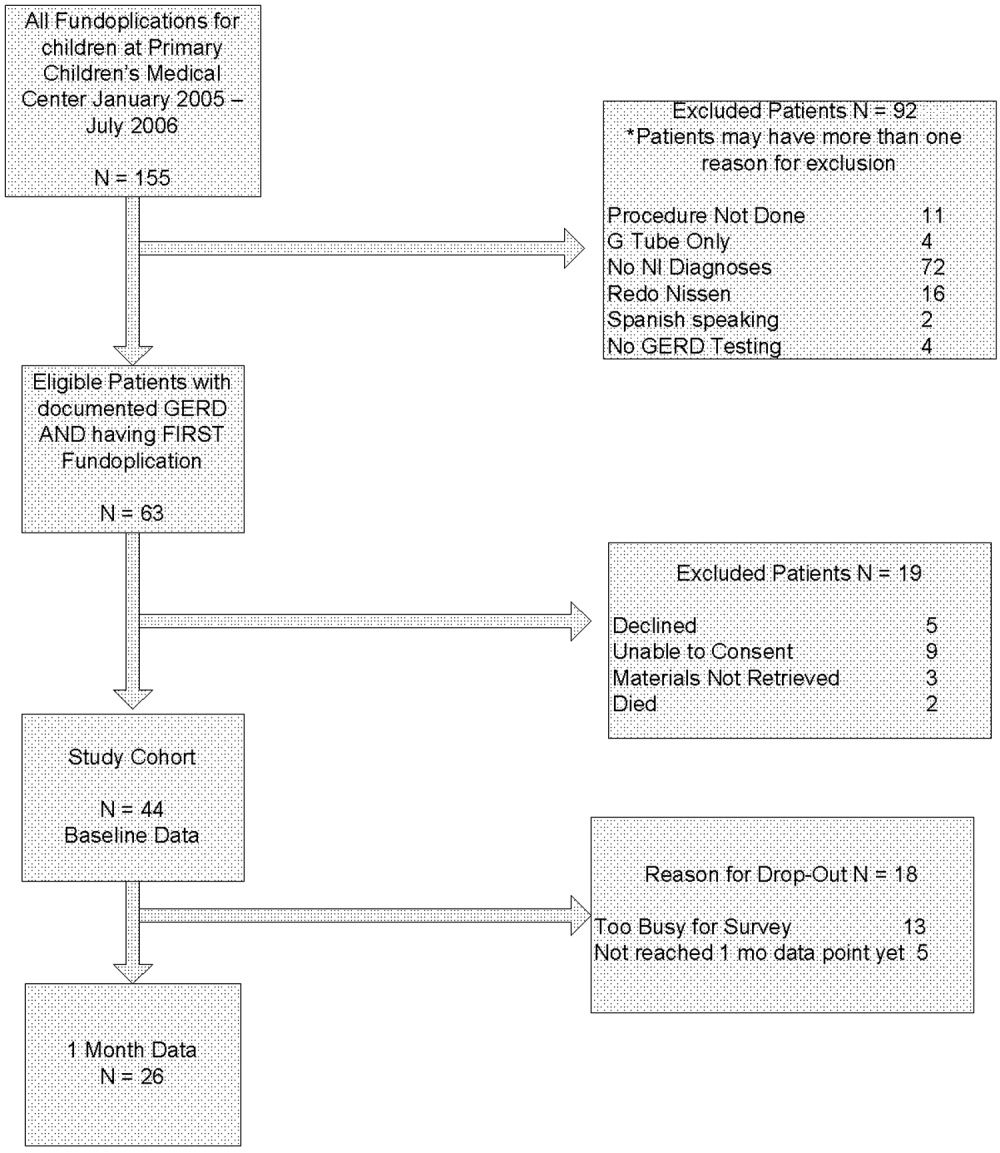
Data for the 13 parents and children (30%) who gave baseline data but were subsequently lost to follow‐up are shown in Table 1. Reasons for loss to follow‐up were caregiver reporting being too busy to fill out the questionnaires (n = 8) and no reason stated (n = 5).
In addition to the diagnosis of GERD, clinical indications for fundoplication were vomiting (55%), feeding‐related issues (47%), and failure to thrive (39%). Diagnosis of GERD was confirmed for 41 of 44 patients77% had an abnormal upper GI, 26% an abnormal pH probe, 14% an abnormal endoscopy, and 24% an abnormal swallow study. The remaining 3 had obvious clinical symptoms for GERD and did not require further testing according to their attending surgeon (2 with witnessed vomiting leading to aspiration and 1 who was exclusively gastrostomy‐fed and was witnessed having feeds coming from the tracheostomy). Various medications had been tried and were considered to have failed in these patients: 39% had been treated with acid‐suppressive agents; 80% with acid blocking agents; and 61% with prokinetic agents. Fourteen patients (32%) had cerebral palsy, and 14 (32%) had a brain or spinal cord abnormality (see Table 2).
| Diagnostic category | ICD‐9 codes used |
|---|---|
| |
| Brain or spinal cord anomaly | 335.22, 742.0, 742.1, 742.2, 742.4, 742.53 |
| Cerebral palsy | 343.0, 343.1, 343.2, 343.8, 343.9, 344.00 |
| Hydrocephalus | 331.3, 331.4, 742.3 |
| Down syndrome | 758.0 |
| Seizures | 345.10, 345.11, 345.3, 345.41, 345.50, 345.81, 345.90, 345.91 |
| Muscular dystrophy or myopathy | 359.0, 359.1, 359.2, 359.9 |
| Nervous system anomaly | 742.8, 742.9 |
| Cerebral degeneration | 330.8, 331.9 |
| Chromosomal anomaly | 758.2, 758.3, 758.5, 758.89 |
| Infantile spasms | 345.60, 345.61 |
| Menial retardation | 317.0, 318.1, 318.2 |
| Spinal muscle atrophy | 335.0, 335.10 |
Thirty‐four children underwent a laparoscopic Nissen fundoplication, and 10 had an open Nissen fundoplication. All had gastrostomy tubes placed or replaced at the time of surgery.
Analysis of the mean bodily pain scores from the CHQ‐PF50 revealed that bodily pain of patients in the study cohort had improved from baseline after 1 month of follow‐up (mean score at baseline, 32.8; after 1 month of follow‐up, 47.5; P = .01), after adjusting for functional status. However, these mean bodily pain scores were significantly lower than those of children with cerebral palsy (mean score, 73.9; P < .001).34, 35 After adjusting for functional status, scores were improved for role/social‐physical limitations (mean baseline score, 30.6; 1‐month follow‐up score, 56.6; P = .01), mental health (mean baseline score, 62.7; 1‐month follow‐up score, 70.6; P = .01), family limitation of activities (mean baseline score, 43.3; 1‐month follow‐up score, 55.1; P = .03), and parental time (mean baseline score, 43.0; 1‐month follow‐up score, 55.3; P = .03). Scores were unchanged for physical function, global health, general health perception, physical summary, role/social‐emotional, mental health, self‐esteem, and psychological summary (see Table 3).
| Domain of Quality of Life | Baseline (Mean and SD) | 1‐Month Follow‐Up (Mean and SD) | P Value |
|---|---|---|---|
| Physical functioning | 19.3 (34.1) | 16.7 (30.8) | 0.77 |
| Role physical* | 30.6 (44.4) | 56.6 (40.5) | 0.01 |
| Bodily pain* | 32.8 (24.4) | 47.5 (25.7) | 0.01 |
| Global health | 42.0 (23.7) | 44.1 (22.6) | 0.19 |
| General behavior | 72.1 (29.3) | 78.7 (14.5) | 0.21 |
| Self‐esteem | 39.9 (21.1) | 32.8 (19.4) | 0.36 |
| Mental health | 62.7 (15.9) | 70.6 (16.6) | 0.01 |
| Family limitation of activity* | 43.3 (23.7) | 55.1 (21.3) | 0.03 |
| Parental time* | 43.0 (35.5) | 55.3 (32.5) | 0.03 |
| Physical summary | 23.1 (21.2) | 17.8 (13.9) | 0.17 |
| Psychological summary | 39.0 (11.8) | 39.6 (10.8) | 0.76 |
Analysis of the SF‐36 of the parents of these children revealed mean scores significantly lower than those in general U.S. population for all quality‐of‐life domains except physical function (see Table 4). Many baseline domain scores were similar to those of adults with clinical depression. The only domain that showed improvement in quality of life of the caregivers over the 1‐month follow‐up period was vitality (mean baseline score, 41.3; 1‐month follow‐up score, 48.2; P = .001).
| Quality‐of‐life domain | Study group mean (SD) | U.S. population norm mean (SD) | P value |
|---|---|---|---|
| |||
| Physical functioning | 89.35 (14.60) | 84.15 (23.26) | 0.10 |
| Role physical | 71.02 (39.96) | 80.96 (34.00) | 0.05 |
| Bodily pain | 82.50 (24.00) | 75.15 (23.69) | 0.04 |
| General Health* | 59.07 (18.75) | 71.95 (20.34) | 0.001 |
| Vitality* | 41.33 (19.49) | 60.86 (33.04) | 0.001 |
| Social functioning* | 63.33 (34.48) | 83.28 (22.69) | 0.001 |
| Role emotional | 60.60 (40.20) | 81.26 (33.04) | 0.001 |
| Mental health | 67.00 (19.61) | 74.74 (18.05) | 0.004 |
Total stress as measured by the PSI/SF mean was 79.1 at baseline and 77.6 1 month after fundoplication (P = .54). This was significantly higher stress than the parental norm of 71.0 (P = .01). One in 4 parents expressed clinically significant levels of stress (scores > 90, 90th percentile).
Patients suffered the following complications in the month after fundoplication. Eight children had at least 1 subsequent emergency department visit related to a complication of the gastrostomy tube (8 visits), to respiratory distress (1 visit), or tovomiting (1 visit). Seven children had a subsequent admission to the hospital related to a complication of the gastrostomy tube (4 admissions), complication of surgery (2 admissions), or aspiration pneumonia (1 admission). None of the children had a repeat fundoplication or subsequently underwent placement of a gastrojejunal feeding tube. One patient died. She was 10 months old when she died, which was 3 weeks after she had received a fundoplication. She had obstructive hydrocephalus, cortical blindness, and developmental delay, and respiratory arrest and subsequent tonsillar herniation led to her death.
DISCUSSION
Parents of children with neurological impairment and GERD who underwent their first fundoplication reported improved quality of life of their children in the domains of bodily pain, role/social‐physical limitations, mental health, family limitation of activities, and parental time over the first month after surgery, when controlling for the children's degree of functional impairment. The only significant similar improvement in the parent self‐reported quality of life was in the domain of vitality.
This study had several limitations. Loss to follow‐up may have led to a bias reflecting the phenomenon that patients who have poorer quality of life are less likely to report this, or even to be able to participate in the follow‐up component of a study like this. In survival analyses, this incomplete follow‐up of patients is called informative dropout and may be minimized by applying a statistical technique that accounts for this, using the Q‐TWiST.45 However, our current study design and analysis plan precluded using this methodology. As shown in Table 1, we did not find any differences between those patients who stayed in the study and those who dropped out. Also, we were able to contact most parents who reported being too busy to fill out the surveys. Patient heterogeneity is also a concern: Table 2 shows the wide array of diagnoses responsible for the children's neurological impairment. However, we used a standardized functional status measure to ensure we were analyzing similarly disabled patients. Also, the standard deviation of the mean WeeFIM score was small, implying little variability in the study cohort. Our study analyzed data from a single center, which reflects care in the western United States. However, our hospital is similar to other medium and large children's hospitals and our patient population similar to others that perform fundoplication for children with neurological impairment.46 We believe our findings are generalizable to other surgical centers that perform a similar volume of fundoplications in such children with NI.
Our study findings are similar to those reported by O'Neill et al., whose study found that parents reported improved quality of life of their children in ease of feedings, physical comfort during feeding, and ability of the child to enjoy life.23 The CHQPF50 does not specifically ask about feeding, but we did find similar improvement in the domain of role/social‐physical limitations. O'Neill et al. also found that after the children in their study received a fundoplication, caregivers reported their own quality of life improved in the areas of being able to spend more time caring for their child's needs, which is similar to our findings of fewer family limitations of activities and more parental time. Our findings were somewhat dissimilar to the O'Neill et al. study, as parents in their study found several additional areas of improvement in caregiver own quality of life. One explanation for the differing results may be differences in the populations studied. Parents in our study had SF‐36 scores for general health, vitality, and social functioning that were similar to those of adults with depression,47 whereas parents in the O'Neill study did not. Although the O'Neill et al. study was the first to examine these critical quality‐of‐life outcomes for children with NI who have received fundoplication, it had several methodological limitations. We have had the opportunity to build on the work of O'Neill et al. and in a prospective study to capture standardized baseline data (therefore not subject to recall bias, as was likely in the O'Neill et al. study) and collect long‐term data on this population. We also controlled for functional status, which did not improve over the 1 month and by itself could be responsible for the already poor caregiver quality of life. Some aspects of the children's care did improve, but perhaps not enough to overcome the severe disabilities the children and their caregivers live with on a daily basis. We found some evidence to support that the parents' PSI/SF scores were similar to those of parents of children with heart disease, other enterally fed children, and children with traumatic brain injury (who make up between 1 in 3 and 1 in 5 parents with severe stress).39, 41, 43 Future interventions should address the stress and quality of life of these caregivers, especially if surgery does not improve caregiver quality of life or decrease stress.
Contrary to an emerging body of literature in pediatrics that describes a positive correlation between the health of children with chronic illnesses and their caregivers' quality of life,12, 42 we did not find large immediate improvements in caregiver quality of life and decrease in stress as their children's quality of life improved. This may be related to the number of parents in our sample being too small to detect such changes or that changes in longer‐term (greater than 6 months or 1 year) quality of life not being reflected by short‐term assessment. Caregiver and child quality of life following fundoplication needs to be studied over the long term (eg, over many years). We are continuing to follow these patients and their families and will repeat the quality‐of‐life measures 6 and 12 months after fundoplication and report these findings.
Additional studies of treatments for neurologically impaired children with GERD are needed. Randomized trials of alternatives to fundoplication such as gastrojejunal feeding tubes have been proposed, with which we strongly agree.46, 48 We believe that any randomized, controlled trial of children with neurological impairment and GERD must measure child and caregiver quality of life and functional status outcomes. 0
| Variables | Study patients at baseline (N = 44) | Study patients at 1‐month follow‐up (N = 26) | P value |
|---|---|---|---|
| Functional Status Measure | |||
| WeeFIM Score | 24 | 36 | NS |
| Child CHQ‐PF50 Quality‐of‐Life Scores | |||
| Role physical | 30.6 | 56.6 | 0.01 |
| Bodily pain | 32.8 | 47.5 | 0.01 |
| Mental health | 62.7 | 70.6 | 0.01 |
| Family limitation of activity | 43.3 | 55.1 | 0.03 |
| Parental time | 43.0 | 55.3 | 0.03 |
| Global health | 42.0 | 44.1 | NS |
| Physical functioning | 19.3 | 16.7 | NS |
| General behavior | 72.1 | 78.7 | NS |
| Self‐esteem | 39.9 | 32.8 | NS |
| Role emotional | 27.1 | 37.1 | NS |
| Physical summary | 23.1 | 17.8 | NS |
| Psychological summary | 39.0 | 39.6 | NS |
| Caregiver SF‐36 Quality‐of‐Life Scores | |||
| Vitality | 41.3 | 46.9 | 0.001 |
| Role physical | 89.9 | 92.5 | NS |
| Bodily pain | 71.0 | 78.7 | NS |
| General health | 82.5 | 81.1 | NS |
| Social functioning | 59.1 | 59.5 | NS |
| Role emotional | 60.6 | 65.6 | NS |
| Mental health | 67.0 | 73.5 | NS |
| Parenting stress index | 79.1 | 77.7 | NS |
Acknowledgements
The authors thank Tanner Coleman and Matthew Swenson for their invaluable help in recruiting patients. Dr. Srivastava was supported in part by the Children's Health Research Center, University of Utah and Primary Children's Medical Center Foundation.
- ,,.Comparison of respiratory mortality in the profoundly mentally retarded and in the less retarded.J Ment Defic Res.1979;23(1):1–7.
- ,,.Cause of death in cerebral palsy: a descriptive study.Arch Dis Child.1999;81:390–394.
- .Survival rates of children with severe neurologic disabilities: a review.Semin Pediatr Neurol.2003;10(2):120–129.
- ,.Gastroesophageal reflux among severely retarded children.J Pediatr.1979;94:710–714.
- ,,,,,.Operation for gastro‐oesophageal reflux associated with severe mental retardation.Arch Dis Child.1993;68:347–351.
- ,,,,,.Prevalence and severity of feeding and nutritional problems in children with neurological impairment: Oxford Feeding Study.Dev Med Child Neurol.2000;42:674–680.
- ,,, et al.Aspiration pneumonia in pediatric age group: etiology, predisposing factors and clinical outcome.J Pak Med Assoc.1999;49(4):105–108.
- ,.Respiratory problems in children with neurological impairment.Arch Dis Child.2003;88(1):75–78.
- ,.Gastroesophageal reflux in childhood.Curr Probl Surg.1996;33(1):1–70.
- ,.Minimally invasive surgical techniques in reoperative surgery for gastroesophageal reflux disease in infants and children.Am Surg.2002;68:989–992.
- .Laparoscopic Nissen procedure in children.Semin Laparosc Surg.2002;9(3):146–152.
- ,,, et al.Caregiving process and caregiver burden: conceptual models to guide research and practice.BMC Pediatr.2004;4(1):1.
- ,.Theoretical and psychometric analysis of caregiver strain.Res Nurs Health.1996;19:499–510.
- ,,,,,.Complications and reoperation after Nissen fundoplication in childhood.Am J Surg.1987;153(2):177–183.
- ,,, et al.Surgical treatment of gastroesophageal reflux in children: a combined hospital study of 7467 patients.Pediatrics.1998;101:419–422.
- ,,,,,.Outcomes of surgical fundoplication in children.Clin Gastroenterol Hepatol.2004;2:978–984.
- ,,, et al.The respiratory advantage of laparoscopic Nissen fundoplication.J Pediatr Surg.2003;38:886–891.
- ,,,.Laparoscopic Nissen fundoplication in children: 2‐5‐year follow‐up.Pediatr Surg Int.2003;19:537–539.
- ,,.Recognition of recurrent gastroesophageal reflux following antireflux surgery in the neurologically disabled child: high index of suspicion and definitive evaluation.J Pediatr Surg.1992;27:983–988; discussion988–990.
- ,,.Sequelae of antireflux surgery in profoundly disabled children.J Pediatr Surg.1992;27(2):267–271; discussion271–263.
- ,,.Efficacy of the Nissen fundoplication in the management of gastroesophageal reflux following esophageal atresia repair.J Pediatr Surg.1993;28(1):53–55.
- ,,,.Caregivers' perceptions following gastrostomy in severely disabled children with feeding problems.Dev Med Child Neurol.1997;39:746–751.
- ,,,,.Care‐giver evaluation of anti‐gastroesophageal reflux procedures in neurologically impaired children: what is the real‐life outcome?J Pediatr Surg.1996;31:375–380.
- ,,, et al.Impact of gastrostomy tube feeding on the quality of life of carers of children with cerebral palsy.Dev Med Child Neurol.2004;46:796–800.
- ,.Organizational responses to managed care: issues for academic health centers and implications for pediatric programs.Pediatrics.1998;101:805–811; discussion811–802.
- Children's Digestive Health and Nutrition Foundation Website. Gastroesophageal Reflux Disease in the Neurologically Impaired Child. Available at: http://www.cdhnf.org/PractitionerSeries.asp. Accessed August 30,2006.
- ,,,,.Functional status of school‐aged children with Down syndrome.J Paediatr Child Health.2002;38(2):160–165.
- ,,,,,.Concurrent validity of the Functional Independence Measure for Children (WeeFIM) and the Pediatric Evaluation of Disabilities Inventory in children with developmental disabilities and acquired brain injuries.Phys Occup Ther Pediatr.2001;21(2–3):91–101.
- ,,, et al.The WeeFIM instrument: its utility in detecting change in children with developmental disabilities.Arch Phys Med Rehabil.2000;81:1317–1326.
- ,,, et al.Functional assessment and care of children with neurodevelopmental disabilities.Am J Phys Med Rehabil.2000;79(2):114–123.
- ,,,,,.Predictors of mortality, morbidity, and disability in a cohort of infants < or = 28 weeks' gestation.Clin Pediatr (Phila).1993;32:521–527.
- ,.Content validity of a pediatric functional independence measure.Appl Nurs Res.1990;3(3):120–122.
- ,,, et al.The Functional Independence Measure for Children (WeeFIM). Conceptual basis and pilot use in children with developmental disabilities.Clin Pediatr (Phila). Jul1994;33:421–430.
- ,,.The CHQ User's Manual.1st ed.Boston, MA:The Health Institute, New England Medical Center,1996.
- ,,,,,.Comparing reliability and validity of pediatric instruments for measuring health and well‐being of children with spastic cerebral palsy.Dev Med Child Neurol.2002;44:468–476.
- ,,,,.Needs of carers of severely disabled people: are they identified and met adequately?Health Soc Care Community.2001;9(4):235–243.
- ,,.The realities of postoperative disability and the carer's burden.Ann R Coll Surg Engl.2001;83(3):215–218.
- Abdidin.Parenting Stress Index.3rd ed.Lutz, FL:Psychological Assessment Resources, Inc.;1995.
- ,,,.Parental stress and burden following traumatic brain injury amongst children and adolescents.Brain Inj. Jan2003;17(1):1–23.
- ,,.Comparing stress levels of parents of children with cancer and parents of children with physical disabilities.Psychooncology. Dec2004;13(12):898–903.
- ,,.Stress levels experienced by the parents of enterally fed children.Child Care Health Dev.2004;30:507–513.
- ,,, et al.The health and well‐being of caregivers of children with cerebral palsy.Pediatrics.2005;115:e626–e636.
- ,.Parenting stress and children with heart disease.J Pediatr Health Care.2003;17(4):163–168.
- ,.Small sample inference for fixed effects from restricted maximum likelihood.Biometrics.1997;53:983–997.
- ,,.Methods for the analysis of quality‐of‐life and survival data in health technology assessment.Health Technol Assess.1999;3(10):1–152.
- ,,, et al.Fundoplication and gastrostomy versus image‐guided gastrojejunal tube for enteral feeding in neurologically impaired children with gastroesophageal reflux.J Pediatr Surg.2002;37:407–412.
- SF‐36 Health Survey: Manual and Interpretation Guide.Lincoln, RI:QualityMetric Inc.;1993,year="2000"2000.
- ,,.The role of protective antireflux procedures in neurologically impaired children: a decision analysis.J Pediatr Surg. Mar2002;37:500–506.
Aspiration pneumonia is the most common cause of death in children with severe neurological impairment (NI).13 For several reasons (eg, improved survival of extremely low‐birth‐weight infants, technological advances, and changing societal attitudes), the number of children with severe NI is increasing. Many children with severe NI have dysfunctional swallowing and gastroesophageal reflux disease (GERD).46 This combination places them at high risk for recurrent aspiration that, in turn, leads to aspiration pneumonia, repeated hospitalization, respiratory failure, compromised quality of life, and death.7, 8
The most common treatment approach for the combination of dysfunctional swallowing and GERD is surgical fundoplication with a gastrostomy feeding tube. Fundoplication is the third most common procedure performed in children by pediatric surgeons in the United States.9 Fifty percent of the children who receive a fundoplication have neurological impairment.10, 11 The goals of the surgery to treat GERD unresponsive to medical management are to reduce the risk of aspiration pneumonia, improve nutritional status, and improve the quality of life of the children and their families. However, few prospective longitudinal studies have determined whether the quality of life of the children or their caregivers actually improves over time.
The importance of caregiver and child quality of life is increasingly recognized as a critical outcome of any intervention in this population.12, 13 Previous studies of fundoplication in children with NI, GERD, and dysfunctional swallowing reported surgical mortality rates between 1% and 3% and other complications between 4% and 39%, reflecting the medical fragility of these children.5, 1418 Some of these studies had longitudinal follow‐up and reported long‐term data. Recurrence of symptoms was reported in up to 56% of patients, recurrence of AP in up to 39%, further surgical procedures in up to 19%, and mortality in up to 17%.14, 1921 Few case series of children with neurological impairment who have had a fundoplication have addressed child and caregiver quality of life following either a fundoplication or placement of a feeding tube.2224 In their study of 16 patients who had a fundoplication and gastrostomy tube placed, Tawfik et al. found improvements in children's happiness, ease of giving medicines, and time to devote to other children. Sullivan et al. found improvement in caregiver quality of life following placement of a gastrostomy tube in a child; however, they did not specifically identify those children who had been treated with a fundoplication. In their retrospective study, O'Neill et al. found improved child and caregiver quality of life following a fundoplication. Collectively, these studies have found that parents report improvement of both their own and their child's quality of life after either intervention. However, not having baseline measurements, not controlling for degree of functional impairment of the children, small sample sizes, and large loss to follow‐up limit the utility of these studies. In this ongoing, long‐term prospective longitudinal study, we report the initial impact of a fundoplication on the quality of life of both children and their caregivers.
The primary objective of this study was to determine change over time in the quality of life of children with neurological impairment who received surgical treatment of their GERD and of the caregivers of these children, controlling for the degree of functional impairment of the children. We hypothesized that child and caregiver quality of life would both improve after primary fundoplication and gastrostomy tube placement. Secondary objectives included describing rates of complications in this population.
METHODS
Setting and Study Population
We enrolled patients from newborn to 18 years of age who had a diagnosis compatible with neurological impairment and who received their first fundoplication for GERD between January 2005 and July 2006 at Primary Children's Medical Center (PCMC), in Salt Lake City, Utah. PCMC is a 232‐bed children's hospital in the Intermountain West owned and operated by Intermountain Healthcare, Inc., a large vertically integrated health care delivery system that serves as both the primary hospital for Salt Lake County and as the tertiary‐care hospital for 4 additional states (Wyoming, Nevada, Idaho, and Montana).25 Patients who had a previous gastrojejunal feeding tube were excluded as were patients who had a previous fundoplication, as these procedures may have biased their reported quality of life, our main outcome measure.
Patients were included in the study if they had GERD (based on clinical history or testing) that had been refractory to medical management (defined as continued gastroesophageal reflux symptoms despite antireflux medications). GERD was defined using the North American Society for Pediatric Gastroenterology, Hepatology and Nutrition (NASPGHAN) criteria.26 These include: the presence of clinical symptoms and at least 1 abnormal result from an upper gastrointestinal x‐ray series (recognizing that this test is neither sensitive nor specific for reflux), pH probe, upper gastrointestinal endoscopy with biopsy, nuclear medicine scan, or a modified barium swallow. As this was a prospective observational study, physicians were allowed to order testing as their practice dictated. Patients were excluded if they had neurological impairment but lacked objective documentation of GERD using the NASPGHAN recommendations, unless there were obvious clinical indications such as witnessed vomiting and aspiration (N = 3). No patient received a prophylactic fundoplication (fundoplication without documented GERD).
Study Design
This is an ongoing prospective longitudinal study. Patients who had a first fundoplication at PCMC were identified by the surgical service, with weekly lists shared with the research team. Patients were approached by a research assistant during that initial hospitalization to see if they met inclusion criteria for the study using data from the medical records and surgical team when necessary.
Data Variables and Sources
Indications for the fundoplication, performance and results of diagnostic testing for GERD, complications of the fundoplication, and reasons for the neurological impairment were obtained through review of the electronic and paper medical records. Mortality data, subsequent emergency department visits, and admissions to the hospital were obtained using Intermountain Healthcare's electronic data warehouse, which merges clinical, financial, and administrative data including the Utah Vital Statistics database.
Neurological impairment was defined from 2 sources: (1) clinical diagnoses as identified by providers and (2) International Classification of Diseases Codes Modified, version 9 (ICD‐9 CM) identified a priori as indicating neurological impairment.
Instruments and Study Outcomes
Functional status was measured using the WeeFIM. This instrument has been tested and shown to be valid and reliable for children more than 6 months old with neurodevelopmental disabilities including spina bifida and Down syndrome.2732 WeeFIM is a self‐administered parent instrument composed of 18 items and 6 domains (self‐care, sphincter control, transfers, locomotion, communication, and social cognition).33 The WeeFIM allows patients to be stratified into areas of function from severely impaired to normal.
The primary outcome was child quality of life as measured by the Child Health Questionnaire Parental Form 50 (CHQ‐PF50). Caregiver quality of life was measured using the Short‐Form Health Status Survey (SF‐36) and Parenting Stress Index/Short Form (PSI/SF). The CHQ‐PF50 is a self‐administered parent questionnaire of 50 questions that measures 6 domains, including physical function and abilities, pain and discomfort, general health perception, behavior, temperament and moods, and satisfaction with growth and development.34 This instrument has been tested for validity and reliability in children with cerebral palsy.35 The SF‐36 is a widely accepted measure of health status that measures 8 domains of health: physical functioning, role limitations due to physical problems, bodily pain, general health, vitality, social functioning, role limitations due to emotional problems, and mental health. The SF‐36 has been well studied and has been used to measure the effect on a caregiver's quality of life associated with caring for a chronically ill child with significant medical problems.36, 37 Higher scores in each domain of both the CHQPF50 and the SF‐36 reflect better quality of life. Caregiver stress was measured using the PSI/SF (Psychological Assessment Resources Inc, Odessa, FL).38 In the PSI/SF a parent rates the parentchild dyad on 36 items that are summarized in 3 subscales: parental distress, parentchild dysfunctional interaction, and difficult child. A parent scores each item as strongly agree, agree, not sure, disagree, or strongly disagree. The sum of the 3 subscale scores is the total stress score. Higher scores denote a greater degree of stress. The PSI/SF has been validated in several studies for caregivers of children with chronic diseases.3943
The CHQ‐PF50, SF‐36, and PSI/SF questionnaires and the WeeFIM functional status measure were administered to each study patient and caregiver in person at enrollment (baseline) and by mail 1 month after fundoplication. A follow‐up postcard reminder was mailed 1 week after the initial mailing. Second and final mailings were sent to nonresponders 3 and 5 weeks, respectively, after the initial mailing.
Secondary outcomes included rates of complications including failure of the fundoplication. Complications were defined as a subsequent emergency department visit, hospitalization, or death related to the surgery, gastrostomy tube, or aspiration pneumonia. Failures were defined as a second fundoplication or the insertion of a gastrojejunal feeding tube as nonsurgical management of recurrent GERD and/or paraesophageal hernia. Secondary outcomes were followed from the time of the first fundoplication until 1 month after surgery.
Analyses
The differential effect of the fundoplication on the quality of life measures was assessed and quantified through statistical analysis. Because the primary interest was to measure change in baseline characteristics over time, repeated‐measures models were used to compare the group relative to changes in functional status. In particular, changes from baseline values were modeled 1 month after the procedure. The Kenward‐Roger approximation of degrees of freedom was used to compute P values from the overall tests.44 Repeated‐measures models were fit to the data using restricted maximum likelihood estimation. An autoregressive covariance matrix was assumed for the multiple measurements of each individual, thus limiting the number of restrictions forced by the model on the data. The repeated‐measures models used all the available data on participants, including those who dropped out of the study. To obtain the most accurate comparison of the study group, the covariate of functional status at baseline was taken into account in the fitted models. Statistical analyses were performed with SAS statistical software (version 9.13; SAS Institute, Cary NC). Student t tests were performed for comparison of means of the quality‐of‐life domains for the study cohort compared to either the general population or specific groups of patients for comparative purposes.
The study was approved by the institutional review boards of the University of Utah Health Sciences Center and Primary Children's Medical Center.
RESULTS
Sixty‐three children met eligibility criteria. Forty‐four families (70%) initially agreed to participate in the study and completed the baseline questionnaires (see Fig. 1). The mean age of the children was 2.2 years. Twenty‐six parents of children completed the 1‐month postfundoplication quality‐of‐life questionnaires. Thirteen patients were lost to follow‐up, 5 of whom had not reached the 1‐month postfundoplication time point. The median WeeFIM (functional status) score of the whole group was 31.2 (95% confidence interval [CI] 11‐71) compared with a childhood matched‐age norm of 83 (95% CI 60‐110), P = .001. WeeFIM scores did not change significantly from baseline to 1 month, P = .98 (Kruskall‐Wallis test).
Data for the 13 parents and children (30%) who gave baseline data but were subsequently lost to follow‐up are shown in Table 1. Reasons for loss to follow‐up were caregiver reporting being too busy to fill out the questionnaires (n = 8) and no reason stated (n = 5).
In addition to the diagnosis of GERD, clinical indications for fundoplication were vomiting (55%), feeding‐related issues (47%), and failure to thrive (39%). Diagnosis of GERD was confirmed for 41 of 44 patients77% had an abnormal upper GI, 26% an abnormal pH probe, 14% an abnormal endoscopy, and 24% an abnormal swallow study. The remaining 3 had obvious clinical symptoms for GERD and did not require further testing according to their attending surgeon (2 with witnessed vomiting leading to aspiration and 1 who was exclusively gastrostomy‐fed and was witnessed having feeds coming from the tracheostomy). Various medications had been tried and were considered to have failed in these patients: 39% had been treated with acid‐suppressive agents; 80% with acid blocking agents; and 61% with prokinetic agents. Fourteen patients (32%) had cerebral palsy, and 14 (32%) had a brain or spinal cord abnormality (see Table 2).
| Diagnostic category | ICD‐9 codes used |
|---|---|
| |
| Brain or spinal cord anomaly | 335.22, 742.0, 742.1, 742.2, 742.4, 742.53 |
| Cerebral palsy | 343.0, 343.1, 343.2, 343.8, 343.9, 344.00 |
| Hydrocephalus | 331.3, 331.4, 742.3 |
| Down syndrome | 758.0 |
| Seizures | 345.10, 345.11, 345.3, 345.41, 345.50, 345.81, 345.90, 345.91 |
| Muscular dystrophy or myopathy | 359.0, 359.1, 359.2, 359.9 |
| Nervous system anomaly | 742.8, 742.9 |
| Cerebral degeneration | 330.8, 331.9 |
| Chromosomal anomaly | 758.2, 758.3, 758.5, 758.89 |
| Infantile spasms | 345.60, 345.61 |
| Menial retardation | 317.0, 318.1, 318.2 |
| Spinal muscle atrophy | 335.0, 335.10 |
Thirty‐four children underwent a laparoscopic Nissen fundoplication, and 10 had an open Nissen fundoplication. All had gastrostomy tubes placed or replaced at the time of surgery.
Analysis of the mean bodily pain scores from the CHQ‐PF50 revealed that bodily pain of patients in the study cohort had improved from baseline after 1 month of follow‐up (mean score at baseline, 32.8; after 1 month of follow‐up, 47.5; P = .01), after adjusting for functional status. However, these mean bodily pain scores were significantly lower than those of children with cerebral palsy (mean score, 73.9; P < .001).34, 35 After adjusting for functional status, scores were improved for role/social‐physical limitations (mean baseline score, 30.6; 1‐month follow‐up score, 56.6; P = .01), mental health (mean baseline score, 62.7; 1‐month follow‐up score, 70.6; P = .01), family limitation of activities (mean baseline score, 43.3; 1‐month follow‐up score, 55.1; P = .03), and parental time (mean baseline score, 43.0; 1‐month follow‐up score, 55.3; P = .03). Scores were unchanged for physical function, global health, general health perception, physical summary, role/social‐emotional, mental health, self‐esteem, and psychological summary (see Table 3).
| Domain of Quality of Life | Baseline (Mean and SD) | 1‐Month Follow‐Up (Mean and SD) | P Value |
|---|---|---|---|
| Physical functioning | 19.3 (34.1) | 16.7 (30.8) | 0.77 |
| Role physical* | 30.6 (44.4) | 56.6 (40.5) | 0.01 |
| Bodily pain* | 32.8 (24.4) | 47.5 (25.7) | 0.01 |
| Global health | 42.0 (23.7) | 44.1 (22.6) | 0.19 |
| General behavior | 72.1 (29.3) | 78.7 (14.5) | 0.21 |
| Self‐esteem | 39.9 (21.1) | 32.8 (19.4) | 0.36 |
| Mental health | 62.7 (15.9) | 70.6 (16.6) | 0.01 |
| Family limitation of activity* | 43.3 (23.7) | 55.1 (21.3) | 0.03 |
| Parental time* | 43.0 (35.5) | 55.3 (32.5) | 0.03 |
| Physical summary | 23.1 (21.2) | 17.8 (13.9) | 0.17 |
| Psychological summary | 39.0 (11.8) | 39.6 (10.8) | 0.76 |
Analysis of the SF‐36 of the parents of these children revealed mean scores significantly lower than those in general U.S. population for all quality‐of‐life domains except physical function (see Table 4). Many baseline domain scores were similar to those of adults with clinical depression. The only domain that showed improvement in quality of life of the caregivers over the 1‐month follow‐up period was vitality (mean baseline score, 41.3; 1‐month follow‐up score, 48.2; P = .001).
| Quality‐of‐life domain | Study group mean (SD) | U.S. population norm mean (SD) | P value |
|---|---|---|---|
| |||
| Physical functioning | 89.35 (14.60) | 84.15 (23.26) | 0.10 |
| Role physical | 71.02 (39.96) | 80.96 (34.00) | 0.05 |
| Bodily pain | 82.50 (24.00) | 75.15 (23.69) | 0.04 |
| General Health* | 59.07 (18.75) | 71.95 (20.34) | 0.001 |
| Vitality* | 41.33 (19.49) | 60.86 (33.04) | 0.001 |
| Social functioning* | 63.33 (34.48) | 83.28 (22.69) | 0.001 |
| Role emotional | 60.60 (40.20) | 81.26 (33.04) | 0.001 |
| Mental health | 67.00 (19.61) | 74.74 (18.05) | 0.004 |
Total stress as measured by the PSI/SF mean was 79.1 at baseline and 77.6 1 month after fundoplication (P = .54). This was significantly higher stress than the parental norm of 71.0 (P = .01). One in 4 parents expressed clinically significant levels of stress (scores > 90, 90th percentile).
Patients suffered the following complications in the month after fundoplication. Eight children had at least 1 subsequent emergency department visit related to a complication of the gastrostomy tube (8 visits), to respiratory distress (1 visit), or tovomiting (1 visit). Seven children had a subsequent admission to the hospital related to a complication of the gastrostomy tube (4 admissions), complication of surgery (2 admissions), or aspiration pneumonia (1 admission). None of the children had a repeat fundoplication or subsequently underwent placement of a gastrojejunal feeding tube. One patient died. She was 10 months old when she died, which was 3 weeks after she had received a fundoplication. She had obstructive hydrocephalus, cortical blindness, and developmental delay, and respiratory arrest and subsequent tonsillar herniation led to her death.
DISCUSSION
Parents of children with neurological impairment and GERD who underwent their first fundoplication reported improved quality of life of their children in the domains of bodily pain, role/social‐physical limitations, mental health, family limitation of activities, and parental time over the first month after surgery, when controlling for the children's degree of functional impairment. The only significant similar improvement in the parent self‐reported quality of life was in the domain of vitality.
This study had several limitations. Loss to follow‐up may have led to a bias reflecting the phenomenon that patients who have poorer quality of life are less likely to report this, or even to be able to participate in the follow‐up component of a study like this. In survival analyses, this incomplete follow‐up of patients is called informative dropout and may be minimized by applying a statistical technique that accounts for this, using the Q‐TWiST.45 However, our current study design and analysis plan precluded using this methodology. As shown in Table 1, we did not find any differences between those patients who stayed in the study and those who dropped out. Also, we were able to contact most parents who reported being too busy to fill out the surveys. Patient heterogeneity is also a concern: Table 2 shows the wide array of diagnoses responsible for the children's neurological impairment. However, we used a standardized functional status measure to ensure we were analyzing similarly disabled patients. Also, the standard deviation of the mean WeeFIM score was small, implying little variability in the study cohort. Our study analyzed data from a single center, which reflects care in the western United States. However, our hospital is similar to other medium and large children's hospitals and our patient population similar to others that perform fundoplication for children with neurological impairment.46 We believe our findings are generalizable to other surgical centers that perform a similar volume of fundoplications in such children with NI.
Our study findings are similar to those reported by O'Neill et al., whose study found that parents reported improved quality of life of their children in ease of feedings, physical comfort during feeding, and ability of the child to enjoy life.23 The CHQPF50 does not specifically ask about feeding, but we did find similar improvement in the domain of role/social‐physical limitations. O'Neill et al. also found that after the children in their study received a fundoplication, caregivers reported their own quality of life improved in the areas of being able to spend more time caring for their child's needs, which is similar to our findings of fewer family limitations of activities and more parental time. Our findings were somewhat dissimilar to the O'Neill et al. study, as parents in their study found several additional areas of improvement in caregiver own quality of life. One explanation for the differing results may be differences in the populations studied. Parents in our study had SF‐36 scores for general health, vitality, and social functioning that were similar to those of adults with depression,47 whereas parents in the O'Neill study did not. Although the O'Neill et al. study was the first to examine these critical quality‐of‐life outcomes for children with NI who have received fundoplication, it had several methodological limitations. We have had the opportunity to build on the work of O'Neill et al. and in a prospective study to capture standardized baseline data (therefore not subject to recall bias, as was likely in the O'Neill et al. study) and collect long‐term data on this population. We also controlled for functional status, which did not improve over the 1 month and by itself could be responsible for the already poor caregiver quality of life. Some aspects of the children's care did improve, but perhaps not enough to overcome the severe disabilities the children and their caregivers live with on a daily basis. We found some evidence to support that the parents' PSI/SF scores were similar to those of parents of children with heart disease, other enterally fed children, and children with traumatic brain injury (who make up between 1 in 3 and 1 in 5 parents with severe stress).39, 41, 43 Future interventions should address the stress and quality of life of these caregivers, especially if surgery does not improve caregiver quality of life or decrease stress.
Contrary to an emerging body of literature in pediatrics that describes a positive correlation between the health of children with chronic illnesses and their caregivers' quality of life,12, 42 we did not find large immediate improvements in caregiver quality of life and decrease in stress as their children's quality of life improved. This may be related to the number of parents in our sample being too small to detect such changes or that changes in longer‐term (greater than 6 months or 1 year) quality of life not being reflected by short‐term assessment. Caregiver and child quality of life following fundoplication needs to be studied over the long term (eg, over many years). We are continuing to follow these patients and their families and will repeat the quality‐of‐life measures 6 and 12 months after fundoplication and report these findings.
Additional studies of treatments for neurologically impaired children with GERD are needed. Randomized trials of alternatives to fundoplication such as gastrojejunal feeding tubes have been proposed, with which we strongly agree.46, 48 We believe that any randomized, controlled trial of children with neurological impairment and GERD must measure child and caregiver quality of life and functional status outcomes. 0
| Variables | Study patients at baseline (N = 44) | Study patients at 1‐month follow‐up (N = 26) | P value |
|---|---|---|---|
| Functional Status Measure | |||
| WeeFIM Score | 24 | 36 | NS |
| Child CHQ‐PF50 Quality‐of‐Life Scores | |||
| Role physical | 30.6 | 56.6 | 0.01 |
| Bodily pain | 32.8 | 47.5 | 0.01 |
| Mental health | 62.7 | 70.6 | 0.01 |
| Family limitation of activity | 43.3 | 55.1 | 0.03 |
| Parental time | 43.0 | 55.3 | 0.03 |
| Global health | 42.0 | 44.1 | NS |
| Physical functioning | 19.3 | 16.7 | NS |
| General behavior | 72.1 | 78.7 | NS |
| Self‐esteem | 39.9 | 32.8 | NS |
| Role emotional | 27.1 | 37.1 | NS |
| Physical summary | 23.1 | 17.8 | NS |
| Psychological summary | 39.0 | 39.6 | NS |
| Caregiver SF‐36 Quality‐of‐Life Scores | |||
| Vitality | 41.3 | 46.9 | 0.001 |
| Role physical | 89.9 | 92.5 | NS |
| Bodily pain | 71.0 | 78.7 | NS |
| General health | 82.5 | 81.1 | NS |
| Social functioning | 59.1 | 59.5 | NS |
| Role emotional | 60.6 | 65.6 | NS |
| Mental health | 67.0 | 73.5 | NS |
| Parenting stress index | 79.1 | 77.7 | NS |
Acknowledgements
The authors thank Tanner Coleman and Matthew Swenson for their invaluable help in recruiting patients. Dr. Srivastava was supported in part by the Children's Health Research Center, University of Utah and Primary Children's Medical Center Foundation.
- ,,.Comparison of respiratory mortality in the profoundly mentally retarded and in the less retarded.J Ment Defic Res.1979;23(1):1–7.
- ,,.Cause of death in cerebral palsy: a descriptive study.Arch Dis Child.1999;81:390–394.
- .Survival rates of children with severe neurologic disabilities: a review.Semin Pediatr Neurol.2003;10(2):120–129.
- ,.Gastroesophageal reflux among severely retarded children.J Pediatr.1979;94:710–714.
- ,,,,,.Operation for gastro‐oesophageal reflux associated with severe mental retardation.Arch Dis Child.1993;68:347–351.
- ,,,,,.Prevalence and severity of feeding and nutritional problems in children with neurological impairment: Oxford Feeding Study.Dev Med Child Neurol.2000;42:674–680.
- ,,, et al.Aspiration pneumonia in pediatric age group: etiology, predisposing factors and clinical outcome.J Pak Med Assoc.1999;49(4):105–108.
- ,.Respiratory problems in children with neurological impairment.Arch Dis Child.2003;88(1):75–78.
- ,.Gastroesophageal reflux in childhood.Curr Probl Surg.1996;33(1):1–70.
- ,.Minimally invasive surgical techniques in reoperative surgery for gastroesophageal reflux disease in infants and children.Am Surg.2002;68:989–992.
- .Laparoscopic Nissen procedure in children.Semin Laparosc Surg.2002;9(3):146–152.
- ,,, et al.Caregiving process and caregiver burden: conceptual models to guide research and practice.BMC Pediatr.2004;4(1):1.
- ,.Theoretical and psychometric analysis of caregiver strain.Res Nurs Health.1996;19:499–510.
- ,,,,,.Complications and reoperation after Nissen fundoplication in childhood.Am J Surg.1987;153(2):177–183.
- ,,, et al.Surgical treatment of gastroesophageal reflux in children: a combined hospital study of 7467 patients.Pediatrics.1998;101:419–422.
- ,,,,,.Outcomes of surgical fundoplication in children.Clin Gastroenterol Hepatol.2004;2:978–984.
- ,,, et al.The respiratory advantage of laparoscopic Nissen fundoplication.J Pediatr Surg.2003;38:886–891.
- ,,,.Laparoscopic Nissen fundoplication in children: 2‐5‐year follow‐up.Pediatr Surg Int.2003;19:537–539.
- ,,.Recognition of recurrent gastroesophageal reflux following antireflux surgery in the neurologically disabled child: high index of suspicion and definitive evaluation.J Pediatr Surg.1992;27:983–988; discussion988–990.
- ,,.Sequelae of antireflux surgery in profoundly disabled children.J Pediatr Surg.1992;27(2):267–271; discussion271–263.
- ,,.Efficacy of the Nissen fundoplication in the management of gastroesophageal reflux following esophageal atresia repair.J Pediatr Surg.1993;28(1):53–55.
- ,,,.Caregivers' perceptions following gastrostomy in severely disabled children with feeding problems.Dev Med Child Neurol.1997;39:746–751.
- ,,,,.Care‐giver evaluation of anti‐gastroesophageal reflux procedures in neurologically impaired children: what is the real‐life outcome?J Pediatr Surg.1996;31:375–380.
- ,,, et al.Impact of gastrostomy tube feeding on the quality of life of carers of children with cerebral palsy.Dev Med Child Neurol.2004;46:796–800.
- ,.Organizational responses to managed care: issues for academic health centers and implications for pediatric programs.Pediatrics.1998;101:805–811; discussion811–802.
- Children's Digestive Health and Nutrition Foundation Website. Gastroesophageal Reflux Disease in the Neurologically Impaired Child. Available at: http://www.cdhnf.org/PractitionerSeries.asp. Accessed August 30,2006.
- ,,,,.Functional status of school‐aged children with Down syndrome.J Paediatr Child Health.2002;38(2):160–165.
- ,,,,,.Concurrent validity of the Functional Independence Measure for Children (WeeFIM) and the Pediatric Evaluation of Disabilities Inventory in children with developmental disabilities and acquired brain injuries.Phys Occup Ther Pediatr.2001;21(2–3):91–101.
- ,,, et al.The WeeFIM instrument: its utility in detecting change in children with developmental disabilities.Arch Phys Med Rehabil.2000;81:1317–1326.
- ,,, et al.Functional assessment and care of children with neurodevelopmental disabilities.Am J Phys Med Rehabil.2000;79(2):114–123.
- ,,,,,.Predictors of mortality, morbidity, and disability in a cohort of infants < or = 28 weeks' gestation.Clin Pediatr (Phila).1993;32:521–527.
- ,.Content validity of a pediatric functional independence measure.Appl Nurs Res.1990;3(3):120–122.
- ,,, et al.The Functional Independence Measure for Children (WeeFIM). Conceptual basis and pilot use in children with developmental disabilities.Clin Pediatr (Phila). Jul1994;33:421–430.
- ,,.The CHQ User's Manual.1st ed.Boston, MA:The Health Institute, New England Medical Center,1996.
- ,,,,,.Comparing reliability and validity of pediatric instruments for measuring health and well‐being of children with spastic cerebral palsy.Dev Med Child Neurol.2002;44:468–476.
- ,,,,.Needs of carers of severely disabled people: are they identified and met adequately?Health Soc Care Community.2001;9(4):235–243.
- ,,.The realities of postoperative disability and the carer's burden.Ann R Coll Surg Engl.2001;83(3):215–218.
- Abdidin.Parenting Stress Index.3rd ed.Lutz, FL:Psychological Assessment Resources, Inc.;1995.
- ,,,.Parental stress and burden following traumatic brain injury amongst children and adolescents.Brain Inj. Jan2003;17(1):1–23.
- ,,.Comparing stress levels of parents of children with cancer and parents of children with physical disabilities.Psychooncology. Dec2004;13(12):898–903.
- ,,.Stress levels experienced by the parents of enterally fed children.Child Care Health Dev.2004;30:507–513.
- ,,, et al.The health and well‐being of caregivers of children with cerebral palsy.Pediatrics.2005;115:e626–e636.
- ,.Parenting stress and children with heart disease.J Pediatr Health Care.2003;17(4):163–168.
- ,.Small sample inference for fixed effects from restricted maximum likelihood.Biometrics.1997;53:983–997.
- ,,.Methods for the analysis of quality‐of‐life and survival data in health technology assessment.Health Technol Assess.1999;3(10):1–152.
- ,,, et al.Fundoplication and gastrostomy versus image‐guided gastrojejunal tube for enteral feeding in neurologically impaired children with gastroesophageal reflux.J Pediatr Surg.2002;37:407–412.
- SF‐36 Health Survey: Manual and Interpretation Guide.Lincoln, RI:QualityMetric Inc.;1993,year="2000"2000.
- ,,.The role of protective antireflux procedures in neurologically impaired children: a decision analysis.J Pediatr Surg. Mar2002;37:500–506.
