User login
Antiviral Therapy Improves Hepatocellular Cancer Survival
Hepatocellular cancer (HCC) is the most common type of hepatic cancers, accounting for 65% of all hepatic cancers.1 Among all cancers, HCC is one of the fastest growing causes of death in the United States, and the rate of new HCC cases are on the rise over several decades.2 There are many risk factors leading to HCC, including alcohol use, obesity, and smoking. Infection with hepatitis C virus (HCV) poses a significant risk.1
The pathogenesis of HCV-induced carcinogenesis is mediated by a unique host-induced immunologic response. Viral replication induces production of inflammatory factors, such as tumor necrosis factor (TNF-α), interferon (IFN), and oxidative stress on hepatocytes, resulting in cell injury, death, and regeneration. Repetitive cycles of cellular death and regeneration induce fibrosis, which may lead to cirrhosis.3 Hence, early treatment of HCV infection and achieving sustained virologic response (SVR) may lead to decreased incidence and mortality associated with HCC.
Treatment of HCV infection has become more effective with the development of direct-acting antivirals (DAAs) leading to SVR in > 90% of patients compared with 40 to 50% with IFN-based treatment.4,5 DAAs have been proved safe and highly effective in eradicating HCV infection even in patients with advanced liver disease with decompensated cirrhosis.6 Although achieving SVR indicates a complete cure from chronic HCV infection, several studies have shown subsequent risk of developing HCC persists even after successful HCV treatment.7-9 Some studies show that using DAAs to achieve SVR in patients with HCV infection leads to a decreased relative risk of HCC development compared with patients who do not receive treatment.10-12 But data on HCC risk following DAA-induced SVR vs IFN-induced SVR are somewhat conflicting.
Much of the information regarding the association between SVR and HCC has been gleaned from large data banks without accounting for individual patient characteristics that can be obtained through full chart review. Due to small sample sizes in many chart review studies, the impact that SVR from DAA therapy has on the progression and severity of HCC is not entirely clear. The aim of our study is to evaluate the effect of HCV treatment and SVR status on overall survival (OS) in patients with HCC. Second, we aim to compare survival benefits, if any exist, among the 2 major HCV treatment modalities (IFN vs DAA).
Methods
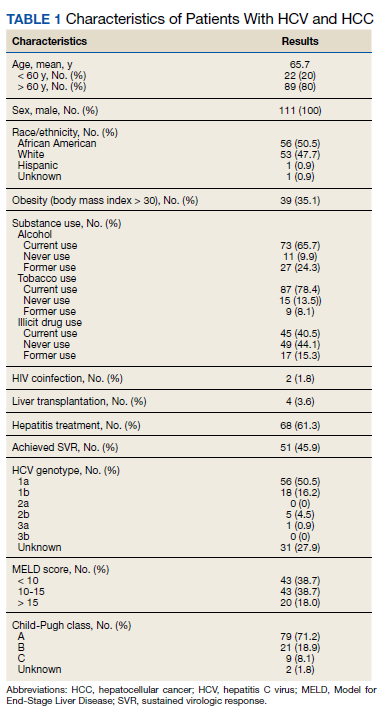
We performed a retrospective review of patients at Memphis Veterans Affairs Medical Center (VAMC) in Tennessee to determine whether treatment for HCV infection in general, and achieving SVR in particular, makes a difference in progression, recurrence, or OS among patients with HCV infection who develop HCC. We identified 111 patients with a diagnosis of both HCV and new or recurrent HCC lesions from November 2008 to March 2019 (Table 1). We divided these patients based on their HCV treatment status, SVR status, and treatment types (IFN vs DAA).
The inclusion criteria were patients aged > 18 years treated at the Memphis VAMC who have HCV infection and developed HCC. Exclusion criteria were patients who developed HCC from other causes such as alcoholic steatohepatitis, hepatitis B virus infection, hemochromatosis, patients without HCV infection, and patients who were not established at the Memphis VAMC. This protocol was approved by the Memphis VAMC Institutional Review Board.
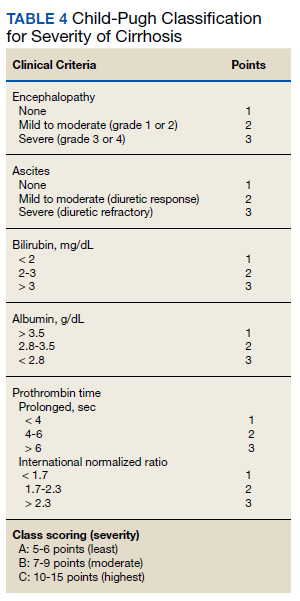
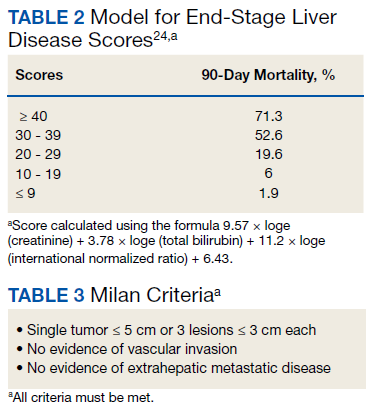
HCC diagnosis was determined using International Classification of Diseases codes (9th revision: 155 and 155.2; 10th revision: CD 22 and 22.9). We also used records of multidisciplinary gastrointestinal malignancy tumor conferences to identify patient who had been diagnosed and treated for HCV infection. We identified patients who were treated with DAA vs IFN as well as patients who had achieved SVR (classified as having negative HCV RNA tests at the end of DAA treatment). We were unable to evaluate Barcelona Clinic Liver Cancer staging since this required documented performance status that was not available in many patient records. We selected cases consistent with both treatment for HCV infection and subsequent development of HCC. Patient data included age; OS time; HIV status HCV genotype; time and status of progression to HCC; type and duration of treatment; and alcohol, tobacco, and drug use. Disease status was measured using the Model for End-Stage Liver Disease (MELD) score (Table 2), Milan criteria (Table 3), and Child-Pugh score (Table 4).
Statistical Analysis
OS was measured from the date of HCC diagnosis to the date of death or last follow-up. Progression-free survival (PFS) was defined from the date of HCC treatment initiation to the date of first HCC recurrence. We compared survival data for the SVR and non-SVR subgroups, the HCV treatment vs non-HCV treatment subgroups, and the IFN therapy vs DAA therapy subgroups, using the Kaplan-Meier method. The differences between subgroups were assessed using a log-rank test. Multivariate analysis using Cox proportional hazards regression model was used to identify factors that had significant impact on OS. Those factors included age; race; alcohol, tobacco, and illicit drug use; SVR status; HCV treatment status; IFN-based regimen vs DAA; MELD, and Child-Pugh scores. The results were expressed as hazard ratios (HRs) and 95% CI. Calculations were made using Statistical Analysis SAS and IBM SPSS software.
Results
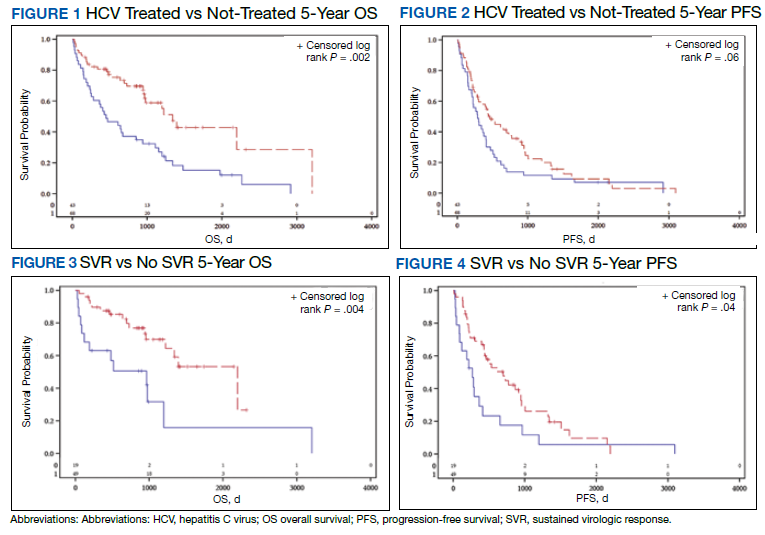
The study included 111 patients. The mean age was 65.7 years; all were male and half of were Black patients. The gender imbalance was due to the predominantly male patient population at Memphis VAMC. Among 111 patients with HCV infection and HCC, 68 patients were treated for HCV infection and had significantly improved OS and PFS compared with the nontreatment group. The median 5-year OS was 44.6 months (95% CI, 966-3202) in the treated HCV infection group compared with 15.1 months in the untreated HCV infection group with a Wilcoxon P = .0005 (Figure 1). Similarly, patients treated for HCV infection had a significantly better 5-year PFS of 15.3 months (95% CI, 294-726) compared with the nontreatment group 9.5 months (95% CI, 205-405) with a Wilcoxon P = .04 (Figure 2).
Among 68 patients treated for HCV infection, 51 achieved SVR, and 34 achieved SVR after the diagnosis of HCC. Patients who achieved SVR had an improved 5-year OS when compared with patients who did not achieve SVR (median 65.8 months [95% CI, 1222-NA] vs 15.7 months [95% CI, 242-853], Wilcoxon P < .001) (Figure 3). Similarly, patients with SVR had improved 5-year PFS when compared with the non-SVR group (median 20.5 months [95% CI, 431-914] vs 8.9 months [95% CI, 191-340], Wilcoxon P = .007 (Figure 4). Achievement of SVR after HCC diagnosis suggests a significantly improved OS (HR 0.37) compared with achievement prior to HCC diagnosis (HR, 0.65; 95% CI, 0.23-1.82, P = .41)
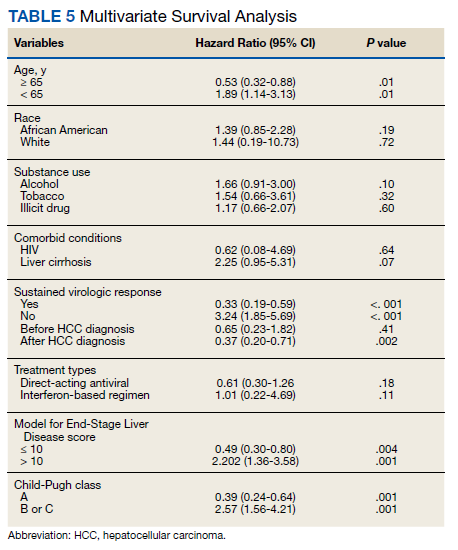
Multivariate Cox regression was used to determine factors with significant survival impact. Advanced age at diagnosis (aged ≥ 65 years) (HR, 0.53; 95% CI, 0.320-0.880; P = .01), SVR status (HR, 0.33; 95% CI, 0.190-0.587; P < .001), achieving SVR after HCC diagnosis (HR, 0.37; 95% CI, 0.20-0.71; P = .002), low MELD score (< 10) (HR, 0.49; 95% CI, 0.30-0.80; P = .004) and low Child-Pugh score (class A) (HR, 0.39; 95% CI, 0.24-0.64; P = .001) have a significant positive impact on OS. Survival was not significantly influenced by race, tobacco, drug use, HIV or cirrhosis status, or HCV treatment type. In addition, higher Child-Pugh class (B or C), higher MELD score (> 10), and younger age at diagnosis (< 65 years) have a negative impact on survival outcome (Table 5).
Discussion
The survival benefit of HCV eradication and achieving SVR status has been well established in patients with HCC.13 In a retrospective cohort study of 250 patients with HCV infection who had received curative treatment for HCC, multivariate analysis demonstrated that achieving SVR is an independent predictor of OS.14 The 3-year and 5-year OS rates were 97% and 94% for the SVR group, and 91% and 60% for the non‐SVR group, respectively (P < .001). Similarly, according to Sou and colleagues, of 122 patients with HCV-related HCC, patients with SVR had longer OS than patients with no SVR (P = .04).15 One of the hypotheses that could explain the survival benefit in patients who achieved SVR is the effect of achieving SVR in reducing persistent liver inflammation and associated liver mortality, and therefore lowering risks of complication in patients with HCC.16 In our study, multivariate analysis shows that achieving SVR is associated with significant improved OS (HR, 0.33). In contrast, patients with HCC who have not achieved SVR are associated with worse survival (HR, 3.24). This finding supports early treatment of HCV to obtain SVR in HCV-related patients with HCC, even after development of HCC.
Among 68 patients treated for HCV infection, 45 patients were treated after HCC diagnosis, and 34 patients achieved SVR after HCC diagnosis. The average time between HCV infection treatment after HCC diagnosis was 6 months. Our data suggested that achievement of SVR after HCC diagnosis suggests an improved OS (HR, 0.37) compared with achievement prior to HCC diagnosis (HR, 0.65; 95% CI,0.23-1.82; P = .41). This lack of statistical significance is likely due to small sample size of patients achieving SVR prior to HCC diagnosis. Our results are consistent with the findings regarding the efficacy and timing of DAA treatment in patients with active HCC. According to Singal and colleagues, achieving SVR after DAA therapy may result in improved liver function and facilitate additional HCC-directed therapy, which potentially improves survival.17-19
Nagaoki and colleagues found that there was no significant difference in OS in patients with HCC between the DAA and IFN groups. According to the study, the 3-year and 5-year OS rates were 96% and 96% for DAA patients and 93% and 73% for IFN patients, respectively (P = .16).14 This finding is consistent with the results of our study. HCV treatment type (IFN vs DAA) was not found to be associated with either OS or PFS time, regardless of time period.
A higher MELD score (> 10) and a higher Child-Pugh class (B or C) score are associated with worse survival outcome regardless of SVR status. While patients with a low MELD score (≤ 10) have a better survival rate (HR 0.49), a higher MELD score has a significantly higher HR and therefore worse survival outcomes (HR, 2.20). Similarly, patients with Child-Pugh A (HR, 0.39) have a better survival outcome compared with those patients with Child-Pugh class B or C (HR, 2.57). This finding is consistent with results of multiple studies indicating that advanced liver disease, as measured by a high MELD score and Child-Pugh class score, can be used to predict the survival outcome in patients with HCV-related HCC.20-22
Unlike other studies that look at a single prognostic variable, our study evaluated prognostic impacts of multiple variables (age, SVR status, the order of SVR in relation to HCC development, HCV treatment type, MELD score and Child-Pugh class) in patients with HCC. The study included patients treated for HCV after development of HCC along with other multiple variables leading to OS benefit. It is one of the only studies in the United States that compared 5-year OS and PFS among patients with HCC treated for HCV and achieved SVR. The studies by Nagaoki and colleagues and Sou and colleagues were conducted in Japan, and some of their subset analyses were univariate. Among our study population of veterans, 50% were African American patients, suggesting that they may have similar OS benefit when compared to White patients with HCC and HCV treatment.
Limitations
Our findings were limited in that our study population is too small to conduct further subset analysis that would allow statistical significance of those subsets, such as the suggested benefit of SVR in patients who presented with HCC after antiviral therapy. Another limitation is the all-male population, likely a result of the older veteran population at the Memphis VAMC. The mean age at diagnosis was 65 years, which is slightly higher than the general population. Compared to the SEER database, HCC is most frequently diagnosed among people aged 55 to 64 years.23 The age difference was likely due to our aging veteran population.
Further studies are needed to determine the significance of SVR on HCC recurrence and treatment. Immunotherapy is now first-line treatment for patients with local advanced HCC. All the immunotherapy studies excluded patients with active HCV infection. Hence, we need more data on HCV treatment timing among patients scheduled to start treatment with immunotherapy.
Conclusions
In a population of older veterans, treatment of HCV infection leads to OS benefit among patients with HCC. In addition, patients with HCV infection who achieve SVR have an OS benefit over patients unable to achieve SVR. The type of treatment, DAA vs IFN-based regimen, did not show significant survival benefit.
1. Ghouri YA, Mian I, Rowe JH. Review of hepatocellular carcinoma: epidemiology, etiology, and carcinogenesis. J Carcinog. 2017;16:1. Published 2017 May 29. doi:10.4103/jcar.JCar_9_16
2. Bray F, Ferlay J, Soerjomataram I, Siegel RL, Torre LA, Jemal A. Global cancer statistics 2018: GLOBOCAN estimates of incidence and mortality worldwide for 36 cancers in 185 countries. CA Cancer J Clin. 2018;68(6):394-424. doi:10.3322/caac.21492
3. Farazi PA, DePinho RA. Hepatocellular carcinoma pathogenesis: from genes to environment. Nat Rev Cancer. 2006;6(9):674-687. doi:10.1038/nrc1934
4. Falade-Nwulia O, Suarez-Cuervo C, Nelson DR, Fried MW, Segal JB, Sulkowski MS. Oral direct-acting agent therapy for hepatitis c virus infection: a systematic review. Ann Intern Med. 2017;166(9):637-648. doi:10.7326/M16-2575
5. Kouris G, Hydery T, Greenwood BC, et al. Effectiveness of Ledipasvir/Sofosbuvir and predictors of treatment failure in members with hepatitis C genotype 1 infection: a retrospective cohort study in a medicaid population. J Manag Care Spec Pharm. 2018;24(7):591-597. doi:10.18553/jmcp.2018.24.7.591
6. Jacobson IM, Lawitz E, Kwo PY, et al. Safety and efficacy of elbasvir/grazoprevir in patients with hepatitis c virus infection and compensated cirrhosis: an integrated analysis. Gastroenterology. 2017;152(6):1372-1382.e2. doi:10.1053/j.gastro.2017.01.050
7. Nahon P, Layese R, Bourcier V, et al. Incidence of hepatocellular carcinoma after direct antiviral therapy for HCV in patients with cirrhosis included in surveillance programs. Gastroenterology. 2018;155(5):1436-1450.e6. doi:10.1053/j.gastro.2018.07.01510.
8. Innes H, Barclay ST, Hayes PC, et al. The risk of hepatocellular carcinoma in cirrhotic patients with hepatitis C and sustained viral response: role of the treatment regimen. J Hepatol. 2018;68(4):646-654. doi:10.1016/j.jhep.2017.10.033
9. Romano A, Angeli P, Piovesan S, et al. Newly diagnosed hepatocellular carcinoma in patients with advanced hepatitis C treated with DAAs: a prospective population study. J Hepatol. 2018;69(2):345-352. doi:10.1016/j.jhep.2018.03.009
10. Kanwal F, Kramer J, Asch SM, Chayanupatkul M, Cao Y, El-Serag HB. Risk of hepatocellular cancer in HCV patients treated with direct-acting antiviral agents. Gastroenterology. 2017;153(4):996-1005.e1. doi:10.1053/j.gastro.2017.06.0122
11. Singh S, Nautiyal A, Loke YK. Oral direct-acting antivirals and the incidence or recurrence of hepatocellular carcinoma: a systematic review and meta-analysis. Frontline Gastroenterol. 2018;9(4):262-270. doi:10.1136/flgastro-2018-101017
12. Kuftinec G, Loehfelm T, Corwin M, et al. De novo hepatocellular carcinoma occurrence in hepatitis C cirrhotics treated with direct-acting antiviral agents. Hepat Oncol. 2018;5(1):HEP06. Published 2018 Jul 25. doi:10.2217/hep-2018-00033
13. Morgan RL, Baack B, Smith BD, Yartel A, Pitasi M, Falck-Ytter Y. Eradication of hepatitis C virus infection and the development of hepatocellular carcinoma: a meta-analysis of observational studies. Ann Intern Med. 2013;158(5 Pt 1):329-337. doi:10.7326/0003-4819-158-5-201303050-00005
14. Nagaoki Y, Imamura M, Nishida Y, et al. The impact of interferon-free direct-acting antivirals on clinical outcome after curative treatment for hepatitis C virus-associated hepatocellular carcinoma: comparison with interferon-based therapy. J Med Virol. 2019;91(4):650-658. doi:10.1002/jmv.25352
15. Sou FM, Wu CK, Chang KC, et al. Clinical characteristics and prognosis of HCC occurrence after antiviral therapy for HCV patients between sustained and non-sustained responders. J Formos Med Assoc. 2019;118(1 Pt 3):504-513. doi:10.1016/j.jfma.2018.10.017
16. Roche B, Coilly A, Duclos-Vallee JC, Samuel D. The impact of treatment of hepatitis C with DAAs on the occurrence of HCC. Liver Int. 2018;38(suppl 1):139-145. doi:10.1111/liv.13659
17. Singal AG, Lim JK, Kanwal F. AGA clinical practice update on interaction between oral direct-acting antivirals for chronic hepatitis C infection and hepatocellular carcinoma: expert review. Gastroenterology. 2019;156(8):2149-2157. doi:10.1053/j.gastro.2019.02.046
18. Toyoda H, Kumada T, Hayashi K, et al. Characteristics and prognosis of hepatocellular carcinoma detected in sustained responders to interferon therapy for chronic hepatitis C. Cancer Detect Prev. 2003;27(6):498-502. doi:10.1016/j.cdp.2003.09.00719. Okamura Y, Sugiura T, Ito T, et al. The achievement of a sustained virological response either before or after hepatectomy improves the prognosis of patients with primary hepatitis C virus-related hepatocellular carcinoma. Ann Surg Oncol. 2019; 26(13):4566-4575. doi:10.1245/s10434-019-07911-w
20. Wray CJ, Harvin JA, Silberfein EJ, Ko TC, Kao LS. Pilot prognostic model of extremely poor survival among high-risk hepatocellular carcinoma patients. Cancer. 2012;118(24):6118-6125. doi:10.1002/cncr.27649
21. Kim JH, Kim JH, Choi JH, et al. Value of the model for end-stage liver disease for predicting survival in hepatocellular carcinoma patients treated with transarterial chemoembolization. Scand J Gastroenterol. 2009;44(3):346-357. doi:10.1080/00365520802530838
22. Vogeler M, Mohr I, Pfeiffenberger J, et al. Applicability of scoring systems predicting outcome of transarterial chemoembolization for hepatocellular carcinoma. J Cancer Res Clin Oncol. 2020;146(4):1033-1050. doi:10.1007/s00432-020-03135-8
23. National Institutes of Health, Surveillance, Epidemiology, and End Results. Cancer stat facts: cancer of the liver and intrahepatic bile duct. Accessed July 15, 2021. https://seer.cancer.gov/statfacts/html/livibd.html
24. Singal AK, Kamath PS. Model for End-stage Liver Disease. J Clin Exp Hepatol. 2013;3(1):50-60. doi:10.1016/j.jceh.2012.11.002
Hepatocellular cancer (HCC) is the most common type of hepatic cancers, accounting for 65% of all hepatic cancers.1 Among all cancers, HCC is one of the fastest growing causes of death in the United States, and the rate of new HCC cases are on the rise over several decades.2 There are many risk factors leading to HCC, including alcohol use, obesity, and smoking. Infection with hepatitis C virus (HCV) poses a significant risk.1
The pathogenesis of HCV-induced carcinogenesis is mediated by a unique host-induced immunologic response. Viral replication induces production of inflammatory factors, such as tumor necrosis factor (TNF-α), interferon (IFN), and oxidative stress on hepatocytes, resulting in cell injury, death, and regeneration. Repetitive cycles of cellular death and regeneration induce fibrosis, which may lead to cirrhosis.3 Hence, early treatment of HCV infection and achieving sustained virologic response (SVR) may lead to decreased incidence and mortality associated with HCC.
Treatment of HCV infection has become more effective with the development of direct-acting antivirals (DAAs) leading to SVR in > 90% of patients compared with 40 to 50% with IFN-based treatment.4,5 DAAs have been proved safe and highly effective in eradicating HCV infection even in patients with advanced liver disease with decompensated cirrhosis.6 Although achieving SVR indicates a complete cure from chronic HCV infection, several studies have shown subsequent risk of developing HCC persists even after successful HCV treatment.7-9 Some studies show that using DAAs to achieve SVR in patients with HCV infection leads to a decreased relative risk of HCC development compared with patients who do not receive treatment.10-12 But data on HCC risk following DAA-induced SVR vs IFN-induced SVR are somewhat conflicting.
Much of the information regarding the association between SVR and HCC has been gleaned from large data banks without accounting for individual patient characteristics that can be obtained through full chart review. Due to small sample sizes in many chart review studies, the impact that SVR from DAA therapy has on the progression and severity of HCC is not entirely clear. The aim of our study is to evaluate the effect of HCV treatment and SVR status on overall survival (OS) in patients with HCC. Second, we aim to compare survival benefits, if any exist, among the 2 major HCV treatment modalities (IFN vs DAA).
Methods
We performed a retrospective review of patients at Memphis Veterans Affairs Medical Center (VAMC) in Tennessee to determine whether treatment for HCV infection in general, and achieving SVR in particular, makes a difference in progression, recurrence, or OS among patients with HCV infection who develop HCC. We identified 111 patients with a diagnosis of both HCV and new or recurrent HCC lesions from November 2008 to March 2019 (Table 1). We divided these patients based on their HCV treatment status, SVR status, and treatment types (IFN vs DAA).
The inclusion criteria were patients aged > 18 years treated at the Memphis VAMC who have HCV infection and developed HCC. Exclusion criteria were patients who developed HCC from other causes such as alcoholic steatohepatitis, hepatitis B virus infection, hemochromatosis, patients without HCV infection, and patients who were not established at the Memphis VAMC. This protocol was approved by the Memphis VAMC Institutional Review Board.
HCC diagnosis was determined using International Classification of Diseases codes (9th revision: 155 and 155.2; 10th revision: CD 22 and 22.9). We also used records of multidisciplinary gastrointestinal malignancy tumor conferences to identify patient who had been diagnosed and treated for HCV infection. We identified patients who were treated with DAA vs IFN as well as patients who had achieved SVR (classified as having negative HCV RNA tests at the end of DAA treatment). We were unable to evaluate Barcelona Clinic Liver Cancer staging since this required documented performance status that was not available in many patient records. We selected cases consistent with both treatment for HCV infection and subsequent development of HCC. Patient data included age; OS time; HIV status HCV genotype; time and status of progression to HCC; type and duration of treatment; and alcohol, tobacco, and drug use. Disease status was measured using the Model for End-Stage Liver Disease (MELD) score (Table 2), Milan criteria (Table 3), and Child-Pugh score (Table 4).
Statistical Analysis
OS was measured from the date of HCC diagnosis to the date of death or last follow-up. Progression-free survival (PFS) was defined from the date of HCC treatment initiation to the date of first HCC recurrence. We compared survival data for the SVR and non-SVR subgroups, the HCV treatment vs non-HCV treatment subgroups, and the IFN therapy vs DAA therapy subgroups, using the Kaplan-Meier method. The differences between subgroups were assessed using a log-rank test. Multivariate analysis using Cox proportional hazards regression model was used to identify factors that had significant impact on OS. Those factors included age; race; alcohol, tobacco, and illicit drug use; SVR status; HCV treatment status; IFN-based regimen vs DAA; MELD, and Child-Pugh scores. The results were expressed as hazard ratios (HRs) and 95% CI. Calculations were made using Statistical Analysis SAS and IBM SPSS software.
Results
The study included 111 patients. The mean age was 65.7 years; all were male and half of were Black patients. The gender imbalance was due to the predominantly male patient population at Memphis VAMC. Among 111 patients with HCV infection and HCC, 68 patients were treated for HCV infection and had significantly improved OS and PFS compared with the nontreatment group. The median 5-year OS was 44.6 months (95% CI, 966-3202) in the treated HCV infection group compared with 15.1 months in the untreated HCV infection group with a Wilcoxon P = .0005 (Figure 1). Similarly, patients treated for HCV infection had a significantly better 5-year PFS of 15.3 months (95% CI, 294-726) compared with the nontreatment group 9.5 months (95% CI, 205-405) with a Wilcoxon P = .04 (Figure 2).
Among 68 patients treated for HCV infection, 51 achieved SVR, and 34 achieved SVR after the diagnosis of HCC. Patients who achieved SVR had an improved 5-year OS when compared with patients who did not achieve SVR (median 65.8 months [95% CI, 1222-NA] vs 15.7 months [95% CI, 242-853], Wilcoxon P < .001) (Figure 3). Similarly, patients with SVR had improved 5-year PFS when compared with the non-SVR group (median 20.5 months [95% CI, 431-914] vs 8.9 months [95% CI, 191-340], Wilcoxon P = .007 (Figure 4). Achievement of SVR after HCC diagnosis suggests a significantly improved OS (HR 0.37) compared with achievement prior to HCC diagnosis (HR, 0.65; 95% CI, 0.23-1.82, P = .41)
Multivariate Cox regression was used to determine factors with significant survival impact. Advanced age at diagnosis (aged ≥ 65 years) (HR, 0.53; 95% CI, 0.320-0.880; P = .01), SVR status (HR, 0.33; 95% CI, 0.190-0.587; P < .001), achieving SVR after HCC diagnosis (HR, 0.37; 95% CI, 0.20-0.71; P = .002), low MELD score (< 10) (HR, 0.49; 95% CI, 0.30-0.80; P = .004) and low Child-Pugh score (class A) (HR, 0.39; 95% CI, 0.24-0.64; P = .001) have a significant positive impact on OS. Survival was not significantly influenced by race, tobacco, drug use, HIV or cirrhosis status, or HCV treatment type. In addition, higher Child-Pugh class (B or C), higher MELD score (> 10), and younger age at diagnosis (< 65 years) have a negative impact on survival outcome (Table 5).
Discussion
The survival benefit of HCV eradication and achieving SVR status has been well established in patients with HCC.13 In a retrospective cohort study of 250 patients with HCV infection who had received curative treatment for HCC, multivariate analysis demonstrated that achieving SVR is an independent predictor of OS.14 The 3-year and 5-year OS rates were 97% and 94% for the SVR group, and 91% and 60% for the non‐SVR group, respectively (P < .001). Similarly, according to Sou and colleagues, of 122 patients with HCV-related HCC, patients with SVR had longer OS than patients with no SVR (P = .04).15 One of the hypotheses that could explain the survival benefit in patients who achieved SVR is the effect of achieving SVR in reducing persistent liver inflammation and associated liver mortality, and therefore lowering risks of complication in patients with HCC.16 In our study, multivariate analysis shows that achieving SVR is associated with significant improved OS (HR, 0.33). In contrast, patients with HCC who have not achieved SVR are associated with worse survival (HR, 3.24). This finding supports early treatment of HCV to obtain SVR in HCV-related patients with HCC, even after development of HCC.
Among 68 patients treated for HCV infection, 45 patients were treated after HCC diagnosis, and 34 patients achieved SVR after HCC diagnosis. The average time between HCV infection treatment after HCC diagnosis was 6 months. Our data suggested that achievement of SVR after HCC diagnosis suggests an improved OS (HR, 0.37) compared with achievement prior to HCC diagnosis (HR, 0.65; 95% CI,0.23-1.82; P = .41). This lack of statistical significance is likely due to small sample size of patients achieving SVR prior to HCC diagnosis. Our results are consistent with the findings regarding the efficacy and timing of DAA treatment in patients with active HCC. According to Singal and colleagues, achieving SVR after DAA therapy may result in improved liver function and facilitate additional HCC-directed therapy, which potentially improves survival.17-19
Nagaoki and colleagues found that there was no significant difference in OS in patients with HCC between the DAA and IFN groups. According to the study, the 3-year and 5-year OS rates were 96% and 96% for DAA patients and 93% and 73% for IFN patients, respectively (P = .16).14 This finding is consistent with the results of our study. HCV treatment type (IFN vs DAA) was not found to be associated with either OS or PFS time, regardless of time period.
A higher MELD score (> 10) and a higher Child-Pugh class (B or C) score are associated with worse survival outcome regardless of SVR status. While patients with a low MELD score (≤ 10) have a better survival rate (HR 0.49), a higher MELD score has a significantly higher HR and therefore worse survival outcomes (HR, 2.20). Similarly, patients with Child-Pugh A (HR, 0.39) have a better survival outcome compared with those patients with Child-Pugh class B or C (HR, 2.57). This finding is consistent with results of multiple studies indicating that advanced liver disease, as measured by a high MELD score and Child-Pugh class score, can be used to predict the survival outcome in patients with HCV-related HCC.20-22
Unlike other studies that look at a single prognostic variable, our study evaluated prognostic impacts of multiple variables (age, SVR status, the order of SVR in relation to HCC development, HCV treatment type, MELD score and Child-Pugh class) in patients with HCC. The study included patients treated for HCV after development of HCC along with other multiple variables leading to OS benefit. It is one of the only studies in the United States that compared 5-year OS and PFS among patients with HCC treated for HCV and achieved SVR. The studies by Nagaoki and colleagues and Sou and colleagues were conducted in Japan, and some of their subset analyses were univariate. Among our study population of veterans, 50% were African American patients, suggesting that they may have similar OS benefit when compared to White patients with HCC and HCV treatment.
Limitations
Our findings were limited in that our study population is too small to conduct further subset analysis that would allow statistical significance of those subsets, such as the suggested benefit of SVR in patients who presented with HCC after antiviral therapy. Another limitation is the all-male population, likely a result of the older veteran population at the Memphis VAMC. The mean age at diagnosis was 65 years, which is slightly higher than the general population. Compared to the SEER database, HCC is most frequently diagnosed among people aged 55 to 64 years.23 The age difference was likely due to our aging veteran population.
Further studies are needed to determine the significance of SVR on HCC recurrence and treatment. Immunotherapy is now first-line treatment for patients with local advanced HCC. All the immunotherapy studies excluded patients with active HCV infection. Hence, we need more data on HCV treatment timing among patients scheduled to start treatment with immunotherapy.
Conclusions
In a population of older veterans, treatment of HCV infection leads to OS benefit among patients with HCC. In addition, patients with HCV infection who achieve SVR have an OS benefit over patients unable to achieve SVR. The type of treatment, DAA vs IFN-based regimen, did not show significant survival benefit.
1. Ghouri YA, Mian I, Rowe JH. Review of hepatocellular carcinoma: epidemiology, etiology, and carcinogenesis. J Carcinog. 2017;16:1. Published 2017 May 29. doi:10.4103/jcar.JCar_9_16
2. Bray F, Ferlay J, Soerjomataram I, Siegel RL, Torre LA, Jemal A. Global cancer statistics 2018: GLOBOCAN estimates of incidence and mortality worldwide for 36 cancers in 185 countries. CA Cancer J Clin. 2018;68(6):394-424. doi:10.3322/caac.21492
3. Farazi PA, DePinho RA. Hepatocellular carcinoma pathogenesis: from genes to environment. Nat Rev Cancer. 2006;6(9):674-687. doi:10.1038/nrc1934
4. Falade-Nwulia O, Suarez-Cuervo C, Nelson DR, Fried MW, Segal JB, Sulkowski MS. Oral direct-acting agent therapy for hepatitis c virus infection: a systematic review. Ann Intern Med. 2017;166(9):637-648. doi:10.7326/M16-2575
5. Kouris G, Hydery T, Greenwood BC, et al. Effectiveness of Ledipasvir/Sofosbuvir and predictors of treatment failure in members with hepatitis C genotype 1 infection: a retrospective cohort study in a medicaid population. J Manag Care Spec Pharm. 2018;24(7):591-597. doi:10.18553/jmcp.2018.24.7.591
6. Jacobson IM, Lawitz E, Kwo PY, et al. Safety and efficacy of elbasvir/grazoprevir in patients with hepatitis c virus infection and compensated cirrhosis: an integrated analysis. Gastroenterology. 2017;152(6):1372-1382.e2. doi:10.1053/j.gastro.2017.01.050
7. Nahon P, Layese R, Bourcier V, et al. Incidence of hepatocellular carcinoma after direct antiviral therapy for HCV in patients with cirrhosis included in surveillance programs. Gastroenterology. 2018;155(5):1436-1450.e6. doi:10.1053/j.gastro.2018.07.01510.
8. Innes H, Barclay ST, Hayes PC, et al. The risk of hepatocellular carcinoma in cirrhotic patients with hepatitis C and sustained viral response: role of the treatment regimen. J Hepatol. 2018;68(4):646-654. doi:10.1016/j.jhep.2017.10.033
9. Romano A, Angeli P, Piovesan S, et al. Newly diagnosed hepatocellular carcinoma in patients with advanced hepatitis C treated with DAAs: a prospective population study. J Hepatol. 2018;69(2):345-352. doi:10.1016/j.jhep.2018.03.009
10. Kanwal F, Kramer J, Asch SM, Chayanupatkul M, Cao Y, El-Serag HB. Risk of hepatocellular cancer in HCV patients treated with direct-acting antiviral agents. Gastroenterology. 2017;153(4):996-1005.e1. doi:10.1053/j.gastro.2017.06.0122
11. Singh S, Nautiyal A, Loke YK. Oral direct-acting antivirals and the incidence or recurrence of hepatocellular carcinoma: a systematic review and meta-analysis. Frontline Gastroenterol. 2018;9(4):262-270. doi:10.1136/flgastro-2018-101017
12. Kuftinec G, Loehfelm T, Corwin M, et al. De novo hepatocellular carcinoma occurrence in hepatitis C cirrhotics treated with direct-acting antiviral agents. Hepat Oncol. 2018;5(1):HEP06. Published 2018 Jul 25. doi:10.2217/hep-2018-00033
13. Morgan RL, Baack B, Smith BD, Yartel A, Pitasi M, Falck-Ytter Y. Eradication of hepatitis C virus infection and the development of hepatocellular carcinoma: a meta-analysis of observational studies. Ann Intern Med. 2013;158(5 Pt 1):329-337. doi:10.7326/0003-4819-158-5-201303050-00005
14. Nagaoki Y, Imamura M, Nishida Y, et al. The impact of interferon-free direct-acting antivirals on clinical outcome after curative treatment for hepatitis C virus-associated hepatocellular carcinoma: comparison with interferon-based therapy. J Med Virol. 2019;91(4):650-658. doi:10.1002/jmv.25352
15. Sou FM, Wu CK, Chang KC, et al. Clinical characteristics and prognosis of HCC occurrence after antiviral therapy for HCV patients between sustained and non-sustained responders. J Formos Med Assoc. 2019;118(1 Pt 3):504-513. doi:10.1016/j.jfma.2018.10.017
16. Roche B, Coilly A, Duclos-Vallee JC, Samuel D. The impact of treatment of hepatitis C with DAAs on the occurrence of HCC. Liver Int. 2018;38(suppl 1):139-145. doi:10.1111/liv.13659
17. Singal AG, Lim JK, Kanwal F. AGA clinical practice update on interaction between oral direct-acting antivirals for chronic hepatitis C infection and hepatocellular carcinoma: expert review. Gastroenterology. 2019;156(8):2149-2157. doi:10.1053/j.gastro.2019.02.046
18. Toyoda H, Kumada T, Hayashi K, et al. Characteristics and prognosis of hepatocellular carcinoma detected in sustained responders to interferon therapy for chronic hepatitis C. Cancer Detect Prev. 2003;27(6):498-502. doi:10.1016/j.cdp.2003.09.00719. Okamura Y, Sugiura T, Ito T, et al. The achievement of a sustained virological response either before or after hepatectomy improves the prognosis of patients with primary hepatitis C virus-related hepatocellular carcinoma. Ann Surg Oncol. 2019; 26(13):4566-4575. doi:10.1245/s10434-019-07911-w
20. Wray CJ, Harvin JA, Silberfein EJ, Ko TC, Kao LS. Pilot prognostic model of extremely poor survival among high-risk hepatocellular carcinoma patients. Cancer. 2012;118(24):6118-6125. doi:10.1002/cncr.27649
21. Kim JH, Kim JH, Choi JH, et al. Value of the model for end-stage liver disease for predicting survival in hepatocellular carcinoma patients treated with transarterial chemoembolization. Scand J Gastroenterol. 2009;44(3):346-357. doi:10.1080/00365520802530838
22. Vogeler M, Mohr I, Pfeiffenberger J, et al. Applicability of scoring systems predicting outcome of transarterial chemoembolization for hepatocellular carcinoma. J Cancer Res Clin Oncol. 2020;146(4):1033-1050. doi:10.1007/s00432-020-03135-8
23. National Institutes of Health, Surveillance, Epidemiology, and End Results. Cancer stat facts: cancer of the liver and intrahepatic bile duct. Accessed July 15, 2021. https://seer.cancer.gov/statfacts/html/livibd.html
24. Singal AK, Kamath PS. Model for End-stage Liver Disease. J Clin Exp Hepatol. 2013;3(1):50-60. doi:10.1016/j.jceh.2012.11.002
Liver Imaging Reporting and Data System in Patients at High Risk for Hepatocellular Carcinoma in the Memphis Veterans Affairs Population (FULL)
Although hepatocellular carcinoma can be difficult to detect, use of the LI-RADS algorithm could lead to earlier identification in at-risk patients.
Hepatocellular carcinoma (HCC) is the third most common cause of death from cancer worldwide.1 Liver cancer is the fifth most common cancer in men and the seventh in women.2 The highest incidence rates are in sub-Saharan Africa and Southeast Asia where hepatitis B virus is endemic. The incidence of HCC in western countries is increasing, particularly due to the rise of hepatitis C virus (HCV) as well as alcoholic liver disease and nonalcoholic fatty liver disease. The incidence of HCC has tripled in the US in the past 2 decades.1-3
HCC can be diagnosed by radiographic images without the need for biopsy if the typical imaging features are present.3 The European Association for the Study of Liver Disease (EASL) and the American Association for the Study of Liver Diseases (AASLD) recommend screening abdominal ultrasonography at 6-month intervals for high-risk patients.3,4 High-risk patients include patients with cirrhosis, especially those with hepatitis B or C.3
If screening ultrasonography detects a nodule, size determines whether a follow-up ultrasound is needed vs obtaining a contrast-enhanced dynamic computed tomography (CT) scan or a magnetic resonance image (MRI).3 If ultrasonography detects a nodule > 1 cm in diameter, then a dynamic CT or MRI is performed. Characteristic hyperenhancement during later arterial phase and washout during the venous or delayed phase is associated with a nearly 100% specificity for HCC diagnosis.5 Arterial-enhancing contrast is required when using CT and MRI because HCC is a hypervascular lesion.6 The portal venous blood dilutes the majority of the liver’s arterial blood; therefore, the liver does not enhance during the arterial phase, while HCC will show maximum enhancement.7 Furthermore, HCC should demonstrate a “washout” of contrast during the venous phase on CT and MRI.4 Standard imaging protocol dictates that 4 phases are needed to properly diagnose HCC including unenhanced, arterial, venous, and delayed.4
Regular surveillance increases the likelihood of detecting HCC before the presentation of clinical symptoms and facilitates receipt of curative therapy.8-10 Patients with viral hepatitis and cirrhosis with HCC found on screening are more likely to have earlier-stage disease and survive longer from the time of diagnosis.11 Furthermore, it has been observed that HCC detected by surveillance is significantly more likely to undergo curative therapy compared with incidental or symptomatic detection of HCC.9
Technical improvements in imaging techniques include advancement in contrast agents, multidetector row helical CT, and the flexibility/range of pulse sequences available in MRI.7 Even with technical improvements in all modalities used in HCC imaging, detecting HCC remains difficult, especially when detecting the small (< 2 cm) lesions in a cirrhotic liver.7 Interpretation of imaging also remains a challenge as HCC does not always fit strict criteria: lack of “washout” in a hypervascular lesion, determining small HCC lesions from benign nodules, and hypovascular/isovascular HCC.5 Radiologic differentials in the diagnosis of HCC include transient hepatic intensity difference (THID)/transient hepatic attenuation difference (THAD), arterio-portal shunt, and regenerative nodules.12 In the common clinical setting, patients undergo multiple imaging studies that are interpreted by multiple radiologists, which can add to the difficulty in the diagnosis of HCC.13
The radiology community recognized the inconsistencies and complexities of HCC imaging. Therefore, the American College of Radiology endorsed the Liver Imaging Reporting and Data System (LI-RADS), which had the goal of reducing variability in lesion interpretation through standardization and improving communication with clinicians.14 LI-RADS uses a diagnostic algorithm for CT and MRI that categorizes observed liver findings in high-risk individuals based on the probability or relative risk of HCC without assigning a formal diagnosis.14 LI-RADS takes into account arterial phase enhancement, tumor size, washout appearance, the presence and nature of a capsule, and threshold growth.15 LI-RADS categorizes an observed liver finding on a scale of 1 to 5, with 1 corresponding to a definitely benign finding and 5 with definitive HCC.14 Furthermore, LI-RADS sought to limit the technical variabilities among institutions.
LI-RADS was launched in 2011 and has been utilized by many clinical practices while continuing to be expanded and updated.16 Recent studies examined the specificity of LI-RADS as well as interreader variability.17,18 For nodules viewed on MRI, both LI-RADS categories 4 and 5 had high specificity for HCC.17 When looking at interreader repeatability, LI-RADS showed moderate agreement among experts using the diagnostic algorithm.19 Further studies have compared LI-RADS with the AASLD guidelines and the Organ Procurement and Transplantation Network (OPTN) guidelines.16 When compared with other guidelines, LI-RADS expands the definition of indeterminate findings into probably benign, intermediate probability of HCC, and probably HCC, which corresponds to LI-RADS categories 2, 3, and 4.16
We looked retrospectively at a group of patients previously diagnosed with HCC to see whether utilizing the LI-RADS scoring system within our screening system might have allowed an earlier prediction of HCC and a timelier intervention. Prior to this investigation the LI-RADS system was not used for HCC screening at our US Department of Veterans Affairs (VA) facility. We examined screened patients at the Memphis VA Medical Center (MVAMC) in Tennessee who were subsequently diagnosed with HCC to see which LI-RADS category the last surveillance CT prior to diagnosis would fall into, 6 months to a year prior to the diagnosis of HCC. Our control population was a group of patients screened with CT for their liver nodules who were found not to have HCC.
Methods
Patients at MVAMC with cirrhosis and patients with chronic hepatitis B are routinely screened with ultrasound, CT, or MRI in accordance with the AASLD, EASL, and VA guidelines. Of 303 patients with HCV and cirrhosis under care in 2015, 242 (81%) received imaging to screen for HCC according to the VA National Hepatitis C Registry 2015 (Personal Communication, Population Health Service, Office of Patient Care Services).The LI-RADS scoring system was not applied as a standard screening methodology.
Under an institutional review board-approved protocol, we reviewed the charts of all patients diagnosed with HCC at MVAMC from 2009 to 2014, utilizing ICD-9 code of 155.0 for HCC. We identified within these charts patients who had a surveillance CT image performed within a 6- to 13-month period prior to the CTs that diagnosed HCC (prediagnostic HCC CT). Furthermore, we reviewed the charts of all patients diagnosed with benign liver nodules at MVAMC from 2009 to 2014, utilizing the ICD-9 code of 573.8 for other specified disorders of the liver.
Within these charts, we found patients who had a surveillance CT image performed and who were followed after that image with additional imaging for ≥ 2 years or who had a liver biopsy negative for HCC (benign surveillance CT). We compared these 2 sets of CTs utilizing LI-RADS criteria. Once these patients were identified, a list of the CTs to be examined were given to 2 MVAMC radiologists who specialize in CT.
No identifying information of the patients was included, and a 13-digit number unique to each CT exam identified the CTs to be reviewed. Radiologist 1 and 2 examined the CTs on the MVAMC Picture Archiving and Communication System (PACS). Both radiologists were asked to give each nodule a score according to LI-RADS v2014 diagnostic algorithm (Figure).
We hypothesized that the prediagnostic CT images of patients eventually determined to have HCC would have a LI-RADS score of 4 (LR4) or LR5. Furthermore, we hypothesized that the CT images of the benign liver nodule patients would have a score ≤ LR3. If there was a disagreement between the radiologists in terms of a malignant score (LR4 or LR5) vs a benign score (≤ LR3), then a third radiologist (radiologist 3) provided a score for these nodules. The third, tiebreaker radiologist was given the scores of both prior radiologists and asked to choose which score was correct.
Statistical analysis was then applied to the data to determine the sensitivity, specificity, and diagnostic accuracy in diagnosing eventual HCC, as well as the false-negative and false-positive rates of radiologists 1 and 2. Raw data also were used to determine the agreement between raters by calculating the κ statistic with a 95% CI.
Results
A total of 70 nodules were examined by radiologists 1 and 2 with 42 of the nodules in the prediagnostic HCC CTs and 28 of the nodules in the benign surveillance CTs. 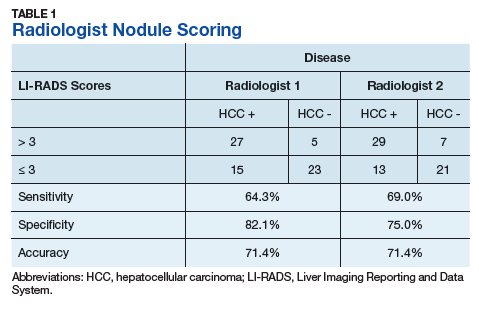
Radiologist 1 identified 11 patients with LR4 and 21 patients with LR5. His scores showed a sensitivity of 64.3% and specificity of 82.1% with accuracy of 71.4% for LI-RADS in identifying eventual HCC. The false-negative rate of the LI-RADS diagnostic algorithm for radiologist 1 was 35.7% and the false-positive rate was 17.9%. Radiologist 2 identified 17 patients LR4 and 19 patients with LR5. Radiologist 2’s scores showed a sensitivity of 69.0% and specificity of 75.0% with accuracy of 71.4% for LI-RADS in identifying eventual HCC.The false-negative rate of the LI-RADS diagnostic algorithm for radiologist 2 was 31.0% and false-positive rate of 25.0%. The κ statistic was calculated to determine the interrater agreement. The radiologists agreed on 58 of 70 samples; 15 without HCC and 43 with HCC. The κ statistic was 0.592, which indicates moderate agreement (Table 2). 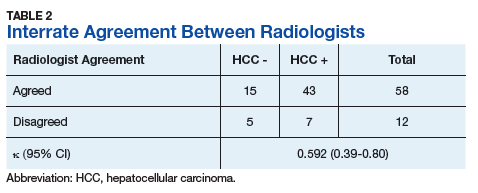
Discussion
If HCC is diagnosed late in the disease process based on symptomatology and not on surveillance imaging, the likelihood of receiving early and potential curative therapy greatly declines as was shown in a systemic literature review.9 Surveillance imaging and lesion interpretation by various radiologists has been difficult to standardize as new technologic advances continue to occur in the imaging of HCC.14 LI-RADS was initiated to help standardize CT and MRI interpretation and reporting of hepatic nodules. As a dynamic algorithm, it continues to adjust with new advances in imaging techniques with the most recent updates being made to the algorithm in 2014.14,19 LI-RADS applies to patients at high risk for HCC most often who are already enrolled in a surveillance program.19 The MVAMC has a high incidence of patients with cirrhosis who are at risk for HCC, which is why we chose it as our study population.
LI-RADS can be applied to both MRI and CT imaging. Much of the recent literature have looked at LI-RADS in terms of MRI. A group in China looked at 100 pathologically confirmed patients and assigned a LI-RADS score to the MRI at the time of diagnosis and showed that MRI LI-RADS scoring was highly sensitive and specific in the diagnosis of HCC.20 This study did note a numeric difference in the specificity of LI-RADS algorithm depending on how LR3 scores were viewed. If a LR3 score was considered negative rather than positive for HCC, then the specificity increased by almost 20%.20
Another study looked at patients with liver nodules ≤ 20 mm found on ultrasound and obtained MRIs and biopsies on these patients, assigning the MRI a LI-RADs score.17 Darnell and colleagues found that MRI LR4 and LR5 have a high specificity for HCC. However, 29 of the 42 LR3 lesions examined were found to be HCC.17 Furthermore, Choi and colleagues retrospectively looked at patients in a HCC surveillance program who had undergone MRI as part of the program and assigned LI-RADS scores to these MRIs.21 Their study showed that LR5 criteria on gadoxetate disodium-enhanced MRI has excellent positive predictive value (PPV) for diagnosing HCC, and LR4 showed good PPV.21
In our study, we chose to look at LI-RADS in terms of surveillance CT scans 6 to 13 months prior to the diagnosis of HCC to see whether this method would allow us to intervene earlier with more aggressive diagnostics or therapy in those suspected of having HCC. Although Choi and colleagues looked retrospectively at MRI surveillance imaging, most of the prior studies have looked at LI-RADS scoring in imaging at the time of diagnosis.17,20,21 By looking at surveillance CT scans, we sought to determine LI-RADS sensitivity, specificity, and diagnostic accuracy as a screening tool compared with CT evaluations without LI-RADS scoring.
We also chose to look at CT scans since most of the prior studies have looked at the more detailed and often more expensive MRIs. For both radiologists 1 and 2, the sensitivity was > 60% and specificity was > 70% with a diagnostic accuracy of 71.4% in predicting a diagnosis of HCC in future scans. Although there was high false negative of > 30% for both radiologists, we did consider LR3 as negative for HCC. As Darnell and colleagues’ study of MRI LI-RADS shows, LR3 may need to be revised in the future as its ambiguity can lead to false-negatives.17 Our results also showed moderate interreader agreement, which has been seen in previous studies with LI-RADS.18
Some studies have compared MRI with CT imaging in terms of LI-RADs classification of hepatic nodules to find out whether concordance was seen.22,23 Both studies found that there was substantial discordance between MRI and CT with CT often underscoring hepatic nodules.22,23 In Zhang and colleagues, interclass agreement between CT and MRI varied the most in terms of arterial enhancement with CT producing false-negative findings.22 CT also underestimated LI-RADS score by 16.9% for LR3, 37.3% for LR4, and 8.5% for LR5 in this study.22 Furthermore, Corwin and colleagues found a significant upgrade in terms of LI-RADS categorization with MRI for 42.5% of observations.23 In this study, upgraded LI-RADS scores on MRI included 2 upgraded to LR5V (Figure), 15 upgraded to LR5, and 12 upgraded to LR4.23 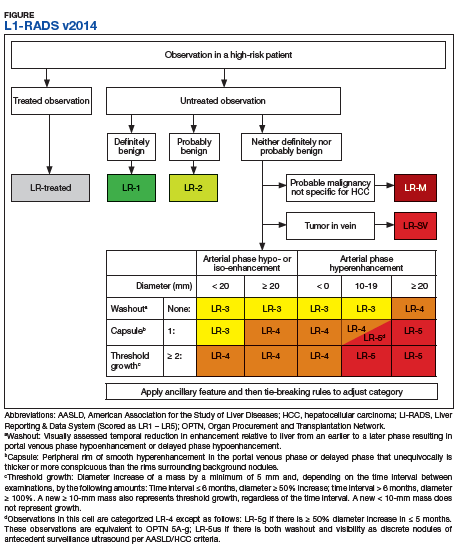
Our study shows that the LI-RADS algorithm has a good sensitivity, specificity, and diagnostic accuracy as a screening tool, predicting HCC in scans earlier than standard CT evaluation. In our study, the patients with HCC were shown to have higher LI-RADS scores on prediagnostic imaging, while the benign liver nodule patients were shown to have lower LI-RADS scores. This data would suggest that a LI-RADS score given to surveillance CT of LR4 or higher should recommend either a biopsy or follow-up imaging after a short interval. If LI-RADS is applied to surveillance CTs in patients at risk for HCC, a diagnosis of HCC may be arrived at earlier as compared with not using the LI-RADS algorithm. Earlier detection may lead to earlier intervention and improved treatment outcomes.
Limitations
Limitations to our study occurred because radiologist 3 did not review all of the images nor score them. Radiologist 3 was limited to 12 images where there was disagreement and was limited to 2 scores to choose from for each image. Further limitations include that this study was performed at a single center. Our study focused on one imaging modality and did not include ultrasounds or MRIs. We did not compare the demographics of our patients with those of other VA hospitals. The radiologists interpreted the images individually, and their subjectivity was another limitation.
Conclusion
In the MVAMC population, LI-RADS showed a good sensitivity, specificity, and diagnostic accuracy for CT surveillance scans in patient at high risk for HCC at an earlier time point than did standard evaluation by very experienced CT radiologists. Higher LI-RADS scores on surveillance CTs had good diagnostic accuracy for the probable future diagnosis of HCC, whereas lower LI-RADS scores had a good diagnostic accuracy for probable benign nodules. Utilizing the LI-RADS algorithm on all surveillance CTs in patients at high risk for HCC may lead to obtaining MRIs or follow-up CTs sooner for suspicious nodules, leading to an earlier diagnosis of HCC and possible earlier and more effective intervention.
1. El–Serag HB, Rudolph KL. Hepatocellular carcinoma: epidemiology and molecular carcinogenesis. Gastroenterology. 2007;132(7):2557-2576.
2. El-Serag HB. Hepatocellular carcinoma. N Engl J Med. 2011;365(12):1118-1127.
3. Bruix J, Sherman M; American Association for the Study of Liver Diseases. Management of hepatocellular carcinoma: an update. Hepatology. 2011;53(3):1020-1022.
4. Selvapatt N, House H, Brown A. Hepatocellular carcinoma surveillance: are we utilizing it? J Clin Gastroenterol. 2016;50(1):e8-e12.
5. Lee JM, Yoon JH, Joo I, Woo HS. Recent advances in CT and MR imaging for evaluation of hepatocellular carcinoma. Liver Cancer. 2012;1(1):22-40.
6. Chou R, Cuevas C, Fu R, et al. Imaging techniques for the diagnosis of hepatocellular carcinoma: a systemic review and meta-analysis. Ann Intern Med. 2015;162(10):697-711.
7. Ariff B, Lloyd CR, Khan S, et al. Imaging of liver cancer. World J Gastroenterol. 2009;15(11):1289-1300.
8. Yuen MF, Cheng CC, Lauder IJ, Lam SK, Ooi CG, Lai CL. Early detection of hepatocellular carcinoma increases the chance of treatment: Hong Kong experience. Hepatology. 2000;31(2):330-335.
9. Singal AG, Pillai A, Tiro J. Early detection, curative treatment, and survival rates for hepatocellular carcinoma surveillance in patients with cirrhosis: a meta-analysis. PLoS Med. 2014;11(4):e1001624.
10. Nusbaum, JD, Smirniotopoulos J, Wright HC, et al. The effect of hepatocellular carcinoma surveillance in an urban population with liver cirrhosis. J Clin Gastroenterol. 2015;49(10):e91-e95.
11. Kansagara D, Papak J, Pasha AS, et al. Screening for hepatocellular carcinoma in chronic liver disease: a systemic review. Ann Intern Med. 2014;161(4):261-269.
12. Shah S, Shukla A, Paunipagar B. Radiological features of hepatocellular carcinoma. J Clin Exp Hepatol. 2014;4(suppl 3):S63-S66.
13. You MW, Kim SY, Kim KW, et al. Recent advances in the imaging of hepatocellular carcinoma. Clin Mol Hepatol. 2015;21(1):95-103.
14. American College of Radiology. Liver reporting and data system (LI-RADS). https://www.acr.org/Clinical-Resources/Reporting-and-Data-Systems/LI-RADS. Accessed April 10, 2018.
15. Anis M. Imaging of hepatocellular carcinoma: new approaches to diagnosis. Clin Liver Dis. 2015;19(2):325-340.
16. Mitchell D, Bruix J, Sherman M, Sirlin CB. LI-RADS (Liver Imaging Reporting and Data System): summary, discussion, and consensus of the LI-RADS Management Working Group and future directions. Hepatology. 2015;61(3):1056-1065.
17. Darnell A, Forner A, Rimola J, et al. Liver imaging reporting and data system with MR imaging: evaluation in nodules 20 mm or smaller detected in cirrhosis at screening US. Radiology. 2015; 275(3):698-707.
18. Davenport MS, Khalatbari S, Liu PS, et al. Repeatability of diagnostic features and scoring systems for hepatocellular carcinoma by using MR imaging. Radiology. 2014;272(1):132-142.
19. An C, Rakhmonova G, Choi JY, Kim MJ. Liver imaging reporting and data system (LI-RADS) version 2014: understanding and application of the diagnostic algorithm. Clin Mol Hepatol. 2016;22(2):296-307.
20. Zhao W, Li W, Yi X, et al. [Diagnostic value of liver imaging reporting and data system on primary hepatocellular carcinoma] [in Chinese]. Zhong Nan Da Xue Xue Bao Yi Xue Ban. 2016;41(4):380-387.
21. Choi SH, Byun JH, Kim SY, et al. Liver imaging reporting and data system v2014 with gadoxetate disodium-enhanced magnetic resonance imaging: validation of LIRADS category 4 and 5 criteria. Invest Radiol. 2016;51(8):483-490.
22. Zhang YD, Zhu FP, Xu X, et al. Liver imaging reporting and data system: substantial discordance between CT and MR for imaging classification of hepatic nodules. Acad Radiol. 2016;23(3):344-352.
23. Corwin MT, Fananapazir G, Jin M, Lamba R, Bashir MR. Difference in liver imaging and reporting data system categorization between MRI and CT. Am J Roentgenol. 2016;206(2):307-312.
Although hepatocellular carcinoma can be difficult to detect, use of the LI-RADS algorithm could lead to earlier identification in at-risk patients.
Although hepatocellular carcinoma can be difficult to detect, use of the LI-RADS algorithm could lead to earlier identification in at-risk patients.
Hepatocellular carcinoma (HCC) is the third most common cause of death from cancer worldwide.1 Liver cancer is the fifth most common cancer in men and the seventh in women.2 The highest incidence rates are in sub-Saharan Africa and Southeast Asia where hepatitis B virus is endemic. The incidence of HCC in western countries is increasing, particularly due to the rise of hepatitis C virus (HCV) as well as alcoholic liver disease and nonalcoholic fatty liver disease. The incidence of HCC has tripled in the US in the past 2 decades.1-3
HCC can be diagnosed by radiographic images without the need for biopsy if the typical imaging features are present.3 The European Association for the Study of Liver Disease (EASL) and the American Association for the Study of Liver Diseases (AASLD) recommend screening abdominal ultrasonography at 6-month intervals for high-risk patients.3,4 High-risk patients include patients with cirrhosis, especially those with hepatitis B or C.3
If screening ultrasonography detects a nodule, size determines whether a follow-up ultrasound is needed vs obtaining a contrast-enhanced dynamic computed tomography (CT) scan or a magnetic resonance image (MRI).3 If ultrasonography detects a nodule > 1 cm in diameter, then a dynamic CT or MRI is performed. Characteristic hyperenhancement during later arterial phase and washout during the venous or delayed phase is associated with a nearly 100% specificity for HCC diagnosis.5 Arterial-enhancing contrast is required when using CT and MRI because HCC is a hypervascular lesion.6 The portal venous blood dilutes the majority of the liver’s arterial blood; therefore, the liver does not enhance during the arterial phase, while HCC will show maximum enhancement.7 Furthermore, HCC should demonstrate a “washout” of contrast during the venous phase on CT and MRI.4 Standard imaging protocol dictates that 4 phases are needed to properly diagnose HCC including unenhanced, arterial, venous, and delayed.4
Regular surveillance increases the likelihood of detecting HCC before the presentation of clinical symptoms and facilitates receipt of curative therapy.8-10 Patients with viral hepatitis and cirrhosis with HCC found on screening are more likely to have earlier-stage disease and survive longer from the time of diagnosis.11 Furthermore, it has been observed that HCC detected by surveillance is significantly more likely to undergo curative therapy compared with incidental or symptomatic detection of HCC.9
Technical improvements in imaging techniques include advancement in contrast agents, multidetector row helical CT, and the flexibility/range of pulse sequences available in MRI.7 Even with technical improvements in all modalities used in HCC imaging, detecting HCC remains difficult, especially when detecting the small (< 2 cm) lesions in a cirrhotic liver.7 Interpretation of imaging also remains a challenge as HCC does not always fit strict criteria: lack of “washout” in a hypervascular lesion, determining small HCC lesions from benign nodules, and hypovascular/isovascular HCC.5 Radiologic differentials in the diagnosis of HCC include transient hepatic intensity difference (THID)/transient hepatic attenuation difference (THAD), arterio-portal shunt, and regenerative nodules.12 In the common clinical setting, patients undergo multiple imaging studies that are interpreted by multiple radiologists, which can add to the difficulty in the diagnosis of HCC.13
The radiology community recognized the inconsistencies and complexities of HCC imaging. Therefore, the American College of Radiology endorsed the Liver Imaging Reporting and Data System (LI-RADS), which had the goal of reducing variability in lesion interpretation through standardization and improving communication with clinicians.14 LI-RADS uses a diagnostic algorithm for CT and MRI that categorizes observed liver findings in high-risk individuals based on the probability or relative risk of HCC without assigning a formal diagnosis.14 LI-RADS takes into account arterial phase enhancement, tumor size, washout appearance, the presence and nature of a capsule, and threshold growth.15 LI-RADS categorizes an observed liver finding on a scale of 1 to 5, with 1 corresponding to a definitely benign finding and 5 with definitive HCC.14 Furthermore, LI-RADS sought to limit the technical variabilities among institutions.
LI-RADS was launched in 2011 and has been utilized by many clinical practices while continuing to be expanded and updated.16 Recent studies examined the specificity of LI-RADS as well as interreader variability.17,18 For nodules viewed on MRI, both LI-RADS categories 4 and 5 had high specificity for HCC.17 When looking at interreader repeatability, LI-RADS showed moderate agreement among experts using the diagnostic algorithm.19 Further studies have compared LI-RADS with the AASLD guidelines and the Organ Procurement and Transplantation Network (OPTN) guidelines.16 When compared with other guidelines, LI-RADS expands the definition of indeterminate findings into probably benign, intermediate probability of HCC, and probably HCC, which corresponds to LI-RADS categories 2, 3, and 4.16
We looked retrospectively at a group of patients previously diagnosed with HCC to see whether utilizing the LI-RADS scoring system within our screening system might have allowed an earlier prediction of HCC and a timelier intervention. Prior to this investigation the LI-RADS system was not used for HCC screening at our US Department of Veterans Affairs (VA) facility. We examined screened patients at the Memphis VA Medical Center (MVAMC) in Tennessee who were subsequently diagnosed with HCC to see which LI-RADS category the last surveillance CT prior to diagnosis would fall into, 6 months to a year prior to the diagnosis of HCC. Our control population was a group of patients screened with CT for their liver nodules who were found not to have HCC.
Methods
Patients at MVAMC with cirrhosis and patients with chronic hepatitis B are routinely screened with ultrasound, CT, or MRI in accordance with the AASLD, EASL, and VA guidelines. Of 303 patients with HCV and cirrhosis under care in 2015, 242 (81%) received imaging to screen for HCC according to the VA National Hepatitis C Registry 2015 (Personal Communication, Population Health Service, Office of Patient Care Services).The LI-RADS scoring system was not applied as a standard screening methodology.
Under an institutional review board-approved protocol, we reviewed the charts of all patients diagnosed with HCC at MVAMC from 2009 to 2014, utilizing ICD-9 code of 155.0 for HCC. We identified within these charts patients who had a surveillance CT image performed within a 6- to 13-month period prior to the CTs that diagnosed HCC (prediagnostic HCC CT). Furthermore, we reviewed the charts of all patients diagnosed with benign liver nodules at MVAMC from 2009 to 2014, utilizing the ICD-9 code of 573.8 for other specified disorders of the liver.
Within these charts, we found patients who had a surveillance CT image performed and who were followed after that image with additional imaging for ≥ 2 years or who had a liver biopsy negative for HCC (benign surveillance CT). We compared these 2 sets of CTs utilizing LI-RADS criteria. Once these patients were identified, a list of the CTs to be examined were given to 2 MVAMC radiologists who specialize in CT.
No identifying information of the patients was included, and a 13-digit number unique to each CT exam identified the CTs to be reviewed. Radiologist 1 and 2 examined the CTs on the MVAMC Picture Archiving and Communication System (PACS). Both radiologists were asked to give each nodule a score according to LI-RADS v2014 diagnostic algorithm (Figure).
We hypothesized that the prediagnostic CT images of patients eventually determined to have HCC would have a LI-RADS score of 4 (LR4) or LR5. Furthermore, we hypothesized that the CT images of the benign liver nodule patients would have a score ≤ LR3. If there was a disagreement between the radiologists in terms of a malignant score (LR4 or LR5) vs a benign score (≤ LR3), then a third radiologist (radiologist 3) provided a score for these nodules. The third, tiebreaker radiologist was given the scores of both prior radiologists and asked to choose which score was correct.
Statistical analysis was then applied to the data to determine the sensitivity, specificity, and diagnostic accuracy in diagnosing eventual HCC, as well as the false-negative and false-positive rates of radiologists 1 and 2. Raw data also were used to determine the agreement between raters by calculating the κ statistic with a 95% CI.
Results
A total of 70 nodules were examined by radiologists 1 and 2 with 42 of the nodules in the prediagnostic HCC CTs and 28 of the nodules in the benign surveillance CTs.
Radiologist 1 identified 11 patients with LR4 and 21 patients with LR5. His scores showed a sensitivity of 64.3% and specificity of 82.1% with accuracy of 71.4% for LI-RADS in identifying eventual HCC. The false-negative rate of the LI-RADS diagnostic algorithm for radiologist 1 was 35.7% and the false-positive rate was 17.9%. Radiologist 2 identified 17 patients LR4 and 19 patients with LR5. Radiologist 2’s scores showed a sensitivity of 69.0% and specificity of 75.0% with accuracy of 71.4% for LI-RADS in identifying eventual HCC.The false-negative rate of the LI-RADS diagnostic algorithm for radiologist 2 was 31.0% and false-positive rate of 25.0%. The κ statistic was calculated to determine the interrater agreement. The radiologists agreed on 58 of 70 samples; 15 without HCC and 43 with HCC. The κ statistic was 0.592, which indicates moderate agreement (Table 2).
Discussion
If HCC is diagnosed late in the disease process based on symptomatology and not on surveillance imaging, the likelihood of receiving early and potential curative therapy greatly declines as was shown in a systemic literature review.9 Surveillance imaging and lesion interpretation by various radiologists has been difficult to standardize as new technologic advances continue to occur in the imaging of HCC.14 LI-RADS was initiated to help standardize CT and MRI interpretation and reporting of hepatic nodules. As a dynamic algorithm, it continues to adjust with new advances in imaging techniques with the most recent updates being made to the algorithm in 2014.14,19 LI-RADS applies to patients at high risk for HCC most often who are already enrolled in a surveillance program.19 The MVAMC has a high incidence of patients with cirrhosis who are at risk for HCC, which is why we chose it as our study population.
LI-RADS can be applied to both MRI and CT imaging. Much of the recent literature have looked at LI-RADS in terms of MRI. A group in China looked at 100 pathologically confirmed patients and assigned a LI-RADS score to the MRI at the time of diagnosis and showed that MRI LI-RADS scoring was highly sensitive and specific in the diagnosis of HCC.20 This study did note a numeric difference in the specificity of LI-RADS algorithm depending on how LR3 scores were viewed. If a LR3 score was considered negative rather than positive for HCC, then the specificity increased by almost 20%.20
Another study looked at patients with liver nodules ≤ 20 mm found on ultrasound and obtained MRIs and biopsies on these patients, assigning the MRI a LI-RADs score.17 Darnell and colleagues found that MRI LR4 and LR5 have a high specificity for HCC. However, 29 of the 42 LR3 lesions examined were found to be HCC.17 Furthermore, Choi and colleagues retrospectively looked at patients in a HCC surveillance program who had undergone MRI as part of the program and assigned LI-RADS scores to these MRIs.21 Their study showed that LR5 criteria on gadoxetate disodium-enhanced MRI has excellent positive predictive value (PPV) for diagnosing HCC, and LR4 showed good PPV.21
In our study, we chose to look at LI-RADS in terms of surveillance CT scans 6 to 13 months prior to the diagnosis of HCC to see whether this method would allow us to intervene earlier with more aggressive diagnostics or therapy in those suspected of having HCC. Although Choi and colleagues looked retrospectively at MRI surveillance imaging, most of the prior studies have looked at LI-RADS scoring in imaging at the time of diagnosis.17,20,21 By looking at surveillance CT scans, we sought to determine LI-RADS sensitivity, specificity, and diagnostic accuracy as a screening tool compared with CT evaluations without LI-RADS scoring.
We also chose to look at CT scans since most of the prior studies have looked at the more detailed and often more expensive MRIs. For both radiologists 1 and 2, the sensitivity was > 60% and specificity was > 70% with a diagnostic accuracy of 71.4% in predicting a diagnosis of HCC in future scans. Although there was high false negative of > 30% for both radiologists, we did consider LR3 as negative for HCC. As Darnell and colleagues’ study of MRI LI-RADS shows, LR3 may need to be revised in the future as its ambiguity can lead to false-negatives.17 Our results also showed moderate interreader agreement, which has been seen in previous studies with LI-RADS.18
Some studies have compared MRI with CT imaging in terms of LI-RADs classification of hepatic nodules to find out whether concordance was seen.22,23 Both studies found that there was substantial discordance between MRI and CT with CT often underscoring hepatic nodules.22,23 In Zhang and colleagues, interclass agreement between CT and MRI varied the most in terms of arterial enhancement with CT producing false-negative findings.22 CT also underestimated LI-RADS score by 16.9% for LR3, 37.3% for LR4, and 8.5% for LR5 in this study.22 Furthermore, Corwin and colleagues found a significant upgrade in terms of LI-RADS categorization with MRI for 42.5% of observations.23 In this study, upgraded LI-RADS scores on MRI included 2 upgraded to LR5V (Figure), 15 upgraded to LR5, and 12 upgraded to LR4.23
Our study shows that the LI-RADS algorithm has a good sensitivity, specificity, and diagnostic accuracy as a screening tool, predicting HCC in scans earlier than standard CT evaluation. In our study, the patients with HCC were shown to have higher LI-RADS scores on prediagnostic imaging, while the benign liver nodule patients were shown to have lower LI-RADS scores. This data would suggest that a LI-RADS score given to surveillance CT of LR4 or higher should recommend either a biopsy or follow-up imaging after a short interval. If LI-RADS is applied to surveillance CTs in patients at risk for HCC, a diagnosis of HCC may be arrived at earlier as compared with not using the LI-RADS algorithm. Earlier detection may lead to earlier intervention and improved treatment outcomes.
Limitations
Limitations to our study occurred because radiologist 3 did not review all of the images nor score them. Radiologist 3 was limited to 12 images where there was disagreement and was limited to 2 scores to choose from for each image. Further limitations include that this study was performed at a single center. Our study focused on one imaging modality and did not include ultrasounds or MRIs. We did not compare the demographics of our patients with those of other VA hospitals. The radiologists interpreted the images individually, and their subjectivity was another limitation.
Conclusion
In the MVAMC population, LI-RADS showed a good sensitivity, specificity, and diagnostic accuracy for CT surveillance scans in patient at high risk for HCC at an earlier time point than did standard evaluation by very experienced CT radiologists. Higher LI-RADS scores on surveillance CTs had good diagnostic accuracy for the probable future diagnosis of HCC, whereas lower LI-RADS scores had a good diagnostic accuracy for probable benign nodules. Utilizing the LI-RADS algorithm on all surveillance CTs in patients at high risk for HCC may lead to obtaining MRIs or follow-up CTs sooner for suspicious nodules, leading to an earlier diagnosis of HCC and possible earlier and more effective intervention.
1. El–Serag HB, Rudolph KL. Hepatocellular carcinoma: epidemiology and molecular carcinogenesis. Gastroenterology. 2007;132(7):2557-2576.
2. El-Serag HB. Hepatocellular carcinoma. N Engl J Med. 2011;365(12):1118-1127.
3. Bruix J, Sherman M; American Association for the Study of Liver Diseases. Management of hepatocellular carcinoma: an update. Hepatology. 2011;53(3):1020-1022.
4. Selvapatt N, House H, Brown A. Hepatocellular carcinoma surveillance: are we utilizing it? J Clin Gastroenterol. 2016;50(1):e8-e12.
5. Lee JM, Yoon JH, Joo I, Woo HS. Recent advances in CT and MR imaging for evaluation of hepatocellular carcinoma. Liver Cancer. 2012;1(1):22-40.
6. Chou R, Cuevas C, Fu R, et al. Imaging techniques for the diagnosis of hepatocellular carcinoma: a systemic review and meta-analysis. Ann Intern Med. 2015;162(10):697-711.
7. Ariff B, Lloyd CR, Khan S, et al. Imaging of liver cancer. World J Gastroenterol. 2009;15(11):1289-1300.
8. Yuen MF, Cheng CC, Lauder IJ, Lam SK, Ooi CG, Lai CL. Early detection of hepatocellular carcinoma increases the chance of treatment: Hong Kong experience. Hepatology. 2000;31(2):330-335.
9. Singal AG, Pillai A, Tiro J. Early detection, curative treatment, and survival rates for hepatocellular carcinoma surveillance in patients with cirrhosis: a meta-analysis. PLoS Med. 2014;11(4):e1001624.
10. Nusbaum, JD, Smirniotopoulos J, Wright HC, et al. The effect of hepatocellular carcinoma surveillance in an urban population with liver cirrhosis. J Clin Gastroenterol. 2015;49(10):e91-e95.
11. Kansagara D, Papak J, Pasha AS, et al. Screening for hepatocellular carcinoma in chronic liver disease: a systemic review. Ann Intern Med. 2014;161(4):261-269.
12. Shah S, Shukla A, Paunipagar B. Radiological features of hepatocellular carcinoma. J Clin Exp Hepatol. 2014;4(suppl 3):S63-S66.
13. You MW, Kim SY, Kim KW, et al. Recent advances in the imaging of hepatocellular carcinoma. Clin Mol Hepatol. 2015;21(1):95-103.
14. American College of Radiology. Liver reporting and data system (LI-RADS). https://www.acr.org/Clinical-Resources/Reporting-and-Data-Systems/LI-RADS. Accessed April 10, 2018.
15. Anis M. Imaging of hepatocellular carcinoma: new approaches to diagnosis. Clin Liver Dis. 2015;19(2):325-340.
16. Mitchell D, Bruix J, Sherman M, Sirlin CB. LI-RADS (Liver Imaging Reporting and Data System): summary, discussion, and consensus of the LI-RADS Management Working Group and future directions. Hepatology. 2015;61(3):1056-1065.
17. Darnell A, Forner A, Rimola J, et al. Liver imaging reporting and data system with MR imaging: evaluation in nodules 20 mm or smaller detected in cirrhosis at screening US. Radiology. 2015; 275(3):698-707.
18. Davenport MS, Khalatbari S, Liu PS, et al. Repeatability of diagnostic features and scoring systems for hepatocellular carcinoma by using MR imaging. Radiology. 2014;272(1):132-142.
19. An C, Rakhmonova G, Choi JY, Kim MJ. Liver imaging reporting and data system (LI-RADS) version 2014: understanding and application of the diagnostic algorithm. Clin Mol Hepatol. 2016;22(2):296-307.
20. Zhao W, Li W, Yi X, et al. [Diagnostic value of liver imaging reporting and data system on primary hepatocellular carcinoma] [in Chinese]. Zhong Nan Da Xue Xue Bao Yi Xue Ban. 2016;41(4):380-387.
21. Choi SH, Byun JH, Kim SY, et al. Liver imaging reporting and data system v2014 with gadoxetate disodium-enhanced magnetic resonance imaging: validation of LIRADS category 4 and 5 criteria. Invest Radiol. 2016;51(8):483-490.
22. Zhang YD, Zhu FP, Xu X, et al. Liver imaging reporting and data system: substantial discordance between CT and MR for imaging classification of hepatic nodules. Acad Radiol. 2016;23(3):344-352.
23. Corwin MT, Fananapazir G, Jin M, Lamba R, Bashir MR. Difference in liver imaging and reporting data system categorization between MRI and CT. Am J Roentgenol. 2016;206(2):307-312.
Blistering Disease During the Treatment of Chronic Hepatitis C With Ledipasvir/Sofosbuvir (FULL)
Porphyria cutanea tarda (PCT) is the most common type of porphyria. The accumulation of porphyrin in various organ systems results from a deficiency of uroporphyrinogen decarboxylase (UROD).1-3 Chronic hepatitis C virus (HCV) causes a hepatic decrease in hepcidin production, resulting in increased iron absorption. Iron loading and increased oxidative stress in the liver leads to nonporphyrin inhibition of UROD production and to oxidation of porphyrinogens to porphyrins.4 This in turn leads to accumulation of uroporphyrins and carboxylated metabolites that can be detected in urine.4
Signs of PCT include blisters, vesicles, and possibly milia developing on sun-exposed areas of the skin, such as the face, forearms, and dorsal hands.4 Case reports have demonstrated a resolution of PCT in patients with chronic HCV with treatment with direct-acting antivirals (DAAs), such as ledipasvir/sofosbuvir.1,3 However, here we present 2 cases of patients who developed blistering diseases during treatment of chronic HCV with ledipasvir/sofosbuvir. Neither demonstrated complete resolution of symptoms during the treatment regimen.
Cases
Patient 1
A 63-year-old white male with a history of chronic HCV (genotype 1a), bipolar disorder, hyperlipidemia, tobacco dependence, and cirrhosis (F4 by elastography) presented with minimally to moderately painful blisters on his bilateral dorsal hands that had developed around weeks 8 to 9 of treatment with ledipasvir/sofosbuvir. The patient reported that no new blisters had appeared following completion of 12 weeks of treatment and that his current blisters were in various stages of healing. He reported alcohol use of 1 to 2 twelve-ounce beers daily and no history of dioxin exposure. His medications included doxepin, hydralazine, hydrochlorothiazide, quetiapine, folic acid, and thiamine. His hepatitis C viral load was 440,000 IU/mL prior to treatment. Tests for hepatitis B surface antigen and HIV antibodies were negative. His iron level was 135 µg/dL, total iron-binding capacity (TIBC) was 323 µg/dL, and ferritin was 299.0 ng/mL. His HFE
A physical examination on presentation revealed erosions with overlying hemorrhagic crusts on the bilateral dorsal hands (Figure). 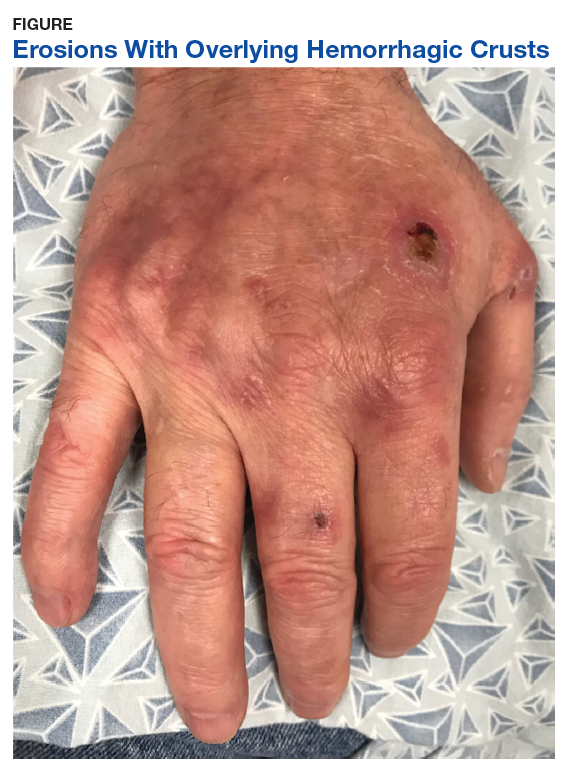
At the 4-month follow-up, the patient reported no new blister formations. A physical examination revealed well-healed scars and several clustered milia on bilateral dorsal hands with no active vesicles or bullae noted.
Patient 2
An African American male aged 63 years presented with a 1-month history of moderately painful blisters on his bilateral dorsal hands during treatment of chronic HCV (genotype 1a) with ledipasvir/sofosbuvir. His medical history included gout, tobacco and alcohol addiction, osteoarthritis, and hepatic fibrosis (F3 by elastography). The patient’s medications included allopurinol, lisinopril, and hydrochlorothiazide. He reported no history of dioxin exposure. On the day of presentation, he was on week 9 of the 12-week treatment ledipasvir/sofosbuvir regimen. Laboratory results included an initial HCV viral load of 1,618,605 IU/mL. Tests for hepatitis B surface antigen and HIV antibodies were negative. His iron was 191 µg/dL, TIBC 388 µg/dL, and ferritin 459.0 ng/mL. After 4 weeks of treatment, the patient’s hepatitis C viral load was undetectable.
A physical examination revealed several resolving erosions to his bilateral dorsal hands, some of which had overlying crusting along with one small hemorrhagic vesicle on the right dorsal hand. A punch biopsy of the hemorrhagic vesicle was performed and demonstrated a cell-poor subepidermal blister with festooning of the dermal papilla. A direct immunofluorescence study showed immunoglobulin (Ig) G fluorescence along the dermal-epidermal junction and within vessel walls in the superficial dermis. Weak IgM and C3 fluorescence also was noted within vessel walls in the superficial dermis. All of the patient findings and history were consistent with PCT, although pseudo-PCT also was a consideration. A 24-hour urine sample yielded negative results for porphobilinogen. Urine porphyrin test results were not available, leading to a presumptive histological diagnosis of PCT.
The patient completed 11 of the prescribed 12 weeks of ledipasvir/sofosbuvir. The blisters resolved shortly thereafter.
Discussion
PCT has a well-established association with chronic HCV infection.4 We present 2 cases of a blistering disease clinically and histologically compatible with PCT that developed in patients only after initiation of treatment for chronic HCV with ledipasvir/sofosbuvir. One case was confirmed as PCT on the basis of compatible histopathologic findings and a urine porphyrin assay that showed elevated levels of uroporphyrins and carboxylated metabolites. The second case was clinically and histologically suggestive of PCT but not confirmed by urine porphyrin testing. In both patients, after 8 to 9 weeks of a 12-week course of antiviral therapy, the blistering lesions were noted but appeared to be resolving, and no new lesions were noted after discontinuation of therapy. It appeared that the antiviral treatment temporally triggered the initiation of the blistering skin disease, and as the chronic HCV infection cleared after treatment, the blistering lesions also began to resolve.
Mechanistically, it is known that the virally-induced hepatic damage leads to inhibition of uroporphyrinogen decarboxylase, and the subsequent oxidation of porphyrinogens to porphyrins. Cofactors such as HIV infection also may contribute to development of PCT.5
De novo PCT has been documented during therapy using interferon and ribavirin.6 The hemolytic anemia and increased hepatic iron were implicated as potential etiologies.6 Patients with HCV and PCT treated with the newer direct-acting antiviral therapies have been described to have experienced improvement in PCT symptoms.3
Although there were rare reports of deterioration in renal and liver function,7 reactivation of HBV infection,8 and Stevens-Johnson syndrome9 with antiviral therapy, these complications were not observed in these patients. Both patients also had successful resolution of HCV infection, and by completion of the antiviral therapy, the blistering also resolved.
Conclusion
PCT is an extrahepatic manifestation of HCV infection. Health care providers should be aware of the association of chronic HCV infection with PCT. The findings of PCT should not result in the delay or discontinuation of antiviral therapy.
1. Combalia A, To-Figueras J, Laguno M, Martinez-Rebollar M, Aguilera P. Direct-acting antivirals for hepatitis C virus induce a rapid clinical and biochemical remission of porphyria cutanea tarda. Br J Dermatol. 2017;177(5):e183-e184.
2. Younossi Z, Park H, Henry L, Adeyemi A, Stepanova M. Extrahepatic manifestations of hepatitis C: a meta-analysis of prevalence, quality of life, and economic burden. Gastroenterology. 2016;150(7):1599-1608.
3. Tong Y, Song YK, Tyring S. Resolution of porphyria cutanea tarda in patients with hepatitis C following ledipasvir/sofosbuvir combination therapy. JAMA Dermatol. 2016;152(12):1393-1395.
4. Ryan Caballes F, Sendi H, Bonkovsky H. Hepatitis C, porphyria cutanea tarda and liver iron: an update. Liver Int. 2012;32(6):880-893.
5. Quansah R, Cooper CJ, Said S, Bizet J, Paez D, Hernandez GT. Hepatitis C- and HIV-induced porphyria cutanea tarda. Am J Case Rep. 2014;15:35-40.
6. Azim J, McCurdy H, Moseley RH. Porphyria cutanea tarda as a complication of therapy for chronic hepatitis C. World J Gastroenterol. 2008;14(38):5913-5915.
7. Ahmed M. Harvoni-induced deterioration of renal and liver function. Adv Res Gastroentero Hepatol. 2017;2(3):555588.
8. De Monte A, Courion J, Anty R, et al. Direct-acting antiviral treatment in adults infected with hepatitis C virus: reactivation of hepatitis B virus coinfection as a further challenge. J Clin Virol. 2016;78:27-30.
9. Verma N, Singh S, Sawatkar G,Singh V. Sofosbuvir induced Steven Johnson Syndrome in a patient with hepatitis C virus-related cirrhosis. Hepatol Commun. 2017;2(1):16-20.
Porphyria cutanea tarda (PCT) is the most common type of porphyria. The accumulation of porphyrin in various organ systems results from a deficiency of uroporphyrinogen decarboxylase (UROD).1-3 Chronic hepatitis C virus (HCV) causes a hepatic decrease in hepcidin production, resulting in increased iron absorption. Iron loading and increased oxidative stress in the liver leads to nonporphyrin inhibition of UROD production and to oxidation of porphyrinogens to porphyrins.4 This in turn leads to accumulation of uroporphyrins and carboxylated metabolites that can be detected in urine.4
Signs of PCT include blisters, vesicles, and possibly milia developing on sun-exposed areas of the skin, such as the face, forearms, and dorsal hands.4 Case reports have demonstrated a resolution of PCT in patients with chronic HCV with treatment with direct-acting antivirals (DAAs), such as ledipasvir/sofosbuvir.1,3 However, here we present 2 cases of patients who developed blistering diseases during treatment of chronic HCV with ledipasvir/sofosbuvir. Neither demonstrated complete resolution of symptoms during the treatment regimen.
Cases
Patient 1
A 63-year-old white male with a history of chronic HCV (genotype 1a), bipolar disorder, hyperlipidemia, tobacco dependence, and cirrhosis (F4 by elastography) presented with minimally to moderately painful blisters on his bilateral dorsal hands that had developed around weeks 8 to 9 of treatment with ledipasvir/sofosbuvir. The patient reported that no new blisters had appeared following completion of 12 weeks of treatment and that his current blisters were in various stages of healing. He reported alcohol use of 1 to 2 twelve-ounce beers daily and no history of dioxin exposure. His medications included doxepin, hydralazine, hydrochlorothiazide, quetiapine, folic acid, and thiamine. His hepatitis C viral load was 440,000 IU/mL prior to treatment. Tests for hepatitis B surface antigen and HIV antibodies were negative. His iron level was 135 µg/dL, total iron-binding capacity (TIBC) was 323 µg/dL, and ferritin was 299.0 ng/mL. His HFE
A physical examination on presentation revealed erosions with overlying hemorrhagic crusts on the bilateral dorsal hands (Figure).
At the 4-month follow-up, the patient reported no new blister formations. A physical examination revealed well-healed scars and several clustered milia on bilateral dorsal hands with no active vesicles or bullae noted.
Patient 2
An African American male aged 63 years presented with a 1-month history of moderately painful blisters on his bilateral dorsal hands during treatment of chronic HCV (genotype 1a) with ledipasvir/sofosbuvir. His medical history included gout, tobacco and alcohol addiction, osteoarthritis, and hepatic fibrosis (F3 by elastography). The patient’s medications included allopurinol, lisinopril, and hydrochlorothiazide. He reported no history of dioxin exposure. On the day of presentation, he was on week 9 of the 12-week treatment ledipasvir/sofosbuvir regimen. Laboratory results included an initial HCV viral load of 1,618,605 IU/mL. Tests for hepatitis B surface antigen and HIV antibodies were negative. His iron was 191 µg/dL, TIBC 388 µg/dL, and ferritin 459.0 ng/mL. After 4 weeks of treatment, the patient’s hepatitis C viral load was undetectable.
A physical examination revealed several resolving erosions to his bilateral dorsal hands, some of which had overlying crusting along with one small hemorrhagic vesicle on the right dorsal hand. A punch biopsy of the hemorrhagic vesicle was performed and demonstrated a cell-poor subepidermal blister with festooning of the dermal papilla. A direct immunofluorescence study showed immunoglobulin (Ig) G fluorescence along the dermal-epidermal junction and within vessel walls in the superficial dermis. Weak IgM and C3 fluorescence also was noted within vessel walls in the superficial dermis. All of the patient findings and history were consistent with PCT, although pseudo-PCT also was a consideration. A 24-hour urine sample yielded negative results for porphobilinogen. Urine porphyrin test results were not available, leading to a presumptive histological diagnosis of PCT.
The patient completed 11 of the prescribed 12 weeks of ledipasvir/sofosbuvir. The blisters resolved shortly thereafter.
Discussion
PCT has a well-established association with chronic HCV infection.4 We present 2 cases of a blistering disease clinically and histologically compatible with PCT that developed in patients only after initiation of treatment for chronic HCV with ledipasvir/sofosbuvir. One case was confirmed as PCT on the basis of compatible histopathologic findings and a urine porphyrin assay that showed elevated levels of uroporphyrins and carboxylated metabolites. The second case was clinically and histologically suggestive of PCT but not confirmed by urine porphyrin testing. In both patients, after 8 to 9 weeks of a 12-week course of antiviral therapy, the blistering lesions were noted but appeared to be resolving, and no new lesions were noted after discontinuation of therapy. It appeared that the antiviral treatment temporally triggered the initiation of the blistering skin disease, and as the chronic HCV infection cleared after treatment, the blistering lesions also began to resolve.
Mechanistically, it is known that the virally-induced hepatic damage leads to inhibition of uroporphyrinogen decarboxylase, and the subsequent oxidation of porphyrinogens to porphyrins. Cofactors such as HIV infection also may contribute to development of PCT.5
De novo PCT has been documented during therapy using interferon and ribavirin.6 The hemolytic anemia and increased hepatic iron were implicated as potential etiologies.6 Patients with HCV and PCT treated with the newer direct-acting antiviral therapies have been described to have experienced improvement in PCT symptoms.3
Although there were rare reports of deterioration in renal and liver function,7 reactivation of HBV infection,8 and Stevens-Johnson syndrome9 with antiviral therapy, these complications were not observed in these patients. Both patients also had successful resolution of HCV infection, and by completion of the antiviral therapy, the blistering also resolved.
Conclusion
PCT is an extrahepatic manifestation of HCV infection. Health care providers should be aware of the association of chronic HCV infection with PCT. The findings of PCT should not result in the delay or discontinuation of antiviral therapy.
1. Combalia A, To-Figueras J, Laguno M, Martinez-Rebollar M, Aguilera P. Direct-acting antivirals for hepatitis C virus induce a rapid clinical and biochemical remission of porphyria cutanea tarda. Br J Dermatol. 2017;177(5):e183-e184.
2. Younossi Z, Park H, Henry L, Adeyemi A, Stepanova M. Extrahepatic manifestations of hepatitis C: a meta-analysis of prevalence, quality of life, and economic burden. Gastroenterology. 2016;150(7):1599-1608.
3. Tong Y, Song YK, Tyring S. Resolution of porphyria cutanea tarda in patients with hepatitis C following ledipasvir/sofosbuvir combination therapy. JAMA Dermatol. 2016;152(12):1393-1395.
4. Ryan Caballes F, Sendi H, Bonkovsky H. Hepatitis C, porphyria cutanea tarda and liver iron: an update. Liver Int. 2012;32(6):880-893.
5. Quansah R, Cooper CJ, Said S, Bizet J, Paez D, Hernandez GT. Hepatitis C- and HIV-induced porphyria cutanea tarda. Am J Case Rep. 2014;15:35-40.
6. Azim J, McCurdy H, Moseley RH. Porphyria cutanea tarda as a complication of therapy for chronic hepatitis C. World J Gastroenterol. 2008;14(38):5913-5915.
7. Ahmed M. Harvoni-induced deterioration of renal and liver function. Adv Res Gastroentero Hepatol. 2017;2(3):555588.
8. De Monte A, Courion J, Anty R, et al. Direct-acting antiviral treatment in adults infected with hepatitis C virus: reactivation of hepatitis B virus coinfection as a further challenge. J Clin Virol. 2016;78:27-30.
9. Verma N, Singh S, Sawatkar G,Singh V. Sofosbuvir induced Steven Johnson Syndrome in a patient with hepatitis C virus-related cirrhosis. Hepatol Commun. 2017;2(1):16-20.
Accuracy of Endoscopic Ultrasound in Staging of Early Rectal Cancer (FULL)
Endoscopic ultrasound can be highly accurate for the staging of neoplasms in early rectal cancer.
Colorectal cancer is the second most common cause of cancer death in the US, with one-third of all colorectal cancers occurring within the rectum. Each year, an estimated 40000 Americans are diagnosed with rectal cancer (RC).1,2 The prognosis and treatment of RC depends on both T and N stage at the time of diagnosis.3-5 According to the most recent National Comprehensive Cancer Network guidelines from May 2019, patients with T1 to T2N0 tumors should undergo transanal or transabdominal surgery upfront, whereas patients with T3 to T4N0 or any TN1 to 2 should start with neoadjuvant therapy for better locoregional control, followed by surgery.6 Therefore, the appropriate management of RC requires adequate staging.
Endoscopic ultrasound (EUS), magnetic resonance imaging (MRI), and computed tomography (CT) are the imaging techniques currently used to stage RC. In a meta-analysis of 90 articles published between 1985 and 2002 that compared the 3 radiologic modalities, Bipat and colleagues found that MRI and EUS had a similar sensitivity of 94%, whereas the specificity of EUS (86%) was significantly higher than that of MRI (69%) for muscularis propria invasion.7 CT was performed only in a limited number of trials because CT was considered inadequate to assess early T stage. For perirectal tissue invasion, the sensitivity of EUS was statistically higher than that of CT and MRI imaging: 90% compared with 79% and 82%, respectively. The specificity estimates for EUS, CT, and MRI were comparable: 75%, 78%, and 76%, respectively. The respective sensitivity and specificity of the 3 imaging modalities to evaluate lymph nodes were also comparable: EUS, 67% and 78%; CT, 55% and 74%; and MRI, 66% and 76%.
The role of EUS in the diagnosis and treatment of RC has long been validated.1,2-5 A meta-analysis of 42 studies involving 5039 patients found EUS to be highly accurate for differentiating various T stages.8 However, EUS cannot assess iliac and mesenteric lymph nodes or posterior tumor extension beyond endopelvic fascia in advanced RC. Notable heterogeneity was found among the studies in the meta-analyses with regard to the type of equipment used for staging, as well as the criteria used to assess the depth of penetration and nodal status. The recent introduction of phased-array coils and the development of T2-weighted fast spin sequences have improved the resolution of MRI. The MERCURY trial showed that extension of tumor to within 1 mm of the circumferential margin on high-resolution MRI correctly predicted margin involvement at the time of surgery in 92% of the patients.9 In the retrospective study by Balyasnikova and colleagues, MRI was found to correctly identify partial submucosal invasion and suitability for local excision in 89% of the cases.10
Therefore, both EUS and MRI are useful, more so than CT, in assessment of the depth of tumor invasion, nodal staging, and predicting the circumferential resection margin. The use of EUS, however, does not preclude the use of MRI, or vice versa. Rather, the 2 modalities can complement each other in staging and proper patient selection for treatment.11
Despite data supporting the value of EUS in staging RC, its use is limited by a high degree of operator dependence and a substantial learning curve,12-17 which may explain the low EUS accuracy observed in some reports.7,13,15 Given the presence of recognized alternatives such as MRI, we decided to reevaluate EUS accuracy for the staging of RC outside high-volume specialized centers and prospective clinical trials.
Methods
A retrospective chart review was performed that included all consecutive patients undergoing rectal ultrasound from January 2011 to August 2015 at the US Department of Veterans Affairs Medical Center (VAMC) in Memphis, Tennessee. Sixty-five patients with short-stocked or sessile lesions < 15 cm from anal margin staged T2N0M0 or lower by endorectal ultrasound (ERUS) were included. The patients with neoplasms staged in excess of T2 or N0 were excluded from the study because treatment protocol dictates immediate neoadjuvant treatment, the administration of which would affect subsequent histopathology.
For the 37 patients included in the final analysis, ERUS results were compared with surgical pathology to ascertain accuracy. The resections were performed endoscopically or surgically with a goal of obtaining clear margins. The choice of procedure depended on size, shape, location, and depth of invasion. All patients underwent clinical and endoscopic surveillance with flexible sigmoidoscopy/EUS every 3 to 6 months for the first 2 years. We used 2 different gold standards for surveillance depending on the type of procedure performed to remove the lesion. A pathology report was the gold standard used for patients who underwent surgery. In patients who underwent endoscopic resection, we used the lack of recurrent disease, determined by normal endoscopic and endoscopic ultrasound examination, to signify complete endoscopic resection and therefore adequate staging as an early neoplasm.
Results
From January 2011 to August 2015, 65 rectal ultrasounds were performed. All EUS procedures were performed by 1 physician (C Ruben Tombazzi). All patients had previous endoscopic evaluation and tissue diagnoses. Twenty-eight patients were excluded: 18 had T3 or N1 disease, 2 had T2N0 but refused surgery, 2 had anal cancer, 3 patients with suspected cancer had benign nonneoplastic disease (2 radiation proctitis, 1 normal rectal wall), and 3 underwent EUS for benign tumors (1 ganglioneuroma and 2 lipomas).
Thirty-seven patients were included in the study, 3 of whom were staged as T2N0 and 34 as T1N0 or lower by EUS. All patients were men ranging in age from 43 to 73 years (mean, 59 years). All 37 patients underwent endoscopic or surgical resection of their early rectal neoplasm. The final pathologic evaluation of the specimens demonstrated 14 carcinoid tumors, 11 adenocarcinomas, 6 tubular adenomas with high-grade dysplasia, and 6 benign adenomas. The preoperative EUS staging was confirmed for all patients, with 100% sensitivity, specificity, and accuracy. None of the patients who underwent endoscopic or surgical transanal resection had recurrence, determined by normal endoscopic and endoscopic ultrasound appearance, during a mean of 32.6 months surveillance.
Discussion
EUS has long been a recognized method for T and N staging of RC.1,3-5,7,8 Our data confirm that, in experienced hands, EUS is highly accurate in the staging of early rectal cancers.
The impact of EUS on the management of RC was demonstrated in a Mayo Clinic prospective blinded study.1 In that cohort of 80 consecutive patients who had previously had a CT for staging, EUS altered patient management in about 30% of cases. The most common change precipatated by EUS was the indication for additional neoadjuvant treatment.
However, the results have not been as encouraging when ERUS is performed outside of strict research protocol. A multicenter, prospective, country-wide quality assurance study from > 300 German hospitals was designed to assess the diagnostic accuracy of EUS in RC.13 Of 29206 patients, 7096 underwent surgery, without neoadjuvant treatment, and were included in the final analysis. The correspondence of tumor invasion with histopathology was 64.7%, with understaging of 18% and overstaging of 17.3%.13 These numbers were better in hospitals with greater experience performing ERUS: 73% accuracy in the centers with a case load of > 30 cases per year compared with 63.2% accuracy for the centers with < 10 cases a year. Marusch and colleagues had previously demonstrated an EUS accuracy of 63.3% in a study of 1463 patients with RC in Germany.14 Another study based out of the UK had similar findings. Ashraf and colleagues performed a database analyses from 20 UK centers and identified 165 patients with RC who underwent ERUS and endoscopic microsurgery.15 Compared with histopathology, EUS had 57.1% sensitivity, 73% specificity, and 42.9% accuracy for T1 cancers; EUS accuracy was 50% for T2 and 58% for T3 tumors. The authors concluded that the general accuracy of EUS in determining stage was around 50%, the statistical equivalent of flipping a coin.
The low accuracy of EUS observed by German and British multicenter studies13-15 was attributed to the difference that may exist in clinical trials at specialized centers compared with wider use of EUS in a community setting. As seen by our data, the Memphis VAMC is not a high-volume center for the treatment of RC. However, all our EUS procedures were performed and interpreted by a single operator (C. Ruben Tombazzi) with 18 years of EUS experience. We cannot conclude that no patient was overstaged, as patients receiving a stage of T3N0 or T > N0 received neoadjuvant treatment and were not included. However, we can conclude that no patient was understaged. All patients deemed to be T1 to T2N0 included in our study received accurate staging. Our results are consistent with the high accuracy of EUS reported from other centers with experience in diagnosis and treatment of RC.1,3-5,17,18
Although EUS is accurate in differentiating T1 from T2 tumors, it cannot reliably differentiate T1 from T0 lesions. In one study, 57.6% of adenomas and 30.7% of carcinomas in situ were staged as T1 on EUS, while almost half of T1 cancers were interpreted as T0.17 This drawback is a well-known limitation of EUS; although, the misinterpretation does not affect treatment, as both T0 and T1 lesions can be treated successfully by local excision alone, which was the algorithm used for our patients. The choice of the specific procedure for local excision was left to the clinicians and included transanal endoscopic or surgical resections. At a mean follow-up of 32.6 months, none of the 37 patients who underwent endoscopic or surgical transanal resection had evidence of recurrent disease.
A limitation of EUS, or any other imaging modality, is differentiating tumor invasion from peritumoral inflammation. The inflammation can render images of tumor borders ill-defined and irregular, which hinders precise staging. However, the accurate identification of tumors with deep involvement of the submucosa (T1sm3) is of importance, because these tumors are more advanced than the superficial and intermediate T1 lesions (T1sm1 and T1sm2, respectively).
Patients with RC whose lesions are considered T1sm3 are at higher risk of harboring lymph node metastases.18 Nascimbeni and colleagues had shown that the invasion into the lower third of the submucosa (sm3) was an independent risk factor for lower cancer-free survival among patients with T1 RC.19
Unlike rectal adenocarcinomas, the prognosis for carcinoid tumors correlates not only with the depth of invasion but also with the size of the tumor. The other adverse prognostic features include poor differentiation, high mitosis index, and lymphovascular invasion.20
EUS had been shown to be highly accurate in determining the precise carcinoid tumor size, depth of invasion, and lymph node metastases.20,21 In a study of 66 resected rectal carcinoid tumors by Ishii and colleagues, 57 lesions had a diameter of ≤ 10 mm and 9 lesions had a diameter of > 10 mm.21 All of the 57 carcinoid tumors with a diameter of ≤ 10 mm were confined to the submucosa. In contrast, 5 of the 9 lesions > 10 mm invaded the muscularis propria, 6 had a lymphovascular invasion, 4 were lymph node metastases, and 1 was a liver metastasis.
In our series, 4 of the 14 carcinoid tumors were > 10 mm but none were > 20 mm. None of the carcinoids with a diameter ≤ 10 mm invaded the muscularis propria. Of the 4 carcinoids > 10 mm, 1 was T2N0 and 3 were T1N0. All carcinoid tumors in our series were low grade and with low proliferation indexes, and all were treated successfully by local excision.
Conclusion
We believe our study shows that EUS can be highly accurate in staging rectal lesions, specifically lesions that are T1-T2N0, be they adenocarcinoma or carcinoid. Although we could not assess overstaging for lesions that were staged > T2 or > N0, we w
1. Harewood GC, Wiersema MJ, Nelson H, et al. A prospective, blinded assessment of the impact of preoperative staging on the management of rectal cancer. Gastroenterology. 2002;123(1):24-32.
2. Siegel RL, Miller KD, Jemal A. Cancer statistics, 2015. CA Cancer J Clin. 2015;65(1):5-29.
3. Ahuja NK, Sauer BG, Wang AY, et al. Performance of endoscopic ultrasound in staging rectal adenocarcinoma appropriate for primary surgical resection. Clin Gastroenterol Hepatol. 2015;13:339-44.
4. Doornebosch PG, Bronkhorst PJ, Hop WC, Bode WA, Sing AK, de Graaf EJ. The role of endorectal ultrasound in therapeutic decision-making for local vs. transabdominal resection of rectal tumors. Dis Colon Rectum. 2008;51(1):38-42.
5. Santoro GA, Gizzi G, Pellegrini L, Battistella G, Di Falco G. The value of high-resolution three-dimensional endorectal ultrasonography in the management of submucosal invasive rectal tumors. Dis Colon Rectum. 2009;52(11):1837-1843.
6. National Comprehensive Cancer Network. NCCN clinical practice guidelines in oncology: rectal cancer, version 2.2019. https://www.nccn.org/professionals/physician_gls/pdf/rectal.pdf. Published May 15, 2019. Accessed July 19, 2019.
7. Bipat S, Glas AS, Slors FJ, Zwinderman AH, Bossuyt PM, Stoker J. Rectal cancer: local staging and assessment of lymph node involvement with endoluminal US, CT, and MR imaging—a meta-analysis. Radiology. 2004;232(3):773-783.
8. Puli SR, Bechtold ML, Reddy JB, Choudhary A, Antillon MR, Brugge WR. How good is endoscopic ultrasound in differentiating various T stages of rectal cancer? Meta-analysis and systematic review. Ann Surg Oncol. 2009;16(2):254-265.
9. MERCURY Study Group. Diagnostic accuracy of preoperative magnetic resonance imaging in predicting curative resection of rectal cancer: prospective observational study. BMJ. 2006;333(7572):779.
10. Balyasnikova S, Read J, Wotherspoon A, et al. Diagnostic accuracy of high-resolution MRI as a method to predict potentially safe endoscopic and surgical planes in patient with early rectal cancer. BMJ Open Gastroenterol. 2017;4(1):e000151.
11. Frasson M, Garcia-Granero E, Roda D, et al. Preoperative chemoradiation may not always be needed for patients with T3 and T2N+ rectal cancer. Cancer. 2011;117(14):3118-3125.
12. Rafaelsen SR, Sørensen T, Jakobsen A, Bisgaard C, Lindebjerg J. Transrectal ultrasonography and magnetic resonance imaging in the staging of rectal cancer. Effect of experience. Scand J Gastroenterol. 2008;43(4):440-446.
13. Marusch F, Ptok H, Sahm M, et al. Endorectal ultrasound in rectal carcinoma – do the literature results really correspond to the realities of routine clinical care? Endoscopy. 2011;43(5):425-431.
14. Marusch F, Koch A, Schmidt U, et al. Routine use of transrectal ultrasound in rectal carcinoma: results of a prospective multicenter study. Endoscopy. 2002;34(5):385-390.
15. Ashraf S, Hompes R, Slater A, et al; Association of Coloproctology of Great Britain and Ireland Transanal Endoscopic Microsurgery (TEM) Collaboration. A critical appraisal of endorectal ultrasound and transanal endoscopic microsurgery and decision-making in early rectal cancer. Colorectal Dis. 2012;14(7):821-826.
16. Harewood GC. Assessment of clinical impact of endoscopic ultrasound on rectal cancer. Am J Gastroenterol. 2004;99(4):623-627.
17. Zorcolo L, Fantola G, Cabras F, Marongiu L, D’Alia G, Casula G. Preoperative staging of patients with rectal tumors suitable for transanal endoscopic microsurgery (TEM): comparison of endorectal ultrasound and histopathologic findings. Surg Endosc. 2009;23(6):1384-1389.
18. Akasu T, Kondo H, Moriya Y, et al. Endoscopic ultrasonography and treatment of early stage rectal cancer. World J Surg. 2000;24(9):1061-1068.
19. Nascimbeni R, Nivatvongs S, Larson DR, Burgart LJ. Long-term survival after local excision for T1 carcinoma of the rectum. Dis Colon Rectum. 2004;47(11):1773-1779.
20. Park CH, Cheon JH, Kim JO, et al. Criteria for decision making after endoscopic resection of well-differentiated rectal carcinoids with regard to potential lymphatic spread. Endoscopy. 2011;43(9):790-795.
21. Ishii N, Horiki N, Itoh T, et al. Endoscopic submucosal dissection and preoperative assessment with endoscopic ultrasonography for the treatment of rectal carcinoid tumors. Surg Endosc. 2010;24(6):1413-1419.
Endoscopic ultrasound can be highly accurate for the staging of neoplasms in early rectal cancer.
Endoscopic ultrasound can be highly accurate for the staging of neoplasms in early rectal cancer.
Colorectal cancer is the second most common cause of cancer death in the US, with one-third of all colorectal cancers occurring within the rectum. Each year, an estimated 40000 Americans are diagnosed with rectal cancer (RC).1,2 The prognosis and treatment of RC depends on both T and N stage at the time of diagnosis.3-5 According to the most recent National Comprehensive Cancer Network guidelines from May 2019, patients with T1 to T2N0 tumors should undergo transanal or transabdominal surgery upfront, whereas patients with T3 to T4N0 or any TN1 to 2 should start with neoadjuvant therapy for better locoregional control, followed by surgery.6 Therefore, the appropriate management of RC requires adequate staging.
Endoscopic ultrasound (EUS), magnetic resonance imaging (MRI), and computed tomography (CT) are the imaging techniques currently used to stage RC. In a meta-analysis of 90 articles published between 1985 and 2002 that compared the 3 radiologic modalities, Bipat and colleagues found that MRI and EUS had a similar sensitivity of 94%, whereas the specificity of EUS (86%) was significantly higher than that of MRI (69%) for muscularis propria invasion.7 CT was performed only in a limited number of trials because CT was considered inadequate to assess early T stage. For perirectal tissue invasion, the sensitivity of EUS was statistically higher than that of CT and MRI imaging: 90% compared with 79% and 82%, respectively. The specificity estimates for EUS, CT, and MRI were comparable: 75%, 78%, and 76%, respectively. The respective sensitivity and specificity of the 3 imaging modalities to evaluate lymph nodes were also comparable: EUS, 67% and 78%; CT, 55% and 74%; and MRI, 66% and 76%.
The role of EUS in the diagnosis and treatment of RC has long been validated.1,2-5 A meta-analysis of 42 studies involving 5039 patients found EUS to be highly accurate for differentiating various T stages.8 However, EUS cannot assess iliac and mesenteric lymph nodes or posterior tumor extension beyond endopelvic fascia in advanced RC. Notable heterogeneity was found among the studies in the meta-analyses with regard to the type of equipment used for staging, as well as the criteria used to assess the depth of penetration and nodal status. The recent introduction of phased-array coils and the development of T2-weighted fast spin sequences have improved the resolution of MRI. The MERCURY trial showed that extension of tumor to within 1 mm of the circumferential margin on high-resolution MRI correctly predicted margin involvement at the time of surgery in 92% of the patients.9 In the retrospective study by Balyasnikova and colleagues, MRI was found to correctly identify partial submucosal invasion and suitability for local excision in 89% of the cases.10
Therefore, both EUS and MRI are useful, more so than CT, in assessment of the depth of tumor invasion, nodal staging, and predicting the circumferential resection margin. The use of EUS, however, does not preclude the use of MRI, or vice versa. Rather, the 2 modalities can complement each other in staging and proper patient selection for treatment.11
Despite data supporting the value of EUS in staging RC, its use is limited by a high degree of operator dependence and a substantial learning curve,12-17 which may explain the low EUS accuracy observed in some reports.7,13,15 Given the presence of recognized alternatives such as MRI, we decided to reevaluate EUS accuracy for the staging of RC outside high-volume specialized centers and prospective clinical trials.
Methods
A retrospective chart review was performed that included all consecutive patients undergoing rectal ultrasound from January 2011 to August 2015 at the US Department of Veterans Affairs Medical Center (VAMC) in Memphis, Tennessee. Sixty-five patients with short-stocked or sessile lesions < 15 cm from anal margin staged T2N0M0 or lower by endorectal ultrasound (ERUS) were included. The patients with neoplasms staged in excess of T2 or N0 were excluded from the study because treatment protocol dictates immediate neoadjuvant treatment, the administration of which would affect subsequent histopathology.
For the 37 patients included in the final analysis, ERUS results were compared with surgical pathology to ascertain accuracy. The resections were performed endoscopically or surgically with a goal of obtaining clear margins. The choice of procedure depended on size, shape, location, and depth of invasion. All patients underwent clinical and endoscopic surveillance with flexible sigmoidoscopy/EUS every 3 to 6 months for the first 2 years. We used 2 different gold standards for surveillance depending on the type of procedure performed to remove the lesion. A pathology report was the gold standard used for patients who underwent surgery. In patients who underwent endoscopic resection, we used the lack of recurrent disease, determined by normal endoscopic and endoscopic ultrasound examination, to signify complete endoscopic resection and therefore adequate staging as an early neoplasm.
Results
From January 2011 to August 2015, 65 rectal ultrasounds were performed. All EUS procedures were performed by 1 physician (C Ruben Tombazzi). All patients had previous endoscopic evaluation and tissue diagnoses. Twenty-eight patients were excluded: 18 had T3 or N1 disease, 2 had T2N0 but refused surgery, 2 had anal cancer, 3 patients with suspected cancer had benign nonneoplastic disease (2 radiation proctitis, 1 normal rectal wall), and 3 underwent EUS for benign tumors (1 ganglioneuroma and 2 lipomas).
Thirty-seven patients were included in the study, 3 of whom were staged as T2N0 and 34 as T1N0 or lower by EUS. All patients were men ranging in age from 43 to 73 years (mean, 59 years). All 37 patients underwent endoscopic or surgical resection of their early rectal neoplasm. The final pathologic evaluation of the specimens demonstrated 14 carcinoid tumors, 11 adenocarcinomas, 6 tubular adenomas with high-grade dysplasia, and 6 benign adenomas. The preoperative EUS staging was confirmed for all patients, with 100% sensitivity, specificity, and accuracy. None of the patients who underwent endoscopic or surgical transanal resection had recurrence, determined by normal endoscopic and endoscopic ultrasound appearance, during a mean of 32.6 months surveillance.
Discussion
EUS has long been a recognized method for T and N staging of RC.1,3-5,7,8 Our data confirm that, in experienced hands, EUS is highly accurate in the staging of early rectal cancers.
The impact of EUS on the management of RC was demonstrated in a Mayo Clinic prospective blinded study.1 In that cohort of 80 consecutive patients who had previously had a CT for staging, EUS altered patient management in about 30% of cases. The most common change precipatated by EUS was the indication for additional neoadjuvant treatment.
However, the results have not been as encouraging when ERUS is performed outside of strict research protocol. A multicenter, prospective, country-wide quality assurance study from > 300 German hospitals was designed to assess the diagnostic accuracy of EUS in RC.13 Of 29206 patients, 7096 underwent surgery, without neoadjuvant treatment, and were included in the final analysis. The correspondence of tumor invasion with histopathology was 64.7%, with understaging of 18% and overstaging of 17.3%.13 These numbers were better in hospitals with greater experience performing ERUS: 73% accuracy in the centers with a case load of > 30 cases per year compared with 63.2% accuracy for the centers with < 10 cases a year. Marusch and colleagues had previously demonstrated an EUS accuracy of 63.3% in a study of 1463 patients with RC in Germany.14 Another study based out of the UK had similar findings. Ashraf and colleagues performed a database analyses from 20 UK centers and identified 165 patients with RC who underwent ERUS and endoscopic microsurgery.15 Compared with histopathology, EUS had 57.1% sensitivity, 73% specificity, and 42.9% accuracy for T1 cancers; EUS accuracy was 50% for T2 and 58% for T3 tumors. The authors concluded that the general accuracy of EUS in determining stage was around 50%, the statistical equivalent of flipping a coin.
The low accuracy of EUS observed by German and British multicenter studies13-15 was attributed to the difference that may exist in clinical trials at specialized centers compared with wider use of EUS in a community setting. As seen by our data, the Memphis VAMC is not a high-volume center for the treatment of RC. However, all our EUS procedures were performed and interpreted by a single operator (C. Ruben Tombazzi) with 18 years of EUS experience. We cannot conclude that no patient was overstaged, as patients receiving a stage of T3N0 or T > N0 received neoadjuvant treatment and were not included. However, we can conclude that no patient was understaged. All patients deemed to be T1 to T2N0 included in our study received accurate staging. Our results are consistent with the high accuracy of EUS reported from other centers with experience in diagnosis and treatment of RC.1,3-5,17,18
Although EUS is accurate in differentiating T1 from T2 tumors, it cannot reliably differentiate T1 from T0 lesions. In one study, 57.6% of adenomas and 30.7% of carcinomas in situ were staged as T1 on EUS, while almost half of T1 cancers were interpreted as T0.17 This drawback is a well-known limitation of EUS; although, the misinterpretation does not affect treatment, as both T0 and T1 lesions can be treated successfully by local excision alone, which was the algorithm used for our patients. The choice of the specific procedure for local excision was left to the clinicians and included transanal endoscopic or surgical resections. At a mean follow-up of 32.6 months, none of the 37 patients who underwent endoscopic or surgical transanal resection had evidence of recurrent disease.
A limitation of EUS, or any other imaging modality, is differentiating tumor invasion from peritumoral inflammation. The inflammation can render images of tumor borders ill-defined and irregular, which hinders precise staging. However, the accurate identification of tumors with deep involvement of the submucosa (T1sm3) is of importance, because these tumors are more advanced than the superficial and intermediate T1 lesions (T1sm1 and T1sm2, respectively).
Patients with RC whose lesions are considered T1sm3 are at higher risk of harboring lymph node metastases.18 Nascimbeni and colleagues had shown that the invasion into the lower third of the submucosa (sm3) was an independent risk factor for lower cancer-free survival among patients with T1 RC.19
Unlike rectal adenocarcinomas, the prognosis for carcinoid tumors correlates not only with the depth of invasion but also with the size of the tumor. The other adverse prognostic features include poor differentiation, high mitosis index, and lymphovascular invasion.20
EUS had been shown to be highly accurate in determining the precise carcinoid tumor size, depth of invasion, and lymph node metastases.20,21 In a study of 66 resected rectal carcinoid tumors by Ishii and colleagues, 57 lesions had a diameter of ≤ 10 mm and 9 lesions had a diameter of > 10 mm.21 All of the 57 carcinoid tumors with a diameter of ≤ 10 mm were confined to the submucosa. In contrast, 5 of the 9 lesions > 10 mm invaded the muscularis propria, 6 had a lymphovascular invasion, 4 were lymph node metastases, and 1 was a liver metastasis.
In our series, 4 of the 14 carcinoid tumors were > 10 mm but none were > 20 mm. None of the carcinoids with a diameter ≤ 10 mm invaded the muscularis propria. Of the 4 carcinoids > 10 mm, 1 was T2N0 and 3 were T1N0. All carcinoid tumors in our series were low grade and with low proliferation indexes, and all were treated successfully by local excision.
Conclusion
We believe our study shows that EUS can be highly accurate in staging rectal lesions, specifically lesions that are T1-T2N0, be they adenocarcinoma or carcinoid. Although we could not assess overstaging for lesions that were staged > T2 or > N0, we w
1. Harewood GC, Wiersema MJ, Nelson H, et al. A prospective, blinded assessment of the impact of preoperative staging on the management of rectal cancer. Gastroenterology. 2002;123(1):24-32.
2. Siegel RL, Miller KD, Jemal A. Cancer statistics, 2015. CA Cancer J Clin. 2015;65(1):5-29.
3. Ahuja NK, Sauer BG, Wang AY, et al. Performance of endoscopic ultrasound in staging rectal adenocarcinoma appropriate for primary surgical resection. Clin Gastroenterol Hepatol. 2015;13:339-44.
4. Doornebosch PG, Bronkhorst PJ, Hop WC, Bode WA, Sing AK, de Graaf EJ. The role of endorectal ultrasound in therapeutic decision-making for local vs. transabdominal resection of rectal tumors. Dis Colon Rectum. 2008;51(1):38-42.
5. Santoro GA, Gizzi G, Pellegrini L, Battistella G, Di Falco G. The value of high-resolution three-dimensional endorectal ultrasonography in the management of submucosal invasive rectal tumors. Dis Colon Rectum. 2009;52(11):1837-1843.
6. National Comprehensive Cancer Network. NCCN clinical practice guidelines in oncology: rectal cancer, version 2.2019. https://www.nccn.org/professionals/physician_gls/pdf/rectal.pdf. Published May 15, 2019. Accessed July 19, 2019.
7. Bipat S, Glas AS, Slors FJ, Zwinderman AH, Bossuyt PM, Stoker J. Rectal cancer: local staging and assessment of lymph node involvement with endoluminal US, CT, and MR imaging—a meta-analysis. Radiology. 2004;232(3):773-783.
8. Puli SR, Bechtold ML, Reddy JB, Choudhary A, Antillon MR, Brugge WR. How good is endoscopic ultrasound in differentiating various T stages of rectal cancer? Meta-analysis and systematic review. Ann Surg Oncol. 2009;16(2):254-265.
9. MERCURY Study Group. Diagnostic accuracy of preoperative magnetic resonance imaging in predicting curative resection of rectal cancer: prospective observational study. BMJ. 2006;333(7572):779.
10. Balyasnikova S, Read J, Wotherspoon A, et al. Diagnostic accuracy of high-resolution MRI as a method to predict potentially safe endoscopic and surgical planes in patient with early rectal cancer. BMJ Open Gastroenterol. 2017;4(1):e000151.
11. Frasson M, Garcia-Granero E, Roda D, et al. Preoperative chemoradiation may not always be needed for patients with T3 and T2N+ rectal cancer. Cancer. 2011;117(14):3118-3125.
12. Rafaelsen SR, Sørensen T, Jakobsen A, Bisgaard C, Lindebjerg J. Transrectal ultrasonography and magnetic resonance imaging in the staging of rectal cancer. Effect of experience. Scand J Gastroenterol. 2008;43(4):440-446.
13. Marusch F, Ptok H, Sahm M, et al. Endorectal ultrasound in rectal carcinoma – do the literature results really correspond to the realities of routine clinical care? Endoscopy. 2011;43(5):425-431.
14. Marusch F, Koch A, Schmidt U, et al. Routine use of transrectal ultrasound in rectal carcinoma: results of a prospective multicenter study. Endoscopy. 2002;34(5):385-390.
15. Ashraf S, Hompes R, Slater A, et al; Association of Coloproctology of Great Britain and Ireland Transanal Endoscopic Microsurgery (TEM) Collaboration. A critical appraisal of endorectal ultrasound and transanal endoscopic microsurgery and decision-making in early rectal cancer. Colorectal Dis. 2012;14(7):821-826.
16. Harewood GC. Assessment of clinical impact of endoscopic ultrasound on rectal cancer. Am J Gastroenterol. 2004;99(4):623-627.
17. Zorcolo L, Fantola G, Cabras F, Marongiu L, D’Alia G, Casula G. Preoperative staging of patients with rectal tumors suitable for transanal endoscopic microsurgery (TEM): comparison of endorectal ultrasound and histopathologic findings. Surg Endosc. 2009;23(6):1384-1389.
18. Akasu T, Kondo H, Moriya Y, et al. Endoscopic ultrasonography and treatment of early stage rectal cancer. World J Surg. 2000;24(9):1061-1068.
19. Nascimbeni R, Nivatvongs S, Larson DR, Burgart LJ. Long-term survival after local excision for T1 carcinoma of the rectum. Dis Colon Rectum. 2004;47(11):1773-1779.
20. Park CH, Cheon JH, Kim JO, et al. Criteria for decision making after endoscopic resection of well-differentiated rectal carcinoids with regard to potential lymphatic spread. Endoscopy. 2011;43(9):790-795.
21. Ishii N, Horiki N, Itoh T, et al. Endoscopic submucosal dissection and preoperative assessment with endoscopic ultrasonography for the treatment of rectal carcinoid tumors. Surg Endosc. 2010;24(6):1413-1419.