User login
Liver Imaging Reporting and Data System in Patients at High Risk for Hepatocellular Carcinoma in the Memphis Veterans Affairs Population (FULL)
Although hepatocellular carcinoma can be difficult to detect, use of the LI-RADS algorithm could lead to earlier identification in at-risk patients.
Hepatocellular carcinoma (HCC) is the third most common cause of death from cancer worldwide.1 Liver cancer is the fifth most common cancer in men and the seventh in women.2 The highest incidence rates are in sub-Saharan Africa and Southeast Asia where hepatitis B virus is endemic. The incidence of HCC in western countries is increasing, particularly due to the rise of hepatitis C virus (HCV) as well as alcoholic liver disease and nonalcoholic fatty liver disease. The incidence of HCC has tripled in the US in the past 2 decades.1-3
HCC can be diagnosed by radiographic images without the need for biopsy if the typical imaging features are present.3 The European Association for the Study of Liver Disease (EASL) and the American Association for the Study of Liver Diseases (AASLD) recommend screening abdominal ultrasonography at 6-month intervals for high-risk patients.3,4 High-risk patients include patients with cirrhosis, especially those with hepatitis B or C.3
If screening ultrasonography detects a nodule, size determines whether a follow-up ultrasound is needed vs obtaining a contrast-enhanced dynamic computed tomography (CT) scan or a magnetic resonance image (MRI).3 If ultrasonography detects a nodule > 1 cm in diameter, then a dynamic CT or MRI is performed. Characteristic hyperenhancement during later arterial phase and washout during the venous or delayed phase is associated with a nearly 100% specificity for HCC diagnosis.5 Arterial-enhancing contrast is required when using CT and MRI because HCC is a hypervascular lesion.6 The portal venous blood dilutes the majority of the liver’s arterial blood; therefore, the liver does not enhance during the arterial phase, while HCC will show maximum enhancement.7 Furthermore, HCC should demonstrate a “washout” of contrast during the venous phase on CT and MRI.4 Standard imaging protocol dictates that 4 phases are needed to properly diagnose HCC including unenhanced, arterial, venous, and delayed.4
Regular surveillance increases the likelihood of detecting HCC before the presentation of clinical symptoms and facilitates receipt of curative therapy.8-10 Patients with viral hepatitis and cirrhosis with HCC found on screening are more likely to have earlier-stage disease and survive longer from the time of diagnosis.11 Furthermore, it has been observed that HCC detected by surveillance is significantly more likely to undergo curative therapy compared with incidental or symptomatic detection of HCC.9
Technical improvements in imaging techniques include advancement in contrast agents, multidetector row helical CT, and the flexibility/range of pulse sequences available in MRI.7 Even with technical improvements in all modalities used in HCC imaging, detecting HCC remains difficult, especially when detecting the small (< 2 cm) lesions in a cirrhotic liver.7 Interpretation of imaging also remains a challenge as HCC does not always fit strict criteria: lack of “washout” in a hypervascular lesion, determining small HCC lesions from benign nodules, and hypovascular/isovascular HCC.5 Radiologic differentials in the diagnosis of HCC include transient hepatic intensity difference (THID)/transient hepatic attenuation difference (THAD), arterio-portal shunt, and regenerative nodules.12 In the common clinical setting, patients undergo multiple imaging studies that are interpreted by multiple radiologists, which can add to the difficulty in the diagnosis of HCC.13
The radiology community recognized the inconsistencies and complexities of HCC imaging. Therefore, the American College of Radiology endorsed the Liver Imaging Reporting and Data System (LI-RADS), which had the goal of reducing variability in lesion interpretation through standardization and improving communication with clinicians.14 LI-RADS uses a diagnostic algorithm for CT and MRI that categorizes observed liver findings in high-risk individuals based on the probability or relative risk of HCC without assigning a formal diagnosis.14 LI-RADS takes into account arterial phase enhancement, tumor size, washout appearance, the presence and nature of a capsule, and threshold growth.15 LI-RADS categorizes an observed liver finding on a scale of 1 to 5, with 1 corresponding to a definitely benign finding and 5 with definitive HCC.14 Furthermore, LI-RADS sought to limit the technical variabilities among institutions.
LI-RADS was launched in 2011 and has been utilized by many clinical practices while continuing to be expanded and updated.16 Recent studies examined the specificity of LI-RADS as well as interreader variability.17,18 For nodules viewed on MRI, both LI-RADS categories 4 and 5 had high specificity for HCC.17 When looking at interreader repeatability, LI-RADS showed moderate agreement among experts using the diagnostic algorithm.19 Further studies have compared LI-RADS with the AASLD guidelines and the Organ Procurement and Transplantation Network (OPTN) guidelines.16 When compared with other guidelines, LI-RADS expands the definition of indeterminate findings into probably benign, intermediate probability of HCC, and probably HCC, which corresponds to LI-RADS categories 2, 3, and 4.16
We looked retrospectively at a group of patients previously diagnosed with HCC to see whether utilizing the LI-RADS scoring system within our screening system might have allowed an earlier prediction of HCC and a timelier intervention. Prior to this investigation the LI-RADS system was not used for HCC screening at our US Department of Veterans Affairs (VA) facility. We examined screened patients at the Memphis VA Medical Center (MVAMC) in Tennessee who were subsequently diagnosed with HCC to see which LI-RADS category the last surveillance CT prior to diagnosis would fall into, 6 months to a year prior to the diagnosis of HCC. Our control population was a group of patients screened with CT for their liver nodules who were found not to have HCC.
Methods
Patients at MVAMC with cirrhosis and patients with chronic hepatitis B are routinely screened with ultrasound, CT, or MRI in accordance with the AASLD, EASL, and VA guidelines. Of 303 patients with HCV and cirrhosis under care in 2015, 242 (81%) received imaging to screen for HCC according to the VA National Hepatitis C Registry 2015 (Personal Communication, Population Health Service, Office of Patient Care Services).The LI-RADS scoring system was not applied as a standard screening methodology.
Under an institutional review board-approved protocol, we reviewed the charts of all patients diagnosed with HCC at MVAMC from 2009 to 2014, utilizing ICD-9 code of 155.0 for HCC. We identified within these charts patients who had a surveillance CT image performed within a 6- to 13-month period prior to the CTs that diagnosed HCC (prediagnostic HCC CT). Furthermore, we reviewed the charts of all patients diagnosed with benign liver nodules at MVAMC from 2009 to 2014, utilizing the ICD-9 code of 573.8 for other specified disorders of the liver.
Within these charts, we found patients who had a surveillance CT image performed and who were followed after that image with additional imaging for ≥ 2 years or who had a liver biopsy negative for HCC (benign surveillance CT). We compared these 2 sets of CTs utilizing LI-RADS criteria. Once these patients were identified, a list of the CTs to be examined were given to 2 MVAMC radiologists who specialize in CT.
No identifying information of the patients was included, and a 13-digit number unique to each CT exam identified the CTs to be reviewed. Radiologist 1 and 2 examined the CTs on the MVAMC Picture Archiving and Communication System (PACS). Both radiologists were asked to give each nodule a score according to LI-RADS v2014 diagnostic algorithm (Figure).
We hypothesized that the prediagnostic CT images of patients eventually determined to have HCC would have a LI-RADS score of 4 (LR4) or LR5. Furthermore, we hypothesized that the CT images of the benign liver nodule patients would have a score ≤ LR3. If there was a disagreement between the radiologists in terms of a malignant score (LR4 or LR5) vs a benign score (≤ LR3), then a third radiologist (radiologist 3) provided a score for these nodules. The third, tiebreaker radiologist was given the scores of both prior radiologists and asked to choose which score was correct.
Statistical analysis was then applied to the data to determine the sensitivity, specificity, and diagnostic accuracy in diagnosing eventual HCC, as well as the false-negative and false-positive rates of radiologists 1 and 2. Raw data also were used to determine the agreement between raters by calculating the κ statistic with a 95% CI.
Results
A total of 70 nodules were examined by radiologists 1 and 2 with 42 of the nodules in the prediagnostic HCC CTs and 28 of the nodules in the benign surveillance CTs. 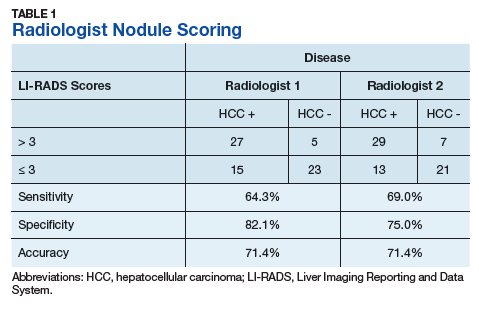
Radiologist 1 identified 11 patients with LR4 and 21 patients with LR5. His scores showed a sensitivity of 64.3% and specificity of 82.1% with accuracy of 71.4% for LI-RADS in identifying eventual HCC. The false-negative rate of the LI-RADS diagnostic algorithm for radiologist 1 was 35.7% and the false-positive rate was 17.9%. Radiologist 2 identified 17 patients LR4 and 19 patients with LR5. Radiologist 2’s scores showed a sensitivity of 69.0% and specificity of 75.0% with accuracy of 71.4% for LI-RADS in identifying eventual HCC.The false-negative rate of the LI-RADS diagnostic algorithm for radiologist 2 was 31.0% and false-positive rate of 25.0%. The κ statistic was calculated to determine the interrater agreement. The radiologists agreed on 58 of 70 samples; 15 without HCC and 43 with HCC. The κ statistic was 0.592, which indicates moderate agreement (Table 2). 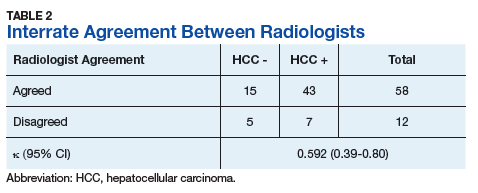
Discussion
If HCC is diagnosed late in the disease process based on symptomatology and not on surveillance imaging, the likelihood of receiving early and potential curative therapy greatly declines as was shown in a systemic literature review.9 Surveillance imaging and lesion interpretation by various radiologists has been difficult to standardize as new technologic advances continue to occur in the imaging of HCC.14 LI-RADS was initiated to help standardize CT and MRI interpretation and reporting of hepatic nodules. As a dynamic algorithm, it continues to adjust with new advances in imaging techniques with the most recent updates being made to the algorithm in 2014.14,19 LI-RADS applies to patients at high risk for HCC most often who are already enrolled in a surveillance program.19 The MVAMC has a high incidence of patients with cirrhosis who are at risk for HCC, which is why we chose it as our study population.
LI-RADS can be applied to both MRI and CT imaging. Much of the recent literature have looked at LI-RADS in terms of MRI. A group in China looked at 100 pathologically confirmed patients and assigned a LI-RADS score to the MRI at the time of diagnosis and showed that MRI LI-RADS scoring was highly sensitive and specific in the diagnosis of HCC.20 This study did note a numeric difference in the specificity of LI-RADS algorithm depending on how LR3 scores were viewed. If a LR3 score was considered negative rather than positive for HCC, then the specificity increased by almost 20%.20
Another study looked at patients with liver nodules ≤ 20 mm found on ultrasound and obtained MRIs and biopsies on these patients, assigning the MRI a LI-RADs score.17 Darnell and colleagues found that MRI LR4 and LR5 have a high specificity for HCC. However, 29 of the 42 LR3 lesions examined were found to be HCC.17 Furthermore, Choi and colleagues retrospectively looked at patients in a HCC surveillance program who had undergone MRI as part of the program and assigned LI-RADS scores to these MRIs.21 Their study showed that LR5 criteria on gadoxetate disodium-enhanced MRI has excellent positive predictive value (PPV) for diagnosing HCC, and LR4 showed good PPV.21
In our study, we chose to look at LI-RADS in terms of surveillance CT scans 6 to 13 months prior to the diagnosis of HCC to see whether this method would allow us to intervene earlier with more aggressive diagnostics or therapy in those suspected of having HCC. Although Choi and colleagues looked retrospectively at MRI surveillance imaging, most of the prior studies have looked at LI-RADS scoring in imaging at the time of diagnosis.17,20,21 By looking at surveillance CT scans, we sought to determine LI-RADS sensitivity, specificity, and diagnostic accuracy as a screening tool compared with CT evaluations without LI-RADS scoring.
We also chose to look at CT scans since most of the prior studies have looked at the more detailed and often more expensive MRIs. For both radiologists 1 and 2, the sensitivity was > 60% and specificity was > 70% with a diagnostic accuracy of 71.4% in predicting a diagnosis of HCC in future scans. Although there was high false negative of > 30% for both radiologists, we did consider LR3 as negative for HCC. As Darnell and colleagues’ study of MRI LI-RADS shows, LR3 may need to be revised in the future as its ambiguity can lead to false-negatives.17 Our results also showed moderate interreader agreement, which has been seen in previous studies with LI-RADS.18
Some studies have compared MRI with CT imaging in terms of LI-RADs classification of hepatic nodules to find out whether concordance was seen.22,23 Both studies found that there was substantial discordance between MRI and CT with CT often underscoring hepatic nodules.22,23 In Zhang and colleagues, interclass agreement between CT and MRI varied the most in terms of arterial enhancement with CT producing false-negative findings.22 CT also underestimated LI-RADS score by 16.9% for LR3, 37.3% for LR4, and 8.5% for LR5 in this study.22 Furthermore, Corwin and colleagues found a significant upgrade in terms of LI-RADS categorization with MRI for 42.5% of observations.23 In this study, upgraded LI-RADS scores on MRI included 2 upgraded to LR5V (Figure), 15 upgraded to LR5, and 12 upgraded to LR4.23 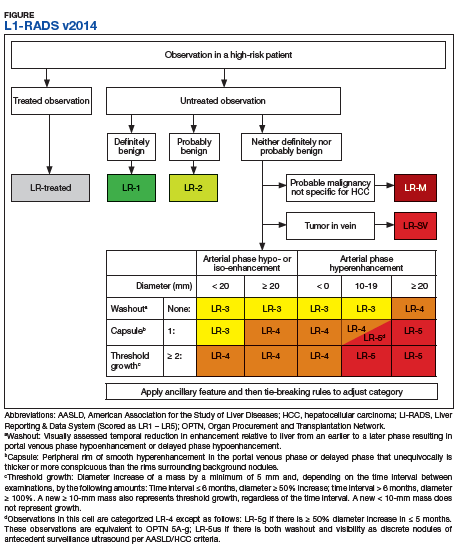
Our study shows that the LI-RADS algorithm has a good sensitivity, specificity, and diagnostic accuracy as a screening tool, predicting HCC in scans earlier than standard CT evaluation. In our study, the patients with HCC were shown to have higher LI-RADS scores on prediagnostic imaging, while the benign liver nodule patients were shown to have lower LI-RADS scores. This data would suggest that a LI-RADS score given to surveillance CT of LR4 or higher should recommend either a biopsy or follow-up imaging after a short interval. If LI-RADS is applied to surveillance CTs in patients at risk for HCC, a diagnosis of HCC may be arrived at earlier as compared with not using the LI-RADS algorithm. Earlier detection may lead to earlier intervention and improved treatment outcomes.
Limitations
Limitations to our study occurred because radiologist 3 did not review all of the images nor score them. Radiologist 3 was limited to 12 images where there was disagreement and was limited to 2 scores to choose from for each image. Further limitations include that this study was performed at a single center. Our study focused on one imaging modality and did not include ultrasounds or MRIs. We did not compare the demographics of our patients with those of other VA hospitals. The radiologists interpreted the images individually, and their subjectivity was another limitation.
Conclusion
In the MVAMC population, LI-RADS showed a good sensitivity, specificity, and diagnostic accuracy for CT surveillance scans in patient at high risk for HCC at an earlier time point than did standard evaluation by very experienced CT radiologists. Higher LI-RADS scores on surveillance CTs had good diagnostic accuracy for the probable future diagnosis of HCC, whereas lower LI-RADS scores had a good diagnostic accuracy for probable benign nodules. Utilizing the LI-RADS algorithm on all surveillance CTs in patients at high risk for HCC may lead to obtaining MRIs or follow-up CTs sooner for suspicious nodules, leading to an earlier diagnosis of HCC and possible earlier and more effective intervention.
1. El–Serag HB, Rudolph KL. Hepatocellular carcinoma: epidemiology and molecular carcinogenesis. Gastroenterology. 2007;132(7):2557-2576.
2. El-Serag HB. Hepatocellular carcinoma. N Engl J Med. 2011;365(12):1118-1127.
3. Bruix J, Sherman M; American Association for the Study of Liver Diseases. Management of hepatocellular carcinoma: an update. Hepatology. 2011;53(3):1020-1022.
4. Selvapatt N, House H, Brown A. Hepatocellular carcinoma surveillance: are we utilizing it? J Clin Gastroenterol. 2016;50(1):e8-e12.
5. Lee JM, Yoon JH, Joo I, Woo HS. Recent advances in CT and MR imaging for evaluation of hepatocellular carcinoma. Liver Cancer. 2012;1(1):22-40.
6. Chou R, Cuevas C, Fu R, et al. Imaging techniques for the diagnosis of hepatocellular carcinoma: a systemic review and meta-analysis. Ann Intern Med. 2015;162(10):697-711.
7. Ariff B, Lloyd CR, Khan S, et al. Imaging of liver cancer. World J Gastroenterol. 2009;15(11):1289-1300.
8. Yuen MF, Cheng CC, Lauder IJ, Lam SK, Ooi CG, Lai CL. Early detection of hepatocellular carcinoma increases the chance of treatment: Hong Kong experience. Hepatology. 2000;31(2):330-335.
9. Singal AG, Pillai A, Tiro J. Early detection, curative treatment, and survival rates for hepatocellular carcinoma surveillance in patients with cirrhosis: a meta-analysis. PLoS Med. 2014;11(4):e1001624.
10. Nusbaum, JD, Smirniotopoulos J, Wright HC, et al. The effect of hepatocellular carcinoma surveillance in an urban population with liver cirrhosis. J Clin Gastroenterol. 2015;49(10):e91-e95.
11. Kansagara D, Papak J, Pasha AS, et al. Screening for hepatocellular carcinoma in chronic liver disease: a systemic review. Ann Intern Med. 2014;161(4):261-269.
12. Shah S, Shukla A, Paunipagar B. Radiological features of hepatocellular carcinoma. J Clin Exp Hepatol. 2014;4(suppl 3):S63-S66.
13. You MW, Kim SY, Kim KW, et al. Recent advances in the imaging of hepatocellular carcinoma. Clin Mol Hepatol. 2015;21(1):95-103.
14. American College of Radiology. Liver reporting and data system (LI-RADS). https://www.acr.org/Clinical-Resources/Reporting-and-Data-Systems/LI-RADS. Accessed April 10, 2018.
15. Anis M. Imaging of hepatocellular carcinoma: new approaches to diagnosis. Clin Liver Dis. 2015;19(2):325-340.
16. Mitchell D, Bruix J, Sherman M, Sirlin CB. LI-RADS (Liver Imaging Reporting and Data System): summary, discussion, and consensus of the LI-RADS Management Working Group and future directions. Hepatology. 2015;61(3):1056-1065.
17. Darnell A, Forner A, Rimola J, et al. Liver imaging reporting and data system with MR imaging: evaluation in nodules 20 mm or smaller detected in cirrhosis at screening US. Radiology. 2015; 275(3):698-707.
18. Davenport MS, Khalatbari S, Liu PS, et al. Repeatability of diagnostic features and scoring systems for hepatocellular carcinoma by using MR imaging. Radiology. 2014;272(1):132-142.
19. An C, Rakhmonova G, Choi JY, Kim MJ. Liver imaging reporting and data system (LI-RADS) version 2014: understanding and application of the diagnostic algorithm. Clin Mol Hepatol. 2016;22(2):296-307.
20. Zhao W, Li W, Yi X, et al. [Diagnostic value of liver imaging reporting and data system on primary hepatocellular carcinoma] [in Chinese]. Zhong Nan Da Xue Xue Bao Yi Xue Ban. 2016;41(4):380-387.
21. Choi SH, Byun JH, Kim SY, et al. Liver imaging reporting and data system v2014 with gadoxetate disodium-enhanced magnetic resonance imaging: validation of LIRADS category 4 and 5 criteria. Invest Radiol. 2016;51(8):483-490.
22. Zhang YD, Zhu FP, Xu X, et al. Liver imaging reporting and data system: substantial discordance between CT and MR for imaging classification of hepatic nodules. Acad Radiol. 2016;23(3):344-352.
23. Corwin MT, Fananapazir G, Jin M, Lamba R, Bashir MR. Difference in liver imaging and reporting data system categorization between MRI and CT. Am J Roentgenol. 2016;206(2):307-312.
Although hepatocellular carcinoma can be difficult to detect, use of the LI-RADS algorithm could lead to earlier identification in at-risk patients.
Although hepatocellular carcinoma can be difficult to detect, use of the LI-RADS algorithm could lead to earlier identification in at-risk patients.
Hepatocellular carcinoma (HCC) is the third most common cause of death from cancer worldwide.1 Liver cancer is the fifth most common cancer in men and the seventh in women.2 The highest incidence rates are in sub-Saharan Africa and Southeast Asia where hepatitis B virus is endemic. The incidence of HCC in western countries is increasing, particularly due to the rise of hepatitis C virus (HCV) as well as alcoholic liver disease and nonalcoholic fatty liver disease. The incidence of HCC has tripled in the US in the past 2 decades.1-3
HCC can be diagnosed by radiographic images without the need for biopsy if the typical imaging features are present.3 The European Association for the Study of Liver Disease (EASL) and the American Association for the Study of Liver Diseases (AASLD) recommend screening abdominal ultrasonography at 6-month intervals for high-risk patients.3,4 High-risk patients include patients with cirrhosis, especially those with hepatitis B or C.3
If screening ultrasonography detects a nodule, size determines whether a follow-up ultrasound is needed vs obtaining a contrast-enhanced dynamic computed tomography (CT) scan or a magnetic resonance image (MRI).3 If ultrasonography detects a nodule > 1 cm in diameter, then a dynamic CT or MRI is performed. Characteristic hyperenhancement during later arterial phase and washout during the venous or delayed phase is associated with a nearly 100% specificity for HCC diagnosis.5 Arterial-enhancing contrast is required when using CT and MRI because HCC is a hypervascular lesion.6 The portal venous blood dilutes the majority of the liver’s arterial blood; therefore, the liver does not enhance during the arterial phase, while HCC will show maximum enhancement.7 Furthermore, HCC should demonstrate a “washout” of contrast during the venous phase on CT and MRI.4 Standard imaging protocol dictates that 4 phases are needed to properly diagnose HCC including unenhanced, arterial, venous, and delayed.4
Regular surveillance increases the likelihood of detecting HCC before the presentation of clinical symptoms and facilitates receipt of curative therapy.8-10 Patients with viral hepatitis and cirrhosis with HCC found on screening are more likely to have earlier-stage disease and survive longer from the time of diagnosis.11 Furthermore, it has been observed that HCC detected by surveillance is significantly more likely to undergo curative therapy compared with incidental or symptomatic detection of HCC.9
Technical improvements in imaging techniques include advancement in contrast agents, multidetector row helical CT, and the flexibility/range of pulse sequences available in MRI.7 Even with technical improvements in all modalities used in HCC imaging, detecting HCC remains difficult, especially when detecting the small (< 2 cm) lesions in a cirrhotic liver.7 Interpretation of imaging also remains a challenge as HCC does not always fit strict criteria: lack of “washout” in a hypervascular lesion, determining small HCC lesions from benign nodules, and hypovascular/isovascular HCC.5 Radiologic differentials in the diagnosis of HCC include transient hepatic intensity difference (THID)/transient hepatic attenuation difference (THAD), arterio-portal shunt, and regenerative nodules.12 In the common clinical setting, patients undergo multiple imaging studies that are interpreted by multiple radiologists, which can add to the difficulty in the diagnosis of HCC.13
The radiology community recognized the inconsistencies and complexities of HCC imaging. Therefore, the American College of Radiology endorsed the Liver Imaging Reporting and Data System (LI-RADS), which had the goal of reducing variability in lesion interpretation through standardization and improving communication with clinicians.14 LI-RADS uses a diagnostic algorithm for CT and MRI that categorizes observed liver findings in high-risk individuals based on the probability or relative risk of HCC without assigning a formal diagnosis.14 LI-RADS takes into account arterial phase enhancement, tumor size, washout appearance, the presence and nature of a capsule, and threshold growth.15 LI-RADS categorizes an observed liver finding on a scale of 1 to 5, with 1 corresponding to a definitely benign finding and 5 with definitive HCC.14 Furthermore, LI-RADS sought to limit the technical variabilities among institutions.
LI-RADS was launched in 2011 and has been utilized by many clinical practices while continuing to be expanded and updated.16 Recent studies examined the specificity of LI-RADS as well as interreader variability.17,18 For nodules viewed on MRI, both LI-RADS categories 4 and 5 had high specificity for HCC.17 When looking at interreader repeatability, LI-RADS showed moderate agreement among experts using the diagnostic algorithm.19 Further studies have compared LI-RADS with the AASLD guidelines and the Organ Procurement and Transplantation Network (OPTN) guidelines.16 When compared with other guidelines, LI-RADS expands the definition of indeterminate findings into probably benign, intermediate probability of HCC, and probably HCC, which corresponds to LI-RADS categories 2, 3, and 4.16
We looked retrospectively at a group of patients previously diagnosed with HCC to see whether utilizing the LI-RADS scoring system within our screening system might have allowed an earlier prediction of HCC and a timelier intervention. Prior to this investigation the LI-RADS system was not used for HCC screening at our US Department of Veterans Affairs (VA) facility. We examined screened patients at the Memphis VA Medical Center (MVAMC) in Tennessee who were subsequently diagnosed with HCC to see which LI-RADS category the last surveillance CT prior to diagnosis would fall into, 6 months to a year prior to the diagnosis of HCC. Our control population was a group of patients screened with CT for their liver nodules who were found not to have HCC.
Methods
Patients at MVAMC with cirrhosis and patients with chronic hepatitis B are routinely screened with ultrasound, CT, or MRI in accordance with the AASLD, EASL, and VA guidelines. Of 303 patients with HCV and cirrhosis under care in 2015, 242 (81%) received imaging to screen for HCC according to the VA National Hepatitis C Registry 2015 (Personal Communication, Population Health Service, Office of Patient Care Services).The LI-RADS scoring system was not applied as a standard screening methodology.
Under an institutional review board-approved protocol, we reviewed the charts of all patients diagnosed with HCC at MVAMC from 2009 to 2014, utilizing ICD-9 code of 155.0 for HCC. We identified within these charts patients who had a surveillance CT image performed within a 6- to 13-month period prior to the CTs that diagnosed HCC (prediagnostic HCC CT). Furthermore, we reviewed the charts of all patients diagnosed with benign liver nodules at MVAMC from 2009 to 2014, utilizing the ICD-9 code of 573.8 for other specified disorders of the liver.
Within these charts, we found patients who had a surveillance CT image performed and who were followed after that image with additional imaging for ≥ 2 years or who had a liver biopsy negative for HCC (benign surveillance CT). We compared these 2 sets of CTs utilizing LI-RADS criteria. Once these patients were identified, a list of the CTs to be examined were given to 2 MVAMC radiologists who specialize in CT.
No identifying information of the patients was included, and a 13-digit number unique to each CT exam identified the CTs to be reviewed. Radiologist 1 and 2 examined the CTs on the MVAMC Picture Archiving and Communication System (PACS). Both radiologists were asked to give each nodule a score according to LI-RADS v2014 diagnostic algorithm (Figure).
We hypothesized that the prediagnostic CT images of patients eventually determined to have HCC would have a LI-RADS score of 4 (LR4) or LR5. Furthermore, we hypothesized that the CT images of the benign liver nodule patients would have a score ≤ LR3. If there was a disagreement between the radiologists in terms of a malignant score (LR4 or LR5) vs a benign score (≤ LR3), then a third radiologist (radiologist 3) provided a score for these nodules. The third, tiebreaker radiologist was given the scores of both prior radiologists and asked to choose which score was correct.
Statistical analysis was then applied to the data to determine the sensitivity, specificity, and diagnostic accuracy in diagnosing eventual HCC, as well as the false-negative and false-positive rates of radiologists 1 and 2. Raw data also were used to determine the agreement between raters by calculating the κ statistic with a 95% CI.
Results
A total of 70 nodules were examined by radiologists 1 and 2 with 42 of the nodules in the prediagnostic HCC CTs and 28 of the nodules in the benign surveillance CTs.
Radiologist 1 identified 11 patients with LR4 and 21 patients with LR5. His scores showed a sensitivity of 64.3% and specificity of 82.1% with accuracy of 71.4% for LI-RADS in identifying eventual HCC. The false-negative rate of the LI-RADS diagnostic algorithm for radiologist 1 was 35.7% and the false-positive rate was 17.9%. Radiologist 2 identified 17 patients LR4 and 19 patients with LR5. Radiologist 2’s scores showed a sensitivity of 69.0% and specificity of 75.0% with accuracy of 71.4% for LI-RADS in identifying eventual HCC.The false-negative rate of the LI-RADS diagnostic algorithm for radiologist 2 was 31.0% and false-positive rate of 25.0%. The κ statistic was calculated to determine the interrater agreement. The radiologists agreed on 58 of 70 samples; 15 without HCC and 43 with HCC. The κ statistic was 0.592, which indicates moderate agreement (Table 2).
Discussion
If HCC is diagnosed late in the disease process based on symptomatology and not on surveillance imaging, the likelihood of receiving early and potential curative therapy greatly declines as was shown in a systemic literature review.9 Surveillance imaging and lesion interpretation by various radiologists has been difficult to standardize as new technologic advances continue to occur in the imaging of HCC.14 LI-RADS was initiated to help standardize CT and MRI interpretation and reporting of hepatic nodules. As a dynamic algorithm, it continues to adjust with new advances in imaging techniques with the most recent updates being made to the algorithm in 2014.14,19 LI-RADS applies to patients at high risk for HCC most often who are already enrolled in a surveillance program.19 The MVAMC has a high incidence of patients with cirrhosis who are at risk for HCC, which is why we chose it as our study population.
LI-RADS can be applied to both MRI and CT imaging. Much of the recent literature have looked at LI-RADS in terms of MRI. A group in China looked at 100 pathologically confirmed patients and assigned a LI-RADS score to the MRI at the time of diagnosis and showed that MRI LI-RADS scoring was highly sensitive and specific in the diagnosis of HCC.20 This study did note a numeric difference in the specificity of LI-RADS algorithm depending on how LR3 scores were viewed. If a LR3 score was considered negative rather than positive for HCC, then the specificity increased by almost 20%.20
Another study looked at patients with liver nodules ≤ 20 mm found on ultrasound and obtained MRIs and biopsies on these patients, assigning the MRI a LI-RADs score.17 Darnell and colleagues found that MRI LR4 and LR5 have a high specificity for HCC. However, 29 of the 42 LR3 lesions examined were found to be HCC.17 Furthermore, Choi and colleagues retrospectively looked at patients in a HCC surveillance program who had undergone MRI as part of the program and assigned LI-RADS scores to these MRIs.21 Their study showed that LR5 criteria on gadoxetate disodium-enhanced MRI has excellent positive predictive value (PPV) for diagnosing HCC, and LR4 showed good PPV.21
In our study, we chose to look at LI-RADS in terms of surveillance CT scans 6 to 13 months prior to the diagnosis of HCC to see whether this method would allow us to intervene earlier with more aggressive diagnostics or therapy in those suspected of having HCC. Although Choi and colleagues looked retrospectively at MRI surveillance imaging, most of the prior studies have looked at LI-RADS scoring in imaging at the time of diagnosis.17,20,21 By looking at surveillance CT scans, we sought to determine LI-RADS sensitivity, specificity, and diagnostic accuracy as a screening tool compared with CT evaluations without LI-RADS scoring.
We also chose to look at CT scans since most of the prior studies have looked at the more detailed and often more expensive MRIs. For both radiologists 1 and 2, the sensitivity was > 60% and specificity was > 70% with a diagnostic accuracy of 71.4% in predicting a diagnosis of HCC in future scans. Although there was high false negative of > 30% for both radiologists, we did consider LR3 as negative for HCC. As Darnell and colleagues’ study of MRI LI-RADS shows, LR3 may need to be revised in the future as its ambiguity can lead to false-negatives.17 Our results also showed moderate interreader agreement, which has been seen in previous studies with LI-RADS.18
Some studies have compared MRI with CT imaging in terms of LI-RADs classification of hepatic nodules to find out whether concordance was seen.22,23 Both studies found that there was substantial discordance between MRI and CT with CT often underscoring hepatic nodules.22,23 In Zhang and colleagues, interclass agreement between CT and MRI varied the most in terms of arterial enhancement with CT producing false-negative findings.22 CT also underestimated LI-RADS score by 16.9% for LR3, 37.3% for LR4, and 8.5% for LR5 in this study.22 Furthermore, Corwin and colleagues found a significant upgrade in terms of LI-RADS categorization with MRI for 42.5% of observations.23 In this study, upgraded LI-RADS scores on MRI included 2 upgraded to LR5V (Figure), 15 upgraded to LR5, and 12 upgraded to LR4.23
Our study shows that the LI-RADS algorithm has a good sensitivity, specificity, and diagnostic accuracy as a screening tool, predicting HCC in scans earlier than standard CT evaluation. In our study, the patients with HCC were shown to have higher LI-RADS scores on prediagnostic imaging, while the benign liver nodule patients were shown to have lower LI-RADS scores. This data would suggest that a LI-RADS score given to surveillance CT of LR4 or higher should recommend either a biopsy or follow-up imaging after a short interval. If LI-RADS is applied to surveillance CTs in patients at risk for HCC, a diagnosis of HCC may be arrived at earlier as compared with not using the LI-RADS algorithm. Earlier detection may lead to earlier intervention and improved treatment outcomes.
Limitations
Limitations to our study occurred because radiologist 3 did not review all of the images nor score them. Radiologist 3 was limited to 12 images where there was disagreement and was limited to 2 scores to choose from for each image. Further limitations include that this study was performed at a single center. Our study focused on one imaging modality and did not include ultrasounds or MRIs. We did not compare the demographics of our patients with those of other VA hospitals. The radiologists interpreted the images individually, and their subjectivity was another limitation.
Conclusion
In the MVAMC population, LI-RADS showed a good sensitivity, specificity, and diagnostic accuracy for CT surveillance scans in patient at high risk for HCC at an earlier time point than did standard evaluation by very experienced CT radiologists. Higher LI-RADS scores on surveillance CTs had good diagnostic accuracy for the probable future diagnosis of HCC, whereas lower LI-RADS scores had a good diagnostic accuracy for probable benign nodules. Utilizing the LI-RADS algorithm on all surveillance CTs in patients at high risk for HCC may lead to obtaining MRIs or follow-up CTs sooner for suspicious nodules, leading to an earlier diagnosis of HCC and possible earlier and more effective intervention.
1. El–Serag HB, Rudolph KL. Hepatocellular carcinoma: epidemiology and molecular carcinogenesis. Gastroenterology. 2007;132(7):2557-2576.
2. El-Serag HB. Hepatocellular carcinoma. N Engl J Med. 2011;365(12):1118-1127.
3. Bruix J, Sherman M; American Association for the Study of Liver Diseases. Management of hepatocellular carcinoma: an update. Hepatology. 2011;53(3):1020-1022.
4. Selvapatt N, House H, Brown A. Hepatocellular carcinoma surveillance: are we utilizing it? J Clin Gastroenterol. 2016;50(1):e8-e12.
5. Lee JM, Yoon JH, Joo I, Woo HS. Recent advances in CT and MR imaging for evaluation of hepatocellular carcinoma. Liver Cancer. 2012;1(1):22-40.
6. Chou R, Cuevas C, Fu R, et al. Imaging techniques for the diagnosis of hepatocellular carcinoma: a systemic review and meta-analysis. Ann Intern Med. 2015;162(10):697-711.
7. Ariff B, Lloyd CR, Khan S, et al. Imaging of liver cancer. World J Gastroenterol. 2009;15(11):1289-1300.
8. Yuen MF, Cheng CC, Lauder IJ, Lam SK, Ooi CG, Lai CL. Early detection of hepatocellular carcinoma increases the chance of treatment: Hong Kong experience. Hepatology. 2000;31(2):330-335.
9. Singal AG, Pillai A, Tiro J. Early detection, curative treatment, and survival rates for hepatocellular carcinoma surveillance in patients with cirrhosis: a meta-analysis. PLoS Med. 2014;11(4):e1001624.
10. Nusbaum, JD, Smirniotopoulos J, Wright HC, et al. The effect of hepatocellular carcinoma surveillance in an urban population with liver cirrhosis. J Clin Gastroenterol. 2015;49(10):e91-e95.
11. Kansagara D, Papak J, Pasha AS, et al. Screening for hepatocellular carcinoma in chronic liver disease: a systemic review. Ann Intern Med. 2014;161(4):261-269.
12. Shah S, Shukla A, Paunipagar B. Radiological features of hepatocellular carcinoma. J Clin Exp Hepatol. 2014;4(suppl 3):S63-S66.
13. You MW, Kim SY, Kim KW, et al. Recent advances in the imaging of hepatocellular carcinoma. Clin Mol Hepatol. 2015;21(1):95-103.
14. American College of Radiology. Liver reporting and data system (LI-RADS). https://www.acr.org/Clinical-Resources/Reporting-and-Data-Systems/LI-RADS. Accessed April 10, 2018.
15. Anis M. Imaging of hepatocellular carcinoma: new approaches to diagnosis. Clin Liver Dis. 2015;19(2):325-340.
16. Mitchell D, Bruix J, Sherman M, Sirlin CB. LI-RADS (Liver Imaging Reporting and Data System): summary, discussion, and consensus of the LI-RADS Management Working Group and future directions. Hepatology. 2015;61(3):1056-1065.
17. Darnell A, Forner A, Rimola J, et al. Liver imaging reporting and data system with MR imaging: evaluation in nodules 20 mm or smaller detected in cirrhosis at screening US. Radiology. 2015; 275(3):698-707.
18. Davenport MS, Khalatbari S, Liu PS, et al. Repeatability of diagnostic features and scoring systems for hepatocellular carcinoma by using MR imaging. Radiology. 2014;272(1):132-142.
19. An C, Rakhmonova G, Choi JY, Kim MJ. Liver imaging reporting and data system (LI-RADS) version 2014: understanding and application of the diagnostic algorithm. Clin Mol Hepatol. 2016;22(2):296-307.
20. Zhao W, Li W, Yi X, et al. [Diagnostic value of liver imaging reporting and data system on primary hepatocellular carcinoma] [in Chinese]. Zhong Nan Da Xue Xue Bao Yi Xue Ban. 2016;41(4):380-387.
21. Choi SH, Byun JH, Kim SY, et al. Liver imaging reporting and data system v2014 with gadoxetate disodium-enhanced magnetic resonance imaging: validation of LIRADS category 4 and 5 criteria. Invest Radiol. 2016;51(8):483-490.
22. Zhang YD, Zhu FP, Xu X, et al. Liver imaging reporting and data system: substantial discordance between CT and MR for imaging classification of hepatic nodules. Acad Radiol. 2016;23(3):344-352.
23. Corwin MT, Fananapazir G, Jin M, Lamba R, Bashir MR. Difference in liver imaging and reporting data system categorization between MRI and CT. Am J Roentgenol. 2016;206(2):307-312.
Is osteoporosis screening in postmenopausal women effective?
No single study evaluates the effectiveness of osteoporosis screening. However, screening women over the age of 65 years—or those between 60–64 years with certain risk factors—is recommended based on available evidence.
First, osteoporosis is common, and its prevalence increases with age (strength of recommendation [SOR]: A—prospective cohort studies). Second, low bone mineral density predicts fracture risk (SOR: A—prospective cohort studies). Finally, the likelihood of osteoporotic fracture is reduced with therapy, such as alendronate 10 mg/day or risedronate 5 mg/day plus adequate daily calcium and vitamin D (SOR: A—meta-analysis of randomized clinical trials).
Women under 60 years should not be screened (SOR: B—clinical decision rule). There is no evidence to guide decisions about screening interval or at what age to stop screening. The long-term risks of newer medications used for osteoporosis are unknown.
Evidence summary
Osteoporosis results in significant morbidity and mortality. In a prospective observational study of women over 50 years of age, 39.6% had osteopenia and 7.2% had osteoporosis. Osteoporosis was associated with a fracture rate 4 times that of normal bone mineral density.1 People with vertebral or hip fractures have a reduced relative 5-year survival of 0.81. Excess mortality occurred within the first 6 months following fracture.2
One prospective cohort study identified 14 independent risk factors for hip fracture.3 The best predictors were female gender, age, low weight, and no current estrogen use. For women aged >65 years with no other risks, 12% to 28% have osteoporosis.4 Multiple risk assessment scales have been studied to identify women aged >65 years who are at increased risk; however, none of the scales had good discriminatory performance.5 As a result, it is unclear which factors for women under 65 years should trigger screening.
While multiple technologies exist to measure bone mineral density, dual-energy x-ray absorptiometry (DEXA) has been the most validated test for predicting fractures. A meta-analysis of 11 prospective cohort trials showed that all sites of bone mineral density measurements correlated with fractures (relative risk [RR], 1.5; 95% confi-dence interval [CI], 1.4–1.6.). However, DEXA of the femoral neck predicted hip fracture better than other measures (RR, 2.6; 95% CI, 2.0–3.5).6
Additionally, heel ultrasonography was compa-rable with hip DEXA for predicting hip fractures for women over 65 years (probability of fracture 0.018 vs. 0.023); no studies have compared effec-tiveness for women under 65 years.
Multiple therapeutic interventions for osteo-porosis have been demonstrated to reduce frac-tures. Adequate calcium and vitamin D appear to prevent fractures. Alendronate and rise-dronate are the only prescription medications with evidence showing they prevent hip fractures.
A meta-analysis of 11 randomized controlled trials including 11,808 women found fewer hip fractures in women taking 10 mg/day of alendronate (RR, 0.51; 95% CI, 0.38–0.69; number needed to treat [NNT]=24), and fewer vertebral fractures in women taking 5 mg/day of alendronate (RR, 0.52; 95% CI, 0.43–0.65; NNT=72).7
For these results to apply to screening, study participants must be similar to those identified by general population screening. All trials included healthy women with low bone mineral density who were not using estrogen, which is similar to women identified by general screening. However, 57% of women recruited for the second Fracture Intervention Trial (FIT-II), the largest study, were classified as ineligible. This raises concern about the study’s generalizability.8
The US Preventive Services Task Force did an outcomes estimation of screening effectiveness, combining all of the above data (Table).9 Screening 731 women aged 65 to 69 years would prevent 1 hip fracture if those with indications for treat-ment took it; screening 248 women would prevent 1 vertebral fracture. As the table demonstrates, benefits increase with age. For women under 65 years, benefits are relatively small, unless they have other risk factors for osteoporosis.
TABLE
Hip and vertebral fracture outcomes for osteoporosis screening in 10,000 postmenopausal women 9
| Age (years) | |||
|---|---|---|---|
| Screening outcomes | 55–59 | 65–69 | 75–79 |
| Identified with osteoporosis | 445 | 1200 | 2850 |
| Hip fracture prevented with medication | 2 | 14 | 70 |
| NNS to prevent 1 hip fracture | 4338 | 731 | 143 |
| NNT to prevent 1 hip fracture | 193 | 88 | 41 |
| Vertebral fractures prevented | 7 | 40 | 134 |
| NNS to prevent 1 vertebral fracture | 1338 | 248 | 75 |
| NNT to prevent 1 vertebral fracture | 60 | 30 | 21 |
| The calculations in this table assume that treatment reduces the risk of vertebral fracture by 48%, the risk of hip fracture to 36%, and that 70% of patients will adhere to therapy. Table modified from USPSTF report.9 | |||
| NNS, number needed to screen for benefit; NNT, number needed to treat for benefit | |||
Recommendations from others
Based on their outcomes model, the US Preventive Services Task Force recommends screening for women aged >65 years, and those aged 60 to 65 years who have risk factors.9 In 1998, the National Osteoporosis Foundation, in collaboration with many other professional organ-izations, recommended bone mineral density test-ing for all women aged >65 years and younger postmenopausal women who have had or are at risk for fractures.10 The 2000 Consensus Development Conference from the National Institutes of Health recommended an individual-ized approach to screening, stating evidence for universal osteoporosis screening is inconclusive.11 The American Association of Clinical Endo-crinologists revised guidelines in 2001 to include screening younger postmenopausal women with a body weight <127 lbs or a family history of nontraumatic spine or hip fracture.12
Michael L. Lefevre, MD, MSPH
Department of Family and Community Medicine, University of Missouri–Columbia
The value of screening for osteoporosis is a much bigger issue for clinicians since the pub-lication of the Women’s Health Initiative study and the consequent decline in the number of postmenopausal women using HRT. Evidence for pharmacologic prevention of fractures in women who do not meet conventional criteria for osteoporosis is lacking. Data on fracture risk with osteoporosis are short-term, and the risks and benefits of long-term treatment of women who do have osteoporosis are unknown for all of the treatment options.
The conclusion to focus our screening efforts on women aged 65 years and older, where the near-term benefits seem to clearly outweigh the risks, is certainly clinically prudent. Irrespective of our wishes, many women in their fifties are getting osteoporosis screening at health fairs or shopping malls. Although I do not encourage this age group to be screened, when faced with results showing osteoporosis, I do still treat with a bisphosphonate, based on the trials noted above.
1. Siris ES, Miller PD, Barrett-Connor E, et al. Identification and fracture outcomes of undiagnosed low bone mineral density in postmenopausal women: results from the National Osteoporosis Risk Assessment. JAMA 2001;286:2815-2822.
2. Cooper C, Atkinson EJ, Jacobsen SJ, O’Fallon WM, Melton LJ, 3rd. Population-based study of survival after osteo-porotic fractures. Am J Epidemiol 1993;137:1001-1005.
3. Cummings SR, Nevitt MC, Browner WS, et al. Risk factors for hip fracture in white women. Study of Osteoporotic Fractures Research Group. N Engl J Med 1995;332:767-773.
4. Cadarette SM, Jaglal SB, Kreiger N, McIsaac WJ, Darlington GA, Tu JV. Development and validation of the Osteoporosis Risk Assessment Instrument to facilitate selection of women for bone densitometry. CMAJ 2000;162:1289-1294.
5. Cadarette SM, Jaglal SB, Murray TM, McIsaac WJ, Joseph L, Brown JP. Evaluation of decision rules for referring women for bone densitometry by dual-energy x-ray absorptiometry. JAMA 2001;286:57-63.
6. Marshall D, Johnell O, Wedel H. Meta-analysis of how well measures of bone marrow density predict occurrence of osteoporotic fractures. BMJ 1996;312:1254-1259.
7. Cranney A, Tugwell P, Adachi J, et al. Meta-analyses of therapies for postmenopausal osteoporosis. III. Meta-analysis of risedronate for the treatment of postmenopausal osteoporosis. Endocr Rev 2002;23:517-523.
8. Cummings SR, Black DM, Thompson DE, et al. Effect of alendronate on risk of fracture in women with low bone density but without vertebral fractures: results from the Fracture Intervention Trial. JAMA 1998;280:2077-2082.
9. Nelson HD, Helfand M, Woolf SH, Allan JD. Screening for postmenopausal osteoporosis: a review of the evidence for the U.S. Preventive Services Task Force. Ann Intern Med 2002;137:529-541.
10. Physicians Guide to Prevention and Treatment of Osteoporosis. National Osteoporosis Foundation. Wash-ington, DC: National Osteoporosis Foundation; 1999. Available at: www.nof.org/physguide. Accessed on February 24, 2003.
11. Osteoporosis prevention, diagnosis, and therapy. NIH Consensus Statement. 2000; 17:1–45. Available at: http://odp.od.nih.gov/consensus/cons/111/111_state-ment.htm. Accessed on February 24, 2003.
12. American Association of Clinical Endocrinologists. 2001 Medical Guidelines for Clinical Practice for the Prevention and Management of Postmenopausal Osteoporosis. Available at: www.aace.com/clin/guidelines/osteoporosis2001.pdf. Accessed on February 24, 2003.
No single study evaluates the effectiveness of osteoporosis screening. However, screening women over the age of 65 years—or those between 60–64 years with certain risk factors—is recommended based on available evidence.
First, osteoporosis is common, and its prevalence increases with age (strength of recommendation [SOR]: A—prospective cohort studies). Second, low bone mineral density predicts fracture risk (SOR: A—prospective cohort studies). Finally, the likelihood of osteoporotic fracture is reduced with therapy, such as alendronate 10 mg/day or risedronate 5 mg/day plus adequate daily calcium and vitamin D (SOR: A—meta-analysis of randomized clinical trials).
Women under 60 years should not be screened (SOR: B—clinical decision rule). There is no evidence to guide decisions about screening interval or at what age to stop screening. The long-term risks of newer medications used for osteoporosis are unknown.
Evidence summary
Osteoporosis results in significant morbidity and mortality. In a prospective observational study of women over 50 years of age, 39.6% had osteopenia and 7.2% had osteoporosis. Osteoporosis was associated with a fracture rate 4 times that of normal bone mineral density.1 People with vertebral or hip fractures have a reduced relative 5-year survival of 0.81. Excess mortality occurred within the first 6 months following fracture.2
One prospective cohort study identified 14 independent risk factors for hip fracture.3 The best predictors were female gender, age, low weight, and no current estrogen use. For women aged >65 years with no other risks, 12% to 28% have osteoporosis.4 Multiple risk assessment scales have been studied to identify women aged >65 years who are at increased risk; however, none of the scales had good discriminatory performance.5 As a result, it is unclear which factors for women under 65 years should trigger screening.
While multiple technologies exist to measure bone mineral density, dual-energy x-ray absorptiometry (DEXA) has been the most validated test for predicting fractures. A meta-analysis of 11 prospective cohort trials showed that all sites of bone mineral density measurements correlated with fractures (relative risk [RR], 1.5; 95% confi-dence interval [CI], 1.4–1.6.). However, DEXA of the femoral neck predicted hip fracture better than other measures (RR, 2.6; 95% CI, 2.0–3.5).6
Additionally, heel ultrasonography was compa-rable with hip DEXA for predicting hip fractures for women over 65 years (probability of fracture 0.018 vs. 0.023); no studies have compared effec-tiveness for women under 65 years.
Multiple therapeutic interventions for osteo-porosis have been demonstrated to reduce frac-tures. Adequate calcium and vitamin D appear to prevent fractures. Alendronate and rise-dronate are the only prescription medications with evidence showing they prevent hip fractures.
A meta-analysis of 11 randomized controlled trials including 11,808 women found fewer hip fractures in women taking 10 mg/day of alendronate (RR, 0.51; 95% CI, 0.38–0.69; number needed to treat [NNT]=24), and fewer vertebral fractures in women taking 5 mg/day of alendronate (RR, 0.52; 95% CI, 0.43–0.65; NNT=72).7
For these results to apply to screening, study participants must be similar to those identified by general population screening. All trials included healthy women with low bone mineral density who were not using estrogen, which is similar to women identified by general screening. However, 57% of women recruited for the second Fracture Intervention Trial (FIT-II), the largest study, were classified as ineligible. This raises concern about the study’s generalizability.8
The US Preventive Services Task Force did an outcomes estimation of screening effectiveness, combining all of the above data (Table).9 Screening 731 women aged 65 to 69 years would prevent 1 hip fracture if those with indications for treat-ment took it; screening 248 women would prevent 1 vertebral fracture. As the table demonstrates, benefits increase with age. For women under 65 years, benefits are relatively small, unless they have other risk factors for osteoporosis.
TABLE
Hip and vertebral fracture outcomes for osteoporosis screening in 10,000 postmenopausal women 9
| Age (years) | |||
|---|---|---|---|
| Screening outcomes | 55–59 | 65–69 | 75–79 |
| Identified with osteoporosis | 445 | 1200 | 2850 |
| Hip fracture prevented with medication | 2 | 14 | 70 |
| NNS to prevent 1 hip fracture | 4338 | 731 | 143 |
| NNT to prevent 1 hip fracture | 193 | 88 | 41 |
| Vertebral fractures prevented | 7 | 40 | 134 |
| NNS to prevent 1 vertebral fracture | 1338 | 248 | 75 |
| NNT to prevent 1 vertebral fracture | 60 | 30 | 21 |
| The calculations in this table assume that treatment reduces the risk of vertebral fracture by 48%, the risk of hip fracture to 36%, and that 70% of patients will adhere to therapy. Table modified from USPSTF report.9 | |||
| NNS, number needed to screen for benefit; NNT, number needed to treat for benefit | |||
Recommendations from others
Based on their outcomes model, the US Preventive Services Task Force recommends screening for women aged >65 years, and those aged 60 to 65 years who have risk factors.9 In 1998, the National Osteoporosis Foundation, in collaboration with many other professional organ-izations, recommended bone mineral density test-ing for all women aged >65 years and younger postmenopausal women who have had or are at risk for fractures.10 The 2000 Consensus Development Conference from the National Institutes of Health recommended an individual-ized approach to screening, stating evidence for universal osteoporosis screening is inconclusive.11 The American Association of Clinical Endo-crinologists revised guidelines in 2001 to include screening younger postmenopausal women with a body weight <127 lbs or a family history of nontraumatic spine or hip fracture.12
Michael L. Lefevre, MD, MSPH
Department of Family and Community Medicine, University of Missouri–Columbia
The value of screening for osteoporosis is a much bigger issue for clinicians since the pub-lication of the Women’s Health Initiative study and the consequent decline in the number of postmenopausal women using HRT. Evidence for pharmacologic prevention of fractures in women who do not meet conventional criteria for osteoporosis is lacking. Data on fracture risk with osteoporosis are short-term, and the risks and benefits of long-term treatment of women who do have osteoporosis are unknown for all of the treatment options.
The conclusion to focus our screening efforts on women aged 65 years and older, where the near-term benefits seem to clearly outweigh the risks, is certainly clinically prudent. Irrespective of our wishes, many women in their fifties are getting osteoporosis screening at health fairs or shopping malls. Although I do not encourage this age group to be screened, when faced with results showing osteoporosis, I do still treat with a bisphosphonate, based on the trials noted above.
1. Siris ES, Miller PD, Barrett-Connor E, et al. Identification and fracture outcomes of undiagnosed low bone mineral density in postmenopausal women: results from the National Osteoporosis Risk Assessment. JAMA 2001;286:2815-2822.
2. Cooper C, Atkinson EJ, Jacobsen SJ, O’Fallon WM, Melton LJ, 3rd. Population-based study of survival after osteo-porotic fractures. Am J Epidemiol 1993;137:1001-1005.
3. Cummings SR, Nevitt MC, Browner WS, et al. Risk factors for hip fracture in white women. Study of Osteoporotic Fractures Research Group. N Engl J Med 1995;332:767-773.
4. Cadarette SM, Jaglal SB, Kreiger N, McIsaac WJ, Darlington GA, Tu JV. Development and validation of the Osteoporosis Risk Assessment Instrument to facilitate selection of women for bone densitometry. CMAJ 2000;162:1289-1294.
5. Cadarette SM, Jaglal SB, Murray TM, McIsaac WJ, Joseph L, Brown JP. Evaluation of decision rules for referring women for bone densitometry by dual-energy x-ray absorptiometry. JAMA 2001;286:57-63.
6. Marshall D, Johnell O, Wedel H. Meta-analysis of how well measures of bone marrow density predict occurrence of osteoporotic fractures. BMJ 1996;312:1254-1259.
7. Cranney A, Tugwell P, Adachi J, et al. Meta-analyses of therapies for postmenopausal osteoporosis. III. Meta-analysis of risedronate for the treatment of postmenopausal osteoporosis. Endocr Rev 2002;23:517-523.
8. Cummings SR, Black DM, Thompson DE, et al. Effect of alendronate on risk of fracture in women with low bone density but without vertebral fractures: results from the Fracture Intervention Trial. JAMA 1998;280:2077-2082.
9. Nelson HD, Helfand M, Woolf SH, Allan JD. Screening for postmenopausal osteoporosis: a review of the evidence for the U.S. Preventive Services Task Force. Ann Intern Med 2002;137:529-541.
10. Physicians Guide to Prevention and Treatment of Osteoporosis. National Osteoporosis Foundation. Wash-ington, DC: National Osteoporosis Foundation; 1999. Available at: www.nof.org/physguide. Accessed on February 24, 2003.
11. Osteoporosis prevention, diagnosis, and therapy. NIH Consensus Statement. 2000; 17:1–45. Available at: http://odp.od.nih.gov/consensus/cons/111/111_state-ment.htm. Accessed on February 24, 2003.
12. American Association of Clinical Endocrinologists. 2001 Medical Guidelines for Clinical Practice for the Prevention and Management of Postmenopausal Osteoporosis. Available at: www.aace.com/clin/guidelines/osteoporosis2001.pdf. Accessed on February 24, 2003.
Evidence-based answers from the Family Physicians Inquiries Network
Does magnesium therapy early in acute MI reduce mortality?
Short-term mortality is not reduced with early administration of intravenous magnesium in high-risk patients having an acute myocardial infarction (MI). There is no reason to give intravenous magnesium unless patients have other indications for repletion, such as a low magnesium level or arrhythmia responsive to magnesium therapy.
Short-term mortality is not reduced with early administration of intravenous magnesium in high-risk patients having an acute myocardial infarction (MI). There is no reason to give intravenous magnesium unless patients have other indications for repletion, such as a low magnesium level or arrhythmia responsive to magnesium therapy.
Short-term mortality is not reduced with early administration of intravenous magnesium in high-risk patients having an acute myocardial infarction (MI). There is no reason to give intravenous magnesium unless patients have other indications for repletion, such as a low magnesium level or arrhythmia responsive to magnesium therapy.
β-blockers no better than placebo in the treatment of vasovagal syncope
ABSTRACT
BACKGROUND: About half of syncopal episodes are vasovagal reactions. Empiric treatment with β-blockers is a common practice based on physiologic mechanisms of vasovagal syncope. Only 3 prospective, randomized controlled trials have been done to compare a β-blocker (atenolol) with placebo; no study showed reduced syncopal episodes. No studies have been published on β-blockers other than atenolol.
POPULATION STUDIED: The authors enrolled 30 consecutive patients with recurrent vasovagal syncope. The mean age of the subjects was 41 years; 17 (57%) were women. Investigators defined recurrent vasovagal syncope as at least 2 episodes in the past 3 months and a positive tilt test response. Patients had normal cardiovascular examinations and no electrocardiographic changes. Patients were excluded who had known or suspected autonomic failure (including diabetes), hypertension, chronic obstructive pulmonary disease, or peripheral vascular disease. Patients were recruited from an outpatient cardiology setting, potentially representing a different population than encountered in many primary care settings.
STUDY DESIGN AND VALIDITY: This study was an unblinded, crossover placebo-controlled trial. Patients were assigned to receive 3 drugs in random order for 3 months each. Study drugs were the maximum tolerated dose of propranolol (Inderal) 20 to 40 mg 3 times daily, nadolol (Corgard) 40 to 80 mg once daily, and placebo 1 capsule once daily. Investigators were not blinded but patients were. However, patients took propranolol 3 times daily compared with once daily for placebo and nadolol. To minimize the effect of dosing frequency, investigators advised patients that frequency had no relationship with efficacy. Concealed allocation was not performed. All 30 patients completed the study, although 1 patient withdrew from propranolol therapy due to fatigue. Results were analyzed by intention to treat.
OUTCOMES MEASURED: The primary outcome measured was the number of syncopal and presyncopal events during each study drug’s 3-month period. Additionally, patients’ assessed their quality of life and reported which therapies they preferred. Quality of life was scored from 0 to 4 based on vasovagal symptoms, drug side effects, and personal well being during therapy (0 = very dissatisfied and 4 = excellent).
RESULTS: Overall, no difference was noted in the number of syncopal episodes or quality of life scores during the 3 study periods. Propranolol, nadolol, and placebo equally improved outcomes as compared with baseline (0.25, 0.25, and 0.5 episodes during 3 months respectively vs 3.4 episodes per 3 months; P < .0001). Similar benefits were seen for presyncopal episodes (2.1, 1.3, and 2.6 episodes during 3 months, respectively vs 9.1 episodes per 3 months; P < .0001). Patients’ quality of life scores improved with propranolol, nadolol, and placebo as compared with baseline (3.1, 3.5, and 3.4 on a scale of 4, respectively vs 1.5; P < .0001). At the conclusion of the study, 4 patients preferred nadolol, 2 preferred placebo, and 3 preferred propranolol. Five patients were dissatisfied with propranolol due to fatigue. The remaining 70% of patients were satisfied with all 3 regimens.
Most patients with vasovagal syncope had a profound response to β-blocker therapy with a marked decrease in episodes during a 3-month period. However, the patients had a similar response when treated with placebo. Because we do not use placebos frequently in practice and no other therapies have proven benefit above the placebo response, dosing with a β-blocker, if well tolerated, is an option for treating this type of syncope.