User login
The Need for Standardized Metrics to Drive Decision-making During the COVID-19 Pandemic
The rapid onset of the novel coronavirus disease 2019 (COVID-19) pandemic forced the US healthcare system to scramble to prepare for a health crisis with many unknowns. Early on, it was unclear exactly how the virus was transmitted, how many people would fall ill or how ill they would get, what treatments would be most efficacious, and what resources were needed to care for patients.1 Given the short window the healthcare system had to prepare, many initial and important decisions were made quickly and often at a local level, with limited coordination and standardization across localities and organizations. These decisions included what services could be offered, how best to allocate potentially scarce resources (such as personal protective equipment and ventilators), and how much surge capacity to build.2,3 In short, many of the early decisions about the pandemic were understandably varied, and the lack of standardized metrics to help guide decision-making did not help the situation.
CHALLENGES WITH MANAGING THE PANDEMIC WITHOUT STANDARDIZED METRICS
Unfortunately, as the COVID-19 pandemic continues, there has been insufficient movement toward standardizing definitions for many key measures needed to manage the public health response. Even small differences in definitions can have important implications for decision-making.4 For example, public health officials have recommended communities achieve a positivity rate of 5% or lower for 14 straight days before easing virus-related restrictions.5 In Maryland, two different entities are calculating positivity rates for the state using different methodologies and producing different results, which can have significant public health and economic implications for the state. Johns Hopkins University’s Resource Center calculates the positivity rate by comparing the number of people who tested positive for severe acute respiratory syndrome coronavirus 2 (SARS-CoV-2) to all people who were tested. This method consistently produces a positivity rate for Maryland above the 5% threshold. In contrast, the state of Maryland calculates the positivity rate by comparing the number of positive tests for SARS-CoV-2 to the number of tests conducted, even if the same person had multiple tests (unless the tests are performed the same day at the same location). This method consistently produces a positivity rate for Maryland below the 5% threshold.6
THE POLITICIZATION OF THE DATA
The lack of standardized definitions leads not only to debate and confusion over what steps to take next, but also opens the door to politicization of pandemic data. This is readily apparent when considering mortality due to COVID-19. For example, different states use different definitions for COVID-19 mortality. Alabama defines COVID-19 mortality by only including patients who tested positive for the SARS-CoV-2 virus and the cause of death was attributed to COVID-19. In contrast, Colorado’s COVID-19 mortality definition includes those patients who are believed to have died of COVID-19, but does not require confirmation of SARS-CoV-2 infection by a positive test.7 Further compounding the challenge, some politicians reference the COVID-19 mortality rate as a comparison of those who died from COVID-19 with those who were sick with COVID-19, reflecting the success rate of treating patients with COVID-19, an area in which the United States has done relatively well compared with other countries. This definition of the mortality rate suits a narrative of successful pandemic management.8 However, many public health officials suggest the COVID-19 mortality rate should be defined by comparing the number of deaths from COVID-19 as a percentage of the population, which reflects the percentage of the population dying from the disease. In this regard, the United States has not done as well relative to other countries.9 These different definitions highlight how the United States lacks a standardized way to compare its performance across states and with other countries, even on a straightforward measure like mortality.
CURRENT METRICS THAT NEED STANDARDIZATION
The lack of clarity on, and politicization of, pandemic data demonstrate the need to take stock of what metrics require standardization to help public health officials and health system leaders manage the pandemic response moving forward. The Table provides examples of currently used metrics that would benefit from better standardization to inform decision-making across a broad range of settings, including public health, hospitals, physician clinics, and nursing homes. For example, a commonly referenced metric during the pandemic has been a moving average of the incidence rate of positive COVID-19 cases in a defined geographic area (eg, a state).10,11 This data point is helpful to healthcare delivery organizations for understanding the change in COVID-19 cases in their cities and states, which can inform planning on whether or not to continue elective surgeries or how many beds need to be kept in reserve status for a potential surge of hospitalizations. But there has not been a consensus around whether the reporting of COVID-19 positive tests should reflect the day the test was performed or the day the test results were available. The day the test results were available can be influenced by lengthy or uneven turnaround times for the results (eg, backlogs in labs) and can paint a false picture of trends with the virus.
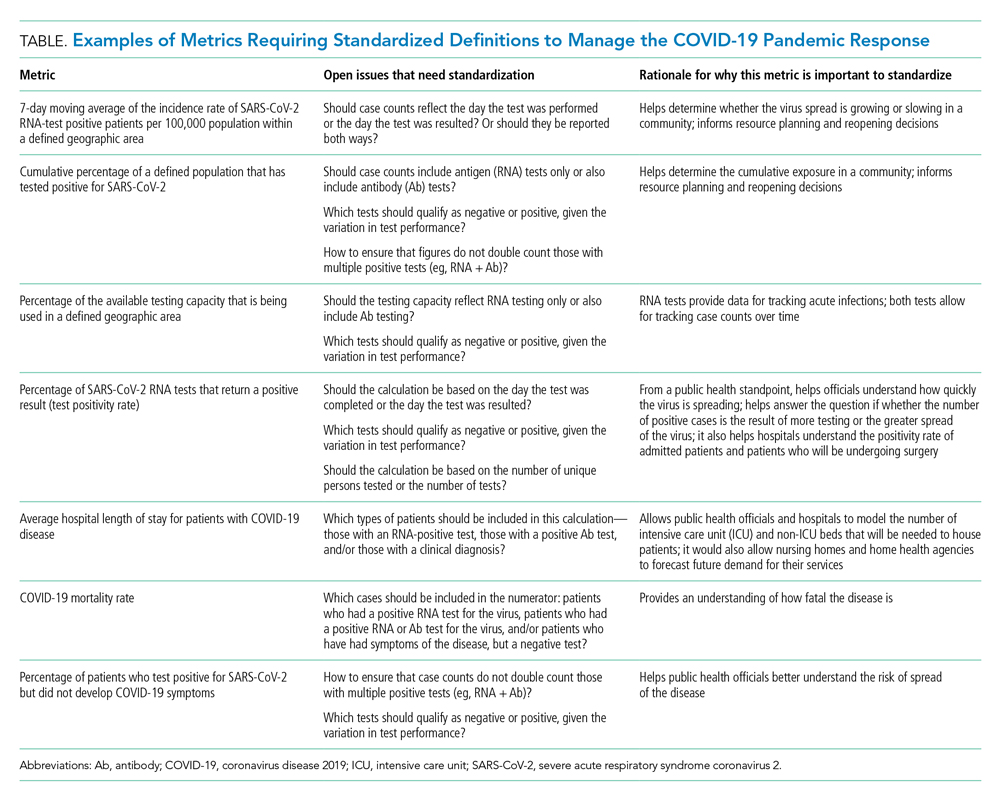
As another example, knowing the percentage of the population that has tested positive for COVID-19 can help inform both resource planning and reopening decisions. But there has been variation in whether counts of positive COVID-19 tests should only include antigen tests, or antibody tests as well. This exact question played out when the Centers for Disease Control and Prevention (CDC) made decisions that differed from those of many states about whether to include antibody tests in their publicly announced COVID-19 testing numbers,12 perhaps undermining public confidence in the reported data.
MOVING FORWARD WITH STANDARDIZING DEFINITIONS
To capture currently unstandardized metrics with broad applicability, the United States should form a consensus task force to identify and define metrics and, over time, refine them based on current science and public health priorities. The task force would require a mix of individuals with various skill sets, such as expertise in infectious diseases and epidemiology, healthcare operations, statistics, performance measurement, and public health. The US Department of Health and Human Services is likely the appropriate sponsor, with representation from the National Institutes of Health, the CDC, and the Agency for Healthcare Research and Quality, in partnership with national provider and public health group representatives.
Once standardized definitions for metrics have been agreed upon, the metric definitions will need to be made readily available to the public and healthcare organizations. Standardization will permit collection of electronic health records for quick calculation and review, with an output of dashboards for reporting. It would also prevent every public health and healthcare delivery organization from having to define its own metrics, freeing them up to focus on planning. Several metrics already have standard definitions, and those metrics have proven useful for decision-making. For example, there is agreement that the turnaround time for a SARS-CoV-2 test is measured by the difference in time between when the test was performed and when the test results were available. This standard definition allows for performance comparisons across different laboratories within the same service area and comparisons across different regions of the country. Once the metrics are standardized, public health leaders and healthcare organizations can use variation in performance and outcomes to identify leading indicators for planning.
CONCLUSION
Amid the COVID-19 pandemic, the US healthcare system finds itself in a state of managing uncertainty for a prolonged period of time. The unprecedented nature of this crisis means that best practices will not always be clear. Providing access to clearly defined, standardized metrics will be essential to public health officials and healthcare organization leaders’ ability to manage through this pandemic. The risk of not moving in this direction means forcing leaders to make decisions without the best information available. Good data will be essential to guiding the US healthcare system through this extraordinary crisis.
- Weston S, Frieman MB. COVID-19: knowns, unknowns, and questions. mSphere. 2020;5(2):e00203-20. https://doi.org/10.1128/mSphere.00203-20
- Griffin KM, Karas MG, Ivascu NS, Lief L. Hospital preparedness for COVID-19: a practical guide from a critical care perspective. Am J Respir Crit Care Med. 2020;201(11):1337-1344. https://doi.org/10.1164/rccm.202004-1037CP
- De Georgeo MR, De Georgeo JM, Egan TM, et al. Containing SARS-CoV-2 in hospitals facing finite PPE, limited testing, and physical space variability: navigating resource constrained enhanced traffic control bundling. J Microbiol Immunol. 2020;S1684-1182(20)30166-3. https://doi.org/10.1016/j.jmii.2020.07.009
- Fischhoff B. Making decisions in a COVID-19 world. JAMA. 2020;324(2):139-140. https://doi.org/10.1001/jama.2020.10178
- Collins K. Is your state doing enough coronavirus testing? New York Times. October 14, 2020. Updated October 29, 2020. Accessed October 14, 2020. https://www.nytimes.com/interactive/2020/us/coronavirus-testing.html
- Ruiz N. Why is Maryland’s coronavirus positivity rate always lower than what Johns Hopkins says it is — and does it matter? Baltimore Sun. September 10, 2020. Accessed October 14, 2020. https://www.baltimoresun.com/coronavirus/bs-md-maryland-coronavirus-positivity-rate-hopkins-20200817-zoepxdjlxbazdm6kabrjehbemq-story.html
- Brown E, Reinhard B, Thebault R. Which deaths count toward the covid-19 death toll? It depends on the state. Washington Post. April 16, 2020. Accessed July 23, 2020. https://www.washingtonpost.com/investigations/which-deaths-count-toward-the-covid-19-death-toll-it-depends-on-the-state/2020/04/16/bca84ae0-7991-11ea-a130-df573469f094_story.html
- Carlisle M. Here’s what Trump got wrong about America’s COVID-19 death rate. Time. August 4, 2020. Accessed October 14, 2020. https://time.com/5875411/trump-covid-19-death-rate-interview/
- Mortality analyses. Johns Hopkins University & Medicine Coronavirus Resource Center. October 14, 2020. Updated October 29, 2020. Accessed October 14, 2020. https://coronavirus.jhu.edu/data/mortality
- COVID-19 daily case incidence rate maps. Kentucky Cabinet for Health and Family Services. Accessed October 14, 2020. https://chfs.ky.gov/Pages/cv19maps.aspx
- COVID-19 trajectory animations. Pennsylvania Department of Health. Accessed October 14, 2020. https://www.health.pa.gov/topics/disease/coronavirus/Pages/Data-Animations.aspx
- Stolberg SG, Kaplan S, Mervosh S. CDC test counting error leaves epidemiologists ‘really baffled.’ New York Times. May 22, 2020. Updated June 3, 2020. Accessed July 23, 2020. https://www.nytimes.com/2020/05/22/us/politics/coronavirus-tests-cdc.html
The rapid onset of the novel coronavirus disease 2019 (COVID-19) pandemic forced the US healthcare system to scramble to prepare for a health crisis with many unknowns. Early on, it was unclear exactly how the virus was transmitted, how many people would fall ill or how ill they would get, what treatments would be most efficacious, and what resources were needed to care for patients.1 Given the short window the healthcare system had to prepare, many initial and important decisions were made quickly and often at a local level, with limited coordination and standardization across localities and organizations. These decisions included what services could be offered, how best to allocate potentially scarce resources (such as personal protective equipment and ventilators), and how much surge capacity to build.2,3 In short, many of the early decisions about the pandemic were understandably varied, and the lack of standardized metrics to help guide decision-making did not help the situation.
CHALLENGES WITH MANAGING THE PANDEMIC WITHOUT STANDARDIZED METRICS
Unfortunately, as the COVID-19 pandemic continues, there has been insufficient movement toward standardizing definitions for many key measures needed to manage the public health response. Even small differences in definitions can have important implications for decision-making.4 For example, public health officials have recommended communities achieve a positivity rate of 5% or lower for 14 straight days before easing virus-related restrictions.5 In Maryland, two different entities are calculating positivity rates for the state using different methodologies and producing different results, which can have significant public health and economic implications for the state. Johns Hopkins University’s Resource Center calculates the positivity rate by comparing the number of people who tested positive for severe acute respiratory syndrome coronavirus 2 (SARS-CoV-2) to all people who were tested. This method consistently produces a positivity rate for Maryland above the 5% threshold. In contrast, the state of Maryland calculates the positivity rate by comparing the number of positive tests for SARS-CoV-2 to the number of tests conducted, even if the same person had multiple tests (unless the tests are performed the same day at the same location). This method consistently produces a positivity rate for Maryland below the 5% threshold.6
THE POLITICIZATION OF THE DATA
The lack of standardized definitions leads not only to debate and confusion over what steps to take next, but also opens the door to politicization of pandemic data. This is readily apparent when considering mortality due to COVID-19. For example, different states use different definitions for COVID-19 mortality. Alabama defines COVID-19 mortality by only including patients who tested positive for the SARS-CoV-2 virus and the cause of death was attributed to COVID-19. In contrast, Colorado’s COVID-19 mortality definition includes those patients who are believed to have died of COVID-19, but does not require confirmation of SARS-CoV-2 infection by a positive test.7 Further compounding the challenge, some politicians reference the COVID-19 mortality rate as a comparison of those who died from COVID-19 with those who were sick with COVID-19, reflecting the success rate of treating patients with COVID-19, an area in which the United States has done relatively well compared with other countries. This definition of the mortality rate suits a narrative of successful pandemic management.8 However, many public health officials suggest the COVID-19 mortality rate should be defined by comparing the number of deaths from COVID-19 as a percentage of the population, which reflects the percentage of the population dying from the disease. In this regard, the United States has not done as well relative to other countries.9 These different definitions highlight how the United States lacks a standardized way to compare its performance across states and with other countries, even on a straightforward measure like mortality.
CURRENT METRICS THAT NEED STANDARDIZATION
The lack of clarity on, and politicization of, pandemic data demonstrate the need to take stock of what metrics require standardization to help public health officials and health system leaders manage the pandemic response moving forward. The Table provides examples of currently used metrics that would benefit from better standardization to inform decision-making across a broad range of settings, including public health, hospitals, physician clinics, and nursing homes. For example, a commonly referenced metric during the pandemic has been a moving average of the incidence rate of positive COVID-19 cases in a defined geographic area (eg, a state).10,11 This data point is helpful to healthcare delivery organizations for understanding the change in COVID-19 cases in their cities and states, which can inform planning on whether or not to continue elective surgeries or how many beds need to be kept in reserve status for a potential surge of hospitalizations. But there has not been a consensus around whether the reporting of COVID-19 positive tests should reflect the day the test was performed or the day the test results were available. The day the test results were available can be influenced by lengthy or uneven turnaround times for the results (eg, backlogs in labs) and can paint a false picture of trends with the virus.
As another example, knowing the percentage of the population that has tested positive for COVID-19 can help inform both resource planning and reopening decisions. But there has been variation in whether counts of positive COVID-19 tests should only include antigen tests, or antibody tests as well. This exact question played out when the Centers for Disease Control and Prevention (CDC) made decisions that differed from those of many states about whether to include antibody tests in their publicly announced COVID-19 testing numbers,12 perhaps undermining public confidence in the reported data.
MOVING FORWARD WITH STANDARDIZING DEFINITIONS
To capture currently unstandardized metrics with broad applicability, the United States should form a consensus task force to identify and define metrics and, over time, refine them based on current science and public health priorities. The task force would require a mix of individuals with various skill sets, such as expertise in infectious diseases and epidemiology, healthcare operations, statistics, performance measurement, and public health. The US Department of Health and Human Services is likely the appropriate sponsor, with representation from the National Institutes of Health, the CDC, and the Agency for Healthcare Research and Quality, in partnership with national provider and public health group representatives.
Once standardized definitions for metrics have been agreed upon, the metric definitions will need to be made readily available to the public and healthcare organizations. Standardization will permit collection of electronic health records for quick calculation and review, with an output of dashboards for reporting. It would also prevent every public health and healthcare delivery organization from having to define its own metrics, freeing them up to focus on planning. Several metrics already have standard definitions, and those metrics have proven useful for decision-making. For example, there is agreement that the turnaround time for a SARS-CoV-2 test is measured by the difference in time between when the test was performed and when the test results were available. This standard definition allows for performance comparisons across different laboratories within the same service area and comparisons across different regions of the country. Once the metrics are standardized, public health leaders and healthcare organizations can use variation in performance and outcomes to identify leading indicators for planning.
CONCLUSION
Amid the COVID-19 pandemic, the US healthcare system finds itself in a state of managing uncertainty for a prolonged period of time. The unprecedented nature of this crisis means that best practices will not always be clear. Providing access to clearly defined, standardized metrics will be essential to public health officials and healthcare organization leaders’ ability to manage through this pandemic. The risk of not moving in this direction means forcing leaders to make decisions without the best information available. Good data will be essential to guiding the US healthcare system through this extraordinary crisis.
- Weston S, Frieman MB. COVID-19: knowns, unknowns, and questions. mSphere. 2020;5(2):e00203-20. https://doi.org/10.1128/mSphere.00203-20
- Griffin KM, Karas MG, Ivascu NS, Lief L. Hospital preparedness for COVID-19: a practical guide from a critical care perspective. Am J Respir Crit Care Med. 2020;201(11):1337-1344. https://doi.org/10.1164/rccm.202004-1037CP
- De Georgeo MR, De Georgeo JM, Egan TM, et al. Containing SARS-CoV-2 in hospitals facing finite PPE, limited testing, and physical space variability: navigating resource constrained enhanced traffic control bundling. J Microbiol Immunol. 2020;S1684-1182(20)30166-3. https://doi.org/10.1016/j.jmii.2020.07.009
- Fischhoff B. Making decisions in a COVID-19 world. JAMA. 2020;324(2):139-140. https://doi.org/10.1001/jama.2020.10178
- Collins K. Is your state doing enough coronavirus testing? New York Times. October 14, 2020. Updated October 29, 2020. Accessed October 14, 2020. https://www.nytimes.com/interactive/2020/us/coronavirus-testing.html
- Ruiz N. Why is Maryland’s coronavirus positivity rate always lower than what Johns Hopkins says it is — and does it matter? Baltimore Sun. September 10, 2020. Accessed October 14, 2020. https://www.baltimoresun.com/coronavirus/bs-md-maryland-coronavirus-positivity-rate-hopkins-20200817-zoepxdjlxbazdm6kabrjehbemq-story.html
- Brown E, Reinhard B, Thebault R. Which deaths count toward the covid-19 death toll? It depends on the state. Washington Post. April 16, 2020. Accessed July 23, 2020. https://www.washingtonpost.com/investigations/which-deaths-count-toward-the-covid-19-death-toll-it-depends-on-the-state/2020/04/16/bca84ae0-7991-11ea-a130-df573469f094_story.html
- Carlisle M. Here’s what Trump got wrong about America’s COVID-19 death rate. Time. August 4, 2020. Accessed October 14, 2020. https://time.com/5875411/trump-covid-19-death-rate-interview/
- Mortality analyses. Johns Hopkins University & Medicine Coronavirus Resource Center. October 14, 2020. Updated October 29, 2020. Accessed October 14, 2020. https://coronavirus.jhu.edu/data/mortality
- COVID-19 daily case incidence rate maps. Kentucky Cabinet for Health and Family Services. Accessed October 14, 2020. https://chfs.ky.gov/Pages/cv19maps.aspx
- COVID-19 trajectory animations. Pennsylvania Department of Health. Accessed October 14, 2020. https://www.health.pa.gov/topics/disease/coronavirus/Pages/Data-Animations.aspx
- Stolberg SG, Kaplan S, Mervosh S. CDC test counting error leaves epidemiologists ‘really baffled.’ New York Times. May 22, 2020. Updated June 3, 2020. Accessed July 23, 2020. https://www.nytimes.com/2020/05/22/us/politics/coronavirus-tests-cdc.html
© 2021 Society of Hospital Medicine
Email: jmaustin@jhmi.edu; Telephone: 832-816-5618; Twitter: @JMatthewAustin.