User login
Improving Stroke Alert Response Time
In‐hospital strokes account for a significant proportion of the almost 800,000 cerebrovascular accidents that occur each year in the United States.1 Although inpatient strokes are thought to be under‐recognized and under‐reported, between 4% and 17% of all stroke patients in the hospital experienced stroke onset during hospitalization.2, 3 Estimates place the number of in‐hospital strokes at 35,000‐75,000 each year in the United States.4
As a result of the exquisite sensitivity of brain tissue to ischemic events, stroke is a medical emergency and time‐to‐treatment is of the essence. With each minute of ischemia, 1.9 million neurons are destroyed.5 Evidence suggests benefit of treatment with intravenous thrombolysis up to 4.5 hours after symptom onset, with lower disability associated with more rapid initiation of therapy.6, 7 To facilitate timely thrombolytic therapy, the American Stroke Association (ASA) recommends that imaging of the brain be initiated within 25 minutes of presentation for patients with suspected stroke.8
Studies demonstrate greater delays in the evaluation of hospitalized patients suffering from stroke compared to stroke patients presenting to the Emergency Department (ED).9, 10 Performance of timely evaluation of in‐hospital stroke rarely meets ASA goals. Analysis of a Michigan stroke registry found that only 3.1% of patients with in‐hospital strokes received computed tomography (CT) scan within 25 minutes of symptom recognition, and a Colorado stroke registry found time‐to‐evaluation to be more than twice the recommended benchmark.11, 12 Data from a multicenter stroke registry in Spain showed that half of all thrombolysis‐eligible, in‐hospital stroke patients could not be treated due to delays in evaluation.13
Our prior work demonstrated that the use of an in‐hospital stroke response team significantly reduced time to evaluation for true ischemic strokes.10 Even with this rapid response mechanism, the evaluation time for in‐hospital stroke was still more than twice that observed in the ED despite using the same team to respond to both settings. Hospital rapid response systems, specifically for patients with suspected stroke, have been described in the literature and outline in‐hospital response systems capable of meeting evaluation time goals.1415 How to optimize a stroke response system has not been previously described. The aim of this quality improvement (QI) initiative was to reduce time‐to‐evaluation for strokes occurring in patients already hospitalized using systems analysis and modification. We describe key elements and tools for implementing institutional QI for in‐hospital stroke.
METHODS
The QI initiative was implemented at the University of Colorado Hospital (UCH), a tertiary care academic medical center. The Colorado Multiple Institutional Review Board determined this project to be in the exempt category. UCH uses a protocol in which all stroke alerts undergo non‐contrast CT of the brain. If no intracranial bleeding is found, and the patient is a thrombolytic candidate, advanced CT imaging including CT perfusion and CT angiogram will also be performed during the alert. Magnetic resonance imaging (MRI) with diffusion weighted imaging is done non‐emergently for subsequent stroke evaluation, but is not part of the stroke alert protocol. The primary endpoint of time from alert to initiation of CT was chosen because it represents an unambiguous interval which is present for all stroke alerts. Pre‐intervention data was gathered for 6 months, from September 2008 to February 2009. During this period, the process through which in‐hospital strokes were identified, referred for evaluation, and treated was mapped to identify inefficient or unreliable steps, and the process was redesigned to enhance efficiency. The intervention was rolled out over a 3‐month period from March 2009 to May 2009. During the intervention roll‐out period, the refined stroke alert process and a checklist containing the optimal in‐hospital stroke alert response system was implemented. An education campaign was initiated, for acute stroke team members and nursing staff, on signs of stroke and each individual's role in response to symptoms of in‐hospital stroke based on the new process. During the roll‐out period, each unit in the hospital was provided in‐hospital stroke alert posters and a packet containing specific stroke education on the in‐hospital stroke alert process. Unit educators were empowered to determine how to best deliver the education to their staff, and many chose to invite the stroke program coordinator to give an hour‐long presentation on stroke prior to shift or during lunch. Each unit educator kept record of the stroke instruction provided and submitted staff signatures to the stroke program. Nursing staff was also provided with in‐hospital stroke protocol badge cards that outlined optimal approach to stroke identification and treatment using the revised protocol. Interventions were being implemented in a progressive fashion throughout the roll‐out period. Starting during the roll‐out and continuing into the post‐intervention period, feedback on all in‐hospital stroke alerts was provided to the stroke team and front‐line providers. The impact of the intervention was followed for 6 months post‐intervention from June 2009 to November 2009. The QI tools used in this project are well described by the Institute of Healthcare Improvement, and each step in the QI process is outlined in detail below:16
Step 1: Process Map With Identification of Unreliable and Reliably Slow Steps
A detailed process map was created to outline steps in the existing stroke alert process (see Supporting Figures, Process Maps, in the online version of this article). One investigator (R.Z.) interviewed key members of the multidisciplinary stroke team, including representatives from the departments of neurology, nursing, hospital medicine, neurosurgery, radiology, and transportation. Interviews with key stakeholders and frequent participants in stroke alerts revealed evidence of episodic unreliable steps. Stakeholders were noted to have slightly different conceptions of how the process flow was intended to occur, and where responsibility lay for certain tasks. The interviews aided in identification of pitfalls, bottlenecks, misconceptions, and areas that needed clarification or change in the alert process.
Examples of unreliable and bottleneck steps include: In the pre‐intervention process, the transportation department was responsible for moving patients to radiology; this step was identified as reliably slow. Investigation revealed that the transportation department did not have a mechanism for rapid response to emergency transport requests. Analysis also revealed that 2 key steps necessary for treating in‐hospital stroke were occasionally neglected: ensuring adequate intravenous (IV) access, and ordering of the correct panel of laboratory tests. Finally, a process communication deficit was identified, with CT technicians periodically unaware of the pending arrival of an in‐hospital stroke patient, thus preventing the scan from being cleared for the emergent stroke imaging.
Direct observation of real‐time stroke alerts in both the inpatient and ED settings was also employed to outline the process and identify areas of inefficiency. Direct observation of stroke alerts in progress verified the unified picture of process flow developed from stakeholder interviews (see Supporting Figures, Process Maps, in the online version of this article). Particular note was made of differences between the stroke alert process in the ED and the inpatient setting.
Step 2: System Redesign With Input From All Stakeholders
Proposed interventions were presented to hospital governing councils, including the interdisciplinary Stroke Council and Nurse Managers Council. After verification of the shortcomings of the existing alert process and obtaining buy‐in from key participants and governing departments, a new process was designed (see Supporting Figures, Process Maps, in the online version of this article). Specific changes include the following examples: First, electrocardiogram was moved to occur after CT scan. Second, investigation revealed that the transportation department within the hospital was designed for non‐emergent transportation and not amenable to change. The mechanism of patient transportation was changed such that, rather than using the transportation department, patients were now transported by the neurology resident responding to the stroke alert, accompanied by the patient's ward nurse. This both removed a bottleneck step and assured critical staff presence during the transportation of a potentially unstable patient. Third, to ensure effective communication, CT technicians were provided with stroke alert pagers that receive text messages regarding incoming in‐hospital stroke alert patients. Fourth, a time limit was set for IV attempts prior to transportation. The new protocol, along with explicit expectations for the role of the patient's nurse in in‐hospital stroke alerts, was described in a hospital‐wide nursing stroke education initiative.
Step 3: In‐Hospital Stroke Alert Checklist
A new standardized protocol for optimal in‐hospital stroke care was detailed on a laminated pocket card. The checklist described exactly what steps were to be performed, by whom, how to make them occur, and in what order. The checklist was designed to reduce the incidence of omitted steps, such as ordering of correct laboratory evaluations. The laminated cards highlighted the benchmark time to evaluation of 25 minutes. Process checklist cards were distributed to all members of the acute stroke alert response team, and short versions designed specifically for nursing staff were distributed as badge cards and posted on clinical care units (Supporting Information Appendix I).
Step 4: Real‐Time Feedback
During the intervention roll‐out and post‐intervention periods, feedback was provided from the stroke program to the front‐line providers following each in‐hospital stroke alert. The clinicians involved were notified of the final diagnosis and patient outcome, and were provided with feedback about how the patient's evaluation times compared with benchmark goals. Feedback may serve to motivate, based on clinician professionalism, but performance in the alert was not tied to rewards or penalties for the providers involved. The feedback process was designed to be bi‐directional, with requests for input from staff on barriers to rapid evaluation experienced and suggestions for future process improvement (Supporting Information Appendix II).
Statistical Analysis
The primary outcome was the change in time from stroke alert to CT scan (alert‐to‐CT), comparing pre‐intervention and post‐intervention periods. This time interval was chosen because its calculation involved unambiguous time points, which are available for all patients for whom an in‐hospital alert is called. It is a measure of process efficiency, with minimal expected variation based on differences in patient characteristics (ie, hemorrhagic vs ischemic stroke). Non‐overlapping Kaplan‐Meier curves confirmed the proportional hazards assumption for 2 Cox proportional hazards models: unadjusted and adjusted by group characteristics with P‐value <0.10. Relative hazards and estimates for the percent of patients with alert‐to‐CT scan 25 minutes, according to intervention groups, were obtained from these models. For analyses, admit unit was re‐categorized as intensive care unit (ICU), Med/Surg, or Other. Analyses were conducted using SAS Version 9.2 (SAS Institute, Inc, Cary, NC).
RESULTS
During the study intervals, there were 82 inpatient stroke alerts. Of these alerts, 75 were included in the analysis. Seven were excluded for the following reasons: alert canceled by the stroke team (3), time of alert was not recorded (1), patient identifiers not recorded (1), or stroke alert was preceded by CT imaging (2).
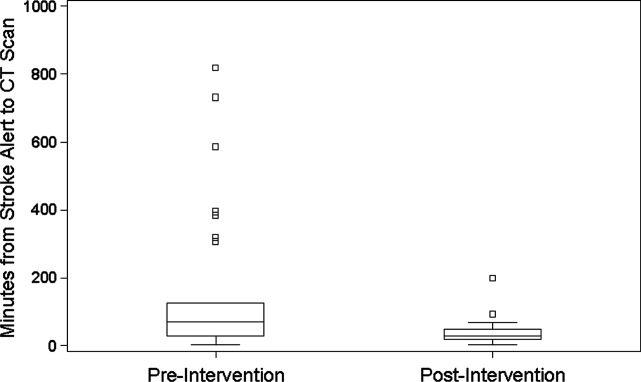
During the 6 months prior to intervention, the median inpatient stroke alert‐to‐CT time (n = 31) was 69.0 minutes (Table 1). Nineteen percent of these alerts met the goal of 25 minutes from alert‐to‐CT time. During the 6‐month post‐intervention period, the median inpatient alert‐to‐CT time (n = 44) was 29.5 minutes. Thirty‐two percent of these alerts met the 25‐minute alert‐to‐CT time benchmark. In the unadjusted model, patients during the post‐intervention period were significantly more likely to have alert‐to‐CT scan time 25 minutes compared to patients prior to the intervention (post‐intervention compared to pre‐intervention, Relative Hazard (RH): 3.03; 95% confidence interval [CI]: 1.76‐5.20; log‐rank P < 0.0001). This remained significant after adjustment for hyperlipidemia, active cancer, final diagnosis of ischemic brain injury, and final diagnosis of stroke mimic (RH: 4.96; 95% CI: 2.65‐9.32; P < 0.0001); data not shown. Admit unit was not included in the adjusted model since there was no indication of differences in the 3‐level variable according to intervention group (P = 0.27). In addition to reduction in median response times, the variability of response times was markedly reduced, and no patient in the 6‐month post‐intervention period had delay to CT sufficient to preclude use of IV thrombolysis (Figure 1).
| Pre‐Intervention (n = 31) | Post‐Intervention (n = 44) | P Value | |
|---|---|---|---|
| |||
| Stroke alert to CT time, median [95% CI] | 69 min [34, 103] | 29.5 min [26, 40] | P < 0.0001 |
| Age, median [IQR] | 61.0 [54.0, 70.0] | 60.5 [48.5, 70.5] | 0.94 |
| Female (%) | 19 (61.3) | 23 (52.3) | 0.44 |
| Race (%) | |||
| Asian | 1 (3.2) | 1 (2.3) | 0.31 |
| Black | 4 (12.9) | 6 (13.6) | |
| Caucasian | 21 (67.7) | 27 (61.4) | |
| Hispanic | 3 (9.7) | 10 (22.7) | |
| Unknown | 2 (6.5) | 0 (0) | |
| Admit unit (%) | |||
| Intensive care | 12 (38.7) | 10 (22.7) | 0.07 |
| Medicine/surgery | 15 (48.4) | 24 (54.6) | |
| Neurology | 0 (0) | 5 (11.4) | |
| Post‐acute care | 3 (9.7) | 0 (0) | |
| Rehabilitation | 1 (3.2) | 2 (4.6) | |
| Women's and maternal care | 0 (0) | 2 (4.6) | |
| Cardiology | 0 (0) | 1 (2.3) | |
| Case mix index, median [IQR] | n = 29 2.6 [1.1, 5.0] | n = 42 2.2 [1.6, 4.5] | 0.82 |
| Prior cerebrovascular accident (%) | 5 (16.1) | 8 (18.2) | 0.82 |
| Hypertension (%) | 17 (54.8) | 24 (54.6) | 0.98 |
| Diabetes mellitus (%) | 7 (22.6) | 11 (25.0) | 0.81 |
| Hyperlipidemia (%) | 15 (48.4) | 9 (20.5) | 0.01 |
| Tobacco abuse, current (%) | 4 (12.9) | 1 (2.3) | 0.15 |
| Alcohol abuse (%) | 2 (6.5) | 0 (0) | 0.17 |
| Active cancer (%) | 8 (25.8) | 5 (11.4) | 0.10 |
| Peripheral vascular disease (%) | 2 (6.5) | 3 (6.8) | 1.0 |
| Coronary artery disease (%) | 6 (19.4) | 7 (15.9) | 0.70 |
| Congestive heart failure (%) | n = 30 5 (16.7) | 4 (9.1) | 0.47 |
| Valvulopathy (%) | 0 (0) | 1 (2.3) | 1.0 |
| Atrial fibrillation (%) | 3 (9.7) | 10 (22.7) | 0.14 |
| Anticoagulation (%) | 7 (22.6) | 7 (15.9) | 0.47 |
| Final diagnosis ischemic brain injury (%) | 15 (48.4) | 11 (25.0) | 0.04 |
| Final diagnosis hemorrhagic brain injury (%) | 3 (9.7) | 4 (9.1) | 1.0 |
| Final diagnosis stroke mimic (symptoms not due to ischemic or hemorrhagic brain injury) (%) | 13 (41.9) | 29 (65.9) | 0.04 |

CONCLUSIONS
In‐hospital strokes represent an emergency for which response time is critical. Neurologic injury progresses with every minute of ischemia, and current recommendations offer a limited time window for intravenous thrombolysis. For stroke with symptom onset in the monitored setting of the hospital, there is a compelling imperative to reduce all delays from system inefficiencies. The findings of the current QI initiative suggest that dramatic improvements are possible through systematic evaluation and redesign of hospital response processes, a checklist for in‐hospital stroke carried by front‐line responders, and ongoing real‐time feedback.
Limitations of this study include a prepost design. The necessity of implementing system change hospital‐wide precluded use of a concurrent control group. The time goals for evaluation are derived from American Stroke Association targets for patients arriving in the Emergency Department. There are differences in process between the hospital ward and the Emergency Department, but the fundamental concept of minimizing time to evaluation once patient symptoms are recognized by hospital staff remains valid.
The possibility of system improvements not due to this QI initiative cannot be excluded. In 2006, this hospital expanded the responsibility of the stroke response team to include acute neurologic deficits outside of the ED without other changes to the in‐hospital stroke alert process. This reduced time to evaluation for in‐hospital ischemic strokes compared to usual care, but even with the same acute stroke response team responding to stroke alerts in both settings, in‐hospital stroke response times remained significantly longer than response times for stroke in the ED.10 The presence of an in‐hospital stroke alert response team alone was not capable of reducing evaluation times to goal. Minimal improvement in median in‐hospital stroke alert evaluation time was seen in the intervening year, following the completion of our previously published analysis, suggesting explicit system QI was necessary.
The Hawthorne effect, in which individuals who know they are being observed modify behavior while such monitoring is in effect, is a major limitation of interpreting QI initiatives. By committing to continuous and ongoing feedback to front‐line providers, this phenomenon can be harnessed to sustain improvement.17 In effect, the study of efficient response to the in‐hospital stroke never ceases. UCH has continued to employ the post‐intervention stroke alert protocol and engage in ongoing feedback after each stroke alert. In the 12 months following the conclusion of this study, the median response time to in‐hospital strokes continues to be 30 minutes, and 7 additional in‐hospital stroke patients have been treated with thrombolysis.
This inpatient stroke alert initiative decreased median inpatient alert‐to‐CT time by 57%, and demonstrates that quality of in‐hospital stroke care can be improved. Decrease in stroke alert‐to‐CT time facilitates earlier thrombolytic therapy. Analysis of treatment and patient outcomes was outside of the scope of the current study, but earlier treatment has potential to significantly improve clinical outcomes.
The Society of Hospital Medicine defines one of the goals of QI to be the change in processes with reduction in variation, thus improving the care for all patients rather than focusing exclusively on outlier events.18 This initiative markedly reduced evaluation variability, allowing a greater percentage of patients to be eligible for treatment within the critical time window. Prior to the intervention, almost a quarter of patients had delays in evaluation sufficient to preclude IV thrombolysis, whereas in the 6 months after the intervention was initiated, not a single patient had evaluation delayed to the point that IV thrombolysis would not have been an option (Figure 1). The goal of in‐hospital stroke QI must be to improve the speed of the process for all patients, and assure that no patient is denied the potential for therapy as a result of inefficiencies in hospital systems.
Acknowledgements
The authors thank Traci Yamashita, PRA, for her work in the statistical analysis for this publication, and Dr Jeffrey Glasheen for development of the University of Colorado Hospital's Hospitalist Training Track Quality Improvement Program of which this work is a product.
- ,,, et al.Heart disease and stroke statistics—2010 update: a report from the American Heart Association.Circulation.2010;121:e46–e215.
- ,,.Characteristics of in‐hospital onset ischemic stroke.Eur Neurol.2006;55:155–159.
- ,.Inpatient and community ischemic strokes in a community hospital.Neuroepidemiology.2007;28:86–92.
- .In‐hospital stroke.Lancet Neurol.2003;2:741–746.
- .Time is brain‐quantified.Stroke.2006;37:263–266.
- ,,, et al.Ultra‐early thrombolysis in acute ischemic stroke is associated with better outcomes and lower mortality.Stroke.2010;41:712–716.
- ,,,.Expansion of the time window for treatment of acute ischemic stroke with intravenous tissue plasminogen activator: a science advisory from the American Heart Association/American Stroke Association.Stroke.2009;40:2945–2948.
- ,,, et al.Guidelines for early management of adults with ischemic stroke.Stroke.2007;38;1655–1711.
- ,,, et al.In‐hospital stroke treated with intravenous tissue plasminogen activator.Stroke.2008;39:2614–2616.
- ,,,,.Stroke alert program improves recognition and evaluation time of in‐hospital ischemic stroke.J Stroke Cerebrovasc Dis.2009;19:494–496.
- ,,,,,.In‐hospital stroke in a statewide stroke registry.Cerebrovasc Dis.2008;25:12–20.
- ,,,,.Quality of care for in‐hospital stroke: analysis of a statewide registry.Stroke.2011;42:207–210.
- ,,, et al.In‐hospital stroke: a multi‐center prospective registry.Eur J Neurol.2011;18:170–176.
- ,,.Code Gray—an organized approach to inpatient stroke.Crit Care Nurs Q.2003;26:296–302.
- ,,.ID, stat‐rapid response to in‐hospital stroke patients.Nurs Manage.2009;40:34–38.
- Institute of Healthcare Improvement. Quality Improvement Tools. Available at: http://www.ihi.org/IHI/Topics/Improvement/ImprovementMethods/Tools/. Accessed December 1,2010.
- ,,,,,.Variability in the Hawthorne effect with regard to hand hygiene performance in high‐ and low‐performing inpatient care units.Infect Control Hosp Epidemiol.2009;30:222–225.
- Society of Hospital Medicine Quality Improvement Resources. Available at: http://www.hospitalmedicine.org/ResourceRoomRedesign/html/32. Accessed December 1,2010.
In‐hospital strokes account for a significant proportion of the almost 800,000 cerebrovascular accidents that occur each year in the United States.1 Although inpatient strokes are thought to be under‐recognized and under‐reported, between 4% and 17% of all stroke patients in the hospital experienced stroke onset during hospitalization.2, 3 Estimates place the number of in‐hospital strokes at 35,000‐75,000 each year in the United States.4
As a result of the exquisite sensitivity of brain tissue to ischemic events, stroke is a medical emergency and time‐to‐treatment is of the essence. With each minute of ischemia, 1.9 million neurons are destroyed.5 Evidence suggests benefit of treatment with intravenous thrombolysis up to 4.5 hours after symptom onset, with lower disability associated with more rapid initiation of therapy.6, 7 To facilitate timely thrombolytic therapy, the American Stroke Association (ASA) recommends that imaging of the brain be initiated within 25 minutes of presentation for patients with suspected stroke.8
Studies demonstrate greater delays in the evaluation of hospitalized patients suffering from stroke compared to stroke patients presenting to the Emergency Department (ED).9, 10 Performance of timely evaluation of in‐hospital stroke rarely meets ASA goals. Analysis of a Michigan stroke registry found that only 3.1% of patients with in‐hospital strokes received computed tomography (CT) scan within 25 minutes of symptom recognition, and a Colorado stroke registry found time‐to‐evaluation to be more than twice the recommended benchmark.11, 12 Data from a multicenter stroke registry in Spain showed that half of all thrombolysis‐eligible, in‐hospital stroke patients could not be treated due to delays in evaluation.13
Our prior work demonstrated that the use of an in‐hospital stroke response team significantly reduced time to evaluation for true ischemic strokes.10 Even with this rapid response mechanism, the evaluation time for in‐hospital stroke was still more than twice that observed in the ED despite using the same team to respond to both settings. Hospital rapid response systems, specifically for patients with suspected stroke, have been described in the literature and outline in‐hospital response systems capable of meeting evaluation time goals.1415 How to optimize a stroke response system has not been previously described. The aim of this quality improvement (QI) initiative was to reduce time‐to‐evaluation for strokes occurring in patients already hospitalized using systems analysis and modification. We describe key elements and tools for implementing institutional QI for in‐hospital stroke.
METHODS
The QI initiative was implemented at the University of Colorado Hospital (UCH), a tertiary care academic medical center. The Colorado Multiple Institutional Review Board determined this project to be in the exempt category. UCH uses a protocol in which all stroke alerts undergo non‐contrast CT of the brain. If no intracranial bleeding is found, and the patient is a thrombolytic candidate, advanced CT imaging including CT perfusion and CT angiogram will also be performed during the alert. Magnetic resonance imaging (MRI) with diffusion weighted imaging is done non‐emergently for subsequent stroke evaluation, but is not part of the stroke alert protocol. The primary endpoint of time from alert to initiation of CT was chosen because it represents an unambiguous interval which is present for all stroke alerts. Pre‐intervention data was gathered for 6 months, from September 2008 to February 2009. During this period, the process through which in‐hospital strokes were identified, referred for evaluation, and treated was mapped to identify inefficient or unreliable steps, and the process was redesigned to enhance efficiency. The intervention was rolled out over a 3‐month period from March 2009 to May 2009. During the intervention roll‐out period, the refined stroke alert process and a checklist containing the optimal in‐hospital stroke alert response system was implemented. An education campaign was initiated, for acute stroke team members and nursing staff, on signs of stroke and each individual's role in response to symptoms of in‐hospital stroke based on the new process. During the roll‐out period, each unit in the hospital was provided in‐hospital stroke alert posters and a packet containing specific stroke education on the in‐hospital stroke alert process. Unit educators were empowered to determine how to best deliver the education to their staff, and many chose to invite the stroke program coordinator to give an hour‐long presentation on stroke prior to shift or during lunch. Each unit educator kept record of the stroke instruction provided and submitted staff signatures to the stroke program. Nursing staff was also provided with in‐hospital stroke protocol badge cards that outlined optimal approach to stroke identification and treatment using the revised protocol. Interventions were being implemented in a progressive fashion throughout the roll‐out period. Starting during the roll‐out and continuing into the post‐intervention period, feedback on all in‐hospital stroke alerts was provided to the stroke team and front‐line providers. The impact of the intervention was followed for 6 months post‐intervention from June 2009 to November 2009. The QI tools used in this project are well described by the Institute of Healthcare Improvement, and each step in the QI process is outlined in detail below:16
Step 1: Process Map With Identification of Unreliable and Reliably Slow Steps
A detailed process map was created to outline steps in the existing stroke alert process (see Supporting Figures, Process Maps, in the online version of this article). One investigator (R.Z.) interviewed key members of the multidisciplinary stroke team, including representatives from the departments of neurology, nursing, hospital medicine, neurosurgery, radiology, and transportation. Interviews with key stakeholders and frequent participants in stroke alerts revealed evidence of episodic unreliable steps. Stakeholders were noted to have slightly different conceptions of how the process flow was intended to occur, and where responsibility lay for certain tasks. The interviews aided in identification of pitfalls, bottlenecks, misconceptions, and areas that needed clarification or change in the alert process.
Examples of unreliable and bottleneck steps include: In the pre‐intervention process, the transportation department was responsible for moving patients to radiology; this step was identified as reliably slow. Investigation revealed that the transportation department did not have a mechanism for rapid response to emergency transport requests. Analysis also revealed that 2 key steps necessary for treating in‐hospital stroke were occasionally neglected: ensuring adequate intravenous (IV) access, and ordering of the correct panel of laboratory tests. Finally, a process communication deficit was identified, with CT technicians periodically unaware of the pending arrival of an in‐hospital stroke patient, thus preventing the scan from being cleared for the emergent stroke imaging.
Direct observation of real‐time stroke alerts in both the inpatient and ED settings was also employed to outline the process and identify areas of inefficiency. Direct observation of stroke alerts in progress verified the unified picture of process flow developed from stakeholder interviews (see Supporting Figures, Process Maps, in the online version of this article). Particular note was made of differences between the stroke alert process in the ED and the inpatient setting.
Step 2: System Redesign With Input From All Stakeholders
Proposed interventions were presented to hospital governing councils, including the interdisciplinary Stroke Council and Nurse Managers Council. After verification of the shortcomings of the existing alert process and obtaining buy‐in from key participants and governing departments, a new process was designed (see Supporting Figures, Process Maps, in the online version of this article). Specific changes include the following examples: First, electrocardiogram was moved to occur after CT scan. Second, investigation revealed that the transportation department within the hospital was designed for non‐emergent transportation and not amenable to change. The mechanism of patient transportation was changed such that, rather than using the transportation department, patients were now transported by the neurology resident responding to the stroke alert, accompanied by the patient's ward nurse. This both removed a bottleneck step and assured critical staff presence during the transportation of a potentially unstable patient. Third, to ensure effective communication, CT technicians were provided with stroke alert pagers that receive text messages regarding incoming in‐hospital stroke alert patients. Fourth, a time limit was set for IV attempts prior to transportation. The new protocol, along with explicit expectations for the role of the patient's nurse in in‐hospital stroke alerts, was described in a hospital‐wide nursing stroke education initiative.
Step 3: In‐Hospital Stroke Alert Checklist
A new standardized protocol for optimal in‐hospital stroke care was detailed on a laminated pocket card. The checklist described exactly what steps were to be performed, by whom, how to make them occur, and in what order. The checklist was designed to reduce the incidence of omitted steps, such as ordering of correct laboratory evaluations. The laminated cards highlighted the benchmark time to evaluation of 25 minutes. Process checklist cards were distributed to all members of the acute stroke alert response team, and short versions designed specifically for nursing staff were distributed as badge cards and posted on clinical care units (Supporting Information Appendix I).
Step 4: Real‐Time Feedback
During the intervention roll‐out and post‐intervention periods, feedback was provided from the stroke program to the front‐line providers following each in‐hospital stroke alert. The clinicians involved were notified of the final diagnosis and patient outcome, and were provided with feedback about how the patient's evaluation times compared with benchmark goals. Feedback may serve to motivate, based on clinician professionalism, but performance in the alert was not tied to rewards or penalties for the providers involved. The feedback process was designed to be bi‐directional, with requests for input from staff on barriers to rapid evaluation experienced and suggestions for future process improvement (Supporting Information Appendix II).
Statistical Analysis
The primary outcome was the change in time from stroke alert to CT scan (alert‐to‐CT), comparing pre‐intervention and post‐intervention periods. This time interval was chosen because its calculation involved unambiguous time points, which are available for all patients for whom an in‐hospital alert is called. It is a measure of process efficiency, with minimal expected variation based on differences in patient characteristics (ie, hemorrhagic vs ischemic stroke). Non‐overlapping Kaplan‐Meier curves confirmed the proportional hazards assumption for 2 Cox proportional hazards models: unadjusted and adjusted by group characteristics with P‐value <0.10. Relative hazards and estimates for the percent of patients with alert‐to‐CT scan 25 minutes, according to intervention groups, were obtained from these models. For analyses, admit unit was re‐categorized as intensive care unit (ICU), Med/Surg, or Other. Analyses were conducted using SAS Version 9.2 (SAS Institute, Inc, Cary, NC).
RESULTS
During the study intervals, there were 82 inpatient stroke alerts. Of these alerts, 75 were included in the analysis. Seven were excluded for the following reasons: alert canceled by the stroke team (3), time of alert was not recorded (1), patient identifiers not recorded (1), or stroke alert was preceded by CT imaging (2).
During the 6 months prior to intervention, the median inpatient stroke alert‐to‐CT time (n = 31) was 69.0 minutes (Table 1). Nineteen percent of these alerts met the goal of 25 minutes from alert‐to‐CT time. During the 6‐month post‐intervention period, the median inpatient alert‐to‐CT time (n = 44) was 29.5 minutes. Thirty‐two percent of these alerts met the 25‐minute alert‐to‐CT time benchmark. In the unadjusted model, patients during the post‐intervention period were significantly more likely to have alert‐to‐CT scan time 25 minutes compared to patients prior to the intervention (post‐intervention compared to pre‐intervention, Relative Hazard (RH): 3.03; 95% confidence interval [CI]: 1.76‐5.20; log‐rank P < 0.0001). This remained significant after adjustment for hyperlipidemia, active cancer, final diagnosis of ischemic brain injury, and final diagnosis of stroke mimic (RH: 4.96; 95% CI: 2.65‐9.32; P < 0.0001); data not shown. Admit unit was not included in the adjusted model since there was no indication of differences in the 3‐level variable according to intervention group (P = 0.27). In addition to reduction in median response times, the variability of response times was markedly reduced, and no patient in the 6‐month post‐intervention period had delay to CT sufficient to preclude use of IV thrombolysis (Figure 1).
| Pre‐Intervention (n = 31) | Post‐Intervention (n = 44) | P Value | |
|---|---|---|---|
| |||
| Stroke alert to CT time, median [95% CI] | 69 min [34, 103] | 29.5 min [26, 40] | P < 0.0001 |
| Age, median [IQR] | 61.0 [54.0, 70.0] | 60.5 [48.5, 70.5] | 0.94 |
| Female (%) | 19 (61.3) | 23 (52.3) | 0.44 |
| Race (%) | |||
| Asian | 1 (3.2) | 1 (2.3) | 0.31 |
| Black | 4 (12.9) | 6 (13.6) | |
| Caucasian | 21 (67.7) | 27 (61.4) | |
| Hispanic | 3 (9.7) | 10 (22.7) | |
| Unknown | 2 (6.5) | 0 (0) | |
| Admit unit (%) | |||
| Intensive care | 12 (38.7) | 10 (22.7) | 0.07 |
| Medicine/surgery | 15 (48.4) | 24 (54.6) | |
| Neurology | 0 (0) | 5 (11.4) | |
| Post‐acute care | 3 (9.7) | 0 (0) | |
| Rehabilitation | 1 (3.2) | 2 (4.6) | |
| Women's and maternal care | 0 (0) | 2 (4.6) | |
| Cardiology | 0 (0) | 1 (2.3) | |
| Case mix index, median [IQR] | n = 29 2.6 [1.1, 5.0] | n = 42 2.2 [1.6, 4.5] | 0.82 |
| Prior cerebrovascular accident (%) | 5 (16.1) | 8 (18.2) | 0.82 |
| Hypertension (%) | 17 (54.8) | 24 (54.6) | 0.98 |
| Diabetes mellitus (%) | 7 (22.6) | 11 (25.0) | 0.81 |
| Hyperlipidemia (%) | 15 (48.4) | 9 (20.5) | 0.01 |
| Tobacco abuse, current (%) | 4 (12.9) | 1 (2.3) | 0.15 |
| Alcohol abuse (%) | 2 (6.5) | 0 (0) | 0.17 |
| Active cancer (%) | 8 (25.8) | 5 (11.4) | 0.10 |
| Peripheral vascular disease (%) | 2 (6.5) | 3 (6.8) | 1.0 |
| Coronary artery disease (%) | 6 (19.4) | 7 (15.9) | 0.70 |
| Congestive heart failure (%) | n = 30 5 (16.7) | 4 (9.1) | 0.47 |
| Valvulopathy (%) | 0 (0) | 1 (2.3) | 1.0 |
| Atrial fibrillation (%) | 3 (9.7) | 10 (22.7) | 0.14 |
| Anticoagulation (%) | 7 (22.6) | 7 (15.9) | 0.47 |
| Final diagnosis ischemic brain injury (%) | 15 (48.4) | 11 (25.0) | 0.04 |
| Final diagnosis hemorrhagic brain injury (%) | 3 (9.7) | 4 (9.1) | 1.0 |
| Final diagnosis stroke mimic (symptoms not due to ischemic or hemorrhagic brain injury) (%) | 13 (41.9) | 29 (65.9) | 0.04 |
CONCLUSIONS
In‐hospital strokes represent an emergency for which response time is critical. Neurologic injury progresses with every minute of ischemia, and current recommendations offer a limited time window for intravenous thrombolysis. For stroke with symptom onset in the monitored setting of the hospital, there is a compelling imperative to reduce all delays from system inefficiencies. The findings of the current QI initiative suggest that dramatic improvements are possible through systematic evaluation and redesign of hospital response processes, a checklist for in‐hospital stroke carried by front‐line responders, and ongoing real‐time feedback.
Limitations of this study include a prepost design. The necessity of implementing system change hospital‐wide precluded use of a concurrent control group. The time goals for evaluation are derived from American Stroke Association targets for patients arriving in the Emergency Department. There are differences in process between the hospital ward and the Emergency Department, but the fundamental concept of minimizing time to evaluation once patient symptoms are recognized by hospital staff remains valid.
The possibility of system improvements not due to this QI initiative cannot be excluded. In 2006, this hospital expanded the responsibility of the stroke response team to include acute neurologic deficits outside of the ED without other changes to the in‐hospital stroke alert process. This reduced time to evaluation for in‐hospital ischemic strokes compared to usual care, but even with the same acute stroke response team responding to stroke alerts in both settings, in‐hospital stroke response times remained significantly longer than response times for stroke in the ED.10 The presence of an in‐hospital stroke alert response team alone was not capable of reducing evaluation times to goal. Minimal improvement in median in‐hospital stroke alert evaluation time was seen in the intervening year, following the completion of our previously published analysis, suggesting explicit system QI was necessary.
The Hawthorne effect, in which individuals who know they are being observed modify behavior while such monitoring is in effect, is a major limitation of interpreting QI initiatives. By committing to continuous and ongoing feedback to front‐line providers, this phenomenon can be harnessed to sustain improvement.17 In effect, the study of efficient response to the in‐hospital stroke never ceases. UCH has continued to employ the post‐intervention stroke alert protocol and engage in ongoing feedback after each stroke alert. In the 12 months following the conclusion of this study, the median response time to in‐hospital strokes continues to be 30 minutes, and 7 additional in‐hospital stroke patients have been treated with thrombolysis.
This inpatient stroke alert initiative decreased median inpatient alert‐to‐CT time by 57%, and demonstrates that quality of in‐hospital stroke care can be improved. Decrease in stroke alert‐to‐CT time facilitates earlier thrombolytic therapy. Analysis of treatment and patient outcomes was outside of the scope of the current study, but earlier treatment has potential to significantly improve clinical outcomes.
The Society of Hospital Medicine defines one of the goals of QI to be the change in processes with reduction in variation, thus improving the care for all patients rather than focusing exclusively on outlier events.18 This initiative markedly reduced evaluation variability, allowing a greater percentage of patients to be eligible for treatment within the critical time window. Prior to the intervention, almost a quarter of patients had delays in evaluation sufficient to preclude IV thrombolysis, whereas in the 6 months after the intervention was initiated, not a single patient had evaluation delayed to the point that IV thrombolysis would not have been an option (Figure 1). The goal of in‐hospital stroke QI must be to improve the speed of the process for all patients, and assure that no patient is denied the potential for therapy as a result of inefficiencies in hospital systems.
Acknowledgements
The authors thank Traci Yamashita, PRA, for her work in the statistical analysis for this publication, and Dr Jeffrey Glasheen for development of the University of Colorado Hospital's Hospitalist Training Track Quality Improvement Program of which this work is a product.
- ,,, et al.Heart disease and stroke statistics—2010 update: a report from the American Heart Association.Circulation.2010;121:e46–e215.
- ,,.Characteristics of in‐hospital onset ischemic stroke.Eur Neurol.2006;55:155–159.
- ,.Inpatient and community ischemic strokes in a community hospital.Neuroepidemiology.2007;28:86–92.
- .In‐hospital stroke.Lancet Neurol.2003;2:741–746.
- .Time is brain‐quantified.Stroke.2006;37:263–266.
- ,,, et al.Ultra‐early thrombolysis in acute ischemic stroke is associated with better outcomes and lower mortality.Stroke.2010;41:712–716.
- ,,,.Expansion of the time window for treatment of acute ischemic stroke with intravenous tissue plasminogen activator: a science advisory from the American Heart Association/American Stroke Association.Stroke.2009;40:2945–2948.
- ,,, et al.Guidelines for early management of adults with ischemic stroke.Stroke.2007;38;1655–1711.
- ,,, et al.In‐hospital stroke treated with intravenous tissue plasminogen activator.Stroke.2008;39:2614–2616.
- ,,,,.Stroke alert program improves recognition and evaluation time of in‐hospital ischemic stroke.J Stroke Cerebrovasc Dis.2009;19:494–496.
- ,,,,,.In‐hospital stroke in a statewide stroke registry.Cerebrovasc Dis.2008;25:12–20.
- ,,,,.Quality of care for in‐hospital stroke: analysis of a statewide registry.Stroke.2011;42:207–210.
- ,,, et al.In‐hospital stroke: a multi‐center prospective registry.Eur J Neurol.2011;18:170–176.
- ,,.Code Gray—an organized approach to inpatient stroke.Crit Care Nurs Q.2003;26:296–302.
- ,,.ID, stat‐rapid response to in‐hospital stroke patients.Nurs Manage.2009;40:34–38.
- Institute of Healthcare Improvement. Quality Improvement Tools. Available at: http://www.ihi.org/IHI/Topics/Improvement/ImprovementMethods/Tools/. Accessed December 1,2010.
- ,,,,,.Variability in the Hawthorne effect with regard to hand hygiene performance in high‐ and low‐performing inpatient care units.Infect Control Hosp Epidemiol.2009;30:222–225.
- Society of Hospital Medicine Quality Improvement Resources. Available at: http://www.hospitalmedicine.org/ResourceRoomRedesign/html/32. Accessed December 1,2010.