User login
Improving Sleep in Hospitalized Patients
In recent years, the philosophy of major hospitals has become more patient‐centered with increased focus on outcomes, safety, and patient satisfaction. To this end, many hospitals are looking for innovative ways not only to optimize quality of care, but also to improve patient satisfaction.
Sleep is a domain in which the goals of improving patient outcomes and satisfaction can be mutually achieved. Poor sleep has become a prevalent problem, and a single night of complete sleep loss can result in the undesirable consequences of daytime sleepiness, lethargy, irritability, confusion, and poor short‐term memory.1, 2 Literature has also suggested that chronic partial sleep loss can have significant consequences for safety, mood stability, neurological and medical functioning, and quality of life.38 The importance of acknowledging the relationship between sleep and a patient's level of functioning is magnified in the context of hospitalized patients, particularly those undergoing neurological inpatient care. Changes in level of alertness due to sleep loss can have serious implications for these patients, as they can lead to unnecessary testing and decreased participation with rehabilitative services.
Among the potential causes of sleep deprivation in hospitalized patients are poor pain control, lights, activities of others, and increased noise levels. The effect that increased noise has on patients has been evaluated in a variety of hospital settings, most notably in pediatric and adult intensive care units and nursing homes.9, 10 Noise has been shown to increase blood pressure, heart rate, respiratory rate, and body temperature. It has also been associated with failure to thrive, impaired immune function, delayed wound healing, and increased stress levels.11
The majority of literature regarding sleep disturbance in the hospital has focused on sleep disruption in the intensive care unit, where interventions associated with sleep loss are required to deliver the appropriate standard level of care.1218 However, few evidence‐based strategies to promote sleep quality in hospitalized patients have been evaluated.16, 1823 In this study, we aimed to examine sleep among neurological and neurosurgical inpatients, identify specific sleep‐disruptive factors, and assess patient satisfaction regarding their sleep. We implemented a sleep‐promoting protocol with the hypothesis that improvement of modifiable sleep‐disruptive factors would improve sleep and patient satisfaction.
METHODS
Study Design
This prospective, observational study was designed and implemented by an interdisciplinary team of physicians, neuroscience nurses, and hospital administrators.
Patient Selection
The study was performed on a Neurology and Neurosurgery unit, with both private and semi‐private rooms, at a large, urban, tertiary teaching hospital from February 2009 through June 2010. During enrollment periods, all patients on the unit were screened daily for eligibility. Eligible patients were medically stable and capable of giving verbal consent. Patients who were less than 16 years of age, encephalopathic, aphasic, or non‐English speaking were excluded. Eligible patients were asked for consent to participate in the study. After consultation with the hospital's institutional review board (IRB) committee, written consent was waived in this observational, quality improvement study.
Study Timeline
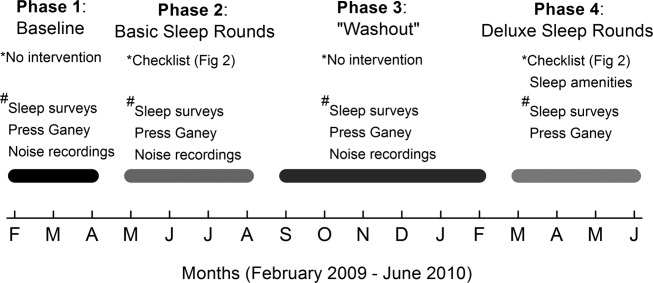
The study comprised 4 phases (Figure 1). In Phase 1, we collected baseline data on patients in the unit. Data were collected in the form of sleep surveys, Press Ganey surveys, and noise meter recordings. The baseline phase (Phase 1) lasted 10 weeks from February to April 2009. We then implemented a novel sleep‐promoting intervention called Basic Sleep Rounds (Phase 2, May to August 2009). After discontinuing Basic Sleep Rounds, data were collected for the washout phase (Phase 3, September 2009 to February 2010). An enhanced version of the sleep‐promoting intervention called Deluxe Sleep Rounds was then instituted (Phase 4, March to June 2010). In Phases 2 and 4, sleep rounds were implemented for 2 weeks before data collection to ensure uniform application of Sleep Rounds.

Sleep Promoting Interventions
Prior to implementing Basic Sleep Rounds in Phase 2, a nursing in‐service was performed where staff were educated about sleep in the hospital and about the planned interventions, and posters promoting sleep were hung on the unit. Basic Sleep Rounds were performed during Phase 2 by the patient's bedside nurse or the unit charge nurse. This occurred for all patients on the unit at approximately 23:00 nightly using the Basic Sleep Rounds checklist, which formalized simple hospital functions, such as lights out, television off, room temperature adjustment, and a final restroom usage (Figure 2). For Phase 4, a team of undergraduate volunteers was organized to assist with the delivery of Sleep Rounds. In this phase (Deluxe Sleep Rounds), nurses performed Basic Sleep Rounds by completing the checklist, and undergraduate volunteers offered patients any of the following sleep amenities: warm blanket, warm milk, white‐noise machine, hypoallergenic lotion, or room spritzer.24, 25
Additionally, during the Basic and Deluxe intervention phases, noise‐sensitive traffic lights (Talk Light Too;
Data Collection
A survey was designed to evaluate sleep quality, estimate sleep quantity, identify sleep disruptors, and assess patient satisfaction (see Supporting Figure 1 in the online version of this article). The survey was given to all eligible participants on the morning after their second night in the unit. This time point was chosen to account for potentially confounding first night effects, and to ensure that enrolled patients spent a full night in the unit.
To better evaluate one of the sleep disruptors, a subset of the survey participants had noise meters placed in their rooms. Every morning, a member of the team would visit all eligible patients to ask if they were willing to participate in this portion of the study. Data recorded between 8:00 PM and 8:00 AM on the second night of each participant's stay were later used for analysis. Noise was recorded in decibels using a Vernier Sound Level Meter, attached to a LabQuest data collection device (
Scores from Press Ganey surveys were also analyzed. These surveys were mailed to patients shortly after hospital discharge, and subsequently processed by Press Ganey Associates, Inc (
Data Analysis
Most datasets were not described by a normal distribution, thus most data are presented as medians with interquartile ranges (IQR), and comparisons between datasets were made using the MannWhitney U test. Press Ganey data are presented as means with standard errors of the mean, as distributed by Press Ganey. P < 0.05 was considered significant for all data comparisons.
RESULTS
Basic demographic data were available on all participants from whom both noise and survey data were collected. As in Table 1, these participants were demographically similar (P < 0.05) with regards to age, sex, and ethnic background. For unknown reasons, neurosurgery patients comprised the majority of participants in Phases 1 and 3, and neurology patients comprised the majority in Phase 2. This difference was not significant.
| Demographic | Phase 1 (n = 32) | Phase 2 (n = 33) | Phase 3 (n = 30) |
|---|---|---|---|
| Average age | 49 1 | 43 3 | 46 3 |
| % Female | 71% | 71% | 57% |
| % Neurology | 42% | 65% | 37% |
| % White | 67% | 77% | 73% |
Sleep Survey
A total of 253 sleep surveys were collected in all 4 phases. Data generated from these surveys are demonstrated in Table 2. On a 7‐point scale (1 being the best score, corresponding to the answer none, and 7 the worst, corresponding to extreme), the median scores for overall difficulty sleeping were not significantly different in Phases 1, 2, and 4. In Phase 3, the median score was 4 (moderate), significantly worse than in the other 3 phases (0.002 < P < 0.01). Despite the reported difficulty sleeping during Phase 3, the median number of hours of sleep and awakenings in Phases 1, 2, 3, and 4 were not significantly different. Sleep latency was scored on a 6‐point scale (1 being the best, corresponding to 010 min, and 6 the worst, corresponding to greater than 45 minutes). Similar sleep latency was reported in Phases 1, 3, and 4. However, median sleep latency in Phase 2 was 1 (010 min), significantly shorter than in the other phases (0.001 < P < 0.02). Despite similar survey results throughout most of the phases, there was a significant improvement in sleep latency in the Basic Sleep Rounds phase (Phase 2), and a significant worsening in overall difficulty sleeping in the washout phase (Phase 3).
| Survey Question | Phase 1 | Phase 2 | Phase 3 | Phase 4 |
|---|---|---|---|---|
| ||||
| 1. How much difficulty did you have sleeping last night? | 3 | 2 | 4* | 3 |
| IQR 4 N = 100 | IQR 4 N = 78 | IQR 3 N = 75 | IQR 2 N = 22 | |
| 2. How many hours did you sleep last night? | 6 hr | 6 hr | 5 hr | 5 hr |
| IQR 4 N = 98 | IQR 3 N = 77 | IQR 3 N = 72 | IQR 2 N = 22 | |
| 3. About how many times did you wake up during the night while you were trying to sleep? | 3 | 3 | 4 | 3 |
| IQR 3 N = 101 | IQR 3 N = 77 | IQR 3 N = 73 | IQR 3 N = 22 | |
| 4. How long did it take you to go to sleep last night? | 3 (1620 min) | 1 (010 min) | 2 (1115 min) | 2 (1115 min) |
| IQR 3 N = 101 | IQR 2 N = 77 | IQR 4 N = 75 | IQR 3 N = 22 | |
Participants also ranked each of the 7 queried disruptive factors on a 7‐point scale with regards to degree of sleep interruption. Even though less than half of the participants were in shared rooms, the presence of a roommate among those with roommates was the only sleep disrupter that ranked differently among the 4 phases. In Phases 1 and 2, when asked how much their sleep was disturbed by roommates, the median response was 1 (none), IQR = 1 (N = 41 and 31, respectively). In Phase 4, the median was 2 (a little), IQR = 2 (N = 6), but not significantly different. Answers in Phase 3 were significantly different, with a median of 3 (mild), IQR = 3 (N = 30) (0.005 < P < 0.006). Because there were no other statistically significant differences among individual sleep disruptors as compared by phases, survey data from all 4 phases for these factors was also analyzed collectively. Pain and staff interruptions (IQR = 3, N = 252 and IQR = 2, N = 253, respectively) were reported as the most disturbing factors, each with a median of 2 (a little). All remaining factors had a median score of 1 (none): noise inside the room (IQR = 2, N = 253), noise outside of the room (IQR = 1, N = 253), temperature (IQR = 1, N = 253), noise outside of the building (IQR = 0, N = 252), and light (IQR = 0, N = 252).
Noise Meter Recordings
Noise data were recorded from 95 participants in Phases 1 through 3, yielding high‐quality data suitable for analysis from 63 participants (11 in Phase 1, 24 in Phase 2, and 28 in Phase 3). Recorded noise ranged from 35 to 80 dB. As shown in Supporting Figure 2 in the online version of this article, raw data were plotted as decibels as a function of time. Noise levels were then analyzed in aggregate and for each of four 3‐hour time blocks (8 PM11 PM, 11 PM 2 AM,, 2 AM 5 AM, and 5 AM8 AM). Median noise levels during the entire 12‐hour period increased significantly between the first 3 phases of the study (P < 0.001): 38.6 dB (IQR 5.4) in Phase 1; 40.6 dB (IQR 5.3) in Phase 2; and 43.5 (IQR 7) in Phase 3. As in Supporting Table 1 in the online version of this article, within each phase, the median noise levels were significantly less during the 11 PM2 AM and 2 AM5 AM periods, as compared to the 8 PM11 PM and 5 AM8 AM periods (P < 0.001). Due to equipment dysfunction, noise data were not available for Phase 4.
Press Ganey Survey
A total of 457 Press Ganey surveys were collected. According to these surveys, patients' mean raw score of noise, on a scale from 1 to 100 (100 representing the best score), ranged from a low of 59.5 7.2 (January 2010; N = 21) to a high of 82.1 5.2 (April 2009; N = 21). Figure 3 illustrates the monthly trend of the mean score for noise compared to the national average compiled from other large hospitals around the country. It demonstrates that during the phases in which Sleep Rounds were performed (Phases 2 and 4), patients' perceptions of noise were improved.

DISCUSSION
The major conclusions of this study are: 1) hospitalized patients suffer from poor sleep quality and quantity; 2) implementation of simple measures such as Sleep Rounds to change standard practice within the hospital is feasible and effective; and 3) despite an increase in measured noise, patients' perception of their sleep and of noise levels was improved by these measures. This study developed and tested a sleep promotion program that could easily be implemented on any inpatient floor. Our Sleep Rounds checklist outlines a novel, but simple approach to sleep health by hospital providers, with the immediate goal of improving sleep among inpatients and the ultimate goal of improving outcomes.
Our study confirms that sleep disruption is prevalent among patients admitted to general hospital wards. In this study, patients reported a median of 5 hours of sleep, 3 awakenings, and sleep latency of 1115 minutes. Although not alarmingly low, 5 hours is only 60% of the recommended 8 hours of sleep for healthy individuals each night and 72% of the 6.9 hours of sleep reported by the average American each night.26 Poor pain control, frequent staff interactions, and the presence of roommates were rated as most problematic by the patients we surveyed. Interestingly, patients rated noise, temperature, and light as less problematic sleep disruptors.
Although we did not detect a statistically significant improvement in total sleep time or number of awakenings, there was a significant improvement in sleep latency during Phase 2 of the study when Basic Sleep Rounds were performed. In Phase 3 (washout phase), there was less active participation by the nursing staff in sleep hygiene promotion, and patients' perception of sleep quality was significantly worse than it was in other phases. These results suggest that the perception of sleep quality and quantity could have been enhanced by both our Basic (Phase 2) and Deluxe (Phase 4) Sleep Rounds interventions.
We were able to achieve appropriate noise levels at night (40 dB) during this study, even before our intervention began.27 Noise levels increased 2 dB between Phases 1 and 2, and another 3 dB in Phase 3. Although the changes in decibel level were statistically significant, a change of 23 dB is barely perceptible.28 Interestingly, despite the increase in measured noise throughout the study, Press Ganey results showed a trend towards perceived improvement in noise levels just before implementation of the first intervention. This may be attributable to an increased awareness of noise created by consenting patients and placing noise meters in their rooms. Perception of noise worsened significantly during the washout phase, suggesting that abandonment of Sleep Rounds was associated with less concern about noise.
Prior to initiating this study, an educational in‐service was conducted for the nursing team regarding the purpose and overall aims of this project. This may have raised awareness of the importance of sleep before collection of Phase 1 data, and had the unintended effect of an increased focus on sleep even before Sleep Rounds began. Other limitations of the study include lack of objective sleep data, nonrandomized design, inability to demonstrate causality, generalizability of results, inability to control for comorbidity including baseline sleep hygiene, limited patient numbers, inability to blind patients and team members, and difficulty obtaining accurate and complete noise data on all patients enrolled.
This study suggests that although it remains difficult for patients to sleep well in the hospital, it is possible to improve sleep and patients' perception of their sleep while they are hospitalized. Further studies are warranted to systematically evaluate interventions aimed at improving and overcoming the identified sleep disruptors without compromising patient care. However, we believe that Sleep Rounds could be associated with improvements in inpatient sleep hygiene and patient satisfaction, and could ultimately benefit patient outcomes.
Acknowledgements
The authors thank JoEllen Robinson, Jane Hill, and the nursing staff of Meyer 8 for their invaluable contributions to this project.
- .Sleep in acute care settings: an integrative review.J Nurs Scholarsh.2000;32(1):31–38.
- ,.Nursing standard‐of‐practice protocol: sleep disturbances in elderly patients. The NICHE Faculty.Geriatr Nurs.1995;16(5):238–243.
- ,,, et al.Sleep patterns and mortality among elderly patients in a geriatric hospital.Gerontology.2000;46(6):318–322.
- ,,.Sleep, insomnia and falls in elderly patients.Sleep Med.2008;9(suppl 1):S18–S22.
- ,,,,,.Behavioural and physiological reactivity to noise in the newborn.J Paediatr Child Health.2004;40(5–6):275–281.
- ,,.Sleep problems as a risk factor for falls in a sample of community‐dwelling adults aged 64–99 years.J Am Geriatr Soc.2000;48(10):1234–1240.
- ,,, et al.Reducing dangerous nighttime events in persons with dementia by using a nighttime monitoring system.Alzheimers Dement.2009;5(5):419–426.
- ,.Neurocognitive consequences of sleep deprivation.Semin Neurol.2005;25(1):117–129.
- ,,,,.The nursing home at night: effects of an intervention on noise, light, and sleep.J Am Geriatr Soc.1999;47(4):430–438.
- ,,,,.Sleep in hospitalized elders: a pilot study.Geriatr Nurs.2010;31(4):263–271.
- ,.Interactive relationships between hospital patients' noise‐induced stress and other stress with sleep.Heart Lung.2001;30(4):237–243.
- ,,.The impact of noise on patients' sleep and the effectiveness of noise reduction strategies in intensive care units.Crit Care.2009;13(2):208.
- ,,,,,.Sleep in critically ill patients requiring mechanical ventilation.Chest.2000;117(3):809–818.
- ,.Adverse effects of sleep deprivation in the ICU.Crit Care Clin.2008;24(3):461–476, v–vi.
- ,,,,.Abnormal sleep/wake cycles and the effect of environmental noise on sleep disruption in the intensive care unit.Am J Respir Crit Care Med.2001;163(2):451–457.
- ,.Responses of premature infants to routine nursing interventions and noise in the NICU.Nurs Res.1995;44(3):179–185.
- ,,,,.Noise, stress, and annoyance in a pediatric intensive care unit.Crit Care Med.2003;31(1):113–119.
- ,,,,.Effects of guidelines implementation in a surgical intensive care unit to control nighttime light and noise levels.Crit Care Med.2000;28(7):2242–2247.
- ,,,,.Noise control: a nursing team's approach to sleep promotion.Am J Nurs.2004;104(2):40–48; quiz 48–49.
- ,,, et al.Environmental noise sources and interventions to minimize them: a tale of 2 hospitals.J Nurs Care Qual.2008;23(3):216–224; quiz 225–216.
- ,,, et al.Interventions to reduce decibel levels on patient care units.Am Surg.1998;64(9):894–899.
- ,,,.Examining the feasibility of implementing specific nursing interventions to promote sleep in hospitalized elderly patients.Geriatr Nurs.2008;29(3):197–206.
- ,,,.Applicability of two brief evidence‐based interventions to improve sleep quality in inpatient mental health care.Int J Ment Health Nurs.2011;20(5)319–327.
- .Sleep deprivation in critical care units.Crit Care Nurs Q.2003;26(3):179–189; quiz 190–171.
- ,,,.Sleep promotion in hospitalized elders.Medsurg Nurs.2003;12(5):279–289; quiz 290.
- 2005 NSF Sleep in America Poll.Washington, DC:National Sleep Foundation;2005.
- ,,.Guidelines for Community Noise.Geneva, Switzerland:World Health Organization;1999.
- PhysicsArchives.com.2010. Available at: http://physicsarchives.com/index.php/courses/219. Accessed May 15, 2011.
In recent years, the philosophy of major hospitals has become more patient‐centered with increased focus on outcomes, safety, and patient satisfaction. To this end, many hospitals are looking for innovative ways not only to optimize quality of care, but also to improve patient satisfaction.
Sleep is a domain in which the goals of improving patient outcomes and satisfaction can be mutually achieved. Poor sleep has become a prevalent problem, and a single night of complete sleep loss can result in the undesirable consequences of daytime sleepiness, lethargy, irritability, confusion, and poor short‐term memory.1, 2 Literature has also suggested that chronic partial sleep loss can have significant consequences for safety, mood stability, neurological and medical functioning, and quality of life.38 The importance of acknowledging the relationship between sleep and a patient's level of functioning is magnified in the context of hospitalized patients, particularly those undergoing neurological inpatient care. Changes in level of alertness due to sleep loss can have serious implications for these patients, as they can lead to unnecessary testing and decreased participation with rehabilitative services.
Among the potential causes of sleep deprivation in hospitalized patients are poor pain control, lights, activities of others, and increased noise levels. The effect that increased noise has on patients has been evaluated in a variety of hospital settings, most notably in pediatric and adult intensive care units and nursing homes.9, 10 Noise has been shown to increase blood pressure, heart rate, respiratory rate, and body temperature. It has also been associated with failure to thrive, impaired immune function, delayed wound healing, and increased stress levels.11
The majority of literature regarding sleep disturbance in the hospital has focused on sleep disruption in the intensive care unit, where interventions associated with sleep loss are required to deliver the appropriate standard level of care.1218 However, few evidence‐based strategies to promote sleep quality in hospitalized patients have been evaluated.16, 1823 In this study, we aimed to examine sleep among neurological and neurosurgical inpatients, identify specific sleep‐disruptive factors, and assess patient satisfaction regarding their sleep. We implemented a sleep‐promoting protocol with the hypothesis that improvement of modifiable sleep‐disruptive factors would improve sleep and patient satisfaction.
METHODS
Study Design
This prospective, observational study was designed and implemented by an interdisciplinary team of physicians, neuroscience nurses, and hospital administrators.
Patient Selection
The study was performed on a Neurology and Neurosurgery unit, with both private and semi‐private rooms, at a large, urban, tertiary teaching hospital from February 2009 through June 2010. During enrollment periods, all patients on the unit were screened daily for eligibility. Eligible patients were medically stable and capable of giving verbal consent. Patients who were less than 16 years of age, encephalopathic, aphasic, or non‐English speaking were excluded. Eligible patients were asked for consent to participate in the study. After consultation with the hospital's institutional review board (IRB) committee, written consent was waived in this observational, quality improvement study.
Study Timeline
The study comprised 4 phases (Figure 1). In Phase 1, we collected baseline data on patients in the unit. Data were collected in the form of sleep surveys, Press Ganey surveys, and noise meter recordings. The baseline phase (Phase 1) lasted 10 weeks from February to April 2009. We then implemented a novel sleep‐promoting intervention called Basic Sleep Rounds (Phase 2, May to August 2009). After discontinuing Basic Sleep Rounds, data were collected for the washout phase (Phase 3, September 2009 to February 2010). An enhanced version of the sleep‐promoting intervention called Deluxe Sleep Rounds was then instituted (Phase 4, March to June 2010). In Phases 2 and 4, sleep rounds were implemented for 2 weeks before data collection to ensure uniform application of Sleep Rounds.
Sleep Promoting Interventions
Prior to implementing Basic Sleep Rounds in Phase 2, a nursing in‐service was performed where staff were educated about sleep in the hospital and about the planned interventions, and posters promoting sleep were hung on the unit. Basic Sleep Rounds were performed during Phase 2 by the patient's bedside nurse or the unit charge nurse. This occurred for all patients on the unit at approximately 23:00 nightly using the Basic Sleep Rounds checklist, which formalized simple hospital functions, such as lights out, television off, room temperature adjustment, and a final restroom usage (Figure 2). For Phase 4, a team of undergraduate volunteers was organized to assist with the delivery of Sleep Rounds. In this phase (Deluxe Sleep Rounds), nurses performed Basic Sleep Rounds by completing the checklist, and undergraduate volunteers offered patients any of the following sleep amenities: warm blanket, warm milk, white‐noise machine, hypoallergenic lotion, or room spritzer.24, 25
Additionally, during the Basic and Deluxe intervention phases, noise‐sensitive traffic lights (Talk Light Too;
Data Collection
A survey was designed to evaluate sleep quality, estimate sleep quantity, identify sleep disruptors, and assess patient satisfaction (see Supporting Figure 1 in the online version of this article). The survey was given to all eligible participants on the morning after their second night in the unit. This time point was chosen to account for potentially confounding first night effects, and to ensure that enrolled patients spent a full night in the unit.
To better evaluate one of the sleep disruptors, a subset of the survey participants had noise meters placed in their rooms. Every morning, a member of the team would visit all eligible patients to ask if they were willing to participate in this portion of the study. Data recorded between 8:00 PM and 8:00 AM on the second night of each participant's stay were later used for analysis. Noise was recorded in decibels using a Vernier Sound Level Meter, attached to a LabQuest data collection device (
Scores from Press Ganey surveys were also analyzed. These surveys were mailed to patients shortly after hospital discharge, and subsequently processed by Press Ganey Associates, Inc (
Data Analysis
Most datasets were not described by a normal distribution, thus most data are presented as medians with interquartile ranges (IQR), and comparisons between datasets were made using the MannWhitney U test. Press Ganey data are presented as means with standard errors of the mean, as distributed by Press Ganey. P < 0.05 was considered significant for all data comparisons.
RESULTS
Basic demographic data were available on all participants from whom both noise and survey data were collected. As in Table 1, these participants were demographically similar (P < 0.05) with regards to age, sex, and ethnic background. For unknown reasons, neurosurgery patients comprised the majority of participants in Phases 1 and 3, and neurology patients comprised the majority in Phase 2. This difference was not significant.
| Demographic | Phase 1 (n = 32) | Phase 2 (n = 33) | Phase 3 (n = 30) |
|---|---|---|---|
| Average age | 49 1 | 43 3 | 46 3 |
| % Female | 71% | 71% | 57% |
| % Neurology | 42% | 65% | 37% |
| % White | 67% | 77% | 73% |
Sleep Survey
A total of 253 sleep surveys were collected in all 4 phases. Data generated from these surveys are demonstrated in Table 2. On a 7‐point scale (1 being the best score, corresponding to the answer none, and 7 the worst, corresponding to extreme), the median scores for overall difficulty sleeping were not significantly different in Phases 1, 2, and 4. In Phase 3, the median score was 4 (moderate), significantly worse than in the other 3 phases (0.002 < P < 0.01). Despite the reported difficulty sleeping during Phase 3, the median number of hours of sleep and awakenings in Phases 1, 2, 3, and 4 were not significantly different. Sleep latency was scored on a 6‐point scale (1 being the best, corresponding to 010 min, and 6 the worst, corresponding to greater than 45 minutes). Similar sleep latency was reported in Phases 1, 3, and 4. However, median sleep latency in Phase 2 was 1 (010 min), significantly shorter than in the other phases (0.001 < P < 0.02). Despite similar survey results throughout most of the phases, there was a significant improvement in sleep latency in the Basic Sleep Rounds phase (Phase 2), and a significant worsening in overall difficulty sleeping in the washout phase (Phase 3).
| Survey Question | Phase 1 | Phase 2 | Phase 3 | Phase 4 |
|---|---|---|---|---|
| ||||
| 1. How much difficulty did you have sleeping last night? | 3 | 2 | 4* | 3 |
| IQR 4 N = 100 | IQR 4 N = 78 | IQR 3 N = 75 | IQR 2 N = 22 | |
| 2. How many hours did you sleep last night? | 6 hr | 6 hr | 5 hr | 5 hr |
| IQR 4 N = 98 | IQR 3 N = 77 | IQR 3 N = 72 | IQR 2 N = 22 | |
| 3. About how many times did you wake up during the night while you were trying to sleep? | 3 | 3 | 4 | 3 |
| IQR 3 N = 101 | IQR 3 N = 77 | IQR 3 N = 73 | IQR 3 N = 22 | |
| 4. How long did it take you to go to sleep last night? | 3 (1620 min) | 1 (010 min) | 2 (1115 min) | 2 (1115 min) |
| IQR 3 N = 101 | IQR 2 N = 77 | IQR 4 N = 75 | IQR 3 N = 22 | |
Participants also ranked each of the 7 queried disruptive factors on a 7‐point scale with regards to degree of sleep interruption. Even though less than half of the participants were in shared rooms, the presence of a roommate among those with roommates was the only sleep disrupter that ranked differently among the 4 phases. In Phases 1 and 2, when asked how much their sleep was disturbed by roommates, the median response was 1 (none), IQR = 1 (N = 41 and 31, respectively). In Phase 4, the median was 2 (a little), IQR = 2 (N = 6), but not significantly different. Answers in Phase 3 were significantly different, with a median of 3 (mild), IQR = 3 (N = 30) (0.005 < P < 0.006). Because there were no other statistically significant differences among individual sleep disruptors as compared by phases, survey data from all 4 phases for these factors was also analyzed collectively. Pain and staff interruptions (IQR = 3, N = 252 and IQR = 2, N = 253, respectively) were reported as the most disturbing factors, each with a median of 2 (a little). All remaining factors had a median score of 1 (none): noise inside the room (IQR = 2, N = 253), noise outside of the room (IQR = 1, N = 253), temperature (IQR = 1, N = 253), noise outside of the building (IQR = 0, N = 252), and light (IQR = 0, N = 252).
Noise Meter Recordings
Noise data were recorded from 95 participants in Phases 1 through 3, yielding high‐quality data suitable for analysis from 63 participants (11 in Phase 1, 24 in Phase 2, and 28 in Phase 3). Recorded noise ranged from 35 to 80 dB. As shown in Supporting Figure 2 in the online version of this article, raw data were plotted as decibels as a function of time. Noise levels were then analyzed in aggregate and for each of four 3‐hour time blocks (8 PM11 PM, 11 PM 2 AM,, 2 AM 5 AM, and 5 AM8 AM). Median noise levels during the entire 12‐hour period increased significantly between the first 3 phases of the study (P < 0.001): 38.6 dB (IQR 5.4) in Phase 1; 40.6 dB (IQR 5.3) in Phase 2; and 43.5 (IQR 7) in Phase 3. As in Supporting Table 1 in the online version of this article, within each phase, the median noise levels were significantly less during the 11 PM2 AM and 2 AM5 AM periods, as compared to the 8 PM11 PM and 5 AM8 AM periods (P < 0.001). Due to equipment dysfunction, noise data were not available for Phase 4.
Press Ganey Survey
A total of 457 Press Ganey surveys were collected. According to these surveys, patients' mean raw score of noise, on a scale from 1 to 100 (100 representing the best score), ranged from a low of 59.5 7.2 (January 2010; N = 21) to a high of 82.1 5.2 (April 2009; N = 21). Figure 3 illustrates the monthly trend of the mean score for noise compared to the national average compiled from other large hospitals around the country. It demonstrates that during the phases in which Sleep Rounds were performed (Phases 2 and 4), patients' perceptions of noise were improved.
DISCUSSION
The major conclusions of this study are: 1) hospitalized patients suffer from poor sleep quality and quantity; 2) implementation of simple measures such as Sleep Rounds to change standard practice within the hospital is feasible and effective; and 3) despite an increase in measured noise, patients' perception of their sleep and of noise levels was improved by these measures. This study developed and tested a sleep promotion program that could easily be implemented on any inpatient floor. Our Sleep Rounds checklist outlines a novel, but simple approach to sleep health by hospital providers, with the immediate goal of improving sleep among inpatients and the ultimate goal of improving outcomes.
Our study confirms that sleep disruption is prevalent among patients admitted to general hospital wards. In this study, patients reported a median of 5 hours of sleep, 3 awakenings, and sleep latency of 1115 minutes. Although not alarmingly low, 5 hours is only 60% of the recommended 8 hours of sleep for healthy individuals each night and 72% of the 6.9 hours of sleep reported by the average American each night.26 Poor pain control, frequent staff interactions, and the presence of roommates were rated as most problematic by the patients we surveyed. Interestingly, patients rated noise, temperature, and light as less problematic sleep disruptors.
Although we did not detect a statistically significant improvement in total sleep time or number of awakenings, there was a significant improvement in sleep latency during Phase 2 of the study when Basic Sleep Rounds were performed. In Phase 3 (washout phase), there was less active participation by the nursing staff in sleep hygiene promotion, and patients' perception of sleep quality was significantly worse than it was in other phases. These results suggest that the perception of sleep quality and quantity could have been enhanced by both our Basic (Phase 2) and Deluxe (Phase 4) Sleep Rounds interventions.
We were able to achieve appropriate noise levels at night (40 dB) during this study, even before our intervention began.27 Noise levels increased 2 dB between Phases 1 and 2, and another 3 dB in Phase 3. Although the changes in decibel level were statistically significant, a change of 23 dB is barely perceptible.28 Interestingly, despite the increase in measured noise throughout the study, Press Ganey results showed a trend towards perceived improvement in noise levels just before implementation of the first intervention. This may be attributable to an increased awareness of noise created by consenting patients and placing noise meters in their rooms. Perception of noise worsened significantly during the washout phase, suggesting that abandonment of Sleep Rounds was associated with less concern about noise.
Prior to initiating this study, an educational in‐service was conducted for the nursing team regarding the purpose and overall aims of this project. This may have raised awareness of the importance of sleep before collection of Phase 1 data, and had the unintended effect of an increased focus on sleep even before Sleep Rounds began. Other limitations of the study include lack of objective sleep data, nonrandomized design, inability to demonstrate causality, generalizability of results, inability to control for comorbidity including baseline sleep hygiene, limited patient numbers, inability to blind patients and team members, and difficulty obtaining accurate and complete noise data on all patients enrolled.
This study suggests that although it remains difficult for patients to sleep well in the hospital, it is possible to improve sleep and patients' perception of their sleep while they are hospitalized. Further studies are warranted to systematically evaluate interventions aimed at improving and overcoming the identified sleep disruptors without compromising patient care. However, we believe that Sleep Rounds could be associated with improvements in inpatient sleep hygiene and patient satisfaction, and could ultimately benefit patient outcomes.
Acknowledgements
The authors thank JoEllen Robinson, Jane Hill, and the nursing staff of Meyer 8 for their invaluable contributions to this project.
- .Sleep in acute care settings: an integrative review.J Nurs Scholarsh.2000;32(1):31–38.
- ,.Nursing standard‐of‐practice protocol: sleep disturbances in elderly patients. The NICHE Faculty.Geriatr Nurs.1995;16(5):238–243.
- ,,, et al.Sleep patterns and mortality among elderly patients in a geriatric hospital.Gerontology.2000;46(6):318–322.
- ,,.Sleep, insomnia and falls in elderly patients.Sleep Med.2008;9(suppl 1):S18–S22.
- ,,,,,.Behavioural and physiological reactivity to noise in the newborn.J Paediatr Child Health.2004;40(5–6):275–281.
- ,,.Sleep problems as a risk factor for falls in a sample of community‐dwelling adults aged 64–99 years.J Am Geriatr Soc.2000;48(10):1234–1240.
- ,,, et al.Reducing dangerous nighttime events in persons with dementia by using a nighttime monitoring system.Alzheimers Dement.2009;5(5):419–426.
- ,.Neurocognitive consequences of sleep deprivation.Semin Neurol.2005;25(1):117–129.
- ,,,,.The nursing home at night: effects of an intervention on noise, light, and sleep.J Am Geriatr Soc.1999;47(4):430–438.
- ,,,,.Sleep in hospitalized elders: a pilot study.Geriatr Nurs.2010;31(4):263–271.
- ,.Interactive relationships between hospital patients' noise‐induced stress and other stress with sleep.Heart Lung.2001;30(4):237–243.
- ,,.The impact of noise on patients' sleep and the effectiveness of noise reduction strategies in intensive care units.Crit Care.2009;13(2):208.
- ,,,,,.Sleep in critically ill patients requiring mechanical ventilation.Chest.2000;117(3):809–818.
- ,.Adverse effects of sleep deprivation in the ICU.Crit Care Clin.2008;24(3):461–476, v–vi.
- ,,,,.Abnormal sleep/wake cycles and the effect of environmental noise on sleep disruption in the intensive care unit.Am J Respir Crit Care Med.2001;163(2):451–457.
- ,.Responses of premature infants to routine nursing interventions and noise in the NICU.Nurs Res.1995;44(3):179–185.
- ,,,,.Noise, stress, and annoyance in a pediatric intensive care unit.Crit Care Med.2003;31(1):113–119.
- ,,,,.Effects of guidelines implementation in a surgical intensive care unit to control nighttime light and noise levels.Crit Care Med.2000;28(7):2242–2247.
- ,,,,.Noise control: a nursing team's approach to sleep promotion.Am J Nurs.2004;104(2):40–48; quiz 48–49.
- ,,, et al.Environmental noise sources and interventions to minimize them: a tale of 2 hospitals.J Nurs Care Qual.2008;23(3):216–224; quiz 225–216.
- ,,, et al.Interventions to reduce decibel levels on patient care units.Am Surg.1998;64(9):894–899.
- ,,,.Examining the feasibility of implementing specific nursing interventions to promote sleep in hospitalized elderly patients.Geriatr Nurs.2008;29(3):197–206.
- ,,,.Applicability of two brief evidence‐based interventions to improve sleep quality in inpatient mental health care.Int J Ment Health Nurs.2011;20(5)319–327.
- .Sleep deprivation in critical care units.Crit Care Nurs Q.2003;26(3):179–189; quiz 190–171.
- ,,,.Sleep promotion in hospitalized elders.Medsurg Nurs.2003;12(5):279–289; quiz 290.
- 2005 NSF Sleep in America Poll.Washington, DC:National Sleep Foundation;2005.
- ,,.Guidelines for Community Noise.Geneva, Switzerland:World Health Organization;1999.
- PhysicsArchives.com.2010. Available at: http://physicsarchives.com/index.php/courses/219. Accessed May 15, 2011.