User login
Bariatric Surgery for CKD
Q) I know that diabetes can be controlled with bariatric surgery. Is there any proof that it also helps with kidney disease?
With obesity reaching epidemic proportions in the United States, the number of patients undergoing bariatric surgery has increased in recent years. The procedure has been identified as the most effective intervention for the morbidly obese (BMI > 35).1, 2
Obesity is an independent risk factor for the development and progression of chronic kidney disease (CKD).3 It causes changes in the kidney, including hyperfiltration, proteinuria, albuminuria, and reduced glomerular filtration rate (GFR); however, the underlying mechanisms are still poorly understood.4 Research has demonstrated bariatric surgery’s positive effect on morbidly obese patients with CKD, as well as its benefit for patients with diabetes and hypertension—the two major causes of CKD.1,2
Several studies have found that weight loss resulting from bariatric surgery improves proteinuria, albuminuria, and GFR.2,3,5-9 Findings related to serum creatinine (SCr) have been somewhat conflicting. In severely obese patients, the surgery was associated with a reduction in SCr. This association persisted in those with and without baseline CKD, hypertension, and/or diabetes.5 However, other studies found that the procedure lowered SCr in patients with mild renal impairment (SCr 1.3-1.6 mg/dL) but increased levels in those with moderate renal impairment (SCr > 1.6 mg/dL).10 Because the effects of bariatric surgery on kidney function appear to differ based on CKD stage, further research is needed.
Overall, we can conclude that bariatric surgery has merit as an option to prevent and/or slow progression of early-stage CKD in severely obese patients. Larger, long-term studies are needed to analyze the duration of these effects on kidney outcomes, including the development of end-stage kidney disease. And additional research is needed to determine the risks and benefits associated with bariatric surgery in this population. —ZK-K
Zorica Kauric-Klein, APRN-BC, PhD
Assistant Clinical Professor, College of Nursing, Wayne State University, Detroit
1. Schauer PR, Bhatt DL, Kirwan JP, et al; STAMPEDE Investigators. Bariatric surgery versus intensive medical therapy for diabetes—5-year outcomes. N Engl J Med. 2017;376(7):641-651.
2. Ricci C, Gaeta M, Rausa E, et al. Early impact of bariatric surgery on type II diabetes, hypertension, and hyperlipidemia: a systematic review, meta-analysis and meta-regression on 6,587 patients. Obes Surg. 2014;24(4):522-528.
3. Bolignano D, Zoccali C. Effects of weight loss on renal function in obese CKD patients: a systematic review. Nephrol Dial Transplant. 2013;28(suppl 4):82-98.
4. Hall ME, do Carmo JM, da Silva AA, et al. Obesity, hypertension, and chronic kidney disease. Int J Nephrol Renovasc Dis. 2014;7:75-88.
5. Chang AR, Chen Y, Still C, et al. Bariatric surgery is associated with improvement in kidney outcomes. Kidney Int. 2016;90(1):164-171.
6. Ruiz-Tovar J, Giner L, Sarro-Sobrin F, et al. Laparoscopic sleeve gastrectomy prevents the deterioration of renal function in morbidly obese patients over 40 years. Obes Surg. 2015;25(5):796-799.
7. Neff KJ, Baud G, Raverdy V, et al. Renal function and remission of hypertension after bariatric surgery: a 5-year prospective cohort study. Obes Surg. 2017;27(3):613-619.
8. Nehus EJ, Khoury JC, Inge TH, et al. Kidney outcomes three years after bariatric surgery in severely obese adolescents. Kidney Int. 2017;91(2):451-458.
9. Carlsson LMS, Romeo S, Jacobson P, et al. The incidence of albuminuria after bariatric surgery and usual care in Swedish obese subjects (SOS): a prospective controlled intervention trial. Int J Obes (Lond). 2015;39(1):169-175.
10. Schuster DP, Teodorescu M, Mikami D, et al. Effect of bariatric surgery on normal and abnormal renal function. Surg Obes Relat Dis. 2011;7(4):459-464.
Clinician Reviews in partnership with
Renal Consult is edited by Jane S. Davis, CRNP, DNP, a member of the Clinician Reviews editorial board, who is a nurse practitioner in the Division of Nephrology at the University of Alabama at Birmingham and is the communications chairperson for the National Kidney Foundation’s Council of Advanced Practitioners (NKF-CAP); and Kim Zuber, PA-C, MSPS, DFAAPA, a semi-retired PA who works with the American Academy of Nephrology PAs and is a past chair of the NKF-CAP. This month’s responses were authored by Zorica Kauric-Klein, APRN-BC, PhD, who is an Assistant Clinical Professor in the College of Nursing at Wayne State University in Detroit, and Rebecca Clawson, MAT, PA-C, who is an Instructor in the PA Program at LSU Health Shreveport in Louisiana.
Q) I know that diabetes can be controlled with bariatric surgery. Is there any proof that it also helps with kidney disease?
With obesity reaching epidemic proportions in the United States, the number of patients undergoing bariatric surgery has increased in recent years. The procedure has been identified as the most effective intervention for the morbidly obese (BMI > 35).1, 2
Obesity is an independent risk factor for the development and progression of chronic kidney disease (CKD).3 It causes changes in the kidney, including hyperfiltration, proteinuria, albuminuria, and reduced glomerular filtration rate (GFR); however, the underlying mechanisms are still poorly understood.4 Research has demonstrated bariatric surgery’s positive effect on morbidly obese patients with CKD, as well as its benefit for patients with diabetes and hypertension—the two major causes of CKD.1,2
Several studies have found that weight loss resulting from bariatric surgery improves proteinuria, albuminuria, and GFR.2,3,5-9 Findings related to serum creatinine (SCr) have been somewhat conflicting. In severely obese patients, the surgery was associated with a reduction in SCr. This association persisted in those with and without baseline CKD, hypertension, and/or diabetes.5 However, other studies found that the procedure lowered SCr in patients with mild renal impairment (SCr 1.3-1.6 mg/dL) but increased levels in those with moderate renal impairment (SCr > 1.6 mg/dL).10 Because the effects of bariatric surgery on kidney function appear to differ based on CKD stage, further research is needed.
Overall, we can conclude that bariatric surgery has merit as an option to prevent and/or slow progression of early-stage CKD in severely obese patients. Larger, long-term studies are needed to analyze the duration of these effects on kidney outcomes, including the development of end-stage kidney disease. And additional research is needed to determine the risks and benefits associated with bariatric surgery in this population. —ZK-K
Zorica Kauric-Klein, APRN-BC, PhD
Assistant Clinical Professor, College of Nursing, Wayne State University, Detroit
1. Schauer PR, Bhatt DL, Kirwan JP, et al; STAMPEDE Investigators. Bariatric surgery versus intensive medical therapy for diabetes—5-year outcomes. N Engl J Med. 2017;376(7):641-651.
2. Ricci C, Gaeta M, Rausa E, et al. Early impact of bariatric surgery on type II diabetes, hypertension, and hyperlipidemia: a systematic review, meta-analysis and meta-regression on 6,587 patients. Obes Surg. 2014;24(4):522-528.
3. Bolignano D, Zoccali C. Effects of weight loss on renal function in obese CKD patients: a systematic review. Nephrol Dial Transplant. 2013;28(suppl 4):82-98.
4. Hall ME, do Carmo JM, da Silva AA, et al. Obesity, hypertension, and chronic kidney disease. Int J Nephrol Renovasc Dis. 2014;7:75-88.
5. Chang AR, Chen Y, Still C, et al. Bariatric surgery is associated with improvement in kidney outcomes. Kidney Int. 2016;90(1):164-171.
6. Ruiz-Tovar J, Giner L, Sarro-Sobrin F, et al. Laparoscopic sleeve gastrectomy prevents the deterioration of renal function in morbidly obese patients over 40 years. Obes Surg. 2015;25(5):796-799.
7. Neff KJ, Baud G, Raverdy V, et al. Renal function and remission of hypertension after bariatric surgery: a 5-year prospective cohort study. Obes Surg. 2017;27(3):613-619.
8. Nehus EJ, Khoury JC, Inge TH, et al. Kidney outcomes three years after bariatric surgery in severely obese adolescents. Kidney Int. 2017;91(2):451-458.
9. Carlsson LMS, Romeo S, Jacobson P, et al. The incidence of albuminuria after bariatric surgery and usual care in Swedish obese subjects (SOS): a prospective controlled intervention trial. Int J Obes (Lond). 2015;39(1):169-175.
10. Schuster DP, Teodorescu M, Mikami D, et al. Effect of bariatric surgery on normal and abnormal renal function. Surg Obes Relat Dis. 2011;7(4):459-464.
How Low Should You Go? Optimizing BP in CKD
Q) I hear providers quote different numbers for target blood pressure in kidney patients. Which are correct?
The answer to this question starts with the word “meta-analysis”—but don’t stop reading! We’ll get down to the basics quickly. Determining the goal blood pressure (BP) for patients with chronic kidney disease (CKD) comes down to three questions.
1. Does the patient have diabetes? The National Kidney Foundation states that the goal BP for a patient with type 2 diabetes, CKD, and urine albumin > 30 mg/dL is < 140/90 mm Hg.1 This is in line with the JNC-8 recommendations for patients with hypertension and CKD, which do not take urine albumin level into consideration.2 It is important to recognize that while many patients with CKD do not have diabetes, those who do have a worse prognosis.3
2. Is the patient African-American? A meta-analysis of nine randomized clinical trials found that lowering BP to < 130/80 mm Hg was linked to a slower decline in glomerular filtration rate (GFR) in non-African-American patients.3 But this BP was not beneficial for African-American patients; in fact, it actually caused a faster decline in GFR.3 Therefore, target BP for African-American patients should be < 140/90 mm Hg.
3. Does the patient have significant albuminuria? An additional subgroup analysis for patients with high levels of proteinuria (defined as > 1 g/d) yielded inconclusive results.3 Patients with proteinuria > 1 g/d tended to have a slower decline in GFR with intensive BP control.3 Proteinuria > 0.5 g/d was correlated with a slowed progression to end-stage renal disease with intensive BP control.3 Again, these were trends and not statistically significant. So, for patients with high levels of proteinuria, it will not hurt to achieve a BP < 130/80 mm Hg, but there is no statistically significant difference between BP < 130/80 mm Hg and BP < 140/90 mm Hg.
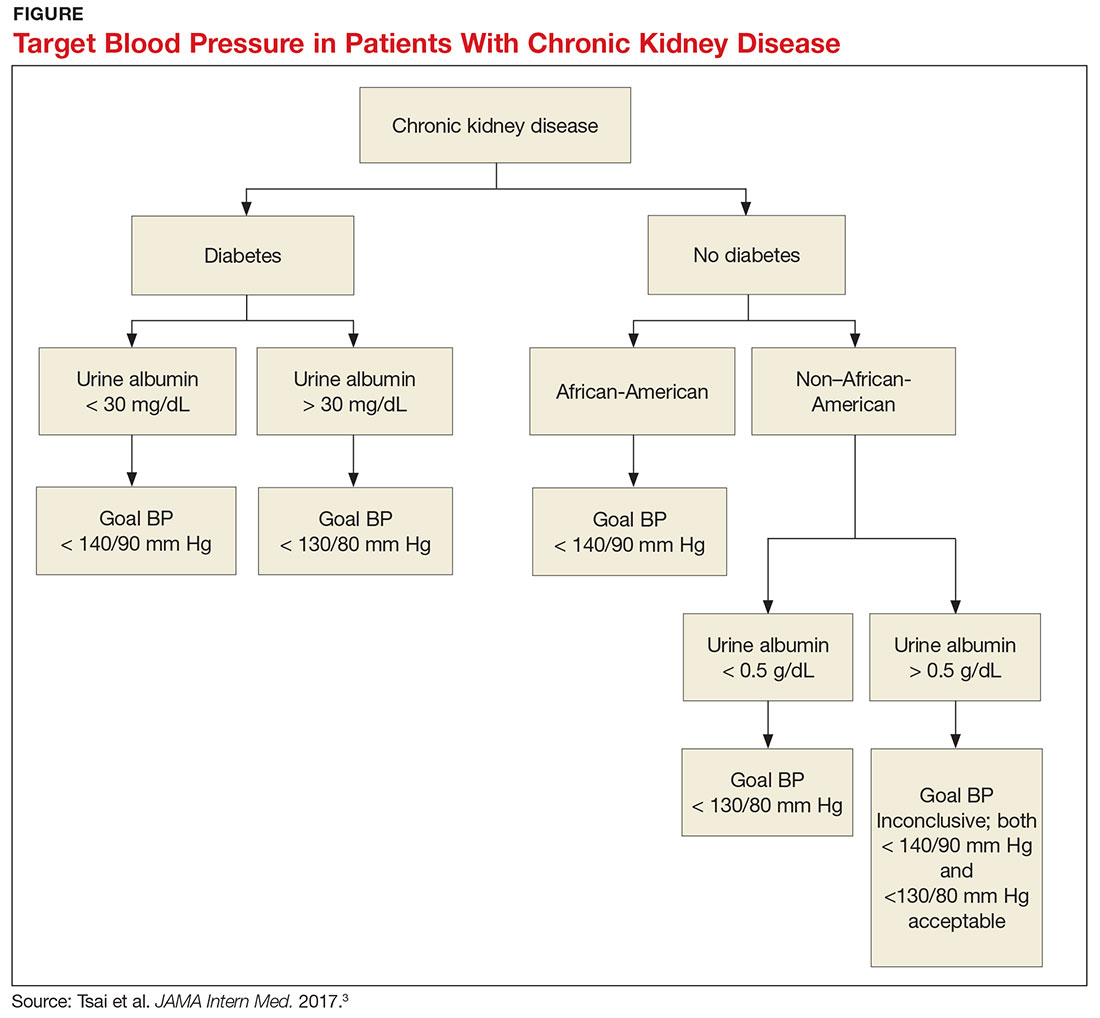
What, then, are the recommendations for an African-American patient with significant proteinuria? While not addressed directly in the analysis, the study results suggest that the goal should still be < 140/90 mm Hg, since the link between race and changes in GFR is statistically significant and the effects of proteinuria are not. Although the recommendations from this review are many, the main points are summarized in the Figure.—RC
Rebecca Clawson, MAT, PA-C
Instructor, PA Program, LSU Health Shreveport, Louisiana
1. Kidney Disease: Improving Global Outcomes (KDIGO) CKD work group. KDIGO 2012 clinical practice guideline for the evaluation and management of chronic kidney disease. Kidney Inter Suppl. 2013;3(1):1-150.
2. James PA, Oparil S, Carter BL, et al. 2014 evidence-based guideline for the management of high blood pressure in adults: report from the panel members appointed to the Eighth Joint National Committee (JNC 8). JAMA. 2014;311(5):507-520.
3. Tsai WC, Wu HY, Peng YS, et al. Association of intensive blood pressure control and kidney disease progression in nondiabetic patients with chronic kidney disease: a systematic review and meta-analysis. JAMA Intern Med. 2017;177:792-799.
Clinician Reviews in partnership with
Renal Consult is edited by Jane S. Davis, CRNP, DNP, a member of the Clinician Reviews editorial board, who is a nurse practitioner in the Division of Nephrology at the University of Alabama at Birmingham and is the communications chairperson for the National Kidney Foundation’s Council of Advanced Practitioners (NKF-CAP); and Kim Zuber, PA-C, MSPS, DFAAPA, a semi-retired PA who works with the American Academy of Nephrology PAs and is a past chair of the NKF-CAP. This month’s responses were authored by Zorica Kauric-Klein, APRN-BC, PhD, who is an Assistant Clinical Professor in the College of Nursing at Wayne State University in Detroit, and Rebecca Clawson, MAT, PA-C, who is an Instructor in the PA Program at LSU Health Shreveport in Louisiana.
Q) I hear providers quote different numbers for target blood pressure in kidney patients. Which are correct?
The answer to this question starts with the word “meta-analysis”—but don’t stop reading! We’ll get down to the basics quickly. Determining the goal blood pressure (BP) for patients with chronic kidney disease (CKD) comes down to three questions.
1. Does the patient have diabetes? The National Kidney Foundation states that the goal BP for a patient with type 2 diabetes, CKD, and urine albumin > 30 mg/dL is < 140/90 mm Hg.1 This is in line with the JNC-8 recommendations for patients with hypertension and CKD, which do not take urine albumin level into consideration.2 It is important to recognize that while many patients with CKD do not have diabetes, those who do have a worse prognosis.3
2. Is the patient African-American? A meta-analysis of nine randomized clinical trials found that lowering BP to < 130/80 mm Hg was linked to a slower decline in glomerular filtration rate (GFR) in non-African-American patients.3 But this BP was not beneficial for African-American patients; in fact, it actually caused a faster decline in GFR.3 Therefore, target BP for African-American patients should be < 140/90 mm Hg.
3. Does the patient have significant albuminuria? An additional subgroup analysis for patients with high levels of proteinuria (defined as > 1 g/d) yielded inconclusive results.3 Patients with proteinuria > 1 g/d tended to have a slower decline in GFR with intensive BP control.3 Proteinuria > 0.5 g/d was correlated with a slowed progression to end-stage renal disease with intensive BP control.3 Again, these were trends and not statistically significant. So, for patients with high levels of proteinuria, it will not hurt to achieve a BP < 130/80 mm Hg, but there is no statistically significant difference between BP < 130/80 mm Hg and BP < 140/90 mm Hg.
What, then, are the recommendations for an African-American patient with significant proteinuria? While not addressed directly in the analysis, the study results suggest that the goal should still be < 140/90 mm Hg, since the link between race and changes in GFR is statistically significant and the effects of proteinuria are not. Although the recommendations from this review are many, the main points are summarized in the Figure.—RC
Rebecca Clawson, MAT, PA-C
Instructor, PA Program, LSU Health Shreveport, Louisiana
1. Kidney Disease: Improving Global Outcomes (KDIGO) CKD work group. KDIGO 2012 clinical practice guideline for the evaluation and management of chronic kidney disease. Kidney Inter Suppl. 2013;3(1):1-150.
2. James PA, Oparil S, Carter BL, et al. 2014 evidence-based guideline for the management of high blood pressure in adults: report from the panel members appointed to the Eighth Joint National Committee (JNC 8). JAMA. 2014;311(5):507-520.
3. Tsai WC, Wu HY, Peng YS, et al. Association of intensive blood pressure control and kidney disease progression in nondiabetic patients with chronic kidney disease: a systematic review and meta-analysis. JAMA Intern Med. 2017;177:792-799.
To Vaccinate, or Not, in Patients With MS
Q) Are vaccines safe for patients with multiple sclerosis?
Vaccines are an important component of general disease prevention and are especially useful for patients with chronic illnesses, such as MS, who may be at elevated risk due to disability or medications that alter the immune system. Currently, there are many disease-modifying therapies that attempt to reduce relapses and impact the immune system, MRI activity, and disability. But is it safe for patients with MS to receive vaccines, given the multitude of studies suggesting that infections may increase relapse rate?
In 2002, the American Academy of Neurology published a summary of evidence and recommendations to provide guidance for practitioners.1 The data showed an increased risk for MS relapse during the weeks following infection.2,3 Therefore, preventing infections is beneficial for patients with MS. An analysis of studies in patients with MS who were vaccinated with inactivated vaccines (influenza, hepatitis B, tetanus) found sufficient evidence to support this practice. Studies of patients with MS who were given attenuated vaccines did not find enough evidence to support or reject these vaccines, except in the case of varicella. A study with sufficient follow-up concluded that varicella vaccination was safe for patients with MS who were not immunosuppressed. As a result of this effort, the MS Council for Clinical Practice Guidelines recommends that patients and health care providers follow the CDC’s indications for immunizations (www.cdc.gov/vaccines/schedules/hcp/adult.html).1
On the other hand, administration of the live-virus yellow fever vaccine in patients with clinically relapsing MS was correlated with an increased risk for disease progression in one study.4 The researchers followed disease progression, measured by relapses and MRI activity, in patients taking glatiramer acetate and interferon ß. Relapse rates reached 8.57 within three months after vaccination, compared to a rate of 0.67 the year prior to vaccine administration. Additionally, significant changes were seen on MRI; new or enlarging T2-weighted lesions and gadolinium-enhancing lesions were observed at three months, compared to 12 months prior and nine months after.4 Therefore, the researchers concluded that patients with MS traveling to endemic yellow fever areas should be cautioned regarding the risk for disease progression with vaccination, versus the risk for exposure to yellow fever.
Over the past decade, as newer therapies with different mechanisms of action have become available, concern has risen that patients may not respond to immunizations or may have a higher risk for infection after vaccination. For that reason, several studies have evaluated the ability of patients with MS to mount a normal antibody and cellular immune response after vaccine administration. In 2016, a study by Lin et al determined that patients who received daclizumab were able to mount a normal response after influenza vaccination.5
By contrast, Kappos et al, in a 2015 study, found that patients receiving fingolimod had lower response rates to influenza and tetanus booster vaccines than patients who took a placebo.6 Similarly, in a 2014 study, Olberg et al examined patients receiving interferon ß, glatiramer acetate, natalizumab, and mitoxantrone after receiving influenza and H1N1 vaccinations. The researchers found that those treated with any therapy other than interferon ß had a reduced rate of response and should therefore be considered for vaccine response analysis.7 Bar-Or et al also published data on response rates of patients treated with teriflunomide (7 mg or 14 mg) or interferon ß; rates were reduced with 14-mg teriflunomide compared to the other treatments—but most patients exhibited seroprotection regardless.8 Studying vaccine efficacy in 2013, McCarthy et al evaluated serum antibodies against common viruses before and after treatment with alemtuzumab and found that antibodies remained detectable six months post-alemtuzumab.9
In summary, most specialists agree that vaccines are helpful for patients with MS. However, due to the varied response rates among disease-modifying therapies and the correlation between infection and increased relapse rates, special care should be taken when treating this population. Generally, inactivated vaccines are safe, but seroprotection should be established to determine if a booster is necessary. Attenuated vaccines are generally safe for patients who are not immunosuppressed and can reduce the risk for infection if given prior to immunosuppression. After immunosuppression, attenuated vaccines should not be given until immune recovery has been established. —PP
Patricia Pagnotta, ARNP, MSN, CNRN, MSCN
Neurology Associates, PA
MS Center of Greater Orlando
1. Rutschmann OT, McCrory DC, Matchar DB. Immunization and MS: a summary of published evidence and recommendations. Neurology. 2002;59(12):1837-1843.
2. Anderson O, Lygner PE, Bergstrom T, et al. Viral infections trigger multiple sclerosis relapses: a prospective seroepidemiological study. J Neurol. 1993;240(7):417-422.
3. Panitch HS, Bever CT, Katz E, Johnson KP. Upper respiratory tract infections trigger attacks of multiple sclerosis in patients treated with interferon. J Neuroimmunol. 1991; 36:125.
4. Farez MF, Correale J. Yellow fever vaccination and increased relapse rate in travelers with multiple sclerosis. Arch Neurol. 2011;68(10):1267-1271.
5. Lin YC, Winokur P, Blake A, et al. Patients with MS under daclizumab therapy mount normal immune responses to influenza vaccine. Neurol Neuroimmunol Neuroinflamm. 2016;3(1):1-10.
6. Kappos L, Mehling M, Arroyo R, et al. Randomized trial of vaccination in fingolimod-treated patients with multiple sclerosis. Neurology. 2015;84(9):872-879.
7. Olberg HK, Cox RJ, Nostbakken JK, et al. Immunotherapies influence the influenza vaccination response in multiple sclerosis patients: an explorative study. Mult Scler. 2014;20(8):1074-1080.
8. Bar-Or A, Freedman MS, Kremenchutzky M, et al. Teriflunomide effect on immune response to influenza vaccine in patients with multiple sclerosis. Neurology. 2013;81(6):552-558.
9. McCarthy CL, Tuohy O, Compston DA, et al. Immune competence after alemtuzumab treatment of multiple sclerosis. Neurology. 2013;81(10):872-876.
Clinician Reviews in partnership with
MS Consult is edited by Colleen J. Harris, MN, NP, MSCN, Nurse Practitioner/Manager of the Multiple Sclerosis Clinic at Foothills Medical Centre in Calgary, Alberta, Canada, and Bryan Walker, MHS, PA-C, who is in the Department of Neurology, Division of MS and Neuroimmunology, at Duke University Medical Center in Durham, North Carolina. This month's responses were authored by Stephanie Agrella, MSN, RN, APRN, ANP-BC, MSCN, Director of Clinical Services at the Multiple Sclerosis Clinic of Central Texas, Round Rock, and Patricia Pagnotta, ARNP, MSN, CNRN, MSCN, who is with Neurology Associates, PA, and the MS Center of Greater Orlando.
Q) Are vaccines safe for patients with multiple sclerosis?
Vaccines are an important component of general disease prevention and are especially useful for patients with chronic illnesses, such as MS, who may be at elevated risk due to disability or medications that alter the immune system. Currently, there are many disease-modifying therapies that attempt to reduce relapses and impact the immune system, MRI activity, and disability. But is it safe for patients with MS to receive vaccines, given the multitude of studies suggesting that infections may increase relapse rate?
In 2002, the American Academy of Neurology published a summary of evidence and recommendations to provide guidance for practitioners.1 The data showed an increased risk for MS relapse during the weeks following infection.2,3 Therefore, preventing infections is beneficial for patients with MS. An analysis of studies in patients with MS who were vaccinated with inactivated vaccines (influenza, hepatitis B, tetanus) found sufficient evidence to support this practice. Studies of patients with MS who were given attenuated vaccines did not find enough evidence to support or reject these vaccines, except in the case of varicella. A study with sufficient follow-up concluded that varicella vaccination was safe for patients with MS who were not immunosuppressed. As a result of this effort, the MS Council for Clinical Practice Guidelines recommends that patients and health care providers follow the CDC’s indications for immunizations (www.cdc.gov/vaccines/schedules/hcp/adult.html).1
On the other hand, administration of the live-virus yellow fever vaccine in patients with clinically relapsing MS was correlated with an increased risk for disease progression in one study.4 The researchers followed disease progression, measured by relapses and MRI activity, in patients taking glatiramer acetate and interferon ß. Relapse rates reached 8.57 within three months after vaccination, compared to a rate of 0.67 the year prior to vaccine administration. Additionally, significant changes were seen on MRI; new or enlarging T2-weighted lesions and gadolinium-enhancing lesions were observed at three months, compared to 12 months prior and nine months after.4 Therefore, the researchers concluded that patients with MS traveling to endemic yellow fever areas should be cautioned regarding the risk for disease progression with vaccination, versus the risk for exposure to yellow fever.
Over the past decade, as newer therapies with different mechanisms of action have become available, concern has risen that patients may not respond to immunizations or may have a higher risk for infection after vaccination. For that reason, several studies have evaluated the ability of patients with MS to mount a normal antibody and cellular immune response after vaccine administration. In 2016, a study by Lin et al determined that patients who received daclizumab were able to mount a normal response after influenza vaccination.5
By contrast, Kappos et al, in a 2015 study, found that patients receiving fingolimod had lower response rates to influenza and tetanus booster vaccines than patients who took a placebo.6 Similarly, in a 2014 study, Olberg et al examined patients receiving interferon ß, glatiramer acetate, natalizumab, and mitoxantrone after receiving influenza and H1N1 vaccinations. The researchers found that those treated with any therapy other than interferon ß had a reduced rate of response and should therefore be considered for vaccine response analysis.7 Bar-Or et al also published data on response rates of patients treated with teriflunomide (7 mg or 14 mg) or interferon ß; rates were reduced with 14-mg teriflunomide compared to the other treatments—but most patients exhibited seroprotection regardless.8 Studying vaccine efficacy in 2013, McCarthy et al evaluated serum antibodies against common viruses before and after treatment with alemtuzumab and found that antibodies remained detectable six months post-alemtuzumab.9
In summary, most specialists agree that vaccines are helpful for patients with MS. However, due to the varied response rates among disease-modifying therapies and the correlation between infection and increased relapse rates, special care should be taken when treating this population. Generally, inactivated vaccines are safe, but seroprotection should be established to determine if a booster is necessary. Attenuated vaccines are generally safe for patients who are not immunosuppressed and can reduce the risk for infection if given prior to immunosuppression. After immunosuppression, attenuated vaccines should not be given until immune recovery has been established. —PP
Patricia Pagnotta, ARNP, MSN, CNRN, MSCN
Neurology Associates, PA
MS Center of Greater Orlando
1. Rutschmann OT, McCrory DC, Matchar DB. Immunization and MS: a summary of published evidence and recommendations. Neurology. 2002;59(12):1837-1843.
2. Anderson O, Lygner PE, Bergstrom T, et al. Viral infections trigger multiple sclerosis relapses: a prospective seroepidemiological study. J Neurol. 1993;240(7):417-422.
3. Panitch HS, Bever CT, Katz E, Johnson KP. Upper respiratory tract infections trigger attacks of multiple sclerosis in patients treated with interferon. J Neuroimmunol. 1991; 36:125.
4. Farez MF, Correale J. Yellow fever vaccination and increased relapse rate in travelers with multiple sclerosis. Arch Neurol. 2011;68(10):1267-1271.
5. Lin YC, Winokur P, Blake A, et al. Patients with MS under daclizumab therapy mount normal immune responses to influenza vaccine. Neurol Neuroimmunol Neuroinflamm. 2016;3(1):1-10.
6. Kappos L, Mehling M, Arroyo R, et al. Randomized trial of vaccination in fingolimod-treated patients with multiple sclerosis. Neurology. 2015;84(9):872-879.
7. Olberg HK, Cox RJ, Nostbakken JK, et al. Immunotherapies influence the influenza vaccination response in multiple sclerosis patients: an explorative study. Mult Scler. 2014;20(8):1074-1080.
8. Bar-Or A, Freedman MS, Kremenchutzky M, et al. Teriflunomide effect on immune response to influenza vaccine in patients with multiple sclerosis. Neurology. 2013;81(6):552-558.
9. McCarthy CL, Tuohy O, Compston DA, et al. Immune competence after alemtuzumab treatment of multiple sclerosis. Neurology. 2013;81(10):872-876.
Fighting Fatigue in MS
Q) Why do my patients with multiple sclerosis experience so much fatigue, and what can I do to help them?
Fatigue is an extremely common symptom of multiple sclerosis (MS) and one of the most disabling complications of the disease.1 More than 75% of patients with MS experience fatigue, which can worsen motor function, sleep quality, mood, and overall quality of life.1,2 Fatigue can also adversely affect employment; among patients with MS who reduce their work hours from full- to part-time, 90% do so because of fatigue.3
The
Patients with MS may have primary or secondary causes of fatigue. Primary fatigue is believed to result from the disease itself. Although it is not well understood, one hypothesis suggests that it is caused by an immune-related process involving inflammation and immune-mediated neurodegeneration.7 Another theory relates it to impaired nerve conduction.8
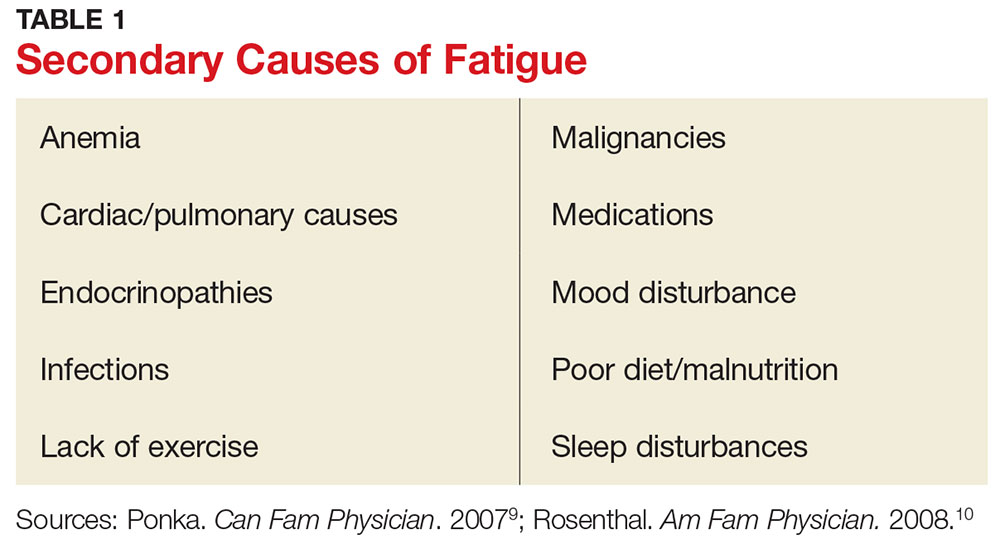
Secondary fatigue is unrelated to MS itself, and it is often treatable. Common causes include anemia, infection, or insomnia (see Table 1).9,10 These possibilities should be considered and ruled out in all patients with MS who complain of fatigue. A comprehensive history, exam, and evaluation performed by the clinician may help identify alternative reasons for fatigue.
Once any secondary causes have been addressed, primary fatigue should be evaluated and managed. One method for assessing the severity of fatigue and its impact on functional disability is to discuss it with the patient. The Fatigue Severity Scale can also be used as a measure; this self-assessment is quick, easy, and can be downloaded for free at www.saintalphonsus.org/documents/boise/sleep-Fatigue-Severity-Scale.pdf.11Identifying potential triggers of fatigue can help clinicians develop appropriate interventions. Heat intolerance is common and can precipitate or contribute to fatigue; cooling equipment can be a helpful solution (see Figure). Urinary tract infections frequently cause fatigue and can exacerbate many symptoms of MS. Bladder dysfunction and subsequent nocturnal wakening may contribute to the problem. Psychological stress is another common trigger; managing it can reduce fatigue.1,12 Screening for depression in patients with MS who complain of fatigue is imperative; if diagnosed, it must be addressed as the first line of treatment.1

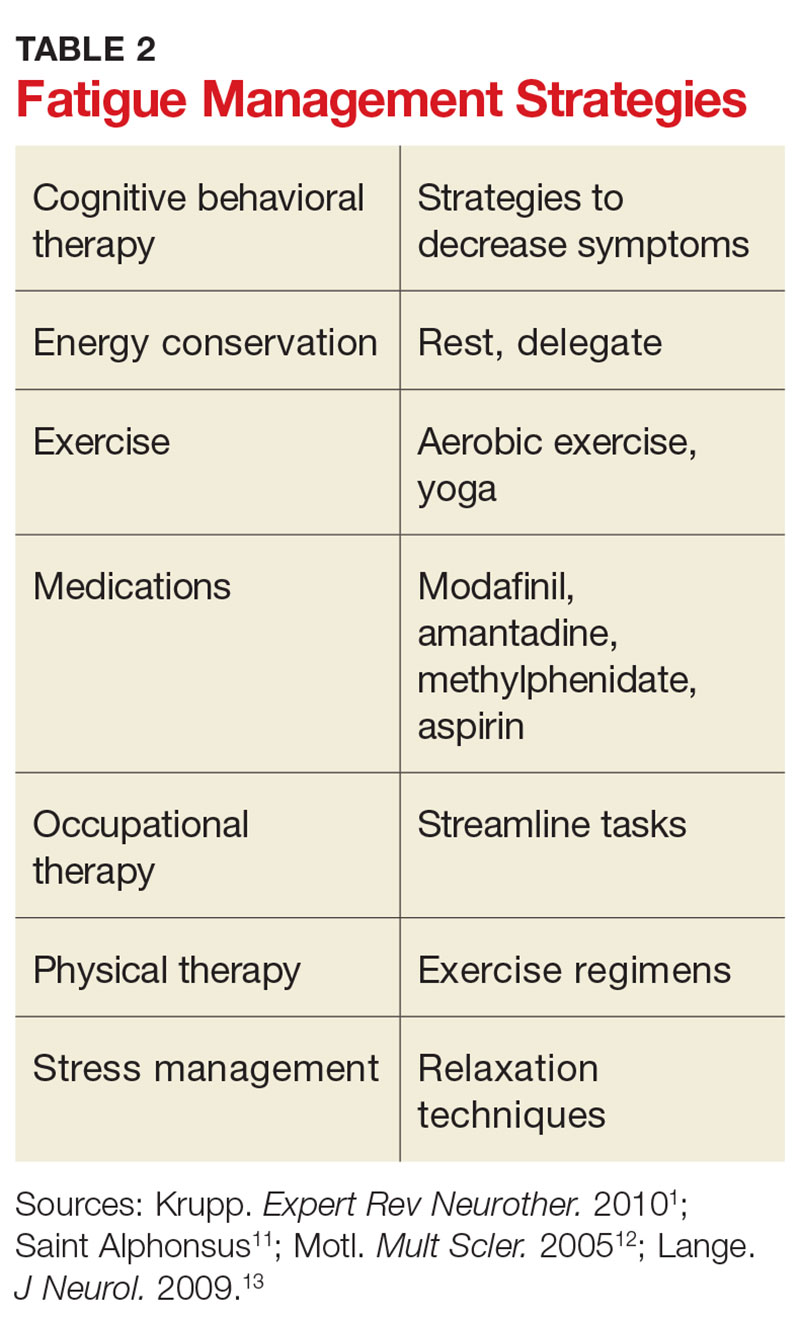
Other clinician-initiated intervention strategies include exercise, therapy, and medication. Modafinil is frequently prescribed for MS fatigue; small trials have demonstrated dramatic improvements with its use.13 Interestingly, aspirin has been shown to reduce fatigue in randomized controlled trials.14 This may be due to its indirect effects on neuroendocrine and autonomic responses, both of which are involved in the perception of fatigue.14 Additional interventions are listed in Table 2. As always, before prescribing any new medication, ensure that it is appropriate and that the patient’s other medical providers agree to the plan.
Counsel patients by emphasizing the importance of good sleep hygiene, a healthy diet, and avoidance of unhealthy habits. Taking an interdisciplinary approach can help patients with MS receive the best possible health care. While you may not be treating your patient’s disease, you will be managing much of his or her health care; treating the underlying causes of fatigue can significantly improve quality of life. —SA
Stephanie Agrella, MSN, RN, APRN, ANP-BC, MSCN
Director of Clinical Services, Multiple Scerlosis Clinic of Central Texas, Round Rock
1. Krupp B, Serafin D, Christodoulou C. Multiple sclerosis-associated fatigue. Expert Rev Neurother. 2010;10(9):1437-1447.
2. Krupp L. Fatigue is intrinsic to multiple sclerosis (MS) and is the most commonly reported symptom of the disease. Mult Scler. 2006;12(4):367-368.
3. Dennett SL, Castelli-Haley J, Oleen-Burkey MK. The impact of multiple sclerosis on patient employment: a review of the medical literature. J Health Productivity. 2007;2(2):12-18.
4. Fatigue Guidelines Development Panel of the Multiple Sclerosis Council for Clinical Practice Guidelines. Fatigue and Multiple Sclerosis: Evidence-based Management Strategies for Fatigue in Multiple Sclerosis. Washington, DC: Paralyzed Veterans of America; 1998.
5. Kalb R. Multiple Sclerosis: The Questions You Have—The Answers You Need. New York, NY: Demos; 2012.
6. Krupp LB, Alvarez LA, LaRocca NG, Scheinberg LC. Fatigue in multiple sclerosis. Arch Neurol. 1988;45(4):435-437.
7. Patejdl R, Penner IK, Noack TK, Zettl UK. Multiple sclerosis and fatigue: a review on the contribution of inflammation and immune-mediated neurodegeneration. Autoimmun Rev. 2016;15(3):210-220.
8. Davis S, Wilson T, White A, Frohman E. Thermoregulation in multiple sclerosis. J Appl Physiol. 2016;109(5):1531-1537.
9. Ponka D, Kirlew M. Top 10 differential diagnoses in family medicine: fatigue. Can Fam Physician. 2007;53(5):892.
10. Rosenthal TC, Majeroni BA, Pretorius R, Malik K. Fatigue: an overview. Am Fam Physician. 2008;78(10):1173-1179.
11. Saint Alphonsus. Fatigue severity scale. www.saintalphonsus.org/documents/boise/sleep-Fatigue-Severity-Scale.pdf. Accessed May 16, 2017.
12. Motl RW, McAuley E, Snook EM. Physical activity and multiple sclerosis: a meta-analysis. Mult Scler. 2005;11(4):459-463.
13. Lange R, Volkmer M, Heesen C, Liepert J. Modafinil effects in multiple sclerosis patients with fatigue. J Neurol. 2009; 256(4):645-650.
14. Wingerchuk DM, Benarroch EE, O’Brien PC, et al. A randomized controlled crossover trial of aspirin for fatigue in multiple sclerosis. Neurology. 2005;64(7):1267-1269.
Clinician Reviews in partnership with
MS Consult is edited by Colleen J. Harris, MN, NP, MSCN, Nurse Practitioner/Manager of the Multiple Sclerosis Clinic at Foothills Medical Centre in Calgary, Alberta, Canada, and Bryan Walker, MHS, PA-C, who is in the Department of Neurology, Division of MS and Neuroimmunology, at Duke University Medical Center in Durham, North Carolina. This month's responses were authored by Stephanie Agrella, MSN, RN, APRN, ANP-BC, MSCN, Director of Clinical Services at the Multiple Sclerosis Clinic of Central Texas, Round Rock, and Patricia Pagnotta, ARNP, MSN, CNRN, MSCN, who is with Neurology Associates, PA, and the MS Center of Greater Orlando.
Q) Why do my patients with multiple sclerosis experience so much fatigue, and what can I do to help them?
Fatigue is an extremely common symptom of multiple sclerosis (MS) and one of the most disabling complications of the disease.1 More than 75% of patients with MS experience fatigue, which can worsen motor function, sleep quality, mood, and overall quality of life.1,2 Fatigue can also adversely affect employment; among patients with MS who reduce their work hours from full- to part-time, 90% do so because of fatigue.3
The
Patients with MS may have primary or secondary causes of fatigue. Primary fatigue is believed to result from the disease itself. Although it is not well understood, one hypothesis suggests that it is caused by an immune-related process involving inflammation and immune-mediated neurodegeneration.7 Another theory relates it to impaired nerve conduction.8
Secondary fatigue is unrelated to MS itself, and it is often treatable. Common causes include anemia, infection, or insomnia (see Table 1).9,10 These possibilities should be considered and ruled out in all patients with MS who complain of fatigue. A comprehensive history, exam, and evaluation performed by the clinician may help identify alternative reasons for fatigue.
Once any secondary causes have been addressed, primary fatigue should be evaluated and managed. One method for assessing the severity of fatigue and its impact on functional disability is to discuss it with the patient. The Fatigue Severity Scale can also be used as a measure; this self-assessment is quick, easy, and can be downloaded for free at www.saintalphonsus.org/documents/boise/sleep-Fatigue-Severity-Scale.pdf.11Identifying potential triggers of fatigue can help clinicians develop appropriate interventions. Heat intolerance is common and can precipitate or contribute to fatigue; cooling equipment can be a helpful solution (see Figure). Urinary tract infections frequently cause fatigue and can exacerbate many symptoms of MS. Bladder dysfunction and subsequent nocturnal wakening may contribute to the problem. Psychological stress is another common trigger; managing it can reduce fatigue.1,12 Screening for depression in patients with MS who complain of fatigue is imperative; if diagnosed, it must be addressed as the first line of treatment.1
Other clinician-initiated intervention strategies include exercise, therapy, and medication. Modafinil is frequently prescribed for MS fatigue; small trials have demonstrated dramatic improvements with its use.13 Interestingly, aspirin has been shown to reduce fatigue in randomized controlled trials.14 This may be due to its indirect effects on neuroendocrine and autonomic responses, both of which are involved in the perception of fatigue.14 Additional interventions are listed in Table 2. As always, before prescribing any new medication, ensure that it is appropriate and that the patient’s other medical providers agree to the plan.
Counsel patients by emphasizing the importance of good sleep hygiene, a healthy diet, and avoidance of unhealthy habits. Taking an interdisciplinary approach can help patients with MS receive the best possible health care. While you may not be treating your patient’s disease, you will be managing much of his or her health care; treating the underlying causes of fatigue can significantly improve quality of life. —SA
Stephanie Agrella, MSN, RN, APRN, ANP-BC, MSCN
Director of Clinical Services, Multiple Scerlosis Clinic of Central Texas, Round Rock
1. Krupp B, Serafin D, Christodoulou C. Multiple sclerosis-associated fatigue. Expert Rev Neurother. 2010;10(9):1437-1447.
2. Krupp L. Fatigue is intrinsic to multiple sclerosis (MS) and is the most commonly reported symptom of the disease. Mult Scler. 2006;12(4):367-368.
3. Dennett SL, Castelli-Haley J, Oleen-Burkey MK. The impact of multiple sclerosis on patient employment: a review of the medical literature. J Health Productivity. 2007;2(2):12-18.
4. Fatigue Guidelines Development Panel of the Multiple Sclerosis Council for Clinical Practice Guidelines. Fatigue and Multiple Sclerosis: Evidence-based Management Strategies for Fatigue in Multiple Sclerosis. Washington, DC: Paralyzed Veterans of America; 1998.
5. Kalb R. Multiple Sclerosis: The Questions You Have—The Answers You Need. New York, NY: Demos; 2012.
6. Krupp LB, Alvarez LA, LaRocca NG, Scheinberg LC. Fatigue in multiple sclerosis. Arch Neurol. 1988;45(4):435-437.
7. Patejdl R, Penner IK, Noack TK, Zettl UK. Multiple sclerosis and fatigue: a review on the contribution of inflammation and immune-mediated neurodegeneration. Autoimmun Rev. 2016;15(3):210-220.
8. Davis S, Wilson T, White A, Frohman E. Thermoregulation in multiple sclerosis. J Appl Physiol. 2016;109(5):1531-1537.
9. Ponka D, Kirlew M. Top 10 differential diagnoses in family medicine: fatigue. Can Fam Physician. 2007;53(5):892.
10. Rosenthal TC, Majeroni BA, Pretorius R, Malik K. Fatigue: an overview. Am Fam Physician. 2008;78(10):1173-1179.
11. Saint Alphonsus. Fatigue severity scale. www.saintalphonsus.org/documents/boise/sleep-Fatigue-Severity-Scale.pdf. Accessed May 16, 2017.
12. Motl RW, McAuley E, Snook EM. Physical activity and multiple sclerosis: a meta-analysis. Mult Scler. 2005;11(4):459-463.
13. Lange R, Volkmer M, Heesen C, Liepert J. Modafinil effects in multiple sclerosis patients with fatigue. J Neurol. 2009; 256(4):645-650.
14. Wingerchuk DM, Benarroch EE, O’Brien PC, et al. A randomized controlled crossover trial of aspirin for fatigue in multiple sclerosis. Neurology. 2005;64(7):1267-1269.
Defining Pharmacy Leadership in the VA
Ashley L. Adams, PharmD. What are the key leadership attributes of pharmacy leaders?
Julie A. Groppi, PharmD. As a pharmacy leader, you have to be confident in what you do as a pharmacist and not only look at what you are doing now but what you can do in the future. You always have to look for that next apple to pick, because you have to be willing to accept change and help influence change, even though many people do not like change. As a supervisor, I ran a large and growing clinical pharmacy program. I remember many colleagues saying, “You mean, I have to do this now?” I would always try to bring the conversation around with staff to ensure that the benefit of the change or ‘what is in it for you’ was included in the approach. If you are a leader, communicating with physicians, pharmacists, or VA leadership, you just need to sell it to show why it is important and how the change will improve the process. If you don’t, then you won’t be able facilitate or sustain the momentum needed for change.
One important aspect of being a change leader is to make sure you listen (and talk) to those working in the area on a daily basis when you are going through your processes and trying to create change on what is going happen. It is important to make sure your stakeholders are involved and heard while you think about all of your potential obstacles; this is something that I always have tried to do. Also, reflecting on where you have been and what you have done will help you to think differently and is something you should do both professionally and personally. I may not need to know every aspect of the process, but I need to know the obstacles to figure out ways to prevent or break down those walls and solve those underlying issues.
Dr. Adams. What are some of the challenges and opportunities you have found in pharmacy leadership
Dr. Groppi. I think the challenges [are related to] the sheer volume of work that is out there. Having the ability to be able to separate and think about where you want your team to go is the challenge of any leader. When you are right in the middle of it, you tend to focus on the task at hand to get the work done. One week, it is pain management, and then the next week it is hepatitis C, and then it’s assessing acute care services, then gaps or problems somewhere else. There are always different obstacles and different initiatives (pressures) coming at you. You have to not lose your sense of where you want to go. Often, many people cannot stop and look at the whole picture.
I joined the Clinical Pharmacy Practice office in 2011, and one of the first things we were challenged with when the office started was to write guidelines, create policies, and develop tools that would help guide the practice. However, when we started sending out resources to the field, many people were too busy with what was going on at their local facility to focus on what we had developed, so we had to step back. We brainstormed some ideas and looked at our peers in other offices who had demonstrated success. When we started discussing pharmacist scope of practice agreements, I looked at nursing service and their movement related to scope of practice and how it had impacted change in the profession over the past several years.
Nursing has great infrastructure and support for its program. They created many different types of clinical practice councils within nursing, and they were able to institute a lot of changes and spread their initiatives. We thought, “Why don’t we do this for clinical pharmacy?” So we started doing more outreach to the different sites and had discussions with our advisory board, which resulted in the development of the National Clinical Pharmacy Practice Council (NCPPC). We promoted facility and VISN councils to start talking about practice issues and regularly discussing our initiatives as a part of teleconferences, so we could gain support and keep the momentum. Now the NCPPC has grown and everyone is excited about what is happening. It is having a multipronged effect to impact clinical practice.
Dr. Adams. When you are starting on a new project, how do you and your fellow coworkers decide which one is the best to pursue?
Dr. Groppi. We just do them all—I’m joking... sometimes it feels that way. It’s really hard. There are a lot of different things happening at once and many competing priorities, so we try to do as many things as possible. We will assist with requests that come through the Central Office or questions coming from other program offices related to clinical pharmacy practice and we try to get involved and help support and share the success stories of our pharmacist roles as much as possible. For example, the National Nephrology Office contacted us, about the anticoagulation directive. They wanted to do something similar for nephrology since so many pharmacists were effectively and safely managing erythropoietin stimulating agents. This started a conversation.
Often, the priorities come from patient demand such as in primary care. When VA was implementing patient aligned care teams (PACTs), PBM had to ensure that we had conversations ready to describe clinical pharmacy practice in this area. The same thing occurred with hepatitis C. There were new drugs approved and roles for pharmacists, and often there were not enough providers to care for patients. It became an opportunity.
Frequently, choices are based on what we think will be the largest yield and the biggest gaps in care. Other times, it is based on national priorities. We look at the strategic plan for VA and develop our initiatives accordingly. What’s a new priority or component of the strategic plan for this year? What’s the plan for next year or moving forward? Telepharmacy a few years ago or telehealth is an example. We were making sure to describe our practice in the area and then set goals that are going to sustain the profession.
We focused on PACTs during the first few years as we had hundreds of pharmacists practicing. The next big area was specialty and acute care. We started leading workgroups and focused on policies and guidance to share strong practices. The past several years the focus has been on pain management because everyone is struggling with the number of veterans on opioids. When there is a big crisis, you have to hit it full force and look for opportunities that exist. Antimicrobial stewardship was another great example where we were able to provide help and describe the important role of pharmacists based on the strong practices we have across VA. Many times prioritization is on demand, but always keeping in mind what is happening around you and how it supports our VHA strategic plan.
Dr. Adams. What would be your main advice for future pharmacy leaders? Just taking those opportunities and going with them?
Dr. Groppi. Yes. Look for the spot where you might be able to make a positive im
Which Diet for Type 2 Diabetes?
Prescribed diets can be trying for both patients and providers; patients often struggle to adhere to them, and providers must determine which plan is suitable for which patient. The optimal diet for patients with diabetes—and whether it is sustainable—remains controversial.
A plant-based diet high in polyunsaturated and monounsaturated fats, with limited saturated fat and avoidance of trans-fatty acids, is supported by the American Association of Clinical Endocrinologists. Caloric restriction is recommended when weight loss is appropriate.1 The American Diabetes Association (ADA) recommends a Mediterranean-style diet rich in monounsaturated fats with carbohydrates from whole grains, vegetables, fruits, legumes, and dairy products, and an emphasis on foods higher in fiber and lower in glycemic load.2
Additionally, the ADA, the American Association of Diabetes Educators, and the Academy of Nutrition and Dietetics advise that all individuals with diabetes receive individualized Medical Nutrition Therapy (MNT), preferably with a registered dietitian nutritionist (RDN) knowledgeable and skilled in providing diabetes-specific nutrition education. MNT delivered by an RDN has been shown to reduce A1C levels by up to 2% in people with type 2 diabetes (T2DM).3
This flexibility in recommendations creates uncertainty about the correct dietary choice. Several diet plans are endorsed for the management of diabetes, including Mediterranean, low carbohydrate, Paleolithic, vegan, high fiber, and glycemic index (GI). Which should your patients adhere to? Several randomized controlled trials (RCTs), meta-analyses, and literature reviews have examined and compared the benefits of these eating habits for management of diabetes.
MEDITERRANEAN
The Mediterranean diet incorporates plant foods such as greens, tomatoes, onions, garlic, herbs, whole grains, legumes, nuts, and olive oil as the primary source of fat. A crossover trial of adults with T2DM demonstrated a statistically significant A1C reduction (from 7.1% to 6.8%) after 12 weeks on the Mediterranean diet.4
In a systematic review of 20 RCTs, Ajala et al analyzed data for nearly 3,500 patients with T2DM who adhered to either a low-carbohydrate, vegetarian, vegan, low-GI, high-fiber, Mediterranean, or high-protein diet for at least six months. The researchers found that Mediterranean, low-carbohydrate, low-GI, and high-protein diets all led to A1C reductions—but the largest reduction was observed with patients on the Mediterranean diet. Low-carbohydrate and Mediterranean diets resulted in the most weight loss.5
LOW-CARBOHYDRATE
Low-carbohydrate diets have decreased in popularity due to concerns about their effects on renal function, possible lack of nutrients, and speculation that their macronutrient composition may have effects on weight beyond those explained by caloric deficit. A meta-analysis of 13 studies of adults with T2DM following a low-carbohydrate diet (≤ 45% of calories from carbohydrates) demonstrated beneficial effects on fasting glucose, A1C, and triglyceride levels. Nine of the studies evaluated glycemic control and found A1C reduction with lower carbohydrate diets; the greatest reductions in A1C and triglycerides were correlated with the lowest carbohydrate intakes. No significant effects were seen for total, HDL, or LDL cholesterol.6
In the literature review by Ajala et al, low-carbohydrate, low-GI, and Mediterranean diets all improved lipid profiles. HDL cholesterol increased the most with a low-carbohydrate diet.5
A two-week study of 10 adults with T2DM found that just one week on a low-carbohydrate diet decreased the average 24-h plasma glucose from 135 mg/dL to 113 mg/dL. Over the two-week study period, triglycerides decreased by 35%, cholesterol by 10%, and A1C by 0.5%. Patients were allowed to consume as much protein and fat as desired. Food sources included beef and ground turkey patties, chicken breasts, turkey, ham, steamed vegetables, butter, diet gelatin, and a limited amount of cheese. Mean calorie intake decreased from 3,111 to 2,164 calories/d. Carbohydrate intake decreased from 300 to 20 g/d. Weight loss was entirely explained by the mean energy deficit.6 Patients experienced no difference in hunger, satisfaction, or energy level with a low-carb diet compared to their usual diet.7
A literature review of six studies examined the effects of low-carb diets (between 20-95 g/d) on body weight and A1C in patients with T2DM. Three of the studies restricted carbohydrate intake to less than 50 g/d. All reported reductions in body weight and A1C. In two studies, the majority of the weight loss was explained by a decrease in body fat, not loss of water weight. No deleterious effects on cardiovascular disease risk, renal function, or nutritional intake were seen. The researchers concluded that low-carb diets are safe and effective over the short term for people with T2DM.8
PALEOLITHIC
The Paleolithic diet (also referred to as the caveman diet, Stone Age diet, and hunter-gatherer diet) involves eating foods believed to have been available to humans before agriculture—this period began about 2.5 million years ago and ended about 100,000 years ago. Food sources include wild animal meat (lean meat and fish) and uncultivated plant foods (vegetables, fruits, roots, eggs, and nuts). It excludes grains, legumes, dairy products, salt, refined sugar, and processed oils.
In a randomized crossover study of 13 participants with T2DM, the Paleolithic diet improved glucose control and several cardiovascular disease markers, compared to a standard diabetes diet. The Paleolithic diet resulted in significantly lower A1C, triglycerides, diastolic blood pressure, body weight, BMI, and waist circumference, as well as increased HDL. Despite receiving no instruction to restrict calories, patients on the Paleolithic diet consumed fewer calories and carbohydrates, and more protein and fat, than those on the standard diabetes diet. The caloric deficit accounted almost exactly for the observed difference in weight loss between the two groups.9
GLYCEMIC INDEX
The GI measures the blood glucose level increase in the two hours after eating a particular food, with 100 representing the effect of glucose consumption. Low-GI food sources include beans, peas, lentils, pasta, pumpernickel bread, bulgur, parboiled rice, barley, and oats, while high-GI foods include potatoes, wheat flour, white bread, most breakfast cereals, and rice.
A meta-analysis compared the effects of high- and low-GI diets on glycemic control in 356 patients with diabetes. Ten of 14 studies documented improvements in A1C and postprandial plasma glucose with lower GI diets. Low-GI diets reduced A1C by 0.43% after an average duration of 10 weeks. The average GI was 83 for high-GI diets and 65 for low-GI diets. The researchers concluded that selecting low-GI foods has a small but clinically relevant effect on medium-term glycemic control, similar to that offered by medications that target postprandial blood glucose excursions.10
Low-GI diets resulted in lower A1C and higher HDL but no significant change in weight, according to Ajala et al.5
HIGH-FIBER
A survey of 15 studies examined the relationship between fiber intake and glycemic control. Interventions ranged from an additional 4 to 40 g of fiber per day, with a mean increase of 18.3 g/d. Additional fiber lowered A1C by 0.26% in 3 to 12 weeks, compared to placebo. The overall mean fasting blood glucose reduction was 15.32 mg/dL. No study lasted more than 12 weeks, but it is inferred that a longer study could result in a greater A1C reduction. Current dietary guidelines for patients with diabetes exceed the amount of fiber included in most of these studies.11
VEGAN
Ajala et al observed that patients on a vegan diet had lower total cholesterol, LDL, and A1C levels, compared to those on a low-fat diet. At 18 months, the vegetarian diet demonstrated improvement in glucose control and lipids, but not weight loss.5
In one RCT, a low-fat vegan diet was shown to improve glycemic control and lipid levels more than a conventional diabetes diet did. A1C decreased by 1.23% over 22 weeks, compared to 0.38% in the conventional diet group. Body weight decreased by 6.5 kg and LDL cholesterol decreased by 21.2% with the vegan diet, compared with a weight loss of 3.1 kg and a 10.7% LDL reduction in the conventional diet group.12
Patients on the vegan diet derived energy primarily from carbohydrates (75%), protein (15%), and fat (10%) by eating fruits, vegetables, grains, and legumes. Portion size and caloric and carbohydrate intake were not restricted. The conventional diet involved a caloric intake mainly from a combination of carbohydrates and monounsaturated fats (60% to 70%), protein (15% to 20%), and saturated fat (< 7%). The diet was individualized based on caloric needs and participants’ lipid levels. All participants were given calorie intake deficits of 500 to 1000 kcal/d.13 Participants rated both diets as satisfactory, with no significant differences between groups. The researchers concluded that a low-fat vegan diet has acceptability similar to that of a more conventional diabetes diet.12
CONCLUSION
Diabetes management strategies may incorporate a variety of dietary plans. While study populations are small and study durations relatively short, the aforementioned diets show improvement in biochemical markers such as fasting glucose, A1C, and lipid levels. The Mediterranean diet is believed to be sustainable over the long term, given the duration of time that people in the region have survived on it. Low-carbohydrate diets, including the Atkins and Paleolithic diets, are very effective at lowering A1C and triglycerides. Vegetarian/vegan diets may be more acceptable to patients than previously thought.
The long-term impact of any eating pattern will likely relate to adherence; adherence is more likely when patients find a diet to be acceptable, palatable, and easy to prepare. Diet selection should incorporate patient preferences and lifestyle choices, and when possible, should involve an RDN with expertise in diabetes.
1. American Association of Clinical Endocrinologists; American College of Endocrinology. Consensus statement by the American Association of Clinical Endocrinologists and American College of Endocrinology on the comprehensive type 2 diabetes management algorithm. Endocr Pract. 2016;22(1):84-113.
2. American Diabetes Association. Standards of medical care in diabetes—2016. Clin Diabetes. 2016;34(1):3-21.
3. Powers MA, Bardsley J, Cypress M, et al. Diabetes self-management education and support in type 2 diabetes: a joint position statement of the American Diabetes Association, the American Association of Diabetes Educators, and the Academy of Nutrition. J Acad Nutr Diet. 2015:115(8):1323-1334.
4. Itsiopoulos C, Brazionis L, Kaimakamis M, et al. Can the Mediterranean diet lower HbA1c in type 2 diabetes? Results from a randomized cross-over study. Nutr Metab Cardiovasc Dis. 2011;21(9):740-747.
5. Ajala O, English P, Pinkney J. Systematic review and meta-analysis of different dietary approaches to the management of type 2 diabetes. Am J Clin Nutr. 2013;97(3):505-516.
6. Boden G, Sargrad K, Homko C, et al. Effect of a low-carbohydrate diet on appetite, blood glucose levels, and insulin resistance in obese patients with type 2 diabetes. Ann Intern Med. 2005;142(6):403-411.
7. Kirk JK, Graves DE, Craven TE, et al. Restricted-carbohydrate diets in patients with type 2 diabetes: a meta-analysis. J Am Diet Assoc. 2008;108(1):91-100.
8. Dyson PA. A review of low and reduced carbohydrate diets and weight loss in type 2 diabetes. J Hum Nutr Diet. 2008;21(6):530-538.
9. Jönsson T, Granfeldt Y, Ahrén B, et al. Beneficial effects of a Paleolithic diet on cardiovascular risk factors in type 2 diabetes: a randomized cross-over pilot study. Cardiovasc Diabetol. 2009;8:35.
10. Brand-Miller J, Hayne S, Petocz P, et al. Low-glycemic index diets in the management of diabetes: a meta-analysis of randomized controlled trials. Diabetes Care. 2003;26(8):2261-2267.
11. Post RE, Mainous AG III, King DE, Simpson KN. Dietary fiber for the treatment of type 2 diabetes mellitus: a meta-analysis. J Am Board Fam Med. 2012;25(1):16-23.
12. Barnard ND, Gloede L, Cohen J, et al. A low-fat vegan diet elicits greater macronutrient changes, but is comparable in adherence and acceptability, compared with a more conventional diabetes diet among individuals with type 2 diabetes. J Am Diet Assoc. 2009;109(2):263-272.
13. Barnard ND, Cohen J, Jenkins DJA, et al. A low-fat vegan diet and a conventional diabetes diet in the treatment of type 2 diabetes: a randomized, controlled, 74-week clinical trial. Am J Clin Nutr. 2009;89(5):1588S-1596S.
Clinician Reviews in partnership with
Karen Beer practices at the Oregon Medical Group in Eugene.
Clinician Reviews in partnership with
Karen Beer practices at the Oregon Medical Group in Eugene.
Clinician Reviews in partnership with
Karen Beer practices at the Oregon Medical Group in Eugene.
Prescribed diets can be trying for both patients and providers; patients often struggle to adhere to them, and providers must determine which plan is suitable for which patient. The optimal diet for patients with diabetes—and whether it is sustainable—remains controversial.
A plant-based diet high in polyunsaturated and monounsaturated fats, with limited saturated fat and avoidance of trans-fatty acids, is supported by the American Association of Clinical Endocrinologists. Caloric restriction is recommended when weight loss is appropriate.1 The American Diabetes Association (ADA) recommends a Mediterranean-style diet rich in monounsaturated fats with carbohydrates from whole grains, vegetables, fruits, legumes, and dairy products, and an emphasis on foods higher in fiber and lower in glycemic load.2
Additionally, the ADA, the American Association of Diabetes Educators, and the Academy of Nutrition and Dietetics advise that all individuals with diabetes receive individualized Medical Nutrition Therapy (MNT), preferably with a registered dietitian nutritionist (RDN) knowledgeable and skilled in providing diabetes-specific nutrition education. MNT delivered by an RDN has been shown to reduce A1C levels by up to 2% in people with type 2 diabetes (T2DM).3
This flexibility in recommendations creates uncertainty about the correct dietary choice. Several diet plans are endorsed for the management of diabetes, including Mediterranean, low carbohydrate, Paleolithic, vegan, high fiber, and glycemic index (GI). Which should your patients adhere to? Several randomized controlled trials (RCTs), meta-analyses, and literature reviews have examined and compared the benefits of these eating habits for management of diabetes.
MEDITERRANEAN
The Mediterranean diet incorporates plant foods such as greens, tomatoes, onions, garlic, herbs, whole grains, legumes, nuts, and olive oil as the primary source of fat. A crossover trial of adults with T2DM demonstrated a statistically significant A1C reduction (from 7.1% to 6.8%) after 12 weeks on the Mediterranean diet.4
In a systematic review of 20 RCTs, Ajala et al analyzed data for nearly 3,500 patients with T2DM who adhered to either a low-carbohydrate, vegetarian, vegan, low-GI, high-fiber, Mediterranean, or high-protein diet for at least six months. The researchers found that Mediterranean, low-carbohydrate, low-GI, and high-protein diets all led to A1C reductions—but the largest reduction was observed with patients on the Mediterranean diet. Low-carbohydrate and Mediterranean diets resulted in the most weight loss.5
LOW-CARBOHYDRATE
Low-carbohydrate diets have decreased in popularity due to concerns about their effects on renal function, possible lack of nutrients, and speculation that their macronutrient composition may have effects on weight beyond those explained by caloric deficit. A meta-analysis of 13 studies of adults with T2DM following a low-carbohydrate diet (≤ 45% of calories from carbohydrates) demonstrated beneficial effects on fasting glucose, A1C, and triglyceride levels. Nine of the studies evaluated glycemic control and found A1C reduction with lower carbohydrate diets; the greatest reductions in A1C and triglycerides were correlated with the lowest carbohydrate intakes. No significant effects were seen for total, HDL, or LDL cholesterol.6
In the literature review by Ajala et al, low-carbohydrate, low-GI, and Mediterranean diets all improved lipid profiles. HDL cholesterol increased the most with a low-carbohydrate diet.5
A two-week study of 10 adults with T2DM found that just one week on a low-carbohydrate diet decreased the average 24-h plasma glucose from 135 mg/dL to 113 mg/dL. Over the two-week study period, triglycerides decreased by 35%, cholesterol by 10%, and A1C by 0.5%. Patients were allowed to consume as much protein and fat as desired. Food sources included beef and ground turkey patties, chicken breasts, turkey, ham, steamed vegetables, butter, diet gelatin, and a limited amount of cheese. Mean calorie intake decreased from 3,111 to 2,164 calories/d. Carbohydrate intake decreased from 300 to 20 g/d. Weight loss was entirely explained by the mean energy deficit.6 Patients experienced no difference in hunger, satisfaction, or energy level with a low-carb diet compared to their usual diet.7
A literature review of six studies examined the effects of low-carb diets (between 20-95 g/d) on body weight and A1C in patients with T2DM. Three of the studies restricted carbohydrate intake to less than 50 g/d. All reported reductions in body weight and A1C. In two studies, the majority of the weight loss was explained by a decrease in body fat, not loss of water weight. No deleterious effects on cardiovascular disease risk, renal function, or nutritional intake were seen. The researchers concluded that low-carb diets are safe and effective over the short term for people with T2DM.8
PALEOLITHIC
The Paleolithic diet (also referred to as the caveman diet, Stone Age diet, and hunter-gatherer diet) involves eating foods believed to have been available to humans before agriculture—this period began about 2.5 million years ago and ended about 100,000 years ago. Food sources include wild animal meat (lean meat and fish) and uncultivated plant foods (vegetables, fruits, roots, eggs, and nuts). It excludes grains, legumes, dairy products, salt, refined sugar, and processed oils.
In a randomized crossover study of 13 participants with T2DM, the Paleolithic diet improved glucose control and several cardiovascular disease markers, compared to a standard diabetes diet. The Paleolithic diet resulted in significantly lower A1C, triglycerides, diastolic blood pressure, body weight, BMI, and waist circumference, as well as increased HDL. Despite receiving no instruction to restrict calories, patients on the Paleolithic diet consumed fewer calories and carbohydrates, and more protein and fat, than those on the standard diabetes diet. The caloric deficit accounted almost exactly for the observed difference in weight loss between the two groups.9
GLYCEMIC INDEX
The GI measures the blood glucose level increase in the two hours after eating a particular food, with 100 representing the effect of glucose consumption. Low-GI food sources include beans, peas, lentils, pasta, pumpernickel bread, bulgur, parboiled rice, barley, and oats, while high-GI foods include potatoes, wheat flour, white bread, most breakfast cereals, and rice.
A meta-analysis compared the effects of high- and low-GI diets on glycemic control in 356 patients with diabetes. Ten of 14 studies documented improvements in A1C and postprandial plasma glucose with lower GI diets. Low-GI diets reduced A1C by 0.43% after an average duration of 10 weeks. The average GI was 83 for high-GI diets and 65 for low-GI diets. The researchers concluded that selecting low-GI foods has a small but clinically relevant effect on medium-term glycemic control, similar to that offered by medications that target postprandial blood glucose excursions.10
Low-GI diets resulted in lower A1C and higher HDL but no significant change in weight, according to Ajala et al.5
HIGH-FIBER
A survey of 15 studies examined the relationship between fiber intake and glycemic control. Interventions ranged from an additional 4 to 40 g of fiber per day, with a mean increase of 18.3 g/d. Additional fiber lowered A1C by 0.26% in 3 to 12 weeks, compared to placebo. The overall mean fasting blood glucose reduction was 15.32 mg/dL. No study lasted more than 12 weeks, but it is inferred that a longer study could result in a greater A1C reduction. Current dietary guidelines for patients with diabetes exceed the amount of fiber included in most of these studies.11
VEGAN
Ajala et al observed that patients on a vegan diet had lower total cholesterol, LDL, and A1C levels, compared to those on a low-fat diet. At 18 months, the vegetarian diet demonstrated improvement in glucose control and lipids, but not weight loss.5
In one RCT, a low-fat vegan diet was shown to improve glycemic control and lipid levels more than a conventional diabetes diet did. A1C decreased by 1.23% over 22 weeks, compared to 0.38% in the conventional diet group. Body weight decreased by 6.5 kg and LDL cholesterol decreased by 21.2% with the vegan diet, compared with a weight loss of 3.1 kg and a 10.7% LDL reduction in the conventional diet group.12
Patients on the vegan diet derived energy primarily from carbohydrates (75%), protein (15%), and fat (10%) by eating fruits, vegetables, grains, and legumes. Portion size and caloric and carbohydrate intake were not restricted. The conventional diet involved a caloric intake mainly from a combination of carbohydrates and monounsaturated fats (60% to 70%), protein (15% to 20%), and saturated fat (< 7%). The diet was individualized based on caloric needs and participants’ lipid levels. All participants were given calorie intake deficits of 500 to 1000 kcal/d.13 Participants rated both diets as satisfactory, with no significant differences between groups. The researchers concluded that a low-fat vegan diet has acceptability similar to that of a more conventional diabetes diet.12
CONCLUSION
Diabetes management strategies may incorporate a variety of dietary plans. While study populations are small and study durations relatively short, the aforementioned diets show improvement in biochemical markers such as fasting glucose, A1C, and lipid levels. The Mediterranean diet is believed to be sustainable over the long term, given the duration of time that people in the region have survived on it. Low-carbohydrate diets, including the Atkins and Paleolithic diets, are very effective at lowering A1C and triglycerides. Vegetarian/vegan diets may be more acceptable to patients than previously thought.
The long-term impact of any eating pattern will likely relate to adherence; adherence is more likely when patients find a diet to be acceptable, palatable, and easy to prepare. Diet selection should incorporate patient preferences and lifestyle choices, and when possible, should involve an RDN with expertise in diabetes.
1. American Association of Clinical Endocrinologists; American College of Endocrinology. Consensus statement by the American Association of Clinical Endocrinologists and American College of Endocrinology on the comprehensive type 2 diabetes management algorithm. Endocr Pract. 2016;22(1):84-113.
2. American Diabetes Association. Standards of medical care in diabetes—2016. Clin Diabetes. 2016;34(1):3-21.
3. Powers MA, Bardsley J, Cypress M, et al. Diabetes self-management education and support in type 2 diabetes: a joint position statement of the American Diabetes Association, the American Association of Diabetes Educators, and the Academy of Nutrition. J Acad Nutr Diet. 2015:115(8):1323-1334.
4. Itsiopoulos C, Brazionis L, Kaimakamis M, et al. Can the Mediterranean diet lower HbA1c in type 2 diabetes? Results from a randomized cross-over study. Nutr Metab Cardiovasc Dis. 2011;21(9):740-747.
5. Ajala O, English P, Pinkney J. Systematic review and meta-analysis of different dietary approaches to the management of type 2 diabetes. Am J Clin Nutr. 2013;97(3):505-516.
6. Boden G, Sargrad K, Homko C, et al. Effect of a low-carbohydrate diet on appetite, blood glucose levels, and insulin resistance in obese patients with type 2 diabetes. Ann Intern Med. 2005;142(6):403-411.
7. Kirk JK, Graves DE, Craven TE, et al. Restricted-carbohydrate diets in patients with type 2 diabetes: a meta-analysis. J Am Diet Assoc. 2008;108(1):91-100.
8. Dyson PA. A review of low and reduced carbohydrate diets and weight loss in type 2 diabetes. J Hum Nutr Diet. 2008;21(6):530-538.
9. Jönsson T, Granfeldt Y, Ahrén B, et al. Beneficial effects of a Paleolithic diet on cardiovascular risk factors in type 2 diabetes: a randomized cross-over pilot study. Cardiovasc Diabetol. 2009;8:35.
10. Brand-Miller J, Hayne S, Petocz P, et al. Low-glycemic index diets in the management of diabetes: a meta-analysis of randomized controlled trials. Diabetes Care. 2003;26(8):2261-2267.
11. Post RE, Mainous AG III, King DE, Simpson KN. Dietary fiber for the treatment of type 2 diabetes mellitus: a meta-analysis. J Am Board Fam Med. 2012;25(1):16-23.
12. Barnard ND, Gloede L, Cohen J, et al. A low-fat vegan diet elicits greater macronutrient changes, but is comparable in adherence and acceptability, compared with a more conventional diabetes diet among individuals with type 2 diabetes. J Am Diet Assoc. 2009;109(2):263-272.
13. Barnard ND, Cohen J, Jenkins DJA, et al. A low-fat vegan diet and a conventional diabetes diet in the treatment of type 2 diabetes: a randomized, controlled, 74-week clinical trial. Am J Clin Nutr. 2009;89(5):1588S-1596S.
When to Discontinue RAAS Therapy in CKD Patients
Q) A speaker at a meeting I attended said that ACEis/ARBs can be used in all stages of CKD. But locally, our nephrologists discontinue use when the GFR falls below 20 mL/min. Who is correct?
Definitive data on whether to continue use of ACE inhibitors (ACEis) and angiotensin-II receptor blockers (ARBs) in patients with chronic kidney disease (CKD) is lacking.¹ At this time, it is difficult to prove that the renoprotective effects of renin-angiotensin-aldosterone system (RAAS) inhibitors are separate from their antihypertensive effects. Few studies have investigated the effects of RAAS therapy on patients with advanced CKD at baseline (CKD stage 4 or 5; glomerular filtration rate [GFR], < 30 mL/min).2
ACEis and ARBs are indicated for use in CKD patients with hypertension, proteinuria/albuminuria, heart failure with reduced ejection fraction, and left ventricle dysfunction post–myocardial infarction.3 While these medications are the main pharmacologic therapy for reducing albuminuria in CKD patients, they increase serum creatinine by 20% to 30% and thereby decrease GFR.2,4
The decision to continue or discontinue ACEi/ARB use when patients reach CKD stage 4 or 5 is controversial. On one hand, risks associated with continuation include hyperkalemia, metabolic acidosis, and possible reduction in GFR. The decision to discontinue these medications may result in increased GFR, improved kidney function, and delayed onset of kidney failure or need for dialysis.3,4 In a 2011 study examining outcomes in patients with stage 4 CKD two years after stopping their ACEis/ARBs, the researchers found that patients who were alive without renal replacement therapy were hypertensive but had the highest GFRs.3
On the other hand, ACEis/ARBs have been shown to reduce incidence of cardiovascular disease (CVD) in patients without CKD. It is widely known that patients with CKD have increased risk for CVD, though there is little data examining the effects of RAAS inhibitors on CVD in this population.¹ A recent study found a reduced risk for fatal CVD in peritoneal dialysis patients treated with ACEis.5 Another study reported improved renal outcomes in nondiabetic patients with advanced CKD who were treated with ACEis.6 The National Kidney Foundation/Kidney Disease Outcomes Quality Initiative Clinical Practice Guidelines on Hypertension currently state that with careful monitoring, most patients with advanced CKD can continue taking ACEis/ARBs.7
More studies are needed to confidently close this controversial debate. Fortunately, the STOP-ACEi study, a three-year trial that began in 2014 in the UK, is examining the effects of ACEi/ARB use in patients with advanced CKD. It aims to determine whether discontinuation of ACEis/ARBs in these patients can help to stabilize or improve renal function, compared to continued use. By maintaining good blood pressure control in these patients, the researchers hope to distinguish the antihypertensive effects from other potential benefits of the RAAS inhibitors.2 The results of this trial may provide additional clarity for making decisions about ACEi/ARB treatment in our patients with advanced CKD. —RVR, SMR
Rebecca V. Rokosky, MSN, APRN, FNP-BC
Sub Investigator in the Clinical Advancement Center, PPLC, San Antonio, Texas
Shannon M. Rice, MS, PA-C
Division of Nephrology and Hypertension, Department of Medicine, University of California, San Diego
1. Ahmed A, Jorna T, Bhandari S. Should we STOP angiotensin converting enzyme inhibitors/angiotensin receptor blockers in advanced kidney disease? Nephron. 2016; 133(3):147-158.
2. Bhandari S, Ives N, Brettell EA, et al. Multicentre randomized controlled trial of angiotensin-converting enzyme inhibitor/angiotensin receptor blocker withdrawal in advanced renal disease: the STOP-ACEi trial. Nephrol Dial Transplant. 2016; 31(2):255-261.
3. Gonclaves A, Khwaja A, Ahmed A, et al. Stopping renin-angiotensin system inhibitors in chronic kidney disease: predictors of response. Nephron Clin Pract. 2011;119(4):348-354.
4. Zuber K, Gilmartin C, Davis J. Managing hypertension in patients with chronic kidney disease. JAAPA. 2014;27(9):37-46.
5. Shen JI, Saxena AB, Montez-Rath ME, et al. Angiotensin-converting enzyme inhibitor/angiotensin receptor blocker use and cardiovascular outcomes in patients initiating peritoneal dialysis. Nephrol Dial Transplant. 2016 Apr 13. [Epub ahead of print]
6. Hou F, Zhang X, Zhang GH, et al. Efficacy and safety of benazepril for advanced chronic renal insufficiency. N Engl J Med. 2006;354(2):131-140.
7. Kidney Disease Outcomes Quality Initiative (K/DOQI). K/DOQI clinical practice guidelines on hypertension and antihypertensive agents in chronic kidney disease. Am J Kidney Dis. 2004;43(5 suppl 1):S1-S290.
Clinician Reviews in partnership with
Renal Consult is edited by Jane S. Davis, CRNP, DNP, a member of the Clinician Reviews editorial board, who is a nurse practitioner in the Division of Nephrology at the University of Alabama at Birmingham and is the communications chairperson for the National Kidney Foundation’s Council of Advanced Practitioners (NKF-CAP); and Kim Zuber, PA-C, MSPS, DFAAPA, a semi-retired PA who works with the American Academy of Nephrology PAs and is a past chair of the NKF-CAP. This month’s responses were authored by Cynthia Smith, DNP, CNN-NP, APRN, FNP-BC, who practices at Renal Consultants, PLLC, in South Charleston, West Virginia, Rebecca V. Rokosky, MSN, APRN, FNP-BC, who is Sub Investigator in the Clinical Advancement Center, PPLC, in San Antonio, Texas, and Shannon M. Rice, MS, PA-C, who is in the Division of Nephrology and Hypertension, Department of Medicine, at the University of California, San Diego.
Q) A speaker at a meeting I attended said that ACEis/ARBs can be used in all stages of CKD. But locally, our nephrologists discontinue use when the GFR falls below 20 mL/min. Who is correct?
Definitive data on whether to continue use of ACE inhibitors (ACEis) and angiotensin-II receptor blockers (ARBs) in patients with chronic kidney disease (CKD) is lacking.¹ At this time, it is difficult to prove that the renoprotective effects of renin-angiotensin-aldosterone system (RAAS) inhibitors are separate from their antihypertensive effects. Few studies have investigated the effects of RAAS therapy on patients with advanced CKD at baseline (CKD stage 4 or 5; glomerular filtration rate [GFR], < 30 mL/min).2
ACEis and ARBs are indicated for use in CKD patients with hypertension, proteinuria/albuminuria, heart failure with reduced ejection fraction, and left ventricle dysfunction post–myocardial infarction.3 While these medications are the main pharmacologic therapy for reducing albuminuria in CKD patients, they increase serum creatinine by 20% to 30% and thereby decrease GFR.2,4
The decision to continue or discontinue ACEi/ARB use when patients reach CKD stage 4 or 5 is controversial. On one hand, risks associated with continuation include hyperkalemia, metabolic acidosis, and possible reduction in GFR. The decision to discontinue these medications may result in increased GFR, improved kidney function, and delayed onset of kidney failure or need for dialysis.3,4 In a 2011 study examining outcomes in patients with stage 4 CKD two years after stopping their ACEis/ARBs, the researchers found that patients who were alive without renal replacement therapy were hypertensive but had the highest GFRs.3
On the other hand, ACEis/ARBs have been shown to reduce incidence of cardiovascular disease (CVD) in patients without CKD. It is widely known that patients with CKD have increased risk for CVD, though there is little data examining the effects of RAAS inhibitors on CVD in this population.¹ A recent study found a reduced risk for fatal CVD in peritoneal dialysis patients treated with ACEis.5 Another study reported improved renal outcomes in nondiabetic patients with advanced CKD who were treated with ACEis.6 The National Kidney Foundation/Kidney Disease Outcomes Quality Initiative Clinical Practice Guidelines on Hypertension currently state that with careful monitoring, most patients with advanced CKD can continue taking ACEis/ARBs.7
More studies are needed to confidently close this controversial debate. Fortunately, the STOP-ACEi study, a three-year trial that began in 2014 in the UK, is examining the effects of ACEi/ARB use in patients with advanced CKD. It aims to determine whether discontinuation of ACEis/ARBs in these patients can help to stabilize or improve renal function, compared to continued use. By maintaining good blood pressure control in these patients, the researchers hope to distinguish the antihypertensive effects from other potential benefits of the RAAS inhibitors.2 The results of this trial may provide additional clarity for making decisions about ACEi/ARB treatment in our patients with advanced CKD. —RVR, SMR
Rebecca V. Rokosky, MSN, APRN, FNP-BC
Sub Investigator in the Clinical Advancement Center, PPLC, San Antonio, Texas
Shannon M. Rice, MS, PA-C
Division of Nephrology and Hypertension, Department of Medicine, University of California, San Diego
1. Ahmed A, Jorna T, Bhandari S. Should we STOP angiotensin converting enzyme inhibitors/angiotensin receptor blockers in advanced kidney disease? Nephron. 2016; 133(3):147-158.
2. Bhandari S, Ives N, Brettell EA, et al. Multicentre randomized controlled trial of angiotensin-converting enzyme inhibitor/angiotensin receptor blocker withdrawal in advanced renal disease: the STOP-ACEi trial. Nephrol Dial Transplant. 2016; 31(2):255-261.
3. Gonclaves A, Khwaja A, Ahmed A, et al. Stopping renin-angiotensin system inhibitors in chronic kidney disease: predictors of response. Nephron Clin Pract. 2011;119(4):348-354.
4. Zuber K, Gilmartin C, Davis J. Managing hypertension in patients with chronic kidney disease. JAAPA. 2014;27(9):37-46.
5. Shen JI, Saxena AB, Montez-Rath ME, et al. Angiotensin-converting enzyme inhibitor/angiotensin receptor blocker use and cardiovascular outcomes in patients initiating peritoneal dialysis. Nephrol Dial Transplant. 2016 Apr 13. [Epub ahead of print]
6. Hou F, Zhang X, Zhang GH, et al. Efficacy and safety of benazepril for advanced chronic renal insufficiency. N Engl J Med. 2006;354(2):131-140.
7. Kidney Disease Outcomes Quality Initiative (K/DOQI). K/DOQI clinical practice guidelines on hypertension and antihypertensive agents in chronic kidney disease. Am J Kidney Dis. 2004;43(5 suppl 1):S1-S290.
New Drugs to Treat Hyperkalemia
Q)I have heard talk about the development of new drugs to treat hyperkalemia. What is the status of these?
Hyperkalemia is a commonly seen electrolyte imbalance in clinical practice. Risks associated with moderate-to-severe hyperkalemia include potentially fatal cardiac conduction abnormalities/arrhythmias, making identification and management critical. An in-depth discussion of hyperkalemia diagnosis can be found in our March 2017 CE/CME activity (2017;27[3]:40-49).
Risk factors for hyperkalemia include excess intake or supplementation of potassium, type 2 diabetes, liver cirrhosis, congestive heart failure (CHF), and chronic kidney disease (CKD). The kidneys excrete 90% to 95% of ingested potassium, and the gut excretes the rest. Normal kidneys take six to 12 hours to excrete an acute potassium load. As kidney function decreases, risk for hyperkalemia increases.1 Hyperkalemia rates as high as 26% have been observed in patients with CKD stages 3 to 5 (glomerular filtration rate [GFR], < 60 mL/min).2
Renin-angiotensin-aldosterone system (RAAS) inhibitors—including ACE inhibitors (ACEis), angiotensin-receptor blockers, and aldosterone agonists—are associated with hyperkalemia. While RAAS therapy can play an important role in the management of CKD and cardiovascular disease (CVD), the development of hyperkalemia can necessitate a dose reduction or discontinuation of these medications, limiting their therapeutic benefit. Other medications that elevate risk for hyperkalemia include NSAIDs, heparin, cyclosporine, amiloride, triamterene, and nonselective ß-blockers.1
Therapeutic options for nonurgent treatment of hyperkalemia are limited. In addition to reducing or discontinuing associated medications, strategies include use of diuretics (as appropriate), treatment of metabolic acidosis, and dietary restrictions (ie, limiting high-potassium foods).1 Pharmacologically, there has been one (less than ideal) option—until recently.
Sodium polystyrene sulfonate (SPS), an ion-exchange resin approved in 1958, can be used to treat hyperkalemia.3 It comes in an enema and an oral form; the former has a faster onset, but the latter is more effective, with an onset of action of one to two hours and a duration of four to six hours.1 However, each gram of SPS contains 100 g of sodium, and the typical dose of SPS is 15 g to 60 g.4 The resulting increase in sodium load can be a concern for patients with CHF, severe hypertension, or severe edema.5
Data from randomized controlled trials (RCTs) are limited; however, one double-blind RCT investigated the effect of SPS on 33 patients with CKD and mild-to-moderate hyperkalemia (potassium level, 5 mEq/L to 5.9 mEq/L). The researchers found that patients who took 30 g/d of SPS for seven days experienced a 73% reduction in serum potassium, compared with a 38% reduction in patients who took a placebo. Of note, more gastrointestinal issues were observed in the SPS group.6
Additionally, a retrospective chart review of 14 patients with CKD and heart disease found low-dose SPS to be safe and effective when used as a secondary measure for hyperkalemia prevention in those taking RAAS therapy.7 However, a systematic review found that SPS use with and without concurrent sorbitol may be associated with serious and fatal gastrointestinal injuries.8 In 2011, the FDA issued a black box warning regarding increased risk for intestinal necrosis when SPS is used with sorbitol.9 In 2015, the FDA recommended separating SPS from other oral medications by at least six hours, due to its potential to bind with other medications.10
Patiromer, a new potassium binder, was approved by the FDA in 2015. This sodium-free, nonabsorbed, spherical polymer uses calcium as the exchange cation to bind potassium in the gastrointestinal tract. Its onset of action is seven hours, with a 24-hour duration of action. It is not approved for emergency use. There are no renal dosing adjustment considerations with patiromer.
In RCTs, patiromer has been associated with a significant reduction in serum potassium in patients with CKD (with or without diabetes) taking RAAS therapy. The starting dose is 8.4 g/d mixed with water, taken with food; this can be increased by 8.4 g each week as needed, to a maximum dosage of 25.2 g/d. Patiromer binds between 8.5 mEq to 8.8 mEq of potassium per gram of polymer.
The original approval included a black box warning to take patiromer six hours before and after other medications, due to concern for binding with certain medications. However, after an additional study in 2016, the FDA removed this warning and approved a change in administration to three hours before and after taking other medications.
Use of patiromer is not advised in those with severe constipation, bowel obstruction/impaction, or allergies to any of its components.11 Adverse reactions associated with patiromer include constipation (which generally improves with time), hypomagnesemia, diarrhea, nausea, abdominal discomfort, and flatulence. A 52-week RCT of 304 patients with CKD on RAAS found the most common adverse event to be mild-to-moderate constipation (6.3% of patients), with two patients discontinuing therapy as a result.4 In clinical trials, 9% of patients developed hypomagnesemia (serum magnesium value, < 1.4 mg/dL). It is recommended that serum magnesium levels be monitored and supplementation offered, when appropriate.11
Sodium zirconium cyclosilicate (ZS-9) is among the potassium-lowering medications on the horizon. In 2016, the FDA accepted a new drug application for this insoluble, unabsorbed cation exchanger that also works in the GI tract and uses sodium and hydrogen as exchange cations.12
For now, however, dietary education remains a mainstay of treatment for patients with elevated serum potassium levels. It is particularly important to inform your patients that many salt substitutes and low-sodium products contain potassium chloride. They should therefore exercise caution when incorporating sodium-reducing components into their diet. —CS
Cynthia Smith, DNP, CNN-NP, APRN, FNP-BC
Renal Consultants, PLLC, South Charleston, West Virginia
1. Gilbert S, Weiner D, Gipson D, eds; National Kidney Foundation. Primer on Kidney Diseases. 6th ed. Philadelphia, PA: Saunders Elsevier; 2014.
2. Einhorn LM, Zhan M, Hsu VD, et al. The frequency of hyperkalemia and its significance in chronic kidney disease. Arch Intern Med. 2009;169(12):1156-1162.
3. Flinn RB, Merrill JP, Welzant WR. Treatment of the oliguric patient with a new sodium-exchange resin and sorbitol: a preliminary report. N Engl J Med. 1961;264:111-115.
4. Dunn JD, Benton WW, Orozco-Torrentera E, Adamson RT. The burden of hyperkalemia in patients with cardiovascular and renal disease. Am J Manag Care. 2015;21(15 suppl): s307-s315.
5. Li L, Harrison SD, Cope MJ, et al. Mechanism of action and pharmacology of patiromer, a nonabsorbed cross-linked polymer that lowers serum potassium concentration in patients with hyperkalemia. J Cardiovasc Pharmacol Ther. 2016;21(5):456-465.
6. Lepage L, Dufour AC, Doiron J, et al. Randomized clinical trial of sodium polystyrene sulfonate for the treatment of mild hyperkalemia in CKD. Clin J Am Soc Nephrol. 2015; 10(12):2136-2142.
7. Chernin G, Gal-Oz A, Ben-Assa E, et al. Secondary prevention of hyperkalemia with sodium polystyrene sulfonate in cardiac and kidney patients on renin-angiotensin-aldosterone system inhibition therapy. Clin Cardiol. 2012;35(1):32-36.
8. Harel Z, Harel S, Shah PS, et al. Gastrointestinal adverse events with sodium polystyrene sulfonate (Kayexalate) use: a systematic review. Am J Med. 2013;126(3):264.e9-e24.
9. FDA. Safety warning: Kayexalate (sodium polystyrene sulfonate) powder. www.fda.gov/Safety/MedWatch/SafetyInformation/ucm186845.htm. Accessed February 15, 2017.
10. FDA. FDA drug safety communication: FDA required drug interaction studies with potassium-lowering drug Kayexalate (sodium polystyrene sulfonate). www.fda.gov/Drugs/DrugSafety/ucm468035.htm. Accessed March 1, 2017.
11. Veltassa® (patiromer) [package insert]. Redwood City, CA: Relypsa, Inc; 2016. www.veltassa.com/pi.pdf. Accessed March 1, 2017.
12. AstraZeneca. FDA accepts for review New Drug Application for sodium zirconium cyclosilicate (ZS-9) for the treatment of hyperkalaemia. www.astrazeneca.com/investor-relations/Stock-exchange-announcements/fda-accepts-for-review-new-drug-application-for-sodium-zirconium-18102016.html. Accessed March 1, 2017.
Clinician Reviews in partnership with
Renal Consult is edited by Jane S. Davis, CRNP, DNP, a member of the Clinician Reviews editorial board, who is a nurse practitioner in the Division of Nephrology at the University of Alabama at Birmingham and is the communications chairperson for the National Kidney Foundation’s Council of Advanced Practitioners (NKF-CAP); and Kim Zuber, PA-C, MSPS, DFAAPA, a semi-retired PA who works with the American Academy of Nephrology PAs and is a past chair of the NKF-CAP. This month’s responses were authored by Cynthia Smith, DNP, CNN-NP, APRN, FNP-BC, who practices at Renal Consultants, PLLC, in South Charleston, West Virginia, Rebecca V. Rokosky, MSN, APRN, FNP-BC, who is Sub Investigator in the Clinical Advancement Center, PPLC, in San Antonio, Texas, and Shannon M. Rice, MS, PA-C, who is in the Division of Nephrology and Hypertension, Department of Medicine, at the University of California, San Diego.
Q)I have heard talk about the development of new drugs to treat hyperkalemia. What is the status of these?
Hyperkalemia is a commonly seen electrolyte imbalance in clinical practice. Risks associated with moderate-to-severe hyperkalemia include potentially fatal cardiac conduction abnormalities/arrhythmias, making identification and management critical. An in-depth discussion of hyperkalemia diagnosis can be found in our March 2017 CE/CME activity (2017;27[3]:40-49).
Risk factors for hyperkalemia include excess intake or supplementation of potassium, type 2 diabetes, liver cirrhosis, congestive heart failure (CHF), and chronic kidney disease (CKD). The kidneys excrete 90% to 95% of ingested potassium, and the gut excretes the rest. Normal kidneys take six to 12 hours to excrete an acute potassium load. As kidney function decreases, risk for hyperkalemia increases.1 Hyperkalemia rates as high as 26% have been observed in patients with CKD stages 3 to 5 (glomerular filtration rate [GFR], < 60 mL/min).2
Renin-angiotensin-aldosterone system (RAAS) inhibitors—including ACE inhibitors (ACEis), angiotensin-receptor blockers, and aldosterone agonists—are associated with hyperkalemia. While RAAS therapy can play an important role in the management of CKD and cardiovascular disease (CVD), the development of hyperkalemia can necessitate a dose reduction or discontinuation of these medications, limiting their therapeutic benefit. Other medications that elevate risk for hyperkalemia include NSAIDs, heparin, cyclosporine, amiloride, triamterene, and nonselective ß-blockers.1
Therapeutic options for nonurgent treatment of hyperkalemia are limited. In addition to reducing or discontinuing associated medications, strategies include use of diuretics (as appropriate), treatment of metabolic acidosis, and dietary restrictions (ie, limiting high-potassium foods).1 Pharmacologically, there has been one (less than ideal) option—until recently.
Sodium polystyrene sulfonate (SPS), an ion-exchange resin approved in 1958, can be used to treat hyperkalemia.3 It comes in an enema and an oral form; the former has a faster onset, but the latter is more effective, with an onset of action of one to two hours and a duration of four to six hours.1 However, each gram of SPS contains 100 g of sodium, and the typical dose of SPS is 15 g to 60 g.4 The resulting increase in sodium load can be a concern for patients with CHF, severe hypertension, or severe edema.5
Data from randomized controlled trials (RCTs) are limited; however, one double-blind RCT investigated the effect of SPS on 33 patients with CKD and mild-to-moderate hyperkalemia (potassium level, 5 mEq/L to 5.9 mEq/L). The researchers found that patients who took 30 g/d of SPS for seven days experienced a 73% reduction in serum potassium, compared with a 38% reduction in patients who took a placebo. Of note, more gastrointestinal issues were observed in the SPS group.6
Additionally, a retrospective chart review of 14 patients with CKD and heart disease found low-dose SPS to be safe and effective when used as a secondary measure for hyperkalemia prevention in those taking RAAS therapy.7 However, a systematic review found that SPS use with and without concurrent sorbitol may be associated with serious and fatal gastrointestinal injuries.8 In 2011, the FDA issued a black box warning regarding increased risk for intestinal necrosis when SPS is used with sorbitol.9 In 2015, the FDA recommended separating SPS from other oral medications by at least six hours, due to its potential to bind with other medications.10
Patiromer, a new potassium binder, was approved by the FDA in 2015. This sodium-free, nonabsorbed, spherical polymer uses calcium as the exchange cation to bind potassium in the gastrointestinal tract. Its onset of action is seven hours, with a 24-hour duration of action. It is not approved for emergency use. There are no renal dosing adjustment considerations with patiromer.
In RCTs, patiromer has been associated with a significant reduction in serum potassium in patients with CKD (with or without diabetes) taking RAAS therapy. The starting dose is 8.4 g/d mixed with water, taken with food; this can be increased by 8.4 g each week as needed, to a maximum dosage of 25.2 g/d. Patiromer binds between 8.5 mEq to 8.8 mEq of potassium per gram of polymer.
The original approval included a black box warning to take patiromer six hours before and after other medications, due to concern for binding with certain medications. However, after an additional study in 2016, the FDA removed this warning and approved a change in administration to three hours before and after taking other medications.
Use of patiromer is not advised in those with severe constipation, bowel obstruction/impaction, or allergies to any of its components.11 Adverse reactions associated with patiromer include constipation (which generally improves with time), hypomagnesemia, diarrhea, nausea, abdominal discomfort, and flatulence. A 52-week RCT of 304 patients with CKD on RAAS found the most common adverse event to be mild-to-moderate constipation (6.3% of patients), with two patients discontinuing therapy as a result.4 In clinical trials, 9% of patients developed hypomagnesemia (serum magnesium value, < 1.4 mg/dL). It is recommended that serum magnesium levels be monitored and supplementation offered, when appropriate.11
Sodium zirconium cyclosilicate (ZS-9) is among the potassium-lowering medications on the horizon. In 2016, the FDA accepted a new drug application for this insoluble, unabsorbed cation exchanger that also works in the GI tract and uses sodium and hydrogen as exchange cations.12
For now, however, dietary education remains a mainstay of treatment for patients with elevated serum potassium levels. It is particularly important to inform your patients that many salt substitutes and low-sodium products contain potassium chloride. They should therefore exercise caution when incorporating sodium-reducing components into their diet. —CS
Cynthia Smith, DNP, CNN-NP, APRN, FNP-BC
Renal Consultants, PLLC, South Charleston, West Virginia
1. Gilbert S, Weiner D, Gipson D, eds; National Kidney Foundation. Primer on Kidney Diseases. 6th ed. Philadelphia, PA: Saunders Elsevier; 2014.
2. Einhorn LM, Zhan M, Hsu VD, et al. The frequency of hyperkalemia and its significance in chronic kidney disease. Arch Intern Med. 2009;169(12):1156-1162.
3. Flinn RB, Merrill JP, Welzant WR. Treatment of the oliguric patient with a new sodium-exchange resin and sorbitol: a preliminary report. N Engl J Med. 1961;264:111-115.
4. Dunn JD, Benton WW, Orozco-Torrentera E, Adamson RT. The burden of hyperkalemia in patients with cardiovascular and renal disease. Am J Manag Care. 2015;21(15 suppl): s307-s315.
5. Li L, Harrison SD, Cope MJ, et al. Mechanism of action and pharmacology of patiromer, a nonabsorbed cross-linked polymer that lowers serum potassium concentration in patients with hyperkalemia. J Cardiovasc Pharmacol Ther. 2016;21(5):456-465.
6. Lepage L, Dufour AC, Doiron J, et al. Randomized clinical trial of sodium polystyrene sulfonate for the treatment of mild hyperkalemia in CKD. Clin J Am Soc Nephrol. 2015; 10(12):2136-2142.
7. Chernin G, Gal-Oz A, Ben-Assa E, et al. Secondary prevention of hyperkalemia with sodium polystyrene sulfonate in cardiac and kidney patients on renin-angiotensin-aldosterone system inhibition therapy. Clin Cardiol. 2012;35(1):32-36.
8. Harel Z, Harel S, Shah PS, et al. Gastrointestinal adverse events with sodium polystyrene sulfonate (Kayexalate) use: a systematic review. Am J Med. 2013;126(3):264.e9-e24.
9. FDA. Safety warning: Kayexalate (sodium polystyrene sulfonate) powder. www.fda.gov/Safety/MedWatch/SafetyInformation/ucm186845.htm. Accessed February 15, 2017.
10. FDA. FDA drug safety communication: FDA required drug interaction studies with potassium-lowering drug Kayexalate (sodium polystyrene sulfonate). www.fda.gov/Drugs/DrugSafety/ucm468035.htm. Accessed March 1, 2017.
11. Veltassa® (patiromer) [package insert]. Redwood City, CA: Relypsa, Inc; 2016. www.veltassa.com/pi.pdf. Accessed March 1, 2017.
12. AstraZeneca. FDA accepts for review New Drug Application for sodium zirconium cyclosilicate (ZS-9) for the treatment of hyperkalaemia. www.astrazeneca.com/investor-relations/Stock-exchange-announcements/fda-accepts-for-review-new-drug-application-for-sodium-zirconium-18102016.html. Accessed March 1, 2017.
Is Vitamin D Beneficial for MS Patients?
Q) What is the role of vitamin D in multiple sclerosis? Is it beneficial?
The exact etiology and pathophysiology of multiple sclerosis (MS) is still not fully understood. Research strongly suggests that there are two major causative factors: one genetic, and the other, environmental. From an environmental standpoint, multiple studies have shown that living farther from the equator, not being exposed to sunlight, and having a low vitamin D level are all correlated with increased risk for MS and MS relapse.1
Our bodies need sunlight to successfully synthesize vitamin D in the skin. Research has found that individuals with lightly pigmented skin are five times more efficient at synthesizing vitamin D in the presence of sunlight than those with darker skin.2 However, the ability to absorb sunlight is also correlated with the earth’s latitude; worse absorption occurs in areas beyond the 40th parallel (in either hemisphere), where UVB levels are too low to synthesize vitamin D four to six months out of the year.2
When exposed to UVB rays, our bodies start to synthesize vitamin D; it undergoes a transformation in the liver and then the kidneys and ultimately becomes the hormonally active form of vitamin D, 1,25-dihydroxyvitamin D3 (calcitriol).2 Calcitriol is recognized by multiple tissues throughout the body that contain vitamin D receptors. Specifically, in the central nervous system, receptors are located on microglia, activated monocytes, and B and T lymphocytes.1 In MS, myelin (the coating around the nerves) is destroyed by an immune-mediated inflammatory process involving the microglia and B and T lymphocytes. Vitamin D quiets down this inflammation, thereby reducing disability accumulation and relapse risk and resulting in fewer changes on MRI.
Vitamin D is also believed to shift the immune response to an anti-inflammatory state by focusing the response on the cytotoxic T cells often found in MS lesions, which attack neurons and oligodendrocytes.2 This theory was tested by Munger and colleagues, who used a pooled cohort of 187,000 women from the Nurses’ Health Study and Nurses’ Health Study II to assess vitamin D intake and risk for MS. Compared to women with lower vitamin D intake, those who took 700 IU/d had a 41% lower incidence of MS. Women who took ≥ 400 IU/d had a 33% lower risk for MS, compared to nonusers.3 In another evaluation of 7 million US military personnel, individuals with a serum vitamin D level of 40 ng/mL were 62% less likely to develop MS.4
In light of the anti-inflammatory effects of vitamin D and its purported reduction of MS risk, it is possible that patients with MS should begin vitamin D supplementation early to obtain maximum anti-inflammatory effects. While an optimal vitamin D goal has not been established in the literature, some studies suggest 30 to 55 ng/mL as a target range for serum vitamin D level.1
While vitamin D has been found to be well-tolerated, patients should be cautioned that very high doses can cause fatigue, abdominal cramps, nausea, vomiting, kidney damage, hypertension, hypercalcemia, and oth
Lisa Marie Fox, MSPAS, PA-C
Division of Multiple Sclerosis, Department of Neurology, Johns Hopkins Hosptial, Baltimore
1. Waubant E, Mowry E, Bowling A. The role of vitamin D in multiple sclerosis pathology and treatment: answers and opportunities. Int J MS Care. 2015;17(2):1-24.
2. Pierrot-Deseilligny C. Clinical implications of a possible role of vitamin D in multiple sclerosis. J Neurol. 2009;256(9):1468-1478.3. Munger KL, Zhang SM, O’Reilly E, et al. Vitamin D intake and incidence of multiple sclerosis. Neurology. 2004;62(1):60-65.
4. Munger KL, Levin LI, Hollis BW, et al. Serum 25-hydroxyvitamin D levels and risk of multiple sclerosis. JAMA. 2006; 296(23):2832-2838.
5. Ross AC, Manson JE, Abrams SA, et al. The 2011 report on dietary reference intakes for calcium and vitamin D from the Institute of Medicine: what clinicians need to know. J Clin Endocrinol Metab. 2011;96(1):53-58.
Clinician Reviews in partnership with
MS Consult is edited by Colleen J. Harris, MN, NP, MSCN, Nurse Practitioner/Manager of the Multiple Sclerosis Clinic at Foothills Medical Centre in Calgary, Alberta, Canada, and Bryan Walker, MHS, PA-C, who is in the Department of Neurology, Division of MS and Neuroimmunology, at Duke University Medical Center in Durham, North Carolina. This month’s responses were authored by Bryan Walker and Lisa Marie Fox, MSPAS, PA-C, who is in the Division of Multiple Sclerosis, Department of Neurology, at Johns Hopkins Hospital in Baltimore.
Q) What is the role of vitamin D in multiple sclerosis? Is it beneficial?
The exact etiology and pathophysiology of multiple sclerosis (MS) is still not fully understood. Research strongly suggests that there are two major causative factors: one genetic, and the other, environmental. From an environmental standpoint, multiple studies have shown that living farther from the equator, not being exposed to sunlight, and having a low vitamin D level are all correlated with increased risk for MS and MS relapse.1
Our bodies need sunlight to successfully synthesize vitamin D in the skin. Research has found that individuals with lightly pigmented skin are five times more efficient at synthesizing vitamin D in the presence of sunlight than those with darker skin.2 However, the ability to absorb sunlight is also correlated with the earth’s latitude; worse absorption occurs in areas beyond the 40th parallel (in either hemisphere), where UVB levels are too low to synthesize vitamin D four to six months out of the year.2
When exposed to UVB rays, our bodies start to synthesize vitamin D; it undergoes a transformation in the liver and then the kidneys and ultimately becomes the hormonally active form of vitamin D, 1,25-dihydroxyvitamin D3 (calcitriol).2 Calcitriol is recognized by multiple tissues throughout the body that contain vitamin D receptors. Specifically, in the central nervous system, receptors are located on microglia, activated monocytes, and B and T lymphocytes.1 In MS, myelin (the coating around the nerves) is destroyed by an immune-mediated inflammatory process involving the microglia and B and T lymphocytes. Vitamin D quiets down this inflammation, thereby reducing disability accumulation and relapse risk and resulting in fewer changes on MRI.
Vitamin D is also believed to shift the immune response to an anti-inflammatory state by focusing the response on the cytotoxic T cells often found in MS lesions, which attack neurons and oligodendrocytes.2 This theory was tested by Munger and colleagues, who used a pooled cohort of 187,000 women from the Nurses’ Health Study and Nurses’ Health Study II to assess vitamin D intake and risk for MS. Compared to women with lower vitamin D intake, those who took 700 IU/d had a 41% lower incidence of MS. Women who took ≥ 400 IU/d had a 33% lower risk for MS, compared to nonusers.3 In another evaluation of 7 million US military personnel, individuals with a serum vitamin D level of 40 ng/mL were 62% less likely to develop MS.4
In light of the anti-inflammatory effects of vitamin D and its purported reduction of MS risk, it is possible that patients with MS should begin vitamin D supplementation early to obtain maximum anti-inflammatory effects. While an optimal vitamin D goal has not been established in the literature, some studies suggest 30 to 55 ng/mL as a target range for serum vitamin D level.1
While vitamin D has been found to be well-tolerated, patients should be cautioned that very high doses can cause fatigue, abdominal cramps, nausea, vomiting, kidney damage, hypertension, hypercalcemia, and oth
Lisa Marie Fox, MSPAS, PA-C
Division of Multiple Sclerosis, Department of Neurology, Johns Hopkins Hosptial, Baltimore
1. Waubant E, Mowry E, Bowling A. The role of vitamin D in multiple sclerosis pathology and treatment: answers and opportunities. Int J MS Care. 2015;17(2):1-24.
2. Pierrot-Deseilligny C. Clinical implications of a possible role of vitamin D in multiple sclerosis. J Neurol. 2009;256(9):1468-1478.3. Munger KL, Zhang SM, O’Reilly E, et al. Vitamin D intake and incidence of multiple sclerosis. Neurology. 2004;62(1):60-65.
4. Munger KL, Levin LI, Hollis BW, et al. Serum 25-hydroxyvitamin D levels and risk of multiple sclerosis. JAMA. 2006; 296(23):2832-2838.
5. Ross AC, Manson JE, Abrams SA, et al. The 2011 report on dietary reference intakes for calcium and vitamin D from the Institute of Medicine: what clinicians need to know. J Clin Endocrinol Metab. 2011;96(1):53-58.
Cigarette Smoking: Modifiable Risk Factor for MS
Q) What impact does cigarette smoking have on multiple sclerosis?
The development and disease course of multiple sclerosis (MS) are influenced by a variety of factors. Some—such as genetics, environmental exposure to viruses, and place of residence at an early age—cannot be modified. There are, however, other factors that can be modified, one of which is cigarette smoking.
Between 15% and 17% of patients with MS smoke cigarettes, a rate comparable to that of the general United States population; among US veterans with MS, prevalence can reach as high as 28.5%.1-4 Factors that correlate with smoking in patients with MS include younger age, lower economic/educational background, being single, and lack of available or affordable cessation strategies.1,2,4
Studies have found that in addition to contributing to the development of diseases (eg, cardiovascular and pulmonary) and certain cancers, smoking cigarettes may put individuals at higher risk for MS.5-7 Data also show that increased duration of smoking and/or increased quantity of cigarettes smoked may exacerbate this risk.5 While the mechanisms are not well understood, there appears to be a higher prevalence of MS in male smokers and in current smokers (compared with those who have already quit).6 Other studies have also suggested an increased risk with passive exposure to cigarette smoke.6,7
Current cigarette smoking accelerates the conversion from a relapsing to a progressive form of MS.8-11 One study demonstrated that after the diagnosis of MS had been made, continued smoking increased the rate of acceleration to a progressive form by 5% per year.9 Current smokers also had a higher disability rate attributable to their MS, but smoking cessation may improve disability outcomes.9-11
Current smokers, with or without other risk factors, therefore have incentive to quit smoking to reduce risk for MS. Patients with MS who smoke should be counseled on the increased risk associated with the combination of passive smoke exposure and other genetic and environmental factors, which may increase risk for MS in first-degree family members.3
While there is no one-size-fits-all strategy for smoking cessation in patients with MS, traditional behavioral and/or medication therapies should be offered. Some factors involved in cigarette smoking are variable and difficult to address, in addition to the physical dependence on nicotine. Many patients will require interventions to address related poor health behaviors (eg, lack of exercise) and comorbid factors (eg, depression).5,7 —BW
Bryan Walker, MHS, PA-C
Department of Neurology, Division of MS and Neuroimmunology, Duke University Medical Center, Durham, North Carolina
1. Friend KB, Mernoff ST, Block P, Reeve G. Smoking rates and smoking cessation among individuals with multiple sclerosis. Disabil Rehabil. 2006;28(18):1135-1141.
2. Marrie R, Horwitz R, Cutter G, et al. High frequency of adverse health behaviors in multiple sclerosis. Mult Scler. 2009;15(1): 105-113.
3. CDC. Current cigarette smoking among adults in the United States. www.cdc.gov/tobacco/data_statistics/fact_sheets/adult_data/cig_smoking. Accessed January 13, 2017.
4. Turner AP, Kivlahan DR, Kazis LE, Haselkorn JK. Smoking among veterans with multiple sclerosis: prevalence correlates, quit attempts, and unmet need for services. Arch Phys Med Rehabil. 2007;88(11):1394-1399.
5. Ascherio A, Munger K. Epidemiology of multiple sclerosis: from risk factors to prevention—an update. Semin Neurol. 2016; 36(2):103-114.
6. Zhang P, Wang R, Li Z, et al. The risk of smoking on multiple sclerosis: a meta-analysis based on 20,626 cases from case-control and cohort studies. PeerJ. 2016;4:e1797.
7. Hedström AK, Olsson T, Alfredsson L. Smoking is a major preventable risk factor for multiple sclerosis. Mult Scler. 2016; 22(8):1021-1026.
8. Healy BC, Ali EN, Guttmann CR, et al. Smoking and disease progression in multiple sclerosis. Arch Neurol. 2009;66(7):858-864.
9. Goldman MD, Stüve O. Smoking beyond multiple sclerosis diagnosis: a risk factor still worth modifying. JAMA Neurol. 2015;72(10):1105-1106.
10. Ramanujam R, Hedström A, Manouchehrinia A, et al. Effect of smoking cessation on multiple sclerosis prognosis. JAMA Neurol. 2015;72(10):1117-1123.
11. Ben-Zacharia A. The effect of modifiable risk factors on multiple sclerosis progression. Neurology. 2016;86(16):Supplement P1.387.
Clinician Reviews in partnership with
MS Consult is edited by Colleen J. Harris, MN, NP, MSCN, Nurse Practitioner/Manager of the Multiple Sclerosis Clinic at Foothills Medical Centre in Calgary, Alberta, Canada, and Bryan Walker, MHS, PA-C, who is in the Department of Neurology, Division of MS and Neuroimmunology, at Duke University Medical Center in Durham, North Carolina. This month’s responses were authored by Bryan Walker and Lisa Marie Fox, MSPAS, PA-C, who is in the Division of Multiple Sclerosis, Department of Neurology, at Johns Hopkins Hospital in Baltimore.
Q) What impact does cigarette smoking have on multiple sclerosis?
The development and disease course of multiple sclerosis (MS) are influenced by a variety of factors. Some—such as genetics, environmental exposure to viruses, and place of residence at an early age—cannot be modified. There are, however, other factors that can be modified, one of which is cigarette smoking.
Between 15% and 17% of patients with MS smoke cigarettes, a rate comparable to that of the general United States population; among US veterans with MS, prevalence can reach as high as 28.5%.1-4 Factors that correlate with smoking in patients with MS include younger age, lower economic/educational background, being single, and lack of available or affordable cessation strategies.1,2,4
Studies have found that in addition to contributing to the development of diseases (eg, cardiovascular and pulmonary) and certain cancers, smoking cigarettes may put individuals at higher risk for MS.5-7 Data also show that increased duration of smoking and/or increased quantity of cigarettes smoked may exacerbate this risk.5 While the mechanisms are not well understood, there appears to be a higher prevalence of MS in male smokers and in current smokers (compared with those who have already quit).6 Other studies have also suggested an increased risk with passive exposure to cigarette smoke.6,7
Current cigarette smoking accelerates the conversion from a relapsing to a progressive form of MS.8-11 One study demonstrated that after the diagnosis of MS had been made, continued smoking increased the rate of acceleration to a progressive form by 5% per year.9 Current smokers also had a higher disability rate attributable to their MS, but smoking cessation may improve disability outcomes.9-11
Current smokers, with or without other risk factors, therefore have incentive to quit smoking to reduce risk for MS. Patients with MS who smoke should be counseled on the increased risk associated with the combination of passive smoke exposure and other genetic and environmental factors, which may increase risk for MS in first-degree family members.3
While there is no one-size-fits-all strategy for smoking cessation in patients with MS, traditional behavioral and/or medication therapies should be offered. Some factors involved in cigarette smoking are variable and difficult to address, in addition to the physical dependence on nicotine. Many patients will require interventions to address related poor health behaviors (eg, lack of exercise) and comorbid factors (eg, depression).5,7 —BW
Bryan Walker, MHS, PA-C
Department of Neurology, Division of MS and Neuroimmunology, Duke University Medical Center, Durham, North Carolina
1. Friend KB, Mernoff ST, Block P, Reeve G. Smoking rates and smoking cessation among individuals with multiple sclerosis. Disabil Rehabil. 2006;28(18):1135-1141.
2. Marrie R, Horwitz R, Cutter G, et al. High frequency of adverse health behaviors in multiple sclerosis. Mult Scler. 2009;15(1): 105-113.
3. CDC. Current cigarette smoking among adults in the United States. www.cdc.gov/tobacco/data_statistics/fact_sheets/adult_data/cig_smoking. Accessed January 13, 2017.
4. Turner AP, Kivlahan DR, Kazis LE, Haselkorn JK. Smoking among veterans with multiple sclerosis: prevalence correlates, quit attempts, and unmet need for services. Arch Phys Med Rehabil. 2007;88(11):1394-1399.
5. Ascherio A, Munger K. Epidemiology of multiple sclerosis: from risk factors to prevention—an update. Semin Neurol. 2016; 36(2):103-114.
6. Zhang P, Wang R, Li Z, et al. The risk of smoking on multiple sclerosis: a meta-analysis based on 20,626 cases from case-control and cohort studies. PeerJ. 2016;4:e1797.
7. Hedström AK, Olsson T, Alfredsson L. Smoking is a major preventable risk factor for multiple sclerosis. Mult Scler. 2016; 22(8):1021-1026.
8. Healy BC, Ali EN, Guttmann CR, et al. Smoking and disease progression in multiple sclerosis. Arch Neurol. 2009;66(7):858-864.
9. Goldman MD, Stüve O. Smoking beyond multiple sclerosis diagnosis: a risk factor still worth modifying. JAMA Neurol. 2015;72(10):1105-1106.
10. Ramanujam R, Hedström A, Manouchehrinia A, et al. Effect of smoking cessation on multiple sclerosis prognosis. JAMA Neurol. 2015;72(10):1117-1123.
11. Ben-Zacharia A. The effect of modifiable risk factors on multiple sclerosis progression. Neurology. 2016;86(16):Supplement P1.387.