User login
Improved Transitional Care Through an Innovative Hospitalist Model: Expanding Clinician Practice From Acute to Subacute Care
Hospitalist physician rotations between acute inpatient hospitals and subacute care facilities with dedicated time in each environment may foster quality improvement and educational opportunities.
Care transitions between hospitals and skilled nursing facilities (SNFs) are a vulnerable time for patients. The current health care climate of decreasing hospital length of stay, readmission penalties, and increasing patient complexity has made hospital care transitions an important safety concern. Suboptimal transitions across clinical settings can result in adverse events, inadequately controlled comorbidities, deficient patient and caregiver preparation for discharge, medication errors, relocation stress, and overall increased morbidity and mortality.1,2 Such care transitions also may generate unnecessary spending, including avoidable readmissions, emergency department utilization, and duplicative laboratory and imaging studies. Approximately 23% of patients admitted to SNFs are readmitted to acute care hospitals within 30 days, and these patients have increased mortality rates in risk-adjusted analyses. 3,4
Compounding the magnitude of this risk and vulnerability is the significant growth in the number of patients discharged to SNFs over the past 30 years. In 2013, more than 20% of Medicare patients discharged from acute care hospitals were destined for SNFs.5,6 Paradoxically, despite the increasing need for SNF providers, there is a shortage of clinicians with training in geriatrics or nursing home care.7 The result is a growing need to identify organizational systems to optimize physician practice in these settings, enhance quality of care, especially around transitions, and increase educational training opportunities in SNFs for future practitioners.
Many SNFs today are staffed by physicians and other licensed clinicians whose exclusive practice location is the nursing facility or possibly several such facilities. This prevailing model of care can isolate the physicians, depriving them of interaction with clinicians in other specialties, and can contribute to burnout.8 This model does not lend itself to academic scholarship, quality improvement (QI), and student or resident training, as each of these endeavors depends on interprofessional collaboration as well as access to an academic medical center with additional resources.9
Few studies have described innovative hospitalist rotation models from acute to subacute care. The Cleveland Clinic implemented the Connected Care model where hospital-employed physicians and advanced practice professionals integrated into postacute care and reduced the 30-day hospital readmission rate from SNFs from 28% to 22%.10 Goth and colleagues performed a comparative effectiveness trial between a postacute care hospitalist (PACH) model and a community-based physician model of nursing home care. They found that the institution of a PACH model in a nursing home was associated with a significant increase in laboratory costs, nonsignificant reduction in medication errors and pharmacy costs, and no improvement in fall rates.11 The conclusion was that the PACH model may lead to greater clinician involvement and that the potential decrease in pharmacy costs and medications errors may offset the costs associated with additional laboratory testing. Overall, there has been a lack of studies on the impact of these hospitalist rotation models from acute to subacute care on educational programs, QI activities, and the interprofessional environment.
To achieve a system in which physicians in a SNF can excel in these areas, Veterans Affairs Boston Healthcare System (VABHS) adopted a staffing model in which academic hospitalist physicians rotate between the inpatient hospital and subacute settings. This report describes the model structure, the varying roles of the physicians, and early indicators of its positive effects on educational programs, QI activities, and the interprofessional environment.
Methods
The VABHS consists of a 159-bed acute care hospital in West Roxbury, Massachusetts; and a 110-bed SNF in Brockton, Massachusetts, with 3 units: a 65-bed transitional care unit (TCU), a 30-bed long-term care unit, and a 15-bed palliative care/hospice unit. The majority of patients admitted to the SNF are transferred from the acute care hospital in West Roxbury and other regional hospitals. Prior to 2015, the TCU was staffed with full-time clinicians who exclusively practiced in the SNF.
In the new staffing model, 6 hospitalist physicians divide their clinical time between the acute care hospital’s inpatient medical service and the TCU. The hospitalists come from varied backgrounds in terms of years in practice and advanced training (Table 1). 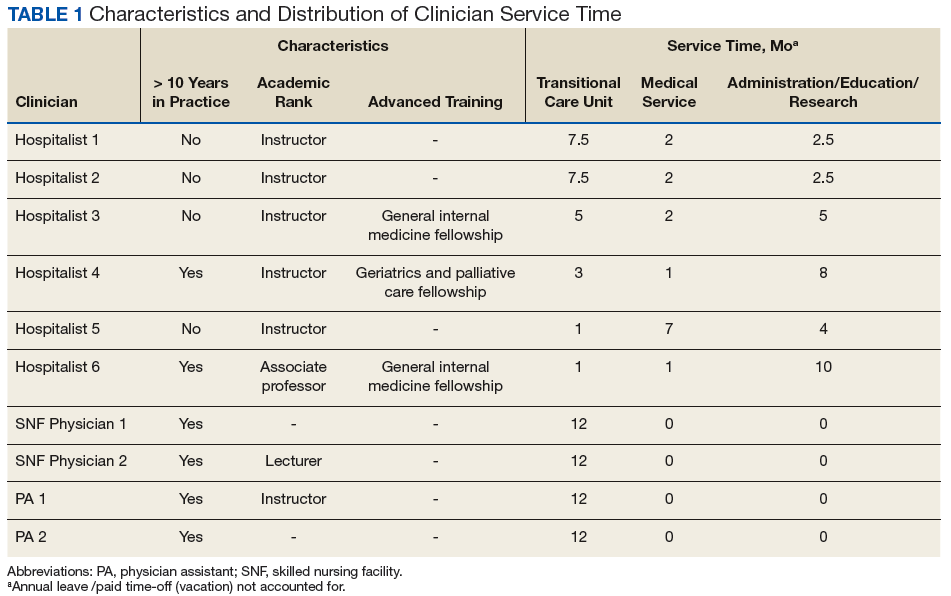
The amount of nonclinical (protected) time and clinical time on the acute inpatient service and the TCU varies for each physician. For example, a physician serves as principal investigator for several major research grants and has a hospital-wide administrative leadership role; as a result, the principal investigator has fewer months of clinical responsibility. Physicians are expected to use the protected time for scholarship, educational program development and teaching, QI, and administrative responsibilities. The VABHS leadership determines the amount of protected time based on individualized benchmarks for research, education, and administrative responsibilities that follow VA national and local institutional guidelines. These metrics and time allocations are negotiated at the time of recruitment and then are reviewed annually.
The TCU also is staffed with 4 full-time clinicians (2 physicians and 2 physician assistants) who provide additional continuity of care. The new hospitalist staffing model only required an approximate 10% increase in TCU clinical staffing full-time equivalents. Patients and admissions are divided equally among clinicians on service (census per clinician 12-15 patients), with redistribution of patients at times of transition from clinical to nonclinical time. Blocks of clinical time are scheduled for greater than 2 weeks at a time to preserve continuity. In addition, the new staffing model allocates assignment of clinical responsibilities that allows for clinicians to take leave without resultant shortages in clinical coverage.
To facilitate communication among physicians serving in the acute inpatient facility and the TCU, leaders of both of these programs meet monthly and ad hoc to review the transitions of care between the 2 settings. The description of this model and its assessment have been reviewed and deemed exempt from oversight by the VA Boston Healthcare System Research and Development Committee.
Results
Since the implementation of this staffing model in 2015, the system has grown considerably in the breadth and depth of educational programming, QI, and systems redesign in the TCU and, more broadly, in the SNF. The TCU, which previously had limited training opportunities, has experienced marked expansion of educational offerings. It is now a site for core general medicine rotations for first-year psychiatry residents and physician assistant students. The TCU also has expanded as a clinical site for transitions-in-care internal medicine resident curricula and electives, as well as a clinical site for a geriatrics fellowship.
A hospitalist developed and implemented a 4-week interprofessional curriculum for all clinical trainees and students, which occurs continuously. The curriculum includes a monthly academic conference and 12 didactic lectures and is taught by 16 interprofessional faculty from the TCU and the Palliative Care/Hospice Unit, including medicine, geriatric and palliative care physicians, physician assistants, social workers, physical and occupational therapists, pharmacists, and a geriatric psychologist. The goal of the curriculum is to provide learners the knowledge, attitudes, and skills necessary to perform effective, efficient, and safe transfers between clinical settings as well as education in transitional care. In addition, using a team of interprofessional faculty, the curriculum develops the interprofessional competencies of teamwork and communication. The curriculum also has provided a significant opportunity for interprofessional collaboration among faculty who have volunteered their teaching time in the development and teaching of the curriculum, with potential for improved clinical staff knowledge of other disciplines.
Quality improvement and system redesign projects in care transitions also have expanded (Table 2). 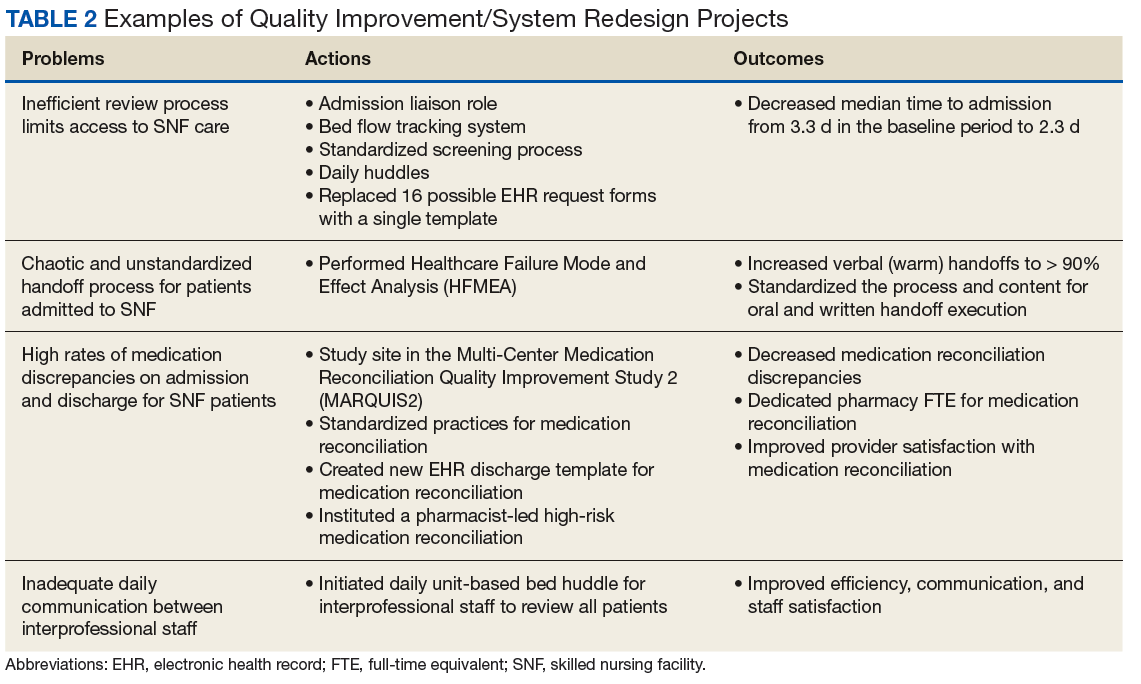
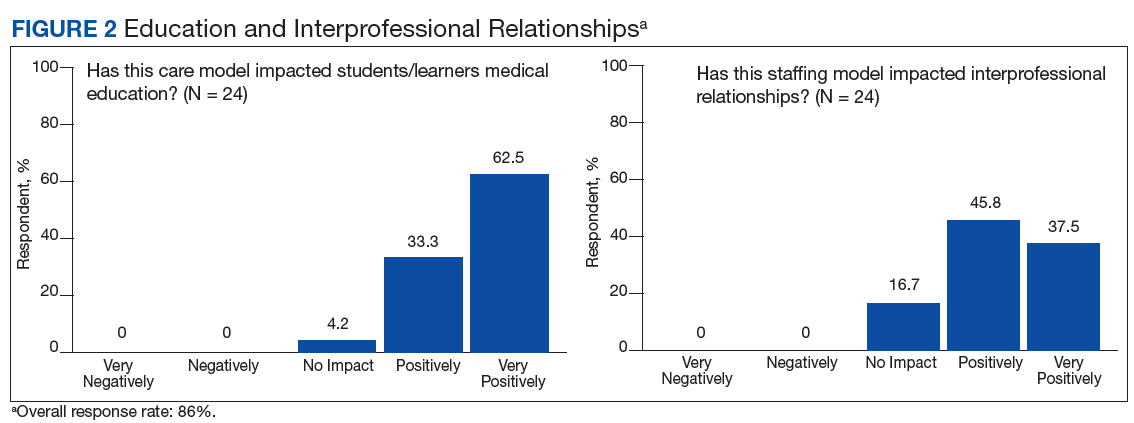
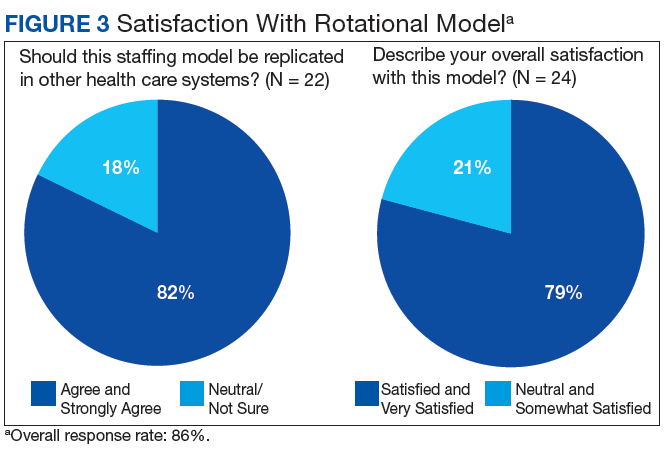
Early assessment indicates that the new staffing model is having positive effects on the clinical environment of the TCU. A survey was conducted of a convenience sample of all physicians, nurse managers, social workers, and other members of the clinical team in the TCU (N=24)(Table 3), with response categories ranging on a Likert scale from 1 (very negative) to 5 (very positive). 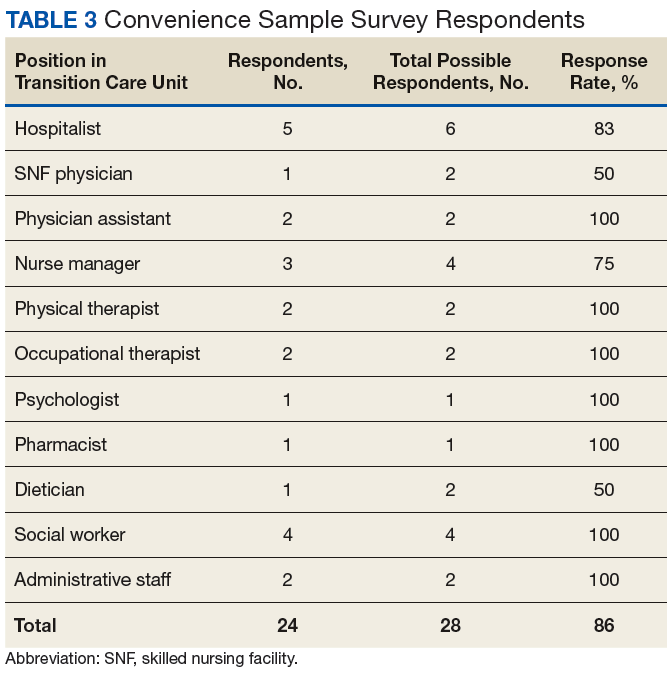
Although not rigorously analyzed using qualitative research methods, comments from respondents have consistently indicated that this staffing model increases the transfer of clinical and logistical knowledge among staff members working in the acute inpatient facility and the TCU. 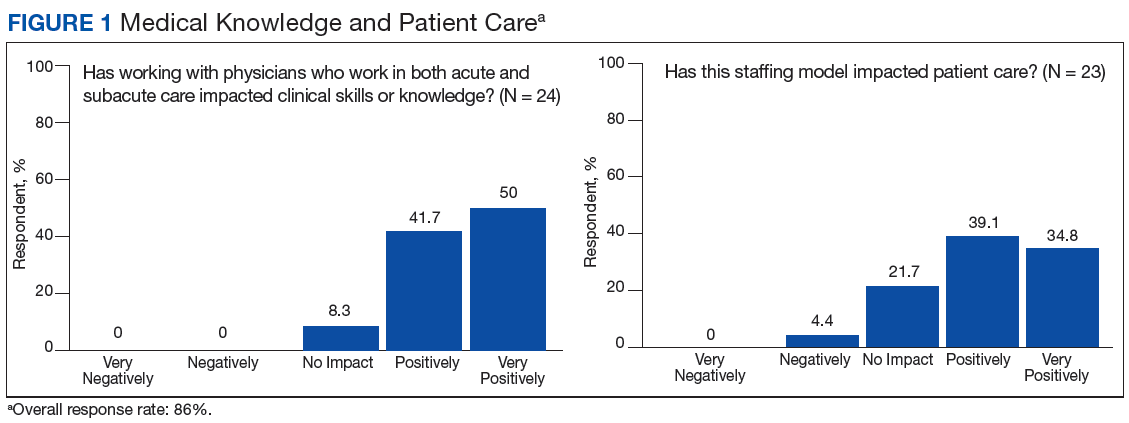
Discussion
With greater numbers of increasingly complex patients transitioning from the hospital to SNF, health care systems need to expand the capacity of their skilled nursing systems, not only to provide clinical care, but also to support QI and medical education. The VABHS developed a physician staffing model with the goal of enriching physician practice and enhancing QI and educational opportunities in its SNF. The model offers an opportunity to improve transitions in care as physicians gain a greater knowledge of both the hospital and subacute clinical settings. This hospitalist rotation model may improve the knowledge necessary for caring for patients moving across care settings, as well as improve communication between settings. It also has served as a foundation for systematic innovation in QI and education at this institution. Clinical staff in the transitional care setting have reported positive effects of this model on clinical skills and patient care, educational opportunities, as well as a desire for replication in other health care systems.
The potential generalizability of this model requires careful consideration. The VABHS is a tertiary care integrated health care system, enabling physicians to work in multiple clinical settings. Other settings may not have the staffing or clinical volume to sustain such a model. In addition, this model may increase discontinuity in patient care as hospitalists move between acute and subacute settings and nonclinical roles. This loss of continuity may be a greater concern in the SNF setting, as the inpatient hospitalist model generally involves high provider turnover as shift work. Our survey included nurse managers, and not floor nurses due to survey administration limitations, and feedback may not have captured a comprehensive view from CLC staff. Moreover, some of the perceived positive impacts also may be related to professional and personal attributes of the physicians rather than the actual model of care. In addition, the survey response rate was 86%. However, the nature of the improvement work (focused on care transitions) and educational opportunities (interprofessional care) would likely not occur had the physicians been based in one clinical setting.
Other new physician staffing models have been designed to improve the continuity between the hospital, subacute, and outpatient settings. For example, the University of Chicago Comprehensive Care model pairs patients with trained hospitalists who provide both inpatient and outpatient care, thereby optimizing continuity between these settings.14 At CareMore Health System, high-risk patients also are paired with hospitalists, referred to as “extensivists,” who lead care teams that follow patients between settings and provide acute, postacute, and outpatient care.15 In these models, a single physician takes responsibility for the patient throughout transitions of care and through various care settings. Both models have shown reduction in hospital readmissions. One concern with such models is that the treatment teams need to coexist in the various settings of care, and the ability to impact and create systematic change within each environment is limited. This may limit QI, educational opportunities, and system level impact within each environment of care.
In comparison, the “transitionalist” model proposed here features hospitalist physicians rotating between the acute inpatient hospital and subacute care with dedicated time in each environment. This innovative organizational structure may enhance physician practice and enrich QI and educational opportunities in SNFs. Further evaluation will include the impact on quality metrics of patient care and patient satisfaction, as this model has the potential to influence quality, cost, and overall health outcomes.
Acknowledgments
We would like to thank Shivani Jindal, Matthew Russell, Matthew Ronan, Juman Hijab, Wei Shen, Sandra Vilbrun-Bruno, and Jack Earnshaw for their significant contributions to this staffing model. We would also like to thank Paul Conlin, Jay Orlander, and the leadership team of Veterans Affairs Boston Healthcare System for supporting this staffing model.
1. Forster AJ, Murff HJ, Peterson JF, Gandhi TK, Bates DW. Adverse drug events occurring following hospital discharge. J Gen Intern Med. 2005;20(4):317-323.
2. Murtaugh CM, Litke A. Transitions through postacute and long-term care settings: patterns of use and outcomes for a national cohort of elders. Med Care. 2002;40(3):227-236.
3. Burke RE, Whitfield EA, Hittle D, et al. Hospital readmission from post-acute care facilities: risk factors, timing, and outcomes. J Am Med Dir Assoc. 2016;17(3):249-255.
4. Mor V, Intrator O, Feng Z, Grabowski DC. The revolving door of rehospitalization from skilled nursing facilities. Health Aff (Millwood). 2010;29(1):57-64.
5. Tian W. An all-payer view of hospital discharge to postacute care, 2013: Statistical Brief #205. https://www.hcup-us.ahrq.gov/reports/statbriefs/sb205-Hospital-Discharge-Postacute-Care.jsp. Published May 2016. Accessed August 13, 2018.
6. Barnett ML, Grabowski DC, Mehrotra A. Home-to-home time–measuring what matters to patients and payers. N Engl J Med. 2017;377(1):4-6.
7. Golden AG, Silverman MA, Mintzer MJ. Is geriatric medicine terminally ill? Ann Intern Med. 2012;156(9):654-656.
8. Nazir A, Smalbrugge M, Moser A, et al. The prevalence of burnout among nursing home physicians: an international perspective. J Am Med Dir Assoc. 2018;19(1):86-88.
9. Coleman EA, Berenson RA. Lost in transition: challenges and opportunities for improving the quality of transitional care. Ann Intern Med. 2004;141(7):533-536.
10. Kim LD, Kou L, Hu B, Gorodeski EZ, Rothberg MB. Impact of a connected care model on 30-day readmission rates from skilled nursing facilities. J Hosp Med. 2017;12(4):238-244.
11. Gloth MF, Gloth MJ. A comparative effectiveness trial between a post-acute care hospitalist model and a community-based physician model of nursing home care. J Am Med Dir Assoc. 2011;12(5):384-386.
12. Baughman AW, Cain G, Ruopp MD, et al. Improving access to care by admission process redesign in a veterans affairs skilled nursing facility. Jt Comm J Qual Patient Saf. 2018;44(8):454-462.
13. Mixon A, Smith GR, Dalal A et al. The Multi-Center Medication Reconciliation Quality Improvement Study 2 (MARQUIS2): methods and implementation. Abstract 248. Present at: Society of Hospital Medicine Annual Meeting; 2018 Apr 8 – 11, 2018; Orlando, FL. https://www.shmabstracts.com/abstract/the-multi-center-medication-reconciliation-quality-improvement-study-2-marquis2-methods-and-implementation. Accessed August 13, 2018.
14. Meltzer DO, Ruhnke GW. Redesigning care for patients at increased hospitalization risk: the comprehensive care physician model. Health Aff (Millwood). 2014;33(5):770-777.
15. Powers BW, Milstein A, Jain SH. Delivery models for high-risk older patients: back to the future? JAMA. 2016;315(1):23-24.
Hospitalist physician rotations between acute inpatient hospitals and subacute care facilities with dedicated time in each environment may foster quality improvement and educational opportunities.
Hospitalist physician rotations between acute inpatient hospitals and subacute care facilities with dedicated time in each environment may foster quality improvement and educational opportunities.
Care transitions between hospitals and skilled nursing facilities (SNFs) are a vulnerable time for patients. The current health care climate of decreasing hospital length of stay, readmission penalties, and increasing patient complexity has made hospital care transitions an important safety concern. Suboptimal transitions across clinical settings can result in adverse events, inadequately controlled comorbidities, deficient patient and caregiver preparation for discharge, medication errors, relocation stress, and overall increased morbidity and mortality.1,2 Such care transitions also may generate unnecessary spending, including avoidable readmissions, emergency department utilization, and duplicative laboratory and imaging studies. Approximately 23% of patients admitted to SNFs are readmitted to acute care hospitals within 30 days, and these patients have increased mortality rates in risk-adjusted analyses. 3,4
Compounding the magnitude of this risk and vulnerability is the significant growth in the number of patients discharged to SNFs over the past 30 years. In 2013, more than 20% of Medicare patients discharged from acute care hospitals were destined for SNFs.5,6 Paradoxically, despite the increasing need for SNF providers, there is a shortage of clinicians with training in geriatrics or nursing home care.7 The result is a growing need to identify organizational systems to optimize physician practice in these settings, enhance quality of care, especially around transitions, and increase educational training opportunities in SNFs for future practitioners.
Many SNFs today are staffed by physicians and other licensed clinicians whose exclusive practice location is the nursing facility or possibly several such facilities. This prevailing model of care can isolate the physicians, depriving them of interaction with clinicians in other specialties, and can contribute to burnout.8 This model does not lend itself to academic scholarship, quality improvement (QI), and student or resident training, as each of these endeavors depends on interprofessional collaboration as well as access to an academic medical center with additional resources.9
Few studies have described innovative hospitalist rotation models from acute to subacute care. The Cleveland Clinic implemented the Connected Care model where hospital-employed physicians and advanced practice professionals integrated into postacute care and reduced the 30-day hospital readmission rate from SNFs from 28% to 22%.10 Goth and colleagues performed a comparative effectiveness trial between a postacute care hospitalist (PACH) model and a community-based physician model of nursing home care. They found that the institution of a PACH model in a nursing home was associated with a significant increase in laboratory costs, nonsignificant reduction in medication errors and pharmacy costs, and no improvement in fall rates.11 The conclusion was that the PACH model may lead to greater clinician involvement and that the potential decrease in pharmacy costs and medications errors may offset the costs associated with additional laboratory testing. Overall, there has been a lack of studies on the impact of these hospitalist rotation models from acute to subacute care on educational programs, QI activities, and the interprofessional environment.
To achieve a system in which physicians in a SNF can excel in these areas, Veterans Affairs Boston Healthcare System (VABHS) adopted a staffing model in which academic hospitalist physicians rotate between the inpatient hospital and subacute settings. This report describes the model structure, the varying roles of the physicians, and early indicators of its positive effects on educational programs, QI activities, and the interprofessional environment.
Methods
The VABHS consists of a 159-bed acute care hospital in West Roxbury, Massachusetts; and a 110-bed SNF in Brockton, Massachusetts, with 3 units: a 65-bed transitional care unit (TCU), a 30-bed long-term care unit, and a 15-bed palliative care/hospice unit. The majority of patients admitted to the SNF are transferred from the acute care hospital in West Roxbury and other regional hospitals. Prior to 2015, the TCU was staffed with full-time clinicians who exclusively practiced in the SNF.
In the new staffing model, 6 hospitalist physicians divide their clinical time between the acute care hospital’s inpatient medical service and the TCU. The hospitalists come from varied backgrounds in terms of years in practice and advanced training (Table 1).
The amount of nonclinical (protected) time and clinical time on the acute inpatient service and the TCU varies for each physician. For example, a physician serves as principal investigator for several major research grants and has a hospital-wide administrative leadership role; as a result, the principal investigator has fewer months of clinical responsibility. Physicians are expected to use the protected time for scholarship, educational program development and teaching, QI, and administrative responsibilities. The VABHS leadership determines the amount of protected time based on individualized benchmarks for research, education, and administrative responsibilities that follow VA national and local institutional guidelines. These metrics and time allocations are negotiated at the time of recruitment and then are reviewed annually.
The TCU also is staffed with 4 full-time clinicians (2 physicians and 2 physician assistants) who provide additional continuity of care. The new hospitalist staffing model only required an approximate 10% increase in TCU clinical staffing full-time equivalents. Patients and admissions are divided equally among clinicians on service (census per clinician 12-15 patients), with redistribution of patients at times of transition from clinical to nonclinical time. Blocks of clinical time are scheduled for greater than 2 weeks at a time to preserve continuity. In addition, the new staffing model allocates assignment of clinical responsibilities that allows for clinicians to take leave without resultant shortages in clinical coverage.
To facilitate communication among physicians serving in the acute inpatient facility and the TCU, leaders of both of these programs meet monthly and ad hoc to review the transitions of care between the 2 settings. The description of this model and its assessment have been reviewed and deemed exempt from oversight by the VA Boston Healthcare System Research and Development Committee.
Results
Since the implementation of this staffing model in 2015, the system has grown considerably in the breadth and depth of educational programming, QI, and systems redesign in the TCU and, more broadly, in the SNF. The TCU, which previously had limited training opportunities, has experienced marked expansion of educational offerings. It is now a site for core general medicine rotations for first-year psychiatry residents and physician assistant students. The TCU also has expanded as a clinical site for transitions-in-care internal medicine resident curricula and electives, as well as a clinical site for a geriatrics fellowship.
A hospitalist developed and implemented a 4-week interprofessional curriculum for all clinical trainees and students, which occurs continuously. The curriculum includes a monthly academic conference and 12 didactic lectures and is taught by 16 interprofessional faculty from the TCU and the Palliative Care/Hospice Unit, including medicine, geriatric and palliative care physicians, physician assistants, social workers, physical and occupational therapists, pharmacists, and a geriatric psychologist. The goal of the curriculum is to provide learners the knowledge, attitudes, and skills necessary to perform effective, efficient, and safe transfers between clinical settings as well as education in transitional care. In addition, using a team of interprofessional faculty, the curriculum develops the interprofessional competencies of teamwork and communication. The curriculum also has provided a significant opportunity for interprofessional collaboration among faculty who have volunteered their teaching time in the development and teaching of the curriculum, with potential for improved clinical staff knowledge of other disciplines.
Quality improvement and system redesign projects in care transitions also have expanded (Table 2).
Early assessment indicates that the new staffing model is having positive effects on the clinical environment of the TCU. A survey was conducted of a convenience sample of all physicians, nurse managers, social workers, and other members of the clinical team in the TCU (N=24)(Table 3), with response categories ranging on a Likert scale from 1 (very negative) to 5 (very positive).
Although not rigorously analyzed using qualitative research methods, comments from respondents have consistently indicated that this staffing model increases the transfer of clinical and logistical knowledge among staff members working in the acute inpatient facility and the TCU.
Discussion
With greater numbers of increasingly complex patients transitioning from the hospital to SNF, health care systems need to expand the capacity of their skilled nursing systems, not only to provide clinical care, but also to support QI and medical education. The VABHS developed a physician staffing model with the goal of enriching physician practice and enhancing QI and educational opportunities in its SNF. The model offers an opportunity to improve transitions in care as physicians gain a greater knowledge of both the hospital and subacute clinical settings. This hospitalist rotation model may improve the knowledge necessary for caring for patients moving across care settings, as well as improve communication between settings. It also has served as a foundation for systematic innovation in QI and education at this institution. Clinical staff in the transitional care setting have reported positive effects of this model on clinical skills and patient care, educational opportunities, as well as a desire for replication in other health care systems.
The potential generalizability of this model requires careful consideration. The VABHS is a tertiary care integrated health care system, enabling physicians to work in multiple clinical settings. Other settings may not have the staffing or clinical volume to sustain such a model. In addition, this model may increase discontinuity in patient care as hospitalists move between acute and subacute settings and nonclinical roles. This loss of continuity may be a greater concern in the SNF setting, as the inpatient hospitalist model generally involves high provider turnover as shift work. Our survey included nurse managers, and not floor nurses due to survey administration limitations, and feedback may not have captured a comprehensive view from CLC staff. Moreover, some of the perceived positive impacts also may be related to professional and personal attributes of the physicians rather than the actual model of care. In addition, the survey response rate was 86%. However, the nature of the improvement work (focused on care transitions) and educational opportunities (interprofessional care) would likely not occur had the physicians been based in one clinical setting.
Other new physician staffing models have been designed to improve the continuity between the hospital, subacute, and outpatient settings. For example, the University of Chicago Comprehensive Care model pairs patients with trained hospitalists who provide both inpatient and outpatient care, thereby optimizing continuity between these settings.14 At CareMore Health System, high-risk patients also are paired with hospitalists, referred to as “extensivists,” who lead care teams that follow patients between settings and provide acute, postacute, and outpatient care.15 In these models, a single physician takes responsibility for the patient throughout transitions of care and through various care settings. Both models have shown reduction in hospital readmissions. One concern with such models is that the treatment teams need to coexist in the various settings of care, and the ability to impact and create systematic change within each environment is limited. This may limit QI, educational opportunities, and system level impact within each environment of care.
In comparison, the “transitionalist” model proposed here features hospitalist physicians rotating between the acute inpatient hospital and subacute care with dedicated time in each environment. This innovative organizational structure may enhance physician practice and enrich QI and educational opportunities in SNFs. Further evaluation will include the impact on quality metrics of patient care and patient satisfaction, as this model has the potential to influence quality, cost, and overall health outcomes.
Acknowledgments
We would like to thank Shivani Jindal, Matthew Russell, Matthew Ronan, Juman Hijab, Wei Shen, Sandra Vilbrun-Bruno, and Jack Earnshaw for their significant contributions to this staffing model. We would also like to thank Paul Conlin, Jay Orlander, and the leadership team of Veterans Affairs Boston Healthcare System for supporting this staffing model.
1. Forster AJ, Murff HJ, Peterson JF, Gandhi TK, Bates DW. Adverse drug events occurring following hospital discharge. J Gen Intern Med. 2005;20(4):317-323.
2. Murtaugh CM, Litke A. Transitions through postacute and long-term care settings: patterns of use and outcomes for a national cohort of elders. Med Care. 2002;40(3):227-236.
3. Burke RE, Whitfield EA, Hittle D, et al. Hospital readmission from post-acute care facilities: risk factors, timing, and outcomes. J Am Med Dir Assoc. 2016;17(3):249-255.
4. Mor V, Intrator O, Feng Z, Grabowski DC. The revolving door of rehospitalization from skilled nursing facilities. Health Aff (Millwood). 2010;29(1):57-64.
5. Tian W. An all-payer view of hospital discharge to postacute care, 2013: Statistical Brief #205. https://www.hcup-us.ahrq.gov/reports/statbriefs/sb205-Hospital-Discharge-Postacute-Care.jsp. Published May 2016. Accessed August 13, 2018.
6. Barnett ML, Grabowski DC, Mehrotra A. Home-to-home time–measuring what matters to patients and payers. N Engl J Med. 2017;377(1):4-6.
7. Golden AG, Silverman MA, Mintzer MJ. Is geriatric medicine terminally ill? Ann Intern Med. 2012;156(9):654-656.
8. Nazir A, Smalbrugge M, Moser A, et al. The prevalence of burnout among nursing home physicians: an international perspective. J Am Med Dir Assoc. 2018;19(1):86-88.
9. Coleman EA, Berenson RA. Lost in transition: challenges and opportunities for improving the quality of transitional care. Ann Intern Med. 2004;141(7):533-536.
10. Kim LD, Kou L, Hu B, Gorodeski EZ, Rothberg MB. Impact of a connected care model on 30-day readmission rates from skilled nursing facilities. J Hosp Med. 2017;12(4):238-244.
11. Gloth MF, Gloth MJ. A comparative effectiveness trial between a post-acute care hospitalist model and a community-based physician model of nursing home care. J Am Med Dir Assoc. 2011;12(5):384-386.
12. Baughman AW, Cain G, Ruopp MD, et al. Improving access to care by admission process redesign in a veterans affairs skilled nursing facility. Jt Comm J Qual Patient Saf. 2018;44(8):454-462.
13. Mixon A, Smith GR, Dalal A et al. The Multi-Center Medication Reconciliation Quality Improvement Study 2 (MARQUIS2): methods and implementation. Abstract 248. Present at: Society of Hospital Medicine Annual Meeting; 2018 Apr 8 – 11, 2018; Orlando, FL. https://www.shmabstracts.com/abstract/the-multi-center-medication-reconciliation-quality-improvement-study-2-marquis2-methods-and-implementation. Accessed August 13, 2018.
14. Meltzer DO, Ruhnke GW. Redesigning care for patients at increased hospitalization risk: the comprehensive care physician model. Health Aff (Millwood). 2014;33(5):770-777.
15. Powers BW, Milstein A, Jain SH. Delivery models for high-risk older patients: back to the future? JAMA. 2016;315(1):23-24.
Vendor CPOE for Renal Impairment
Hospitalized patients with renal impairment are vulnerable to adverse drug events (ADEs).[1, 2] Appropriate prescribing for patients with renal insufficiency is challenging because of the complexities of drug therapy within the wide spectrum of kidney disease.[3, 4, 5, 6] Accordingly, computerized physician order entry (CPOE) systems with clinical decision support may help prevent many ADEs by providing timely laboratory information, recommending renally adjusted doses, and by offering assistance with prescribing.[7, 8, 9]
Despite the proposed benefits of CPOE, outcomes vary greatly because of differences in technology.[10, 11, 12, 13] In particular, the type of decision support available to assist medication ordering in the setting of renal disease varies widely among current vendor systems. Given the uncertain benefits of CPOE, especially with the wide range of associated clinical decision support, we conducted this study to determine the impact of these systems on the rates of ADEs among hospitalized patients with kidney disease.
METHODS
This study was approved by the institutional review boards at each study site.
Design and Setting
We conducted a before‐and‐after study to evaluate the impact of newly implemented vendor CPOE systems in 5 community hospitals in Massachusetts. Although we reported on 6 hospitals in our baseline study,[14] 1 of these hospitals later chose not to implement CPOE, and therefore was not included in follow‐up. At the time of this study, 1 of the hospitals (site 3) had not yet achieved hospital‐wide implementation. Although CPOE had been adopted by most medical services at site 3, it had not yet been implemented in the emergency, obstetrical, or surgical departments. Thus, we limited our study to the medical services at this site. For the remaining sites, all admitting services were included with the exception of the psychiatric and neonatal services, which were excluded from both phases because they would have required different detection tools.
Participants
Patients aged 18 years with renal failure, exposed to potentially nephrotoxic and/or renally cleared medications, and admitted to any of the participating hospitals during the study period were eligible for inclusion. Of the patients meeting eligibility criteria, we randomly selected approximately 150 records per hospital in the preimplementation and postimplementation phases for a total sample of 1590 charts. The first phase of this study occurred from January 2005 to August 2006; the second phase began 6 months postimplementation and lasted from October 2008 to September 2010.
Principal Exposure
Each hospital independently selected a vendor CPOE system with variable clinical decision support capabilities: (1) sites 4 and 5 had basic CPOE only with no clinical decision support for renal disease; (2) sites 1 and 2 implemented rudimentary clinical decision support with laboratory display (eg, serum creatinine) whenever common renally related drugs were ordered; and (3) site 3 had the most advanced support in place where, in addition to basic order entry and lab checks, physicians were provided with suggested doses for renally cleared and/or nephrotoxic medications, as well as appropriate drug monitoring for medications with narrow therapeutic indices (eg, suggested dosages and frequencies for vancomycin and automated corollary laboratory monitoring).
Definitions
We screened for the presence of renal failure by a serum creatinine 1.5 mg/dL at the time of admission. However, the duration of renal impairment was not known. We defined 3 levels of renal insufficiency based on the calculated creatinine clearance (CrCl)15: mild (CrCl 5080 mL/min), moderate (1649 mL/min), and severe (15 mL/min). Subjects with a CrCl >80 mL/min were considered to have normal renal function and were excluded. Potentially nephrotoxic and/or renally cleared medications were then identified using an established knowledge base (see Supporting Information, Table 1, in the online version of this article).[16]
| Hospital Site | |||||||
|---|---|---|---|---|---|---|---|
| Baseline Characteristics | All Sites | 1 | 2 | 3 | 4 | 5 | P (Among All Sites)* |
| |||||||
| No. of patients | 815 | 170 | 156 | 143 | 164 | 182 | |
| Age, y, mean (range) | 72.2 (18.0102.0) | 79.2 (33102) | 77.3 (23101) | 65.6 (1898) | 70.7 (1896) | 69.2 (2096) | <0.01 |
| 1844 years, no. (%) | 68 (9.1) | 1 (0.67) | 8 (6.5) | 20 (14.9) | 15 (9.4) | 24 (13.4) | <0.01 |
| 4554 years, no. (%) | 67 (9.0) | 6 (4.0) | 5 (4.1) | 17 (12.7) | 16 (10.0) | 23 (12.9) | |
| 5564 years, no. (%) | 79 (10.6) | 15 (10.0) | 12 (9.8) | 23 (17.2) | 13 (8.1) | 16 (8.9) | |
| 6574 years, no. (%) | 104 (13.9) | 20 (13.3) | 12 (9.8) | 16 (11.9) | 30 (18.8) | 26 (14.5) | |
| 7584 years, no. (%) | 197 (26.4) | 44 (29.3) | 36 (29.3) | 24 (17.9) | 49 (30.6) | 44 (24.6) | |
| 85 years, no. (%) | 231 (31.0) | 64 (42.7) | 50 (40.7) | 34 (25.4) | 37 (23.1) | 46 (25.7) | |
| Sex | |||||||
| Male, no. (%) | 427 (57.0) | 66 (44.0) | 60 (48.8) | 82 (60.7) | 105 (65.2) | 114 (63.7) | <0.01 |
| Female, no. (%) | 321 (43.0) | 84 (56.0) | 63 (51.2) | 53 (39.3) | 56 (34.8) | 65 (36.3) | |
| Race | |||||||
| Caucasian, no. (%) | 654 (87.4) | 129 (86.0) | 118 (95.9) | 126 (93.3) | 129 (80.1) | 152 (84.9) | <0.01 |
| Hispanic, no. (%) | 25 (3.3) | 2 (1.3) | 0 (0) | 1 (0.74) | 13 (8.1) | 9 (5.0) | |
| African American, no. (%) | 45 (6.0) | 12 (8.0) | 4 (3.3) | 5 (3.7) | 13 (8.1) | 11 (6.2) | |
| Native American, no. (%) | 0 (0) | 0 (0) | 0 (0) | 0 (0) | 0 (0) | 0 (0) | |
| Asian, no. (%) | 13 (1.7) | 1 (0.81) | 1 (0.81) | 2 (1.5) | 5 (3.1) | 4 (2.2) | |
| Other, no. (%) | 7 (0.94) | 2 (1.3) | 0 (0) | 1 (0.74) | 1 (14.3) | 3 (1.7) | |
| Not recorded, no. (%) | 4 (0.53) | 4 (2.7) | 0 (0) | 0 (0.0) | 0 (0) | 0 (0) | |
| Initial severity of renal dysfunction | |||||||
| Mild, CrCl 5080 mL/min, no. (%) | 60 (7.4) | 4 (2.4) | 5 (3.2) | 5 (3.5) | 14 (8.5) | 32 (17.6) | <0. 01 |
| Moderate, CrCl 1649 mL/min, no. (%) | 388 (47.6) | 84 (49.4) | 71 (45.5) | 80 (55.9) | 76 (46.3) | 77 (42.3) | |
| Severe, CrCl <15 mL/min, no. (%) | 367 (45.0) | 82 (48.2) | 80 (51.3) | 58 (40.6) | 74 (45.1) | 73 (40.1) | |
| LOS, d, median (IQR) | 4.0 (26) | 4.0 (37) | 3.0 (25.5) | 4.0 (27) | 4.0 (27) | 4.0 (26) | 0.02 |
| DRG‐weighted LOS, d, median (IQR) | 5.0 (3.76.7) | 5.5 (46.7) | 5.0 (3.46.2) | 5.6 (4.36.7) | 5.0 (3.36.7) | 5.0 (4.26.7) | 0.27 |
In both phases of our study, only medications that were potentially nephrotoxic and/or renally cleared were included as potential cases; all other drugs were excluded. We defined an ADE as any drug‐related injury. These were considered preventable if they were due to an error at the time of order entry (eg, a doubling of creatinine secondary to an overdose of gentamicin or failure to order corollary drug levels for monitoring). A nonpreventable ADE was any drug‐related injury in which there was no error at the time of order entry (eg, a doubling of creatinine despite appropriate dosing of lisinopril).[17] A medication error was an error anywhere in the process of prescribing, transcribing, dispensing, administering, or monitoring a drug, but with no potential for harm or injury (eg, an order for an oral medication with no route specified when it was clear that the oral route was intended).[18] A potential ADE was an error with the potential to cause harm, but not resulting in injury, either because it was intercepted (eg, an order for ketorolac for a patient with renal failure, but caught by a pharmacist) or because of chance (eg, administering enoxaparin to a patient with severe renal dysfunction but without hemorrhage).
All study investigators underwent standardized training using a curriculum developed by the Center for Patient Safety Research and Practice (
Main Outcome Measures
The primary outcome was the rate of preventable ADEs. Secondary outcomes were the rates of potential ADEs and overall ADEs. All outcomes were related to nephrotoxicity or accumulation of a renally excreted medication.
Data collection and classification strategies were identical in both phases of our study.[14] We reviewed physician orders, medication lists, laboratory reports, admission histories, progress and consultation notes, discharge summaries, and nursing flow sheets, screening for the presence of medication incidents using an adaptation of the Institute for Healthcare Improvement's trigger tool, selected for its high sensitivity, reproducibility, and ease of use.[22, 23] In our adaptation of the tool, we excluded lidocaine, tobramycin, amikacin, and theophylline levels because of their infrequency. For each trigger found, a detailed description of the incident was extracted for detailed review. An example of a trigger is the use of sodium polystyrene, which may possibly indicate an overdose of potassium or a medication side effect.
Subsequently, each case was then independently reviewed by two investigators (A.A.L., M.A., B.C., S.R.S., M.C., N.K., E.Z., and G.S.)each assigned to at least 1 siteand blinded to prescribing physician and hospital to determine whether nephrotoxicity or injury from drug accumulation was present (see Supporting Information, Figure 1, in the online version of this article).[17] First, incidents were classified as ADEs, potential ADEs, or medication errors with no potential for injury. Second, ADEs and potential ADEs were rated according to severity. When nephrotoxic drugs were ordered, event severity was classified according to the elevation in serum creatinine24: increases of 10% were considered potential ADEs (near misses); increases of 10% to 100% were significant ADEs; and increases of 100% were serious ADEs. Changes in creatinine that were not associated with inappropriate medication orders were excluded. For renally excreted drugs with no potential for nephrotoxicity (eg, enoxaparin), we used clinical judgment to classify events as significant (eg, rash), severe (eg, 2‐unit gastrointestinal bleed), life threatening (eg, transfer to an intensive care unit), or fatal categories, as based on earlier work.[25] Disagreements were resolved by consensus. We had a score of 0.70 (95% confidence interval [CI]: 0.61‐0.80) for incident type, indicating excellent overall agreement.
Statistical Analysis
Baseline characteristics between hospitals were compared using the Fisher exact test for categorical variables and 1‐way analysis of variance for continuous variables. The occurrence of each outcome was determined according to site. To facilitate comparisons between sites, rates were expressed as number of events per 100 admissions with 95% CIs. To account for hospital effects in the analysis when comparing pre‐ and postimplementation rates of ADEs and potential ADEs, we developed a fixed‐effects Poisson regression model. To explore the independent effects of each system, a stratified analysis was performed to compare average rates of each outcome observed.
RESULTS
The outcomes of 775 patients in the baseline study were compared with the 815 patients enrolled during the postimplementation phase.[14] Among those in the postimplementation phase (Table 1), the mean age was 72.2 years, and they were predominantly male (57.0%). The demographics of the patients admitted to each of the 5 sites varied widely (P<0.01). Most patients had moderate to severe renal dysfunction.
Overall, the rates of ADEs were similar between the pre‐ and postimplementation phases (8.9/100 vs 8.3/100 admissions, respectively; P=0.74) (Table 2). However, there was a significant decrease in the rate of preventable ADEs, the primary outcome of interest, following CPOE implementation (8.0/100 vs 4.4/100 admissions; P<0.01). A reduction in preventable ADEs was observed in every hospital except site 4, where only basic order entry was introduced. However, there was a significant increase in the rates of nonpreventable ADEs (0.90/100 vs 3.9/100 admissions; P<0.01) and potential ADEs (55.5/100 vs 136.8/100 admissions; P<0.01).
| Rate/100 Admissions (95% CI) | ||||||||||||||||||||
|---|---|---|---|---|---|---|---|---|---|---|---|---|---|---|---|---|---|---|---|---|
| Total No. (%) | All Sites | Site 1 | Site 2 | Site 3 | Site 4 | Site 5 | ||||||||||||||
| Event | Pre | Post | Pre | Post | P* | Pre | Post | P | Pre | Post | P | Pre | Post | P | Pre | Post | P | Pre | Post | P |
| ||||||||||||||||||||
| ADEs | 69 (13.8) | 68 (5.7) | 8.9 (7.0 1.2) | 8.3 (6.50.5) | 0.74 | 9.8 (6.015.1) | 10.0 (6.015.5) | 0.96 | 11.0 (6.517.4) | 7.7 (4.1 12.9) | 0.34 | 12.4 (7.5 19.1) | 4.2 (1.7 8.5) | 0.02 | 4.1 (1.68.3) | 13.4 (8.619.8) | 0.01 | 7.1 (3.712.2) | 6.0 (3.110.4) | 0.71 |
| Preventable | 62 | 36 | 8.0 (6.2 10.2) | 4.4 (3.16.0) | <0.01 | 8.2 (4.713.1) | 7.1 (3.811.8) | 0.70 | 10.3 (6.016.5) | 5.8 (2.8 10.4) | 0.17 | 12.4 (7.519.1) | 0 (0 0.03) | <0.01 | 3.4 (1.27.3) | 7.9 (4.413.1) | 0.11 | 5.8 (2.810.5) | 1.1 (0.183.4) | 0.03 |
| Nonpreventable | 7 | 32 | 0.90 (0.39 1.7) | 3.9 (2.75.4) | <0.01 | 1.6 (0.414.3) | 2.9 (1.16.3) | 0.42 | 0.69 (0.043.04) | 1.9 (0.48 5.0) | 0.37 | 0 (00.03) | 4.2 (1.7 8.5) | <0.01 | 0.68 (0.043.0) | 5.5 (2.6 9.9) | 0.05 | 1.3 (0.21, 4.0) | 4.9 (2.48.9) | 0.09 |
| Potential ADEs | 430 (86.2) | 1115 (93.5) | 55.5 (50.4 60.9) | 136.8 (128.9145.0) | <0.01 | 65.0 (54.077.4) | 141.1 (124.1159.8) | <0.01 | 57.2 (45.870.5) | 98.7 (83.9 115.1) | <0.01 | 44.8 (34.856.6) | 103.5 (87.7 121.1) | <0.01 | 59.2 (47.645.8) | 132.9 (116.1151.4) | <0.01 | 49.0 (38.860.9) | 195.1 (175.5216.1) | <0.01 |
| Intercepted | 16 | 24 | 2.1 (1.2 3.2) | 2.9 (1.94.3) | <0.24 | 3.3 (1.36.6) | 4.7 (2.28.8) | 0.50 | 2.1 (0.515.4) | 1.3 (0.21 4.0) | 0.60 | 1.4 (0.234.3) | 2.8 (0.87 6.5) | 0.41 | 2.0 (0.515.3) | 4.9 (2.2 9.1) | 0.20 | 1.3 (0.214.0) | 1.1 (0.183.4) | 0.87 |
| Nonintercepted | 414 | 1091 | 53.4 (48.4 58.7) | 133.9 (126.1142.0) | <0.01 | 61.7 (51.173.8) | 136.5 (119.754.8) | <0.01 | 55.2 43.968.2) | 97.4 (82.8 113.8) | <0.01 | 43.4 (33.655.1) | 100.7 (85.1 118.1) | <0.01 | 57.1 (45.8 70.2) | 128.0 (111.5146.2) | <0.01 | 47.7 (37.759.5) | 194.0 (174.4214.9) | <0.01 |
Stratified Analysis
To account for differences in technology, we performed a stratified analysis (Table 3). As was consistent with the overall study estimates, the rates of nonpreventable ADEs and potential ADEs increased with all 3 interventions. In contrast, we found that the changes in preventable ADE rates were related to the level of clinical decision support, where the greatest benefit was associated with the most sophisticated decision support system (P=0.03 and 0.02 for comparisons between advanced vs rudimentary decision support and basic order entry only, respectively). There was no difference in preventable ADE rates at sites without decision support (4.6/100 vs 4.3/100 admissions; P=0.87); with rudimentary clinical decision support, there was a trend toward a decrease in the preventable ADE rate, which did not meet statistical significance (9.1/100 vs 6.4/100 admissions; P=0.22), and, the greatest reduction was seen with advanced clinical decision support (12.4/100 vs 0/100 admissions; P<0.01).
| Rate per 100 Admissions by Level of Clinical Decision Support (95% CI) | |||||||||
|---|---|---|---|---|---|---|---|---|---|
| Basic CPOE Only (Sites 4 and 5) | CPOE and Lab Display (Sites 1 and 2) | CPOE, Lab Display, and DrugDosing Check (Site 3) | |||||||
| Incident | Pre | Post | P | Pre | Post | P | Pre | Post | P |
| |||||||||
| ADEs | 5.6 (3.48.7) | 9.5 (6.613.2) | 0.08 | 10.3(7.314.3) | 8.9 (6.012.5) | 0.55 | 12.4 (7.5319.1) | 4.2 (1.78.5) | 0.02 |
| Preventable | 4.6 (2.67.5) | 4.3 (2.56.9) | 0.87 | 9.1 (6.312.8) | 6.4 (4.19.6) | 0.22 | 12.4 (7.5319.1) | 0.00 (00.03) | <0.01 |
| Nonpreventable | 0.99 (0.24 2.6) | 5.2 (3.28.0) | <0.01 | 1.2 (0.382.8) | 2.5 (1.14.6) | 0.24 | 0.00 (00.03) | 4.2 (1.78.5) | <0.01 |
| Potential ADEs | 54.0 (46.162.7) | 165.6 (152.4179.5) | <0.01 | 61.6 (53.570.5) | 120.9 (109.3133.2) | <0.01 | 44.8 (34.856.6) | 103.5 (87.7121.1) | <0.01 |
| Intercepted | 1.7 (0.593.6) | 2.9 (1.45.1) | 0.30 | 2.7 (1.34.9) | 3.1 (1.55.4) | 0.76 | 1.4 (0.234.3) | 2.8 (0.876.5) | 0.42 |
| Nonintercepted | 52.3 (44.660.9) | 162.7 (149.6176.5) | <0.01 | 58.8 (50.967.5) | 117.8 (106.4130.0) | <0.01 | 43.4 (33.655.1) | 100.7 (85.1118.1) | <0.01 |
Severity of Events
We further analyzed our data based on event severity (Table 4). Among preventable ADEs, only 1 fatal event was observed, which occurred after CPOE implementation. Here, a previously opioid‐nave patient received intravenous morphine for malignant pain. Within the first 24 hours, the patient received 70.2 mg of intravenous morphine, resulting in a decreased level of consciousness. The patient expired the following day. Furthermore, following implementation, among preventable ADEs, a reduction in significant events was seen (P=0.02) along with a nonsignificant reduction in the rate of serious events (P=0.06). However, the rate of preventable life‐threatening events was not different (P=0.96). The nonpreventable ADE rate rose during the postimplementation period for both serious (P=0.03) and significant events (P<0.01). The risk of fatal and life‐threatening nonpreventable ADEs did not change. The potential ADE rate increased following implementation for all severities (P<0. 01).
| Preimplementation | Postimplementation | ||||
|---|---|---|---|---|---|
| Incident | No. (%) | Average Rate/100 Admissions (95% CI)* | No. (%) | Average Rate/100 Admissions (95% CI)* | P |
| |||||
| All ADEs | |||||
| Fatal | 0 (0) | 0.00 (00.0047) | 1 (1.4) | 0.12 (0.0070.54) | 0.52 |
| Lifethreatening | 3 (4.3) | 0.39 (0.101.0) | 3 (4.4) | 0.37 (0.09 0.95) | 0.95 |
| Serious | 34 (49.3) | 4.4 (3.16.0) | 32 (47.1) | 3.9 (2.75.4) | 0.65 |
| Significant | 32 (46.4) | 4.1 (2.95.7) | 32 (47.1) | 3.9 (2.75.4) | 0.84 |
| Total | 69 (100) | 8.9 (7.011.2) | 68 (100) | 8.3 (6.510.5) | 0.74 |
| Preventable ADEs | |||||
| Fatal | 0 (0) | 0.00 (00.0047) | 1 (2.7) | 0.00 (00.0045) | 0.52 |
| Lifethreatening | 2 (3.2) | 0.26 (0.040.80) | 2 (5.6) | 0.25 (0.040.76) | 0.96 |
| Serious | 31 (50.0) | 4.0 (2.85.6) | 19 (52.8) | 2.3 (1.43.5) | 0.06 |
| Significant | 29 (46.8) | 3.7 (2.55.3) | 14 (38.9) | 1.7 (0.972.8) | 0.02 |
| Total | 62 (100) | 8.0 (6.210.2) | 36 (100) | 4.4 (3.16.0) | <0.01 |
| Nonpreventable ADEs | |||||
| Fatal | 0 (0) | 0.00 (00.0047) | 0 (0) | 0.00 (00.0045) | NS |
| Lifethreatening | 1 (14.2) | 0.13 (0.0070.57) | 1 (3.1) | 0.12 (0.0070.54) | 0.97 |
| Serious | 3 (42.9) | 0.39 (0.101.0) | 13 (40.6) | 1.6 (0.882.6) | 0.03 |
| Significant | 3 (42.9) | 0.39 (0.101.0) | 18 (56.3) | 2.2 (1.33.4) | <0.01 |
| Total | 7 (100) | 0.90 (0.391.7) | 32 (100) | 3.9 (2.75.4) | <0.01 |
| All potential ADEs | |||||
| Lifethreatening | 5 (1.2) | 0.65 (0.231.4) | 33 (3.0) | 4.0 (2.85.6) | <0.01 |
| Serious | 233 (54.2) | 30.1 (26.434.1) | 429 (38.4) | 52.6 (47.857.8) | <0.01 |
| Significant | 192 (44.6) | 24.8 (21.428.4) | 653 (58.6) | 80.1 (74.186.4) | <0.01 |
| Total | 430 (100) | 55.5 (50.460.9) | 1115 (100) | 136.8 (128.9145.0) | <0.01 |
| Intercepted potential ADEs | |||||
| Lifethreatening | 0 (0) | 0.00 (00.0047) | 1 (4.2) | 0.12 (0.0070.54) | 0.52 |
| Serious | 5 (31.2) | 0.65 (0.231.4) | 13 (54.2) | 1.6 (0.882.6) | 0.09 |
| Significant | 11 (68.8) | 1.4 (0.74 2.4) | 10 (41.6) | 1.2 (0.622.2) | 0.74 |
| Total | 16 (100) | 2.1 (1.23.2) | 24 (100) | 2.9 (1.94.3) | 0.24 |
| Nonintercepted potential ADEs | |||||
| Lifethreatening | 5 (1.2) | 0.65 (0.231.4) | 32 (2.9) | 3.9 (2.75.4) | <0.01 |
| Serious | 228 (55.1) | 29.4 (25.833.4) | 416 (38.1) | 51.0 (46.356.1) | <0.01 |
| Significant | 181 (43.7) | 23.4 (20.126.9) | 643 (58.9) | 78.9 (73.085.2) | <0.01 |
| Total | 414 (100) | 53.4 (48.458.7) | 1091 (100) | 133.9(126.1142.0) | <0.01 |
Case Reviews
In total, there were 36 preventable ADEs identified during the postimplementation phase (Table 5). Of these, inappropriate renal dosing accounted for 26 preventable ADEs, which involved antibiotics (eg, gentamicin‐induced renal failure), opioids (eg, over sedation from morphine), ‐blockers (eg, hypotension from atenolol), angiotensin‐converting enzyme inhibitors (eg, renal failure with hyperkalemia secondary to lisinopril), and digoxin (eg, bradyarrhythmia and toxicity). The use of contraindicated medications resulted in 7 preventable ADEs (eg, prescribing glyburide in the setting of severe renal impairment).[26] The remaining 3 preventable ADEs stemmed from unmonitored use of vancomycin.
| ADEs, Preventable, No. (Rate per 100 Admissions)* | ADEs, Nonpreventable, No. (Rate per 100 Admissions)* | ||||||
|---|---|---|---|---|---|---|---|
| Drug Class | Preimplementation | Postimplementation | P (for Entire Drug Class) | Preimplementation | Postimplementation | P (for Drug Class) | Drugs Involved |
| |||||||
| Cardiovascular | 20 (2.6) | 18 (2.2) | 0.63 | 4 (0.52) | 16 (2.0) | 0.02 | Atenolol, bumetanide, captopril, digoxin, furosemide, hydralazine, hydrochlorothiazide, lisinopril, sotalol, spironolactone |
| Diuretics | 1 (0.13) | 2 (0.25) | 1 (0.13) | 9 (1.1) | |||
| ‐blockers | 0 (0.00) | 2 (0.25) | 1 (0.13) | ||||
| ACE inhibitors and ARBs | 16 (2.1) | 10 (1.2) | 2 (0.26) | 7 (0.86) | |||
| Antiarrhythmic | 3 (0.39) | 3 (0.37) | |||||
| Vasodilator | 0 (0.00) | 1 (0.12) | |||||
| Analgesics | 28 (3.6) | 4 (0.49) | 0.0002 | 1 (0.13) | 5 (0.61) | 0.15 | Acetaminophen and combination pills containing acetaminophen: Percocet (oxycodone and acetaminophen), Tylenol #3 (codeine and acetaminophen), Vicodin (hydrocodone and acetaminophen), fentanyl, hydrocodone, meperidine, morphine, oxycodone |
| Narcotic | 13 (1.7) | 4 (0.49) | 0 (0.00) | 5 (0.61) | |||
| Non‐narcotic | 15 (1.9) | 0 (0.00) | 1 (0.13) | 0 | |||
| Antibiotics | 8 (1.0) | 13 (1.6) | 0.33 | 1 (0.13) | 9 (1.1) | 0.04 | Amikacin, ampicillin and sulbactam, ciprofloxacin, cefazolin, cefuroxime, gatifloxacin, gentamicin, levofloxacin, metronidazole, piperacillin and tazobactam, tobramycin, vancomycin |
| Neurotropic drugs | 2 (0.26) | 0 (0.00) | 0.28 | 0 | 0 | Lithium, midazolam | |
| Sedatives | 1 (0.13) | 0 (0.00) | |||||
| Antipsychotics | 1 (0.13) | 0 (0.00) | |||||
| Diabetes | 0 | 1 (0.12) | 0.52 | 0 | 1 (0.12) | 0.52 | Glipizide, glyburide |
| Oral antidiabetics | 0 | 1 (0.12) | 1 (0.12) | ||||
| Other drugs | 4 (0.52) | 0 (0.00) | 0.13 | 1 (0.13) | 1 (0.12) | 0.97 | Allopurinol, famotidine |
| Gastrointestinal drugs | 1 (0.13) | 0 (0.00) | |||||
| Other | 3 (0.39) | 0 (0.00) | 0 | 1 (0.12) | |||
DISCUSSION
We evaluated the use of vendor CPOE for hospitalized patients with renal disease and found that it was associated with a 45% reduction in preventable ADEs related to nephrotoxicity and accumulation of renally excreted medications. The impact of CPOE appeared to be related to the level of associated clinical decision support, where only the most advanced system was associated with benefit. We observed a significant increase in potential ADEs with all levels of intervention. Overall, these findings suggest that vendor‐developed applications with appropriate decision support can reduce the occurrence of renally related preventable ADEs, but careful implementation is needed if the potential ADE rate is to fall.
Many of the benefits of CPOE come from clinical decision support.[11] When applied to patients with renal impairment, CPOE with clinical decision support has been associated with decreased lengths of stay,[16, 27] reduced use of contraindicated medications,[28, 29, 30] improved dosing and drug monitoring,[16, 31, 32] and improved general prescribing practices.[29, 33] Even so, the observed benefit of CPOE on ADE rates has been variable, with some studies reporting reductions,[27, 34] whereas others are unable to detect differences.[16, 31] These studies, however, limited their case definition of ADEs to strictly declining renal function,[16, 31, 34] or adverse events directly resulting from anti‐infective drugs.[27] In contrast, our study accounted for nephrotoxicity and systemic toxicity from drug accumulation. Using this broader definition, we were able to detect large reductions in the rates of preventable ADEs following CPOE adoption.
Successful decision support is simple, intuitive, and provides speedy information that integrates seamlessly into the clinical workflow.[35, 36] However, information delivery, although necessary, is insufficient for improving safety. For instance, passive alerts are often ignored, deferred, or overridden.[30, 37, 38] Demonstrating this, Quartarolo et al. found that informing physicians of the presence of renal impairment using automated reporting of glomerular filtration rates did not change prescribing behavior.[39] In contrast, providing active feedback (with dosing recommendations) was observed to be more useful in effecting change.[40] Chertow et al. further showed that providing an adjusted dose list with a default dose and frequency at the time of order entry for patients with renal insufficiency improved appropriate ordering and was associated with a decreased length of stay.[16] Altogether, these studies help to explain why only CPOE with clinical decision support equipped to provide renally adjusted dosing and monitoring was associated with a reduction in preventable ADEs in our study.
However, in contrast to reports of internally developed systems,[20, 25] potential ADE rates actually rose during the follow‐up portion of our study. These appeared to be chiefly related to customized order sets with the potential of overdosing drugs through therapeutic duplication, a problem that is commonly known to be associated with CPOE (ie, new orders that overlap with other new or active medication orders, which may be the same drug itself or from within the same drug class, with the risk of overdose).[41, 42] Of note, our findings give rise to several key implications. First, hospitals implementing vendor‐developed CPOE systems may be at greater risk of incurring potential ADEs compared to those using home‐grown systems, which have comparatively gone through more cycles of internal refinement. As such, it is necessary to monitor for issues postimplementation and respond with appropriate changes to achieve successful system performance.[35, 36] Second, although the rate of potential ADEs (near misses) increased, preventable ADEs decreased because some of these errors were intercepted, whereas others were averted simply because of chance. Of note, not all potential ADEs have the same potential for injury; more serious cases are more likely to result in actual ADEs (eg, failure to renally dose acetaminophen likely poses less potential for harm than prescribing a full dose of enoxaparin in the setting of severe renal failure). Third, we found that most potential ADEs could have been averted with a combination of basic (dosing guidance and drug‐drug interactions checks) and advanced decision support (medication‐associated laboratory testing and drug‐disease interactions).[43] Therefore, further refinements to existing software are needed to maximize safety outcomes.
Our study has some limitations. This study was not a randomized controlled trial, and thus is subject to potential confounding. Although 6 hospitals were involved at the study inception,[14] one of these hospitals eventually opted not to implement CPOE, and further declined to participate as a control site. Therefore, we cannot exclude confounding from secular trends because we had no contemporaneous control group. However, the introduction of CPOE was the main medication safety‐oriented intervention during the study interval, thus arguing against major confounding by cointervention. Second, even though it is possible that classification bias may have been introduced between the preimplementation and postimplementation portions of our study, especially given the passage of time, it is unlikely. Study personnel underwent training using a curriculum designed to maintain continuity across projects, minimize individual variability, and optimize reproducibility in data collection and classification, as in a number of previous studies.[14, 17, 19, 20, 21] Third, our study is limited by a heterogeneous intervention, as varying levels of decision support were introduced. However, this reflects usual practice and may be construed as a strength as we were able to describe the impact of different types of decision support. Fourth, we enrolled patients with a large spectrum of renal impairment, and our findings are not specific to any particular subgroup. However, our wide recruitment strategy also enhances the generalizability. Finally, our study was restricted to patients who were exposed to potentially nephrotoxic and/or renally cleared drugs. As such, we could not determine whether advanced decision support helped to eliminate the use of some potentially dangerous medications altogether, as these cases would have been excluded from our study. It is possible, therefore, that our study findings underestimate the true benefit of clinical decision support.
In conclusion, vendor CPOE implementation in 5 community hospitals was associated with a 45% reduction in preventable ADE rates among patients with renal impairment. Measurable benefit was associated with advanced decision support capable of lab display, dosing guidance, and medication‐associated laboratory testing. Although the potential benefits of CPOE systems are far reaching, achieving the desired safety benefits will require appropriate decision support, tracking of problems that arise, and systematic approaches to eliminating them.
Acknowledgments
The authors thank Kathy Zigmont, RN, and Cathy Foskett, RN (Brigham and Women's Hospital, Division of General Internal Medicine and Primary Care) for the chart review and data collection at the participating study sites.
Disclosures: The Rx Foundation and Commonwealth Fund supported the study. They commented on its design, but were not involved in data collection, data management, analysis, interpretation, or writing of the manuscript. Dr. Leung is supported by a Clinical Fellowship Award from Alberta Innovates Health Solutions and by a Fellowship Award from the Canadian Institutes for Health Research. Dr. Schiff received financial support from the FDA CPOE Task Order and the Commonwealth Fund. Ms. Keohane served as a consultant to the American College of Obstetrician and Gynecologists and as a reviewer for the VRQC Program. She received honoraria for a presentation on Patient Safety in 2010, sponsored by Abbott Nutrition International, and a lecture on Nurse Interruptions in Medication Administration by Educational Review Systems. Dr. Coffey received an honorarium from Meditech for speaking on social networking at Physician/CIO Forum in 2009. Dr. Kaufman participates in an advisory group with Siemens Medical Solutions. Dr. Zimlichman received support from the Rx Foundation and the Commonwealth Fund. Dr. Bates holds a minority equity position in the privately held company Medicalis, which develops Web‐based decision support for radiology test ordering, and has served as a consultant to Medicalis. He serves as an advisor to Calgary Scientific, which makes technologies that enable mobility within electronic health records. He is on the clinical advisory board for Patient Safety Systems, which provides a set of approaches to help hospitals improve safety. He has received funding support from the Massachusetts Technology Consortium. Ms. Amato, Dr. Simon, Dr. Cadet, Ms. Seger, and Ms. Yoon have no disclosures relevant to this study.
- , , . Drug Prescribing in Renal Failure: Dosing Guidelines for Adults and Children: American College of Physicians; 2007.
- , . Management of drug toxicity in patients with renal insufficiency. Nat Rev Nephrol. 2010;6(6):317–318.
- , , , . Use of renal risk drugs in hospitalized patients with impaired renal function—an underestimated problem? Nephrol Dial Transplant. 2006;21(11):3164–3171.
- , , , et al. Medication misuse in hospitalized patients with renal impairment. Int J Qual Health Care. 2003;15(4):331–335.
- , , , . Impact of a renal drug dosing service on dose adjustment in hospitalized patients with chronic kidney disease. Ann Pharmacother. 2009;43(10):1598–1605.
- , . Drug dosing in chronic kidney disease. Med Clin North Am. 2005;89(3):649–687.
- , , , et al. Systems analysis of adverse drug events. ADE Prevention Study Group. JAMA. 1995;274(1):35–43.
- , , , , , . The epidemiology of prescribing errors: the potential impact of computerized prescriber order entry. Arch Intern Med. 2004;164(7):785–792.
- , , . Factors related to errors in medication prescribing. JAMA. 1997;277(4):312–317.
- , , , et al. Role of computerized physician order entry systems in facilitating medication errors. JAMA. 2005;293(10):1197–1203.
- , , , , . Mixed results in the safety performance of computerized physician order entry. Health Aff (Millwood). 2010;29(4):655–663.
- , , , et al. The effect of computerized physician order entry with clinical decision support on the rates of adverse drug events: a systematic review. J Gen Intern Med. 2008;23(4):451–458.
- , , . The impact of computerized physician medication order entry in hospitalized patients—a systematic review. Int J Med Inform. 2008;77(6):365–376.
- , , , et al. Occurrence of adverse, often preventable, events in community hospitals involving nephrotoxic drugs or those excreted by the kidney. Kidney Int. 2009;76(11):1192–1198.
- , . Prediction of creatinine clearance from serum creatinine. Nephron. 1976;16(1):31–41.
- , , , et al. Guided medication dosing for inpatients with renal insufficiency. JAMA. 2001;286(22):2839–2844.
- , , , , . Adverse drug events and medication errors: detection and classification methods. Qual Saf Health Care. 2004;13(4):306–314.
- , , , , . Relationship between medication errors and adverse drug events. J Gen Intern Med. 1995;10(4):199–205.
- , , , et al. Incidence of adverse drug events and potential adverse drug events. Implications for prevention. ADE Prevention Study Group. JAMA. 1995;274(1):29–34.
- , , , et al. Effect of computerized physician order entry and a team intervention on prevention of serious medication errors. JAMA. 1998;280(15):1311–1316.
- , , , et al. Adverse drug event rates in six community hospitals and the potential impact of computerized physician order entry for prevention. J Gen Intern Med. 2010;25(1):31–38.
- , , . Adverse drug event trigger tool: a practical methodology for measuring medication related harm. Qual Saf Health Care. 2003;12(3):194–200.
- Institute for Healthcare Improvement: IHI Trigger Tool for Measuring Adverse Drug Events. 2011. Available at: http://www.ihi.org/knowledge/Pages/Tools/TriggerToolforMeasuringAdverseDrugEvents.aspx. Accessed February 1, 2013.
- , , , . Renal safety of two analgesics used over the counter: ibuprofen and aspirin. Clin Pharmacol Ther. 1986;40(4):373–377.
- , , , et al. The impact of computerized physician order entry on medication error prevention. J Am Med Inform Assoc. 1999;6(4):313–321.
- , , . Prolonged sulfonylurea‐induced hypoglycemia in diabetic patients with end‐stage renal disease. Am J Kidney Dis. 2000;35(3):500–505.
- , , , et al. A computer‐assisted management program for antibiotics and other antiinfective agents. N Engl J Med. 1998;338(4):232–238.
- , , , et al. Alert system for inappropriate prescriptions relating to patients' clinical condition. Methods Inf Med. 2009;48(6):566–573.
- , , , , , . Computerized clinical decision support during medication ordering for long‐term care residents with renal insufficiency. J Am Med Inform Assoc. 2009;16(4):480–485.
- , , . A trial of automated decision support alerts for contraindicated medications using computerized physician order entry. J Am Med Inform Assoc. 2005;12(3):269–274.
- , , , , . Effects of clinical decision support on initial dosing and monitoring of tobramycin and amikacin. Am J Health Syst Pharm. 2011;68(7):624–632.
- , , , , , . Computerized decision support for medication dosing in renal insufficiency: a randomized, controlled trial. Ann Emerg Med. 2010;56(6):623–629.
- , , , . Implementation of rules based computerised bedside prescribing and administration: intervention study. BMJ. 2000;320(7237):750–753.
- , , , et al. Effect of computer‐based alerts on the treatment and outcomes of hospitalized patients. Arch Intern Med. 1994;154(13):1511–1517.
- , , , et al. Ten commandments for effective clinical decision support: making the practice of evidence‐based medicine a reality. J Am Med Inform Assoc. 2003;10(6):523–530.
- , , . Computerized decision support systems: improving patient safety in nephrology. Nat Rev Nephrol. 2011;7(6):348–355.
- , , , et al. Impact of a computerized alert during physician order entry on medication dosing in patients with renal impairment. Proc AMIA Symp. 2002:577–581.
- , , , et al. A computerized provider order entry intervention for medication safety during acute kidney injury: a quality improvement report. Am J Kidney Dis. 2010;56(5):832–841.
- , , . Reporting of estimated glomerular filtration rate: effect on physician recognition of chronic kidney disease and prescribing practices for elderly hospitalized patients. J Hosp Med. 2007;2(2):74–78.
- , , , , . Drug dosage in patients with renal failure optimized by immediate concurrent feedback. J Gen Intern Med. 2001;16(6):369–375.
- , , , et al. Factors contributing to an increase in duplicate medication order errors after CPOE implementation. J Am Med Inform Assoc. 2011;18(6):774–782.
- , , , et al. Impact of Vendor Computerized Physician Order Entry in Community Hospitals. J Gen Intern Med. 2012;27(7):801–807.
- , , , et al. Medication‐related clinical decision support in computerized provider order entry systems: a review. J Am Med Inform Assoc. 2007;14(1):29–40.
Hospitalized patients with renal impairment are vulnerable to adverse drug events (ADEs).[1, 2] Appropriate prescribing for patients with renal insufficiency is challenging because of the complexities of drug therapy within the wide spectrum of kidney disease.[3, 4, 5, 6] Accordingly, computerized physician order entry (CPOE) systems with clinical decision support may help prevent many ADEs by providing timely laboratory information, recommending renally adjusted doses, and by offering assistance with prescribing.[7, 8, 9]
Despite the proposed benefits of CPOE, outcomes vary greatly because of differences in technology.[10, 11, 12, 13] In particular, the type of decision support available to assist medication ordering in the setting of renal disease varies widely among current vendor systems. Given the uncertain benefits of CPOE, especially with the wide range of associated clinical decision support, we conducted this study to determine the impact of these systems on the rates of ADEs among hospitalized patients with kidney disease.
METHODS
This study was approved by the institutional review boards at each study site.
Design and Setting
We conducted a before‐and‐after study to evaluate the impact of newly implemented vendor CPOE systems in 5 community hospitals in Massachusetts. Although we reported on 6 hospitals in our baseline study,[14] 1 of these hospitals later chose not to implement CPOE, and therefore was not included in follow‐up. At the time of this study, 1 of the hospitals (site 3) had not yet achieved hospital‐wide implementation. Although CPOE had been adopted by most medical services at site 3, it had not yet been implemented in the emergency, obstetrical, or surgical departments. Thus, we limited our study to the medical services at this site. For the remaining sites, all admitting services were included with the exception of the psychiatric and neonatal services, which were excluded from both phases because they would have required different detection tools.
Participants
Patients aged 18 years with renal failure, exposed to potentially nephrotoxic and/or renally cleared medications, and admitted to any of the participating hospitals during the study period were eligible for inclusion. Of the patients meeting eligibility criteria, we randomly selected approximately 150 records per hospital in the preimplementation and postimplementation phases for a total sample of 1590 charts. The first phase of this study occurred from January 2005 to August 2006; the second phase began 6 months postimplementation and lasted from October 2008 to September 2010.
Principal Exposure
Each hospital independently selected a vendor CPOE system with variable clinical decision support capabilities: (1) sites 4 and 5 had basic CPOE only with no clinical decision support for renal disease; (2) sites 1 and 2 implemented rudimentary clinical decision support with laboratory display (eg, serum creatinine) whenever common renally related drugs were ordered; and (3) site 3 had the most advanced support in place where, in addition to basic order entry and lab checks, physicians were provided with suggested doses for renally cleared and/or nephrotoxic medications, as well as appropriate drug monitoring for medications with narrow therapeutic indices (eg, suggested dosages and frequencies for vancomycin and automated corollary laboratory monitoring).
Definitions
We screened for the presence of renal failure by a serum creatinine 1.5 mg/dL at the time of admission. However, the duration of renal impairment was not known. We defined 3 levels of renal insufficiency based on the calculated creatinine clearance (CrCl)15: mild (CrCl 5080 mL/min), moderate (1649 mL/min), and severe (15 mL/min). Subjects with a CrCl >80 mL/min were considered to have normal renal function and were excluded. Potentially nephrotoxic and/or renally cleared medications were then identified using an established knowledge base (see Supporting Information, Table 1, in the online version of this article).[16]
| Hospital Site | |||||||
|---|---|---|---|---|---|---|---|
| Baseline Characteristics | All Sites | 1 | 2 | 3 | 4 | 5 | P (Among All Sites)* |
| |||||||
| No. of patients | 815 | 170 | 156 | 143 | 164 | 182 | |
| Age, y, mean (range) | 72.2 (18.0102.0) | 79.2 (33102) | 77.3 (23101) | 65.6 (1898) | 70.7 (1896) | 69.2 (2096) | <0.01 |
| 1844 years, no. (%) | 68 (9.1) | 1 (0.67) | 8 (6.5) | 20 (14.9) | 15 (9.4) | 24 (13.4) | <0.01 |
| 4554 years, no. (%) | 67 (9.0) | 6 (4.0) | 5 (4.1) | 17 (12.7) | 16 (10.0) | 23 (12.9) | |
| 5564 years, no. (%) | 79 (10.6) | 15 (10.0) | 12 (9.8) | 23 (17.2) | 13 (8.1) | 16 (8.9) | |
| 6574 years, no. (%) | 104 (13.9) | 20 (13.3) | 12 (9.8) | 16 (11.9) | 30 (18.8) | 26 (14.5) | |
| 7584 years, no. (%) | 197 (26.4) | 44 (29.3) | 36 (29.3) | 24 (17.9) | 49 (30.6) | 44 (24.6) | |
| 85 years, no. (%) | 231 (31.0) | 64 (42.7) | 50 (40.7) | 34 (25.4) | 37 (23.1) | 46 (25.7) | |
| Sex | |||||||
| Male, no. (%) | 427 (57.0) | 66 (44.0) | 60 (48.8) | 82 (60.7) | 105 (65.2) | 114 (63.7) | <0.01 |
| Female, no. (%) | 321 (43.0) | 84 (56.0) | 63 (51.2) | 53 (39.3) | 56 (34.8) | 65 (36.3) | |
| Race | |||||||
| Caucasian, no. (%) | 654 (87.4) | 129 (86.0) | 118 (95.9) | 126 (93.3) | 129 (80.1) | 152 (84.9) | <0.01 |
| Hispanic, no. (%) | 25 (3.3) | 2 (1.3) | 0 (0) | 1 (0.74) | 13 (8.1) | 9 (5.0) | |
| African American, no. (%) | 45 (6.0) | 12 (8.0) | 4 (3.3) | 5 (3.7) | 13 (8.1) | 11 (6.2) | |
| Native American, no. (%) | 0 (0) | 0 (0) | 0 (0) | 0 (0) | 0 (0) | 0 (0) | |
| Asian, no. (%) | 13 (1.7) | 1 (0.81) | 1 (0.81) | 2 (1.5) | 5 (3.1) | 4 (2.2) | |
| Other, no. (%) | 7 (0.94) | 2 (1.3) | 0 (0) | 1 (0.74) | 1 (14.3) | 3 (1.7) | |
| Not recorded, no. (%) | 4 (0.53) | 4 (2.7) | 0 (0) | 0 (0.0) | 0 (0) | 0 (0) | |
| Initial severity of renal dysfunction | |||||||
| Mild, CrCl 5080 mL/min, no. (%) | 60 (7.4) | 4 (2.4) | 5 (3.2) | 5 (3.5) | 14 (8.5) | 32 (17.6) | <0. 01 |
| Moderate, CrCl 1649 mL/min, no. (%) | 388 (47.6) | 84 (49.4) | 71 (45.5) | 80 (55.9) | 76 (46.3) | 77 (42.3) | |
| Severe, CrCl <15 mL/min, no. (%) | 367 (45.0) | 82 (48.2) | 80 (51.3) | 58 (40.6) | 74 (45.1) | 73 (40.1) | |
| LOS, d, median (IQR) | 4.0 (26) | 4.0 (37) | 3.0 (25.5) | 4.0 (27) | 4.0 (27) | 4.0 (26) | 0.02 |
| DRG‐weighted LOS, d, median (IQR) | 5.0 (3.76.7) | 5.5 (46.7) | 5.0 (3.46.2) | 5.6 (4.36.7) | 5.0 (3.36.7) | 5.0 (4.26.7) | 0.27 |
In both phases of our study, only medications that were potentially nephrotoxic and/or renally cleared were included as potential cases; all other drugs were excluded. We defined an ADE as any drug‐related injury. These were considered preventable if they were due to an error at the time of order entry (eg, a doubling of creatinine secondary to an overdose of gentamicin or failure to order corollary drug levels for monitoring). A nonpreventable ADE was any drug‐related injury in which there was no error at the time of order entry (eg, a doubling of creatinine despite appropriate dosing of lisinopril).[17] A medication error was an error anywhere in the process of prescribing, transcribing, dispensing, administering, or monitoring a drug, but with no potential for harm or injury (eg, an order for an oral medication with no route specified when it was clear that the oral route was intended).[18] A potential ADE was an error with the potential to cause harm, but not resulting in injury, either because it was intercepted (eg, an order for ketorolac for a patient with renal failure, but caught by a pharmacist) or because of chance (eg, administering enoxaparin to a patient with severe renal dysfunction but without hemorrhage).
All study investigators underwent standardized training using a curriculum developed by the Center for Patient Safety Research and Practice (
Main Outcome Measures
The primary outcome was the rate of preventable ADEs. Secondary outcomes were the rates of potential ADEs and overall ADEs. All outcomes were related to nephrotoxicity or accumulation of a renally excreted medication.
Data collection and classification strategies were identical in both phases of our study.[14] We reviewed physician orders, medication lists, laboratory reports, admission histories, progress and consultation notes, discharge summaries, and nursing flow sheets, screening for the presence of medication incidents using an adaptation of the Institute for Healthcare Improvement's trigger tool, selected for its high sensitivity, reproducibility, and ease of use.[22, 23] In our adaptation of the tool, we excluded lidocaine, tobramycin, amikacin, and theophylline levels because of their infrequency. For each trigger found, a detailed description of the incident was extracted for detailed review. An example of a trigger is the use of sodium polystyrene, which may possibly indicate an overdose of potassium or a medication side effect.
Subsequently, each case was then independently reviewed by two investigators (A.A.L., M.A., B.C., S.R.S., M.C., N.K., E.Z., and G.S.)each assigned to at least 1 siteand blinded to prescribing physician and hospital to determine whether nephrotoxicity or injury from drug accumulation was present (see Supporting Information, Figure 1, in the online version of this article).[17] First, incidents were classified as ADEs, potential ADEs, or medication errors with no potential for injury. Second, ADEs and potential ADEs were rated according to severity. When nephrotoxic drugs were ordered, event severity was classified according to the elevation in serum creatinine24: increases of 10% were considered potential ADEs (near misses); increases of 10% to 100% were significant ADEs; and increases of 100% were serious ADEs. Changes in creatinine that were not associated with inappropriate medication orders were excluded. For renally excreted drugs with no potential for nephrotoxicity (eg, enoxaparin), we used clinical judgment to classify events as significant (eg, rash), severe (eg, 2‐unit gastrointestinal bleed), life threatening (eg, transfer to an intensive care unit), or fatal categories, as based on earlier work.[25] Disagreements were resolved by consensus. We had a score of 0.70 (95% confidence interval [CI]: 0.61‐0.80) for incident type, indicating excellent overall agreement.
Statistical Analysis
Baseline characteristics between hospitals were compared using the Fisher exact test for categorical variables and 1‐way analysis of variance for continuous variables. The occurrence of each outcome was determined according to site. To facilitate comparisons between sites, rates were expressed as number of events per 100 admissions with 95% CIs. To account for hospital effects in the analysis when comparing pre‐ and postimplementation rates of ADEs and potential ADEs, we developed a fixed‐effects Poisson regression model. To explore the independent effects of each system, a stratified analysis was performed to compare average rates of each outcome observed.
RESULTS
The outcomes of 775 patients in the baseline study were compared with the 815 patients enrolled during the postimplementation phase.[14] Among those in the postimplementation phase (Table 1), the mean age was 72.2 years, and they were predominantly male (57.0%). The demographics of the patients admitted to each of the 5 sites varied widely (P<0.01). Most patients had moderate to severe renal dysfunction.
Overall, the rates of ADEs were similar between the pre‐ and postimplementation phases (8.9/100 vs 8.3/100 admissions, respectively; P=0.74) (Table 2). However, there was a significant decrease in the rate of preventable ADEs, the primary outcome of interest, following CPOE implementation (8.0/100 vs 4.4/100 admissions; P<0.01). A reduction in preventable ADEs was observed in every hospital except site 4, where only basic order entry was introduced. However, there was a significant increase in the rates of nonpreventable ADEs (0.90/100 vs 3.9/100 admissions; P<0.01) and potential ADEs (55.5/100 vs 136.8/100 admissions; P<0.01).
| Rate/100 Admissions (95% CI) | ||||||||||||||||||||
|---|---|---|---|---|---|---|---|---|---|---|---|---|---|---|---|---|---|---|---|---|
| Total No. (%) | All Sites | Site 1 | Site 2 | Site 3 | Site 4 | Site 5 | ||||||||||||||
| Event | Pre | Post | Pre | Post | P* | Pre | Post | P | Pre | Post | P | Pre | Post | P | Pre | Post | P | Pre | Post | P |
| ||||||||||||||||||||
| ADEs | 69 (13.8) | 68 (5.7) | 8.9 (7.0 1.2) | 8.3 (6.50.5) | 0.74 | 9.8 (6.015.1) | 10.0 (6.015.5) | 0.96 | 11.0 (6.517.4) | 7.7 (4.1 12.9) | 0.34 | 12.4 (7.5 19.1) | 4.2 (1.7 8.5) | 0.02 | 4.1 (1.68.3) | 13.4 (8.619.8) | 0.01 | 7.1 (3.712.2) | 6.0 (3.110.4) | 0.71 |
| Preventable | 62 | 36 | 8.0 (6.2 10.2) | 4.4 (3.16.0) | <0.01 | 8.2 (4.713.1) | 7.1 (3.811.8) | 0.70 | 10.3 (6.016.5) | 5.8 (2.8 10.4) | 0.17 | 12.4 (7.519.1) | 0 (0 0.03) | <0.01 | 3.4 (1.27.3) | 7.9 (4.413.1) | 0.11 | 5.8 (2.810.5) | 1.1 (0.183.4) | 0.03 |
| Nonpreventable | 7 | 32 | 0.90 (0.39 1.7) | 3.9 (2.75.4) | <0.01 | 1.6 (0.414.3) | 2.9 (1.16.3) | 0.42 | 0.69 (0.043.04) | 1.9 (0.48 5.0) | 0.37 | 0 (00.03) | 4.2 (1.7 8.5) | <0.01 | 0.68 (0.043.0) | 5.5 (2.6 9.9) | 0.05 | 1.3 (0.21, 4.0) | 4.9 (2.48.9) | 0.09 |
| Potential ADEs | 430 (86.2) | 1115 (93.5) | 55.5 (50.4 60.9) | 136.8 (128.9145.0) | <0.01 | 65.0 (54.077.4) | 141.1 (124.1159.8) | <0.01 | 57.2 (45.870.5) | 98.7 (83.9 115.1) | <0.01 | 44.8 (34.856.6) | 103.5 (87.7 121.1) | <0.01 | 59.2 (47.645.8) | 132.9 (116.1151.4) | <0.01 | 49.0 (38.860.9) | 195.1 (175.5216.1) | <0.01 |
| Intercepted | 16 | 24 | 2.1 (1.2 3.2) | 2.9 (1.94.3) | <0.24 | 3.3 (1.36.6) | 4.7 (2.28.8) | 0.50 | 2.1 (0.515.4) | 1.3 (0.21 4.0) | 0.60 | 1.4 (0.234.3) | 2.8 (0.87 6.5) | 0.41 | 2.0 (0.515.3) | 4.9 (2.2 9.1) | 0.20 | 1.3 (0.214.0) | 1.1 (0.183.4) | 0.87 |
| Nonintercepted | 414 | 1091 | 53.4 (48.4 58.7) | 133.9 (126.1142.0) | <0.01 | 61.7 (51.173.8) | 136.5 (119.754.8) | <0.01 | 55.2 43.968.2) | 97.4 (82.8 113.8) | <0.01 | 43.4 (33.655.1) | 100.7 (85.1 118.1) | <0.01 | 57.1 (45.8 70.2) | 128.0 (111.5146.2) | <0.01 | 47.7 (37.759.5) | 194.0 (174.4214.9) | <0.01 |
Stratified Analysis
To account for differences in technology, we performed a stratified analysis (Table 3). As was consistent with the overall study estimates, the rates of nonpreventable ADEs and potential ADEs increased with all 3 interventions. In contrast, we found that the changes in preventable ADE rates were related to the level of clinical decision support, where the greatest benefit was associated with the most sophisticated decision support system (P=0.03 and 0.02 for comparisons between advanced vs rudimentary decision support and basic order entry only, respectively). There was no difference in preventable ADE rates at sites without decision support (4.6/100 vs 4.3/100 admissions; P=0.87); with rudimentary clinical decision support, there was a trend toward a decrease in the preventable ADE rate, which did not meet statistical significance (9.1/100 vs 6.4/100 admissions; P=0.22), and, the greatest reduction was seen with advanced clinical decision support (12.4/100 vs 0/100 admissions; P<0.01).
| Rate per 100 Admissions by Level of Clinical Decision Support (95% CI) | |||||||||
|---|---|---|---|---|---|---|---|---|---|
| Basic CPOE Only (Sites 4 and 5) | CPOE and Lab Display (Sites 1 and 2) | CPOE, Lab Display, and DrugDosing Check (Site 3) | |||||||
| Incident | Pre | Post | P | Pre | Post | P | Pre | Post | P |
| |||||||||
| ADEs | 5.6 (3.48.7) | 9.5 (6.613.2) | 0.08 | 10.3(7.314.3) | 8.9 (6.012.5) | 0.55 | 12.4 (7.5319.1) | 4.2 (1.78.5) | 0.02 |
| Preventable | 4.6 (2.67.5) | 4.3 (2.56.9) | 0.87 | 9.1 (6.312.8) | 6.4 (4.19.6) | 0.22 | 12.4 (7.5319.1) | 0.00 (00.03) | <0.01 |
| Nonpreventable | 0.99 (0.24 2.6) | 5.2 (3.28.0) | <0.01 | 1.2 (0.382.8) | 2.5 (1.14.6) | 0.24 | 0.00 (00.03) | 4.2 (1.78.5) | <0.01 |
| Potential ADEs | 54.0 (46.162.7) | 165.6 (152.4179.5) | <0.01 | 61.6 (53.570.5) | 120.9 (109.3133.2) | <0.01 | 44.8 (34.856.6) | 103.5 (87.7121.1) | <0.01 |
| Intercepted | 1.7 (0.593.6) | 2.9 (1.45.1) | 0.30 | 2.7 (1.34.9) | 3.1 (1.55.4) | 0.76 | 1.4 (0.234.3) | 2.8 (0.876.5) | 0.42 |
| Nonintercepted | 52.3 (44.660.9) | 162.7 (149.6176.5) | <0.01 | 58.8 (50.967.5) | 117.8 (106.4130.0) | <0.01 | 43.4 (33.655.1) | 100.7 (85.1118.1) | <0.01 |
Severity of Events
We further analyzed our data based on event severity (Table 4). Among preventable ADEs, only 1 fatal event was observed, which occurred after CPOE implementation. Here, a previously opioid‐nave patient received intravenous morphine for malignant pain. Within the first 24 hours, the patient received 70.2 mg of intravenous morphine, resulting in a decreased level of consciousness. The patient expired the following day. Furthermore, following implementation, among preventable ADEs, a reduction in significant events was seen (P=0.02) along with a nonsignificant reduction in the rate of serious events (P=0.06). However, the rate of preventable life‐threatening events was not different (P=0.96). The nonpreventable ADE rate rose during the postimplementation period for both serious (P=0.03) and significant events (P<0.01). The risk of fatal and life‐threatening nonpreventable ADEs did not change. The potential ADE rate increased following implementation for all severities (P<0. 01).
| Preimplementation | Postimplementation | ||||
|---|---|---|---|---|---|
| Incident | No. (%) | Average Rate/100 Admissions (95% CI)* | No. (%) | Average Rate/100 Admissions (95% CI)* | P |
| |||||
| All ADEs | |||||
| Fatal | 0 (0) | 0.00 (00.0047) | 1 (1.4) | 0.12 (0.0070.54) | 0.52 |
| Lifethreatening | 3 (4.3) | 0.39 (0.101.0) | 3 (4.4) | 0.37 (0.09 0.95) | 0.95 |
| Serious | 34 (49.3) | 4.4 (3.16.0) | 32 (47.1) | 3.9 (2.75.4) | 0.65 |
| Significant | 32 (46.4) | 4.1 (2.95.7) | 32 (47.1) | 3.9 (2.75.4) | 0.84 |
| Total | 69 (100) | 8.9 (7.011.2) | 68 (100) | 8.3 (6.510.5) | 0.74 |
| Preventable ADEs | |||||
| Fatal | 0 (0) | 0.00 (00.0047) | 1 (2.7) | 0.00 (00.0045) | 0.52 |
| Lifethreatening | 2 (3.2) | 0.26 (0.040.80) | 2 (5.6) | 0.25 (0.040.76) | 0.96 |
| Serious | 31 (50.0) | 4.0 (2.85.6) | 19 (52.8) | 2.3 (1.43.5) | 0.06 |
| Significant | 29 (46.8) | 3.7 (2.55.3) | 14 (38.9) | 1.7 (0.972.8) | 0.02 |
| Total | 62 (100) | 8.0 (6.210.2) | 36 (100) | 4.4 (3.16.0) | <0.01 |
| Nonpreventable ADEs | |||||
| Fatal | 0 (0) | 0.00 (00.0047) | 0 (0) | 0.00 (00.0045) | NS |
| Lifethreatening | 1 (14.2) | 0.13 (0.0070.57) | 1 (3.1) | 0.12 (0.0070.54) | 0.97 |
| Serious | 3 (42.9) | 0.39 (0.101.0) | 13 (40.6) | 1.6 (0.882.6) | 0.03 |
| Significant | 3 (42.9) | 0.39 (0.101.0) | 18 (56.3) | 2.2 (1.33.4) | <0.01 |
| Total | 7 (100) | 0.90 (0.391.7) | 32 (100) | 3.9 (2.75.4) | <0.01 |
| All potential ADEs | |||||
| Lifethreatening | 5 (1.2) | 0.65 (0.231.4) | 33 (3.0) | 4.0 (2.85.6) | <0.01 |
| Serious | 233 (54.2) | 30.1 (26.434.1) | 429 (38.4) | 52.6 (47.857.8) | <0.01 |
| Significant | 192 (44.6) | 24.8 (21.428.4) | 653 (58.6) | 80.1 (74.186.4) | <0.01 |
| Total | 430 (100) | 55.5 (50.460.9) | 1115 (100) | 136.8 (128.9145.0) | <0.01 |
| Intercepted potential ADEs | |||||
| Lifethreatening | 0 (0) | 0.00 (00.0047) | 1 (4.2) | 0.12 (0.0070.54) | 0.52 |
| Serious | 5 (31.2) | 0.65 (0.231.4) | 13 (54.2) | 1.6 (0.882.6) | 0.09 |
| Significant | 11 (68.8) | 1.4 (0.74 2.4) | 10 (41.6) | 1.2 (0.622.2) | 0.74 |
| Total | 16 (100) | 2.1 (1.23.2) | 24 (100) | 2.9 (1.94.3) | 0.24 |
| Nonintercepted potential ADEs | |||||
| Lifethreatening | 5 (1.2) | 0.65 (0.231.4) | 32 (2.9) | 3.9 (2.75.4) | <0.01 |
| Serious | 228 (55.1) | 29.4 (25.833.4) | 416 (38.1) | 51.0 (46.356.1) | <0.01 |
| Significant | 181 (43.7) | 23.4 (20.126.9) | 643 (58.9) | 78.9 (73.085.2) | <0.01 |
| Total | 414 (100) | 53.4 (48.458.7) | 1091 (100) | 133.9(126.1142.0) | <0.01 |
Case Reviews
In total, there were 36 preventable ADEs identified during the postimplementation phase (Table 5). Of these, inappropriate renal dosing accounted for 26 preventable ADEs, which involved antibiotics (eg, gentamicin‐induced renal failure), opioids (eg, over sedation from morphine), ‐blockers (eg, hypotension from atenolol), angiotensin‐converting enzyme inhibitors (eg, renal failure with hyperkalemia secondary to lisinopril), and digoxin (eg, bradyarrhythmia and toxicity). The use of contraindicated medications resulted in 7 preventable ADEs (eg, prescribing glyburide in the setting of severe renal impairment).[26] The remaining 3 preventable ADEs stemmed from unmonitored use of vancomycin.
| ADEs, Preventable, No. (Rate per 100 Admissions)* | ADEs, Nonpreventable, No. (Rate per 100 Admissions)* | ||||||
|---|---|---|---|---|---|---|---|
| Drug Class | Preimplementation | Postimplementation | P (for Entire Drug Class) | Preimplementation | Postimplementation | P (for Drug Class) | Drugs Involved |
| |||||||
| Cardiovascular | 20 (2.6) | 18 (2.2) | 0.63 | 4 (0.52) | 16 (2.0) | 0.02 | Atenolol, bumetanide, captopril, digoxin, furosemide, hydralazine, hydrochlorothiazide, lisinopril, sotalol, spironolactone |
| Diuretics | 1 (0.13) | 2 (0.25) | 1 (0.13) | 9 (1.1) | |||
| ‐blockers | 0 (0.00) | 2 (0.25) | 1 (0.13) | ||||
| ACE inhibitors and ARBs | 16 (2.1) | 10 (1.2) | 2 (0.26) | 7 (0.86) | |||
| Antiarrhythmic | 3 (0.39) | 3 (0.37) | |||||
| Vasodilator | 0 (0.00) | 1 (0.12) | |||||
| Analgesics | 28 (3.6) | 4 (0.49) | 0.0002 | 1 (0.13) | 5 (0.61) | 0.15 | Acetaminophen and combination pills containing acetaminophen: Percocet (oxycodone and acetaminophen), Tylenol #3 (codeine and acetaminophen), Vicodin (hydrocodone and acetaminophen), fentanyl, hydrocodone, meperidine, morphine, oxycodone |
| Narcotic | 13 (1.7) | 4 (0.49) | 0 (0.00) | 5 (0.61) | |||
| Non‐narcotic | 15 (1.9) | 0 (0.00) | 1 (0.13) | 0 | |||
| Antibiotics | 8 (1.0) | 13 (1.6) | 0.33 | 1 (0.13) | 9 (1.1) | 0.04 | Amikacin, ampicillin and sulbactam, ciprofloxacin, cefazolin, cefuroxime, gatifloxacin, gentamicin, levofloxacin, metronidazole, piperacillin and tazobactam, tobramycin, vancomycin |
| Neurotropic drugs | 2 (0.26) | 0 (0.00) | 0.28 | 0 | 0 | Lithium, midazolam | |
| Sedatives | 1 (0.13) | 0 (0.00) | |||||
| Antipsychotics | 1 (0.13) | 0 (0.00) | |||||
| Diabetes | 0 | 1 (0.12) | 0.52 | 0 | 1 (0.12) | 0.52 | Glipizide, glyburide |
| Oral antidiabetics | 0 | 1 (0.12) | 1 (0.12) | ||||
| Other drugs | 4 (0.52) | 0 (0.00) | 0.13 | 1 (0.13) | 1 (0.12) | 0.97 | Allopurinol, famotidine |
| Gastrointestinal drugs | 1 (0.13) | 0 (0.00) | |||||
| Other | 3 (0.39) | 0 (0.00) | 0 | 1 (0.12) | |||
DISCUSSION
We evaluated the use of vendor CPOE for hospitalized patients with renal disease and found that it was associated with a 45% reduction in preventable ADEs related to nephrotoxicity and accumulation of renally excreted medications. The impact of CPOE appeared to be related to the level of associated clinical decision support, where only the most advanced system was associated with benefit. We observed a significant increase in potential ADEs with all levels of intervention. Overall, these findings suggest that vendor‐developed applications with appropriate decision support can reduce the occurrence of renally related preventable ADEs, but careful implementation is needed if the potential ADE rate is to fall.
Many of the benefits of CPOE come from clinical decision support.[11] When applied to patients with renal impairment, CPOE with clinical decision support has been associated with decreased lengths of stay,[16, 27] reduced use of contraindicated medications,[28, 29, 30] improved dosing and drug monitoring,[16, 31, 32] and improved general prescribing practices.[29, 33] Even so, the observed benefit of CPOE on ADE rates has been variable, with some studies reporting reductions,[27, 34] whereas others are unable to detect differences.[16, 31] These studies, however, limited their case definition of ADEs to strictly declining renal function,[16, 31, 34] or adverse events directly resulting from anti‐infective drugs.[27] In contrast, our study accounted for nephrotoxicity and systemic toxicity from drug accumulation. Using this broader definition, we were able to detect large reductions in the rates of preventable ADEs following CPOE adoption.
Successful decision support is simple, intuitive, and provides speedy information that integrates seamlessly into the clinical workflow.[35, 36] However, information delivery, although necessary, is insufficient for improving safety. For instance, passive alerts are often ignored, deferred, or overridden.[30, 37, 38] Demonstrating this, Quartarolo et al. found that informing physicians of the presence of renal impairment using automated reporting of glomerular filtration rates did not change prescribing behavior.[39] In contrast, providing active feedback (with dosing recommendations) was observed to be more useful in effecting change.[40] Chertow et al. further showed that providing an adjusted dose list with a default dose and frequency at the time of order entry for patients with renal insufficiency improved appropriate ordering and was associated with a decreased length of stay.[16] Altogether, these studies help to explain why only CPOE with clinical decision support equipped to provide renally adjusted dosing and monitoring was associated with a reduction in preventable ADEs in our study.
However, in contrast to reports of internally developed systems,[20, 25] potential ADE rates actually rose during the follow‐up portion of our study. These appeared to be chiefly related to customized order sets with the potential of overdosing drugs through therapeutic duplication, a problem that is commonly known to be associated with CPOE (ie, new orders that overlap with other new or active medication orders, which may be the same drug itself or from within the same drug class, with the risk of overdose).[41, 42] Of note, our findings give rise to several key implications. First, hospitals implementing vendor‐developed CPOE systems may be at greater risk of incurring potential ADEs compared to those using home‐grown systems, which have comparatively gone through more cycles of internal refinement. As such, it is necessary to monitor for issues postimplementation and respond with appropriate changes to achieve successful system performance.[35, 36] Second, although the rate of potential ADEs (near misses) increased, preventable ADEs decreased because some of these errors were intercepted, whereas others were averted simply because of chance. Of note, not all potential ADEs have the same potential for injury; more serious cases are more likely to result in actual ADEs (eg, failure to renally dose acetaminophen likely poses less potential for harm than prescribing a full dose of enoxaparin in the setting of severe renal failure). Third, we found that most potential ADEs could have been averted with a combination of basic (dosing guidance and drug‐drug interactions checks) and advanced decision support (medication‐associated laboratory testing and drug‐disease interactions).[43] Therefore, further refinements to existing software are needed to maximize safety outcomes.
Our study has some limitations. This study was not a randomized controlled trial, and thus is subject to potential confounding. Although 6 hospitals were involved at the study inception,[14] one of these hospitals eventually opted not to implement CPOE, and further declined to participate as a control site. Therefore, we cannot exclude confounding from secular trends because we had no contemporaneous control group. However, the introduction of CPOE was the main medication safety‐oriented intervention during the study interval, thus arguing against major confounding by cointervention. Second, even though it is possible that classification bias may have been introduced between the preimplementation and postimplementation portions of our study, especially given the passage of time, it is unlikely. Study personnel underwent training using a curriculum designed to maintain continuity across projects, minimize individual variability, and optimize reproducibility in data collection and classification, as in a number of previous studies.[14, 17, 19, 20, 21] Third, our study is limited by a heterogeneous intervention, as varying levels of decision support were introduced. However, this reflects usual practice and may be construed as a strength as we were able to describe the impact of different types of decision support. Fourth, we enrolled patients with a large spectrum of renal impairment, and our findings are not specific to any particular subgroup. However, our wide recruitment strategy also enhances the generalizability. Finally, our study was restricted to patients who were exposed to potentially nephrotoxic and/or renally cleared drugs. As such, we could not determine whether advanced decision support helped to eliminate the use of some potentially dangerous medications altogether, as these cases would have been excluded from our study. It is possible, therefore, that our study findings underestimate the true benefit of clinical decision support.
In conclusion, vendor CPOE implementation in 5 community hospitals was associated with a 45% reduction in preventable ADE rates among patients with renal impairment. Measurable benefit was associated with advanced decision support capable of lab display, dosing guidance, and medication‐associated laboratory testing. Although the potential benefits of CPOE systems are far reaching, achieving the desired safety benefits will require appropriate decision support, tracking of problems that arise, and systematic approaches to eliminating them.
Acknowledgments
The authors thank Kathy Zigmont, RN, and Cathy Foskett, RN (Brigham and Women's Hospital, Division of General Internal Medicine and Primary Care) for the chart review and data collection at the participating study sites.
Disclosures: The Rx Foundation and Commonwealth Fund supported the study. They commented on its design, but were not involved in data collection, data management, analysis, interpretation, or writing of the manuscript. Dr. Leung is supported by a Clinical Fellowship Award from Alberta Innovates Health Solutions and by a Fellowship Award from the Canadian Institutes for Health Research. Dr. Schiff received financial support from the FDA CPOE Task Order and the Commonwealth Fund. Ms. Keohane served as a consultant to the American College of Obstetrician and Gynecologists and as a reviewer for the VRQC Program. She received honoraria for a presentation on Patient Safety in 2010, sponsored by Abbott Nutrition International, and a lecture on Nurse Interruptions in Medication Administration by Educational Review Systems. Dr. Coffey received an honorarium from Meditech for speaking on social networking at Physician/CIO Forum in 2009. Dr. Kaufman participates in an advisory group with Siemens Medical Solutions. Dr. Zimlichman received support from the Rx Foundation and the Commonwealth Fund. Dr. Bates holds a minority equity position in the privately held company Medicalis, which develops Web‐based decision support for radiology test ordering, and has served as a consultant to Medicalis. He serves as an advisor to Calgary Scientific, which makes technologies that enable mobility within electronic health records. He is on the clinical advisory board for Patient Safety Systems, which provides a set of approaches to help hospitals improve safety. He has received funding support from the Massachusetts Technology Consortium. Ms. Amato, Dr. Simon, Dr. Cadet, Ms. Seger, and Ms. Yoon have no disclosures relevant to this study.
- , , . Drug Prescribing in Renal Failure: Dosing Guidelines for Adults and Children: American College of Physicians; 2007.
- , . Management of drug toxicity in patients with renal insufficiency. Nat Rev Nephrol. 2010;6(6):317–318.
- , , , . Use of renal risk drugs in hospitalized patients with impaired renal function—an underestimated problem? Nephrol Dial Transplant. 2006;21(11):3164–3171.
- , , , et al. Medication misuse in hospitalized patients with renal impairment. Int J Qual Health Care. 2003;15(4):331–335.
- , , , . Impact of a renal drug dosing service on dose adjustment in hospitalized patients with chronic kidney disease. Ann Pharmacother. 2009;43(10):1598–1605.
- , . Drug dosing in chronic kidney disease. Med Clin North Am. 2005;89(3):649–687.
- , , , et al. Systems analysis of adverse drug events. ADE Prevention Study Group. JAMA. 1995;274(1):35–43.
- , , , , , . The epidemiology of prescribing errors: the potential impact of computerized prescriber order entry. Arch Intern Med. 2004;164(7):785–792.
- , , . Factors related to errors in medication prescribing. JAMA. 1997;277(4):312–317.
- , , , et al. Role of computerized physician order entry systems in facilitating medication errors. JAMA. 2005;293(10):1197–1203.
- , , , , . Mixed results in the safety performance of computerized physician order entry. Health Aff (Millwood). 2010;29(4):655–663.
- , , , et al. The effect of computerized physician order entry with clinical decision support on the rates of adverse drug events: a systematic review. J Gen Intern Med. 2008;23(4):451–458.
- , , . The impact of computerized physician medication order entry in hospitalized patients—a systematic review. Int J Med Inform. 2008;77(6):365–376.
- , , , et al. Occurrence of adverse, often preventable, events in community hospitals involving nephrotoxic drugs or those excreted by the kidney. Kidney Int. 2009;76(11):1192–1198.
- , . Prediction of creatinine clearance from serum creatinine. Nephron. 1976;16(1):31–41.
- , , , et al. Guided medication dosing for inpatients with renal insufficiency. JAMA. 2001;286(22):2839–2844.
- , , , , . Adverse drug events and medication errors: detection and classification methods. Qual Saf Health Care. 2004;13(4):306–314.
- , , , , . Relationship between medication errors and adverse drug events. J Gen Intern Med. 1995;10(4):199–205.
- , , , et al. Incidence of adverse drug events and potential adverse drug events. Implications for prevention. ADE Prevention Study Group. JAMA. 1995;274(1):29–34.
- , , , et al. Effect of computerized physician order entry and a team intervention on prevention of serious medication errors. JAMA. 1998;280(15):1311–1316.
- , , , et al. Adverse drug event rates in six community hospitals and the potential impact of computerized physician order entry for prevention. J Gen Intern Med. 2010;25(1):31–38.
- , , . Adverse drug event trigger tool: a practical methodology for measuring medication related harm. Qual Saf Health Care. 2003;12(3):194–200.
- Institute for Healthcare Improvement: IHI Trigger Tool for Measuring Adverse Drug Events. 2011. Available at: http://www.ihi.org/knowledge/Pages/Tools/TriggerToolforMeasuringAdverseDrugEvents.aspx. Accessed February 1, 2013.
- , , , . Renal safety of two analgesics used over the counter: ibuprofen and aspirin. Clin Pharmacol Ther. 1986;40(4):373–377.
- , , , et al. The impact of computerized physician order entry on medication error prevention. J Am Med Inform Assoc. 1999;6(4):313–321.
- , , . Prolonged sulfonylurea‐induced hypoglycemia in diabetic patients with end‐stage renal disease. Am J Kidney Dis. 2000;35(3):500–505.
- , , , et al. A computer‐assisted management program for antibiotics and other antiinfective agents. N Engl J Med. 1998;338(4):232–238.
- , , , et al. Alert system for inappropriate prescriptions relating to patients' clinical condition. Methods Inf Med. 2009;48(6):566–573.
- , , , , , . Computerized clinical decision support during medication ordering for long‐term care residents with renal insufficiency. J Am Med Inform Assoc. 2009;16(4):480–485.
- , , . A trial of automated decision support alerts for contraindicated medications using computerized physician order entry. J Am Med Inform Assoc. 2005;12(3):269–274.
- , , , , . Effects of clinical decision support on initial dosing and monitoring of tobramycin and amikacin. Am J Health Syst Pharm. 2011;68(7):624–632.
- , , , , , . Computerized decision support for medication dosing in renal insufficiency: a randomized, controlled trial. Ann Emerg Med. 2010;56(6):623–629.
- , , , . Implementation of rules based computerised bedside prescribing and administration: intervention study. BMJ. 2000;320(7237):750–753.
- , , , et al. Effect of computer‐based alerts on the treatment and outcomes of hospitalized patients. Arch Intern Med. 1994;154(13):1511–1517.
- , , , et al. Ten commandments for effective clinical decision support: making the practice of evidence‐based medicine a reality. J Am Med Inform Assoc. 2003;10(6):523–530.
- , , . Computerized decision support systems: improving patient safety in nephrology. Nat Rev Nephrol. 2011;7(6):348–355.
- , , , et al. Impact of a computerized alert during physician order entry on medication dosing in patients with renal impairment. Proc AMIA Symp. 2002:577–581.
- , , , et al. A computerized provider order entry intervention for medication safety during acute kidney injury: a quality improvement report. Am J Kidney Dis. 2010;56(5):832–841.
- , , . Reporting of estimated glomerular filtration rate: effect on physician recognition of chronic kidney disease and prescribing practices for elderly hospitalized patients. J Hosp Med. 2007;2(2):74–78.
- , , , , . Drug dosage in patients with renal failure optimized by immediate concurrent feedback. J Gen Intern Med. 2001;16(6):369–375.
- , , , et al. Factors contributing to an increase in duplicate medication order errors after CPOE implementation. J Am Med Inform Assoc. 2011;18(6):774–782.
- , , , et al. Impact of Vendor Computerized Physician Order Entry in Community Hospitals. J Gen Intern Med. 2012;27(7):801–807.
- , , , et al. Medication‐related clinical decision support in computerized provider order entry systems: a review. J Am Med Inform Assoc. 2007;14(1):29–40.
© 2013 Society of Hospital Medicine