User login
Opportunities and Challenges for Improving the Patient Experience in the Acute and Post–Acute Care Setting Using Patient Portals: The Patient’s Perspective
To realize the vision of patient-centered care, efforts are focusing on engaging patients and “care partners,” often a family caregiver, by using patient-facing technologies.1-4 Web-based patient portals linked to the electronic health record (EHR) provide patients and care partners with the ability to access personal health information online and to communicate with clinicians. In recent years, institutions have been increasing patient portal offerings to improve the patient experience, promote safety, and optimize healthcare delivery.5-7
DRIVERS OF ADOPTION
The adoption of patient portals has been driven by federal incentive programs (Meaningful Use), efforts by the Center for Medicare and Medicaid Services, and the Office of the National Coordinator for Health Information Technology to improve patient outcomes and the transition toward value-based reimbursement.2,8,9 The vast majority of use has been in ambulatory settings; use for acute care is nascent at best.10 Among hospitalized patients, few bring an internet-enabled computer or mobile device to access personal health records online.11 However, evidence suggests that care partners will use portals on behalf of acutely ill patients.4 As the Caregiver Advise, Record, Enable Act is implemented, hospitals will be required to identify patients’ care partners during hospitalization, inform them when the patient is ready for discharge, and provide self-management instructions during the transition home.12 In this context, understanding how best to leverage acute care patient portals will be important to institutions, clinicians, and vendors.
CURRENT KNOWLEDGE
The literature regarding acute care patient portals is rapidly growing.4,10 Hospitalized patients have unmet information and communication needs, and hospital-based clinicians struggle to meet these needs in a timely manner.13-15 In general, patients feel that using a mobile device to access personal health records has the potential to improve their experience.11 Early studies suggest that acute care patient portals can promote patient-centered communication and collaboration during hospitalization, including in intensive care settings.4,16,17 Furthermore, the use of acute care patient portals can improve perception of safety and quality, decrease anxiety, and increase understanding of health conditions.3,14 Although early evidence is promising, considerable knowledge gaps exist regarding patient outcomes over the acute episode of care.10,18
OUTSTANDING QUESTIONS
A clear area of interest is accessing acute care patient portals via mobile technology to engage patients during recovery from hospitalization.4,11 Although we do not yet know whether use during care transitions will favorably impact outcomes, given the high rate of harm after discharge, this seems likely.19 The few studies evaluating the effect on validated measures of engagement (Patient Activation Measure) and hospital readmissions have not shown demonstrable improvement to date.20,21 Clearly, optimizing acute care patient portals with regard to patient-clinician communication, as well as the type, timing, and format of information delivered, will be necessary to maximize value.4,22
From the patient’s perspective, there is much we can learn.23 Is the information that is presented pertinent, timely, and easy to understand? Will the use of portals detract from face-to-face interactions? Does greater transparency foster more accountability? Achieving an appropriate balance of digital health-information sharing for hospitalized patients is challenging given the sensitivity of patient data when diagnoses are uncertain and treatments are in flux.4,24 These questions must be answered as hospitals implement acute care patient portals.
ACUTE CARE PATIENT PORTAL TASK FORCE
To start addressing knowledge gaps, we established a task force of 21 leading researchers, informatics and policy experts, and clinical leaders. The Acute Care Patient Portal Task Force was a subgroup of the Libretto Consortium, a collaboration of 4 academic medical centers established by the Gordon and Betty Moore Foundation to design, develop, and implement technologies to engage patients, care partners, and providers in preventing harm in hospital settings. Initially, we were challenged with assessing stakeholders’ perspectives from early adopter institutions. We learned that acute care patient portals must offer an integrated experience across care settings, humanize the patient-clinician relationship, enable equitable access, and align with institutional strategy to promote sustainability.19

Cognitive Support
The opportunities identified include acclimatizing and assimilating to the hospital environment (reviewing policies and patient rights) and facilitating self-education and preparation by linking to personal health information and providing structured guidance at transitions.4 For example, a care partner of an incapacitated patient may watch a video to orient to the intensive care unit, navigate educational content linked to the patient’s admission diagnosis (pneumonia) entered in the EHR, view the timing of an upcoming imaging study (chest computed tomography scan), and complete a standardized checklist prior to discharge.
The main challenges we identified include ensuring accuracy of hospital-, unit-, and patient-level information, addressing information overload, configuring notification and display settings to optimize the user experience, presenting information at an appropriate health literacy level,4,21 and addressing security and privacy concerns when expanding access to family members.24
Respect and Boundaries
Opportunities identified include supporting individual learning styles by using interactive features of mobile devices to improve comprehension for visual, auditory, and tactile learners and reinforcing learning through the use of various types of digital media.25-27 For example, a visual learner may view a video tutorial for a newly prescribed medication. A tactile learner may prefer to use interactive graphical displays that exploit multidimensional touch capabilities of mobile devices to learn about active conditions or an upcoming procedure. An auditory learner may choose to use intelligent personal assistants to navigate their plan of care (“Hey Siri, what is my schedule for today?”). By addressing the learning preferences of patients and time constraints of clinicians, institutions can use acute care patient portals to promote more respectful interactions and collaborative decision-making during important care processes, such as obtaining surgical consent.28,29
We also identified opportunities to facilitate personalization by tailoring educational content and by enabling the use of patient-generated health data collected from wearable devices. For example, patients may prefer to interact with a virtual advocate to review discharge instructions (“Louis” in Project Re-Engineered Discharge) when personalized to their demographics and health literacy level.30-32 Patients may choose to upload step counts from wearable devices so that clinicians can monitor activity goals in preparation for discharge and while recovering afterwards. When supported in these ways, acute care patient portals allow patients to have more meaningful interactions with clinicians about diagnoses, treatments, prognosis, and goals for recovery.
The main challenges we identified include balancing interactions with technology and clinicians, ensuring clinicians understand how patients from different socioeconomic backgrounds use existing and newer technology to enhance self-management, assessing health and technology literacy, and understanding individual preferences for sharing patient-generated health data. Importantly, we must remain vigilant that patients will express concern about overdependence on technology, especially if it detracts from in-person interaction; our panelists emphasized that technology should never replace “human touch.”
Patient and Family Empowerment
The opportunities identified include promoting patient-centered communication by supporting a real-time and asynchronous dialogue among patients, care partners, and care team members (including ambulatory clinicians) while minimizing conversational silos4,33; displaying names, roles, and pictures of all care team members4,34; fostering transparency by sharing clinician documentation in progress notes and sign-outs35; ensuring accountability for a single plan of care spanning shift changes and handoffs, and providing a mechanism to enable real-time feedback.
Hospitalization can be a vulnerable and isolating experience, perpetuated by a lack of timely and coordinated communication with the care team. We identified opportunities to mitigate anxiety by promoting shared understanding when questions require input from multiple clinicians, when team members change, or when patients wish to communicate with their longitudinal ambulatory providers.4,34 For example, inviting patients to review clinicians’ progress notes should stimulate more open and meaningful communication.35 Furthermore, requesting that patients state their wishes, preferences, and goals could improve overall concordance with care team members.36,37 Empowering patients and care partners to voice their concerns, particularly those related to miscommunication, may mitigate harm propagated by handoffs, shift work, and weekend coverage.38,39 While reporting safety concerns represents a novel mechanism to augment medical-error reporting by clinicians alone,23,40 this strategy will be most effective when aligned with standardized communication initiatives (I-PASS) that have been proven to reduce medical errors and preventable adverse events and are being implemented nationally.41 Finally, by leveraging tools that facilitate instantaneous feedback, patients can be empowered to react to their plan (ranking skilled nursing facility options) as it is developed.
The main challenges we identified include managing expectations regarding the use of communication tools, accurately and reliably identifying care team members in the EHR,34 acknowledging patients as equal partners, ensuring patients receive a consistent message about diagnoses and therapies during handoffs and when multiple consultants have conflicting opinions about the plan,37 and addressing patient concerns fairly and respectfully.
RECOMMENDATIONS AND CONCLUSIONS
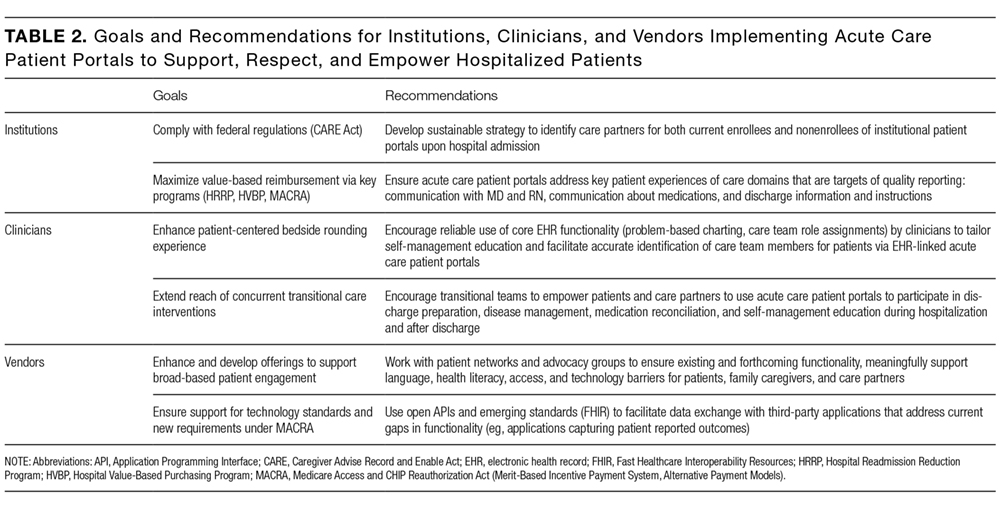
In summary, the patient-centered themes we identified serve as guiding principles for institutions, clinicians, and vendors who wish to use patient portals to improve the acute and postacute care patient experience. One central message resonates: Patients do not simply want access to their health information and the ability to communicate with the clinicians who furnish this information; they want to feel supported, respected, and empowered when doing so. It is only through partnership with patients and their advocates that we can fully realize the impact of digital technologies when patients are in their most vulnerable state.
Acknowledgments
The authors thank their colleagues and the patient and family advocates who contributed to this body of work as part of the Acute Care Patient Portal Task Force and conference: Brittany Couture; Ronen Rozenblum, PhD, MPH; Jennifer Prey, MPhil, MS, PhD; Kristin O’Reilly, RN, BSN, MPH; Patricia Q. Bourie, RN, MS, Cindy Dwyer, RN, BSN,S; Ryan Greysen, MD, MHS, MA; Jeffery Smith, MPP; Michael Gropper, MD, PhD; Patricia Dykes, RN, PhD; Martha B. Carnie; Jeffrey W. Mello; and Jane Webster.
Disclosure
Anuj K. Dalal, MD, David W. Bates, MD, MSc, and Sarah Collins, RN, PhD, are responsible for the conception or design of the work; acquisition, analysis, or interpretation of data; drafting the work or revising it critically for important intellectual content; and final approval of the version to be published. The authors agree to be accountable for all aspects of the work and to ensure that questions related to the accuracy or integrity of the work are appropriately investigated and resolved. This work was supported by a grant from the Gordon and Betty Moore Foundation ([GBMF] #4993). GBMF had no role in the design or conduct of the study; the collection, analysis, or interpretation of data; or preparation or review of the manuscript. The findings and conclusions in this report are those of the authors and do not necessarily represent the official position of GBMF. The authors report no conflicts of interest.
1. Sarkar U, Bates DW. Care partners and online patient portals. JAMA. 2014;311(4):357-358. PubMed
2. Grando MA, Rozenblum R, Bates DW, eds. Information Technology for Patient Empowerment in Healthcare, 1st Edition. Berlin: Walter de Gruyter Inc.; 2015.
3. Kelly MM, Hoonakker PLT, Dean SM. Using an inpatient portal to engage families in pediatric hospital care. J Am Med Inform Assoc. 2016;24(1):153-161. PubMed
4. Dalal AK, Dykes PC, Collins S, et al. A web-based, patient-centered toolkit to engage patients and caregivers in the acute care setting: A preliminary evaluation. J Am Med Inform Assoc. 2016;23(1):80-87. PubMed
5. Prey JE, Restaino S, Vawdrey DK. Providing hospital patients with access to their medical records. AMIA Annu Symp Proc. 2014;2014:1884-1893. PubMed
6. Herrin J, Harris KG, Kenward K, Hines S, Joshi MS, Frosch DL. Patient and family engagement: A survey of US hospital practices. BMJ Qual Saf. 2016;25(3):182-189. PubMed
7. Tom JO, Mangione-Smith R, Solomon C, Grossman DC. Integrated personal health record use: Association with parent-reported care experiences. Pediatrics. 2012;130(1):e183-e190. PubMed
8. Centers for Medicare & Medicaid Services (CMS), HHS. Medicare and Medicaid Programs; Electronic Health Record Incentive Program-Stage 2. Federal Register Final Rule. Sect. 170; 2012. https://www.federalregister.gov/documents/2012/03/07/2012-4443/medicare-and-medicaid-programs-electronic-health-record-incentive-program-stage-2. Accessed March 1, 2017.
9. Centers for Medicare & Medicaid Services (CMS), HHS. Medicare program; merit-based incentive payment system (MIPS) and alternative payment model (APM) incentive under the physician fee schedule, and criteria for physician-focused payment models. Final rule with comment period. Fed Regist. 2016;81(214):77008-77831. PubMed
10. Prey JE, Woollen J, Wilcox L, et al. Patient engagement in the inpatient setting: A systematic review. J Am Med Informat Assoc. 2014;21(4):742-750. PubMed
11. Ludwin S, Greysen SR. Use of smartphones and mobile devices in hospitalized patients: Untapped opportunities for inpatient engagement. J Hosp Med. 2015;10(7):459-461. PubMed
12. Coleman EA. Family caregivers as partners in care transitions: The caregiver advise record and enable act. J Hosp Med. 2016;11(12):883-885. PubMed
13. Kaziunas E, Hanauer DA, Ackerman MS, Choi SW. Identifying unmet informational needs in the inpatient setting to increase patient and caregiver engagement in the context of pediatric hematopoietic stem cell transplantation. J Am Med Inform Assoc. 2016;23(1):94-104. PubMed
14. Woollen J, Prey J, Wilcox L, et al. Patient experiences using an inpatient personal health record. Appl Clin Inform. 2016;7(2):446-460. PubMed
15. Irizarry T, DeVito Dabbs A, Curran CR. Patient portals and patient engagement: A state of the science review. J Med Internet Res. 2015;17(6):e148. doi:10.2196/jmir.4255. PubMed
16. Vawdrey DK, Wilcox LG, Collins SA, et al. A tablet computer application for patients to participate in their hospital care. AMIA Annu Symp Proc. 2011;2011:1428-1435. PubMed
17. Collins SA, Rozenblum R, Leung WY, et al. Acute care patient portals: A qualitative study of stakeholder perspectives on current practices. J Am Med Inform Assoc. 2016;24(e1):e9-e17. PubMed
18. Berger Z, Flickinger TE, Pfoh E, Martinez KA, Dy SM. Promoting engagement by patients and families to reduce adverse events in acute care settings: A systematic review. BMJ Qual Saf. 2014;23(7):548-555. PubMed
19. Forster AJ, Murff HJ, Peterson JF, Gandhi TK, Bates DW. The incidence and severity of adverse events affecting patients after discharge from the hospital. Ann Intern Med. 2003;138(3):161-167. PubMed
20. Griffin A, Skinner A, Thornhill J, Weinberger M. Patient Portals: Who uses them? What features do they use? And do they reduce hospital readmissions? Appl Clin Inform. 2016;7(2):489-501. PubMed
21. O’Leary KJ, Lohman ME, Culver E, Killarney A, Randy Smith G Jr, Liebovitz DM. The effect of tablet computers with a mobile patient portal application on hospitalized patients’ knowledge and activation. J Am Med Inform Assoc. 2016;23(1):159-165. PubMed
22. O’Leary KJ, Sharma RK, Killarney A, et al. Patients’ and Healthcare Providers’ Perceptions of a Mobile Portal Application for Hospitalized Patients. BMC Med Inform Decis Mak. 2016;16(1):123. PubMed
23. Pell JM, Mancuso M, Limon S, Oman K, Lin CT. Patient access to electronic health records during hospitalization. JAMA Intern Med. 2015;175(5):856-858. PubMed
24. Brown SM, Aboumatar HJ, Francis L, et al. Balancing digital information-sharing and patient privacy when engaging families in the intensive care unit. J Am Med Inform Assoc. 2016;23(5):995-1000. PubMed
25. Krishna S, Francisco BD, Balas EA, et al. Internet-enabled interactive multimedia asthma education program: A randomized trial. Pediatrics. 2003;111(3):503-510. PubMed
26. Fox MP. A systematic review of the literature reporting on studies that examined the impact of interactive, computer-based patient education programs. Patient Educ Couns. 2009;77(1):6-13. PubMed
27. Morgan ER, Laing K, McCarthy J, McCrate F, Seal MD. Using tablet-based technology in patient education about systemic therapy options for early-stage breast cancer: A pilot study. Curr Oncol. 2015;22(5):e364-e369. PubMed
28. Nehme J, El-Khani U, Chow A, Hakky S, Ahmed AR, Purkayastha S. The use of multimedia consent programs for surgical procedures: A systematic review. Surg Innov. 2013;20(1):13-23. PubMed
29. Waller A, Forshaw K, Carey M, et al. Optimizing patient preparation and surgical experience using eHealth technology. JMIR Med Inform. 2015;3(3):e29. PubMed
30. Abbott MB, Shaw P. Virtual nursing avatars: Nurse roles and evolving concepts of care. Online J Issues Nurs. 2016;21(3):7. PubMed
31. Cawthon C, Walia S, Osborn CY, Niesner KJ, Schnipper JL, Kripalani S. Improving care transitions: The patient perspective. J Health Commun. 2012;17 Suppl 3:312-324. PubMed
32. Bickmore TW, Pfeifer LM, Byron D, et al. Usability of conversational agents by patients with inadequate health literacy: Evidence from two clinical trials. J Health Commun. 2010;15 Suppl 2:197-210. PubMed
33. 2017;376(20):1905-1907. N Engl J Med.42. Mandl KD, Kohane IS. A 21st-century health IT system—creating a real-world information economy. PubMed
34. 2014;371(19):1803-1812.N Engl J Med41. Starmer AJ, Spector ND, Srivastava R, et al. Changes in medical errors after implementation of a handoff program. PubMed
35. 2016;24(1):153-161.J Am Med Inform Assoc.40. Kelly MM, Hoonakker PLT, Dean SM. Using an inpatient portal to engage families in pediatric hospital care. PubMed
36. 2017;171(4):372-381.JAMA Pediatr.39. Khan A, Coffey M, Litterer KP, et al. Families as partners in hospital error and adverse event surveillance. PubMed
37. 2017;17(4):389-402.Acad Pediatr.38. Khan A, Baird J, Rogers JE, et al. Parent and provider experience and shared understanding after a family-centered nighttime communication intervention. PubMed
38. 2016;6(6):319-329.Hosp Pediatr. 37. Khan A, Rogers JE, Forster CS, Furtak SL, Schuster MA, Landrigan CP. Communication and shared understanding between parents and resident-physicians at night. PubMed
39. 2016;11(9):615-619.J Hosp Med36. Figueroa JF, Schnipper JL, McNally K, Stade D, Lipsitz SR, Dalal AK. How often are hospitalized patients and providers on the same page with regard to the patient’s primary recovery goal for hospitalization? PubMed
40. 2013;8(7):414-417.J Hosp Med.35. Feldman HJ, Walker J, Li J, Delbanco T. OpenNotes: Hospitalists’ challenge and opportunity. PubMed
41. 2016;11(5):381-385.J Hosp Med.34. Dalal AK, Schnipper JL. Care team identification in the electronic health record: A critical first step for patient-centered communication.PubMed
42. 2016;24(e1):e178-e184.J Am Med Inform Assoc.33. Dalal AK, Schnipper J, Massaro A, et al. A web-based and mobile patient-centered “microblog” messaging platform to improve care team communication in acute care. PubMed
To realize the vision of patient-centered care, efforts are focusing on engaging patients and “care partners,” often a family caregiver, by using patient-facing technologies.1-4 Web-based patient portals linked to the electronic health record (EHR) provide patients and care partners with the ability to access personal health information online and to communicate with clinicians. In recent years, institutions have been increasing patient portal offerings to improve the patient experience, promote safety, and optimize healthcare delivery.5-7
DRIVERS OF ADOPTION
The adoption of patient portals has been driven by federal incentive programs (Meaningful Use), efforts by the Center for Medicare and Medicaid Services, and the Office of the National Coordinator for Health Information Technology to improve patient outcomes and the transition toward value-based reimbursement.2,8,9 The vast majority of use has been in ambulatory settings; use for acute care is nascent at best.10 Among hospitalized patients, few bring an internet-enabled computer or mobile device to access personal health records online.11 However, evidence suggests that care partners will use portals on behalf of acutely ill patients.4 As the Caregiver Advise, Record, Enable Act is implemented, hospitals will be required to identify patients’ care partners during hospitalization, inform them when the patient is ready for discharge, and provide self-management instructions during the transition home.12 In this context, understanding how best to leverage acute care patient portals will be important to institutions, clinicians, and vendors.
CURRENT KNOWLEDGE
The literature regarding acute care patient portals is rapidly growing.4,10 Hospitalized patients have unmet information and communication needs, and hospital-based clinicians struggle to meet these needs in a timely manner.13-15 In general, patients feel that using a mobile device to access personal health records has the potential to improve their experience.11 Early studies suggest that acute care patient portals can promote patient-centered communication and collaboration during hospitalization, including in intensive care settings.4,16,17 Furthermore, the use of acute care patient portals can improve perception of safety and quality, decrease anxiety, and increase understanding of health conditions.3,14 Although early evidence is promising, considerable knowledge gaps exist regarding patient outcomes over the acute episode of care.10,18
OUTSTANDING QUESTIONS
A clear area of interest is accessing acute care patient portals via mobile technology to engage patients during recovery from hospitalization.4,11 Although we do not yet know whether use during care transitions will favorably impact outcomes, given the high rate of harm after discharge, this seems likely.19 The few studies evaluating the effect on validated measures of engagement (Patient Activation Measure) and hospital readmissions have not shown demonstrable improvement to date.20,21 Clearly, optimizing acute care patient portals with regard to patient-clinician communication, as well as the type, timing, and format of information delivered, will be necessary to maximize value.4,22
From the patient’s perspective, there is much we can learn.23 Is the information that is presented pertinent, timely, and easy to understand? Will the use of portals detract from face-to-face interactions? Does greater transparency foster more accountability? Achieving an appropriate balance of digital health-information sharing for hospitalized patients is challenging given the sensitivity of patient data when diagnoses are uncertain and treatments are in flux.4,24 These questions must be answered as hospitals implement acute care patient portals.
ACUTE CARE PATIENT PORTAL TASK FORCE
To start addressing knowledge gaps, we established a task force of 21 leading researchers, informatics and policy experts, and clinical leaders. The Acute Care Patient Portal Task Force was a subgroup of the Libretto Consortium, a collaboration of 4 academic medical centers established by the Gordon and Betty Moore Foundation to design, develop, and implement technologies to engage patients, care partners, and providers in preventing harm in hospital settings. Initially, we were challenged with assessing stakeholders’ perspectives from early adopter institutions. We learned that acute care patient portals must offer an integrated experience across care settings, humanize the patient-clinician relationship, enable equitable access, and align with institutional strategy to promote sustainability.19
Cognitive Support
The opportunities identified include acclimatizing and assimilating to the hospital environment (reviewing policies and patient rights) and facilitating self-education and preparation by linking to personal health information and providing structured guidance at transitions.4 For example, a care partner of an incapacitated patient may watch a video to orient to the intensive care unit, navigate educational content linked to the patient’s admission diagnosis (pneumonia) entered in the EHR, view the timing of an upcoming imaging study (chest computed tomography scan), and complete a standardized checklist prior to discharge.
The main challenges we identified include ensuring accuracy of hospital-, unit-, and patient-level information, addressing information overload, configuring notification and display settings to optimize the user experience, presenting information at an appropriate health literacy level,4,21 and addressing security and privacy concerns when expanding access to family members.24
Respect and Boundaries
Opportunities identified include supporting individual learning styles by using interactive features of mobile devices to improve comprehension for visual, auditory, and tactile learners and reinforcing learning through the use of various types of digital media.25-27 For example, a visual learner may view a video tutorial for a newly prescribed medication. A tactile learner may prefer to use interactive graphical displays that exploit multidimensional touch capabilities of mobile devices to learn about active conditions or an upcoming procedure. An auditory learner may choose to use intelligent personal assistants to navigate their plan of care (“Hey Siri, what is my schedule for today?”). By addressing the learning preferences of patients and time constraints of clinicians, institutions can use acute care patient portals to promote more respectful interactions and collaborative decision-making during important care processes, such as obtaining surgical consent.28,29
We also identified opportunities to facilitate personalization by tailoring educational content and by enabling the use of patient-generated health data collected from wearable devices. For example, patients may prefer to interact with a virtual advocate to review discharge instructions (“Louis” in Project Re-Engineered Discharge) when personalized to their demographics and health literacy level.30-32 Patients may choose to upload step counts from wearable devices so that clinicians can monitor activity goals in preparation for discharge and while recovering afterwards. When supported in these ways, acute care patient portals allow patients to have more meaningful interactions with clinicians about diagnoses, treatments, prognosis, and goals for recovery.
The main challenges we identified include balancing interactions with technology and clinicians, ensuring clinicians understand how patients from different socioeconomic backgrounds use existing and newer technology to enhance self-management, assessing health and technology literacy, and understanding individual preferences for sharing patient-generated health data. Importantly, we must remain vigilant that patients will express concern about overdependence on technology, especially if it detracts from in-person interaction; our panelists emphasized that technology should never replace “human touch.”
Patient and Family Empowerment
The opportunities identified include promoting patient-centered communication by supporting a real-time and asynchronous dialogue among patients, care partners, and care team members (including ambulatory clinicians) while minimizing conversational silos4,33; displaying names, roles, and pictures of all care team members4,34; fostering transparency by sharing clinician documentation in progress notes and sign-outs35; ensuring accountability for a single plan of care spanning shift changes and handoffs, and providing a mechanism to enable real-time feedback.
Hospitalization can be a vulnerable and isolating experience, perpetuated by a lack of timely and coordinated communication with the care team. We identified opportunities to mitigate anxiety by promoting shared understanding when questions require input from multiple clinicians, when team members change, or when patients wish to communicate with their longitudinal ambulatory providers.4,34 For example, inviting patients to review clinicians’ progress notes should stimulate more open and meaningful communication.35 Furthermore, requesting that patients state their wishes, preferences, and goals could improve overall concordance with care team members.36,37 Empowering patients and care partners to voice their concerns, particularly those related to miscommunication, may mitigate harm propagated by handoffs, shift work, and weekend coverage.38,39 While reporting safety concerns represents a novel mechanism to augment medical-error reporting by clinicians alone,23,40 this strategy will be most effective when aligned with standardized communication initiatives (I-PASS) that have been proven to reduce medical errors and preventable adverse events and are being implemented nationally.41 Finally, by leveraging tools that facilitate instantaneous feedback, patients can be empowered to react to their plan (ranking skilled nursing facility options) as it is developed.
The main challenges we identified include managing expectations regarding the use of communication tools, accurately and reliably identifying care team members in the EHR,34 acknowledging patients as equal partners, ensuring patients receive a consistent message about diagnoses and therapies during handoffs and when multiple consultants have conflicting opinions about the plan,37 and addressing patient concerns fairly and respectfully.
RECOMMENDATIONS AND CONCLUSIONS
In summary, the patient-centered themes we identified serve as guiding principles for institutions, clinicians, and vendors who wish to use patient portals to improve the acute and postacute care patient experience. One central message resonates: Patients do not simply want access to their health information and the ability to communicate with the clinicians who furnish this information; they want to feel supported, respected, and empowered when doing so. It is only through partnership with patients and their advocates that we can fully realize the impact of digital technologies when patients are in their most vulnerable state.
Acknowledgments
The authors thank their colleagues and the patient and family advocates who contributed to this body of work as part of the Acute Care Patient Portal Task Force and conference: Brittany Couture; Ronen Rozenblum, PhD, MPH; Jennifer Prey, MPhil, MS, PhD; Kristin O’Reilly, RN, BSN, MPH; Patricia Q. Bourie, RN, MS, Cindy Dwyer, RN, BSN,S; Ryan Greysen, MD, MHS, MA; Jeffery Smith, MPP; Michael Gropper, MD, PhD; Patricia Dykes, RN, PhD; Martha B. Carnie; Jeffrey W. Mello; and Jane Webster.
Disclosure
Anuj K. Dalal, MD, David W. Bates, MD, MSc, and Sarah Collins, RN, PhD, are responsible for the conception or design of the work; acquisition, analysis, or interpretation of data; drafting the work or revising it critically for important intellectual content; and final approval of the version to be published. The authors agree to be accountable for all aspects of the work and to ensure that questions related to the accuracy or integrity of the work are appropriately investigated and resolved. This work was supported by a grant from the Gordon and Betty Moore Foundation ([GBMF] #4993). GBMF had no role in the design or conduct of the study; the collection, analysis, or interpretation of data; or preparation or review of the manuscript. The findings and conclusions in this report are those of the authors and do not necessarily represent the official position of GBMF. The authors report no conflicts of interest.
1. Sarkar U, Bates DW. Care partners and online patient portals. JAMA. 2014;311(4):357-358. PubMed
2. Grando MA, Rozenblum R, Bates DW, eds. Information Technology for Patient Empowerment in Healthcare, 1st Edition. Berlin: Walter de Gruyter Inc.; 2015.
3. Kelly MM, Hoonakker PLT, Dean SM. Using an inpatient portal to engage families in pediatric hospital care. J Am Med Inform Assoc. 2016;24(1):153-161. PubMed
4. Dalal AK, Dykes PC, Collins S, et al. A web-based, patient-centered toolkit to engage patients and caregivers in the acute care setting: A preliminary evaluation. J Am Med Inform Assoc. 2016;23(1):80-87. PubMed
5. Prey JE, Restaino S, Vawdrey DK. Providing hospital patients with access to their medical records. AMIA Annu Symp Proc. 2014;2014:1884-1893. PubMed
6. Herrin J, Harris KG, Kenward K, Hines S, Joshi MS, Frosch DL. Patient and family engagement: A survey of US hospital practices. BMJ Qual Saf. 2016;25(3):182-189. PubMed
7. Tom JO, Mangione-Smith R, Solomon C, Grossman DC. Integrated personal health record use: Association with parent-reported care experiences. Pediatrics. 2012;130(1):e183-e190. PubMed
8. Centers for Medicare & Medicaid Services (CMS), HHS. Medicare and Medicaid Programs; Electronic Health Record Incentive Program-Stage 2. Federal Register Final Rule. Sect. 170; 2012. https://www.federalregister.gov/documents/2012/03/07/2012-4443/medicare-and-medicaid-programs-electronic-health-record-incentive-program-stage-2. Accessed March 1, 2017.
9. Centers for Medicare & Medicaid Services (CMS), HHS. Medicare program; merit-based incentive payment system (MIPS) and alternative payment model (APM) incentive under the physician fee schedule, and criteria for physician-focused payment models. Final rule with comment period. Fed Regist. 2016;81(214):77008-77831. PubMed
10. Prey JE, Woollen J, Wilcox L, et al. Patient engagement in the inpatient setting: A systematic review. J Am Med Informat Assoc. 2014;21(4):742-750. PubMed
11. Ludwin S, Greysen SR. Use of smartphones and mobile devices in hospitalized patients: Untapped opportunities for inpatient engagement. J Hosp Med. 2015;10(7):459-461. PubMed
12. Coleman EA. Family caregivers as partners in care transitions: The caregiver advise record and enable act. J Hosp Med. 2016;11(12):883-885. PubMed
13. Kaziunas E, Hanauer DA, Ackerman MS, Choi SW. Identifying unmet informational needs in the inpatient setting to increase patient and caregiver engagement in the context of pediatric hematopoietic stem cell transplantation. J Am Med Inform Assoc. 2016;23(1):94-104. PubMed
14. Woollen J, Prey J, Wilcox L, et al. Patient experiences using an inpatient personal health record. Appl Clin Inform. 2016;7(2):446-460. PubMed
15. Irizarry T, DeVito Dabbs A, Curran CR. Patient portals and patient engagement: A state of the science review. J Med Internet Res. 2015;17(6):e148. doi:10.2196/jmir.4255. PubMed
16. Vawdrey DK, Wilcox LG, Collins SA, et al. A tablet computer application for patients to participate in their hospital care. AMIA Annu Symp Proc. 2011;2011:1428-1435. PubMed
17. Collins SA, Rozenblum R, Leung WY, et al. Acute care patient portals: A qualitative study of stakeholder perspectives on current practices. J Am Med Inform Assoc. 2016;24(e1):e9-e17. PubMed
18. Berger Z, Flickinger TE, Pfoh E, Martinez KA, Dy SM. Promoting engagement by patients and families to reduce adverse events in acute care settings: A systematic review. BMJ Qual Saf. 2014;23(7):548-555. PubMed
19. Forster AJ, Murff HJ, Peterson JF, Gandhi TK, Bates DW. The incidence and severity of adverse events affecting patients after discharge from the hospital. Ann Intern Med. 2003;138(3):161-167. PubMed
20. Griffin A, Skinner A, Thornhill J, Weinberger M. Patient Portals: Who uses them? What features do they use? And do they reduce hospital readmissions? Appl Clin Inform. 2016;7(2):489-501. PubMed
21. O’Leary KJ, Lohman ME, Culver E, Killarney A, Randy Smith G Jr, Liebovitz DM. The effect of tablet computers with a mobile patient portal application on hospitalized patients’ knowledge and activation. J Am Med Inform Assoc. 2016;23(1):159-165. PubMed
22. O’Leary KJ, Sharma RK, Killarney A, et al. Patients’ and Healthcare Providers’ Perceptions of a Mobile Portal Application for Hospitalized Patients. BMC Med Inform Decis Mak. 2016;16(1):123. PubMed
23. Pell JM, Mancuso M, Limon S, Oman K, Lin CT. Patient access to electronic health records during hospitalization. JAMA Intern Med. 2015;175(5):856-858. PubMed
24. Brown SM, Aboumatar HJ, Francis L, et al. Balancing digital information-sharing and patient privacy when engaging families in the intensive care unit. J Am Med Inform Assoc. 2016;23(5):995-1000. PubMed
25. Krishna S, Francisco BD, Balas EA, et al. Internet-enabled interactive multimedia asthma education program: A randomized trial. Pediatrics. 2003;111(3):503-510. PubMed
26. Fox MP. A systematic review of the literature reporting on studies that examined the impact of interactive, computer-based patient education programs. Patient Educ Couns. 2009;77(1):6-13. PubMed
27. Morgan ER, Laing K, McCarthy J, McCrate F, Seal MD. Using tablet-based technology in patient education about systemic therapy options for early-stage breast cancer: A pilot study. Curr Oncol. 2015;22(5):e364-e369. PubMed
28. Nehme J, El-Khani U, Chow A, Hakky S, Ahmed AR, Purkayastha S. The use of multimedia consent programs for surgical procedures: A systematic review. Surg Innov. 2013;20(1):13-23. PubMed
29. Waller A, Forshaw K, Carey M, et al. Optimizing patient preparation and surgical experience using eHealth technology. JMIR Med Inform. 2015;3(3):e29. PubMed
30. Abbott MB, Shaw P. Virtual nursing avatars: Nurse roles and evolving concepts of care. Online J Issues Nurs. 2016;21(3):7. PubMed
31. Cawthon C, Walia S, Osborn CY, Niesner KJ, Schnipper JL, Kripalani S. Improving care transitions: The patient perspective. J Health Commun. 2012;17 Suppl 3:312-324. PubMed
32. Bickmore TW, Pfeifer LM, Byron D, et al. Usability of conversational agents by patients with inadequate health literacy: Evidence from two clinical trials. J Health Commun. 2010;15 Suppl 2:197-210. PubMed
33. 2017;376(20):1905-1907. N Engl J Med.42. Mandl KD, Kohane IS. A 21st-century health IT system—creating a real-world information economy. PubMed
34. 2014;371(19):1803-1812.N Engl J Med41. Starmer AJ, Spector ND, Srivastava R, et al. Changes in medical errors after implementation of a handoff program. PubMed
35. 2016;24(1):153-161.J Am Med Inform Assoc.40. Kelly MM, Hoonakker PLT, Dean SM. Using an inpatient portal to engage families in pediatric hospital care. PubMed
36. 2017;171(4):372-381.JAMA Pediatr.39. Khan A, Coffey M, Litterer KP, et al. Families as partners in hospital error and adverse event surveillance. PubMed
37. 2017;17(4):389-402.Acad Pediatr.38. Khan A, Baird J, Rogers JE, et al. Parent and provider experience and shared understanding after a family-centered nighttime communication intervention. PubMed
38. 2016;6(6):319-329.Hosp Pediatr. 37. Khan A, Rogers JE, Forster CS, Furtak SL, Schuster MA, Landrigan CP. Communication and shared understanding between parents and resident-physicians at night. PubMed
39. 2016;11(9):615-619.J Hosp Med36. Figueroa JF, Schnipper JL, McNally K, Stade D, Lipsitz SR, Dalal AK. How often are hospitalized patients and providers on the same page with regard to the patient’s primary recovery goal for hospitalization? PubMed
40. 2013;8(7):414-417.J Hosp Med.35. Feldman HJ, Walker J, Li J, Delbanco T. OpenNotes: Hospitalists’ challenge and opportunity. PubMed
41. 2016;11(5):381-385.J Hosp Med.34. Dalal AK, Schnipper JL. Care team identification in the electronic health record: A critical first step for patient-centered communication.PubMed
42. 2016;24(e1):e178-e184.J Am Med Inform Assoc.33. Dalal AK, Schnipper J, Massaro A, et al. A web-based and mobile patient-centered “microblog” messaging platform to improve care team communication in acute care. PubMed
© 2017 Society of Hospital Medicine
Vendor CPOE for Renal Impairment
Hospitalized patients with renal impairment are vulnerable to adverse drug events (ADEs).[1, 2] Appropriate prescribing for patients with renal insufficiency is challenging because of the complexities of drug therapy within the wide spectrum of kidney disease.[3, 4, 5, 6] Accordingly, computerized physician order entry (CPOE) systems with clinical decision support may help prevent many ADEs by providing timely laboratory information, recommending renally adjusted doses, and by offering assistance with prescribing.[7, 8, 9]
Despite the proposed benefits of CPOE, outcomes vary greatly because of differences in technology.[10, 11, 12, 13] In particular, the type of decision support available to assist medication ordering in the setting of renal disease varies widely among current vendor systems. Given the uncertain benefits of CPOE, especially with the wide range of associated clinical decision support, we conducted this study to determine the impact of these systems on the rates of ADEs among hospitalized patients with kidney disease.
METHODS
This study was approved by the institutional review boards at each study site.
Design and Setting
We conducted a before‐and‐after study to evaluate the impact of newly implemented vendor CPOE systems in 5 community hospitals in Massachusetts. Although we reported on 6 hospitals in our baseline study,[14] 1 of these hospitals later chose not to implement CPOE, and therefore was not included in follow‐up. At the time of this study, 1 of the hospitals (site 3) had not yet achieved hospital‐wide implementation. Although CPOE had been adopted by most medical services at site 3, it had not yet been implemented in the emergency, obstetrical, or surgical departments. Thus, we limited our study to the medical services at this site. For the remaining sites, all admitting services were included with the exception of the psychiatric and neonatal services, which were excluded from both phases because they would have required different detection tools.
Participants
Patients aged 18 years with renal failure, exposed to potentially nephrotoxic and/or renally cleared medications, and admitted to any of the participating hospitals during the study period were eligible for inclusion. Of the patients meeting eligibility criteria, we randomly selected approximately 150 records per hospital in the preimplementation and postimplementation phases for a total sample of 1590 charts. The first phase of this study occurred from January 2005 to August 2006; the second phase began 6 months postimplementation and lasted from October 2008 to September 2010.
Principal Exposure
Each hospital independently selected a vendor CPOE system with variable clinical decision support capabilities: (1) sites 4 and 5 had basic CPOE only with no clinical decision support for renal disease; (2) sites 1 and 2 implemented rudimentary clinical decision support with laboratory display (eg, serum creatinine) whenever common renally related drugs were ordered; and (3) site 3 had the most advanced support in place where, in addition to basic order entry and lab checks, physicians were provided with suggested doses for renally cleared and/or nephrotoxic medications, as well as appropriate drug monitoring for medications with narrow therapeutic indices (eg, suggested dosages and frequencies for vancomycin and automated corollary laboratory monitoring).
Definitions
We screened for the presence of renal failure by a serum creatinine 1.5 mg/dL at the time of admission. However, the duration of renal impairment was not known. We defined 3 levels of renal insufficiency based on the calculated creatinine clearance (CrCl)15: mild (CrCl 5080 mL/min), moderate (1649 mL/min), and severe (15 mL/min). Subjects with a CrCl >80 mL/min were considered to have normal renal function and were excluded. Potentially nephrotoxic and/or renally cleared medications were then identified using an established knowledge base (see Supporting Information, Table 1, in the online version of this article).[16]
| Hospital Site | |||||||
|---|---|---|---|---|---|---|---|
| Baseline Characteristics | All Sites | 1 | 2 | 3 | 4 | 5 | P (Among All Sites)* |
| |||||||
| No. of patients | 815 | 170 | 156 | 143 | 164 | 182 | |
| Age, y, mean (range) | 72.2 (18.0102.0) | 79.2 (33102) | 77.3 (23101) | 65.6 (1898) | 70.7 (1896) | 69.2 (2096) | <0.01 |
| 1844 years, no. (%) | 68 (9.1) | 1 (0.67) | 8 (6.5) | 20 (14.9) | 15 (9.4) | 24 (13.4) | <0.01 |
| 4554 years, no. (%) | 67 (9.0) | 6 (4.0) | 5 (4.1) | 17 (12.7) | 16 (10.0) | 23 (12.9) | |
| 5564 years, no. (%) | 79 (10.6) | 15 (10.0) | 12 (9.8) | 23 (17.2) | 13 (8.1) | 16 (8.9) | |
| 6574 years, no. (%) | 104 (13.9) | 20 (13.3) | 12 (9.8) | 16 (11.9) | 30 (18.8) | 26 (14.5) | |
| 7584 years, no. (%) | 197 (26.4) | 44 (29.3) | 36 (29.3) | 24 (17.9) | 49 (30.6) | 44 (24.6) | |
| 85 years, no. (%) | 231 (31.0) | 64 (42.7) | 50 (40.7) | 34 (25.4) | 37 (23.1) | 46 (25.7) | |
| Sex | |||||||
| Male, no. (%) | 427 (57.0) | 66 (44.0) | 60 (48.8) | 82 (60.7) | 105 (65.2) | 114 (63.7) | <0.01 |
| Female, no. (%) | 321 (43.0) | 84 (56.0) | 63 (51.2) | 53 (39.3) | 56 (34.8) | 65 (36.3) | |
| Race | |||||||
| Caucasian, no. (%) | 654 (87.4) | 129 (86.0) | 118 (95.9) | 126 (93.3) | 129 (80.1) | 152 (84.9) | <0.01 |
| Hispanic, no. (%) | 25 (3.3) | 2 (1.3) | 0 (0) | 1 (0.74) | 13 (8.1) | 9 (5.0) | |
| African American, no. (%) | 45 (6.0) | 12 (8.0) | 4 (3.3) | 5 (3.7) | 13 (8.1) | 11 (6.2) | |
| Native American, no. (%) | 0 (0) | 0 (0) | 0 (0) | 0 (0) | 0 (0) | 0 (0) | |
| Asian, no. (%) | 13 (1.7) | 1 (0.81) | 1 (0.81) | 2 (1.5) | 5 (3.1) | 4 (2.2) | |
| Other, no. (%) | 7 (0.94) | 2 (1.3) | 0 (0) | 1 (0.74) | 1 (14.3) | 3 (1.7) | |
| Not recorded, no. (%) | 4 (0.53) | 4 (2.7) | 0 (0) | 0 (0.0) | 0 (0) | 0 (0) | |
| Initial severity of renal dysfunction | |||||||
| Mild, CrCl 5080 mL/min, no. (%) | 60 (7.4) | 4 (2.4) | 5 (3.2) | 5 (3.5) | 14 (8.5) | 32 (17.6) | <0. 01 |
| Moderate, CrCl 1649 mL/min, no. (%) | 388 (47.6) | 84 (49.4) | 71 (45.5) | 80 (55.9) | 76 (46.3) | 77 (42.3) | |
| Severe, CrCl <15 mL/min, no. (%) | 367 (45.0) | 82 (48.2) | 80 (51.3) | 58 (40.6) | 74 (45.1) | 73 (40.1) | |
| LOS, d, median (IQR) | 4.0 (26) | 4.0 (37) | 3.0 (25.5) | 4.0 (27) | 4.0 (27) | 4.0 (26) | 0.02 |
| DRG‐weighted LOS, d, median (IQR) | 5.0 (3.76.7) | 5.5 (46.7) | 5.0 (3.46.2) | 5.6 (4.36.7) | 5.0 (3.36.7) | 5.0 (4.26.7) | 0.27 |
In both phases of our study, only medications that were potentially nephrotoxic and/or renally cleared were included as potential cases; all other drugs were excluded. We defined an ADE as any drug‐related injury. These were considered preventable if they were due to an error at the time of order entry (eg, a doubling of creatinine secondary to an overdose of gentamicin or failure to order corollary drug levels for monitoring). A nonpreventable ADE was any drug‐related injury in which there was no error at the time of order entry (eg, a doubling of creatinine despite appropriate dosing of lisinopril).[17] A medication error was an error anywhere in the process of prescribing, transcribing, dispensing, administering, or monitoring a drug, but with no potential for harm or injury (eg, an order for an oral medication with no route specified when it was clear that the oral route was intended).[18] A potential ADE was an error with the potential to cause harm, but not resulting in injury, either because it was intercepted (eg, an order for ketorolac for a patient with renal failure, but caught by a pharmacist) or because of chance (eg, administering enoxaparin to a patient with severe renal dysfunction but without hemorrhage).
All study investigators underwent standardized training using a curriculum developed by the Center for Patient Safety Research and Practice (
Main Outcome Measures
The primary outcome was the rate of preventable ADEs. Secondary outcomes were the rates of potential ADEs and overall ADEs. All outcomes were related to nephrotoxicity or accumulation of a renally excreted medication.
Data collection and classification strategies were identical in both phases of our study.[14] We reviewed physician orders, medication lists, laboratory reports, admission histories, progress and consultation notes, discharge summaries, and nursing flow sheets, screening for the presence of medication incidents using an adaptation of the Institute for Healthcare Improvement's trigger tool, selected for its high sensitivity, reproducibility, and ease of use.[22, 23] In our adaptation of the tool, we excluded lidocaine, tobramycin, amikacin, and theophylline levels because of their infrequency. For each trigger found, a detailed description of the incident was extracted for detailed review. An example of a trigger is the use of sodium polystyrene, which may possibly indicate an overdose of potassium or a medication side effect.
Subsequently, each case was then independently reviewed by two investigators (A.A.L., M.A., B.C., S.R.S., M.C., N.K., E.Z., and G.S.)each assigned to at least 1 siteand blinded to prescribing physician and hospital to determine whether nephrotoxicity or injury from drug accumulation was present (see Supporting Information, Figure 1, in the online version of this article).[17] First, incidents were classified as ADEs, potential ADEs, or medication errors with no potential for injury. Second, ADEs and potential ADEs were rated according to severity. When nephrotoxic drugs were ordered, event severity was classified according to the elevation in serum creatinine24: increases of 10% were considered potential ADEs (near misses); increases of 10% to 100% were significant ADEs; and increases of 100% were serious ADEs. Changes in creatinine that were not associated with inappropriate medication orders were excluded. For renally excreted drugs with no potential for nephrotoxicity (eg, enoxaparin), we used clinical judgment to classify events as significant (eg, rash), severe (eg, 2‐unit gastrointestinal bleed), life threatening (eg, transfer to an intensive care unit), or fatal categories, as based on earlier work.[25] Disagreements were resolved by consensus. We had a score of 0.70 (95% confidence interval [CI]: 0.61‐0.80) for incident type, indicating excellent overall agreement.
Statistical Analysis
Baseline characteristics between hospitals were compared using the Fisher exact test for categorical variables and 1‐way analysis of variance for continuous variables. The occurrence of each outcome was determined according to site. To facilitate comparisons between sites, rates were expressed as number of events per 100 admissions with 95% CIs. To account for hospital effects in the analysis when comparing pre‐ and postimplementation rates of ADEs and potential ADEs, we developed a fixed‐effects Poisson regression model. To explore the independent effects of each system, a stratified analysis was performed to compare average rates of each outcome observed.
RESULTS
The outcomes of 775 patients in the baseline study were compared with the 815 patients enrolled during the postimplementation phase.[14] Among those in the postimplementation phase (Table 1), the mean age was 72.2 years, and they were predominantly male (57.0%). The demographics of the patients admitted to each of the 5 sites varied widely (P<0.01). Most patients had moderate to severe renal dysfunction.
Overall, the rates of ADEs were similar between the pre‐ and postimplementation phases (8.9/100 vs 8.3/100 admissions, respectively; P=0.74) (Table 2). However, there was a significant decrease in the rate of preventable ADEs, the primary outcome of interest, following CPOE implementation (8.0/100 vs 4.4/100 admissions; P<0.01). A reduction in preventable ADEs was observed in every hospital except site 4, where only basic order entry was introduced. However, there was a significant increase in the rates of nonpreventable ADEs (0.90/100 vs 3.9/100 admissions; P<0.01) and potential ADEs (55.5/100 vs 136.8/100 admissions; P<0.01).
| Rate/100 Admissions (95% CI) | ||||||||||||||||||||
|---|---|---|---|---|---|---|---|---|---|---|---|---|---|---|---|---|---|---|---|---|
| Total No. (%) | All Sites | Site 1 | Site 2 | Site 3 | Site 4 | Site 5 | ||||||||||||||
| Event | Pre | Post | Pre | Post | P* | Pre | Post | P | Pre | Post | P | Pre | Post | P | Pre | Post | P | Pre | Post | P |
| ||||||||||||||||||||
| ADEs | 69 (13.8) | 68 (5.7) | 8.9 (7.0 1.2) | 8.3 (6.50.5) | 0.74 | 9.8 (6.015.1) | 10.0 (6.015.5) | 0.96 | 11.0 (6.517.4) | 7.7 (4.1 12.9) | 0.34 | 12.4 (7.5 19.1) | 4.2 (1.7 8.5) | 0.02 | 4.1 (1.68.3) | 13.4 (8.619.8) | 0.01 | 7.1 (3.712.2) | 6.0 (3.110.4) | 0.71 |
| Preventable | 62 | 36 | 8.0 (6.2 10.2) | 4.4 (3.16.0) | <0.01 | 8.2 (4.713.1) | 7.1 (3.811.8) | 0.70 | 10.3 (6.016.5) | 5.8 (2.8 10.4) | 0.17 | 12.4 (7.519.1) | 0 (0 0.03) | <0.01 | 3.4 (1.27.3) | 7.9 (4.413.1) | 0.11 | 5.8 (2.810.5) | 1.1 (0.183.4) | 0.03 |
| Nonpreventable | 7 | 32 | 0.90 (0.39 1.7) | 3.9 (2.75.4) | <0.01 | 1.6 (0.414.3) | 2.9 (1.16.3) | 0.42 | 0.69 (0.043.04) | 1.9 (0.48 5.0) | 0.37 | 0 (00.03) | 4.2 (1.7 8.5) | <0.01 | 0.68 (0.043.0) | 5.5 (2.6 9.9) | 0.05 | 1.3 (0.21, 4.0) | 4.9 (2.48.9) | 0.09 |
| Potential ADEs | 430 (86.2) | 1115 (93.5) | 55.5 (50.4 60.9) | 136.8 (128.9145.0) | <0.01 | 65.0 (54.077.4) | 141.1 (124.1159.8) | <0.01 | 57.2 (45.870.5) | 98.7 (83.9 115.1) | <0.01 | 44.8 (34.856.6) | 103.5 (87.7 121.1) | <0.01 | 59.2 (47.645.8) | 132.9 (116.1151.4) | <0.01 | 49.0 (38.860.9) | 195.1 (175.5216.1) | <0.01 |
| Intercepted | 16 | 24 | 2.1 (1.2 3.2) | 2.9 (1.94.3) | <0.24 | 3.3 (1.36.6) | 4.7 (2.28.8) | 0.50 | 2.1 (0.515.4) | 1.3 (0.21 4.0) | 0.60 | 1.4 (0.234.3) | 2.8 (0.87 6.5) | 0.41 | 2.0 (0.515.3) | 4.9 (2.2 9.1) | 0.20 | 1.3 (0.214.0) | 1.1 (0.183.4) | 0.87 |
| Nonintercepted | 414 | 1091 | 53.4 (48.4 58.7) | 133.9 (126.1142.0) | <0.01 | 61.7 (51.173.8) | 136.5 (119.754.8) | <0.01 | 55.2 43.968.2) | 97.4 (82.8 113.8) | <0.01 | 43.4 (33.655.1) | 100.7 (85.1 118.1) | <0.01 | 57.1 (45.8 70.2) | 128.0 (111.5146.2) | <0.01 | 47.7 (37.759.5) | 194.0 (174.4214.9) | <0.01 |
Stratified Analysis
To account for differences in technology, we performed a stratified analysis (Table 3). As was consistent with the overall study estimates, the rates of nonpreventable ADEs and potential ADEs increased with all 3 interventions. In contrast, we found that the changes in preventable ADE rates were related to the level of clinical decision support, where the greatest benefit was associated with the most sophisticated decision support system (P=0.03 and 0.02 for comparisons between advanced vs rudimentary decision support and basic order entry only, respectively). There was no difference in preventable ADE rates at sites without decision support (4.6/100 vs 4.3/100 admissions; P=0.87); with rudimentary clinical decision support, there was a trend toward a decrease in the preventable ADE rate, which did not meet statistical significance (9.1/100 vs 6.4/100 admissions; P=0.22), and, the greatest reduction was seen with advanced clinical decision support (12.4/100 vs 0/100 admissions; P<0.01).
| Rate per 100 Admissions by Level of Clinical Decision Support (95% CI) | |||||||||
|---|---|---|---|---|---|---|---|---|---|
| Basic CPOE Only (Sites 4 and 5) | CPOE and Lab Display (Sites 1 and 2) | CPOE, Lab Display, and DrugDosing Check (Site 3) | |||||||
| Incident | Pre | Post | P | Pre | Post | P | Pre | Post | P |
| |||||||||
| ADEs | 5.6 (3.48.7) | 9.5 (6.613.2) | 0.08 | 10.3(7.314.3) | 8.9 (6.012.5) | 0.55 | 12.4 (7.5319.1) | 4.2 (1.78.5) | 0.02 |
| Preventable | 4.6 (2.67.5) | 4.3 (2.56.9) | 0.87 | 9.1 (6.312.8) | 6.4 (4.19.6) | 0.22 | 12.4 (7.5319.1) | 0.00 (00.03) | <0.01 |
| Nonpreventable | 0.99 (0.24 2.6) | 5.2 (3.28.0) | <0.01 | 1.2 (0.382.8) | 2.5 (1.14.6) | 0.24 | 0.00 (00.03) | 4.2 (1.78.5) | <0.01 |
| Potential ADEs | 54.0 (46.162.7) | 165.6 (152.4179.5) | <0.01 | 61.6 (53.570.5) | 120.9 (109.3133.2) | <0.01 | 44.8 (34.856.6) | 103.5 (87.7121.1) | <0.01 |
| Intercepted | 1.7 (0.593.6) | 2.9 (1.45.1) | 0.30 | 2.7 (1.34.9) | 3.1 (1.55.4) | 0.76 | 1.4 (0.234.3) | 2.8 (0.876.5) | 0.42 |
| Nonintercepted | 52.3 (44.660.9) | 162.7 (149.6176.5) | <0.01 | 58.8 (50.967.5) | 117.8 (106.4130.0) | <0.01 | 43.4 (33.655.1) | 100.7 (85.1118.1) | <0.01 |
Severity of Events
We further analyzed our data based on event severity (Table 4). Among preventable ADEs, only 1 fatal event was observed, which occurred after CPOE implementation. Here, a previously opioid‐nave patient received intravenous morphine for malignant pain. Within the first 24 hours, the patient received 70.2 mg of intravenous morphine, resulting in a decreased level of consciousness. The patient expired the following day. Furthermore, following implementation, among preventable ADEs, a reduction in significant events was seen (P=0.02) along with a nonsignificant reduction in the rate of serious events (P=0.06). However, the rate of preventable life‐threatening events was not different (P=0.96). The nonpreventable ADE rate rose during the postimplementation period for both serious (P=0.03) and significant events (P<0.01). The risk of fatal and life‐threatening nonpreventable ADEs did not change. The potential ADE rate increased following implementation for all severities (P<0. 01).
| Preimplementation | Postimplementation | ||||
|---|---|---|---|---|---|
| Incident | No. (%) | Average Rate/100 Admissions (95% CI)* | No. (%) | Average Rate/100 Admissions (95% CI)* | P |
| |||||
| All ADEs | |||||
| Fatal | 0 (0) | 0.00 (00.0047) | 1 (1.4) | 0.12 (0.0070.54) | 0.52 |
| Lifethreatening | 3 (4.3) | 0.39 (0.101.0) | 3 (4.4) | 0.37 (0.09 0.95) | 0.95 |
| Serious | 34 (49.3) | 4.4 (3.16.0) | 32 (47.1) | 3.9 (2.75.4) | 0.65 |
| Significant | 32 (46.4) | 4.1 (2.95.7) | 32 (47.1) | 3.9 (2.75.4) | 0.84 |
| Total | 69 (100) | 8.9 (7.011.2) | 68 (100) | 8.3 (6.510.5) | 0.74 |
| Preventable ADEs | |||||
| Fatal | 0 (0) | 0.00 (00.0047) | 1 (2.7) | 0.00 (00.0045) | 0.52 |
| Lifethreatening | 2 (3.2) | 0.26 (0.040.80) | 2 (5.6) | 0.25 (0.040.76) | 0.96 |
| Serious | 31 (50.0) | 4.0 (2.85.6) | 19 (52.8) | 2.3 (1.43.5) | 0.06 |
| Significant | 29 (46.8) | 3.7 (2.55.3) | 14 (38.9) | 1.7 (0.972.8) | 0.02 |
| Total | 62 (100) | 8.0 (6.210.2) | 36 (100) | 4.4 (3.16.0) | <0.01 |
| Nonpreventable ADEs | |||||
| Fatal | 0 (0) | 0.00 (00.0047) | 0 (0) | 0.00 (00.0045) | NS |
| Lifethreatening | 1 (14.2) | 0.13 (0.0070.57) | 1 (3.1) | 0.12 (0.0070.54) | 0.97 |
| Serious | 3 (42.9) | 0.39 (0.101.0) | 13 (40.6) | 1.6 (0.882.6) | 0.03 |
| Significant | 3 (42.9) | 0.39 (0.101.0) | 18 (56.3) | 2.2 (1.33.4) | <0.01 |
| Total | 7 (100) | 0.90 (0.391.7) | 32 (100) | 3.9 (2.75.4) | <0.01 |
| All potential ADEs | |||||
| Lifethreatening | 5 (1.2) | 0.65 (0.231.4) | 33 (3.0) | 4.0 (2.85.6) | <0.01 |
| Serious | 233 (54.2) | 30.1 (26.434.1) | 429 (38.4) | 52.6 (47.857.8) | <0.01 |
| Significant | 192 (44.6) | 24.8 (21.428.4) | 653 (58.6) | 80.1 (74.186.4) | <0.01 |
| Total | 430 (100) | 55.5 (50.460.9) | 1115 (100) | 136.8 (128.9145.0) | <0.01 |
| Intercepted potential ADEs | |||||
| Lifethreatening | 0 (0) | 0.00 (00.0047) | 1 (4.2) | 0.12 (0.0070.54) | 0.52 |
| Serious | 5 (31.2) | 0.65 (0.231.4) | 13 (54.2) | 1.6 (0.882.6) | 0.09 |
| Significant | 11 (68.8) | 1.4 (0.74 2.4) | 10 (41.6) | 1.2 (0.622.2) | 0.74 |
| Total | 16 (100) | 2.1 (1.23.2) | 24 (100) | 2.9 (1.94.3) | 0.24 |
| Nonintercepted potential ADEs | |||||
| Lifethreatening | 5 (1.2) | 0.65 (0.231.4) | 32 (2.9) | 3.9 (2.75.4) | <0.01 |
| Serious | 228 (55.1) | 29.4 (25.833.4) | 416 (38.1) | 51.0 (46.356.1) | <0.01 |
| Significant | 181 (43.7) | 23.4 (20.126.9) | 643 (58.9) | 78.9 (73.085.2) | <0.01 |
| Total | 414 (100) | 53.4 (48.458.7) | 1091 (100) | 133.9(126.1142.0) | <0.01 |
Case Reviews
In total, there were 36 preventable ADEs identified during the postimplementation phase (Table 5). Of these, inappropriate renal dosing accounted for 26 preventable ADEs, which involved antibiotics (eg, gentamicin‐induced renal failure), opioids (eg, over sedation from morphine), ‐blockers (eg, hypotension from atenolol), angiotensin‐converting enzyme inhibitors (eg, renal failure with hyperkalemia secondary to lisinopril), and digoxin (eg, bradyarrhythmia and toxicity). The use of contraindicated medications resulted in 7 preventable ADEs (eg, prescribing glyburide in the setting of severe renal impairment).[26] The remaining 3 preventable ADEs stemmed from unmonitored use of vancomycin.
| ADEs, Preventable, No. (Rate per 100 Admissions)* | ADEs, Nonpreventable, No. (Rate per 100 Admissions)* | ||||||
|---|---|---|---|---|---|---|---|
| Drug Class | Preimplementation | Postimplementation | P (for Entire Drug Class) | Preimplementation | Postimplementation | P (for Drug Class) | Drugs Involved |
| |||||||
| Cardiovascular | 20 (2.6) | 18 (2.2) | 0.63 | 4 (0.52) | 16 (2.0) | 0.02 | Atenolol, bumetanide, captopril, digoxin, furosemide, hydralazine, hydrochlorothiazide, lisinopril, sotalol, spironolactone |
| Diuretics | 1 (0.13) | 2 (0.25) | 1 (0.13) | 9 (1.1) | |||
| ‐blockers | 0 (0.00) | 2 (0.25) | 1 (0.13) | ||||
| ACE inhibitors and ARBs | 16 (2.1) | 10 (1.2) | 2 (0.26) | 7 (0.86) | |||
| Antiarrhythmic | 3 (0.39) | 3 (0.37) | |||||
| Vasodilator | 0 (0.00) | 1 (0.12) | |||||
| Analgesics | 28 (3.6) | 4 (0.49) | 0.0002 | 1 (0.13) | 5 (0.61) | 0.15 | Acetaminophen and combination pills containing acetaminophen: Percocet (oxycodone and acetaminophen), Tylenol #3 (codeine and acetaminophen), Vicodin (hydrocodone and acetaminophen), fentanyl, hydrocodone, meperidine, morphine, oxycodone |
| Narcotic | 13 (1.7) | 4 (0.49) | 0 (0.00) | 5 (0.61) | |||
| Non‐narcotic | 15 (1.9) | 0 (0.00) | 1 (0.13) | 0 | |||
| Antibiotics | 8 (1.0) | 13 (1.6) | 0.33 | 1 (0.13) | 9 (1.1) | 0.04 | Amikacin, ampicillin and sulbactam, ciprofloxacin, cefazolin, cefuroxime, gatifloxacin, gentamicin, levofloxacin, metronidazole, piperacillin and tazobactam, tobramycin, vancomycin |
| Neurotropic drugs | 2 (0.26) | 0 (0.00) | 0.28 | 0 | 0 | Lithium, midazolam | |
| Sedatives | 1 (0.13) | 0 (0.00) | |||||
| Antipsychotics | 1 (0.13) | 0 (0.00) | |||||
| Diabetes | 0 | 1 (0.12) | 0.52 | 0 | 1 (0.12) | 0.52 | Glipizide, glyburide |
| Oral antidiabetics | 0 | 1 (0.12) | 1 (0.12) | ||||
| Other drugs | 4 (0.52) | 0 (0.00) | 0.13 | 1 (0.13) | 1 (0.12) | 0.97 | Allopurinol, famotidine |
| Gastrointestinal drugs | 1 (0.13) | 0 (0.00) | |||||
| Other | 3 (0.39) | 0 (0.00) | 0 | 1 (0.12) | |||
DISCUSSION
We evaluated the use of vendor CPOE for hospitalized patients with renal disease and found that it was associated with a 45% reduction in preventable ADEs related to nephrotoxicity and accumulation of renally excreted medications. The impact of CPOE appeared to be related to the level of associated clinical decision support, where only the most advanced system was associated with benefit. We observed a significant increase in potential ADEs with all levels of intervention. Overall, these findings suggest that vendor‐developed applications with appropriate decision support can reduce the occurrence of renally related preventable ADEs, but careful implementation is needed if the potential ADE rate is to fall.
Many of the benefits of CPOE come from clinical decision support.[11] When applied to patients with renal impairment, CPOE with clinical decision support has been associated with decreased lengths of stay,[16, 27] reduced use of contraindicated medications,[28, 29, 30] improved dosing and drug monitoring,[16, 31, 32] and improved general prescribing practices.[29, 33] Even so, the observed benefit of CPOE on ADE rates has been variable, with some studies reporting reductions,[27, 34] whereas others are unable to detect differences.[16, 31] These studies, however, limited their case definition of ADEs to strictly declining renal function,[16, 31, 34] or adverse events directly resulting from anti‐infective drugs.[27] In contrast, our study accounted for nephrotoxicity and systemic toxicity from drug accumulation. Using this broader definition, we were able to detect large reductions in the rates of preventable ADEs following CPOE adoption.
Successful decision support is simple, intuitive, and provides speedy information that integrates seamlessly into the clinical workflow.[35, 36] However, information delivery, although necessary, is insufficient for improving safety. For instance, passive alerts are often ignored, deferred, or overridden.[30, 37, 38] Demonstrating this, Quartarolo et al. found that informing physicians of the presence of renal impairment using automated reporting of glomerular filtration rates did not change prescribing behavior.[39] In contrast, providing active feedback (with dosing recommendations) was observed to be more useful in effecting change.[40] Chertow et al. further showed that providing an adjusted dose list with a default dose and frequency at the time of order entry for patients with renal insufficiency improved appropriate ordering and was associated with a decreased length of stay.[16] Altogether, these studies help to explain why only CPOE with clinical decision support equipped to provide renally adjusted dosing and monitoring was associated with a reduction in preventable ADEs in our study.
However, in contrast to reports of internally developed systems,[20, 25] potential ADE rates actually rose during the follow‐up portion of our study. These appeared to be chiefly related to customized order sets with the potential of overdosing drugs through therapeutic duplication, a problem that is commonly known to be associated with CPOE (ie, new orders that overlap with other new or active medication orders, which may be the same drug itself or from within the same drug class, with the risk of overdose).[41, 42] Of note, our findings give rise to several key implications. First, hospitals implementing vendor‐developed CPOE systems may be at greater risk of incurring potential ADEs compared to those using home‐grown systems, which have comparatively gone through more cycles of internal refinement. As such, it is necessary to monitor for issues postimplementation and respond with appropriate changes to achieve successful system performance.[35, 36] Second, although the rate of potential ADEs (near misses) increased, preventable ADEs decreased because some of these errors were intercepted, whereas others were averted simply because of chance. Of note, not all potential ADEs have the same potential for injury; more serious cases are more likely to result in actual ADEs (eg, failure to renally dose acetaminophen likely poses less potential for harm than prescribing a full dose of enoxaparin in the setting of severe renal failure). Third, we found that most potential ADEs could have been averted with a combination of basic (dosing guidance and drug‐drug interactions checks) and advanced decision support (medication‐associated laboratory testing and drug‐disease interactions).[43] Therefore, further refinements to existing software are needed to maximize safety outcomes.
Our study has some limitations. This study was not a randomized controlled trial, and thus is subject to potential confounding. Although 6 hospitals were involved at the study inception,[14] one of these hospitals eventually opted not to implement CPOE, and further declined to participate as a control site. Therefore, we cannot exclude confounding from secular trends because we had no contemporaneous control group. However, the introduction of CPOE was the main medication safety‐oriented intervention during the study interval, thus arguing against major confounding by cointervention. Second, even though it is possible that classification bias may have been introduced between the preimplementation and postimplementation portions of our study, especially given the passage of time, it is unlikely. Study personnel underwent training using a curriculum designed to maintain continuity across projects, minimize individual variability, and optimize reproducibility in data collection and classification, as in a number of previous studies.[14, 17, 19, 20, 21] Third, our study is limited by a heterogeneous intervention, as varying levels of decision support were introduced. However, this reflects usual practice and may be construed as a strength as we were able to describe the impact of different types of decision support. Fourth, we enrolled patients with a large spectrum of renal impairment, and our findings are not specific to any particular subgroup. However, our wide recruitment strategy also enhances the generalizability. Finally, our study was restricted to patients who were exposed to potentially nephrotoxic and/or renally cleared drugs. As such, we could not determine whether advanced decision support helped to eliminate the use of some potentially dangerous medications altogether, as these cases would have been excluded from our study. It is possible, therefore, that our study findings underestimate the true benefit of clinical decision support.
In conclusion, vendor CPOE implementation in 5 community hospitals was associated with a 45% reduction in preventable ADE rates among patients with renal impairment. Measurable benefit was associated with advanced decision support capable of lab display, dosing guidance, and medication‐associated laboratory testing. Although the potential benefits of CPOE systems are far reaching, achieving the desired safety benefits will require appropriate decision support, tracking of problems that arise, and systematic approaches to eliminating them.
Acknowledgments
The authors thank Kathy Zigmont, RN, and Cathy Foskett, RN (Brigham and Women's Hospital, Division of General Internal Medicine and Primary Care) for the chart review and data collection at the participating study sites.
Disclosures: The Rx Foundation and Commonwealth Fund supported the study. They commented on its design, but were not involved in data collection, data management, analysis, interpretation, or writing of the manuscript. Dr. Leung is supported by a Clinical Fellowship Award from Alberta Innovates Health Solutions and by a Fellowship Award from the Canadian Institutes for Health Research. Dr. Schiff received financial support from the FDA CPOE Task Order and the Commonwealth Fund. Ms. Keohane served as a consultant to the American College of Obstetrician and Gynecologists and as a reviewer for the VRQC Program. She received honoraria for a presentation on Patient Safety in 2010, sponsored by Abbott Nutrition International, and a lecture on Nurse Interruptions in Medication Administration by Educational Review Systems. Dr. Coffey received an honorarium from Meditech for speaking on social networking at Physician/CIO Forum in 2009. Dr. Kaufman participates in an advisory group with Siemens Medical Solutions. Dr. Zimlichman received support from the Rx Foundation and the Commonwealth Fund. Dr. Bates holds a minority equity position in the privately held company Medicalis, which develops Web‐based decision support for radiology test ordering, and has served as a consultant to Medicalis. He serves as an advisor to Calgary Scientific, which makes technologies that enable mobility within electronic health records. He is on the clinical advisory board for Patient Safety Systems, which provides a set of approaches to help hospitals improve safety. He has received funding support from the Massachusetts Technology Consortium. Ms. Amato, Dr. Simon, Dr. Cadet, Ms. Seger, and Ms. Yoon have no disclosures relevant to this study.
- , , . Drug Prescribing in Renal Failure: Dosing Guidelines for Adults and Children: American College of Physicians; 2007.
- , . Management of drug toxicity in patients with renal insufficiency. Nat Rev Nephrol. 2010;6(6):317–318.
- , , , . Use of renal risk drugs in hospitalized patients with impaired renal function—an underestimated problem? Nephrol Dial Transplant. 2006;21(11):3164–3171.
- , , , et al. Medication misuse in hospitalized patients with renal impairment. Int J Qual Health Care. 2003;15(4):331–335.
- , , , . Impact of a renal drug dosing service on dose adjustment in hospitalized patients with chronic kidney disease. Ann Pharmacother. 2009;43(10):1598–1605.
- , . Drug dosing in chronic kidney disease. Med Clin North Am. 2005;89(3):649–687.
- , , , et al. Systems analysis of adverse drug events. ADE Prevention Study Group. JAMA. 1995;274(1):35–43.
- , , , , , . The epidemiology of prescribing errors: the potential impact of computerized prescriber order entry. Arch Intern Med. 2004;164(7):785–792.
- , , . Factors related to errors in medication prescribing. JAMA. 1997;277(4):312–317.
- , , , et al. Role of computerized physician order entry systems in facilitating medication errors. JAMA. 2005;293(10):1197–1203.
- , , , , . Mixed results in the safety performance of computerized physician order entry. Health Aff (Millwood). 2010;29(4):655–663.
- , , , et al. The effect of computerized physician order entry with clinical decision support on the rates of adverse drug events: a systematic review. J Gen Intern Med. 2008;23(4):451–458.
- , , . The impact of computerized physician medication order entry in hospitalized patients—a systematic review. Int J Med Inform. 2008;77(6):365–376.
- , , , et al. Occurrence of adverse, often preventable, events in community hospitals involving nephrotoxic drugs or those excreted by the kidney. Kidney Int. 2009;76(11):1192–1198.
- , . Prediction of creatinine clearance from serum creatinine. Nephron. 1976;16(1):31–41.
- , , , et al. Guided medication dosing for inpatients with renal insufficiency. JAMA. 2001;286(22):2839–2844.
- , , , , . Adverse drug events and medication errors: detection and classification methods. Qual Saf Health Care. 2004;13(4):306–314.
- , , , , . Relationship between medication errors and adverse drug events. J Gen Intern Med. 1995;10(4):199–205.
- , , , et al. Incidence of adverse drug events and potential adverse drug events. Implications for prevention. ADE Prevention Study Group. JAMA. 1995;274(1):29–34.
- , , , et al. Effect of computerized physician order entry and a team intervention on prevention of serious medication errors. JAMA. 1998;280(15):1311–1316.
- , , , et al. Adverse drug event rates in six community hospitals and the potential impact of computerized physician order entry for prevention. J Gen Intern Med. 2010;25(1):31–38.
- , , . Adverse drug event trigger tool: a practical methodology for measuring medication related harm. Qual Saf Health Care. 2003;12(3):194–200.
- Institute for Healthcare Improvement: IHI Trigger Tool for Measuring Adverse Drug Events. 2011. Available at: http://www.ihi.org/knowledge/Pages/Tools/TriggerToolforMeasuringAdverseDrugEvents.aspx. Accessed February 1, 2013.
- , , , . Renal safety of two analgesics used over the counter: ibuprofen and aspirin. Clin Pharmacol Ther. 1986;40(4):373–377.
- , , , et al. The impact of computerized physician order entry on medication error prevention. J Am Med Inform Assoc. 1999;6(4):313–321.
- , , . Prolonged sulfonylurea‐induced hypoglycemia in diabetic patients with end‐stage renal disease. Am J Kidney Dis. 2000;35(3):500–505.
- , , , et al. A computer‐assisted management program for antibiotics and other antiinfective agents. N Engl J Med. 1998;338(4):232–238.
- , , , et al. Alert system for inappropriate prescriptions relating to patients' clinical condition. Methods Inf Med. 2009;48(6):566–573.
- , , , , , . Computerized clinical decision support during medication ordering for long‐term care residents with renal insufficiency. J Am Med Inform Assoc. 2009;16(4):480–485.
- , , . A trial of automated decision support alerts for contraindicated medications using computerized physician order entry. J Am Med Inform Assoc. 2005;12(3):269–274.
- , , , , . Effects of clinical decision support on initial dosing and monitoring of tobramycin and amikacin. Am J Health Syst Pharm. 2011;68(7):624–632.
- , , , , , . Computerized decision support for medication dosing in renal insufficiency: a randomized, controlled trial. Ann Emerg Med. 2010;56(6):623–629.
- , , , . Implementation of rules based computerised bedside prescribing and administration: intervention study. BMJ. 2000;320(7237):750–753.
- , , , et al. Effect of computer‐based alerts on the treatment and outcomes of hospitalized patients. Arch Intern Med. 1994;154(13):1511–1517.
- , , , et al. Ten commandments for effective clinical decision support: making the practice of evidence‐based medicine a reality. J Am Med Inform Assoc. 2003;10(6):523–530.
- , , . Computerized decision support systems: improving patient safety in nephrology. Nat Rev Nephrol. 2011;7(6):348–355.
- , , , et al. Impact of a computerized alert during physician order entry on medication dosing in patients with renal impairment. Proc AMIA Symp. 2002:577–581.
- , , , et al. A computerized provider order entry intervention for medication safety during acute kidney injury: a quality improvement report. Am J Kidney Dis. 2010;56(5):832–841.
- , , . Reporting of estimated glomerular filtration rate: effect on physician recognition of chronic kidney disease and prescribing practices for elderly hospitalized patients. J Hosp Med. 2007;2(2):74–78.
- , , , , . Drug dosage in patients with renal failure optimized by immediate concurrent feedback. J Gen Intern Med. 2001;16(6):369–375.
- , , , et al. Factors contributing to an increase in duplicate medication order errors after CPOE implementation. J Am Med Inform Assoc. 2011;18(6):774–782.
- , , , et al. Impact of Vendor Computerized Physician Order Entry in Community Hospitals. J Gen Intern Med. 2012;27(7):801–807.
- , , , et al. Medication‐related clinical decision support in computerized provider order entry systems: a review. J Am Med Inform Assoc. 2007;14(1):29–40.
Hospitalized patients with renal impairment are vulnerable to adverse drug events (ADEs).[1, 2] Appropriate prescribing for patients with renal insufficiency is challenging because of the complexities of drug therapy within the wide spectrum of kidney disease.[3, 4, 5, 6] Accordingly, computerized physician order entry (CPOE) systems with clinical decision support may help prevent many ADEs by providing timely laboratory information, recommending renally adjusted doses, and by offering assistance with prescribing.[7, 8, 9]
Despite the proposed benefits of CPOE, outcomes vary greatly because of differences in technology.[10, 11, 12, 13] In particular, the type of decision support available to assist medication ordering in the setting of renal disease varies widely among current vendor systems. Given the uncertain benefits of CPOE, especially with the wide range of associated clinical decision support, we conducted this study to determine the impact of these systems on the rates of ADEs among hospitalized patients with kidney disease.
METHODS
This study was approved by the institutional review boards at each study site.
Design and Setting
We conducted a before‐and‐after study to evaluate the impact of newly implemented vendor CPOE systems in 5 community hospitals in Massachusetts. Although we reported on 6 hospitals in our baseline study,[14] 1 of these hospitals later chose not to implement CPOE, and therefore was not included in follow‐up. At the time of this study, 1 of the hospitals (site 3) had not yet achieved hospital‐wide implementation. Although CPOE had been adopted by most medical services at site 3, it had not yet been implemented in the emergency, obstetrical, or surgical departments. Thus, we limited our study to the medical services at this site. For the remaining sites, all admitting services were included with the exception of the psychiatric and neonatal services, which were excluded from both phases because they would have required different detection tools.
Participants
Patients aged 18 years with renal failure, exposed to potentially nephrotoxic and/or renally cleared medications, and admitted to any of the participating hospitals during the study period were eligible for inclusion. Of the patients meeting eligibility criteria, we randomly selected approximately 150 records per hospital in the preimplementation and postimplementation phases for a total sample of 1590 charts. The first phase of this study occurred from January 2005 to August 2006; the second phase began 6 months postimplementation and lasted from October 2008 to September 2010.
Principal Exposure
Each hospital independently selected a vendor CPOE system with variable clinical decision support capabilities: (1) sites 4 and 5 had basic CPOE only with no clinical decision support for renal disease; (2) sites 1 and 2 implemented rudimentary clinical decision support with laboratory display (eg, serum creatinine) whenever common renally related drugs were ordered; and (3) site 3 had the most advanced support in place where, in addition to basic order entry and lab checks, physicians were provided with suggested doses for renally cleared and/or nephrotoxic medications, as well as appropriate drug monitoring for medications with narrow therapeutic indices (eg, suggested dosages and frequencies for vancomycin and automated corollary laboratory monitoring).
Definitions
We screened for the presence of renal failure by a serum creatinine 1.5 mg/dL at the time of admission. However, the duration of renal impairment was not known. We defined 3 levels of renal insufficiency based on the calculated creatinine clearance (CrCl)15: mild (CrCl 5080 mL/min), moderate (1649 mL/min), and severe (15 mL/min). Subjects with a CrCl >80 mL/min were considered to have normal renal function and were excluded. Potentially nephrotoxic and/or renally cleared medications were then identified using an established knowledge base (see Supporting Information, Table 1, in the online version of this article).[16]
| Hospital Site | |||||||
|---|---|---|---|---|---|---|---|
| Baseline Characteristics | All Sites | 1 | 2 | 3 | 4 | 5 | P (Among All Sites)* |
| |||||||
| No. of patients | 815 | 170 | 156 | 143 | 164 | 182 | |
| Age, y, mean (range) | 72.2 (18.0102.0) | 79.2 (33102) | 77.3 (23101) | 65.6 (1898) | 70.7 (1896) | 69.2 (2096) | <0.01 |
| 1844 years, no. (%) | 68 (9.1) | 1 (0.67) | 8 (6.5) | 20 (14.9) | 15 (9.4) | 24 (13.4) | <0.01 |
| 4554 years, no. (%) | 67 (9.0) | 6 (4.0) | 5 (4.1) | 17 (12.7) | 16 (10.0) | 23 (12.9) | |
| 5564 years, no. (%) | 79 (10.6) | 15 (10.0) | 12 (9.8) | 23 (17.2) | 13 (8.1) | 16 (8.9) | |
| 6574 years, no. (%) | 104 (13.9) | 20 (13.3) | 12 (9.8) | 16 (11.9) | 30 (18.8) | 26 (14.5) | |
| 7584 years, no. (%) | 197 (26.4) | 44 (29.3) | 36 (29.3) | 24 (17.9) | 49 (30.6) | 44 (24.6) | |
| 85 years, no. (%) | 231 (31.0) | 64 (42.7) | 50 (40.7) | 34 (25.4) | 37 (23.1) | 46 (25.7) | |
| Sex | |||||||
| Male, no. (%) | 427 (57.0) | 66 (44.0) | 60 (48.8) | 82 (60.7) | 105 (65.2) | 114 (63.7) | <0.01 |
| Female, no. (%) | 321 (43.0) | 84 (56.0) | 63 (51.2) | 53 (39.3) | 56 (34.8) | 65 (36.3) | |
| Race | |||||||
| Caucasian, no. (%) | 654 (87.4) | 129 (86.0) | 118 (95.9) | 126 (93.3) | 129 (80.1) | 152 (84.9) | <0.01 |
| Hispanic, no. (%) | 25 (3.3) | 2 (1.3) | 0 (0) | 1 (0.74) | 13 (8.1) | 9 (5.0) | |
| African American, no. (%) | 45 (6.0) | 12 (8.0) | 4 (3.3) | 5 (3.7) | 13 (8.1) | 11 (6.2) | |
| Native American, no. (%) | 0 (0) | 0 (0) | 0 (0) | 0 (0) | 0 (0) | 0 (0) | |
| Asian, no. (%) | 13 (1.7) | 1 (0.81) | 1 (0.81) | 2 (1.5) | 5 (3.1) | 4 (2.2) | |
| Other, no. (%) | 7 (0.94) | 2 (1.3) | 0 (0) | 1 (0.74) | 1 (14.3) | 3 (1.7) | |
| Not recorded, no. (%) | 4 (0.53) | 4 (2.7) | 0 (0) | 0 (0.0) | 0 (0) | 0 (0) | |
| Initial severity of renal dysfunction | |||||||
| Mild, CrCl 5080 mL/min, no. (%) | 60 (7.4) | 4 (2.4) | 5 (3.2) | 5 (3.5) | 14 (8.5) | 32 (17.6) | <0. 01 |
| Moderate, CrCl 1649 mL/min, no. (%) | 388 (47.6) | 84 (49.4) | 71 (45.5) | 80 (55.9) | 76 (46.3) | 77 (42.3) | |
| Severe, CrCl <15 mL/min, no. (%) | 367 (45.0) | 82 (48.2) | 80 (51.3) | 58 (40.6) | 74 (45.1) | 73 (40.1) | |
| LOS, d, median (IQR) | 4.0 (26) | 4.0 (37) | 3.0 (25.5) | 4.0 (27) | 4.0 (27) | 4.0 (26) | 0.02 |
| DRG‐weighted LOS, d, median (IQR) | 5.0 (3.76.7) | 5.5 (46.7) | 5.0 (3.46.2) | 5.6 (4.36.7) | 5.0 (3.36.7) | 5.0 (4.26.7) | 0.27 |
In both phases of our study, only medications that were potentially nephrotoxic and/or renally cleared were included as potential cases; all other drugs were excluded. We defined an ADE as any drug‐related injury. These were considered preventable if they were due to an error at the time of order entry (eg, a doubling of creatinine secondary to an overdose of gentamicin or failure to order corollary drug levels for monitoring). A nonpreventable ADE was any drug‐related injury in which there was no error at the time of order entry (eg, a doubling of creatinine despite appropriate dosing of lisinopril).[17] A medication error was an error anywhere in the process of prescribing, transcribing, dispensing, administering, or monitoring a drug, but with no potential for harm or injury (eg, an order for an oral medication with no route specified when it was clear that the oral route was intended).[18] A potential ADE was an error with the potential to cause harm, but not resulting in injury, either because it was intercepted (eg, an order for ketorolac for a patient with renal failure, but caught by a pharmacist) or because of chance (eg, administering enoxaparin to a patient with severe renal dysfunction but without hemorrhage).
All study investigators underwent standardized training using a curriculum developed by the Center for Patient Safety Research and Practice (
Main Outcome Measures
The primary outcome was the rate of preventable ADEs. Secondary outcomes were the rates of potential ADEs and overall ADEs. All outcomes were related to nephrotoxicity or accumulation of a renally excreted medication.
Data collection and classification strategies were identical in both phases of our study.[14] We reviewed physician orders, medication lists, laboratory reports, admission histories, progress and consultation notes, discharge summaries, and nursing flow sheets, screening for the presence of medication incidents using an adaptation of the Institute for Healthcare Improvement's trigger tool, selected for its high sensitivity, reproducibility, and ease of use.[22, 23] In our adaptation of the tool, we excluded lidocaine, tobramycin, amikacin, and theophylline levels because of their infrequency. For each trigger found, a detailed description of the incident was extracted for detailed review. An example of a trigger is the use of sodium polystyrene, which may possibly indicate an overdose of potassium or a medication side effect.
Subsequently, each case was then independently reviewed by two investigators (A.A.L., M.A., B.C., S.R.S., M.C., N.K., E.Z., and G.S.)each assigned to at least 1 siteand blinded to prescribing physician and hospital to determine whether nephrotoxicity or injury from drug accumulation was present (see Supporting Information, Figure 1, in the online version of this article).[17] First, incidents were classified as ADEs, potential ADEs, or medication errors with no potential for injury. Second, ADEs and potential ADEs were rated according to severity. When nephrotoxic drugs were ordered, event severity was classified according to the elevation in serum creatinine24: increases of 10% were considered potential ADEs (near misses); increases of 10% to 100% were significant ADEs; and increases of 100% were serious ADEs. Changes in creatinine that were not associated with inappropriate medication orders were excluded. For renally excreted drugs with no potential for nephrotoxicity (eg, enoxaparin), we used clinical judgment to classify events as significant (eg, rash), severe (eg, 2‐unit gastrointestinal bleed), life threatening (eg, transfer to an intensive care unit), or fatal categories, as based on earlier work.[25] Disagreements were resolved by consensus. We had a score of 0.70 (95% confidence interval [CI]: 0.61‐0.80) for incident type, indicating excellent overall agreement.
Statistical Analysis
Baseline characteristics between hospitals were compared using the Fisher exact test for categorical variables and 1‐way analysis of variance for continuous variables. The occurrence of each outcome was determined according to site. To facilitate comparisons between sites, rates were expressed as number of events per 100 admissions with 95% CIs. To account for hospital effects in the analysis when comparing pre‐ and postimplementation rates of ADEs and potential ADEs, we developed a fixed‐effects Poisson regression model. To explore the independent effects of each system, a stratified analysis was performed to compare average rates of each outcome observed.
RESULTS
The outcomes of 775 patients in the baseline study were compared with the 815 patients enrolled during the postimplementation phase.[14] Among those in the postimplementation phase (Table 1), the mean age was 72.2 years, and they were predominantly male (57.0%). The demographics of the patients admitted to each of the 5 sites varied widely (P<0.01). Most patients had moderate to severe renal dysfunction.
Overall, the rates of ADEs were similar between the pre‐ and postimplementation phases (8.9/100 vs 8.3/100 admissions, respectively; P=0.74) (Table 2). However, there was a significant decrease in the rate of preventable ADEs, the primary outcome of interest, following CPOE implementation (8.0/100 vs 4.4/100 admissions; P<0.01). A reduction in preventable ADEs was observed in every hospital except site 4, where only basic order entry was introduced. However, there was a significant increase in the rates of nonpreventable ADEs (0.90/100 vs 3.9/100 admissions; P<0.01) and potential ADEs (55.5/100 vs 136.8/100 admissions; P<0.01).
| Rate/100 Admissions (95% CI) | ||||||||||||||||||||
|---|---|---|---|---|---|---|---|---|---|---|---|---|---|---|---|---|---|---|---|---|
| Total No. (%) | All Sites | Site 1 | Site 2 | Site 3 | Site 4 | Site 5 | ||||||||||||||
| Event | Pre | Post | Pre | Post | P* | Pre | Post | P | Pre | Post | P | Pre | Post | P | Pre | Post | P | Pre | Post | P |
| ||||||||||||||||||||
| ADEs | 69 (13.8) | 68 (5.7) | 8.9 (7.0 1.2) | 8.3 (6.50.5) | 0.74 | 9.8 (6.015.1) | 10.0 (6.015.5) | 0.96 | 11.0 (6.517.4) | 7.7 (4.1 12.9) | 0.34 | 12.4 (7.5 19.1) | 4.2 (1.7 8.5) | 0.02 | 4.1 (1.68.3) | 13.4 (8.619.8) | 0.01 | 7.1 (3.712.2) | 6.0 (3.110.4) | 0.71 |
| Preventable | 62 | 36 | 8.0 (6.2 10.2) | 4.4 (3.16.0) | <0.01 | 8.2 (4.713.1) | 7.1 (3.811.8) | 0.70 | 10.3 (6.016.5) | 5.8 (2.8 10.4) | 0.17 | 12.4 (7.519.1) | 0 (0 0.03) | <0.01 | 3.4 (1.27.3) | 7.9 (4.413.1) | 0.11 | 5.8 (2.810.5) | 1.1 (0.183.4) | 0.03 |
| Nonpreventable | 7 | 32 | 0.90 (0.39 1.7) | 3.9 (2.75.4) | <0.01 | 1.6 (0.414.3) | 2.9 (1.16.3) | 0.42 | 0.69 (0.043.04) | 1.9 (0.48 5.0) | 0.37 | 0 (00.03) | 4.2 (1.7 8.5) | <0.01 | 0.68 (0.043.0) | 5.5 (2.6 9.9) | 0.05 | 1.3 (0.21, 4.0) | 4.9 (2.48.9) | 0.09 |
| Potential ADEs | 430 (86.2) | 1115 (93.5) | 55.5 (50.4 60.9) | 136.8 (128.9145.0) | <0.01 | 65.0 (54.077.4) | 141.1 (124.1159.8) | <0.01 | 57.2 (45.870.5) | 98.7 (83.9 115.1) | <0.01 | 44.8 (34.856.6) | 103.5 (87.7 121.1) | <0.01 | 59.2 (47.645.8) | 132.9 (116.1151.4) | <0.01 | 49.0 (38.860.9) | 195.1 (175.5216.1) | <0.01 |
| Intercepted | 16 | 24 | 2.1 (1.2 3.2) | 2.9 (1.94.3) | <0.24 | 3.3 (1.36.6) | 4.7 (2.28.8) | 0.50 | 2.1 (0.515.4) | 1.3 (0.21 4.0) | 0.60 | 1.4 (0.234.3) | 2.8 (0.87 6.5) | 0.41 | 2.0 (0.515.3) | 4.9 (2.2 9.1) | 0.20 | 1.3 (0.214.0) | 1.1 (0.183.4) | 0.87 |
| Nonintercepted | 414 | 1091 | 53.4 (48.4 58.7) | 133.9 (126.1142.0) | <0.01 | 61.7 (51.173.8) | 136.5 (119.754.8) | <0.01 | 55.2 43.968.2) | 97.4 (82.8 113.8) | <0.01 | 43.4 (33.655.1) | 100.7 (85.1 118.1) | <0.01 | 57.1 (45.8 70.2) | 128.0 (111.5146.2) | <0.01 | 47.7 (37.759.5) | 194.0 (174.4214.9) | <0.01 |
Stratified Analysis
To account for differences in technology, we performed a stratified analysis (Table 3). As was consistent with the overall study estimates, the rates of nonpreventable ADEs and potential ADEs increased with all 3 interventions. In contrast, we found that the changes in preventable ADE rates were related to the level of clinical decision support, where the greatest benefit was associated with the most sophisticated decision support system (P=0.03 and 0.02 for comparisons between advanced vs rudimentary decision support and basic order entry only, respectively). There was no difference in preventable ADE rates at sites without decision support (4.6/100 vs 4.3/100 admissions; P=0.87); with rudimentary clinical decision support, there was a trend toward a decrease in the preventable ADE rate, which did not meet statistical significance (9.1/100 vs 6.4/100 admissions; P=0.22), and, the greatest reduction was seen with advanced clinical decision support (12.4/100 vs 0/100 admissions; P<0.01).
| Rate per 100 Admissions by Level of Clinical Decision Support (95% CI) | |||||||||
|---|---|---|---|---|---|---|---|---|---|
| Basic CPOE Only (Sites 4 and 5) | CPOE and Lab Display (Sites 1 and 2) | CPOE, Lab Display, and DrugDosing Check (Site 3) | |||||||
| Incident | Pre | Post | P | Pre | Post | P | Pre | Post | P |
| |||||||||
| ADEs | 5.6 (3.48.7) | 9.5 (6.613.2) | 0.08 | 10.3(7.314.3) | 8.9 (6.012.5) | 0.55 | 12.4 (7.5319.1) | 4.2 (1.78.5) | 0.02 |
| Preventable | 4.6 (2.67.5) | 4.3 (2.56.9) | 0.87 | 9.1 (6.312.8) | 6.4 (4.19.6) | 0.22 | 12.4 (7.5319.1) | 0.00 (00.03) | <0.01 |
| Nonpreventable | 0.99 (0.24 2.6) | 5.2 (3.28.0) | <0.01 | 1.2 (0.382.8) | 2.5 (1.14.6) | 0.24 | 0.00 (00.03) | 4.2 (1.78.5) | <0.01 |
| Potential ADEs | 54.0 (46.162.7) | 165.6 (152.4179.5) | <0.01 | 61.6 (53.570.5) | 120.9 (109.3133.2) | <0.01 | 44.8 (34.856.6) | 103.5 (87.7121.1) | <0.01 |
| Intercepted | 1.7 (0.593.6) | 2.9 (1.45.1) | 0.30 | 2.7 (1.34.9) | 3.1 (1.55.4) | 0.76 | 1.4 (0.234.3) | 2.8 (0.876.5) | 0.42 |
| Nonintercepted | 52.3 (44.660.9) | 162.7 (149.6176.5) | <0.01 | 58.8 (50.967.5) | 117.8 (106.4130.0) | <0.01 | 43.4 (33.655.1) | 100.7 (85.1118.1) | <0.01 |
Severity of Events
We further analyzed our data based on event severity (Table 4). Among preventable ADEs, only 1 fatal event was observed, which occurred after CPOE implementation. Here, a previously opioid‐nave patient received intravenous morphine for malignant pain. Within the first 24 hours, the patient received 70.2 mg of intravenous morphine, resulting in a decreased level of consciousness. The patient expired the following day. Furthermore, following implementation, among preventable ADEs, a reduction in significant events was seen (P=0.02) along with a nonsignificant reduction in the rate of serious events (P=0.06). However, the rate of preventable life‐threatening events was not different (P=0.96). The nonpreventable ADE rate rose during the postimplementation period for both serious (P=0.03) and significant events (P<0.01). The risk of fatal and life‐threatening nonpreventable ADEs did not change. The potential ADE rate increased following implementation for all severities (P<0. 01).
| Preimplementation | Postimplementation | ||||
|---|---|---|---|---|---|
| Incident | No. (%) | Average Rate/100 Admissions (95% CI)* | No. (%) | Average Rate/100 Admissions (95% CI)* | P |
| |||||
| All ADEs | |||||
| Fatal | 0 (0) | 0.00 (00.0047) | 1 (1.4) | 0.12 (0.0070.54) | 0.52 |
| Lifethreatening | 3 (4.3) | 0.39 (0.101.0) | 3 (4.4) | 0.37 (0.09 0.95) | 0.95 |
| Serious | 34 (49.3) | 4.4 (3.16.0) | 32 (47.1) | 3.9 (2.75.4) | 0.65 |
| Significant | 32 (46.4) | 4.1 (2.95.7) | 32 (47.1) | 3.9 (2.75.4) | 0.84 |
| Total | 69 (100) | 8.9 (7.011.2) | 68 (100) | 8.3 (6.510.5) | 0.74 |
| Preventable ADEs | |||||
| Fatal | 0 (0) | 0.00 (00.0047) | 1 (2.7) | 0.00 (00.0045) | 0.52 |
| Lifethreatening | 2 (3.2) | 0.26 (0.040.80) | 2 (5.6) | 0.25 (0.040.76) | 0.96 |
| Serious | 31 (50.0) | 4.0 (2.85.6) | 19 (52.8) | 2.3 (1.43.5) | 0.06 |
| Significant | 29 (46.8) | 3.7 (2.55.3) | 14 (38.9) | 1.7 (0.972.8) | 0.02 |
| Total | 62 (100) | 8.0 (6.210.2) | 36 (100) | 4.4 (3.16.0) | <0.01 |
| Nonpreventable ADEs | |||||
| Fatal | 0 (0) | 0.00 (00.0047) | 0 (0) | 0.00 (00.0045) | NS |
| Lifethreatening | 1 (14.2) | 0.13 (0.0070.57) | 1 (3.1) | 0.12 (0.0070.54) | 0.97 |
| Serious | 3 (42.9) | 0.39 (0.101.0) | 13 (40.6) | 1.6 (0.882.6) | 0.03 |
| Significant | 3 (42.9) | 0.39 (0.101.0) | 18 (56.3) | 2.2 (1.33.4) | <0.01 |
| Total | 7 (100) | 0.90 (0.391.7) | 32 (100) | 3.9 (2.75.4) | <0.01 |
| All potential ADEs | |||||
| Lifethreatening | 5 (1.2) | 0.65 (0.231.4) | 33 (3.0) | 4.0 (2.85.6) | <0.01 |
| Serious | 233 (54.2) | 30.1 (26.434.1) | 429 (38.4) | 52.6 (47.857.8) | <0.01 |
| Significant | 192 (44.6) | 24.8 (21.428.4) | 653 (58.6) | 80.1 (74.186.4) | <0.01 |
| Total | 430 (100) | 55.5 (50.460.9) | 1115 (100) | 136.8 (128.9145.0) | <0.01 |
| Intercepted potential ADEs | |||||
| Lifethreatening | 0 (0) | 0.00 (00.0047) | 1 (4.2) | 0.12 (0.0070.54) | 0.52 |
| Serious | 5 (31.2) | 0.65 (0.231.4) | 13 (54.2) | 1.6 (0.882.6) | 0.09 |
| Significant | 11 (68.8) | 1.4 (0.74 2.4) | 10 (41.6) | 1.2 (0.622.2) | 0.74 |
| Total | 16 (100) | 2.1 (1.23.2) | 24 (100) | 2.9 (1.94.3) | 0.24 |
| Nonintercepted potential ADEs | |||||
| Lifethreatening | 5 (1.2) | 0.65 (0.231.4) | 32 (2.9) | 3.9 (2.75.4) | <0.01 |
| Serious | 228 (55.1) | 29.4 (25.833.4) | 416 (38.1) | 51.0 (46.356.1) | <0.01 |
| Significant | 181 (43.7) | 23.4 (20.126.9) | 643 (58.9) | 78.9 (73.085.2) | <0.01 |
| Total | 414 (100) | 53.4 (48.458.7) | 1091 (100) | 133.9(126.1142.0) | <0.01 |
Case Reviews
In total, there were 36 preventable ADEs identified during the postimplementation phase (Table 5). Of these, inappropriate renal dosing accounted for 26 preventable ADEs, which involved antibiotics (eg, gentamicin‐induced renal failure), opioids (eg, over sedation from morphine), ‐blockers (eg, hypotension from atenolol), angiotensin‐converting enzyme inhibitors (eg, renal failure with hyperkalemia secondary to lisinopril), and digoxin (eg, bradyarrhythmia and toxicity). The use of contraindicated medications resulted in 7 preventable ADEs (eg, prescribing glyburide in the setting of severe renal impairment).[26] The remaining 3 preventable ADEs stemmed from unmonitored use of vancomycin.
| ADEs, Preventable, No. (Rate per 100 Admissions)* | ADEs, Nonpreventable, No. (Rate per 100 Admissions)* | ||||||
|---|---|---|---|---|---|---|---|
| Drug Class | Preimplementation | Postimplementation | P (for Entire Drug Class) | Preimplementation | Postimplementation | P (for Drug Class) | Drugs Involved |
| |||||||
| Cardiovascular | 20 (2.6) | 18 (2.2) | 0.63 | 4 (0.52) | 16 (2.0) | 0.02 | Atenolol, bumetanide, captopril, digoxin, furosemide, hydralazine, hydrochlorothiazide, lisinopril, sotalol, spironolactone |
| Diuretics | 1 (0.13) | 2 (0.25) | 1 (0.13) | 9 (1.1) | |||
| ‐blockers | 0 (0.00) | 2 (0.25) | 1 (0.13) | ||||
| ACE inhibitors and ARBs | 16 (2.1) | 10 (1.2) | 2 (0.26) | 7 (0.86) | |||
| Antiarrhythmic | 3 (0.39) | 3 (0.37) | |||||
| Vasodilator | 0 (0.00) | 1 (0.12) | |||||
| Analgesics | 28 (3.6) | 4 (0.49) | 0.0002 | 1 (0.13) | 5 (0.61) | 0.15 | Acetaminophen and combination pills containing acetaminophen: Percocet (oxycodone and acetaminophen), Tylenol #3 (codeine and acetaminophen), Vicodin (hydrocodone and acetaminophen), fentanyl, hydrocodone, meperidine, morphine, oxycodone |
| Narcotic | 13 (1.7) | 4 (0.49) | 0 (0.00) | 5 (0.61) | |||
| Non‐narcotic | 15 (1.9) | 0 (0.00) | 1 (0.13) | 0 | |||
| Antibiotics | 8 (1.0) | 13 (1.6) | 0.33 | 1 (0.13) | 9 (1.1) | 0.04 | Amikacin, ampicillin and sulbactam, ciprofloxacin, cefazolin, cefuroxime, gatifloxacin, gentamicin, levofloxacin, metronidazole, piperacillin and tazobactam, tobramycin, vancomycin |
| Neurotropic drugs | 2 (0.26) | 0 (0.00) | 0.28 | 0 | 0 | Lithium, midazolam | |
| Sedatives | 1 (0.13) | 0 (0.00) | |||||
| Antipsychotics | 1 (0.13) | 0 (0.00) | |||||
| Diabetes | 0 | 1 (0.12) | 0.52 | 0 | 1 (0.12) | 0.52 | Glipizide, glyburide |
| Oral antidiabetics | 0 | 1 (0.12) | 1 (0.12) | ||||
| Other drugs | 4 (0.52) | 0 (0.00) | 0.13 | 1 (0.13) | 1 (0.12) | 0.97 | Allopurinol, famotidine |
| Gastrointestinal drugs | 1 (0.13) | 0 (0.00) | |||||
| Other | 3 (0.39) | 0 (0.00) | 0 | 1 (0.12) | |||
DISCUSSION
We evaluated the use of vendor CPOE for hospitalized patients with renal disease and found that it was associated with a 45% reduction in preventable ADEs related to nephrotoxicity and accumulation of renally excreted medications. The impact of CPOE appeared to be related to the level of associated clinical decision support, where only the most advanced system was associated with benefit. We observed a significant increase in potential ADEs with all levels of intervention. Overall, these findings suggest that vendor‐developed applications with appropriate decision support can reduce the occurrence of renally related preventable ADEs, but careful implementation is needed if the potential ADE rate is to fall.
Many of the benefits of CPOE come from clinical decision support.[11] When applied to patients with renal impairment, CPOE with clinical decision support has been associated with decreased lengths of stay,[16, 27] reduced use of contraindicated medications,[28, 29, 30] improved dosing and drug monitoring,[16, 31, 32] and improved general prescribing practices.[29, 33] Even so, the observed benefit of CPOE on ADE rates has been variable, with some studies reporting reductions,[27, 34] whereas others are unable to detect differences.[16, 31] These studies, however, limited their case definition of ADEs to strictly declining renal function,[16, 31, 34] or adverse events directly resulting from anti‐infective drugs.[27] In contrast, our study accounted for nephrotoxicity and systemic toxicity from drug accumulation. Using this broader definition, we were able to detect large reductions in the rates of preventable ADEs following CPOE adoption.
Successful decision support is simple, intuitive, and provides speedy information that integrates seamlessly into the clinical workflow.[35, 36] However, information delivery, although necessary, is insufficient for improving safety. For instance, passive alerts are often ignored, deferred, or overridden.[30, 37, 38] Demonstrating this, Quartarolo et al. found that informing physicians of the presence of renal impairment using automated reporting of glomerular filtration rates did not change prescribing behavior.[39] In contrast, providing active feedback (with dosing recommendations) was observed to be more useful in effecting change.[40] Chertow et al. further showed that providing an adjusted dose list with a default dose and frequency at the time of order entry for patients with renal insufficiency improved appropriate ordering and was associated with a decreased length of stay.[16] Altogether, these studies help to explain why only CPOE with clinical decision support equipped to provide renally adjusted dosing and monitoring was associated with a reduction in preventable ADEs in our study.
However, in contrast to reports of internally developed systems,[20, 25] potential ADE rates actually rose during the follow‐up portion of our study. These appeared to be chiefly related to customized order sets with the potential of overdosing drugs through therapeutic duplication, a problem that is commonly known to be associated with CPOE (ie, new orders that overlap with other new or active medication orders, which may be the same drug itself or from within the same drug class, with the risk of overdose).[41, 42] Of note, our findings give rise to several key implications. First, hospitals implementing vendor‐developed CPOE systems may be at greater risk of incurring potential ADEs compared to those using home‐grown systems, which have comparatively gone through more cycles of internal refinement. As such, it is necessary to monitor for issues postimplementation and respond with appropriate changes to achieve successful system performance.[35, 36] Second, although the rate of potential ADEs (near misses) increased, preventable ADEs decreased because some of these errors were intercepted, whereas others were averted simply because of chance. Of note, not all potential ADEs have the same potential for injury; more serious cases are more likely to result in actual ADEs (eg, failure to renally dose acetaminophen likely poses less potential for harm than prescribing a full dose of enoxaparin in the setting of severe renal failure). Third, we found that most potential ADEs could have been averted with a combination of basic (dosing guidance and drug‐drug interactions checks) and advanced decision support (medication‐associated laboratory testing and drug‐disease interactions).[43] Therefore, further refinements to existing software are needed to maximize safety outcomes.
Our study has some limitations. This study was not a randomized controlled trial, and thus is subject to potential confounding. Although 6 hospitals were involved at the study inception,[14] one of these hospitals eventually opted not to implement CPOE, and further declined to participate as a control site. Therefore, we cannot exclude confounding from secular trends because we had no contemporaneous control group. However, the introduction of CPOE was the main medication safety‐oriented intervention during the study interval, thus arguing against major confounding by cointervention. Second, even though it is possible that classification bias may have been introduced between the preimplementation and postimplementation portions of our study, especially given the passage of time, it is unlikely. Study personnel underwent training using a curriculum designed to maintain continuity across projects, minimize individual variability, and optimize reproducibility in data collection and classification, as in a number of previous studies.[14, 17, 19, 20, 21] Third, our study is limited by a heterogeneous intervention, as varying levels of decision support were introduced. However, this reflects usual practice and may be construed as a strength as we were able to describe the impact of different types of decision support. Fourth, we enrolled patients with a large spectrum of renal impairment, and our findings are not specific to any particular subgroup. However, our wide recruitment strategy also enhances the generalizability. Finally, our study was restricted to patients who were exposed to potentially nephrotoxic and/or renally cleared drugs. As such, we could not determine whether advanced decision support helped to eliminate the use of some potentially dangerous medications altogether, as these cases would have been excluded from our study. It is possible, therefore, that our study findings underestimate the true benefit of clinical decision support.
In conclusion, vendor CPOE implementation in 5 community hospitals was associated with a 45% reduction in preventable ADE rates among patients with renal impairment. Measurable benefit was associated with advanced decision support capable of lab display, dosing guidance, and medication‐associated laboratory testing. Although the potential benefits of CPOE systems are far reaching, achieving the desired safety benefits will require appropriate decision support, tracking of problems that arise, and systematic approaches to eliminating them.
Acknowledgments
The authors thank Kathy Zigmont, RN, and Cathy Foskett, RN (Brigham and Women's Hospital, Division of General Internal Medicine and Primary Care) for the chart review and data collection at the participating study sites.
Disclosures: The Rx Foundation and Commonwealth Fund supported the study. They commented on its design, but were not involved in data collection, data management, analysis, interpretation, or writing of the manuscript. Dr. Leung is supported by a Clinical Fellowship Award from Alberta Innovates Health Solutions and by a Fellowship Award from the Canadian Institutes for Health Research. Dr. Schiff received financial support from the FDA CPOE Task Order and the Commonwealth Fund. Ms. Keohane served as a consultant to the American College of Obstetrician and Gynecologists and as a reviewer for the VRQC Program. She received honoraria for a presentation on Patient Safety in 2010, sponsored by Abbott Nutrition International, and a lecture on Nurse Interruptions in Medication Administration by Educational Review Systems. Dr. Coffey received an honorarium from Meditech for speaking on social networking at Physician/CIO Forum in 2009. Dr. Kaufman participates in an advisory group with Siemens Medical Solutions. Dr. Zimlichman received support from the Rx Foundation and the Commonwealth Fund. Dr. Bates holds a minority equity position in the privately held company Medicalis, which develops Web‐based decision support for radiology test ordering, and has served as a consultant to Medicalis. He serves as an advisor to Calgary Scientific, which makes technologies that enable mobility within electronic health records. He is on the clinical advisory board for Patient Safety Systems, which provides a set of approaches to help hospitals improve safety. He has received funding support from the Massachusetts Technology Consortium. Ms. Amato, Dr. Simon, Dr. Cadet, Ms. Seger, and Ms. Yoon have no disclosures relevant to this study.
- , , . Drug Prescribing in Renal Failure: Dosing Guidelines for Adults and Children: American College of Physicians; 2007.
- , . Management of drug toxicity in patients with renal insufficiency. Nat Rev Nephrol. 2010;6(6):317–318.
- , , , . Use of renal risk drugs in hospitalized patients with impaired renal function—an underestimated problem? Nephrol Dial Transplant. 2006;21(11):3164–3171.
- , , , et al. Medication misuse in hospitalized patients with renal impairment. Int J Qual Health Care. 2003;15(4):331–335.
- , , , . Impact of a renal drug dosing service on dose adjustment in hospitalized patients with chronic kidney disease. Ann Pharmacother. 2009;43(10):1598–1605.
- , . Drug dosing in chronic kidney disease. Med Clin North Am. 2005;89(3):649–687.
- , , , et al. Systems analysis of adverse drug events. ADE Prevention Study Group. JAMA. 1995;274(1):35–43.
- , , , , , . The epidemiology of prescribing errors: the potential impact of computerized prescriber order entry. Arch Intern Med. 2004;164(7):785–792.
- , , . Factors related to errors in medication prescribing. JAMA. 1997;277(4):312–317.
- , , , et al. Role of computerized physician order entry systems in facilitating medication errors. JAMA. 2005;293(10):1197–1203.
- , , , , . Mixed results in the safety performance of computerized physician order entry. Health Aff (Millwood). 2010;29(4):655–663.
- , , , et al. The effect of computerized physician order entry with clinical decision support on the rates of adverse drug events: a systematic review. J Gen Intern Med. 2008;23(4):451–458.
- , , . The impact of computerized physician medication order entry in hospitalized patients—a systematic review. Int J Med Inform. 2008;77(6):365–376.
- , , , et al. Occurrence of adverse, often preventable, events in community hospitals involving nephrotoxic drugs or those excreted by the kidney. Kidney Int. 2009;76(11):1192–1198.
- , . Prediction of creatinine clearance from serum creatinine. Nephron. 1976;16(1):31–41.
- , , , et al. Guided medication dosing for inpatients with renal insufficiency. JAMA. 2001;286(22):2839–2844.
- , , , , . Adverse drug events and medication errors: detection and classification methods. Qual Saf Health Care. 2004;13(4):306–314.
- , , , , . Relationship between medication errors and adverse drug events. J Gen Intern Med. 1995;10(4):199–205.
- , , , et al. Incidence of adverse drug events and potential adverse drug events. Implications for prevention. ADE Prevention Study Group. JAMA. 1995;274(1):29–34.
- , , , et al. Effect of computerized physician order entry and a team intervention on prevention of serious medication errors. JAMA. 1998;280(15):1311–1316.
- , , , et al. Adverse drug event rates in six community hospitals and the potential impact of computerized physician order entry for prevention. J Gen Intern Med. 2010;25(1):31–38.
- , , . Adverse drug event trigger tool: a practical methodology for measuring medication related harm. Qual Saf Health Care. 2003;12(3):194–200.
- Institute for Healthcare Improvement: IHI Trigger Tool for Measuring Adverse Drug Events. 2011. Available at: http://www.ihi.org/knowledge/Pages/Tools/TriggerToolforMeasuringAdverseDrugEvents.aspx. Accessed February 1, 2013.
- , , , . Renal safety of two analgesics used over the counter: ibuprofen and aspirin. Clin Pharmacol Ther. 1986;40(4):373–377.
- , , , et al. The impact of computerized physician order entry on medication error prevention. J Am Med Inform Assoc. 1999;6(4):313–321.
- , , . Prolonged sulfonylurea‐induced hypoglycemia in diabetic patients with end‐stage renal disease. Am J Kidney Dis. 2000;35(3):500–505.
- , , , et al. A computer‐assisted management program for antibiotics and other antiinfective agents. N Engl J Med. 1998;338(4):232–238.
- , , , et al. Alert system for inappropriate prescriptions relating to patients' clinical condition. Methods Inf Med. 2009;48(6):566–573.
- , , , , , . Computerized clinical decision support during medication ordering for long‐term care residents with renal insufficiency. J Am Med Inform Assoc. 2009;16(4):480–485.
- , , . A trial of automated decision support alerts for contraindicated medications using computerized physician order entry. J Am Med Inform Assoc. 2005;12(3):269–274.
- , , , , . Effects of clinical decision support on initial dosing and monitoring of tobramycin and amikacin. Am J Health Syst Pharm. 2011;68(7):624–632.
- , , , , , . Computerized decision support for medication dosing in renal insufficiency: a randomized, controlled trial. Ann Emerg Med. 2010;56(6):623–629.
- , , , . Implementation of rules based computerised bedside prescribing and administration: intervention study. BMJ. 2000;320(7237):750–753.
- , , , et al. Effect of computer‐based alerts on the treatment and outcomes of hospitalized patients. Arch Intern Med. 1994;154(13):1511–1517.
- , , , et al. Ten commandments for effective clinical decision support: making the practice of evidence‐based medicine a reality. J Am Med Inform Assoc. 2003;10(6):523–530.
- , , . Computerized decision support systems: improving patient safety in nephrology. Nat Rev Nephrol. 2011;7(6):348–355.
- , , , et al. Impact of a computerized alert during physician order entry on medication dosing in patients with renal impairment. Proc AMIA Symp. 2002:577–581.
- , , , et al. A computerized provider order entry intervention for medication safety during acute kidney injury: a quality improvement report. Am J Kidney Dis. 2010;56(5):832–841.
- , , . Reporting of estimated glomerular filtration rate: effect on physician recognition of chronic kidney disease and prescribing practices for elderly hospitalized patients. J Hosp Med. 2007;2(2):74–78.
- , , , , . Drug dosage in patients with renal failure optimized by immediate concurrent feedback. J Gen Intern Med. 2001;16(6):369–375.
- , , , et al. Factors contributing to an increase in duplicate medication order errors after CPOE implementation. J Am Med Inform Assoc. 2011;18(6):774–782.
- , , , et al. Impact of Vendor Computerized Physician Order Entry in Community Hospitals. J Gen Intern Med. 2012;27(7):801–807.
- , , , et al. Medication‐related clinical decision support in computerized provider order entry systems: a review. J Am Med Inform Assoc. 2007;14(1):29–40.
© 2013 Society of Hospital Medicine