User login
The Effects of a Multifaceted Intervention to Improve Care Transitions Within an Accountable Care Organization: Results of a Stepped-Wedge Cluster-Randomized Trial
The Effects of a Multifaceted Intervention to Improve Care Transitions Within an Accountable Care Organization: Results of a Stepped-Wedge Cluster-Randomized Trial

This work is licensed under a Creative Commons Attribution 4.0 International License
Transitions from the hospital to the ambulatory setting are high-risk periods for patients in terms of adverse events, poor clinical outcomes, and readmission. Processes of care during care transitions are suboptimal, including poor communication among inpatient providers, patients, and ambulatory providers1,2; suboptimal communication of postdischarge plans of care to patients and their ability to carry out these plans3; medication discrepancies and nonadherence after discharge4; and lack of timely follow-up with ambulatory providers.5 Healthcare organizations continue to struggle with the question of which interventions to implement and how best to implement them.
Interventions to improve care transitions typically focus on readmission rates, but some studies have focused on postdischarge adverse events, defined as injuries in the 30 days after discharge caused by medical management rather than underlying disease processes.2 These adverse events cause psychological distress, out-of-pocket expenses, decreases in functional status, and caregiver burden. An estimated 20% of hospitalized patients suffer a postdischarge adverse event.1,2 Approximately two-thirds of these may be preventable or ameliorable.
The advent of Accountable Care Organizations (ACOs), defined as “groups of doctors, hospitals, and other health care providers who come together voluntarily to give coordinated high quality care to their patients,” creates an opportunity for improvements in patient safety during care transitions.6 Another opportunity has been the advent of Patient-Centered Medical Homes (PCMH), consisting of patient-oriented, comprehensive, team-based primary care enhanced by health information technology and population-based disease management tools.7,8 In theory, a hospital-PCMH collaboration within an ACO can improve transitional interventions since optimal communication and collaboration are more likely when both inpatient and primary care providers (PCPs) share infrastructure and are similarly incentivized. The objectives of this study were to design and implement a collaborative hospital-PCMH care transitions intervention within an ACO and evaluate its effects.
METHODS
This study was a two-arm, single-blind (blinded outcomes assessor), stepped-wedge, multisite cluster-randomized clinical trial (NCT02130570) approved by the institutional review board of Partners HealthCare.
Study Design and Randomization
The study employed a “stepped-wedge” design, which is a cluster-randomized study design in which an intervention is sequentially rolled out to different groups at different, prespecified, randomly determined times.9 Each cluster (in this case, each primary care practice) served as its own control, while still allowing for adjustment for temporal trends. Originally, 18 practices participated, but one withdrew due to the low number of patients enrolled in the study, leaving 17 clusters and 16 sequences; see Figure 1 of Appendix 1 for a full description of the sample size and timeline for each cluster. Practices were not aware of this timeline until after recruitment.
Study Setting and Participants
Conducted within a large Pioneer ACO in Boston and funded by the Patient-Centered Outcomes Research Institute (PCORI), the Partners-PCORI Transitions Study was designed as a “real-world” quality improvement project. Potential participants were adult patients who were admitted to medical and surgical services of two large academic hospitals (Hospital A and Hospital B) affiliated with an ACO, who were likely to be discharged back to the community, and whose PCP belonged to a primary care practice that was affiliated with the ACO, agreed to participate, and were designated PCMHs or on their way to being designated by meeting certain criteria: electronic health record, patient portal, team-based care, practice redesign, care management, and identification of high-risk patients. See Study Protocol (Appendix 2) for detailed patient and primary care practice inclusion criteria.
Patient Enrollment
Study staff screened participants from a daily automated list of patients admitted the day before, using medical records to determine eligibility, which was then confirmed by the patient’s nurse. Exclusion criteria included likely discharge to a location other than home, being in police custody, lack of a telephone, being homeless, previous enrollment in the study, and being unable to communicate in English or Spanish. Allocation to study arm was concealed until the patient or proxy provided informed written consent. The research assistant administered questionnaires to all study subjects to assess potential confounders and functional status 1 month prior to admission (
Intervention
The intervention was based on a conceptual model of an ideal discharge11 that we developed based on work by Naylor et al,12 work by Coleman and Berenson,3 best practices in medication reconciliation and information transfer according to our own research,13-15 the best examples of interventions to improve the discharge process,12,16,17 and a systematic review of discharge interventions.18 Some of the factors necessary for an ideal care transition include complete, organized, and timely documentation of the patient’s hospital course and postdischarge plan; effective discharge planning; coordination of care among the patient’s providers; methods to ensure medication safety; advanced care planning in appropriate patients; and education and “coaching” of patients and their caregivers so they learn how to manage their conditions. The final multifaceted intervention addressed each component of the ideal discharge and included inpatient and outpatient components (Table 1 and Table 1 of Appendix 1).

Patient and Public Involvement in Research
As with all PCORI-funded studies, this study involved a patient-family advisory council (PFAC). Our PFAC included six recently hospitalized patients or caregivers of recently hospitalized patients. The PFAC participated in monthly meetings throughout the study period. They helped inform the research questions, including confirmation that the endpoints were patient centered, and provided valuable input for the design of the intervention and the patient-facing components of the data collection instruments. They also interviewed several patient participants in the study regarding their experiences with the intervention. Lastly, they helped develop plans for dissemination of study results to the public.19
We also formed a steering committee consisting of physician, nursing, pharmacy, information technology, and administrative leadership representing primary care, inpatient care, and transitional care at both hospitals and Partners Healthcare. PFAC members took turns participating in quarterly steering committee meetings.
Evolution of the Intervention and Implementation
The intervention was iteratively refined during the course of the study in response to input from the PFAC, steering committee, and members of the intervention team; cases of adverse events and readmissions from patients despite being in the intervention arm; exit interviews of patients who had recently completed the intervention; and informal feedback from inpatient and outpatient clinicians. For example, we learned that the more complicated a patient’s conditions are, the sooner the clinical team wanted them to be seen after discharge. However, these patients were also less likely to feel well enough to keep that appointment. Therefore, the timing of follow-up of appointments needed to be a negotiation among the inpatient team, the patient, any caregivers, and the outpatient provider. PFAC members also emphasized that patients wanted one person to trust and to be the “point person” during a complicated transition such as hospital discharge.
At the same time, the intervention components evolved because of factors outside our control (eg, resource limitations). In keeping with the real-world nature of the research, the aim was for the intervention to be internally supported because incentives were theoretically more aligned with improvement of care transitions under the ACO model. By design, the PCORI contract only paid for limited parts of the intervention, such as a nurse practitioner to act as the discharge advocate at one hospital, overtime costs of inpatient pharmacists, and project manager time to facilitate inpatient-outpatient provider communication. (See Table 1 of Appendix 1 for details about the modifications to the intervention.)
Lastly, in keeping with PCORI’s methodology standards for studies of complex interventions,20 we strove to standardize the intervention by function across hospitals, units, and practices, while still allowing for local adaptation in the form. In other words, rather than specifying exactly how a task (eg, medication counseling) needed to be performed, the study design offered sites flexibility in how they implemented the task given their available personnel and institutional culture.
Intervention Fidelity
To determine the extent to which each patient in the intervention arm received each intervention component, a project manager unblinded to treatment arm reviewed the electronic medical record for documentation of each component implemented by providers (eg, inpatient pharmacists, outpatient nurses). Because each intervention component produced documentation, this provided an accurate assessment of intervention fidelity, ie, the extent to which the intervention was implemented as intended.
Outcome Assessment
Postdischarge Follow-up
Based on previous studies,2,21 a trained research assistant attempted to contact all study subjects 30 days (±5 days) after discharge and administered a questionnaire to identify any new or worsening symptoms since discharge, any healthcare use since discharge, and functional status in the previous week. Follow-up questions used branching logic to determine the relationship of any new or worsening symptoms to medications or other aspects of medical management. Research assistants followed up any positive responses with directed medical record review for objective findings, diagnoses, treatments, and responses. If patients could not be reached after five attempts, the research assistant instead conducted a thorough review of the outpatient medical record alone for provider reports of any new or worsening symptoms noted during follow-up within the 30-day postdischarge period. Research assistants also reviewed laboratory test results in all patients for evidence of postdischarge renal failure, elevated liver function tests, or new/worsening anemia.
Hospital Readmissions
We measured nonelective hospital readmissions within 30 days of discharge using a combination of administrative data for hospitalizations within the ACO network plus patient report during the 30-day phone call for all other readmissions.22
Adjudication of Outcomes
Adverse events and preventable adverse events: All cases of new or worsening symptoms or signs, along with all supporting documentation, were then presented to teams of two trained blinded physician adjudicators through application of methods established in previous studies.4,21 Each of the two adjudicators independently reviewed the information, along with the medical record, and completed a standardized form to confirm or deny the presence of any adverse events (ie, patient injury due to medical management) and to classify the type of event (eg, adverse drug event, hospital-acquired infection, procedural complication, diagnostic or management error), the severity and duration of the event, and whether the event was preventable or ameliorable. The two adjudicators then met to resolve any differences in their findings and come to consensus.
Preventable readmissions: If patients were readmitted to either study hospital, we conducted an evaluation, based on previous studies,23 to determine if and how the readmission could have been prevented including (a) a standardized patient and caregiver interview to identify possible problems with the transitions process and (b) an email questionnaire to the patient’s PCP and the inpatient teams who cared for the patient during the index admission and readmission regarding possible deficiencies with the transitions process. As with adverse event adjudications, two physician adjudicators worked independently to classify the preventability of the readmission and then met to come to consensus. Conflicts were resolved by a third adjudicator.
Analysis Plan
To evaluate the effects of the intervention on the primary outcome, the number of postdischarge adverse events per patient, we used multivariable Poisson regression, with study arm as the main predictor. A similar approach was used to evaluate the number of new or worsening postdischarge signs or symptoms and the number of preventable adverse events per patient. We used an intention-to-treat analysis: If a practice did not start the intervention when they were scheduled to, based on our randomization, we counted all patients in that practice admitted after that point as intervention patients. We adjusted for patient demographics, clinical characteristics, month, inpatient unit, and primary care practice as fixed effects. We clustered by PCP using general linear models. Intervention effects were expressed as both unadjusted and adjusted incidence rate ratios (IRRs). We also conducted a limited number of subgroup analyses, determined a priori, to determine whether the intervention was more effective in certain patient populations; we used interaction terms (intervention × subgroup) to determine the statistical significance of any effect modification.
To evaluate the effects of the intervention on nonelective readmissions and preventable readmissions, we used a similar approach, using multivariable logistic regression. Postdischarge functional status, adjusted for status prior to admission, was analyzed using multivariable linear regression and random effects by primary care practice. The general linear mixed model (GLIMMIX) procedure in the SAS 9.3 statistical package (SAS Institute) was used to carry out all analyses.
Power and Sample Size
We assumed a baseline rate of postdischarge adverse events of 0.30 per patient.21 We conservatively assumed an effect size of a change from 0.30 in the control group to 0.23 in the intervention group (a relative reduction of 22%, which was based on studies of preventability rates23 and close to the minimum clinically important difference). Based on prior studies,4,22 we assumed an intraclass correlation coefficient of 0.01 with an average cluster size of seven patients per PCP. Assuming a 10% loss to follow-up rate and an alpha of 0.05, we targeted a sample size of 1,800 patients to achieve 80% power, with one-third of the patients in the usual care arm and two-thirds in the intervention arm.
RESULTS
We enrolled 18 PCMH primary care practices to participate in the study, including 8 from Hospital A (out of 13 approached), 8 from Hospital B (out of 11), and 2 from other ACO practices (out of 9) (plus two pilot practices). Reasons for not participating included not having dedicated personnel to play the role of the responsible outpatient clinician, undergoing recent turn-over in practice leadership, and not having enough patients admitted to the two hospitals. One practice only enrolled 5 patients in the study and withdrew from participation, which left 17 practices.
Study Patients
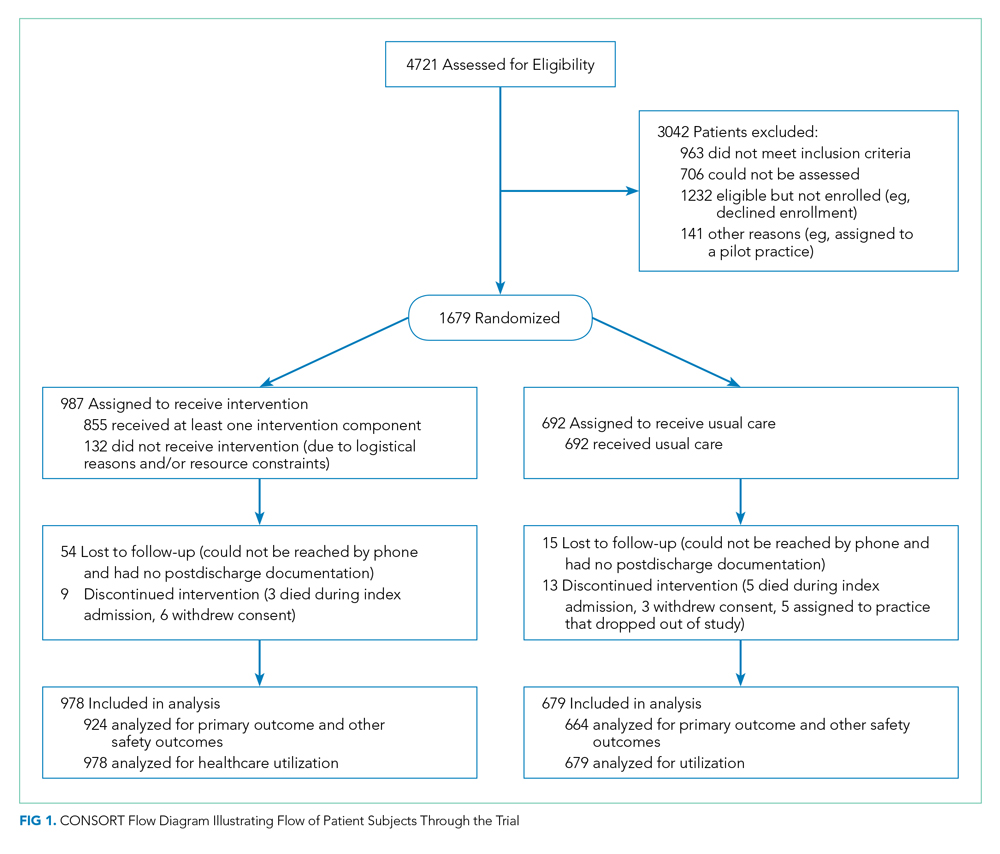
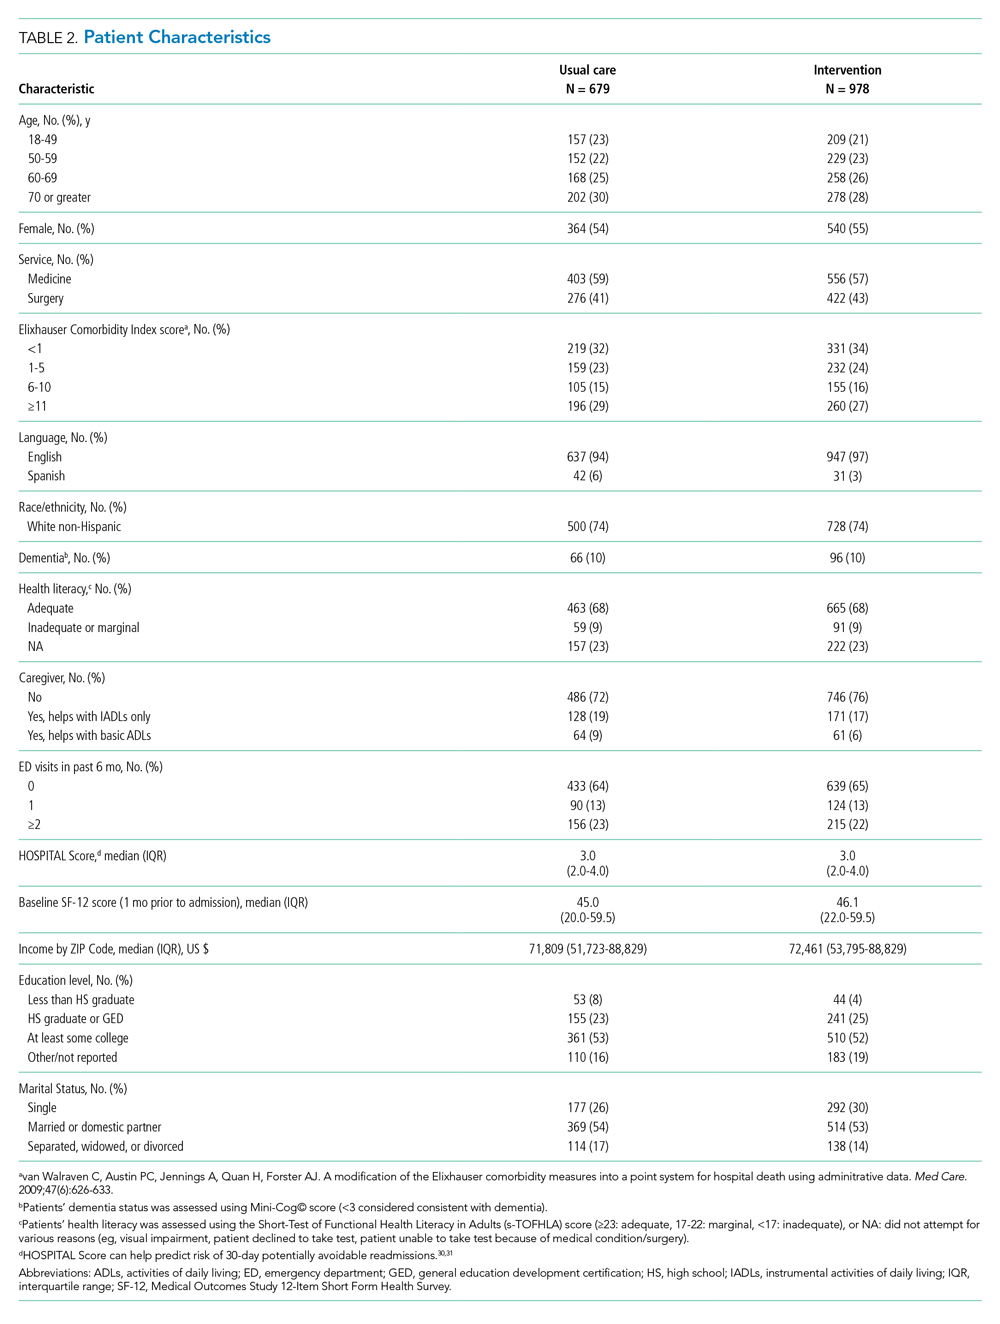
We enrolled 1,679 patients (Figure 1). Reasons for nonenrollment included being unable to complete the screen prior to discharge, not meeting inclusion criteria or meeting exclusion criteria, being assigned to a pilot practice, and declining informed written consent. The baseline characteristics of enrolled patients are presented in Table 2. Differences between the two study arms were small. About 47% of the cohort was not reachable by phone after five attempts for the 30-day phone call, but only 69 (4.1%) were truly lost to follow-up because they were unreachable by phone and had no documentation in the electronic medical record in the 30-days after discharge.
Intervention Fidelity
The majority of patients did not receive most intervention components, even those components that were supposed to be delivered to all intervention patients (Table 3). A minority of patients were referred to visiting nurse services and to the home pharmacy program. However, 855 patients (87%) in the intervention arm received at least one intervention component.

Outcome Measures
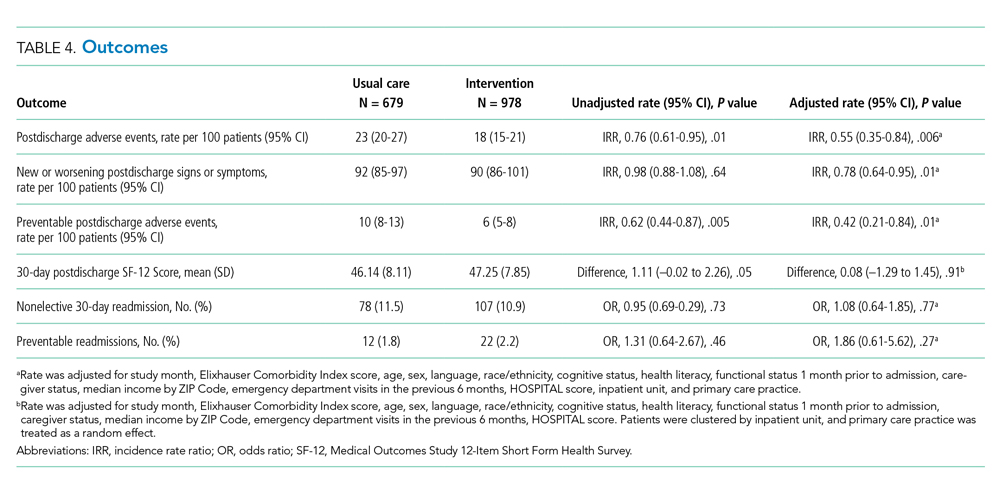
The intervention was associated with a statistically significant reduction in several of the outcomes of interest, including the primary outcome, number of postdischarge adverse events (45% reduction), and new or worsening postdischarge signs or symptoms (22% reduction), as well as preventable postdischarge adverse events (58% reduction) (Table 4). There was a nonsignificant difference in functional status. There was no significant effect on total nonelective or on preventable readmission rates. When analyzed by type of adverse event, the intervention was associated with a reduction in adverse drug events and in procedural complications (Table 2 of Appendix 1). Of note, there was no significant difference in the proportion of patients with at least one adverse event whether the outcome was determined by phone call and medical record review (49%) or medical record review alone (51%) (P = .48).
In subgroup analyses, there was no evidence of effect modification by service, hospital, patient age, readmission risk, health literacy, or comorbidity score (Table 3 of Appendix 1). Table 4 of Appendix 1 provides examples of postdischarge adverse events seen in the usual care arm that might have been prevented in the intervention.
DISCUSSION
This intervention was associated with a reduction in postdischarge adverse events. The relative improvement in each outcome aligned with the hypothesized sensitivity to change: the smallest improvement was seen in new or worsening signs or symptoms, followed by postdischarge adverse events and then by preventable postdischarge adverse events. The intervention was not associated with a difference in readmissions. The lack of effect on hospital readmissions may have been caused by the low proportion of readmissions that are preventable, as well as low intervention fidelity and lack of resources to implement facets such as postdischarge coaching, an evidence-based intervention that was never adopted.16,23 One lesson of this study is that it may be easier to reduce postdischarge injury (still an important outcome) than readmissions.
Putting this study in context, we should note that the literature on interventions to improve care transitions is mixed.18 While there are several reports of successful interventions, there are many reports of unsuccessful ones, often using similar components. Success is often the result of adequate resources and attention to myriad details regarding implementation.24 The intervention in our study likely contributed to improvements in patient and caregiver engagement in the hospital, enhancements of communication between inpatient and outpatient clinicians, and implementation of pharmacist-led interventions to improve medication safety. Regarding the latter, several prior studies have shown the benefits of pharmacist interventions in decreasing postdischarge adverse drug events.4,25,26 Therefore, even an intervention with incomplete intervention fidelity can reduce postdischarge adverse events, especially because adverse drug events make up the majority of adverse events.1,2,21
Perhaps the biggest lesson we learned was regarding the limitations of the hospital-led ACO model to incentivize sufficient up-front investments in transitional care interventions. By design, we chose a real-world approach in which interventions were integrated with existing ACO efforts, which were paid for internally by the institution. As a result, many of the interventions had to be scaled back because of resource constraints. The ACO model theoretically incentivizes more integrated care, but this may not always be true in practice. Emerging evidence suggests that physician group–led ACOs are associated with lower costs and use compared with hospital-led ACOs, likely because of more aligned incentives in physician group–led ACOs to reduce use of inpatient care.27,28
An unresolved question is whether the ideal implementation approach is to protect the time of existing clinical personnel to carry out transitional care tasks or to hire external personnel to do these tasks. We purposely spread the intervention over several clinician types to minimize the additional burden on any one of them, minimize additional costs, and play to each clinician’s expertise, but in retrospect, this may not have been the right approach. By providing additional personnel with dedicated time, interest, and training in care transitions, the intervention may be delivered with higher quantitative and qualitative fidelity, and it could create a single point of contact for patients, which was considered highly desirable by our PFAC.
This study has several limitations. A large proportion of patients (44%) were unavailable for postdischarge phone calls. However, we were able to perform medical record review for worsening signs (eg, lab abnormalities) and symptoms (as reported by patients’ providers) in the postdischarge period and adjudicate them for adverse events for all but 69 of these patients. Because all these patients had ACO-affiliated PCPs, we would expect most of their utilization to have been within the system and, therefore, to be present in the medical record. The proportion of patients with at least one adverse event did not vary by the method of follow-up, which suggests that this issue is an unlikely source of bias. Assessment of readmission was imperfect because we do not have statewide or national data. However, our combination of administrative data for Partners readmissions plus self-report for non-Partners readmission has been shown to be fairly complete in previous studies.29 Adjudicators could not be fully blinded to intervention status due to the lack of blinding of admission date. We did not calculate a kappa value for interrater reliability of individual assessments of adverse events; rather, coming to consensus among the two adjudicators was part of the process. In only a handful of cases was a third adjudicator required. Lastly, this study was conducted at two academic medical centers and their affiliated primary care clinics, which potentially limits generalizability; however, the results are likely generalizable to other ACOs that include major academic medical centers.
CONCLUSION
In conclusion, in this real-world clinical trial, we designed, implemented, and iteratively refined a multifaceted intervention to improve care transitions within a hospital-based academic ACO. Evolution of the intervention components was the result of stakeholder input, experience with the intervention, and ACO resource constraints. The intervention reduced postdischarge adverse events. However, across the ACO network, intervention fidelity was low, and this may have contributed to the lack of effect on readmission rates. ACOs that implement interventions without hiring new personnel or protecting the time of existing personnel to conduct transitional tasks are likely to face the same challenges of low fidelity.
Acknowledgments
The authors would like to acknowledge the many people who worked on designing, implementing, and evaluating this intervention, including but not limited to: Natasha Isaac, Hilary Heyison, Jacqueline Minahan, Molly O’Reilly, Michelle Potter, Nailah Khoory, Maureen Fagan, David Bates, Laura Carr, Joseph Frolkis, Eric Weil, Jacqueline Somerville, Stephanie Ahmed, Marcy Bergeron, Jessica Smith, and Jane Millett. We would also like to thank the members of our Patient-Family Advisory Council: Maureen Fagan, Karen Spikes, Margie Hodges, Win Hodges, Aureldon Henderson, Dena Salzberg, and Kay Bander.
1. Forster AJ, Clark HD, Menard A, et al. Adverse events among medical patients after discharge from hospital. CMAJ. 2004;170(3):345-349.
2. Forster AJ, Murff HJ, Peterson JF, Gandhi TK, Bates DW. The incidence and severity of adverse events affecting patients after discharge from the hospital. Ann Intern Med. 2003;138(3):161-167. https://doi.org/10.7326/0003-4819-138-3-200302040-00007
3. Coleman EA, Berenson RA. Lost in transition: challenges and opportunities for improving the quality of transitional care. Ann Intern Med. 2004;141(7):533-536. https://doi.org/10.7326/0003-4819-141-7-200410050-00009
4. Schnipper JL, Kirwin JL, Cotugno MC, et al. Role of pharmacist counseling in preventing adverse drug events after hospitalization. Arch Intern Med. 2006;166(5):565-571. https://doi.org/10.1001/archinte.166.5.565
5. Jencks SF, Williams MV, Coleman EA. Rehospitalizations among patients in the Medicare fee-for-service program. N Engl J Med. 2009;360(14):1418-1428. https://doi.org/10.1056/nejmsa0803563
6. Accountable Care Organizations (ACOs). Centers for Medicare & Medicaid Services. 2012. Updated February 11, 2020. Accessed July 15, 2012. https://www.cms.gov/Medicare/Medicare-Fee-for-Service-Payment/ACO/index.html?redirect=/ACO/
7. Bates DW, Bitton A. The future of health information technology in the patient-centered medical home. Health Aff (Millwood). 2010;29(4):614-621. https://doi.org/10.1377/hlthaff.2010.0007
8. Bitton A, Martin C, Landon BE. A nationwide survey of patient centered medical home demonstration projects. J Gen Intern Med. 2010;25(6):584-592. https://doi.org/10.1007/s11606-010-1262-8
9. Brown C, Lilford R. Evaluating service delivery interventions to enhance patient safety. BMJ. 2008;337:a2764. https://doi.org/10.1136/bmj.a2764
10. Ware J Jr, Kosinski M, Keller SD. A 12-Item Short-Form Health Survey: construction of scales and preliminary tests of reliability and validity. Med Care. 1996;34(3):220-233. https://doi.org/10.1097/00005650-199603000-00003
11. Burke RE, Kripalani S, Vasilevskis EE, Schnipper JL. Moving beyond readmission penalties: creating an ideal process to improve transitional care. J Hosp Med. 2013;8(2):102-109. https://doi.org/10.1002/jhm.1990
12. Naylor MD, Brooten D, Campbell R, et al. Comprehensive discharge planning and home follow-up of hospitalized elders: a randomized clinical trial. JAMA. 1999;281(7):613-620. https://doi.org/10.1001/jama.281.7.613
13. Gandara E, Ungar J, Lee J, Chan-Macrae M, O’Malley T, Schnipper JL. Discharge documentation of patients discharged to subacute facilities: a three-year quality improvement process across an integrated health care system. Jt Comm J Qual Patient Saf. 2010;36(6):243-251. https://doi.org/10.1016/s1553-7250(10)36039-9
14. Pippins JR, Gandhi TK, Hamann C, et al. Classifying and predicting errors of inpatient medication reconciliation. J Gen Intern Med. 2008;23(9):1414-1422. https://doi.org/10.1007/s11606-008-0687-9
15. Schnipper JL, Hamann C, Ndumele CD, et al. Effect of an electronic medication reconciliation application and process redesign on potential adverse drug events: a cluster-randomized trial. Arch Intern Med. 2009;169(8):771-780. https://doi.org/10.1001/archinternmed.2009.51
16. Coleman EA, Parry C, Chalmers S, Min SJ. The care transitions intervention: results of a randomized controlled trial. Arch Intern Med. 2006;166(17):1822-1828. https://doi.org/10.1001/archinte.166.17.1822
17. Jack BW, Chetty VK, Anthony D, et al. A reengineered hospital discharge program to decrease rehospitalization: a randomized trial. Ann Intern Med. 2009;150(3):178-187. https://doi.org/10.7326/0003-4819-150-3-200902030-00007
18. Hansen LO, Young RS, Hinami K, Leung A, Williams MV. Interventions to reduce 30-day rehospitalization: a systematic review. Ann Intern Med. 2011;155(8):520-528. https://doi.org/10.7326/0003-4819-155-8-201110180-00008
19. Schnipper J, Levine C. The important thing to do before leaving the hospital: many patients and families forget, which can lead to complications later. Next Avenue. October 22, 2019. Accessed September 10, 2020. https://www.nextavenue.org/before-leaving-hospital/
20. PCORI Methodology Standards: Standards for Studies of Complex Interventions. Patient-Centered Outcomes Research Institute; November 12, 2015. Updated: February 26, 2019. Accessed June 3, 2019. https://www.pcori.org/research-results/about-our-research/research-methodology/pcori-methodology-standards#Complex
21. Tsilimingras D, Schnipper J, Duke A, et al. Post-discharge adverse events among urban and rural patients of an urban community hospital: a prospective cohort study. J Gen Intern Med. 2015;30(8):1164-1171. https://doi.org/10.1007/s11606-015-3260-3
22. Kripalani S, Roumie CL, Dalal AK, et al. Effect of a pharmacist intervention on clinically important medication errors after hospital discharge: a randomized trial. Ann Intern Med. 2012;157(1):1-10. https://doi.org/10.7326/0003-4819-157-1-201207030-00003
23. Auerbach AD, Kripalani S, Vasilevskis EE, et al. Preventability and causes of readmissions in a national cohort of general medicine patients. JAMA Intern Med. 2016;176(4):484-493. https://doi.org/10.1001/jamainternmed.2015.7863
24. Vasilevskis EE, Kripalani S, Ong MK, et al. Variability in implementation of interventions aimed at reducing readmissions among patients with heart failure: a survey of teaching hospitals. Acad Med. 2016;91(4):522-529. https://doi.org/10.1097/acm.0000000000000994
25. Gardella JE, Cardwell TB, Nnadi M. Improving medication safety with accurate preadmission medication lists and postdischarge education. Jt Comm J Qual Patient Saf. 2012;38(10):452-458. https://doi.org/10.1016/s1553-7250(12)38060-4
26. Kaboli PJ, Hoth AB, McClimon BJ, Schnipper JL. Clinical pharmacists and inpatient medical care: a systematic review. Arch Intern Med. 2006;166(9):955-964. https://doi.org/10.1001/archinte.166.9.955
27. McWilliams JM, Hatfield LA, Chernew ME, Landon BE, Schwartz AL. Early performance of accountable care organizations in Medicare. N Engl J Med. 2016;374(24):2357-2366. https://doi.org/10.1056/nejmsa1600142
28. McWilliams JM, Hatfield LA, Landon BE, Hamed P, Chernew ME. Medicare spending after 3 years of the Medicare Shared Savings Program. N Engl J Med. 2018;379(12):1139-1149. https://doi.org/10.1056/nejmsa1803388
29. Hasan O, Meltzer DO, Shaykevich SA, et al. Hospital readmission in general medicine patients: a prediction model. J Gen Intern Med. 2010;25(3):211-219. https://doi.org/10.1007/s11606-009-1196-1
30. Donzé JD, Aujesky D, Williams D, Schnipper JL. Potentially avoidable 30-day hospital readmissions in medical patients: derivation and validation of a prediction model. JAMA Intern Med. 2013;173(8):632-638. https://doi.org/10.001/jamainternmed.2013.3023
31. Donzé JD, Williams MV, Robinson EJ, et al. International validity of the HOSPITAL score to predict 30-day potentially avoidable hospital readmissions. JAMA Intern Med. 2016;176(4):496-502. https://doi.org/10.1001/jamainternmed.2015.8462
Transitions from the hospital to the ambulatory setting are high-risk periods for patients in terms of adverse events, poor clinical outcomes, and readmission. Processes of care during care transitions are suboptimal, including poor communication among inpatient providers, patients, and ambulatory providers1,2; suboptimal communication of postdischarge plans of care to patients and their ability to carry out these plans3; medication discrepancies and nonadherence after discharge4; and lack of timely follow-up with ambulatory providers.5 Healthcare organizations continue to struggle with the question of which interventions to implement and how best to implement them.
Interventions to improve care transitions typically focus on readmission rates, but some studies have focused on postdischarge adverse events, defined as injuries in the 30 days after discharge caused by medical management rather than underlying disease processes.2 These adverse events cause psychological distress, out-of-pocket expenses, decreases in functional status, and caregiver burden. An estimated 20% of hospitalized patients suffer a postdischarge adverse event.1,2 Approximately two-thirds of these may be preventable or ameliorable.
The advent of Accountable Care Organizations (ACOs), defined as “groups of doctors, hospitals, and other health care providers who come together voluntarily to give coordinated high quality care to their patients,” creates an opportunity for improvements in patient safety during care transitions.6 Another opportunity has been the advent of Patient-Centered Medical Homes (PCMH), consisting of patient-oriented, comprehensive, team-based primary care enhanced by health information technology and population-based disease management tools.7,8 In theory, a hospital-PCMH collaboration within an ACO can improve transitional interventions since optimal communication and collaboration are more likely when both inpatient and primary care providers (PCPs) share infrastructure and are similarly incentivized. The objectives of this study were to design and implement a collaborative hospital-PCMH care transitions intervention within an ACO and evaluate its effects.
METHODS
This study was a two-arm, single-blind (blinded outcomes assessor), stepped-wedge, multisite cluster-randomized clinical trial (NCT02130570) approved by the institutional review board of Partners HealthCare.
Study Design and Randomization
The study employed a “stepped-wedge” design, which is a cluster-randomized study design in which an intervention is sequentially rolled out to different groups at different, prespecified, randomly determined times.9 Each cluster (in this case, each primary care practice) served as its own control, while still allowing for adjustment for temporal trends. Originally, 18 practices participated, but one withdrew due to the low number of patients enrolled in the study, leaving 17 clusters and 16 sequences; see Figure 1 of Appendix 1 for a full description of the sample size and timeline for each cluster. Practices were not aware of this timeline until after recruitment.
Study Setting and Participants
Conducted within a large Pioneer ACO in Boston and funded by the Patient-Centered Outcomes Research Institute (PCORI), the Partners-PCORI Transitions Study was designed as a “real-world” quality improvement project. Potential participants were adult patients who were admitted to medical and surgical services of two large academic hospitals (Hospital A and Hospital B) affiliated with an ACO, who were likely to be discharged back to the community, and whose PCP belonged to a primary care practice that was affiliated with the ACO, agreed to participate, and were designated PCMHs or on their way to being designated by meeting certain criteria: electronic health record, patient portal, team-based care, practice redesign, care management, and identification of high-risk patients. See Study Protocol (Appendix 2) for detailed patient and primary care practice inclusion criteria.
Patient Enrollment
Study staff screened participants from a daily automated list of patients admitted the day before, using medical records to determine eligibility, which was then confirmed by the patient’s nurse. Exclusion criteria included likely discharge to a location other than home, being in police custody, lack of a telephone, being homeless, previous enrollment in the study, and being unable to communicate in English or Spanish. Allocation to study arm was concealed until the patient or proxy provided informed written consent. The research assistant administered questionnaires to all study subjects to assess potential confounders and functional status 1 month prior to admission (
Intervention
The intervention was based on a conceptual model of an ideal discharge11 that we developed based on work by Naylor et al,12 work by Coleman and Berenson,3 best practices in medication reconciliation and information transfer according to our own research,13-15 the best examples of interventions to improve the discharge process,12,16,17 and a systematic review of discharge interventions.18 Some of the factors necessary for an ideal care transition include complete, organized, and timely documentation of the patient’s hospital course and postdischarge plan; effective discharge planning; coordination of care among the patient’s providers; methods to ensure medication safety; advanced care planning in appropriate patients; and education and “coaching” of patients and their caregivers so they learn how to manage their conditions. The final multifaceted intervention addressed each component of the ideal discharge and included inpatient and outpatient components (Table 1 and Table 1 of Appendix 1).
Patient and Public Involvement in Research
As with all PCORI-funded studies, this study involved a patient-family advisory council (PFAC). Our PFAC included six recently hospitalized patients or caregivers of recently hospitalized patients. The PFAC participated in monthly meetings throughout the study period. They helped inform the research questions, including confirmation that the endpoints were patient centered, and provided valuable input for the design of the intervention and the patient-facing components of the data collection instruments. They also interviewed several patient participants in the study regarding their experiences with the intervention. Lastly, they helped develop plans for dissemination of study results to the public.19
We also formed a steering committee consisting of physician, nursing, pharmacy, information technology, and administrative leadership representing primary care, inpatient care, and transitional care at both hospitals and Partners Healthcare. PFAC members took turns participating in quarterly steering committee meetings.
Evolution of the Intervention and Implementation
The intervention was iteratively refined during the course of the study in response to input from the PFAC, steering committee, and members of the intervention team; cases of adverse events and readmissions from patients despite being in the intervention arm; exit interviews of patients who had recently completed the intervention; and informal feedback from inpatient and outpatient clinicians. For example, we learned that the more complicated a patient’s conditions are, the sooner the clinical team wanted them to be seen after discharge. However, these patients were also less likely to feel well enough to keep that appointment. Therefore, the timing of follow-up of appointments needed to be a negotiation among the inpatient team, the patient, any caregivers, and the outpatient provider. PFAC members also emphasized that patients wanted one person to trust and to be the “point person” during a complicated transition such as hospital discharge.
At the same time, the intervention components evolved because of factors outside our control (eg, resource limitations). In keeping with the real-world nature of the research, the aim was for the intervention to be internally supported because incentives were theoretically more aligned with improvement of care transitions under the ACO model. By design, the PCORI contract only paid for limited parts of the intervention, such as a nurse practitioner to act as the discharge advocate at one hospital, overtime costs of inpatient pharmacists, and project manager time to facilitate inpatient-outpatient provider communication. (See Table 1 of Appendix 1 for details about the modifications to the intervention.)
Lastly, in keeping with PCORI’s methodology standards for studies of complex interventions,20 we strove to standardize the intervention by function across hospitals, units, and practices, while still allowing for local adaptation in the form. In other words, rather than specifying exactly how a task (eg, medication counseling) needed to be performed, the study design offered sites flexibility in how they implemented the task given their available personnel and institutional culture.
Intervention Fidelity
To determine the extent to which each patient in the intervention arm received each intervention component, a project manager unblinded to treatment arm reviewed the electronic medical record for documentation of each component implemented by providers (eg, inpatient pharmacists, outpatient nurses). Because each intervention component produced documentation, this provided an accurate assessment of intervention fidelity, ie, the extent to which the intervention was implemented as intended.
Outcome Assessment
Postdischarge Follow-up
Based on previous studies,2,21 a trained research assistant attempted to contact all study subjects 30 days (±5 days) after discharge and administered a questionnaire to identify any new or worsening symptoms since discharge, any healthcare use since discharge, and functional status in the previous week. Follow-up questions used branching logic to determine the relationship of any new or worsening symptoms to medications or other aspects of medical management. Research assistants followed up any positive responses with directed medical record review for objective findings, diagnoses, treatments, and responses. If patients could not be reached after five attempts, the research assistant instead conducted a thorough review of the outpatient medical record alone for provider reports of any new or worsening symptoms noted during follow-up within the 30-day postdischarge period. Research assistants also reviewed laboratory test results in all patients for evidence of postdischarge renal failure, elevated liver function tests, or new/worsening anemia.
Hospital Readmissions
We measured nonelective hospital readmissions within 30 days of discharge using a combination of administrative data for hospitalizations within the ACO network plus patient report during the 30-day phone call for all other readmissions.22
Adjudication of Outcomes
Adverse events and preventable adverse events: All cases of new or worsening symptoms or signs, along with all supporting documentation, were then presented to teams of two trained blinded physician adjudicators through application of methods established in previous studies.4,21 Each of the two adjudicators independently reviewed the information, along with the medical record, and completed a standardized form to confirm or deny the presence of any adverse events (ie, patient injury due to medical management) and to classify the type of event (eg, adverse drug event, hospital-acquired infection, procedural complication, diagnostic or management error), the severity and duration of the event, and whether the event was preventable or ameliorable. The two adjudicators then met to resolve any differences in their findings and come to consensus.
Preventable readmissions: If patients were readmitted to either study hospital, we conducted an evaluation, based on previous studies,23 to determine if and how the readmission could have been prevented including (a) a standardized patient and caregiver interview to identify possible problems with the transitions process and (b) an email questionnaire to the patient’s PCP and the inpatient teams who cared for the patient during the index admission and readmission regarding possible deficiencies with the transitions process. As with adverse event adjudications, two physician adjudicators worked independently to classify the preventability of the readmission and then met to come to consensus. Conflicts were resolved by a third adjudicator.
Analysis Plan
To evaluate the effects of the intervention on the primary outcome, the number of postdischarge adverse events per patient, we used multivariable Poisson regression, with study arm as the main predictor. A similar approach was used to evaluate the number of new or worsening postdischarge signs or symptoms and the number of preventable adverse events per patient. We used an intention-to-treat analysis: If a practice did not start the intervention when they were scheduled to, based on our randomization, we counted all patients in that practice admitted after that point as intervention patients. We adjusted for patient demographics, clinical characteristics, month, inpatient unit, and primary care practice as fixed effects. We clustered by PCP using general linear models. Intervention effects were expressed as both unadjusted and adjusted incidence rate ratios (IRRs). We also conducted a limited number of subgroup analyses, determined a priori, to determine whether the intervention was more effective in certain patient populations; we used interaction terms (intervention × subgroup) to determine the statistical significance of any effect modification.
To evaluate the effects of the intervention on nonelective readmissions and preventable readmissions, we used a similar approach, using multivariable logistic regression. Postdischarge functional status, adjusted for status prior to admission, was analyzed using multivariable linear regression and random effects by primary care practice. The general linear mixed model (GLIMMIX) procedure in the SAS 9.3 statistical package (SAS Institute) was used to carry out all analyses.
Power and Sample Size
We assumed a baseline rate of postdischarge adverse events of 0.30 per patient.21 We conservatively assumed an effect size of a change from 0.30 in the control group to 0.23 in the intervention group (a relative reduction of 22%, which was based on studies of preventability rates23 and close to the minimum clinically important difference). Based on prior studies,4,22 we assumed an intraclass correlation coefficient of 0.01 with an average cluster size of seven patients per PCP. Assuming a 10% loss to follow-up rate and an alpha of 0.05, we targeted a sample size of 1,800 patients to achieve 80% power, with one-third of the patients in the usual care arm and two-thirds in the intervention arm.
RESULTS
We enrolled 18 PCMH primary care practices to participate in the study, including 8 from Hospital A (out of 13 approached), 8 from Hospital B (out of 11), and 2 from other ACO practices (out of 9) (plus two pilot practices). Reasons for not participating included not having dedicated personnel to play the role of the responsible outpatient clinician, undergoing recent turn-over in practice leadership, and not having enough patients admitted to the two hospitals. One practice only enrolled 5 patients in the study and withdrew from participation, which left 17 practices.
Study Patients
We enrolled 1,679 patients (Figure 1). Reasons for nonenrollment included being unable to complete the screen prior to discharge, not meeting inclusion criteria or meeting exclusion criteria, being assigned to a pilot practice, and declining informed written consent. The baseline characteristics of enrolled patients are presented in Table 2. Differences between the two study arms were small. About 47% of the cohort was not reachable by phone after five attempts for the 30-day phone call, but only 69 (4.1%) were truly lost to follow-up because they were unreachable by phone and had no documentation in the electronic medical record in the 30-days after discharge.
Intervention Fidelity
The majority of patients did not receive most intervention components, even those components that were supposed to be delivered to all intervention patients (Table 3). A minority of patients were referred to visiting nurse services and to the home pharmacy program. However, 855 patients (87%) in the intervention arm received at least one intervention component.
Outcome Measures
The intervention was associated with a statistically significant reduction in several of the outcomes of interest, including the primary outcome, number of postdischarge adverse events (45% reduction), and new or worsening postdischarge signs or symptoms (22% reduction), as well as preventable postdischarge adverse events (58% reduction) (Table 4). There was a nonsignificant difference in functional status. There was no significant effect on total nonelective or on preventable readmission rates. When analyzed by type of adverse event, the intervention was associated with a reduction in adverse drug events and in procedural complications (Table 2 of Appendix 1). Of note, there was no significant difference in the proportion of patients with at least one adverse event whether the outcome was determined by phone call and medical record review (49%) or medical record review alone (51%) (P = .48).
In subgroup analyses, there was no evidence of effect modification by service, hospital, patient age, readmission risk, health literacy, or comorbidity score (Table 3 of Appendix 1). Table 4 of Appendix 1 provides examples of postdischarge adverse events seen in the usual care arm that might have been prevented in the intervention.
DISCUSSION
This intervention was associated with a reduction in postdischarge adverse events. The relative improvement in each outcome aligned with the hypothesized sensitivity to change: the smallest improvement was seen in new or worsening signs or symptoms, followed by postdischarge adverse events and then by preventable postdischarge adverse events. The intervention was not associated with a difference in readmissions. The lack of effect on hospital readmissions may have been caused by the low proportion of readmissions that are preventable, as well as low intervention fidelity and lack of resources to implement facets such as postdischarge coaching, an evidence-based intervention that was never adopted.16,23 One lesson of this study is that it may be easier to reduce postdischarge injury (still an important outcome) than readmissions.
Putting this study in context, we should note that the literature on interventions to improve care transitions is mixed.18 While there are several reports of successful interventions, there are many reports of unsuccessful ones, often using similar components. Success is often the result of adequate resources and attention to myriad details regarding implementation.24 The intervention in our study likely contributed to improvements in patient and caregiver engagement in the hospital, enhancements of communication between inpatient and outpatient clinicians, and implementation of pharmacist-led interventions to improve medication safety. Regarding the latter, several prior studies have shown the benefits of pharmacist interventions in decreasing postdischarge adverse drug events.4,25,26 Therefore, even an intervention with incomplete intervention fidelity can reduce postdischarge adverse events, especially because adverse drug events make up the majority of adverse events.1,2,21
Perhaps the biggest lesson we learned was regarding the limitations of the hospital-led ACO model to incentivize sufficient up-front investments in transitional care interventions. By design, we chose a real-world approach in which interventions were integrated with existing ACO efforts, which were paid for internally by the institution. As a result, many of the interventions had to be scaled back because of resource constraints. The ACO model theoretically incentivizes more integrated care, but this may not always be true in practice. Emerging evidence suggests that physician group–led ACOs are associated with lower costs and use compared with hospital-led ACOs, likely because of more aligned incentives in physician group–led ACOs to reduce use of inpatient care.27,28
An unresolved question is whether the ideal implementation approach is to protect the time of existing clinical personnel to carry out transitional care tasks or to hire external personnel to do these tasks. We purposely spread the intervention over several clinician types to minimize the additional burden on any one of them, minimize additional costs, and play to each clinician’s expertise, but in retrospect, this may not have been the right approach. By providing additional personnel with dedicated time, interest, and training in care transitions, the intervention may be delivered with higher quantitative and qualitative fidelity, and it could create a single point of contact for patients, which was considered highly desirable by our PFAC.
This study has several limitations. A large proportion of patients (44%) were unavailable for postdischarge phone calls. However, we were able to perform medical record review for worsening signs (eg, lab abnormalities) and symptoms (as reported by patients’ providers) in the postdischarge period and adjudicate them for adverse events for all but 69 of these patients. Because all these patients had ACO-affiliated PCPs, we would expect most of their utilization to have been within the system and, therefore, to be present in the medical record. The proportion of patients with at least one adverse event did not vary by the method of follow-up, which suggests that this issue is an unlikely source of bias. Assessment of readmission was imperfect because we do not have statewide or national data. However, our combination of administrative data for Partners readmissions plus self-report for non-Partners readmission has been shown to be fairly complete in previous studies.29 Adjudicators could not be fully blinded to intervention status due to the lack of blinding of admission date. We did not calculate a kappa value for interrater reliability of individual assessments of adverse events; rather, coming to consensus among the two adjudicators was part of the process. In only a handful of cases was a third adjudicator required. Lastly, this study was conducted at two academic medical centers and their affiliated primary care clinics, which potentially limits generalizability; however, the results are likely generalizable to other ACOs that include major academic medical centers.
CONCLUSION
In conclusion, in this real-world clinical trial, we designed, implemented, and iteratively refined a multifaceted intervention to improve care transitions within a hospital-based academic ACO. Evolution of the intervention components was the result of stakeholder input, experience with the intervention, and ACO resource constraints. The intervention reduced postdischarge adverse events. However, across the ACO network, intervention fidelity was low, and this may have contributed to the lack of effect on readmission rates. ACOs that implement interventions without hiring new personnel or protecting the time of existing personnel to conduct transitional tasks are likely to face the same challenges of low fidelity.
Acknowledgments
The authors would like to acknowledge the many people who worked on designing, implementing, and evaluating this intervention, including but not limited to: Natasha Isaac, Hilary Heyison, Jacqueline Minahan, Molly O’Reilly, Michelle Potter, Nailah Khoory, Maureen Fagan, David Bates, Laura Carr, Joseph Frolkis, Eric Weil, Jacqueline Somerville, Stephanie Ahmed, Marcy Bergeron, Jessica Smith, and Jane Millett. We would also like to thank the members of our Patient-Family Advisory Council: Maureen Fagan, Karen Spikes, Margie Hodges, Win Hodges, Aureldon Henderson, Dena Salzberg, and Kay Bander.
1. Forster AJ, Clark HD, Menard A, et al. Adverse events among medical patients after discharge from hospital. CMAJ. 2004;170(3):345-349.
2. Forster AJ, Murff HJ, Peterson JF, Gandhi TK, Bates DW. The incidence and severity of adverse events affecting patients after discharge from the hospital. Ann Intern Med. 2003;138(3):161-167. https://doi.org/10.7326/0003-4819-138-3-200302040-00007
3. Coleman EA, Berenson RA. Lost in transition: challenges and opportunities for improving the quality of transitional care. Ann Intern Med. 2004;141(7):533-536. https://doi.org/10.7326/0003-4819-141-7-200410050-00009
4. Schnipper JL, Kirwin JL, Cotugno MC, et al. Role of pharmacist counseling in preventing adverse drug events after hospitalization. Arch Intern Med. 2006;166(5):565-571. https://doi.org/10.1001/archinte.166.5.565
5. Jencks SF, Williams MV, Coleman EA. Rehospitalizations among patients in the Medicare fee-for-service program. N Engl J Med. 2009;360(14):1418-1428. https://doi.org/10.1056/nejmsa0803563
6. Accountable Care Organizations (ACOs). Centers for Medicare & Medicaid Services. 2012. Updated February 11, 2020. Accessed July 15, 2012. https://www.cms.gov/Medicare/Medicare-Fee-for-Service-Payment/ACO/index.html?redirect=/ACO/
7. Bates DW, Bitton A. The future of health information technology in the patient-centered medical home. Health Aff (Millwood). 2010;29(4):614-621. https://doi.org/10.1377/hlthaff.2010.0007
8. Bitton A, Martin C, Landon BE. A nationwide survey of patient centered medical home demonstration projects. J Gen Intern Med. 2010;25(6):584-592. https://doi.org/10.1007/s11606-010-1262-8
9. Brown C, Lilford R. Evaluating service delivery interventions to enhance patient safety. BMJ. 2008;337:a2764. https://doi.org/10.1136/bmj.a2764
10. Ware J Jr, Kosinski M, Keller SD. A 12-Item Short-Form Health Survey: construction of scales and preliminary tests of reliability and validity. Med Care. 1996;34(3):220-233. https://doi.org/10.1097/00005650-199603000-00003
11. Burke RE, Kripalani S, Vasilevskis EE, Schnipper JL. Moving beyond readmission penalties: creating an ideal process to improve transitional care. J Hosp Med. 2013;8(2):102-109. https://doi.org/10.1002/jhm.1990
12. Naylor MD, Brooten D, Campbell R, et al. Comprehensive discharge planning and home follow-up of hospitalized elders: a randomized clinical trial. JAMA. 1999;281(7):613-620. https://doi.org/10.1001/jama.281.7.613
13. Gandara E, Ungar J, Lee J, Chan-Macrae M, O’Malley T, Schnipper JL. Discharge documentation of patients discharged to subacute facilities: a three-year quality improvement process across an integrated health care system. Jt Comm J Qual Patient Saf. 2010;36(6):243-251. https://doi.org/10.1016/s1553-7250(10)36039-9
14. Pippins JR, Gandhi TK, Hamann C, et al. Classifying and predicting errors of inpatient medication reconciliation. J Gen Intern Med. 2008;23(9):1414-1422. https://doi.org/10.1007/s11606-008-0687-9
15. Schnipper JL, Hamann C, Ndumele CD, et al. Effect of an electronic medication reconciliation application and process redesign on potential adverse drug events: a cluster-randomized trial. Arch Intern Med. 2009;169(8):771-780. https://doi.org/10.1001/archinternmed.2009.51
16. Coleman EA, Parry C, Chalmers S, Min SJ. The care transitions intervention: results of a randomized controlled trial. Arch Intern Med. 2006;166(17):1822-1828. https://doi.org/10.1001/archinte.166.17.1822
17. Jack BW, Chetty VK, Anthony D, et al. A reengineered hospital discharge program to decrease rehospitalization: a randomized trial. Ann Intern Med. 2009;150(3):178-187. https://doi.org/10.7326/0003-4819-150-3-200902030-00007
18. Hansen LO, Young RS, Hinami K, Leung A, Williams MV. Interventions to reduce 30-day rehospitalization: a systematic review. Ann Intern Med. 2011;155(8):520-528. https://doi.org/10.7326/0003-4819-155-8-201110180-00008
19. Schnipper J, Levine C. The important thing to do before leaving the hospital: many patients and families forget, which can lead to complications later. Next Avenue. October 22, 2019. Accessed September 10, 2020. https://www.nextavenue.org/before-leaving-hospital/
20. PCORI Methodology Standards: Standards for Studies of Complex Interventions. Patient-Centered Outcomes Research Institute; November 12, 2015. Updated: February 26, 2019. Accessed June 3, 2019. https://www.pcori.org/research-results/about-our-research/research-methodology/pcori-methodology-standards#Complex
21. Tsilimingras D, Schnipper J, Duke A, et al. Post-discharge adverse events among urban and rural patients of an urban community hospital: a prospective cohort study. J Gen Intern Med. 2015;30(8):1164-1171. https://doi.org/10.1007/s11606-015-3260-3
22. Kripalani S, Roumie CL, Dalal AK, et al. Effect of a pharmacist intervention on clinically important medication errors after hospital discharge: a randomized trial. Ann Intern Med. 2012;157(1):1-10. https://doi.org/10.7326/0003-4819-157-1-201207030-00003
23. Auerbach AD, Kripalani S, Vasilevskis EE, et al. Preventability and causes of readmissions in a national cohort of general medicine patients. JAMA Intern Med. 2016;176(4):484-493. https://doi.org/10.1001/jamainternmed.2015.7863
24. Vasilevskis EE, Kripalani S, Ong MK, et al. Variability in implementation of interventions aimed at reducing readmissions among patients with heart failure: a survey of teaching hospitals. Acad Med. 2016;91(4):522-529. https://doi.org/10.1097/acm.0000000000000994
25. Gardella JE, Cardwell TB, Nnadi M. Improving medication safety with accurate preadmission medication lists and postdischarge education. Jt Comm J Qual Patient Saf. 2012;38(10):452-458. https://doi.org/10.1016/s1553-7250(12)38060-4
26. Kaboli PJ, Hoth AB, McClimon BJ, Schnipper JL. Clinical pharmacists and inpatient medical care: a systematic review. Arch Intern Med. 2006;166(9):955-964. https://doi.org/10.1001/archinte.166.9.955
27. McWilliams JM, Hatfield LA, Chernew ME, Landon BE, Schwartz AL. Early performance of accountable care organizations in Medicare. N Engl J Med. 2016;374(24):2357-2366. https://doi.org/10.1056/nejmsa1600142
28. McWilliams JM, Hatfield LA, Landon BE, Hamed P, Chernew ME. Medicare spending after 3 years of the Medicare Shared Savings Program. N Engl J Med. 2018;379(12):1139-1149. https://doi.org/10.1056/nejmsa1803388
29. Hasan O, Meltzer DO, Shaykevich SA, et al. Hospital readmission in general medicine patients: a prediction model. J Gen Intern Med. 2010;25(3):211-219. https://doi.org/10.1007/s11606-009-1196-1
30. Donzé JD, Aujesky D, Williams D, Schnipper JL. Potentially avoidable 30-day hospital readmissions in medical patients: derivation and validation of a prediction model. JAMA Intern Med. 2013;173(8):632-638. https://doi.org/10.001/jamainternmed.2013.3023
31. Donzé JD, Williams MV, Robinson EJ, et al. International validity of the HOSPITAL score to predict 30-day potentially avoidable hospital readmissions. JAMA Intern Med. 2016;176(4):496-502. https://doi.org/10.1001/jamainternmed.2015.8462
The Effects of a Multifaceted Intervention to Improve Care Transitions Within an Accountable Care Organization: Results of a Stepped-Wedge Cluster-Randomized Trial
This work is licensed under a Creative Commons Attribution 4.0 International License
The Effects of a Multifaceted Intervention to Improve Care Transitions Within an Accountable Care Organization: Results of a Stepped-Wedge Cluster-Randomized Trial
This work is licensed under a Creative Commons Attribution 4.0 International License
© 2021 Society of Hospital Medicine
Email: lsamal@bwh.harvard.edu; Telephone: 617-732-7812; Twitter: @LipikaSamalMD; @drjschnip.
Vendor CPOE for Renal Impairment
Hospitalized patients with renal impairment are vulnerable to adverse drug events (ADEs).[1, 2] Appropriate prescribing for patients with renal insufficiency is challenging because of the complexities of drug therapy within the wide spectrum of kidney disease.[3, 4, 5, 6] Accordingly, computerized physician order entry (CPOE) systems with clinical decision support may help prevent many ADEs by providing timely laboratory information, recommending renally adjusted doses, and by offering assistance with prescribing.[7, 8, 9]
Despite the proposed benefits of CPOE, outcomes vary greatly because of differences in technology.[10, 11, 12, 13] In particular, the type of decision support available to assist medication ordering in the setting of renal disease varies widely among current vendor systems. Given the uncertain benefits of CPOE, especially with the wide range of associated clinical decision support, we conducted this study to determine the impact of these systems on the rates of ADEs among hospitalized patients with kidney disease.
METHODS
This study was approved by the institutional review boards at each study site.
Design and Setting
We conducted a before‐and‐after study to evaluate the impact of newly implemented vendor CPOE systems in 5 community hospitals in Massachusetts. Although we reported on 6 hospitals in our baseline study,[14] 1 of these hospitals later chose not to implement CPOE, and therefore was not included in follow‐up. At the time of this study, 1 of the hospitals (site 3) had not yet achieved hospital‐wide implementation. Although CPOE had been adopted by most medical services at site 3, it had not yet been implemented in the emergency, obstetrical, or surgical departments. Thus, we limited our study to the medical services at this site. For the remaining sites, all admitting services were included with the exception of the psychiatric and neonatal services, which were excluded from both phases because they would have required different detection tools.
Participants
Patients aged 18 years with renal failure, exposed to potentially nephrotoxic and/or renally cleared medications, and admitted to any of the participating hospitals during the study period were eligible for inclusion. Of the patients meeting eligibility criteria, we randomly selected approximately 150 records per hospital in the preimplementation and postimplementation phases for a total sample of 1590 charts. The first phase of this study occurred from January 2005 to August 2006; the second phase began 6 months postimplementation and lasted from October 2008 to September 2010.
Principal Exposure
Each hospital independently selected a vendor CPOE system with variable clinical decision support capabilities: (1) sites 4 and 5 had basic CPOE only with no clinical decision support for renal disease; (2) sites 1 and 2 implemented rudimentary clinical decision support with laboratory display (eg, serum creatinine) whenever common renally related drugs were ordered; and (3) site 3 had the most advanced support in place where, in addition to basic order entry and lab checks, physicians were provided with suggested doses for renally cleared and/or nephrotoxic medications, as well as appropriate drug monitoring for medications with narrow therapeutic indices (eg, suggested dosages and frequencies for vancomycin and automated corollary laboratory monitoring).
Definitions
We screened for the presence of renal failure by a serum creatinine 1.5 mg/dL at the time of admission. However, the duration of renal impairment was not known. We defined 3 levels of renal insufficiency based on the calculated creatinine clearance (CrCl)15: mild (CrCl 5080 mL/min), moderate (1649 mL/min), and severe (15 mL/min). Subjects with a CrCl >80 mL/min were considered to have normal renal function and were excluded. Potentially nephrotoxic and/or renally cleared medications were then identified using an established knowledge base (see Supporting Information, Table 1, in the online version of this article).[16]
| Hospital Site | |||||||
|---|---|---|---|---|---|---|---|
| Baseline Characteristics | All Sites | 1 | 2 | 3 | 4 | 5 | P (Among All Sites)* |
| |||||||
| No. of patients | 815 | 170 | 156 | 143 | 164 | 182 | |
| Age, y, mean (range) | 72.2 (18.0102.0) | 79.2 (33102) | 77.3 (23101) | 65.6 (1898) | 70.7 (1896) | 69.2 (2096) | <0.01 |
| 1844 years, no. (%) | 68 (9.1) | 1 (0.67) | 8 (6.5) | 20 (14.9) | 15 (9.4) | 24 (13.4) | <0.01 |
| 4554 years, no. (%) | 67 (9.0) | 6 (4.0) | 5 (4.1) | 17 (12.7) | 16 (10.0) | 23 (12.9) | |
| 5564 years, no. (%) | 79 (10.6) | 15 (10.0) | 12 (9.8) | 23 (17.2) | 13 (8.1) | 16 (8.9) | |
| 6574 years, no. (%) | 104 (13.9) | 20 (13.3) | 12 (9.8) | 16 (11.9) | 30 (18.8) | 26 (14.5) | |
| 7584 years, no. (%) | 197 (26.4) | 44 (29.3) | 36 (29.3) | 24 (17.9) | 49 (30.6) | 44 (24.6) | |
| 85 years, no. (%) | 231 (31.0) | 64 (42.7) | 50 (40.7) | 34 (25.4) | 37 (23.1) | 46 (25.7) | |
| Sex | |||||||
| Male, no. (%) | 427 (57.0) | 66 (44.0) | 60 (48.8) | 82 (60.7) | 105 (65.2) | 114 (63.7) | <0.01 |
| Female, no. (%) | 321 (43.0) | 84 (56.0) | 63 (51.2) | 53 (39.3) | 56 (34.8) | 65 (36.3) | |
| Race | |||||||
| Caucasian, no. (%) | 654 (87.4) | 129 (86.0) | 118 (95.9) | 126 (93.3) | 129 (80.1) | 152 (84.9) | <0.01 |
| Hispanic, no. (%) | 25 (3.3) | 2 (1.3) | 0 (0) | 1 (0.74) | 13 (8.1) | 9 (5.0) | |
| African American, no. (%) | 45 (6.0) | 12 (8.0) | 4 (3.3) | 5 (3.7) | 13 (8.1) | 11 (6.2) | |
| Native American, no. (%) | 0 (0) | 0 (0) | 0 (0) | 0 (0) | 0 (0) | 0 (0) | |
| Asian, no. (%) | 13 (1.7) | 1 (0.81) | 1 (0.81) | 2 (1.5) | 5 (3.1) | 4 (2.2) | |
| Other, no. (%) | 7 (0.94) | 2 (1.3) | 0 (0) | 1 (0.74) | 1 (14.3) | 3 (1.7) | |
| Not recorded, no. (%) | 4 (0.53) | 4 (2.7) | 0 (0) | 0 (0.0) | 0 (0) | 0 (0) | |
| Initial severity of renal dysfunction | |||||||
| Mild, CrCl 5080 mL/min, no. (%) | 60 (7.4) | 4 (2.4) | 5 (3.2) | 5 (3.5) | 14 (8.5) | 32 (17.6) | <0. 01 |
| Moderate, CrCl 1649 mL/min, no. (%) | 388 (47.6) | 84 (49.4) | 71 (45.5) | 80 (55.9) | 76 (46.3) | 77 (42.3) | |
| Severe, CrCl <15 mL/min, no. (%) | 367 (45.0) | 82 (48.2) | 80 (51.3) | 58 (40.6) | 74 (45.1) | 73 (40.1) | |
| LOS, d, median (IQR) | 4.0 (26) | 4.0 (37) | 3.0 (25.5) | 4.0 (27) | 4.0 (27) | 4.0 (26) | 0.02 |
| DRG‐weighted LOS, d, median (IQR) | 5.0 (3.76.7) | 5.5 (46.7) | 5.0 (3.46.2) | 5.6 (4.36.7) | 5.0 (3.36.7) | 5.0 (4.26.7) | 0.27 |
In both phases of our study, only medications that were potentially nephrotoxic and/or renally cleared were included as potential cases; all other drugs were excluded. We defined an ADE as any drug‐related injury. These were considered preventable if they were due to an error at the time of order entry (eg, a doubling of creatinine secondary to an overdose of gentamicin or failure to order corollary drug levels for monitoring). A nonpreventable ADE was any drug‐related injury in which there was no error at the time of order entry (eg, a doubling of creatinine despite appropriate dosing of lisinopril).[17] A medication error was an error anywhere in the process of prescribing, transcribing, dispensing, administering, or monitoring a drug, but with no potential for harm or injury (eg, an order for an oral medication with no route specified when it was clear that the oral route was intended).[18] A potential ADE was an error with the potential to cause harm, but not resulting in injury, either because it was intercepted (eg, an order for ketorolac for a patient with renal failure, but caught by a pharmacist) or because of chance (eg, administering enoxaparin to a patient with severe renal dysfunction but without hemorrhage).
All study investigators underwent standardized training using a curriculum developed by the Center for Patient Safety Research and Practice (
Main Outcome Measures
The primary outcome was the rate of preventable ADEs. Secondary outcomes were the rates of potential ADEs and overall ADEs. All outcomes were related to nephrotoxicity or accumulation of a renally excreted medication.
Data collection and classification strategies were identical in both phases of our study.[14] We reviewed physician orders, medication lists, laboratory reports, admission histories, progress and consultation notes, discharge summaries, and nursing flow sheets, screening for the presence of medication incidents using an adaptation of the Institute for Healthcare Improvement's trigger tool, selected for its high sensitivity, reproducibility, and ease of use.[22, 23] In our adaptation of the tool, we excluded lidocaine, tobramycin, amikacin, and theophylline levels because of their infrequency. For each trigger found, a detailed description of the incident was extracted for detailed review. An example of a trigger is the use of sodium polystyrene, which may possibly indicate an overdose of potassium or a medication side effect.
Subsequently, each case was then independently reviewed by two investigators (A.A.L., M.A., B.C., S.R.S., M.C., N.K., E.Z., and G.S.)each assigned to at least 1 siteand blinded to prescribing physician and hospital to determine whether nephrotoxicity or injury from drug accumulation was present (see Supporting Information, Figure 1, in the online version of this article).[17] First, incidents were classified as ADEs, potential ADEs, or medication errors with no potential for injury. Second, ADEs and potential ADEs were rated according to severity. When nephrotoxic drugs were ordered, event severity was classified according to the elevation in serum creatinine24: increases of 10% were considered potential ADEs (near misses); increases of 10% to 100% were significant ADEs; and increases of 100% were serious ADEs. Changes in creatinine that were not associated with inappropriate medication orders were excluded. For renally excreted drugs with no potential for nephrotoxicity (eg, enoxaparin), we used clinical judgment to classify events as significant (eg, rash), severe (eg, 2‐unit gastrointestinal bleed), life threatening (eg, transfer to an intensive care unit), or fatal categories, as based on earlier work.[25] Disagreements were resolved by consensus. We had a score of 0.70 (95% confidence interval [CI]: 0.61‐0.80) for incident type, indicating excellent overall agreement.
Statistical Analysis
Baseline characteristics between hospitals were compared using the Fisher exact test for categorical variables and 1‐way analysis of variance for continuous variables. The occurrence of each outcome was determined according to site. To facilitate comparisons between sites, rates were expressed as number of events per 100 admissions with 95% CIs. To account for hospital effects in the analysis when comparing pre‐ and postimplementation rates of ADEs and potential ADEs, we developed a fixed‐effects Poisson regression model. To explore the independent effects of each system, a stratified analysis was performed to compare average rates of each outcome observed.
RESULTS
The outcomes of 775 patients in the baseline study were compared with the 815 patients enrolled during the postimplementation phase.[14] Among those in the postimplementation phase (Table 1), the mean age was 72.2 years, and they were predominantly male (57.0%). The demographics of the patients admitted to each of the 5 sites varied widely (P<0.01). Most patients had moderate to severe renal dysfunction.
Overall, the rates of ADEs were similar between the pre‐ and postimplementation phases (8.9/100 vs 8.3/100 admissions, respectively; P=0.74) (Table 2). However, there was a significant decrease in the rate of preventable ADEs, the primary outcome of interest, following CPOE implementation (8.0/100 vs 4.4/100 admissions; P<0.01). A reduction in preventable ADEs was observed in every hospital except site 4, where only basic order entry was introduced. However, there was a significant increase in the rates of nonpreventable ADEs (0.90/100 vs 3.9/100 admissions; P<0.01) and potential ADEs (55.5/100 vs 136.8/100 admissions; P<0.01).
| Rate/100 Admissions (95% CI) | ||||||||||||||||||||
|---|---|---|---|---|---|---|---|---|---|---|---|---|---|---|---|---|---|---|---|---|
| Total No. (%) | All Sites | Site 1 | Site 2 | Site 3 | Site 4 | Site 5 | ||||||||||||||
| Event | Pre | Post | Pre | Post | P* | Pre | Post | P | Pre | Post | P | Pre | Post | P | Pre | Post | P | Pre | Post | P |
| ||||||||||||||||||||
| ADEs | 69 (13.8) | 68 (5.7) | 8.9 (7.0 1.2) | 8.3 (6.50.5) | 0.74 | 9.8 (6.015.1) | 10.0 (6.015.5) | 0.96 | 11.0 (6.517.4) | 7.7 (4.1 12.9) | 0.34 | 12.4 (7.5 19.1) | 4.2 (1.7 8.5) | 0.02 | 4.1 (1.68.3) | 13.4 (8.619.8) | 0.01 | 7.1 (3.712.2) | 6.0 (3.110.4) | 0.71 |
| Preventable | 62 | 36 | 8.0 (6.2 10.2) | 4.4 (3.16.0) | <0.01 | 8.2 (4.713.1) | 7.1 (3.811.8) | 0.70 | 10.3 (6.016.5) | 5.8 (2.8 10.4) | 0.17 | 12.4 (7.519.1) | 0 (0 0.03) | <0.01 | 3.4 (1.27.3) | 7.9 (4.413.1) | 0.11 | 5.8 (2.810.5) | 1.1 (0.183.4) | 0.03 |
| Nonpreventable | 7 | 32 | 0.90 (0.39 1.7) | 3.9 (2.75.4) | <0.01 | 1.6 (0.414.3) | 2.9 (1.16.3) | 0.42 | 0.69 (0.043.04) | 1.9 (0.48 5.0) | 0.37 | 0 (00.03) | 4.2 (1.7 8.5) | <0.01 | 0.68 (0.043.0) | 5.5 (2.6 9.9) | 0.05 | 1.3 (0.21, 4.0) | 4.9 (2.48.9) | 0.09 |
| Potential ADEs | 430 (86.2) | 1115 (93.5) | 55.5 (50.4 60.9) | 136.8 (128.9145.0) | <0.01 | 65.0 (54.077.4) | 141.1 (124.1159.8) | <0.01 | 57.2 (45.870.5) | 98.7 (83.9 115.1) | <0.01 | 44.8 (34.856.6) | 103.5 (87.7 121.1) | <0.01 | 59.2 (47.645.8) | 132.9 (116.1151.4) | <0.01 | 49.0 (38.860.9) | 195.1 (175.5216.1) | <0.01 |
| Intercepted | 16 | 24 | 2.1 (1.2 3.2) | 2.9 (1.94.3) | <0.24 | 3.3 (1.36.6) | 4.7 (2.28.8) | 0.50 | 2.1 (0.515.4) | 1.3 (0.21 4.0) | 0.60 | 1.4 (0.234.3) | 2.8 (0.87 6.5) | 0.41 | 2.0 (0.515.3) | 4.9 (2.2 9.1) | 0.20 | 1.3 (0.214.0) | 1.1 (0.183.4) | 0.87 |
| Nonintercepted | 414 | 1091 | 53.4 (48.4 58.7) | 133.9 (126.1142.0) | <0.01 | 61.7 (51.173.8) | 136.5 (119.754.8) | <0.01 | 55.2 43.968.2) | 97.4 (82.8 113.8) | <0.01 | 43.4 (33.655.1) | 100.7 (85.1 118.1) | <0.01 | 57.1 (45.8 70.2) | 128.0 (111.5146.2) | <0.01 | 47.7 (37.759.5) | 194.0 (174.4214.9) | <0.01 |
Stratified Analysis
To account for differences in technology, we performed a stratified analysis (Table 3). As was consistent with the overall study estimates, the rates of nonpreventable ADEs and potential ADEs increased with all 3 interventions. In contrast, we found that the changes in preventable ADE rates were related to the level of clinical decision support, where the greatest benefit was associated with the most sophisticated decision support system (P=0.03 and 0.02 for comparisons between advanced vs rudimentary decision support and basic order entry only, respectively). There was no difference in preventable ADE rates at sites without decision support (4.6/100 vs 4.3/100 admissions; P=0.87); with rudimentary clinical decision support, there was a trend toward a decrease in the preventable ADE rate, which did not meet statistical significance (9.1/100 vs 6.4/100 admissions; P=0.22), and, the greatest reduction was seen with advanced clinical decision support (12.4/100 vs 0/100 admissions; P<0.01).
| Rate per 100 Admissions by Level of Clinical Decision Support (95% CI) | |||||||||
|---|---|---|---|---|---|---|---|---|---|
| Basic CPOE Only (Sites 4 and 5) | CPOE and Lab Display (Sites 1 and 2) | CPOE, Lab Display, and DrugDosing Check (Site 3) | |||||||
| Incident | Pre | Post | P | Pre | Post | P | Pre | Post | P |
| |||||||||
| ADEs | 5.6 (3.48.7) | 9.5 (6.613.2) | 0.08 | 10.3(7.314.3) | 8.9 (6.012.5) | 0.55 | 12.4 (7.5319.1) | 4.2 (1.78.5) | 0.02 |
| Preventable | 4.6 (2.67.5) | 4.3 (2.56.9) | 0.87 | 9.1 (6.312.8) | 6.4 (4.19.6) | 0.22 | 12.4 (7.5319.1) | 0.00 (00.03) | <0.01 |
| Nonpreventable | 0.99 (0.24 2.6) | 5.2 (3.28.0) | <0.01 | 1.2 (0.382.8) | 2.5 (1.14.6) | 0.24 | 0.00 (00.03) | 4.2 (1.78.5) | <0.01 |
| Potential ADEs | 54.0 (46.162.7) | 165.6 (152.4179.5) | <0.01 | 61.6 (53.570.5) | 120.9 (109.3133.2) | <0.01 | 44.8 (34.856.6) | 103.5 (87.7121.1) | <0.01 |
| Intercepted | 1.7 (0.593.6) | 2.9 (1.45.1) | 0.30 | 2.7 (1.34.9) | 3.1 (1.55.4) | 0.76 | 1.4 (0.234.3) | 2.8 (0.876.5) | 0.42 |
| Nonintercepted | 52.3 (44.660.9) | 162.7 (149.6176.5) | <0.01 | 58.8 (50.967.5) | 117.8 (106.4130.0) | <0.01 | 43.4 (33.655.1) | 100.7 (85.1118.1) | <0.01 |
Severity of Events
We further analyzed our data based on event severity (Table 4). Among preventable ADEs, only 1 fatal event was observed, which occurred after CPOE implementation. Here, a previously opioid‐nave patient received intravenous morphine for malignant pain. Within the first 24 hours, the patient received 70.2 mg of intravenous morphine, resulting in a decreased level of consciousness. The patient expired the following day. Furthermore, following implementation, among preventable ADEs, a reduction in significant events was seen (P=0.02) along with a nonsignificant reduction in the rate of serious events (P=0.06). However, the rate of preventable life‐threatening events was not different (P=0.96). The nonpreventable ADE rate rose during the postimplementation period for both serious (P=0.03) and significant events (P<0.01). The risk of fatal and life‐threatening nonpreventable ADEs did not change. The potential ADE rate increased following implementation for all severities (P<0. 01).
| Preimplementation | Postimplementation | ||||
|---|---|---|---|---|---|
| Incident | No. (%) | Average Rate/100 Admissions (95% CI)* | No. (%) | Average Rate/100 Admissions (95% CI)* | P |
| |||||
| All ADEs | |||||
| Fatal | 0 (0) | 0.00 (00.0047) | 1 (1.4) | 0.12 (0.0070.54) | 0.52 |
| Lifethreatening | 3 (4.3) | 0.39 (0.101.0) | 3 (4.4) | 0.37 (0.09 0.95) | 0.95 |
| Serious | 34 (49.3) | 4.4 (3.16.0) | 32 (47.1) | 3.9 (2.75.4) | 0.65 |
| Significant | 32 (46.4) | 4.1 (2.95.7) | 32 (47.1) | 3.9 (2.75.4) | 0.84 |
| Total | 69 (100) | 8.9 (7.011.2) | 68 (100) | 8.3 (6.510.5) | 0.74 |
| Preventable ADEs | |||||
| Fatal | 0 (0) | 0.00 (00.0047) | 1 (2.7) | 0.00 (00.0045) | 0.52 |
| Lifethreatening | 2 (3.2) | 0.26 (0.040.80) | 2 (5.6) | 0.25 (0.040.76) | 0.96 |
| Serious | 31 (50.0) | 4.0 (2.85.6) | 19 (52.8) | 2.3 (1.43.5) | 0.06 |
| Significant | 29 (46.8) | 3.7 (2.55.3) | 14 (38.9) | 1.7 (0.972.8) | 0.02 |
| Total | 62 (100) | 8.0 (6.210.2) | 36 (100) | 4.4 (3.16.0) | <0.01 |
| Nonpreventable ADEs | |||||
| Fatal | 0 (0) | 0.00 (00.0047) | 0 (0) | 0.00 (00.0045) | NS |
| Lifethreatening | 1 (14.2) | 0.13 (0.0070.57) | 1 (3.1) | 0.12 (0.0070.54) | 0.97 |
| Serious | 3 (42.9) | 0.39 (0.101.0) | 13 (40.6) | 1.6 (0.882.6) | 0.03 |
| Significant | 3 (42.9) | 0.39 (0.101.0) | 18 (56.3) | 2.2 (1.33.4) | <0.01 |
| Total | 7 (100) | 0.90 (0.391.7) | 32 (100) | 3.9 (2.75.4) | <0.01 |
| All potential ADEs | |||||
| Lifethreatening | 5 (1.2) | 0.65 (0.231.4) | 33 (3.0) | 4.0 (2.85.6) | <0.01 |
| Serious | 233 (54.2) | 30.1 (26.434.1) | 429 (38.4) | 52.6 (47.857.8) | <0.01 |
| Significant | 192 (44.6) | 24.8 (21.428.4) | 653 (58.6) | 80.1 (74.186.4) | <0.01 |
| Total | 430 (100) | 55.5 (50.460.9) | 1115 (100) | 136.8 (128.9145.0) | <0.01 |
| Intercepted potential ADEs | |||||
| Lifethreatening | 0 (0) | 0.00 (00.0047) | 1 (4.2) | 0.12 (0.0070.54) | 0.52 |
| Serious | 5 (31.2) | 0.65 (0.231.4) | 13 (54.2) | 1.6 (0.882.6) | 0.09 |
| Significant | 11 (68.8) | 1.4 (0.74 2.4) | 10 (41.6) | 1.2 (0.622.2) | 0.74 |
| Total | 16 (100) | 2.1 (1.23.2) | 24 (100) | 2.9 (1.94.3) | 0.24 |
| Nonintercepted potential ADEs | |||||
| Lifethreatening | 5 (1.2) | 0.65 (0.231.4) | 32 (2.9) | 3.9 (2.75.4) | <0.01 |
| Serious | 228 (55.1) | 29.4 (25.833.4) | 416 (38.1) | 51.0 (46.356.1) | <0.01 |
| Significant | 181 (43.7) | 23.4 (20.126.9) | 643 (58.9) | 78.9 (73.085.2) | <0.01 |
| Total | 414 (100) | 53.4 (48.458.7) | 1091 (100) | 133.9(126.1142.0) | <0.01 |
Case Reviews
In total, there were 36 preventable ADEs identified during the postimplementation phase (Table 5). Of these, inappropriate renal dosing accounted for 26 preventable ADEs, which involved antibiotics (eg, gentamicin‐induced renal failure), opioids (eg, over sedation from morphine), ‐blockers (eg, hypotension from atenolol), angiotensin‐converting enzyme inhibitors (eg, renal failure with hyperkalemia secondary to lisinopril), and digoxin (eg, bradyarrhythmia and toxicity). The use of contraindicated medications resulted in 7 preventable ADEs (eg, prescribing glyburide in the setting of severe renal impairment).[26] The remaining 3 preventable ADEs stemmed from unmonitored use of vancomycin.
| ADEs, Preventable, No. (Rate per 100 Admissions)* | ADEs, Nonpreventable, No. (Rate per 100 Admissions)* | ||||||
|---|---|---|---|---|---|---|---|
| Drug Class | Preimplementation | Postimplementation | P (for Entire Drug Class) | Preimplementation | Postimplementation | P (for Drug Class) | Drugs Involved |
| |||||||
| Cardiovascular | 20 (2.6) | 18 (2.2) | 0.63 | 4 (0.52) | 16 (2.0) | 0.02 | Atenolol, bumetanide, captopril, digoxin, furosemide, hydralazine, hydrochlorothiazide, lisinopril, sotalol, spironolactone |
| Diuretics | 1 (0.13) | 2 (0.25) | 1 (0.13) | 9 (1.1) | |||
| ‐blockers | 0 (0.00) | 2 (0.25) | 1 (0.13) | ||||
| ACE inhibitors and ARBs | 16 (2.1) | 10 (1.2) | 2 (0.26) | 7 (0.86) | |||
| Antiarrhythmic | 3 (0.39) | 3 (0.37) | |||||
| Vasodilator | 0 (0.00) | 1 (0.12) | |||||
| Analgesics | 28 (3.6) | 4 (0.49) | 0.0002 | 1 (0.13) | 5 (0.61) | 0.15 | Acetaminophen and combination pills containing acetaminophen: Percocet (oxycodone and acetaminophen), Tylenol #3 (codeine and acetaminophen), Vicodin (hydrocodone and acetaminophen), fentanyl, hydrocodone, meperidine, morphine, oxycodone |
| Narcotic | 13 (1.7) | 4 (0.49) | 0 (0.00) | 5 (0.61) | |||
| Non‐narcotic | 15 (1.9) | 0 (0.00) | 1 (0.13) | 0 | |||
| Antibiotics | 8 (1.0) | 13 (1.6) | 0.33 | 1 (0.13) | 9 (1.1) | 0.04 | Amikacin, ampicillin and sulbactam, ciprofloxacin, cefazolin, cefuroxime, gatifloxacin, gentamicin, levofloxacin, metronidazole, piperacillin and tazobactam, tobramycin, vancomycin |
| Neurotropic drugs | 2 (0.26) | 0 (0.00) | 0.28 | 0 | 0 | Lithium, midazolam | |
| Sedatives | 1 (0.13) | 0 (0.00) | |||||
| Antipsychotics | 1 (0.13) | 0 (0.00) | |||||
| Diabetes | 0 | 1 (0.12) | 0.52 | 0 | 1 (0.12) | 0.52 | Glipizide, glyburide |
| Oral antidiabetics | 0 | 1 (0.12) | 1 (0.12) | ||||
| Other drugs | 4 (0.52) | 0 (0.00) | 0.13 | 1 (0.13) | 1 (0.12) | 0.97 | Allopurinol, famotidine |
| Gastrointestinal drugs | 1 (0.13) | 0 (0.00) | |||||
| Other | 3 (0.39) | 0 (0.00) | 0 | 1 (0.12) | |||
DISCUSSION
We evaluated the use of vendor CPOE for hospitalized patients with renal disease and found that it was associated with a 45% reduction in preventable ADEs related to nephrotoxicity and accumulation of renally excreted medications. The impact of CPOE appeared to be related to the level of associated clinical decision support, where only the most advanced system was associated with benefit. We observed a significant increase in potential ADEs with all levels of intervention. Overall, these findings suggest that vendor‐developed applications with appropriate decision support can reduce the occurrence of renally related preventable ADEs, but careful implementation is needed if the potential ADE rate is to fall.
Many of the benefits of CPOE come from clinical decision support.[11] When applied to patients with renal impairment, CPOE with clinical decision support has been associated with decreased lengths of stay,[16, 27] reduced use of contraindicated medications,[28, 29, 30] improved dosing and drug monitoring,[16, 31, 32] and improved general prescribing practices.[29, 33] Even so, the observed benefit of CPOE on ADE rates has been variable, with some studies reporting reductions,[27, 34] whereas others are unable to detect differences.[16, 31] These studies, however, limited their case definition of ADEs to strictly declining renal function,[16, 31, 34] or adverse events directly resulting from anti‐infective drugs.[27] In contrast, our study accounted for nephrotoxicity and systemic toxicity from drug accumulation. Using this broader definition, we were able to detect large reductions in the rates of preventable ADEs following CPOE adoption.
Successful decision support is simple, intuitive, and provides speedy information that integrates seamlessly into the clinical workflow.[35, 36] However, information delivery, although necessary, is insufficient for improving safety. For instance, passive alerts are often ignored, deferred, or overridden.[30, 37, 38] Demonstrating this, Quartarolo et al. found that informing physicians of the presence of renal impairment using automated reporting of glomerular filtration rates did not change prescribing behavior.[39] In contrast, providing active feedback (with dosing recommendations) was observed to be more useful in effecting change.[40] Chertow et al. further showed that providing an adjusted dose list with a default dose and frequency at the time of order entry for patients with renal insufficiency improved appropriate ordering and was associated with a decreased length of stay.[16] Altogether, these studies help to explain why only CPOE with clinical decision support equipped to provide renally adjusted dosing and monitoring was associated with a reduction in preventable ADEs in our study.
However, in contrast to reports of internally developed systems,[20, 25] potential ADE rates actually rose during the follow‐up portion of our study. These appeared to be chiefly related to customized order sets with the potential of overdosing drugs through therapeutic duplication, a problem that is commonly known to be associated with CPOE (ie, new orders that overlap with other new or active medication orders, which may be the same drug itself or from within the same drug class, with the risk of overdose).[41, 42] Of note, our findings give rise to several key implications. First, hospitals implementing vendor‐developed CPOE systems may be at greater risk of incurring potential ADEs compared to those using home‐grown systems, which have comparatively gone through more cycles of internal refinement. As such, it is necessary to monitor for issues postimplementation and respond with appropriate changes to achieve successful system performance.[35, 36] Second, although the rate of potential ADEs (near misses) increased, preventable ADEs decreased because some of these errors were intercepted, whereas others were averted simply because of chance. Of note, not all potential ADEs have the same potential for injury; more serious cases are more likely to result in actual ADEs (eg, failure to renally dose acetaminophen likely poses less potential for harm than prescribing a full dose of enoxaparin in the setting of severe renal failure). Third, we found that most potential ADEs could have been averted with a combination of basic (dosing guidance and drug‐drug interactions checks) and advanced decision support (medication‐associated laboratory testing and drug‐disease interactions).[43] Therefore, further refinements to existing software are needed to maximize safety outcomes.
Our study has some limitations. This study was not a randomized controlled trial, and thus is subject to potential confounding. Although 6 hospitals were involved at the study inception,[14] one of these hospitals eventually opted not to implement CPOE, and further declined to participate as a control site. Therefore, we cannot exclude confounding from secular trends because we had no contemporaneous control group. However, the introduction of CPOE was the main medication safety‐oriented intervention during the study interval, thus arguing against major confounding by cointervention. Second, even though it is possible that classification bias may have been introduced between the preimplementation and postimplementation portions of our study, especially given the passage of time, it is unlikely. Study personnel underwent training using a curriculum designed to maintain continuity across projects, minimize individual variability, and optimize reproducibility in data collection and classification, as in a number of previous studies.[14, 17, 19, 20, 21] Third, our study is limited by a heterogeneous intervention, as varying levels of decision support were introduced. However, this reflects usual practice and may be construed as a strength as we were able to describe the impact of different types of decision support. Fourth, we enrolled patients with a large spectrum of renal impairment, and our findings are not specific to any particular subgroup. However, our wide recruitment strategy also enhances the generalizability. Finally, our study was restricted to patients who were exposed to potentially nephrotoxic and/or renally cleared drugs. As such, we could not determine whether advanced decision support helped to eliminate the use of some potentially dangerous medications altogether, as these cases would have been excluded from our study. It is possible, therefore, that our study findings underestimate the true benefit of clinical decision support.
In conclusion, vendor CPOE implementation in 5 community hospitals was associated with a 45% reduction in preventable ADE rates among patients with renal impairment. Measurable benefit was associated with advanced decision support capable of lab display, dosing guidance, and medication‐associated laboratory testing. Although the potential benefits of CPOE systems are far reaching, achieving the desired safety benefits will require appropriate decision support, tracking of problems that arise, and systematic approaches to eliminating them.
Acknowledgments
The authors thank Kathy Zigmont, RN, and Cathy Foskett, RN (Brigham and Women's Hospital, Division of General Internal Medicine and Primary Care) for the chart review and data collection at the participating study sites.
Disclosures: The Rx Foundation and Commonwealth Fund supported the study. They commented on its design, but were not involved in data collection, data management, analysis, interpretation, or writing of the manuscript. Dr. Leung is supported by a Clinical Fellowship Award from Alberta Innovates Health Solutions and by a Fellowship Award from the Canadian Institutes for Health Research. Dr. Schiff received financial support from the FDA CPOE Task Order and the Commonwealth Fund. Ms. Keohane served as a consultant to the American College of Obstetrician and Gynecologists and as a reviewer for the VRQC Program. She received honoraria for a presentation on Patient Safety in 2010, sponsored by Abbott Nutrition International, and a lecture on Nurse Interruptions in Medication Administration by Educational Review Systems. Dr. Coffey received an honorarium from Meditech for speaking on social networking at Physician/CIO Forum in 2009. Dr. Kaufman participates in an advisory group with Siemens Medical Solutions. Dr. Zimlichman received support from the Rx Foundation and the Commonwealth Fund. Dr. Bates holds a minority equity position in the privately held company Medicalis, which develops Web‐based decision support for radiology test ordering, and has served as a consultant to Medicalis. He serves as an advisor to Calgary Scientific, which makes technologies that enable mobility within electronic health records. He is on the clinical advisory board for Patient Safety Systems, which provides a set of approaches to help hospitals improve safety. He has received funding support from the Massachusetts Technology Consortium. Ms. Amato, Dr. Simon, Dr. Cadet, Ms. Seger, and Ms. Yoon have no disclosures relevant to this study.
- , , . Drug Prescribing in Renal Failure: Dosing Guidelines for Adults and Children: American College of Physicians; 2007.
- , . Management of drug toxicity in patients with renal insufficiency. Nat Rev Nephrol. 2010;6(6):317–318.
- , , , . Use of renal risk drugs in hospitalized patients with impaired renal function—an underestimated problem? Nephrol Dial Transplant. 2006;21(11):3164–3171.
- , , , et al. Medication misuse in hospitalized patients with renal impairment. Int J Qual Health Care. 2003;15(4):331–335.
- , , , . Impact of a renal drug dosing service on dose adjustment in hospitalized patients with chronic kidney disease. Ann Pharmacother. 2009;43(10):1598–1605.
- , . Drug dosing in chronic kidney disease. Med Clin North Am. 2005;89(3):649–687.
- , , , et al. Systems analysis of adverse drug events. ADE Prevention Study Group. JAMA. 1995;274(1):35–43.
- , , , , , . The epidemiology of prescribing errors: the potential impact of computerized prescriber order entry. Arch Intern Med. 2004;164(7):785–792.
- , , . Factors related to errors in medication prescribing. JAMA. 1997;277(4):312–317.
- , , , et al. Role of computerized physician order entry systems in facilitating medication errors. JAMA. 2005;293(10):1197–1203.
- , , , , . Mixed results in the safety performance of computerized physician order entry. Health Aff (Millwood). 2010;29(4):655–663.
- , , , et al. The effect of computerized physician order entry with clinical decision support on the rates of adverse drug events: a systematic review. J Gen Intern Med. 2008;23(4):451–458.
- , , . The impact of computerized physician medication order entry in hospitalized patients—a systematic review. Int J Med Inform. 2008;77(6):365–376.
- , , , et al. Occurrence of adverse, often preventable, events in community hospitals involving nephrotoxic drugs or those excreted by the kidney. Kidney Int. 2009;76(11):1192–1198.
- , . Prediction of creatinine clearance from serum creatinine. Nephron. 1976;16(1):31–41.
- , , , et al. Guided medication dosing for inpatients with renal insufficiency. JAMA. 2001;286(22):2839–2844.
- , , , , . Adverse drug events and medication errors: detection and classification methods. Qual Saf Health Care. 2004;13(4):306–314.
- , , , , . Relationship between medication errors and adverse drug events. J Gen Intern Med. 1995;10(4):199–205.
- , , , et al. Incidence of adverse drug events and potential adverse drug events. Implications for prevention. ADE Prevention Study Group. JAMA. 1995;274(1):29–34.
- , , , et al. Effect of computerized physician order entry and a team intervention on prevention of serious medication errors. JAMA. 1998;280(15):1311–1316.
- , , , et al. Adverse drug event rates in six community hospitals and the potential impact of computerized physician order entry for prevention. J Gen Intern Med. 2010;25(1):31–38.
- , , . Adverse drug event trigger tool: a practical methodology for measuring medication related harm. Qual Saf Health Care. 2003;12(3):194–200.
- Institute for Healthcare Improvement: IHI Trigger Tool for Measuring Adverse Drug Events. 2011. Available at: http://www.ihi.org/knowledge/Pages/Tools/TriggerToolforMeasuringAdverseDrugEvents.aspx. Accessed February 1, 2013.
- , , , . Renal safety of two analgesics used over the counter: ibuprofen and aspirin. Clin Pharmacol Ther. 1986;40(4):373–377.
- , , , et al. The impact of computerized physician order entry on medication error prevention. J Am Med Inform Assoc. 1999;6(4):313–321.
- , , . Prolonged sulfonylurea‐induced hypoglycemia in diabetic patients with end‐stage renal disease. Am J Kidney Dis. 2000;35(3):500–505.
- , , , et al. A computer‐assisted management program for antibiotics and other antiinfective agents. N Engl J Med. 1998;338(4):232–238.
- , , , et al. Alert system for inappropriate prescriptions relating to patients' clinical condition. Methods Inf Med. 2009;48(6):566–573.
- , , , , , . Computerized clinical decision support during medication ordering for long‐term care residents with renal insufficiency. J Am Med Inform Assoc. 2009;16(4):480–485.
- , , . A trial of automated decision support alerts for contraindicated medications using computerized physician order entry. J Am Med Inform Assoc. 2005;12(3):269–274.
- , , , , . Effects of clinical decision support on initial dosing and monitoring of tobramycin and amikacin. Am J Health Syst Pharm. 2011;68(7):624–632.
- , , , , , . Computerized decision support for medication dosing in renal insufficiency: a randomized, controlled trial. Ann Emerg Med. 2010;56(6):623–629.
- , , , . Implementation of rules based computerised bedside prescribing and administration: intervention study. BMJ. 2000;320(7237):750–753.
- , , , et al. Effect of computer‐based alerts on the treatment and outcomes of hospitalized patients. Arch Intern Med. 1994;154(13):1511–1517.
- , , , et al. Ten commandments for effective clinical decision support: making the practice of evidence‐based medicine a reality. J Am Med Inform Assoc. 2003;10(6):523–530.
- , , . Computerized decision support systems: improving patient safety in nephrology. Nat Rev Nephrol. 2011;7(6):348–355.
- , , , et al. Impact of a computerized alert during physician order entry on medication dosing in patients with renal impairment. Proc AMIA Symp. 2002:577–581.
- , , , et al. A computerized provider order entry intervention for medication safety during acute kidney injury: a quality improvement report. Am J Kidney Dis. 2010;56(5):832–841.
- , , . Reporting of estimated glomerular filtration rate: effect on physician recognition of chronic kidney disease and prescribing practices for elderly hospitalized patients. J Hosp Med. 2007;2(2):74–78.
- , , , , . Drug dosage in patients with renal failure optimized by immediate concurrent feedback. J Gen Intern Med. 2001;16(6):369–375.
- , , , et al. Factors contributing to an increase in duplicate medication order errors after CPOE implementation. J Am Med Inform Assoc. 2011;18(6):774–782.
- , , , et al. Impact of Vendor Computerized Physician Order Entry in Community Hospitals. J Gen Intern Med. 2012;27(7):801–807.
- , , , et al. Medication‐related clinical decision support in computerized provider order entry systems: a review. J Am Med Inform Assoc. 2007;14(1):29–40.
Hospitalized patients with renal impairment are vulnerable to adverse drug events (ADEs).[1, 2] Appropriate prescribing for patients with renal insufficiency is challenging because of the complexities of drug therapy within the wide spectrum of kidney disease.[3, 4, 5, 6] Accordingly, computerized physician order entry (CPOE) systems with clinical decision support may help prevent many ADEs by providing timely laboratory information, recommending renally adjusted doses, and by offering assistance with prescribing.[7, 8, 9]
Despite the proposed benefits of CPOE, outcomes vary greatly because of differences in technology.[10, 11, 12, 13] In particular, the type of decision support available to assist medication ordering in the setting of renal disease varies widely among current vendor systems. Given the uncertain benefits of CPOE, especially with the wide range of associated clinical decision support, we conducted this study to determine the impact of these systems on the rates of ADEs among hospitalized patients with kidney disease.
METHODS
This study was approved by the institutional review boards at each study site.
Design and Setting
We conducted a before‐and‐after study to evaluate the impact of newly implemented vendor CPOE systems in 5 community hospitals in Massachusetts. Although we reported on 6 hospitals in our baseline study,[14] 1 of these hospitals later chose not to implement CPOE, and therefore was not included in follow‐up. At the time of this study, 1 of the hospitals (site 3) had not yet achieved hospital‐wide implementation. Although CPOE had been adopted by most medical services at site 3, it had not yet been implemented in the emergency, obstetrical, or surgical departments. Thus, we limited our study to the medical services at this site. For the remaining sites, all admitting services were included with the exception of the psychiatric and neonatal services, which were excluded from both phases because they would have required different detection tools.
Participants
Patients aged 18 years with renal failure, exposed to potentially nephrotoxic and/or renally cleared medications, and admitted to any of the participating hospitals during the study period were eligible for inclusion. Of the patients meeting eligibility criteria, we randomly selected approximately 150 records per hospital in the preimplementation and postimplementation phases for a total sample of 1590 charts. The first phase of this study occurred from January 2005 to August 2006; the second phase began 6 months postimplementation and lasted from October 2008 to September 2010.
Principal Exposure
Each hospital independently selected a vendor CPOE system with variable clinical decision support capabilities: (1) sites 4 and 5 had basic CPOE only with no clinical decision support for renal disease; (2) sites 1 and 2 implemented rudimentary clinical decision support with laboratory display (eg, serum creatinine) whenever common renally related drugs were ordered; and (3) site 3 had the most advanced support in place where, in addition to basic order entry and lab checks, physicians were provided with suggested doses for renally cleared and/or nephrotoxic medications, as well as appropriate drug monitoring for medications with narrow therapeutic indices (eg, suggested dosages and frequencies for vancomycin and automated corollary laboratory monitoring).
Definitions
We screened for the presence of renal failure by a serum creatinine 1.5 mg/dL at the time of admission. However, the duration of renal impairment was not known. We defined 3 levels of renal insufficiency based on the calculated creatinine clearance (CrCl)15: mild (CrCl 5080 mL/min), moderate (1649 mL/min), and severe (15 mL/min). Subjects with a CrCl >80 mL/min were considered to have normal renal function and were excluded. Potentially nephrotoxic and/or renally cleared medications were then identified using an established knowledge base (see Supporting Information, Table 1, in the online version of this article).[16]
| Hospital Site | |||||||
|---|---|---|---|---|---|---|---|
| Baseline Characteristics | All Sites | 1 | 2 | 3 | 4 | 5 | P (Among All Sites)* |
| |||||||
| No. of patients | 815 | 170 | 156 | 143 | 164 | 182 | |
| Age, y, mean (range) | 72.2 (18.0102.0) | 79.2 (33102) | 77.3 (23101) | 65.6 (1898) | 70.7 (1896) | 69.2 (2096) | <0.01 |
| 1844 years, no. (%) | 68 (9.1) | 1 (0.67) | 8 (6.5) | 20 (14.9) | 15 (9.4) | 24 (13.4) | <0.01 |
| 4554 years, no. (%) | 67 (9.0) | 6 (4.0) | 5 (4.1) | 17 (12.7) | 16 (10.0) | 23 (12.9) | |
| 5564 years, no. (%) | 79 (10.6) | 15 (10.0) | 12 (9.8) | 23 (17.2) | 13 (8.1) | 16 (8.9) | |
| 6574 years, no. (%) | 104 (13.9) | 20 (13.3) | 12 (9.8) | 16 (11.9) | 30 (18.8) | 26 (14.5) | |
| 7584 years, no. (%) | 197 (26.4) | 44 (29.3) | 36 (29.3) | 24 (17.9) | 49 (30.6) | 44 (24.6) | |
| 85 years, no. (%) | 231 (31.0) | 64 (42.7) | 50 (40.7) | 34 (25.4) | 37 (23.1) | 46 (25.7) | |
| Sex | |||||||
| Male, no. (%) | 427 (57.0) | 66 (44.0) | 60 (48.8) | 82 (60.7) | 105 (65.2) | 114 (63.7) | <0.01 |
| Female, no. (%) | 321 (43.0) | 84 (56.0) | 63 (51.2) | 53 (39.3) | 56 (34.8) | 65 (36.3) | |
| Race | |||||||
| Caucasian, no. (%) | 654 (87.4) | 129 (86.0) | 118 (95.9) | 126 (93.3) | 129 (80.1) | 152 (84.9) | <0.01 |
| Hispanic, no. (%) | 25 (3.3) | 2 (1.3) | 0 (0) | 1 (0.74) | 13 (8.1) | 9 (5.0) | |
| African American, no. (%) | 45 (6.0) | 12 (8.0) | 4 (3.3) | 5 (3.7) | 13 (8.1) | 11 (6.2) | |
| Native American, no. (%) | 0 (0) | 0 (0) | 0 (0) | 0 (0) | 0 (0) | 0 (0) | |
| Asian, no. (%) | 13 (1.7) | 1 (0.81) | 1 (0.81) | 2 (1.5) | 5 (3.1) | 4 (2.2) | |
| Other, no. (%) | 7 (0.94) | 2 (1.3) | 0 (0) | 1 (0.74) | 1 (14.3) | 3 (1.7) | |
| Not recorded, no. (%) | 4 (0.53) | 4 (2.7) | 0 (0) | 0 (0.0) | 0 (0) | 0 (0) | |
| Initial severity of renal dysfunction | |||||||
| Mild, CrCl 5080 mL/min, no. (%) | 60 (7.4) | 4 (2.4) | 5 (3.2) | 5 (3.5) | 14 (8.5) | 32 (17.6) | <0. 01 |
| Moderate, CrCl 1649 mL/min, no. (%) | 388 (47.6) | 84 (49.4) | 71 (45.5) | 80 (55.9) | 76 (46.3) | 77 (42.3) | |
| Severe, CrCl <15 mL/min, no. (%) | 367 (45.0) | 82 (48.2) | 80 (51.3) | 58 (40.6) | 74 (45.1) | 73 (40.1) | |
| LOS, d, median (IQR) | 4.0 (26) | 4.0 (37) | 3.0 (25.5) | 4.0 (27) | 4.0 (27) | 4.0 (26) | 0.02 |
| DRG‐weighted LOS, d, median (IQR) | 5.0 (3.76.7) | 5.5 (46.7) | 5.0 (3.46.2) | 5.6 (4.36.7) | 5.0 (3.36.7) | 5.0 (4.26.7) | 0.27 |
In both phases of our study, only medications that were potentially nephrotoxic and/or renally cleared were included as potential cases; all other drugs were excluded. We defined an ADE as any drug‐related injury. These were considered preventable if they were due to an error at the time of order entry (eg, a doubling of creatinine secondary to an overdose of gentamicin or failure to order corollary drug levels for monitoring). A nonpreventable ADE was any drug‐related injury in which there was no error at the time of order entry (eg, a doubling of creatinine despite appropriate dosing of lisinopril).[17] A medication error was an error anywhere in the process of prescribing, transcribing, dispensing, administering, or monitoring a drug, but with no potential for harm or injury (eg, an order for an oral medication with no route specified when it was clear that the oral route was intended).[18] A potential ADE was an error with the potential to cause harm, but not resulting in injury, either because it was intercepted (eg, an order for ketorolac for a patient with renal failure, but caught by a pharmacist) or because of chance (eg, administering enoxaparin to a patient with severe renal dysfunction but without hemorrhage).
All study investigators underwent standardized training using a curriculum developed by the Center for Patient Safety Research and Practice (
Main Outcome Measures
The primary outcome was the rate of preventable ADEs. Secondary outcomes were the rates of potential ADEs and overall ADEs. All outcomes were related to nephrotoxicity or accumulation of a renally excreted medication.
Data collection and classification strategies were identical in both phases of our study.[14] We reviewed physician orders, medication lists, laboratory reports, admission histories, progress and consultation notes, discharge summaries, and nursing flow sheets, screening for the presence of medication incidents using an adaptation of the Institute for Healthcare Improvement's trigger tool, selected for its high sensitivity, reproducibility, and ease of use.[22, 23] In our adaptation of the tool, we excluded lidocaine, tobramycin, amikacin, and theophylline levels because of their infrequency. For each trigger found, a detailed description of the incident was extracted for detailed review. An example of a trigger is the use of sodium polystyrene, which may possibly indicate an overdose of potassium or a medication side effect.
Subsequently, each case was then independently reviewed by two investigators (A.A.L., M.A., B.C., S.R.S., M.C., N.K., E.Z., and G.S.)each assigned to at least 1 siteand blinded to prescribing physician and hospital to determine whether nephrotoxicity or injury from drug accumulation was present (see Supporting Information, Figure 1, in the online version of this article).[17] First, incidents were classified as ADEs, potential ADEs, or medication errors with no potential for injury. Second, ADEs and potential ADEs were rated according to severity. When nephrotoxic drugs were ordered, event severity was classified according to the elevation in serum creatinine24: increases of 10% were considered potential ADEs (near misses); increases of 10% to 100% were significant ADEs; and increases of 100% were serious ADEs. Changes in creatinine that were not associated with inappropriate medication orders were excluded. For renally excreted drugs with no potential for nephrotoxicity (eg, enoxaparin), we used clinical judgment to classify events as significant (eg, rash), severe (eg, 2‐unit gastrointestinal bleed), life threatening (eg, transfer to an intensive care unit), or fatal categories, as based on earlier work.[25] Disagreements were resolved by consensus. We had a score of 0.70 (95% confidence interval [CI]: 0.61‐0.80) for incident type, indicating excellent overall agreement.
Statistical Analysis
Baseline characteristics between hospitals were compared using the Fisher exact test for categorical variables and 1‐way analysis of variance for continuous variables. The occurrence of each outcome was determined according to site. To facilitate comparisons between sites, rates were expressed as number of events per 100 admissions with 95% CIs. To account for hospital effects in the analysis when comparing pre‐ and postimplementation rates of ADEs and potential ADEs, we developed a fixed‐effects Poisson regression model. To explore the independent effects of each system, a stratified analysis was performed to compare average rates of each outcome observed.
RESULTS
The outcomes of 775 patients in the baseline study were compared with the 815 patients enrolled during the postimplementation phase.[14] Among those in the postimplementation phase (Table 1), the mean age was 72.2 years, and they were predominantly male (57.0%). The demographics of the patients admitted to each of the 5 sites varied widely (P<0.01). Most patients had moderate to severe renal dysfunction.
Overall, the rates of ADEs were similar between the pre‐ and postimplementation phases (8.9/100 vs 8.3/100 admissions, respectively; P=0.74) (Table 2). However, there was a significant decrease in the rate of preventable ADEs, the primary outcome of interest, following CPOE implementation (8.0/100 vs 4.4/100 admissions; P<0.01). A reduction in preventable ADEs was observed in every hospital except site 4, where only basic order entry was introduced. However, there was a significant increase in the rates of nonpreventable ADEs (0.90/100 vs 3.9/100 admissions; P<0.01) and potential ADEs (55.5/100 vs 136.8/100 admissions; P<0.01).
| Rate/100 Admissions (95% CI) | ||||||||||||||||||||
|---|---|---|---|---|---|---|---|---|---|---|---|---|---|---|---|---|---|---|---|---|
| Total No. (%) | All Sites | Site 1 | Site 2 | Site 3 | Site 4 | Site 5 | ||||||||||||||
| Event | Pre | Post | Pre | Post | P* | Pre | Post | P | Pre | Post | P | Pre | Post | P | Pre | Post | P | Pre | Post | P |
| ||||||||||||||||||||
| ADEs | 69 (13.8) | 68 (5.7) | 8.9 (7.0 1.2) | 8.3 (6.50.5) | 0.74 | 9.8 (6.015.1) | 10.0 (6.015.5) | 0.96 | 11.0 (6.517.4) | 7.7 (4.1 12.9) | 0.34 | 12.4 (7.5 19.1) | 4.2 (1.7 8.5) | 0.02 | 4.1 (1.68.3) | 13.4 (8.619.8) | 0.01 | 7.1 (3.712.2) | 6.0 (3.110.4) | 0.71 |
| Preventable | 62 | 36 | 8.0 (6.2 10.2) | 4.4 (3.16.0) | <0.01 | 8.2 (4.713.1) | 7.1 (3.811.8) | 0.70 | 10.3 (6.016.5) | 5.8 (2.8 10.4) | 0.17 | 12.4 (7.519.1) | 0 (0 0.03) | <0.01 | 3.4 (1.27.3) | 7.9 (4.413.1) | 0.11 | 5.8 (2.810.5) | 1.1 (0.183.4) | 0.03 |
| Nonpreventable | 7 | 32 | 0.90 (0.39 1.7) | 3.9 (2.75.4) | <0.01 | 1.6 (0.414.3) | 2.9 (1.16.3) | 0.42 | 0.69 (0.043.04) | 1.9 (0.48 5.0) | 0.37 | 0 (00.03) | 4.2 (1.7 8.5) | <0.01 | 0.68 (0.043.0) | 5.5 (2.6 9.9) | 0.05 | 1.3 (0.21, 4.0) | 4.9 (2.48.9) | 0.09 |
| Potential ADEs | 430 (86.2) | 1115 (93.5) | 55.5 (50.4 60.9) | 136.8 (128.9145.0) | <0.01 | 65.0 (54.077.4) | 141.1 (124.1159.8) | <0.01 | 57.2 (45.870.5) | 98.7 (83.9 115.1) | <0.01 | 44.8 (34.856.6) | 103.5 (87.7 121.1) | <0.01 | 59.2 (47.645.8) | 132.9 (116.1151.4) | <0.01 | 49.0 (38.860.9) | 195.1 (175.5216.1) | <0.01 |
| Intercepted | 16 | 24 | 2.1 (1.2 3.2) | 2.9 (1.94.3) | <0.24 | 3.3 (1.36.6) | 4.7 (2.28.8) | 0.50 | 2.1 (0.515.4) | 1.3 (0.21 4.0) | 0.60 | 1.4 (0.234.3) | 2.8 (0.87 6.5) | 0.41 | 2.0 (0.515.3) | 4.9 (2.2 9.1) | 0.20 | 1.3 (0.214.0) | 1.1 (0.183.4) | 0.87 |
| Nonintercepted | 414 | 1091 | 53.4 (48.4 58.7) | 133.9 (126.1142.0) | <0.01 | 61.7 (51.173.8) | 136.5 (119.754.8) | <0.01 | 55.2 43.968.2) | 97.4 (82.8 113.8) | <0.01 | 43.4 (33.655.1) | 100.7 (85.1 118.1) | <0.01 | 57.1 (45.8 70.2) | 128.0 (111.5146.2) | <0.01 | 47.7 (37.759.5) | 194.0 (174.4214.9) | <0.01 |
Stratified Analysis
To account for differences in technology, we performed a stratified analysis (Table 3). As was consistent with the overall study estimates, the rates of nonpreventable ADEs and potential ADEs increased with all 3 interventions. In contrast, we found that the changes in preventable ADE rates were related to the level of clinical decision support, where the greatest benefit was associated with the most sophisticated decision support system (P=0.03 and 0.02 for comparisons between advanced vs rudimentary decision support and basic order entry only, respectively). There was no difference in preventable ADE rates at sites without decision support (4.6/100 vs 4.3/100 admissions; P=0.87); with rudimentary clinical decision support, there was a trend toward a decrease in the preventable ADE rate, which did not meet statistical significance (9.1/100 vs 6.4/100 admissions; P=0.22), and, the greatest reduction was seen with advanced clinical decision support (12.4/100 vs 0/100 admissions; P<0.01).
| Rate per 100 Admissions by Level of Clinical Decision Support (95% CI) | |||||||||
|---|---|---|---|---|---|---|---|---|---|
| Basic CPOE Only (Sites 4 and 5) | CPOE and Lab Display (Sites 1 and 2) | CPOE, Lab Display, and DrugDosing Check (Site 3) | |||||||
| Incident | Pre | Post | P | Pre | Post | P | Pre | Post | P |
| |||||||||
| ADEs | 5.6 (3.48.7) | 9.5 (6.613.2) | 0.08 | 10.3(7.314.3) | 8.9 (6.012.5) | 0.55 | 12.4 (7.5319.1) | 4.2 (1.78.5) | 0.02 |
| Preventable | 4.6 (2.67.5) | 4.3 (2.56.9) | 0.87 | 9.1 (6.312.8) | 6.4 (4.19.6) | 0.22 | 12.4 (7.5319.1) | 0.00 (00.03) | <0.01 |
| Nonpreventable | 0.99 (0.24 2.6) | 5.2 (3.28.0) | <0.01 | 1.2 (0.382.8) | 2.5 (1.14.6) | 0.24 | 0.00 (00.03) | 4.2 (1.78.5) | <0.01 |
| Potential ADEs | 54.0 (46.162.7) | 165.6 (152.4179.5) | <0.01 | 61.6 (53.570.5) | 120.9 (109.3133.2) | <0.01 | 44.8 (34.856.6) | 103.5 (87.7121.1) | <0.01 |
| Intercepted | 1.7 (0.593.6) | 2.9 (1.45.1) | 0.30 | 2.7 (1.34.9) | 3.1 (1.55.4) | 0.76 | 1.4 (0.234.3) | 2.8 (0.876.5) | 0.42 |
| Nonintercepted | 52.3 (44.660.9) | 162.7 (149.6176.5) | <0.01 | 58.8 (50.967.5) | 117.8 (106.4130.0) | <0.01 | 43.4 (33.655.1) | 100.7 (85.1118.1) | <0.01 |
Severity of Events
We further analyzed our data based on event severity (Table 4). Among preventable ADEs, only 1 fatal event was observed, which occurred after CPOE implementation. Here, a previously opioid‐nave patient received intravenous morphine for malignant pain. Within the first 24 hours, the patient received 70.2 mg of intravenous morphine, resulting in a decreased level of consciousness. The patient expired the following day. Furthermore, following implementation, among preventable ADEs, a reduction in significant events was seen (P=0.02) along with a nonsignificant reduction in the rate of serious events (P=0.06). However, the rate of preventable life‐threatening events was not different (P=0.96). The nonpreventable ADE rate rose during the postimplementation period for both serious (P=0.03) and significant events (P<0.01). The risk of fatal and life‐threatening nonpreventable ADEs did not change. The potential ADE rate increased following implementation for all severities (P<0. 01).
| Preimplementation | Postimplementation | ||||
|---|---|---|---|---|---|
| Incident | No. (%) | Average Rate/100 Admissions (95% CI)* | No. (%) | Average Rate/100 Admissions (95% CI)* | P |
| |||||
| All ADEs | |||||
| Fatal | 0 (0) | 0.00 (00.0047) | 1 (1.4) | 0.12 (0.0070.54) | 0.52 |
| Lifethreatening | 3 (4.3) | 0.39 (0.101.0) | 3 (4.4) | 0.37 (0.09 0.95) | 0.95 |
| Serious | 34 (49.3) | 4.4 (3.16.0) | 32 (47.1) | 3.9 (2.75.4) | 0.65 |
| Significant | 32 (46.4) | 4.1 (2.95.7) | 32 (47.1) | 3.9 (2.75.4) | 0.84 |
| Total | 69 (100) | 8.9 (7.011.2) | 68 (100) | 8.3 (6.510.5) | 0.74 |
| Preventable ADEs | |||||
| Fatal | 0 (0) | 0.00 (00.0047) | 1 (2.7) | 0.00 (00.0045) | 0.52 |
| Lifethreatening | 2 (3.2) | 0.26 (0.040.80) | 2 (5.6) | 0.25 (0.040.76) | 0.96 |
| Serious | 31 (50.0) | 4.0 (2.85.6) | 19 (52.8) | 2.3 (1.43.5) | 0.06 |
| Significant | 29 (46.8) | 3.7 (2.55.3) | 14 (38.9) | 1.7 (0.972.8) | 0.02 |
| Total | 62 (100) | 8.0 (6.210.2) | 36 (100) | 4.4 (3.16.0) | <0.01 |
| Nonpreventable ADEs | |||||
| Fatal | 0 (0) | 0.00 (00.0047) | 0 (0) | 0.00 (00.0045) | NS |
| Lifethreatening | 1 (14.2) | 0.13 (0.0070.57) | 1 (3.1) | 0.12 (0.0070.54) | 0.97 |
| Serious | 3 (42.9) | 0.39 (0.101.0) | 13 (40.6) | 1.6 (0.882.6) | 0.03 |
| Significant | 3 (42.9) | 0.39 (0.101.0) | 18 (56.3) | 2.2 (1.33.4) | <0.01 |
| Total | 7 (100) | 0.90 (0.391.7) | 32 (100) | 3.9 (2.75.4) | <0.01 |
| All potential ADEs | |||||
| Lifethreatening | 5 (1.2) | 0.65 (0.231.4) | 33 (3.0) | 4.0 (2.85.6) | <0.01 |
| Serious | 233 (54.2) | 30.1 (26.434.1) | 429 (38.4) | 52.6 (47.857.8) | <0.01 |
| Significant | 192 (44.6) | 24.8 (21.428.4) | 653 (58.6) | 80.1 (74.186.4) | <0.01 |
| Total | 430 (100) | 55.5 (50.460.9) | 1115 (100) | 136.8 (128.9145.0) | <0.01 |
| Intercepted potential ADEs | |||||
| Lifethreatening | 0 (0) | 0.00 (00.0047) | 1 (4.2) | 0.12 (0.0070.54) | 0.52 |
| Serious | 5 (31.2) | 0.65 (0.231.4) | 13 (54.2) | 1.6 (0.882.6) | 0.09 |
| Significant | 11 (68.8) | 1.4 (0.74 2.4) | 10 (41.6) | 1.2 (0.622.2) | 0.74 |
| Total | 16 (100) | 2.1 (1.23.2) | 24 (100) | 2.9 (1.94.3) | 0.24 |
| Nonintercepted potential ADEs | |||||
| Lifethreatening | 5 (1.2) | 0.65 (0.231.4) | 32 (2.9) | 3.9 (2.75.4) | <0.01 |
| Serious | 228 (55.1) | 29.4 (25.833.4) | 416 (38.1) | 51.0 (46.356.1) | <0.01 |
| Significant | 181 (43.7) | 23.4 (20.126.9) | 643 (58.9) | 78.9 (73.085.2) | <0.01 |
| Total | 414 (100) | 53.4 (48.458.7) | 1091 (100) | 133.9(126.1142.0) | <0.01 |
Case Reviews
In total, there were 36 preventable ADEs identified during the postimplementation phase (Table 5). Of these, inappropriate renal dosing accounted for 26 preventable ADEs, which involved antibiotics (eg, gentamicin‐induced renal failure), opioids (eg, over sedation from morphine), ‐blockers (eg, hypotension from atenolol), angiotensin‐converting enzyme inhibitors (eg, renal failure with hyperkalemia secondary to lisinopril), and digoxin (eg, bradyarrhythmia and toxicity). The use of contraindicated medications resulted in 7 preventable ADEs (eg, prescribing glyburide in the setting of severe renal impairment).[26] The remaining 3 preventable ADEs stemmed from unmonitored use of vancomycin.
| ADEs, Preventable, No. (Rate per 100 Admissions)* | ADEs, Nonpreventable, No. (Rate per 100 Admissions)* | ||||||
|---|---|---|---|---|---|---|---|
| Drug Class | Preimplementation | Postimplementation | P (for Entire Drug Class) | Preimplementation | Postimplementation | P (for Drug Class) | Drugs Involved |
| |||||||
| Cardiovascular | 20 (2.6) | 18 (2.2) | 0.63 | 4 (0.52) | 16 (2.0) | 0.02 | Atenolol, bumetanide, captopril, digoxin, furosemide, hydralazine, hydrochlorothiazide, lisinopril, sotalol, spironolactone |
| Diuretics | 1 (0.13) | 2 (0.25) | 1 (0.13) | 9 (1.1) | |||
| ‐blockers | 0 (0.00) | 2 (0.25) | 1 (0.13) | ||||
| ACE inhibitors and ARBs | 16 (2.1) | 10 (1.2) | 2 (0.26) | 7 (0.86) | |||
| Antiarrhythmic | 3 (0.39) | 3 (0.37) | |||||
| Vasodilator | 0 (0.00) | 1 (0.12) | |||||
| Analgesics | 28 (3.6) | 4 (0.49) | 0.0002 | 1 (0.13) | 5 (0.61) | 0.15 | Acetaminophen and combination pills containing acetaminophen: Percocet (oxycodone and acetaminophen), Tylenol #3 (codeine and acetaminophen), Vicodin (hydrocodone and acetaminophen), fentanyl, hydrocodone, meperidine, morphine, oxycodone |
| Narcotic | 13 (1.7) | 4 (0.49) | 0 (0.00) | 5 (0.61) | |||
| Non‐narcotic | 15 (1.9) | 0 (0.00) | 1 (0.13) | 0 | |||
| Antibiotics | 8 (1.0) | 13 (1.6) | 0.33 | 1 (0.13) | 9 (1.1) | 0.04 | Amikacin, ampicillin and sulbactam, ciprofloxacin, cefazolin, cefuroxime, gatifloxacin, gentamicin, levofloxacin, metronidazole, piperacillin and tazobactam, tobramycin, vancomycin |
| Neurotropic drugs | 2 (0.26) | 0 (0.00) | 0.28 | 0 | 0 | Lithium, midazolam | |
| Sedatives | 1 (0.13) | 0 (0.00) | |||||
| Antipsychotics | 1 (0.13) | 0 (0.00) | |||||
| Diabetes | 0 | 1 (0.12) | 0.52 | 0 | 1 (0.12) | 0.52 | Glipizide, glyburide |
| Oral antidiabetics | 0 | 1 (0.12) | 1 (0.12) | ||||
| Other drugs | 4 (0.52) | 0 (0.00) | 0.13 | 1 (0.13) | 1 (0.12) | 0.97 | Allopurinol, famotidine |
| Gastrointestinal drugs | 1 (0.13) | 0 (0.00) | |||||
| Other | 3 (0.39) | 0 (0.00) | 0 | 1 (0.12) | |||
DISCUSSION
We evaluated the use of vendor CPOE for hospitalized patients with renal disease and found that it was associated with a 45% reduction in preventable ADEs related to nephrotoxicity and accumulation of renally excreted medications. The impact of CPOE appeared to be related to the level of associated clinical decision support, where only the most advanced system was associated with benefit. We observed a significant increase in potential ADEs with all levels of intervention. Overall, these findings suggest that vendor‐developed applications with appropriate decision support can reduce the occurrence of renally related preventable ADEs, but careful implementation is needed if the potential ADE rate is to fall.
Many of the benefits of CPOE come from clinical decision support.[11] When applied to patients with renal impairment, CPOE with clinical decision support has been associated with decreased lengths of stay,[16, 27] reduced use of contraindicated medications,[28, 29, 30] improved dosing and drug monitoring,[16, 31, 32] and improved general prescribing practices.[29, 33] Even so, the observed benefit of CPOE on ADE rates has been variable, with some studies reporting reductions,[27, 34] whereas others are unable to detect differences.[16, 31] These studies, however, limited their case definition of ADEs to strictly declining renal function,[16, 31, 34] or adverse events directly resulting from anti‐infective drugs.[27] In contrast, our study accounted for nephrotoxicity and systemic toxicity from drug accumulation. Using this broader definition, we were able to detect large reductions in the rates of preventable ADEs following CPOE adoption.
Successful decision support is simple, intuitive, and provides speedy information that integrates seamlessly into the clinical workflow.[35, 36] However, information delivery, although necessary, is insufficient for improving safety. For instance, passive alerts are often ignored, deferred, or overridden.[30, 37, 38] Demonstrating this, Quartarolo et al. found that informing physicians of the presence of renal impairment using automated reporting of glomerular filtration rates did not change prescribing behavior.[39] In contrast, providing active feedback (with dosing recommendations) was observed to be more useful in effecting change.[40] Chertow et al. further showed that providing an adjusted dose list with a default dose and frequency at the time of order entry for patients with renal insufficiency improved appropriate ordering and was associated with a decreased length of stay.[16] Altogether, these studies help to explain why only CPOE with clinical decision support equipped to provide renally adjusted dosing and monitoring was associated with a reduction in preventable ADEs in our study.
However, in contrast to reports of internally developed systems,[20, 25] potential ADE rates actually rose during the follow‐up portion of our study. These appeared to be chiefly related to customized order sets with the potential of overdosing drugs through therapeutic duplication, a problem that is commonly known to be associated with CPOE (ie, new orders that overlap with other new or active medication orders, which may be the same drug itself or from within the same drug class, with the risk of overdose).[41, 42] Of note, our findings give rise to several key implications. First, hospitals implementing vendor‐developed CPOE systems may be at greater risk of incurring potential ADEs compared to those using home‐grown systems, which have comparatively gone through more cycles of internal refinement. As such, it is necessary to monitor for issues postimplementation and respond with appropriate changes to achieve successful system performance.[35, 36] Second, although the rate of potential ADEs (near misses) increased, preventable ADEs decreased because some of these errors were intercepted, whereas others were averted simply because of chance. Of note, not all potential ADEs have the same potential for injury; more serious cases are more likely to result in actual ADEs (eg, failure to renally dose acetaminophen likely poses less potential for harm than prescribing a full dose of enoxaparin in the setting of severe renal failure). Third, we found that most potential ADEs could have been averted with a combination of basic (dosing guidance and drug‐drug interactions checks) and advanced decision support (medication‐associated laboratory testing and drug‐disease interactions).[43] Therefore, further refinements to existing software are needed to maximize safety outcomes.
Our study has some limitations. This study was not a randomized controlled trial, and thus is subject to potential confounding. Although 6 hospitals were involved at the study inception,[14] one of these hospitals eventually opted not to implement CPOE, and further declined to participate as a control site. Therefore, we cannot exclude confounding from secular trends because we had no contemporaneous control group. However, the introduction of CPOE was the main medication safety‐oriented intervention during the study interval, thus arguing against major confounding by cointervention. Second, even though it is possible that classification bias may have been introduced between the preimplementation and postimplementation portions of our study, especially given the passage of time, it is unlikely. Study personnel underwent training using a curriculum designed to maintain continuity across projects, minimize individual variability, and optimize reproducibility in data collection and classification, as in a number of previous studies.[14, 17, 19, 20, 21] Third, our study is limited by a heterogeneous intervention, as varying levels of decision support were introduced. However, this reflects usual practice and may be construed as a strength as we were able to describe the impact of different types of decision support. Fourth, we enrolled patients with a large spectrum of renal impairment, and our findings are not specific to any particular subgroup. However, our wide recruitment strategy also enhances the generalizability. Finally, our study was restricted to patients who were exposed to potentially nephrotoxic and/or renally cleared drugs. As such, we could not determine whether advanced decision support helped to eliminate the use of some potentially dangerous medications altogether, as these cases would have been excluded from our study. It is possible, therefore, that our study findings underestimate the true benefit of clinical decision support.
In conclusion, vendor CPOE implementation in 5 community hospitals was associated with a 45% reduction in preventable ADE rates among patients with renal impairment. Measurable benefit was associated with advanced decision support capable of lab display, dosing guidance, and medication‐associated laboratory testing. Although the potential benefits of CPOE systems are far reaching, achieving the desired safety benefits will require appropriate decision support, tracking of problems that arise, and systematic approaches to eliminating them.
Acknowledgments
The authors thank Kathy Zigmont, RN, and Cathy Foskett, RN (Brigham and Women's Hospital, Division of General Internal Medicine and Primary Care) for the chart review and data collection at the participating study sites.
Disclosures: The Rx Foundation and Commonwealth Fund supported the study. They commented on its design, but were not involved in data collection, data management, analysis, interpretation, or writing of the manuscript. Dr. Leung is supported by a Clinical Fellowship Award from Alberta Innovates Health Solutions and by a Fellowship Award from the Canadian Institutes for Health Research. Dr. Schiff received financial support from the FDA CPOE Task Order and the Commonwealth Fund. Ms. Keohane served as a consultant to the American College of Obstetrician and Gynecologists and as a reviewer for the VRQC Program. She received honoraria for a presentation on Patient Safety in 2010, sponsored by Abbott Nutrition International, and a lecture on Nurse Interruptions in Medication Administration by Educational Review Systems. Dr. Coffey received an honorarium from Meditech for speaking on social networking at Physician/CIO Forum in 2009. Dr. Kaufman participates in an advisory group with Siemens Medical Solutions. Dr. Zimlichman received support from the Rx Foundation and the Commonwealth Fund. Dr. Bates holds a minority equity position in the privately held company Medicalis, which develops Web‐based decision support for radiology test ordering, and has served as a consultant to Medicalis. He serves as an advisor to Calgary Scientific, which makes technologies that enable mobility within electronic health records. He is on the clinical advisory board for Patient Safety Systems, which provides a set of approaches to help hospitals improve safety. He has received funding support from the Massachusetts Technology Consortium. Ms. Amato, Dr. Simon, Dr. Cadet, Ms. Seger, and Ms. Yoon have no disclosures relevant to this study.
- , , . Drug Prescribing in Renal Failure: Dosing Guidelines for Adults and Children: American College of Physicians; 2007.
- , . Management of drug toxicity in patients with renal insufficiency. Nat Rev Nephrol. 2010;6(6):317–318.
- , , , . Use of renal risk drugs in hospitalized patients with impaired renal function—an underestimated problem? Nephrol Dial Transplant. 2006;21(11):3164–3171.
- , , , et al. Medication misuse in hospitalized patients with renal impairment. Int J Qual Health Care. 2003;15(4):331–335.
- , , , . Impact of a renal drug dosing service on dose adjustment in hospitalized patients with chronic kidney disease. Ann Pharmacother. 2009;43(10):1598–1605.
- , . Drug dosing in chronic kidney disease. Med Clin North Am. 2005;89(3):649–687.
- , , , et al. Systems analysis of adverse drug events. ADE Prevention Study Group. JAMA. 1995;274(1):35–43.
- , , , , , . The epidemiology of prescribing errors: the potential impact of computerized prescriber order entry. Arch Intern Med. 2004;164(7):785–792.
- , , . Factors related to errors in medication prescribing. JAMA. 1997;277(4):312–317.
- , , , et al. Role of computerized physician order entry systems in facilitating medication errors. JAMA. 2005;293(10):1197–1203.
- , , , , . Mixed results in the safety performance of computerized physician order entry. Health Aff (Millwood). 2010;29(4):655–663.
- , , , et al. The effect of computerized physician order entry with clinical decision support on the rates of adverse drug events: a systematic review. J Gen Intern Med. 2008;23(4):451–458.
- , , . The impact of computerized physician medication order entry in hospitalized patients—a systematic review. Int J Med Inform. 2008;77(6):365–376.
- , , , et al. Occurrence of adverse, often preventable, events in community hospitals involving nephrotoxic drugs or those excreted by the kidney. Kidney Int. 2009;76(11):1192–1198.
- , . Prediction of creatinine clearance from serum creatinine. Nephron. 1976;16(1):31–41.
- , , , et al. Guided medication dosing for inpatients with renal insufficiency. JAMA. 2001;286(22):2839–2844.
- , , , , . Adverse drug events and medication errors: detection and classification methods. Qual Saf Health Care. 2004;13(4):306–314.
- , , , , . Relationship between medication errors and adverse drug events. J Gen Intern Med. 1995;10(4):199–205.
- , , , et al. Incidence of adverse drug events and potential adverse drug events. Implications for prevention. ADE Prevention Study Group. JAMA. 1995;274(1):29–34.
- , , , et al. Effect of computerized physician order entry and a team intervention on prevention of serious medication errors. JAMA. 1998;280(15):1311–1316.
- , , , et al. Adverse drug event rates in six community hospitals and the potential impact of computerized physician order entry for prevention. J Gen Intern Med. 2010;25(1):31–38.
- , , . Adverse drug event trigger tool: a practical methodology for measuring medication related harm. Qual Saf Health Care. 2003;12(3):194–200.
- Institute for Healthcare Improvement: IHI Trigger Tool for Measuring Adverse Drug Events. 2011. Available at: http://www.ihi.org/knowledge/Pages/Tools/TriggerToolforMeasuringAdverseDrugEvents.aspx. Accessed February 1, 2013.
- , , , . Renal safety of two analgesics used over the counter: ibuprofen and aspirin. Clin Pharmacol Ther. 1986;40(4):373–377.
- , , , et al. The impact of computerized physician order entry on medication error prevention. J Am Med Inform Assoc. 1999;6(4):313–321.
- , , . Prolonged sulfonylurea‐induced hypoglycemia in diabetic patients with end‐stage renal disease. Am J Kidney Dis. 2000;35(3):500–505.
- , , , et al. A computer‐assisted management program for antibiotics and other antiinfective agents. N Engl J Med. 1998;338(4):232–238.
- , , , et al. Alert system for inappropriate prescriptions relating to patients' clinical condition. Methods Inf Med. 2009;48(6):566–573.
- , , , , , . Computerized clinical decision support during medication ordering for long‐term care residents with renal insufficiency. J Am Med Inform Assoc. 2009;16(4):480–485.
- , , . A trial of automated decision support alerts for contraindicated medications using computerized physician order entry. J Am Med Inform Assoc. 2005;12(3):269–274.
- , , , , . Effects of clinical decision support on initial dosing and monitoring of tobramycin and amikacin. Am J Health Syst Pharm. 2011;68(7):624–632.
- , , , , , . Computerized decision support for medication dosing in renal insufficiency: a randomized, controlled trial. Ann Emerg Med. 2010;56(6):623–629.
- , , , . Implementation of rules based computerised bedside prescribing and administration: intervention study. BMJ. 2000;320(7237):750–753.
- , , , et al. Effect of computer‐based alerts on the treatment and outcomes of hospitalized patients. Arch Intern Med. 1994;154(13):1511–1517.
- , , , et al. Ten commandments for effective clinical decision support: making the practice of evidence‐based medicine a reality. J Am Med Inform Assoc. 2003;10(6):523–530.
- , , . Computerized decision support systems: improving patient safety in nephrology. Nat Rev Nephrol. 2011;7(6):348–355.
- , , , et al. Impact of a computerized alert during physician order entry on medication dosing in patients with renal impairment. Proc AMIA Symp. 2002:577–581.
- , , , et al. A computerized provider order entry intervention for medication safety during acute kidney injury: a quality improvement report. Am J Kidney Dis. 2010;56(5):832–841.
- , , . Reporting of estimated glomerular filtration rate: effect on physician recognition of chronic kidney disease and prescribing practices for elderly hospitalized patients. J Hosp Med. 2007;2(2):74–78.
- , , , , . Drug dosage in patients with renal failure optimized by immediate concurrent feedback. J Gen Intern Med. 2001;16(6):369–375.
- , , , et al. Factors contributing to an increase in duplicate medication order errors after CPOE implementation. J Am Med Inform Assoc. 2011;18(6):774–782.
- , , , et al. Impact of Vendor Computerized Physician Order Entry in Community Hospitals. J Gen Intern Med. 2012;27(7):801–807.
- , , , et al. Medication‐related clinical decision support in computerized provider order entry systems: a review. J Am Med Inform Assoc. 2007;14(1):29–40.
© 2013 Society of Hospital Medicine