User login
Effect of Hospital Readmission Reduction on Patients at Low, Medium, and High Risk of Readmission in the Medicare Population
Given the high cost of readmissions to the healthcare system, there has been a substantial push to reduce readmissions by policymakers.1 Among these is the Hospital Readmissions Reduction Program (HRRP), in which hospitals with higher than expected readmission rates receive reduced payments from Medicare.2 Recent evidence has suggested the success of such policy changes, with multiple reports demonstrating a decrease in 30-day readmission rates in the Medicare population starting in 2010.3-8
Initiatives to reduce readmissions can also have an effect on total number of admissions.9,10 Indeed, along with the recent reduction in readmission, there has been a reduction in all admissions among Medicare beneficiaries.11,12 Some studies have found that as admissions have decreased, the burden of comorbidity has increased among hospitalized patients,3,11 suggesting that hospitals may be increasingly filled with patients at high risk of readmission. However, whether readmission risk among hospitalized patients has changed remains unknown, and understanding changes in risk profile could help inform which patients to target with future interventions to reduce readmissions.
Hospital efforts to reduce readmissions may have differential effects on types of patients by risk. For instance, low-intensity, system-wide interventions such as standardized discharge instructions or medicine reconciliation may have a stronger effect on patients at relatively low risk of readmission who may have a few important drivers of readmission that are easily overcome. Alternatively, the impact of intensive care transitions management might be greatest for high-risk patients, who have the most need for postdischarge medications, follow-up, and self-care.
The purpose of this study was therefore twofold: (1) to observe changes in average monthly risk of readmission among hospitalized Medicare patients and (2) to examine changes in readmission rates for Medicare patients at various risk of readmission. We hypothesized that readmission risk in the Medicare population would increase in recent years, as overall number of admissions and readmissions have fallen.7,11 Additionally, we hypothesized that standardized readmission rates would decline less in highest risk patients as compared with the lowest risk patients because transitional care interventions may not be able to mitigate the large burden of comorbidity and social issues present in many high-risk patients.13,14
METHODS
We performed a retrospective cohort study of hospitalizations to US nonfederal short-term acute care facilities by Medicare beneficiaries between January 2009 and June 2015. The design involved 4 steps. First, we estimated a predictive model for unplanned readmissions within 30 days of discharge. Second, we assigned each hospitalization a predicted risk of readmission based on the model. Third, we studied trends in mean predicted risk of readmission during the study period. Fourth, we examined trends in observed to expected (O/E) readmission for hospitalizations in the lowest, middle, and highest categories of predicted risk of readmission to determine whether reductions in readmissions were more substantial in certain risk groups than in others.
Data were obtained from the Centers for Medicare and Medicaid Services (CMS) Inpatient Standard Analytic File and the Medicare Enrollment Data Base. We included hospitalizations of fee-for-service Medicare beneficiaries age ≥65 with continuous enrollment in Part A Medicare fee-for-service for at least 1 year prior and 30 days after the hospitalization.15 Hospitalizations with a discharge disposition of death, transfer to another acute hospital, and left against medical advice (AMA) were excluded. We also excluded patients with enrollment in hospice care prior to hospitalization. We excluded hospitalizations in June 2012 because of an irregularity in data availability for that month.
Hospitalizations were categorized into 5 specialty cohorts according to service line. The 5 cohorts were those used for the CMS hospital-wide readmission measure and included surgery/gynecology, medicine, cardiovascular, cardiorespiratory, and neurology.15 Among the 3 clinical conditions tracked as part of HRRP, heart failure and pneumonia were a subset of the cardiorespiratory cohort, while acute myocardial infarction was a subset of the cardiovascular cohort. Our use of cohorts was threefold: first, the average risk of readmission differs substantially across these cohorts, so pooling them produces heterogeneous risk strata; second, risk variables perform differently in different cohorts, so one single model may not be as accurate for calculating risk; and, third, the use of disease cohorts makes our results comparable to the CMS model and similar to other readmission studies in Medicare.7,8,15
For development of the risk model, the outcome was 30-day unplanned hospital readmission. Planned readmissions were excluded; these were defined by the CMS algorithm as readmissions in which a typically planned procedure occurred in a hospitalization with a nonacute principal diagnosis.16 Independent variables included age and comorbidities in the final hospital-wide readmission models for each of the 5 specialty cohorts.15 In order to produce the best possible individual risk prediction for each patient, we added additional independent variables that CMS avoids for hospital quality measurement purposes but that contribute to risk of readmission: sex, race, dual eligibility status, number of prior AMA discharges, intensive care unit stay during current hospitalization, coronary care unit stay during current hospitalization, and hospitalization in the prior 30, 90, and 180 days. We also included an indicator variable for hospitalizations with more than 9 discharge diagnosis codes on or after January 2011, the time at which Medicare allowed an increase of the number of International Classification of Diseases, 9th Revision-Clinical Modification diagnosis billing codes from 9 to 25.17 This indicator adjusts for the increased availability of comorbidity codes, which might otherwise inflate the predicted risk relative to hospitalizations prior to that date.
Based on the risk models, each hospitalization was assigned a predicted risk of readmission. For each specialty cohort, we pooled all hospitalizations across all study years and divided them into risk quintiles. We categorized hospitalizations as high risk if in the highest quintile, medium risk if in the middle 3 quintiles, and low risk if in the lowest quintile of predicted risk for all study hospitalizations in a given specialty cohort.
For our time trend analyses, we studied 2 outcomes: monthly mean predicted risk and monthly ratio of observed readmissions to expected readmissions for patients in the lowest, middle, and highest categories of predicted risk of readmission. We studied monthly predicted risk to determine whether the average readmission risk of patients was changing over time as admission and readmission rates were declining. We studied the ratio of O/E readmissions to determine whether the decline in overall readmissions was more substantial in particular risk strata; we used the ratio of O/E readmissions, which measures number of readmissions divided by number of readmissions predicted by the model, rather than crude observed readmissions, as O/E readmissions account for any changes in risk profiles over time within each risk stratum. Independent variables in our trend analyses were year—entered as a continuous variable—and indicators for postintroduction of the Affordable Care Act (ACA, March 2010) and for postintroduction of HRRP (October 2012); these time indicators were included because of prior studies demonstrating that the introduction of ACA was associated with a decrease from baseline in readmission rates, which leveled off after introduction of HRRP.7 We also included an indicator for calendar quarter to account for seasonal effects.
Statistical Analysis
We developed generalized estimating equation models to predict 30-day unplanned readmission for each of the 5 specialty cohorts. The 5 models were fit using all patients in each cohort for the included time period and were adjusted for clustering by hospital. We assessed discrimination by calculating area under the receiver operating characteristic curve (AUC) for the 5 models; the AUCs measured the models’ ability to distinguish patients who were readmitted versus those who were not.18 We also calculated AUCs for each year to examine model performance over time.
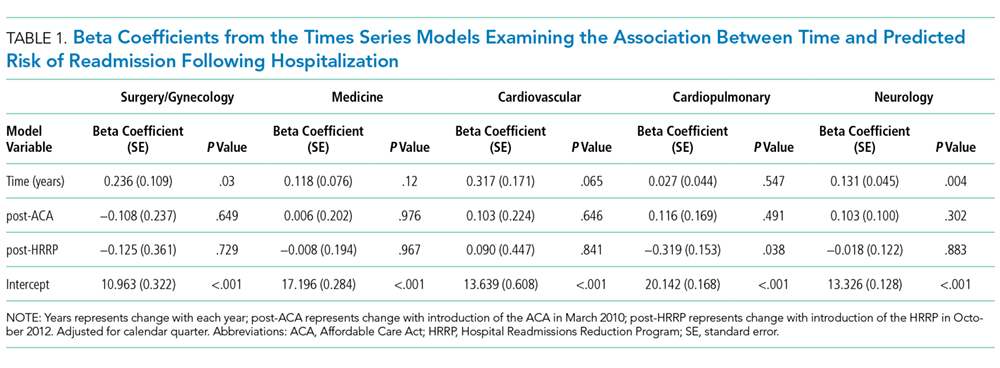
Using these models, we calculated predicted risk for each hospitalization and averaged these to obtain mean predicted risk for each specialty cohort for each month. To test for trends in mean risk, we estimated 5 time series models, one for each cohort, with the dependent variable of monthly mean predicted risk. For each cohort, we first estimated a series of 12 empty autoregressive models, each with a different autoregressive term (1, 2...12). For each model, we calculated χ2 for the test that the autocorrelation was 0; based on a comparison of chi-squared values, we specified an autocorrelation of 1 month for all models. Accordingly, a 1-month lag was used to estimate one final model for each cohort. Independent variables included year and indicators for post-ACA and post-HRRP; these variables captured the effect of trends over time and the introduction of these policy changes, respectively.19
To determine whether changes in risk over time were a result of changes in particular risk groups, we categorized hospitalizations into risk strata based on quintiles of predicted risk for each specialty cohort for the entire study period. For each individual year, we calculated the proportion of hospitalizations in the highest, middle, and lowest readmission risk strata for each cohort.
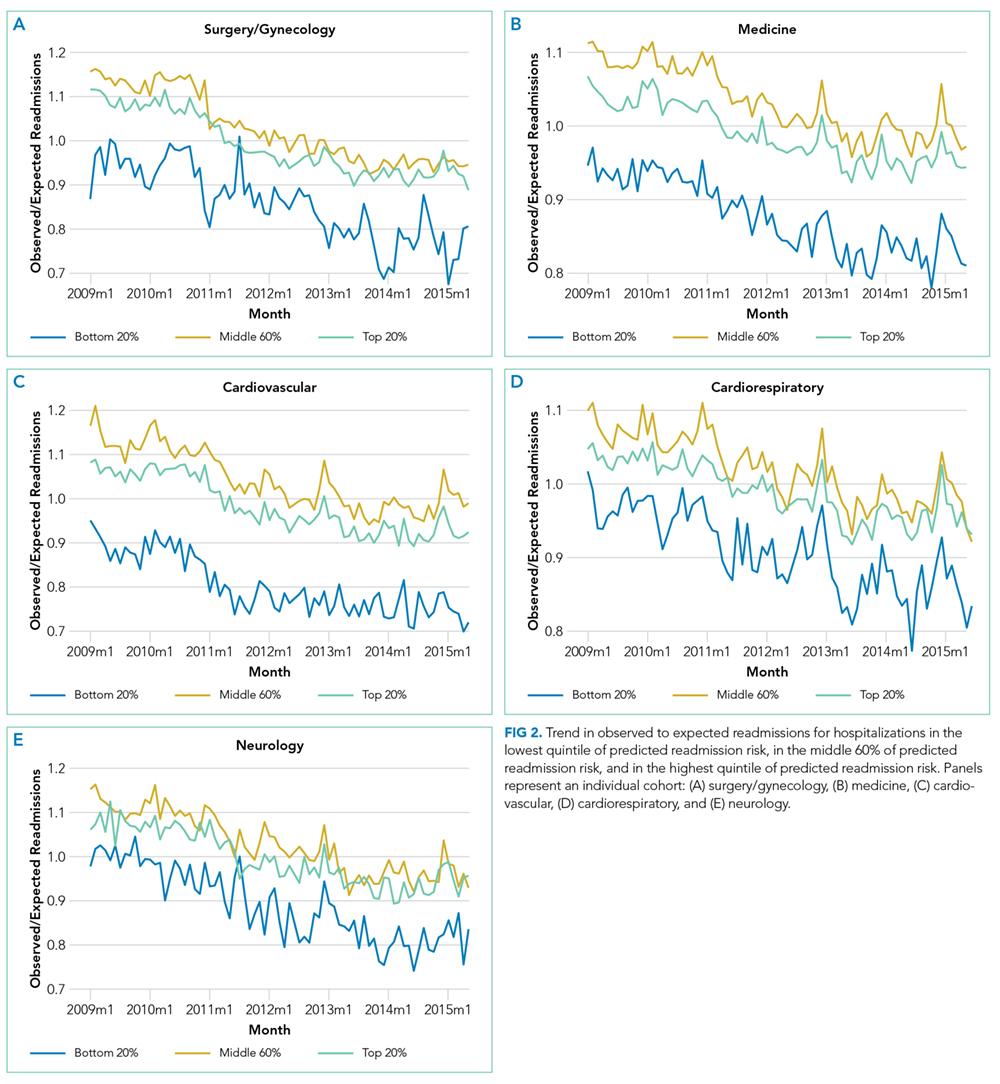
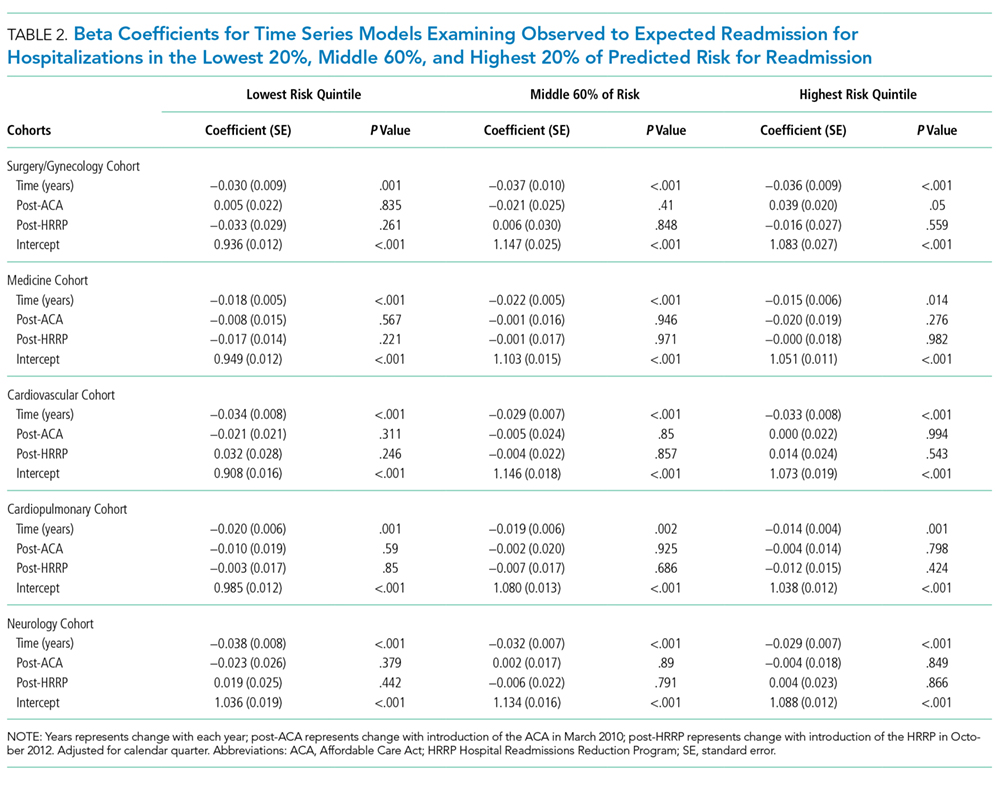
We calculated the monthly ratio of O/E readmission for hospitalizations in the lowest 20%, middle 60%, and highest 20% of readmission risk by month; O/E reflects the excess or deficit observed events relative to the number predicted by the model. Using this monthly O/E as the dependent variable, we developed autoregressive time series models as above, again with a 1-month lag, for each of these 3 risk strata in each cohort. As before, independent variables were year as a continuous variable, indicator variables for post-ACA and post-HRRP, and a categorical variable for calendar quarter.
All analyses were done in SAS version 9.3 (SAS Institute Inc., Cary, NC) and Stata version 14.2 (StataCorp LLC, College Station, TX).
RESULTS
We included 47,288,961 hospitalizations in the study, of which 11,231,242 (23.8%) were in the surgery/gynecology cohort, 19,548,711 (41.3%) were in the medicine cohort, 5,433,125 (11.5%) were in the cardiovascular cohort, 8,179,691 (17.3%) were in the cardiorespiratory cohort, and 2,896,192 (6.1%) were in the neurology cohort. The readmission rate was 16.2% (n = 7,642,161) overall, with the highest rates observed in the cardiorespiratory (20.5%) and medicine (17.6%) cohorts and the lowest rates observed in the surgery/gynecology (11.8%) and neurology (13.8%) cohorts.
The final predictive models for each cohort ranged in number of parameters from 56 for the cardiorespiratory cohort to 264 for the surgery/gynecology cohort. The models had AUCs of 0.70, 0.65, 0.67, 0.65, and 0.63 for the surgery/gynecology, medicine, cardiovascular, cardiorespiratory, and neurology cohorts, respectively; AUCs remained fairly stable over time for all disease cohorts (Appendix Table 1).
DISCUSSION
A number of mechanisms may account for the across-the-board improvements in readmission reduction. Many hospitals have instituted system-wide interventions, including patient education, medicine reconciliation, and early postdischarge follow-up,20 which may have reduced readmissions across all patient risk strata. Alternatively, hospitals may have implemented interventions that disproportionally benefited low-risk patients while simultaneously utilizing interventions that only benefited high-risk patients. For instance, increasing threshold for admission7 may have the greatest effect on low-risk patients who could be most easily managed at home, while many intensive transitional care interventions have been developed to target only high-risk patients.21,22
With the introduction of HRRP, there have been a number of concerns about the readmission measure used to penalize hospitals for high readmission rates. One major concern has been that the readmission metric may be flawed in its ability to capture continued improvement related to readmission.23 Some have suggested that with better population health management, admissions will decrease, patient risk of the remaining patients will increase, and hospitals will be increasingly filled with patients who have high likelihood of readmission. This potential for increased risk with HRRP was suggested by a recent study that found that comorbidities increased in hospitalized Medicare beneficiaries between 2010 and 2013.11 Our results were mixed in supporting this potential phenomenon because we examined global risk of readmission and found that some of the cohorts had increased risk over time while others did not. Others have expressed concern that readmission measure does not account for socioeconomic status, which has been associated with readmission rates.24-27 Although we did not directly examine socioeconomic status in our study, we found that hospitals have been able to reduce readmission across all levels of risk, which includes markers of socioeconomic status, including race and Medicaid eligibility status.
Although we hypothesized that readmission risk would increase as number of hospitalizations decreased over time, we found no increase in readmission risk among the cohorts with HRRP diagnoses that had the largest decrease in readmission rates.7,8 Conversely, readmission risk did increase—with a concurrent increase in the proportion of high-risk hospitalizations—in the surgery/gynecology and neurology cohorts that were not subject to HRRP penalties. Nonetheless, rehospitalizations were reduced for all risk categories in these 2 cohorts. Notably, surgery/gynecology and neurology had the lowest readmission rates overall. These findings suggest that initiatives to prevent initial hospitalizations, such as increasing the threshold for postoperative admission, may have had a greater effect on low- versus high-risk patients in low-risk hospitalizations. However, once a patient is hospitalized, multidisciplinary strategies appear to be effective at reducing readmissions for all risk classes in these cohorts.
For the 3 cohorts in which we observed an increase in readmission risk among hospitalized patients, the risk appeared to increase in early 2011. This time was about 10 months after passage of ACA, the timing of which was previously associated with a drop in readmission rates,7,8 but well before HRRP went into effect in October 2012. The increase in readmission risk coincided with an increase in the number of diagnostic codes that could be included on a hospital claim to Medicare.17 This increase in allowable codes allowed us to capture more diagnoses for some patients, potentially resulting in an increase in apparent predicted risk of readmissions. While we adjusted for this in our predictive models, we may not have fully accounted for differences in risk related to coding change. As a result, some of the observed differences in risk in our study may be attributable to coding differences. More broadly, studies demonstrating the success of HRRP have typically examined risk-adjusted rates of readmission.3,7 It is possible that a small portion of the observed reduction in risk-adjusted readmission rates may be related to the increase in predicted risk of readmission observed in our study. Future assessment of trends in readmission during this period should consider accounting for change in the number of allowed billing codes.
Other limitations should be considered in the interpretation of this study. First, like many predictive models for readmission,14 ours had imperfect discrimination, which could affect our results. Second, our study was based on older Medicare patients, so findings may not be applicable to younger patients. Third, while we accounted for surrogates for socioeconomic status, including dual eligibility and race, our models lacked other socioeconomic and community factors that can influence readmission.24-26 Nonetheless, 1 study suggested that easily measured socioeconomic factors may not have a strong influence on the readmission metric used by Medicare.28 Fourth, while our study included over 47 million hospitalizations, our time trend analyses used calendar month as the primary independent variable. As our study included 77 months, we may not have had sufficient power to detect small changes in risk over time.
Medicare readmissions have declined steadily in recent years, presumably at least partly in response to policy changes including HRRP. We found that hospitals have been effective at reducing readmissions across a range of patient risk strata and clinical conditions. As a result, the overall risk of readmission for hospitalized patients has remained constant for some but not all conditions. Whether institutions can continue to reduce readmission rates for most types of patients remains to be seen.
Acknowledgments
This study was supported by the Agency for Healthcare Research and Quality (AHRQ) grant R01HS022882. Dr. Blecker was supported by the AHRQ grant K08HS23683. The authors would like to thank Shawn Hoke and Jane Padikkala for administrative support.
Disclosure
This study was supported by the Agency for Healthcare Research and Quality (AHRQ) grants R01HS022882 and K08HS23683. The authors have no conflicts to report.
1. Jha AK. Seeking Rational Approaches to Fixing Hospital Readmissions. JAMA. 2015;314(16):1681-1682. PubMed
2. Centers for Medicare & Medicaid Services. Readmissions Reduction Program. https://www.cms.gov/Medicare/Medicare-Fee-for-Service-Payment/AcuteInpatientPPS/Readmissions-Reduction-Program.html. Accessed on January 17, 2017.
3. Suter LG, Li SX, Grady JN, et al. National patterns of risk-standardized mortality and readmission after hospitalization for acute myocardial infarction, heart failure, and pneumonia: update on publicly reported outcomes measures based on the 2013 release. J Gen Intern Med. 2014;29(10):1333-1340. PubMed
4. Gerhardt G, Yemane A, Hickman P, Oelschlaeger A, Rollins E, Brennan N. Medicare readmission rates showed meaningful decline in 2012. Medicare Medicaid Res Rev. 2013;3(2):pii:mmrr.003.02.b01. PubMed
5. Centers for Medicare and Medicaid Services. New Data Shows Affordable Care Act Reforms Are Leading to Lower Hospital Readmission Rates for Medicare Beneficiaries. http://blog.cms.gov/2013/12/06/new-data-shows-affordable-care-act-reforms-are-leading-to-lower-hospital-readmission-rates-for-medicare-beneficiaries/. Accessed on January 17, 2017.
6. Krumholz HM, Normand SL, Wang Y. Trends in hospitalizations and outcomes for acute cardiovascular disease and stroke, 1999-2011. Circulation. 2014;130(12):966-975. PubMed
7. Zuckerman RB, Sheingold SH, Orav EJ, Ruhter J, Epstein AM. Readmissions, Observation, and the Hospital Readmissions Reduction Program. N Engl J Med. 2016;374(16):1543-1551. PubMed
8. Desai NR, Ross JS, Kwon JY, et al. Association Between Hospital Penalty Status Under the Hospital Readmission Reduction Program and Readmission Rates for Target and Nontarget Conditions. JAMA. 2016;316(24):2647-2656. PubMed
9. Brock J, Mitchell J, Irby K, et al. Association between quality improvement for care transitions in communities and rehospitalizations among Medicare beneficiaries. JAMA. 2013;309(4):381-391. PubMed
10. Jencks S. Protecting Hospitals That Improve Population Health. http://medicaring.org/2014/12/16/protecting-hospitals/. Accessed on January 5, 2017.
11. Dharmarajan K, Qin L, Lin Z, et al. Declining Admission Rates And Thirty-Day Readmission Rates Positively Associated Even Though Patients Grew Sicker Over Time. Health Aff (Millwood). 2016;35(7):1294-1302. PubMed
12. Krumholz HM, Nuti SV, Downing NS, Normand SL, Wang Y. Mortality, Hospitalizations, and Expenditures for the Medicare Population Aged 65 Years or Older, 1999-2013. JAMA. 2015;314(4):355-365. PubMed
13. Amarasingham R, Moore BJ, Tabak YP, et al. An automated model to identify heart failure patients at risk for 30-day readmission or death using electronic medical record data. Med Care. 2010;48(11):981-988. PubMed
14. Kansagara D, Englander H, Salanitro A, et al. Risk prediction models for hospital readmission: a systematic review. JAMA. 2011;306(15):1688-1698. PubMed
15. Horwitz LI, Partovian C, Lin Z, et al. Development and use of an administrative claims measure for profiling hospital-wide performance on 30-day unplanned readmission. Ann Intern Med. 2014;161(10 Suppl):S66-S75. PubMed
16. 2016 Condition-Specific Measures Updates and Specifications Report Hospital-Level 30-Day Risk-Standardized Readmission Measures. https://www.cms.gov/Medicare/Quality-Initiatives-Patient-Assessment-Instruments/HospitalQualityInits/Downloads/AMI-HF-PN-COPD-and-Stroke-Readmission-Updates.zip. Accessed on January 19, 2017.
17. Centers for Medicare & Medicaid Services. Pub 100-04 Medicare Claims Processing, Transmittal 2028. https://www.cms.gov/Regulations-and-Guidance/Guidance/Transmittals/downloads/R2028CP.pdf. Accessed on November 28, 2016.
18. Martens FK, Tonk EC, Kers JG, Janssens AC. Small improvement in the area under the receiver operating characteristic curve indicated small changes in predicted risks. J Clin Epidemiol. 2016;79:159-164. PubMed
19. Blecker S, Goldfeld K, Park H, et al. Impact of an Intervention to Improve Weekend Hospital Care at an Academic Medical Center: An Observational Study. J Gen Intern Med. 2015;30(11):1657-1664. PubMed
20. Hansen LO, Young RS, Hinami K, Leung A, Williams MV. Interventions to reduce 30-day rehospitalization: a systematic review. Ann Intern Med. 2011;155(8):520-528. PubMed
21. Cavanaugh JJ, Jones CD, Embree G, et al. Implementation Science Workshop: primary care-based multidisciplinary readmission prevention program. J Gen Intern Med. 2014;29(5):798-804. PubMed
22. Jenq GY, Doyle MM, Belton BM, Herrin J, Horwitz LI. Quasi-Experimental Evaluation of the Effectiveness of a Large-Scale Readmission Reduction Program. JAMA Intern Med. 2016;176(5):681-690. PubMed
23. Lynn J, Jencks S. A Dangerous Malfunction in the Measure of Readmission Reduction. http://medicaring.org/2014/08/26/malfunctioning-metrics/. Accessed on January 17, 2017.
24. Calvillo-King L, Arnold D, Eubank KJ, et al. Impact of social factors on risk of readmission or mortality in pneumonia and heart failure: systematic review. J Gen Intern Med. 2013;28(2):269-282. PubMed
25. Barnett ML, Hsu J, McWilliams JM. Patient Characteristics and Differences in Hospital Readmission Rates. JAMA Intern Med. 2015;175(11):1803-1812. PubMed
26. Singh S, Lin YL, Kuo YF, Nattinger AB, Goodwin JS. Variation in the risk of readmission among hospitals: the relative contribution of patient, hospital and inpatient provider characteristics. J Gen Intern Med. 2014;29(4):572-578. PubMed
27. American Hospital Association. American Hospital Association (AHA) Detailed Comments on the Inpatient Prospective Payment System (PPS) Proposed Rule for Fiscal Year (FY) 2016. http://www.aha.org/advocacy-issues/letter/2015/150616-cl-cms1632-p-ipps.pdf. Accessed on January 10, 2017.
28. Bernheim SM, Parzynski CS, Horwitz L, et al. Accounting For Patients’ Socioeconomic Status Does Not Change Hospital Readmission Rates. Health Aff (Millwood). 2016;35(8):1461-1470. PubMed
Given the high cost of readmissions to the healthcare system, there has been a substantial push to reduce readmissions by policymakers.1 Among these is the Hospital Readmissions Reduction Program (HRRP), in which hospitals with higher than expected readmission rates receive reduced payments from Medicare.2 Recent evidence has suggested the success of such policy changes, with multiple reports demonstrating a decrease in 30-day readmission rates in the Medicare population starting in 2010.3-8
Initiatives to reduce readmissions can also have an effect on total number of admissions.9,10 Indeed, along with the recent reduction in readmission, there has been a reduction in all admissions among Medicare beneficiaries.11,12 Some studies have found that as admissions have decreased, the burden of comorbidity has increased among hospitalized patients,3,11 suggesting that hospitals may be increasingly filled with patients at high risk of readmission. However, whether readmission risk among hospitalized patients has changed remains unknown, and understanding changes in risk profile could help inform which patients to target with future interventions to reduce readmissions.
Hospital efforts to reduce readmissions may have differential effects on types of patients by risk. For instance, low-intensity, system-wide interventions such as standardized discharge instructions or medicine reconciliation may have a stronger effect on patients at relatively low risk of readmission who may have a few important drivers of readmission that are easily overcome. Alternatively, the impact of intensive care transitions management might be greatest for high-risk patients, who have the most need for postdischarge medications, follow-up, and self-care.
The purpose of this study was therefore twofold: (1) to observe changes in average monthly risk of readmission among hospitalized Medicare patients and (2) to examine changes in readmission rates for Medicare patients at various risk of readmission. We hypothesized that readmission risk in the Medicare population would increase in recent years, as overall number of admissions and readmissions have fallen.7,11 Additionally, we hypothesized that standardized readmission rates would decline less in highest risk patients as compared with the lowest risk patients because transitional care interventions may not be able to mitigate the large burden of comorbidity and social issues present in many high-risk patients.13,14
METHODS
We performed a retrospective cohort study of hospitalizations to US nonfederal short-term acute care facilities by Medicare beneficiaries between January 2009 and June 2015. The design involved 4 steps. First, we estimated a predictive model for unplanned readmissions within 30 days of discharge. Second, we assigned each hospitalization a predicted risk of readmission based on the model. Third, we studied trends in mean predicted risk of readmission during the study period. Fourth, we examined trends in observed to expected (O/E) readmission for hospitalizations in the lowest, middle, and highest categories of predicted risk of readmission to determine whether reductions in readmissions were more substantial in certain risk groups than in others.
Data were obtained from the Centers for Medicare and Medicaid Services (CMS) Inpatient Standard Analytic File and the Medicare Enrollment Data Base. We included hospitalizations of fee-for-service Medicare beneficiaries age ≥65 with continuous enrollment in Part A Medicare fee-for-service for at least 1 year prior and 30 days after the hospitalization.15 Hospitalizations with a discharge disposition of death, transfer to another acute hospital, and left against medical advice (AMA) were excluded. We also excluded patients with enrollment in hospice care prior to hospitalization. We excluded hospitalizations in June 2012 because of an irregularity in data availability for that month.
Hospitalizations were categorized into 5 specialty cohorts according to service line. The 5 cohorts were those used for the CMS hospital-wide readmission measure and included surgery/gynecology, medicine, cardiovascular, cardiorespiratory, and neurology.15 Among the 3 clinical conditions tracked as part of HRRP, heart failure and pneumonia were a subset of the cardiorespiratory cohort, while acute myocardial infarction was a subset of the cardiovascular cohort. Our use of cohorts was threefold: first, the average risk of readmission differs substantially across these cohorts, so pooling them produces heterogeneous risk strata; second, risk variables perform differently in different cohorts, so one single model may not be as accurate for calculating risk; and, third, the use of disease cohorts makes our results comparable to the CMS model and similar to other readmission studies in Medicare.7,8,15
For development of the risk model, the outcome was 30-day unplanned hospital readmission. Planned readmissions were excluded; these were defined by the CMS algorithm as readmissions in which a typically planned procedure occurred in a hospitalization with a nonacute principal diagnosis.16 Independent variables included age and comorbidities in the final hospital-wide readmission models for each of the 5 specialty cohorts.15 In order to produce the best possible individual risk prediction for each patient, we added additional independent variables that CMS avoids for hospital quality measurement purposes but that contribute to risk of readmission: sex, race, dual eligibility status, number of prior AMA discharges, intensive care unit stay during current hospitalization, coronary care unit stay during current hospitalization, and hospitalization in the prior 30, 90, and 180 days. We also included an indicator variable for hospitalizations with more than 9 discharge diagnosis codes on or after January 2011, the time at which Medicare allowed an increase of the number of International Classification of Diseases, 9th Revision-Clinical Modification diagnosis billing codes from 9 to 25.17 This indicator adjusts for the increased availability of comorbidity codes, which might otherwise inflate the predicted risk relative to hospitalizations prior to that date.
Based on the risk models, each hospitalization was assigned a predicted risk of readmission. For each specialty cohort, we pooled all hospitalizations across all study years and divided them into risk quintiles. We categorized hospitalizations as high risk if in the highest quintile, medium risk if in the middle 3 quintiles, and low risk if in the lowest quintile of predicted risk for all study hospitalizations in a given specialty cohort.
For our time trend analyses, we studied 2 outcomes: monthly mean predicted risk and monthly ratio of observed readmissions to expected readmissions for patients in the lowest, middle, and highest categories of predicted risk of readmission. We studied monthly predicted risk to determine whether the average readmission risk of patients was changing over time as admission and readmission rates were declining. We studied the ratio of O/E readmissions to determine whether the decline in overall readmissions was more substantial in particular risk strata; we used the ratio of O/E readmissions, which measures number of readmissions divided by number of readmissions predicted by the model, rather than crude observed readmissions, as O/E readmissions account for any changes in risk profiles over time within each risk stratum. Independent variables in our trend analyses were year—entered as a continuous variable—and indicators for postintroduction of the Affordable Care Act (ACA, March 2010) and for postintroduction of HRRP (October 2012); these time indicators were included because of prior studies demonstrating that the introduction of ACA was associated with a decrease from baseline in readmission rates, which leveled off after introduction of HRRP.7 We also included an indicator for calendar quarter to account for seasonal effects.
Statistical Analysis
We developed generalized estimating equation models to predict 30-day unplanned readmission for each of the 5 specialty cohorts. The 5 models were fit using all patients in each cohort for the included time period and were adjusted for clustering by hospital. We assessed discrimination by calculating area under the receiver operating characteristic curve (AUC) for the 5 models; the AUCs measured the models’ ability to distinguish patients who were readmitted versus those who were not.18 We also calculated AUCs for each year to examine model performance over time.
Using these models, we calculated predicted risk for each hospitalization and averaged these to obtain mean predicted risk for each specialty cohort for each month. To test for trends in mean risk, we estimated 5 time series models, one for each cohort, with the dependent variable of monthly mean predicted risk. For each cohort, we first estimated a series of 12 empty autoregressive models, each with a different autoregressive term (1, 2...12). For each model, we calculated χ2 for the test that the autocorrelation was 0; based on a comparison of chi-squared values, we specified an autocorrelation of 1 month for all models. Accordingly, a 1-month lag was used to estimate one final model for each cohort. Independent variables included year and indicators for post-ACA and post-HRRP; these variables captured the effect of trends over time and the introduction of these policy changes, respectively.19
To determine whether changes in risk over time were a result of changes in particular risk groups, we categorized hospitalizations into risk strata based on quintiles of predicted risk for each specialty cohort for the entire study period. For each individual year, we calculated the proportion of hospitalizations in the highest, middle, and lowest readmission risk strata for each cohort.
We calculated the monthly ratio of O/E readmission for hospitalizations in the lowest 20%, middle 60%, and highest 20% of readmission risk by month; O/E reflects the excess or deficit observed events relative to the number predicted by the model. Using this monthly O/E as the dependent variable, we developed autoregressive time series models as above, again with a 1-month lag, for each of these 3 risk strata in each cohort. As before, independent variables were year as a continuous variable, indicator variables for post-ACA and post-HRRP, and a categorical variable for calendar quarter.
All analyses were done in SAS version 9.3 (SAS Institute Inc., Cary, NC) and Stata version 14.2 (StataCorp LLC, College Station, TX).
RESULTS
We included 47,288,961 hospitalizations in the study, of which 11,231,242 (23.8%) were in the surgery/gynecology cohort, 19,548,711 (41.3%) were in the medicine cohort, 5,433,125 (11.5%) were in the cardiovascular cohort, 8,179,691 (17.3%) were in the cardiorespiratory cohort, and 2,896,192 (6.1%) were in the neurology cohort. The readmission rate was 16.2% (n = 7,642,161) overall, with the highest rates observed in the cardiorespiratory (20.5%) and medicine (17.6%) cohorts and the lowest rates observed in the surgery/gynecology (11.8%) and neurology (13.8%) cohorts.
The final predictive models for each cohort ranged in number of parameters from 56 for the cardiorespiratory cohort to 264 for the surgery/gynecology cohort. The models had AUCs of 0.70, 0.65, 0.67, 0.65, and 0.63 for the surgery/gynecology, medicine, cardiovascular, cardiorespiratory, and neurology cohorts, respectively; AUCs remained fairly stable over time for all disease cohorts (Appendix Table 1).
DISCUSSION
A number of mechanisms may account for the across-the-board improvements in readmission reduction. Many hospitals have instituted system-wide interventions, including patient education, medicine reconciliation, and early postdischarge follow-up,20 which may have reduced readmissions across all patient risk strata. Alternatively, hospitals may have implemented interventions that disproportionally benefited low-risk patients while simultaneously utilizing interventions that only benefited high-risk patients. For instance, increasing threshold for admission7 may have the greatest effect on low-risk patients who could be most easily managed at home, while many intensive transitional care interventions have been developed to target only high-risk patients.21,22
With the introduction of HRRP, there have been a number of concerns about the readmission measure used to penalize hospitals for high readmission rates. One major concern has been that the readmission metric may be flawed in its ability to capture continued improvement related to readmission.23 Some have suggested that with better population health management, admissions will decrease, patient risk of the remaining patients will increase, and hospitals will be increasingly filled with patients who have high likelihood of readmission. This potential for increased risk with HRRP was suggested by a recent study that found that comorbidities increased in hospitalized Medicare beneficiaries between 2010 and 2013.11 Our results were mixed in supporting this potential phenomenon because we examined global risk of readmission and found that some of the cohorts had increased risk over time while others did not. Others have expressed concern that readmission measure does not account for socioeconomic status, which has been associated with readmission rates.24-27 Although we did not directly examine socioeconomic status in our study, we found that hospitals have been able to reduce readmission across all levels of risk, which includes markers of socioeconomic status, including race and Medicaid eligibility status.
Although we hypothesized that readmission risk would increase as number of hospitalizations decreased over time, we found no increase in readmission risk among the cohorts with HRRP diagnoses that had the largest decrease in readmission rates.7,8 Conversely, readmission risk did increase—with a concurrent increase in the proportion of high-risk hospitalizations—in the surgery/gynecology and neurology cohorts that were not subject to HRRP penalties. Nonetheless, rehospitalizations were reduced for all risk categories in these 2 cohorts. Notably, surgery/gynecology and neurology had the lowest readmission rates overall. These findings suggest that initiatives to prevent initial hospitalizations, such as increasing the threshold for postoperative admission, may have had a greater effect on low- versus high-risk patients in low-risk hospitalizations. However, once a patient is hospitalized, multidisciplinary strategies appear to be effective at reducing readmissions for all risk classes in these cohorts.
For the 3 cohorts in which we observed an increase in readmission risk among hospitalized patients, the risk appeared to increase in early 2011. This time was about 10 months after passage of ACA, the timing of which was previously associated with a drop in readmission rates,7,8 but well before HRRP went into effect in October 2012. The increase in readmission risk coincided with an increase in the number of diagnostic codes that could be included on a hospital claim to Medicare.17 This increase in allowable codes allowed us to capture more diagnoses for some patients, potentially resulting in an increase in apparent predicted risk of readmissions. While we adjusted for this in our predictive models, we may not have fully accounted for differences in risk related to coding change. As a result, some of the observed differences in risk in our study may be attributable to coding differences. More broadly, studies demonstrating the success of HRRP have typically examined risk-adjusted rates of readmission.3,7 It is possible that a small portion of the observed reduction in risk-adjusted readmission rates may be related to the increase in predicted risk of readmission observed in our study. Future assessment of trends in readmission during this period should consider accounting for change in the number of allowed billing codes.
Other limitations should be considered in the interpretation of this study. First, like many predictive models for readmission,14 ours had imperfect discrimination, which could affect our results. Second, our study was based on older Medicare patients, so findings may not be applicable to younger patients. Third, while we accounted for surrogates for socioeconomic status, including dual eligibility and race, our models lacked other socioeconomic and community factors that can influence readmission.24-26 Nonetheless, 1 study suggested that easily measured socioeconomic factors may not have a strong influence on the readmission metric used by Medicare.28 Fourth, while our study included over 47 million hospitalizations, our time trend analyses used calendar month as the primary independent variable. As our study included 77 months, we may not have had sufficient power to detect small changes in risk over time.
Medicare readmissions have declined steadily in recent years, presumably at least partly in response to policy changes including HRRP. We found that hospitals have been effective at reducing readmissions across a range of patient risk strata and clinical conditions. As a result, the overall risk of readmission for hospitalized patients has remained constant for some but not all conditions. Whether institutions can continue to reduce readmission rates for most types of patients remains to be seen.
Acknowledgments
This study was supported by the Agency for Healthcare Research and Quality (AHRQ) grant R01HS022882. Dr. Blecker was supported by the AHRQ grant K08HS23683. The authors would like to thank Shawn Hoke and Jane Padikkala for administrative support.
Disclosure
This study was supported by the Agency for Healthcare Research and Quality (AHRQ) grants R01HS022882 and K08HS23683. The authors have no conflicts to report.
1. Jha AK. Seeking Rational Approaches to Fixing Hospital Readmissions. JAMA. 2015;314(16):1681-1682. PubMed
2. Centers for Medicare & Medicaid Services. Readmissions Reduction Program. https://www.cms.gov/Medicare/Medicare-Fee-for-Service-Payment/AcuteInpatientPPS/Readmissions-Reduction-Program.html. Accessed on January 17, 2017.
3. Suter LG, Li SX, Grady JN, et al. National patterns of risk-standardized mortality and readmission after hospitalization for acute myocardial infarction, heart failure, and pneumonia: update on publicly reported outcomes measures based on the 2013 release. J Gen Intern Med. 2014;29(10):1333-1340. PubMed
4. Gerhardt G, Yemane A, Hickman P, Oelschlaeger A, Rollins E, Brennan N. Medicare readmission rates showed meaningful decline in 2012. Medicare Medicaid Res Rev. 2013;3(2):pii:mmrr.003.02.b01. PubMed
5. Centers for Medicare and Medicaid Services. New Data Shows Affordable Care Act Reforms Are Leading to Lower Hospital Readmission Rates for Medicare Beneficiaries. http://blog.cms.gov/2013/12/06/new-data-shows-affordable-care-act-reforms-are-leading-to-lower-hospital-readmission-rates-for-medicare-beneficiaries/. Accessed on January 17, 2017.
6. Krumholz HM, Normand SL, Wang Y. Trends in hospitalizations and outcomes for acute cardiovascular disease and stroke, 1999-2011. Circulation. 2014;130(12):966-975. PubMed
7. Zuckerman RB, Sheingold SH, Orav EJ, Ruhter J, Epstein AM. Readmissions, Observation, and the Hospital Readmissions Reduction Program. N Engl J Med. 2016;374(16):1543-1551. PubMed
8. Desai NR, Ross JS, Kwon JY, et al. Association Between Hospital Penalty Status Under the Hospital Readmission Reduction Program and Readmission Rates for Target and Nontarget Conditions. JAMA. 2016;316(24):2647-2656. PubMed
9. Brock J, Mitchell J, Irby K, et al. Association between quality improvement for care transitions in communities and rehospitalizations among Medicare beneficiaries. JAMA. 2013;309(4):381-391. PubMed
10. Jencks S. Protecting Hospitals That Improve Population Health. http://medicaring.org/2014/12/16/protecting-hospitals/. Accessed on January 5, 2017.
11. Dharmarajan K, Qin L, Lin Z, et al. Declining Admission Rates And Thirty-Day Readmission Rates Positively Associated Even Though Patients Grew Sicker Over Time. Health Aff (Millwood). 2016;35(7):1294-1302. PubMed
12. Krumholz HM, Nuti SV, Downing NS, Normand SL, Wang Y. Mortality, Hospitalizations, and Expenditures for the Medicare Population Aged 65 Years or Older, 1999-2013. JAMA. 2015;314(4):355-365. PubMed
13. Amarasingham R, Moore BJ, Tabak YP, et al. An automated model to identify heart failure patients at risk for 30-day readmission or death using electronic medical record data. Med Care. 2010;48(11):981-988. PubMed
14. Kansagara D, Englander H, Salanitro A, et al. Risk prediction models for hospital readmission: a systematic review. JAMA. 2011;306(15):1688-1698. PubMed
15. Horwitz LI, Partovian C, Lin Z, et al. Development and use of an administrative claims measure for profiling hospital-wide performance on 30-day unplanned readmission. Ann Intern Med. 2014;161(10 Suppl):S66-S75. PubMed
16. 2016 Condition-Specific Measures Updates and Specifications Report Hospital-Level 30-Day Risk-Standardized Readmission Measures. https://www.cms.gov/Medicare/Quality-Initiatives-Patient-Assessment-Instruments/HospitalQualityInits/Downloads/AMI-HF-PN-COPD-and-Stroke-Readmission-Updates.zip. Accessed on January 19, 2017.
17. Centers for Medicare & Medicaid Services. Pub 100-04 Medicare Claims Processing, Transmittal 2028. https://www.cms.gov/Regulations-and-Guidance/Guidance/Transmittals/downloads/R2028CP.pdf. Accessed on November 28, 2016.
18. Martens FK, Tonk EC, Kers JG, Janssens AC. Small improvement in the area under the receiver operating characteristic curve indicated small changes in predicted risks. J Clin Epidemiol. 2016;79:159-164. PubMed
19. Blecker S, Goldfeld K, Park H, et al. Impact of an Intervention to Improve Weekend Hospital Care at an Academic Medical Center: An Observational Study. J Gen Intern Med. 2015;30(11):1657-1664. PubMed
20. Hansen LO, Young RS, Hinami K, Leung A, Williams MV. Interventions to reduce 30-day rehospitalization: a systematic review. Ann Intern Med. 2011;155(8):520-528. PubMed
21. Cavanaugh JJ, Jones CD, Embree G, et al. Implementation Science Workshop: primary care-based multidisciplinary readmission prevention program. J Gen Intern Med. 2014;29(5):798-804. PubMed
22. Jenq GY, Doyle MM, Belton BM, Herrin J, Horwitz LI. Quasi-Experimental Evaluation of the Effectiveness of a Large-Scale Readmission Reduction Program. JAMA Intern Med. 2016;176(5):681-690. PubMed
23. Lynn J, Jencks S. A Dangerous Malfunction in the Measure of Readmission Reduction. http://medicaring.org/2014/08/26/malfunctioning-metrics/. Accessed on January 17, 2017.
24. Calvillo-King L, Arnold D, Eubank KJ, et al. Impact of social factors on risk of readmission or mortality in pneumonia and heart failure: systematic review. J Gen Intern Med. 2013;28(2):269-282. PubMed
25. Barnett ML, Hsu J, McWilliams JM. Patient Characteristics and Differences in Hospital Readmission Rates. JAMA Intern Med. 2015;175(11):1803-1812. PubMed
26. Singh S, Lin YL, Kuo YF, Nattinger AB, Goodwin JS. Variation in the risk of readmission among hospitals: the relative contribution of patient, hospital and inpatient provider characteristics. J Gen Intern Med. 2014;29(4):572-578. PubMed
27. American Hospital Association. American Hospital Association (AHA) Detailed Comments on the Inpatient Prospective Payment System (PPS) Proposed Rule for Fiscal Year (FY) 2016. http://www.aha.org/advocacy-issues/letter/2015/150616-cl-cms1632-p-ipps.pdf. Accessed on January 10, 2017.
28. Bernheim SM, Parzynski CS, Horwitz L, et al. Accounting For Patients’ Socioeconomic Status Does Not Change Hospital Readmission Rates. Health Aff (Millwood). 2016;35(8):1461-1470. PubMed
© 2018 Society of Hospital Medicine
Planned, Related or Preventable: Defining Readmissions to Capture Quality of Care
In this issue of the Journal of Hospital Medicine, Ellimoottil and colleagues examine characteristics of readmissions identified as planned by the planned readmission algorithm developed for the Center for Medicare & Medicaid Services (CMS) by using Medicare claims data from 131 hospitals in Michigan.1 They found that a substantial portion of readmissions currently classified as planned by the algorithm appear to be nonelective, as defined by the presence of a charge by an emergency medicine physician or an admission type of emergent or urgent, making those hospitalizations unlikely to be planned. They suggest that the algorithm could be modified to exclude such cases from the planned designation.
To determine whether modifying the algorithm as recommended is a good idea, it is helpful to examine the origins of the existing planned readmission algorithm. The algorithm originated as a consequence of hospital accountability measures for readmissions and was developed by this author in collaboration with colleagues at Yale University and elsewhere.2 Readmission measures have been controversial in part because clearly some (undetermined) fraction of readmissions is unavoidable. Many commentators have asked that readmission measures therefore capture only avoidable or related readmissions. Avoidable readmissions are those that could have been prevented by members of the healthcare system through actions taken during or after hospitalization, such as patient counseling, communication among team members, and guideline-concordant medical care. Related readmissions are those directly stemming from the index admission. However, reliably and accurately defining such events has proven elusive. One study, for instance, found the rate of physician-assessed preventability in published studies ranged from 9% to 48%.3 The challenge is even greater in trying to determine preventability using just claims data, without physician review of charts. Imagine, for instance, a patient with heart failure who is readmitted with heart failure exacerbation. The readmission preceded by a large fast-food meal is likely preventable; although even in this case, some would argue the healthcare system should not be held accountable for a readmission if the patient had been properly counseled about avoiding salty food. The one preceded by progressively worsening systolic function in a patient who reliably takes medications, weighs herself daily, and watches her diet is likely not. But both appear identical in claims. Related is also a difficult concept to operationalize. A recently hospitalized patient readmitted with pneumonia might have acquired it in the hospital (related) or from her grandchild 2 weeks later (unrelated). Again, both appear identical in claims.
In the ideal world, clinicians would be held accountable only for preventable readmissions. In practice, that has not proven to be possible.
Instead, the CMS readmission measures omit readmissions that are thought to be planned in advance: necessary and intentional readmissions. Defining a planned readmission is conceptually easier than defining a preventable readmission, yet even this is not always straightforward. The clearest case might be a person with a longstanding plan to have an elective surgery (say, a hip replacement) who is briefly admitted with something minor enough not to delay a subsequent admission for the scheduled surgery. Other patients are admitted with acute problems that require follow-up hospitalization (for instance, an acute myocardial infarction that requires a coronary artery bypass graft 2 weeks later).4 More ambiguous are patients who are sent home on a course of treatment with a plan for rehospitalization if it fails; for instance, a patient with gangrene is sent home on intravenous antibiotics but fails to improve and is rehospitalized for an amputation. Is that readmission planned or unplanned? Reasonable people might disagree.
Nonetheless, assuming it is desirable to at least try to identify and remove planned readmissions from measures, there are a number of ways in which one might do so. Perhaps the simplest would be to classify each hospitalization as planned or not on the UB-04 claim form. Such a process would be very feasible but also subject to gaming or coding variability. Given that there is some ambiguity and no standard about what types of readmissions are planned and that current policy provides incentives to reduce unplanned readmission rates, hospitals might vary in the cases to which they would apply such a code. This approach, therefore, has not been favored by payers to date. An alternative is to prospectively flag admissions that are expected to result in planned readmissions. In fiscal year 2014, the CMS implemented this option for newborns and patients with acute myocardial infarction by creating new discharge status codes of “discharged to [location] with a planned acute care hospital inpatient readmission.” Institutions can flag discharges that they know at the time of discharge will be followed by a readmission, such as a newborn who requires a repeat hospitalization for repair of a congenital anomaly.5 There is no time span required for the planned readmission to qualify. However, the difficulty in broadening the applicability of this option to all discharges lies in identification and matching; there also remains a possibility for gaming. The code does not specify when the readmission is expected nor for what diagnosis or procedure. How, then, do we know if the subsequent readmission is the one anticipated? Unexpected readmissions may still occur in the interim. Conversely, what if the discharging clinicians don’t know about an anticipated planned procedure? What would stop hospitals from labeling every discharge as expected to be followed by a planned readmission? These considerations have largely prevented the CMS from asking hospitals to apply the new code widely or from applying the code to identify planned readmissions.
Instead, the existing algorithm attempts to identify procedures that might be done on an elective basis and assumes readmissions with these procedures are planned if paired with a nonurgent diagnosis. Ellimoottil and colleagues attempt to verify whether this is accurate using a creative approach of seeking emergency department (ED) charges and admission type of emergent or urgent, and they found that roughly half of planned readmissions are, in fact, likely unplanned. This figure agrees closely with the original chart review validation of the algorithm. In particular, they found that some procedures, such as percutaneous cardiac interventions, appear to be paired regularly with a nonurgent principal diagnosis, such as coronary artery disease, even when done on an urgent basis.
This validation was performed prior to the availability of version 4.0 of the planned readmission algorithm, which removes several high-frequency procedures from the potentially planned readmission list (including cardiac devices and diagnostic cardiac catheterizations) that were very frequently mischaracterized as planned in the original chart validation.6 At least 8 such cases were also identified in this validation according to the table. Therefore, the misclassification rate of the current algorithm version is probably less than that reported in this article. Nonetheless, percutaneous transluminal coronary angioplasty remains on the planned procedure list in version 4.0 and appears to account for a substantial error rate, and it is likely that the authors’ approach would improve the accuracy even of the newer version of the algorithm.
The advantages of the suggested modifications are that they do not require chart review and could be readily adopted by the CMS. Although seeking ED charges for Medicare is somewhat cumbersome in that they are recorded in a different data set than the inpatient hospitalizations, there is no absolute barrier to adding this step to the algorithm, and doing so has substantial face validity. That said, identifying ED visits is not straightforward because nonemergency services can be provided in the ED (ie, critical care or observation care) and because facilities and providers have different billing requirements, producing different estimates depending on the data set used.7 Including admission type would be easier, but it would be less conservative and likely less accurate, as this field has not been validated and is not typically audited. Nonetheless, adding the presence of ED charges seems likely to improve the accuracy of the algorithm. As the CMS continues to refine the planned readmission algorithm, these proposed changes would be very reasonable to study with chart validation and, if valid, to consider adopting.
Disclosure
Dr. Horwitz reports grants from Center for Medicare & Medicaid Services, grants from Agency for Healthcare Research and Quality, during the conduct of the study.
1. Ellimoottil C, Khouri R, Dhir A, Hou H, Miller D, Dupree J. An opportunity to improve Medicare’s planned readmissions measure. J Hosp Med. 2017;12(10):840-842.
2. Horwitz LI, Grady JN, Cohen DB, et al. Development and validation of an algorithm to identify planned readmissions from claims data. J Hosp Med. 2015;10(10):670-677. PubMed
3. Benbassat J, Taragin M. Hospital readmissions as a measure of quality of health care: advantages and limitations. Arch Intern Med. 2000;160(8):1074-1081. PubMed
4. Assmann A, Boeken U, Akhyari P, Lichtenberg A. Appropriate timing of coronary artery bypass grafting after acute myocardial infarction. Thorac Cardiovasc Surg. 2012;60(7):446-451. PubMed
5. Inpatient Prospective Payment System/Long-Term Care Hospital (IPPS/LTCH) Final Rule, 78 Fed. Reg. 27520 (Aug 19, 2013) (to be codified at 42 C.F.R. Parts 424, 414, 419, 424, 482, 485 and 489). http://www.gpo.gov/fdsys/pkg/FR-2013-08-19/pdf/2013-18956.pdf. Accessed on May 4, 2017.
6. Yale New Haven Health Services Corporation Center for Outcomes Research and Evaluation. 2016 Condition-Specific Measures Updates and Specifications Report: Hospital-Level 30-Day Risk-Standardized Readmission Measures. March 2016.
7. Venkatesh AK, Mei H, Kocher KE, et al. Identification of emergency department visits in Medicare administrative claims: approaches and implications. Acad Emerg Med. 2017;24(4):422-431. PubMed
In this issue of the Journal of Hospital Medicine, Ellimoottil and colleagues examine characteristics of readmissions identified as planned by the planned readmission algorithm developed for the Center for Medicare & Medicaid Services (CMS) by using Medicare claims data from 131 hospitals in Michigan.1 They found that a substantial portion of readmissions currently classified as planned by the algorithm appear to be nonelective, as defined by the presence of a charge by an emergency medicine physician or an admission type of emergent or urgent, making those hospitalizations unlikely to be planned. They suggest that the algorithm could be modified to exclude such cases from the planned designation.
To determine whether modifying the algorithm as recommended is a good idea, it is helpful to examine the origins of the existing planned readmission algorithm. The algorithm originated as a consequence of hospital accountability measures for readmissions and was developed by this author in collaboration with colleagues at Yale University and elsewhere.2 Readmission measures have been controversial in part because clearly some (undetermined) fraction of readmissions is unavoidable. Many commentators have asked that readmission measures therefore capture only avoidable or related readmissions. Avoidable readmissions are those that could have been prevented by members of the healthcare system through actions taken during or after hospitalization, such as patient counseling, communication among team members, and guideline-concordant medical care. Related readmissions are those directly stemming from the index admission. However, reliably and accurately defining such events has proven elusive. One study, for instance, found the rate of physician-assessed preventability in published studies ranged from 9% to 48%.3 The challenge is even greater in trying to determine preventability using just claims data, without physician review of charts. Imagine, for instance, a patient with heart failure who is readmitted with heart failure exacerbation. The readmission preceded by a large fast-food meal is likely preventable; although even in this case, some would argue the healthcare system should not be held accountable for a readmission if the patient had been properly counseled about avoiding salty food. The one preceded by progressively worsening systolic function in a patient who reliably takes medications, weighs herself daily, and watches her diet is likely not. But both appear identical in claims. Related is also a difficult concept to operationalize. A recently hospitalized patient readmitted with pneumonia might have acquired it in the hospital (related) or from her grandchild 2 weeks later (unrelated). Again, both appear identical in claims.
In the ideal world, clinicians would be held accountable only for preventable readmissions. In practice, that has not proven to be possible.
Instead, the CMS readmission measures omit readmissions that are thought to be planned in advance: necessary and intentional readmissions. Defining a planned readmission is conceptually easier than defining a preventable readmission, yet even this is not always straightforward. The clearest case might be a person with a longstanding plan to have an elective surgery (say, a hip replacement) who is briefly admitted with something minor enough not to delay a subsequent admission for the scheduled surgery. Other patients are admitted with acute problems that require follow-up hospitalization (for instance, an acute myocardial infarction that requires a coronary artery bypass graft 2 weeks later).4 More ambiguous are patients who are sent home on a course of treatment with a plan for rehospitalization if it fails; for instance, a patient with gangrene is sent home on intravenous antibiotics but fails to improve and is rehospitalized for an amputation. Is that readmission planned or unplanned? Reasonable people might disagree.
Nonetheless, assuming it is desirable to at least try to identify and remove planned readmissions from measures, there are a number of ways in which one might do so. Perhaps the simplest would be to classify each hospitalization as planned or not on the UB-04 claim form. Such a process would be very feasible but also subject to gaming or coding variability. Given that there is some ambiguity and no standard about what types of readmissions are planned and that current policy provides incentives to reduce unplanned readmission rates, hospitals might vary in the cases to which they would apply such a code. This approach, therefore, has not been favored by payers to date. An alternative is to prospectively flag admissions that are expected to result in planned readmissions. In fiscal year 2014, the CMS implemented this option for newborns and patients with acute myocardial infarction by creating new discharge status codes of “discharged to [location] with a planned acute care hospital inpatient readmission.” Institutions can flag discharges that they know at the time of discharge will be followed by a readmission, such as a newborn who requires a repeat hospitalization for repair of a congenital anomaly.5 There is no time span required for the planned readmission to qualify. However, the difficulty in broadening the applicability of this option to all discharges lies in identification and matching; there also remains a possibility for gaming. The code does not specify when the readmission is expected nor for what diagnosis or procedure. How, then, do we know if the subsequent readmission is the one anticipated? Unexpected readmissions may still occur in the interim. Conversely, what if the discharging clinicians don’t know about an anticipated planned procedure? What would stop hospitals from labeling every discharge as expected to be followed by a planned readmission? These considerations have largely prevented the CMS from asking hospitals to apply the new code widely or from applying the code to identify planned readmissions.
Instead, the existing algorithm attempts to identify procedures that might be done on an elective basis and assumes readmissions with these procedures are planned if paired with a nonurgent diagnosis. Ellimoottil and colleagues attempt to verify whether this is accurate using a creative approach of seeking emergency department (ED) charges and admission type of emergent or urgent, and they found that roughly half of planned readmissions are, in fact, likely unplanned. This figure agrees closely with the original chart review validation of the algorithm. In particular, they found that some procedures, such as percutaneous cardiac interventions, appear to be paired regularly with a nonurgent principal diagnosis, such as coronary artery disease, even when done on an urgent basis.
This validation was performed prior to the availability of version 4.0 of the planned readmission algorithm, which removes several high-frequency procedures from the potentially planned readmission list (including cardiac devices and diagnostic cardiac catheterizations) that were very frequently mischaracterized as planned in the original chart validation.6 At least 8 such cases were also identified in this validation according to the table. Therefore, the misclassification rate of the current algorithm version is probably less than that reported in this article. Nonetheless, percutaneous transluminal coronary angioplasty remains on the planned procedure list in version 4.0 and appears to account for a substantial error rate, and it is likely that the authors’ approach would improve the accuracy even of the newer version of the algorithm.
The advantages of the suggested modifications are that they do not require chart review and could be readily adopted by the CMS. Although seeking ED charges for Medicare is somewhat cumbersome in that they are recorded in a different data set than the inpatient hospitalizations, there is no absolute barrier to adding this step to the algorithm, and doing so has substantial face validity. That said, identifying ED visits is not straightforward because nonemergency services can be provided in the ED (ie, critical care or observation care) and because facilities and providers have different billing requirements, producing different estimates depending on the data set used.7 Including admission type would be easier, but it would be less conservative and likely less accurate, as this field has not been validated and is not typically audited. Nonetheless, adding the presence of ED charges seems likely to improve the accuracy of the algorithm. As the CMS continues to refine the planned readmission algorithm, these proposed changes would be very reasonable to study with chart validation and, if valid, to consider adopting.
Disclosure
Dr. Horwitz reports grants from Center for Medicare & Medicaid Services, grants from Agency for Healthcare Research and Quality, during the conduct of the study.
1. Ellimoottil C, Khouri R, Dhir A, Hou H, Miller D, Dupree J. An opportunity to improve Medicare’s planned readmissions measure. J Hosp Med. 2017;12(10):840-842.
2. Horwitz LI, Grady JN, Cohen DB, et al. Development and validation of an algorithm to identify planned readmissions from claims data. J Hosp Med. 2015;10(10):670-677. PubMed
3. Benbassat J, Taragin M. Hospital readmissions as a measure of quality of health care: advantages and limitations. Arch Intern Med. 2000;160(8):1074-1081. PubMed
4. Assmann A, Boeken U, Akhyari P, Lichtenberg A. Appropriate timing of coronary artery bypass grafting after acute myocardial infarction. Thorac Cardiovasc Surg. 2012;60(7):446-451. PubMed
5. Inpatient Prospective Payment System/Long-Term Care Hospital (IPPS/LTCH) Final Rule, 78 Fed. Reg. 27520 (Aug 19, 2013) (to be codified at 42 C.F.R. Parts 424, 414, 419, 424, 482, 485 and 489). http://www.gpo.gov/fdsys/pkg/FR-2013-08-19/pdf/2013-18956.pdf. Accessed on May 4, 2017.
6. Yale New Haven Health Services Corporation Center for Outcomes Research and Evaluation. 2016 Condition-Specific Measures Updates and Specifications Report: Hospital-Level 30-Day Risk-Standardized Readmission Measures. March 2016.
7. Venkatesh AK, Mei H, Kocher KE, et al. Identification of emergency department visits in Medicare administrative claims: approaches and implications. Acad Emerg Med. 2017;24(4):422-431. PubMed
“We’re almost guests in their clinical care”: Inpatient provider attitudes toward chronic disease management
Millions of individuals with chronic diseases are hospitalized annually in the United States. More than 90% of hospitalized adults have at least 1 chronic disease,1 and almost half of Medicare beneficiaries in the hospital have 4 or more chronic conditions.2 While many patients are admitted for worsening of a single chronic disease, patients are hospitalized more commonly for other causes. For instance, although acute heart failure is among the most frequent causes of hospitalizations among older adults, three-fourths of hospitalizations of patients with heart failure are for reasons other than acute heart failure.3
When a patient with a chronic disease is hospitalized, the inpatient provider must consider whether to actively or passively manage the chronic disease. Studies have suggested that intervening in chronic diseases during hospitalizations can lead to long-term improvement in treatment;4-6 for instance, stroke patients who were started on antihypertensive therapy at discharge were more likely to have their blood pressure controlled in the next year.5 However, some authors have argued that aggressive hypertension management by inpatient providers may result in patient harm.7 One case-based survey suggested that hospitalists were mixed in their interest in participating in chronic disease management in the hospital.8 This study found that providers were less likely to participate in chronic disease management if it was unrelated to the reason for hospitalization.8 However, to our knowledge, no studies have broadly evaluated inpatient provider attitudes, motivating factors, or barriers to participation in chronic disease management.
The purpose of this study was to understand provider attitudes towards chronic disease management for patients who are hospitalized for other causes. We were particularly interested in perceptions of barriers and facilitators to delivery of inpatient chronic disease management. Ultimately, such findings can inform future interventions to improve inpatient care of chronic disease.
METHODS
In this qualitative study, we conducted in-depth interviews with providers to understand attitudes, barriers, and facilitators towards inpatient management of chronic disease; this study was part of a larger study to implement an electronic health record-based clinical decision-support system intervention to improve quality of care for hospitalized patients with heart failure.
We included providers who care for and can write medication orders for hospitalized adult patients at New York University (NYU) Langone Medical Center, an urban academic medical center. As patients with chronic conditions are commonly hospitalized for many reasons, we sought to interview providers from a range of clinical services without consideration of factors such as frequency of caring for patients with heart failure. We used a purposive sampling framework: we invited participants to ensure a range of services, including medicine, surgery, and neurology, and provider types, including attending physicians, resident physicians, nurse practitioners, and physician assistants. Potential participants, therefore, included all providers for adult hospitalized patients.
We identified potential participants through study team members, referrals from department heads and prior interviewees, and e-mails to department list serves. We did not formally track declinations to being interviewed, although we estimate them as fewer than 20% of providers directly approached. While we focused on inpatient providers at New York University Langone Medical Center, many of the attending physicians and residents spend a portion of their time at the Manhattan Veterans Affairs Hospital and Bellevue Hospital, a safety-net city hospital; providers could have outpatient responsibilities as well.
All participants provided verbal consent to participate. The study was approved by the New York University Institutional Review Board, which granted a waiver of documentation of consent. Participants received a $25 gift card following the interview.
We used a semi-structured interview guide (Appendix) to elicit in-depth accounts of provider attitudes, experiences with, and barriers and facilitators towards chronic disease management in the hospital. The interview began by asking about chronic disease in general and then asked more specific questions about heart failure; we included responses to both groups of questions in the current study. The interview also included questions related to the clinical decision-support system being developed as part of the larger implementation study, although we do not report on these results in the current study. The semi-structured interview guide was informed by the consolidated framework for advancing implementation science (CFIR), which offers an overarching typology for delineating factors that influence guideline implementation;9 we also used CFIR constructs in theme development. We conducted in-depth interviews with providers.
A priori, we estimated 25 interviews would be sufficient to include the purposive sample and achieve data saturation,10 which was reached after 31 interviews. Interviews were held in person or by telephone, at the convenience of the subject. All interviews were transcribed by a professional service. Transcriptions were reviewed against recordings with any mistakes corrected. Prior to each interview, we conducted a brief demographic survey.
Qualitative data were analyzed using a constant comparative analytic technique.11 The investigative team met after reviewing the first 10 interviews and discussed emergent themes from these early transcripts, which led to the initial code list. Two investigators coded the transcripts. Reliability was evaluated by independent coding of a 20% subset of interviews. Differences were reviewed and discussed until consensus was reached. Final intercoder reliability was determined to be greater than 95%.12 All investigators reviewed and refined the code list during the analysis phase. Codes were clustered into themes based on CFIR constructs.9 Analyses were performed using Atlas.ti v. 7 (ATLAS.ti Scientific Software Development GmbH, Berlin, Germany).

RESULTS
We conducted interviews with 31 providers. Of these, 12 were on the medicine service, 12 were on the surgery or a surgical subspecialty service, and 7 were on other services; 11 were attending physicians, 12 were resident physicians, 5 were NPs, and 3 were PAs. Only 2 providers—an attending in medicine and a resident in surgery—had a specialty focus that was cardiac-related. Median time in current position was 4 years (Table 1). Seventeen of the interviews were in person, and 14 were conducted by telephone. The mean interview time was 20 minutes and ranged from 11 to 41 minutes.

We identified 5 main themes with 29 supporting codes (Table 2) describing provider attitudes towards the management of chronic disease for hospitalized patients. These themes, with related CFIR constructs, were: 1) perceived impact on patient outcomes (CFIR construct: intervention characteristics, relative advantage); 2) hospital structural characteristics (inner setting, structural characteristics); 3) provider knowledge and self-efficacy (characteristic of individual, knowledge and beliefs about the intervention and self-efficacy); 4) hospital priorities (inner setting, implementation climate, relative priority); and 5) continuity and communication (inner setting, networks and communications). For most themes, subjects described both positive and negative aspects of chronic disease management, as well as related facilitators and barriers to delivery of chronic disease care for hospitalized patients. Illustrative quotes for each theme are shown in Table 3.
Perceived Impact on Patient Outcomes
Perceived impact on patient outcomes was mixed. Most providers believed the management of chronic diseases could lead to improvement in important patient outcomes, including decreased length of stay (LOS), prevention of hospital complication, and decreased readmissions. Surgical providers focused particularly on the benefits of preventing surgical complications and noted that they were more likely to manage chronic conditions—primarily through use of specialist consultation—when they perceived a benefit to prevention of surgical outcomes or a fear that surgery may worsen a stable chronic condition:
“Most of the surgery I do is pretty stressful on the body and is very likely to induce acute on chronic exacerbations of heart failure. For someone with Class II or higher heart failure, I’m definitely gonna have cardiology on board or at least internal medicine on board right from the beginning.”
However, some providers acknowledged that there were potential risks to such management, including “prolonging hospital stays for nonemergent indications” and treatment with therapies that had previously led to an “adverse reaction that wasn’t clearly documented.” Providers were also concerned that treating chronic conditions may take focus away from acute conditions, which could lead to worse patient-centered outcomes. One attending in medicine described it:
“If you do potentially focus on those chronic issues, and there’s already a lot of other stuff going on with the patient, you might not be prioritizing the patient’s active issues appropriately. The patient’s saying, ‘I’m in pain. I’m in pain. I’m in pain,’ and you’re saying, ‘Thank you very much. Look, your heart failure, you didn’t get your beta-blocker.’ There could be a disconnect between patient’s goals, expectations, and your goals and expectations.”
Hospital Structural Characteristics
For many providers, the hospital setting provides a unique opportunity for care of patients with chronic disease. First, a hospitalization is a time for a patient’s management to be reviewed by a new care team. The hospital team reviews the management plan for patients at admission, which is a time to reevaluate whether patients are on evidence-based therapies: “It’s helpful to have a new set of eyes on somebody, like fresh information.” According to providers, this reevaluation can overcome instances of therapeutic inertia by the outpatient physician. Second, the hospital has many resources, including readily available specialist services and diagnostic tests, which can allow a patient-centered approach that coordinates care in 1 place, as a surgery NP described: “I think the advantage for the patient is that they wind up stopping in for 1 thing but we wind up taking care of a few without requiring the need for him or her to go to all these different specialists on the outside. They’re mostly elderly and not able to get around.” Third, the high availability of services and frequent monitoring allows rapid titration of evidence-based medicines, as discussed by a medicine resident: “It’s easier and faster to titrate medication—they’re in a monitored setting; you can ensure compliance.”
Patients may also differ from their usual state while hospitalized, creating both risks and benefits. The hospital setting can provide an opportunity to educate patients on their chronic disease(s) because they are motivated: “They’re in an office visit and their sugars are out of whack or something, they may take it a little bit more seriously if they were just in the hospital even though it was on an unrelated issue. I think it probably just changes their perspective on their disease.” However, in the hospital, patients are in an unusual environment with a restricted diet and forced medication compliance. Furthermore, the acute condition can lead to changes in their chronic disease, as described by 1 medicine attending: “their sugar is high because they’re acutely ill.” Providers expressed concern that changing medications in this setting may lead to adverse events (AEs) when patients return to their usual environment.
Provider Knowledge and Self-Efficacy
Insufficient knowledge of treatments for chronic conditions was cited as a barrier to some providers’ ability to actively manage chronic disease for hospitalized patients. Some providers described management of conditions outside their area as less satisfying than their primary focus. For example, an orthopedic surgeon explained: “…it’s very simple. You see your bone is broken, you fix it, that’s it…it’s intellectually satisfying…managing chronic diseases is less like that.” Reliance on consultants was 1 approach to deal with knowledge gaps in areas outside a provider’s expertise.
For a number of providers, management of stable chronic disease is the responsibility of the outpatient provider. Providers expressed concern that inpatient management was a reach into the domain of the primary care provider (PCP) and might take “away from the primary focus” of the hospitalization. Nonetheless, some providers noted an “ethical responsibility to manage [a] patient correctly,” and some providers believed that engaging in chronic disease management in the hospital would present an opportunity to expand their own expertise.
A few providers were worried about legal risk related to chronic disease management: “we don’t typically deal too much with managing some of these other medical issues for medical and legal reasons.” Providers again suggested that consults can help overcome this concern for risk, as discussed by 1 surgical attending: “We’re all not wanting to be sued, and we want to do the right thing. It costs me nothing to have a cardiologist on board, so like—why not.”
Hospital Priorities
Providers explained that the hospital has strong interests in early discharge and minimizing LOS. These priorities are based on goals of improving patient outcomes, increasing bed availability and hospital volume, and reducing costs. Providers perceive these hospital priorities as potential barriers to chronic disease management, which can increase LOS and costs through additional testing and treatment. As a medicine resident described: “The DBN philosophy, ‘discharge before noon’ philosophy, which is part of the hospital efficiency to get people in and out of the hospital as quickly as [is] safe, or maybe faster. And I think that there’s a culture where you’re encouraged to only focus on the acute issue and tend to defer everything else.”
Continuity and Communication
According to many providers, care continuity between the outpatient setting and the hospital played a major role in management of chronic disease. One barrier to starting a new evidence-based medication was lack of knowledge of patient history. As noted, providers expressed concern that a patient may not be on a given therapy because of an adverse reaction that was not documented in the hospital chart. This is particularly true because, as discussed by a surgery resident, patients with “PCPs outside the system [in which providers] don’t have access to the electronic medical record.” To overcome this barrier, providers attempt to communicate with the outpatient provider to confirm a lack of contraindications to therapies prior to any changes; notably, communication is easier if the inpatient provider has a relationship with the outpatient PCP.
Some providers were more likely to start chronic disease therapies if the patient had no prior outpatient care, because the provider was reassured that there was no rationale for missing therapies. One neurology attending noted that if a patient had newly documented “hypertension even if they were in for something else, I might start them on an antihypertensive, but then arrange for a close follow-up with a new PCP.”
Following hospitalization, providers wanted assurance that any changes to chronic disease management would be followed up by an outpatient physician. Any changes are relayed to the outpatient provider and the “level of communication…with the outpatient provider who’s gonna inherit” these changes can influence how aggressively the inpatient provider manages chronic diseases. Providers may be reluctant to start therapy for patients if they are concerned about outpatient follow up: “they have diabetes and they should really technically be on an ACE [angiotensin converting enzyme]inhibitor and aspirin, but they’re not. I might send them out on the aspirin but I might either start ACE inhibitor and have them follow up with their PCP in 2 weeks if I’m confident that they’ll do it or if I’m really confident that they’ll not follow up, I will help them get the appointment and then the discharge instruction is to the PCP is ‘Please start this patient on ACE inhibitor if they show up.’”
DISCUSSION
Providers frequently perceive benefit to chronic disease management in the hospital, including improvements in clinical outcomes. Notably, providers see opportunities to improve compliance with evidence-based care to overcome potential barriers to managing chronic disease in the outpatient setting, which can be limited by pressure for brief encounters,13 clinical inertia,14 difficulty with close monitoring of patients,15 and care fragmentation.16 Concurrently, inpatient providers are concerned about potential for patient harm related to chronic disease management, primarily related to AEs from medications. Similar to a case study about a patient with outpatient hypotension following aggressive inpatient hypertension management,7 providers fear that changing a patient’s chronic disease management in a hospital setting may cause harm when the patient returns home.
Although some clinicians have argued against aggressive in-hospital chronic disease management because of concerns for risk of AEs,7 our study and others8 have suggested that many clinicians perceive benefit. In some cases, such as smoking cessation counseling for all current smokers and prescribing an angiotensin converting enzyme inhibitor for patients with systolic heart failure, the perceived importance is so great that chronic disease management has been used as a national quality metric for hospitals. While these hospital metrics may be justified for short-term benefits after hospitalization, studies have demonstrated only weak improvement in short-term postdischarge outcomes related to chronic disease management.17 The true benefit is likely from improved processes of care in the short term that lead to long-term improvement in outcomes.4,5,18 Thus, the advantage of starting a patient hospitalized for a stroke on blood pressure medication is the increased likelihood that the patient will continue the medication as an outpatient, which may reduce long-term mortality.
For hospital delivery systems that are concerned with such care process improvement through in-hospital chronic disease management, we identified a number of barriers and facilitators to delivering this care. One significant barrier was poor transitions between the inpatient and the outpatient settings. When a patient transitions into the hospital, providers need to understand prior management choices. Facilitators to help inpatient providers understand prior management included either knowing the outpatient provider, or understanding that there was a lack of regular outpatient care; in both these cases, inpatient providers felt more comfortable managing chronic diseases because they had insight into the outpatient plan, or lack thereof. However, these facilitators may not be practical to incorporate in interventions to improve chronic disease care, which should consider overcoming these communication barriers. Use of shared electronic health records or standardized telephone calls with well-documented care plans obtained through health information exchanges may facilitate an inpatient provider to manage appropriately chronic disease. Similarly, discontinuity between the inpatient provider and the outpatient provider is a barrier that must be overcome to ease concerns that any chronic disease management changes do not result in harm in the postdischarge period. These findings again point to the need for improved documentation and communication between inpatient and outpatient providers. Of course, the transitional care period is one of high risk, and improving communication between providers has been an area of ongoing work.19
Lack of comfort among inpatient providers with managing chronic diseases is another important barrier, which appears to be largely overcome through the use of consultation services. Ready availability of specialists, common in academic medical centers, can facilitate delivery of chronic disease management. Inpatient interventions designed to improve evidence-based care for a chronic disease may benefit from involvement or at least availability of specialists in the effort. Another major barrier relates to hospital priorities, which in our study were closely aligned with external factors such as payment models. As hospitalizations are typically paid based on the discharge diagnosis, hospitals have incentives to discharge quickly and not order extra diagnostic tests. As a result, there are disincentives for chronic disease management that may require additional testing or monitoring in the hospital. Conversely, as hospitals accept postdischarge financial risks through readmission penalties or postdischarge cost savings, hospitals may perceive that long-term benefits of chronic disease management may outweigh short-term costs.
The study findings should be interpreted in the context of its limitations. Findings of our study of providers from a single academic medical center may not be generalizable. Nearly half of our interviews were conducted by telephone, which limits our ability to capture nonverbal cues in communication. Providers may have had social desirability bias towards positive aspects of chronic disease management. We did not have the power to determine differences in response by provider characteristic because this was an exploratory qualitative study. Future studies with representative sampling, a larger sample size, and measures for constructs such as provider self-efficacy are needed to examine differences by specialty, provider type, and experience level.
In conclusion, inpatient providers believe that hospital chronic disease management has the potential to be beneficial for both process of care and clinical outcomes; providers also express concern about potential adverse consequences of managing chronic disease during acute hospitalizations. To maximize both quality of care and patient safety, overcoming communication barriers between inpatient and outpatient providers is needed. Both a supportive hospital environment and availability of specialty support can facilitate in-hospital chronic disease management. Interventions that incorporate these factors may be well-suited to improve chronic disease care and long-term outcomes.
Disclosures
This work was supported by the Agency for Healthcare Research and Quality (AHRQ) grant K08HS23683. The authors report no financial conflicts of interest.
1. Friedman B, Jiang HJ, Elixhauser A, Segal A. Hospital inpatient costs for adults with multiple chronic conditions. Med Care Res Rev. 2006;63(3):327-346. PubMed
2. Steiner CA, Friedman B. Hospital utilization, costs, and mortality for adults with multiple chronic conditions, Nationwide Inpatient Sample, 2009. Prev Chronic Dis. 2013;10:E62. PubMed
3. Blecker S, Paul M, Taksler G, Ogedegbe G, Katz S. Heart failure-associated hospitalizations in the United States. J Am Coll Cardiol. 2013;61(12):1259-1267. PubMed
4. Fonarow GC. Role of in-hospital initiation of carvedilol to improve treatment rates and clinical outcomes. Am J Cardiol. 2004;93(9A):77B-81B. PubMed
5. Touze E, Coste J, Voicu M, et al. Importance of in-hospital initiation of therapies and therapeutic inertia in secondary stroke prevention: IMplementation of Prevention After a Cerebrovascular evenT (IMPACT) Study. Stroke. 2008;39(6):1834-1843. PubMed
6. Ovbiagele B, Saver JL, Fredieu A, et al. In-hospital initiation of secondary stroke prevention therapies yields high rates of adherence at follow-up. Stroke. 2004;35(12):2879-2883. PubMed
7. Steinman MA, Auerbach AD. Managing chronic disease in hospitalized patients. JAMA Intern Med. 2013;173(20):1857-1858. PubMed
8. Breu AC, Allen-Dicker J, Mueller S, Palamara K, Hinami K, Herzig SJ. Hospitalist and primary care physician perspectives on medication management of chronic conditions for hospitalized patients. J Hosp Med. 2014;9(5):303-309. PubMed
9. Damschroder LJ, Aron DC, Keith RE, Kirsh SR, Alexander JA, Lowery JC. Fostering implementation of health services research findings into practice: a consolidated framework for advancing implementation science. Implement Sci. 2009;4:50. PubMed
10. Morse JM. The significance of saturation. Qualitative Health Research. 1995;5(2):147-149.
11. Bradley EH, Curry LA, Devers KJ. Qualitative data analysis for health services research: developing taxonomy, themes, and theory. Health Services Research. 2007;42(4):1758-1772. PubMed
12. Riegel B, Dickson VV, Topaz M. Qualitative analysis of naturalistic decision making in adults with chronic heart failure. Nurs Res. 2013;62(2):91-98. PubMed
13. Linzer M, Konrad TR, Douglas J, et al. Managed care, time pressure, and physician job satisfaction: results from the physician worklife study. J Gen Intern Med. 2000;15(7):441-450. PubMed
14. Phillips LS, Branch WT, Cook CB, et al. Clinical inertia. Ann Intern Med. 2001;135(9):825-834.
15. Dev S, Hoffman TK, Kavalieratos D, et al. Barriers to adoption of mineralocorticoid receptor antagonists in patients with heart failure: A mixed-methods study. J Am Heart Assoc. 2016;4(3):e002493. PubMed
16. Stange KC. The problem of fragmentation and the need for integrative solutions. Ann Fam Med. 2009;7(2):100-103. PubMed
17. Fonarow GC, Abraham WT, Albert NM, et al. Association between performance measures and clinical outcomes for patients hospitalized with heart failure. JAMA. 2007;297(1):61-70. PubMed
18. Shah M, Norwood CA, Farias S, Ibrahim S, Chong PH, Fogelfeld L. Diabetes transitional care from inpatient to outpatient setting: pharmacist discharge counseling. J Pharm Pract. 2013;26(2):120-124. PubMed
19. Kripalani S, LeFevre F, Phillips CO, Williams MV, Basaviah P, Baker DW. Deficits in communication and information transfer between hospital-based and primary care physicians: implications for patient safety and continuity of care. JAMA. 2007;297(8):831-841. PubMed
Millions of individuals with chronic diseases are hospitalized annually in the United States. More than 90% of hospitalized adults have at least 1 chronic disease,1 and almost half of Medicare beneficiaries in the hospital have 4 or more chronic conditions.2 While many patients are admitted for worsening of a single chronic disease, patients are hospitalized more commonly for other causes. For instance, although acute heart failure is among the most frequent causes of hospitalizations among older adults, three-fourths of hospitalizations of patients with heart failure are for reasons other than acute heart failure.3
When a patient with a chronic disease is hospitalized, the inpatient provider must consider whether to actively or passively manage the chronic disease. Studies have suggested that intervening in chronic diseases during hospitalizations can lead to long-term improvement in treatment;4-6 for instance, stroke patients who were started on antihypertensive therapy at discharge were more likely to have their blood pressure controlled in the next year.5 However, some authors have argued that aggressive hypertension management by inpatient providers may result in patient harm.7 One case-based survey suggested that hospitalists were mixed in their interest in participating in chronic disease management in the hospital.8 This study found that providers were less likely to participate in chronic disease management if it was unrelated to the reason for hospitalization.8 However, to our knowledge, no studies have broadly evaluated inpatient provider attitudes, motivating factors, or barriers to participation in chronic disease management.
The purpose of this study was to understand provider attitudes towards chronic disease management for patients who are hospitalized for other causes. We were particularly interested in perceptions of barriers and facilitators to delivery of inpatient chronic disease management. Ultimately, such findings can inform future interventions to improve inpatient care of chronic disease.
METHODS
In this qualitative study, we conducted in-depth interviews with providers to understand attitudes, barriers, and facilitators towards inpatient management of chronic disease; this study was part of a larger study to implement an electronic health record-based clinical decision-support system intervention to improve quality of care for hospitalized patients with heart failure.
We included providers who care for and can write medication orders for hospitalized adult patients at New York University (NYU) Langone Medical Center, an urban academic medical center. As patients with chronic conditions are commonly hospitalized for many reasons, we sought to interview providers from a range of clinical services without consideration of factors such as frequency of caring for patients with heart failure. We used a purposive sampling framework: we invited participants to ensure a range of services, including medicine, surgery, and neurology, and provider types, including attending physicians, resident physicians, nurse practitioners, and physician assistants. Potential participants, therefore, included all providers for adult hospitalized patients.
We identified potential participants through study team members, referrals from department heads and prior interviewees, and e-mails to department list serves. We did not formally track declinations to being interviewed, although we estimate them as fewer than 20% of providers directly approached. While we focused on inpatient providers at New York University Langone Medical Center, many of the attending physicians and residents spend a portion of their time at the Manhattan Veterans Affairs Hospital and Bellevue Hospital, a safety-net city hospital; providers could have outpatient responsibilities as well.
All participants provided verbal consent to participate. The study was approved by the New York University Institutional Review Board, which granted a waiver of documentation of consent. Participants received a $25 gift card following the interview.
We used a semi-structured interview guide (Appendix) to elicit in-depth accounts of provider attitudes, experiences with, and barriers and facilitators towards chronic disease management in the hospital. The interview began by asking about chronic disease in general and then asked more specific questions about heart failure; we included responses to both groups of questions in the current study. The interview also included questions related to the clinical decision-support system being developed as part of the larger implementation study, although we do not report on these results in the current study. The semi-structured interview guide was informed by the consolidated framework for advancing implementation science (CFIR), which offers an overarching typology for delineating factors that influence guideline implementation;9 we also used CFIR constructs in theme development. We conducted in-depth interviews with providers.
A priori, we estimated 25 interviews would be sufficient to include the purposive sample and achieve data saturation,10 which was reached after 31 interviews. Interviews were held in person or by telephone, at the convenience of the subject. All interviews were transcribed by a professional service. Transcriptions were reviewed against recordings with any mistakes corrected. Prior to each interview, we conducted a brief demographic survey.
Qualitative data were analyzed using a constant comparative analytic technique.11 The investigative team met after reviewing the first 10 interviews and discussed emergent themes from these early transcripts, which led to the initial code list. Two investigators coded the transcripts. Reliability was evaluated by independent coding of a 20% subset of interviews. Differences were reviewed and discussed until consensus was reached. Final intercoder reliability was determined to be greater than 95%.12 All investigators reviewed and refined the code list during the analysis phase. Codes were clustered into themes based on CFIR constructs.9 Analyses were performed using Atlas.ti v. 7 (ATLAS.ti Scientific Software Development GmbH, Berlin, Germany).
RESULTS
We conducted interviews with 31 providers. Of these, 12 were on the medicine service, 12 were on the surgery or a surgical subspecialty service, and 7 were on other services; 11 were attending physicians, 12 were resident physicians, 5 were NPs, and 3 were PAs. Only 2 providers—an attending in medicine and a resident in surgery—had a specialty focus that was cardiac-related. Median time in current position was 4 years (Table 1). Seventeen of the interviews were in person, and 14 were conducted by telephone. The mean interview time was 20 minutes and ranged from 11 to 41 minutes.
We identified 5 main themes with 29 supporting codes (Table 2) describing provider attitudes towards the management of chronic disease for hospitalized patients. These themes, with related CFIR constructs, were: 1) perceived impact on patient outcomes (CFIR construct: intervention characteristics, relative advantage); 2) hospital structural characteristics (inner setting, structural characteristics); 3) provider knowledge and self-efficacy (characteristic of individual, knowledge and beliefs about the intervention and self-efficacy); 4) hospital priorities (inner setting, implementation climate, relative priority); and 5) continuity and communication (inner setting, networks and communications). For most themes, subjects described both positive and negative aspects of chronic disease management, as well as related facilitators and barriers to delivery of chronic disease care for hospitalized patients. Illustrative quotes for each theme are shown in Table 3.
Perceived Impact on Patient Outcomes
Perceived impact on patient outcomes was mixed. Most providers believed the management of chronic diseases could lead to improvement in important patient outcomes, including decreased length of stay (LOS), prevention of hospital complication, and decreased readmissions. Surgical providers focused particularly on the benefits of preventing surgical complications and noted that they were more likely to manage chronic conditions—primarily through use of specialist consultation—when they perceived a benefit to prevention of surgical outcomes or a fear that surgery may worsen a stable chronic condition:
“Most of the surgery I do is pretty stressful on the body and is very likely to induce acute on chronic exacerbations of heart failure. For someone with Class II or higher heart failure, I’m definitely gonna have cardiology on board or at least internal medicine on board right from the beginning.”
However, some providers acknowledged that there were potential risks to such management, including “prolonging hospital stays for nonemergent indications” and treatment with therapies that had previously led to an “adverse reaction that wasn’t clearly documented.” Providers were also concerned that treating chronic conditions may take focus away from acute conditions, which could lead to worse patient-centered outcomes. One attending in medicine described it:
“If you do potentially focus on those chronic issues, and there’s already a lot of other stuff going on with the patient, you might not be prioritizing the patient’s active issues appropriately. The patient’s saying, ‘I’m in pain. I’m in pain. I’m in pain,’ and you’re saying, ‘Thank you very much. Look, your heart failure, you didn’t get your beta-blocker.’ There could be a disconnect between patient’s goals, expectations, and your goals and expectations.”
Hospital Structural Characteristics
For many providers, the hospital setting provides a unique opportunity for care of patients with chronic disease. First, a hospitalization is a time for a patient’s management to be reviewed by a new care team. The hospital team reviews the management plan for patients at admission, which is a time to reevaluate whether patients are on evidence-based therapies: “It’s helpful to have a new set of eyes on somebody, like fresh information.” According to providers, this reevaluation can overcome instances of therapeutic inertia by the outpatient physician. Second, the hospital has many resources, including readily available specialist services and diagnostic tests, which can allow a patient-centered approach that coordinates care in 1 place, as a surgery NP described: “I think the advantage for the patient is that they wind up stopping in for 1 thing but we wind up taking care of a few without requiring the need for him or her to go to all these different specialists on the outside. They’re mostly elderly and not able to get around.” Third, the high availability of services and frequent monitoring allows rapid titration of evidence-based medicines, as discussed by a medicine resident: “It’s easier and faster to titrate medication—they’re in a monitored setting; you can ensure compliance.”
Patients may also differ from their usual state while hospitalized, creating both risks and benefits. The hospital setting can provide an opportunity to educate patients on their chronic disease(s) because they are motivated: “They’re in an office visit and their sugars are out of whack or something, they may take it a little bit more seriously if they were just in the hospital even though it was on an unrelated issue. I think it probably just changes their perspective on their disease.” However, in the hospital, patients are in an unusual environment with a restricted diet and forced medication compliance. Furthermore, the acute condition can lead to changes in their chronic disease, as described by 1 medicine attending: “their sugar is high because they’re acutely ill.” Providers expressed concern that changing medications in this setting may lead to adverse events (AEs) when patients return to their usual environment.
Provider Knowledge and Self-Efficacy
Insufficient knowledge of treatments for chronic conditions was cited as a barrier to some providers’ ability to actively manage chronic disease for hospitalized patients. Some providers described management of conditions outside their area as less satisfying than their primary focus. For example, an orthopedic surgeon explained: “…it’s very simple. You see your bone is broken, you fix it, that’s it…it’s intellectually satisfying…managing chronic diseases is less like that.” Reliance on consultants was 1 approach to deal with knowledge gaps in areas outside a provider’s expertise.
For a number of providers, management of stable chronic disease is the responsibility of the outpatient provider. Providers expressed concern that inpatient management was a reach into the domain of the primary care provider (PCP) and might take “away from the primary focus” of the hospitalization. Nonetheless, some providers noted an “ethical responsibility to manage [a] patient correctly,” and some providers believed that engaging in chronic disease management in the hospital would present an opportunity to expand their own expertise.
A few providers were worried about legal risk related to chronic disease management: “we don’t typically deal too much with managing some of these other medical issues for medical and legal reasons.” Providers again suggested that consults can help overcome this concern for risk, as discussed by 1 surgical attending: “We’re all not wanting to be sued, and we want to do the right thing. It costs me nothing to have a cardiologist on board, so like—why not.”
Hospital Priorities
Providers explained that the hospital has strong interests in early discharge and minimizing LOS. These priorities are based on goals of improving patient outcomes, increasing bed availability and hospital volume, and reducing costs. Providers perceive these hospital priorities as potential barriers to chronic disease management, which can increase LOS and costs through additional testing and treatment. As a medicine resident described: “The DBN philosophy, ‘discharge before noon’ philosophy, which is part of the hospital efficiency to get people in and out of the hospital as quickly as [is] safe, or maybe faster. And I think that there’s a culture where you’re encouraged to only focus on the acute issue and tend to defer everything else.”
Continuity and Communication
According to many providers, care continuity between the outpatient setting and the hospital played a major role in management of chronic disease. One barrier to starting a new evidence-based medication was lack of knowledge of patient history. As noted, providers expressed concern that a patient may not be on a given therapy because of an adverse reaction that was not documented in the hospital chart. This is particularly true because, as discussed by a surgery resident, patients with “PCPs outside the system [in which providers] don’t have access to the electronic medical record.” To overcome this barrier, providers attempt to communicate with the outpatient provider to confirm a lack of contraindications to therapies prior to any changes; notably, communication is easier if the inpatient provider has a relationship with the outpatient PCP.
Some providers were more likely to start chronic disease therapies if the patient had no prior outpatient care, because the provider was reassured that there was no rationale for missing therapies. One neurology attending noted that if a patient had newly documented “hypertension even if they were in for something else, I might start them on an antihypertensive, but then arrange for a close follow-up with a new PCP.”
Following hospitalization, providers wanted assurance that any changes to chronic disease management would be followed up by an outpatient physician. Any changes are relayed to the outpatient provider and the “level of communication…with the outpatient provider who’s gonna inherit” these changes can influence how aggressively the inpatient provider manages chronic diseases. Providers may be reluctant to start therapy for patients if they are concerned about outpatient follow up: “they have diabetes and they should really technically be on an ACE [angiotensin converting enzyme]inhibitor and aspirin, but they’re not. I might send them out on the aspirin but I might either start ACE inhibitor and have them follow up with their PCP in 2 weeks if I’m confident that they’ll do it or if I’m really confident that they’ll not follow up, I will help them get the appointment and then the discharge instruction is to the PCP is ‘Please start this patient on ACE inhibitor if they show up.’”
DISCUSSION
Providers frequently perceive benefit to chronic disease management in the hospital, including improvements in clinical outcomes. Notably, providers see opportunities to improve compliance with evidence-based care to overcome potential barriers to managing chronic disease in the outpatient setting, which can be limited by pressure for brief encounters,13 clinical inertia,14 difficulty with close monitoring of patients,15 and care fragmentation.16 Concurrently, inpatient providers are concerned about potential for patient harm related to chronic disease management, primarily related to AEs from medications. Similar to a case study about a patient with outpatient hypotension following aggressive inpatient hypertension management,7 providers fear that changing a patient’s chronic disease management in a hospital setting may cause harm when the patient returns home.
Although some clinicians have argued against aggressive in-hospital chronic disease management because of concerns for risk of AEs,7 our study and others8 have suggested that many clinicians perceive benefit. In some cases, such as smoking cessation counseling for all current smokers and prescribing an angiotensin converting enzyme inhibitor for patients with systolic heart failure, the perceived importance is so great that chronic disease management has been used as a national quality metric for hospitals. While these hospital metrics may be justified for short-term benefits after hospitalization, studies have demonstrated only weak improvement in short-term postdischarge outcomes related to chronic disease management.17 The true benefit is likely from improved processes of care in the short term that lead to long-term improvement in outcomes.4,5,18 Thus, the advantage of starting a patient hospitalized for a stroke on blood pressure medication is the increased likelihood that the patient will continue the medication as an outpatient, which may reduce long-term mortality.
For hospital delivery systems that are concerned with such care process improvement through in-hospital chronic disease management, we identified a number of barriers and facilitators to delivering this care. One significant barrier was poor transitions between the inpatient and the outpatient settings. When a patient transitions into the hospital, providers need to understand prior management choices. Facilitators to help inpatient providers understand prior management included either knowing the outpatient provider, or understanding that there was a lack of regular outpatient care; in both these cases, inpatient providers felt more comfortable managing chronic diseases because they had insight into the outpatient plan, or lack thereof. However, these facilitators may not be practical to incorporate in interventions to improve chronic disease care, which should consider overcoming these communication barriers. Use of shared electronic health records or standardized telephone calls with well-documented care plans obtained through health information exchanges may facilitate an inpatient provider to manage appropriately chronic disease. Similarly, discontinuity between the inpatient provider and the outpatient provider is a barrier that must be overcome to ease concerns that any chronic disease management changes do not result in harm in the postdischarge period. These findings again point to the need for improved documentation and communication between inpatient and outpatient providers. Of course, the transitional care period is one of high risk, and improving communication between providers has been an area of ongoing work.19
Lack of comfort among inpatient providers with managing chronic diseases is another important barrier, which appears to be largely overcome through the use of consultation services. Ready availability of specialists, common in academic medical centers, can facilitate delivery of chronic disease management. Inpatient interventions designed to improve evidence-based care for a chronic disease may benefit from involvement or at least availability of specialists in the effort. Another major barrier relates to hospital priorities, which in our study were closely aligned with external factors such as payment models. As hospitalizations are typically paid based on the discharge diagnosis, hospitals have incentives to discharge quickly and not order extra diagnostic tests. As a result, there are disincentives for chronic disease management that may require additional testing or monitoring in the hospital. Conversely, as hospitals accept postdischarge financial risks through readmission penalties or postdischarge cost savings, hospitals may perceive that long-term benefits of chronic disease management may outweigh short-term costs.
The study findings should be interpreted in the context of its limitations. Findings of our study of providers from a single academic medical center may not be generalizable. Nearly half of our interviews were conducted by telephone, which limits our ability to capture nonverbal cues in communication. Providers may have had social desirability bias towards positive aspects of chronic disease management. We did not have the power to determine differences in response by provider characteristic because this was an exploratory qualitative study. Future studies with representative sampling, a larger sample size, and measures for constructs such as provider self-efficacy are needed to examine differences by specialty, provider type, and experience level.
In conclusion, inpatient providers believe that hospital chronic disease management has the potential to be beneficial for both process of care and clinical outcomes; providers also express concern about potential adverse consequences of managing chronic disease during acute hospitalizations. To maximize both quality of care and patient safety, overcoming communication barriers between inpatient and outpatient providers is needed. Both a supportive hospital environment and availability of specialty support can facilitate in-hospital chronic disease management. Interventions that incorporate these factors may be well-suited to improve chronic disease care and long-term outcomes.
Disclosures
This work was supported by the Agency for Healthcare Research and Quality (AHRQ) grant K08HS23683. The authors report no financial conflicts of interest.
1. Friedman B, Jiang HJ, Elixhauser A, Segal A. Hospital inpatient costs for adults with multiple chronic conditions. Med Care Res Rev. 2006;63(3):327-346. PubMed
2. Steiner CA, Friedman B. Hospital utilization, costs, and mortality for adults with multiple chronic conditions, Nationwide Inpatient Sample, 2009. Prev Chronic Dis. 2013;10:E62. PubMed
3. Blecker S, Paul M, Taksler G, Ogedegbe G, Katz S. Heart failure-associated hospitalizations in the United States. J Am Coll Cardiol. 2013;61(12):1259-1267. PubMed
4. Fonarow GC. Role of in-hospital initiation of carvedilol to improve treatment rates and clinical outcomes. Am J Cardiol. 2004;93(9A):77B-81B. PubMed
5. Touze E, Coste J, Voicu M, et al. Importance of in-hospital initiation of therapies and therapeutic inertia in secondary stroke prevention: IMplementation of Prevention After a Cerebrovascular evenT (IMPACT) Study. Stroke. 2008;39(6):1834-1843. PubMed
6. Ovbiagele B, Saver JL, Fredieu A, et al. In-hospital initiation of secondary stroke prevention therapies yields high rates of adherence at follow-up. Stroke. 2004;35(12):2879-2883. PubMed
7. Steinman MA, Auerbach AD. Managing chronic disease in hospitalized patients. JAMA Intern Med. 2013;173(20):1857-1858. PubMed
8. Breu AC, Allen-Dicker J, Mueller S, Palamara K, Hinami K, Herzig SJ. Hospitalist and primary care physician perspectives on medication management of chronic conditions for hospitalized patients. J Hosp Med. 2014;9(5):303-309. PubMed
9. Damschroder LJ, Aron DC, Keith RE, Kirsh SR, Alexander JA, Lowery JC. Fostering implementation of health services research findings into practice: a consolidated framework for advancing implementation science. Implement Sci. 2009;4:50. PubMed
10. Morse JM. The significance of saturation. Qualitative Health Research. 1995;5(2):147-149.
11. Bradley EH, Curry LA, Devers KJ. Qualitative data analysis for health services research: developing taxonomy, themes, and theory. Health Services Research. 2007;42(4):1758-1772. PubMed
12. Riegel B, Dickson VV, Topaz M. Qualitative analysis of naturalistic decision making in adults with chronic heart failure. Nurs Res. 2013;62(2):91-98. PubMed
13. Linzer M, Konrad TR, Douglas J, et al. Managed care, time pressure, and physician job satisfaction: results from the physician worklife study. J Gen Intern Med. 2000;15(7):441-450. PubMed
14. Phillips LS, Branch WT, Cook CB, et al. Clinical inertia. Ann Intern Med. 2001;135(9):825-834.
15. Dev S, Hoffman TK, Kavalieratos D, et al. Barriers to adoption of mineralocorticoid receptor antagonists in patients with heart failure: A mixed-methods study. J Am Heart Assoc. 2016;4(3):e002493. PubMed
16. Stange KC. The problem of fragmentation and the need for integrative solutions. Ann Fam Med. 2009;7(2):100-103. PubMed
17. Fonarow GC, Abraham WT, Albert NM, et al. Association between performance measures and clinical outcomes for patients hospitalized with heart failure. JAMA. 2007;297(1):61-70. PubMed
18. Shah M, Norwood CA, Farias S, Ibrahim S, Chong PH, Fogelfeld L. Diabetes transitional care from inpatient to outpatient setting: pharmacist discharge counseling. J Pharm Pract. 2013;26(2):120-124. PubMed
19. Kripalani S, LeFevre F, Phillips CO, Williams MV, Basaviah P, Baker DW. Deficits in communication and information transfer between hospital-based and primary care physicians: implications for patient safety and continuity of care. JAMA. 2007;297(8):831-841. PubMed
© 2017 Society of Hospital Medicine
Planned Readmission Algorithm
The Centers for Medicare & Medicaid Services (CMS) publicly reports all‐cause risk‐standardized readmission rates after acute‐care hospitalization for acute myocardial infarction, pneumonia, heart failure, total hip and knee arthroplasty, chronic obstructive pulmonary disease, stroke, and for patients hospital‐wide.[1, 2, 3, 4, 5] Ideally, these measures should capture unplanned readmissions that arise from acute clinical events requiring urgent rehospitalization. Planned readmissions, which are scheduled admissions usually involving nonurgent procedures, may not be a signal of quality of care. Including planned readmissions in readmission quality measures could create a disincentive to provide appropriate care to patients who are scheduled for elective or necessary procedures unrelated to the quality of the prior admission. Accordingly, under contract to the CMS, we were asked to develop an algorithm to identify planned readmissions. A version of this algorithm is now incorporated into all publicly reported readmission measures.
Given the widespread use of the planned readmission algorithm in public reporting and its implications for hospital quality measurement and evaluation, the objective of this study was to describe the development process, and to validate and refine the algorithm by reviewing charts of readmitted patients.
METHODS
Algorithm Development
To create a planned readmission algorithm, we first defined planned. We determined that readmissions for obstetrical delivery, maintenance chemotherapy, major organ transplant, and rehabilitation should always be considered planned in the sense that they are desired and/or inevitable, even if not specifically planned on a certain date. Apart from these specific types of readmissions, we defined planned readmissions as nonacute readmissions for scheduled procedures, because the vast majority of planned admissions are related to procedures. We also defined readmissions for acute illness or for complications of care as unplanned for the purposes of a quality measure. Even if such readmissions included a potentially planned procedure, because complications of care represent an important dimension of quality that should not be excluded from outcome measurement, these admissions should not be removed from the measure outcome. This definition of planned readmissions does not imply that all unplanned readmissions are unexpected or avoidable. However, it has proven very difficult to reliably define avoidable readmissions, even by expert review of charts, and we did not attempt to do so here.[6, 7]
In the second stage, we operationalized this definition into an algorithm. We used the Agency for Healthcare Research and Quality's Clinical Classification Software (CCS) codes to group thousands of individual procedure and diagnosis International Classification of Disease, Ninth Revision, Clinical Modification (ICD‐9‐CM) codes into clinically coherent, mutually exclusive procedure CCS categories and mutually exclusive diagnosis CCS categories, respectively. Clinicians on the investigative team reviewed the procedure categories to identify those that are commonly planned and that would require inpatient admission. We also reviewed the diagnosis categories to identify acute diagnoses unlikely to accompany elective procedures. We then created a flow diagram through which every readmission could be run to determine whether it was planned or unplanned based on our categorizations of procedures and diagnoses (Figure 1, and Supporting Information, Appendix A, in the online version of this article). This version of the algorithm (v1.0) was submitted to the National Quality Forum (NQF) as part of the hospital‐wide readmission measure. The measure (NQR #1789) received endorsement in April 2012.

In the third stage of development, we posted the algorithm for 2 public comment periods and recruited 27 outside experts to review and refine the algorithm following a standardized, structured process (see Supporting Information, Appendix B, in the online version of this article). Because the measures publicly report and hold hospitals accountable for unplanned readmission rates, we felt it most important that the algorithm include as few planned readmissions in the reported, unplanned outcome as possible (ie, have high negative predictive value). Therefore, in equivocal situations in which experts felt procedure categories were equally often planned or unplanned, we added those procedures to the potentially planned list. We also solicited feedback from hospitals on algorithm performance during a confidential test run of the hospital‐wide readmission measure in the fall of 2012. Based on all of this feedback, we made a number of changes to the algorithm, which was then identified as v2.1. Version 2.1 of the algorithm was submitted to the NQF as part of the endorsement process for the acute myocardial infarction and heart failure readmission measures and was endorsed by the NQF in January 2013. The algorithm (v2.1) is now applied, adapted if necessary, to all publicly reported readmission measures.[8]
Algorithm Validation: Study Cohort
We recruited 2 hospital systems to participate in a chart validation study of the accuracy of the planned readmission algorithm (v2.1). Within these 2 health systems, we selected 7 hospitals with varying bed size, teaching status, and safety‐net status. Each included 1 large academic teaching hospital that serves as a regional referral center. For each hospital's index admissions, we applied the inclusion and exclusion criteria from the hospital‐wide readmission measure. Index admissions were included for patients age 65 years or older; enrolled in Medicare fee‐for‐service (FFS); discharged from a nonfederal, short‐stay, acute‐care hospital or critical access hospital; without an in‐hospital death; not transferred to another acute‐care facility; and enrolled in Part A Medicare for 1 year prior to discharge. We excluded index admissions for patients without at least 30 days postdischarge enrollment in FFS Medicare, discharged against medical advice, admitted for medical treatment of cancer or primary psychiatric disease, admitted to a Prospective Payment System‐exempt cancer hospital, or who died during the index hospitalization. In addition, for this study, we included only index admissions that were followed by a readmission to a hospital within the participating health system between July 1, 2011 and June 30, 2012. Institutional review board approval was obtained from each of the participating health systems, which granted waivers of signed informed consent and Health Insurance Portability and Accountability Act waivers.
Algorithm Validation: Sample Size Calculation
We determined a priori that the minimum acceptable positive predictive value, or proportion of all readmissions the algorithm labels planned that are truly planned, would be 60%, and the minimum acceptable negative predictive value, or proportion of all readmissions the algorithm labels as unplanned that are truly unplanned, would be 80%. We calculated the sample size required to be confident of these values 10% and determined we would need a total of 291 planned charts and 162 unplanned charts. We inflated these numbers by 20% to account for missing or unobtainable charts for a total of 550 charts. To achieve this sample size, we included all eligible readmissions from all participating hospitals that were categorized as planned. At the 5 smaller hospitals, we randomly selected an equal number of unplanned readmissions occurring at any hospital in its healthcare system. At the 2 largest hospitals, we randomly selected 50 unplanned readmissions occurring at any hospital in its healthcare system.
Algorithm Validation: Data Abstraction
We developed an abstraction tool, tested and refined it using sample charts, and built the final the tool into a secure, password‐protected Microsoft Access 2007 (Microsoft Corp., Redmond, WA) database (see Supporting Information, Appendix C, in the online version of this article). Experienced chart abstractors with RN or MD degrees from each hospital site participated in a 1‐hour training session to become familiar with reviewing medical charts, defining planned/unplanned readmissions, and the data abstraction process. For each readmission, we asked abstractors to review as needed: emergency department triage and physician notes, admission history and physical, operative report, discharge summary, and/or discharge summary from a prior admission. The abstractors verified the accuracy of the administrative billing data, including procedures and principal diagnosis. In addition, they abstracted the source of admission and dates of all major procedures. Then the abstractors provided their opinion and supporting rationale as to whether a readmission was planned or unplanned. They were not asked to determine whether the readmission was preventable. To determine the inter‐rater reliability of data abstraction, an independent abstractor at each health system recoded a random sample of 10% of the charts.
Statistical Analysis
To ensure that we had obtained a representative sample of charts, we identified the 10 most commonly planned procedures among cases identified as planned by the algorithm in the validation cohort and then compared this with planned cases nationally. To confirm the reliability of the abstraction process, we used the kappa statistic to determine the inter‐rater reliability of the determination of planned or unplanned status. Additionally, the full study team, including 5 practicing clinicians, reviewed the details of every chart abstraction in which the algorithm was found to have misclassified the readmission as planned or unplanned. In 11 cases we determined that the abstractor had misunderstood the definition of planned readmission (ie, not all direct admissions are necessarily planned) and we reclassified the chart review assignment accordingly.
We calculated sensitivity, specificity, positive predictive value, and negative predictive value of the algorithm for the validation cohort as a whole, weighted to account for the prevalence of planned readmissions as defined by the algorithm in the national data (7.8%). Weighting is necessary because we did not obtain a pure random sample, but rather selected a stratified sample that oversampled algorithm‐identified planned readmissions.[9] We also calculated these rates separately for large hospitals (>600 beds) and for small hospitals (600 beds).
Finally, we examined performance of the algorithm for individual procedures and diagnoses to determine whether any procedures or diagnoses should be added or removed from the algorithm. First, we reviewed the diagnoses, procedures, and brief narratives provided by the abstractors for all cases in which the algorithm misclassified the readmission as either planned or unplanned. Second, we calculated the positive predictive value for each procedure that had been flagged as planned by the algorithm, and reviewed all readmissions (correctly and incorrectly classified) in which procedures with low positive predictive value took place. We also calculated the frequency with which the procedure was the only qualifying procedure resulting in an accurate or inaccurate classification. Third, to identify changes that should be made to the lists of acute and nonacute diagnoses, we reviewed the principal diagnosis for all readmissions misclassified by the algorithm as either planned or unplanned, and examined the specific ICD‐9‐CM codes within each CCS group that were most commonly associated with misclassifications.
After determining the changes that should be made to the algorithm based on these analyses, we recalculated the sensitivity, specificity, positive predictive value, and negative predictive value of the proposed revised algorithm (v3.0). All analyses used SAS version 9.3 (SAS Institute, Cary, NC).
RESULTS
Study Cohort
Characteristics of participating hospitals are shown in Table 1. Hospitals represented in this sample ranged in size, teaching status, and safety net status, although all were nonprofit. We selected 663 readmissions for review, 363 planned and 300 unplanned. Overall we were able to select 80% of hospitals planned cases for review; the remainder occurred at hospitals outside the participating hospital system. Abstractors were able to locate and review 634 (96%) of the eligible charts (range, 86%100% per hospital). The kappa statistic for inter‐rater reliability was 0.83.
| Description | Hospitals, N | Readmissions Selected for Review, N* | Readmissions Reviewed, N (% of Eligible) | Unplanned Readmissions Reviewed, N | Planned Readmissions Reviewed, N | % of Hospital's Planned Readmissions Reviewed* | |
|---|---|---|---|---|---|---|---|
| |||||||
| All hospitals | 7 | 663 | 634 (95.6) | 283 | 351 | 77.3 | |
| No. of beds | >600 | 2 | 346 | 339 (98.0) | 116 | 223 | 84.5 |
| >300600 | 2 | 190 | 173 (91.1) | 85 | 88 | 87.1 | |
| <300 | 3 | 127 | 122 (96.0) | 82 | 40 | 44.9 | |
| Ownership | Government | 0 | |||||
| For profit | 0 | ||||||
| Not for profit | 7 | 663 | 634 (95.6) | 283 | 351 | 77.3 | |
| Teaching status | Teaching | 2 | 346 | 339 (98.0) | 116 | 223 | 84.5 |
| Nonteaching | 5 | 317 | 295 (93.1) | 167 | 128 | 67.4 | |
| Safety net status | Safety net | 2 | 346 | 339 (98.0) | 116 | 223 | 84.5 |
| Nonsafety net | 5 | 317 | 295 (93.1) | 167 | 128 | 67.4 | |
| Region | New England | 3 | 409 | 392 (95.8) | 155 | 237 | 85.9 |
| South Central | 4 | 254 | 242 (95.3) | 128 | 114 | 64.0 | |
The study sample included 57/67 (85%) of the procedure or condition categories on the potentially planned list. The most common procedure CCS categories among planned readmissions (v2.1) in the validation cohort were very similar to those in the national dataset (see Supporting Information, Appendix D, in the online version of this article). Of the top 20 most commonly planned procedure CCS categories in the validation set, all but 2, therapeutic radiology for cancer treatment (CCS 211) and peripheral vascular bypass (CCS 55), were among the top 20 most commonly planned procedure CCS categories in the national data.
Test Characteristics of Algorithm
The weighted test characteristics of the current algorithm (v2.1) are shown in Table 2. Overall, the algorithm correctly identified 266 readmissions as unplanned and 181 readmissions as planned, and misidentified 170 readmissions as planned and 15 as unplanned. Once weighted to account for the stratified sampling design, the overall prevalence of true planned readmissions was 8.9% of readmissions. The weighted sensitivity was 45.1% overall and was higher in large teaching centers than in smaller community hospitals. The weighted specificity was 95.9%. The positive predictive value was 51.6%, and the negative predictive value was 94.7%.
| Cohort | Sensitivity | Specificity | Positive Predictive Value | Negative Predictive Value |
|---|---|---|---|---|
| Algorithm v2.1 | ||||
| Full cohort | 45.1% | 95.9% | 51.6% | 94.7% |
| Large hospitals | 50.9% | 96.1% | 53.8% | 95.6% |
| Small hospitals | 40.2% | 95.5% | 47.7% | 94.0% |
| Revised algorithm v3.0 | ||||
| Full cohort | 49.8% | 96.5% | 58.7% | 94.5% |
| Large hospitals | 57.1% | 96.8% | 63.0% | 95.9% |
| Small hospitals | 42.6% | 95.9% | 52.6% | 93.9% |
Accuracy of Individual Diagnoses and Procedures
The positive predictive value of the algorithm for individual procedure categories varied widely, from 0% to 100% among procedures with at least 10 cases (Table 3). The procedure for which the algorithm was least accurate was CCS 211, therapeutic radiology for cancer treatment (0% positive predictive value). By contrast, maintenance chemotherapy (90%) and other therapeutic procedures, hemic and lymphatic system (100%) were most accurate. Common procedures with less than 50% positive predictive value (ie, that the algorithm commonly misclassified as planned) were diagnostic cardiac catheterization (25%); debridement of wound, infection, or burn (25%); amputation of lower extremity (29%); insertion, revision, replacement, removal of cardiac pacemaker or cardioverter/defibrillator (33%); and other hernia repair (43%). Of these, diagnostic cardiac catheterization and cardiac devices are the first and second most common procedures nationally, respectively.
| Readmission Procedure CCS Code | Total Categorized as Planned by Algorithm, N | Verified as Planned by Chart Review, N | Positive Predictive Value |
|---|---|---|---|
| |||
| 47 Diagnostic cardiac catheterization; coronary arteriography | 44 | 11 | 25% |
| 224 Cancer chemotherapy | 40 | 22 | 55% |
| 157 Amputation of lower extremity | 31 | 9 | 29% |
| 49 Other operating room heart procedures | 27 | 16 | 59% |
| 48 Insertion, revision, replacement, removal of cardiac pacemaker or cardioverter/defibrillator | 24 | 8 | 33% |
| 43 Heart valve procedures | 20 | 16 | 80% |
| Maintenance chemotherapy (diagnosis CCS 45) | 20 | 18 | 90% |
| 78 Colorectal resection | 18 | 9 | 50% |
| 169 Debridement of wound, infection or burn | 16 | 4 | 25% |
| 84 Cholecystectomy and common duct exploration | 16 | 5 | 31% |
| 99 Other OR gastrointestinal therapeutic procedures | 16 | 8 | 50% |
| 158 Spinal fusion | 15 | 11 | 73% |
| 142 Partial excision bone | 14 | 10 | 71% |
| 86 Other hernia repair | 14 | 6 | 42% |
| 44 Coronary artery bypass graft | 13 | 10 | 77% |
| 67 Other therapeutic procedures, hemic and lymphatic system | 13 | 13 | 100% |
| 211 Therapeutic radiology for cancer treatment | 12 | 0 | 0% |
| 45 Percutaneous transluminal coronary angioplasty | 11 | 7 | 64% |
| Total | 497 | 272 | 54.7% |
The readmissions with least abstractor agreement were those involving CCS 157 (amputation of lower extremity) and CCS 169 (debridement of wound, infection or burn). Readmissions for these procedures were nearly always performed as a consequence of acute worsening of chronic conditions such as osteomyelitis or ulceration. Abstractors were divided over whether these readmissions were appropriate to call planned.
Changes to the Algorithm
We determined that the accuracy of the algorithm would be improved by removing 2 procedure categories from the planned procedure list (therapeutic radiation [CCS 211] and cancer chemotherapy [CCS 224]), adding 1 diagnosis category to the acute diagnosis list (hypertension with complications [CCS 99]), and splitting 2 diagnosis condition categories into acute and nonacute ICD‐9‐CM codes (pancreatic disorders [CCS 149] and biliary tract disease [CCS 152]). Detailed rationales for each modification to the planned readmission algorithm are described in Table 4. We felt further examination of diagnostic cardiac catheterization and cardiac devices was warranted given their high frequency, despite low positive predictive value. We also elected not to alter the categorization of amputation or debridement because it was not easy to determine whether these admissions were planned or unplanned even with chart review. We plan further analyses of these procedure categories.
| Action | Diagnosis or Procedure Category | Algorithm | Chart | N | Rationale for Change |
|---|---|---|---|---|---|
| |||||
| Remove from planned procedure list | Therapeutic radiation (CCS 211) | Accurate | The algorithm was inaccurate in every case. All therapeutic radiology during readmissions was performed because of acute illness (pain crisis, neurologic crisis) or because scheduled treatment occurred during an unplanned readmission. In national data, this ranks as the 25th most common planned procedure identified by the algorithm v2.1. | ||
| Planned | Planned | 0 | |||
| Unplanned | Unplanned | 0 | |||
| Inaccurate | |||||
| Unplanned | Planned | 0 | |||
| Planned | Unplanned | 12 | |||
| Cancer chemotherapy (CCS 224) | Accurate | Of the 22 correctly identified as planned, 18 (82%) would already have been categorized as planned because of a principal diagnosis of maintenance chemotherapy. Therefore, removing CCS 224 from the planned procedure list would only miss a small fraction of planned readmissions but would avoid a large number of misclassifications. In national data, this ranks as the 8th most common planned procedure identified by the algorithm v2.1. | |||
| Planned | Planned | 22 | |||
| Unplanned | Unplanned | 0 | |||
| Inaccurate | |||||
| Unplanned | Planned | 0 | |||
| Planned | Unplanned | 18 | |||
| Add to planned procedure list | None | The abstractors felt a planned readmission was missed by the algorithm in 15 cases. A handful of these cases were missed because the planned procedure was not on the current planned procedure list; however, those procedures (eg, abdominal paracentesis, colonoscopy, endoscopy) were nearly always unplanned overall and should therefore not be added as procedures that potentially qualify as an admission as planned. | |||
| Remove from acute diagnosis list | None | The abstractors felt a planned readmission was missed by the algorithm in 15 cases. The relevant disqualifying acute diagnoses were much more often associated with unplanned readmissions in our dataset. | |||
| Add to acute diagnosis list | Hypertension with complications (CCS 99) | Accurate | This CCS was associated with only 1 planned readmission (for elective nephrectomy, a very rare procedure). Every other time this CCS appeared in the dataset, it was associated with an unplanned readmission (12/13, 92%); 10 of those, however, were misclassified by the algorithm as planned because they were not excluded by diagnosis (91% error rate). Consequently, adding this CCS to the acute diagnosis list is likely to miss only a very small fraction of planned readmissions, while making the overall algorithm much more accurate. | ||
| Planned | Planned | 1 | |||
| Unplanned | Unplanned | 2 | |||
| Inaccurate | |||||
| Unplanned | Planned | 0 | |||
| Planned | Unplanned | 10 | |||
| Split diagnosis condition category into component ICD‐9 codes | Pancreatic disorders (CCS 152) | Accurate | ICD‐9 code 577.0 (acute pancreatitis) is the only acute code in this CCS. Acute pancreatitis was present in 2 cases that were misclassified as planned. Clinically, there is no situation in which a planned procedure would reasonably be performed in the setting of acute pancreatitis. Moving ICD‐9 code 577.0 to the acute list and leaving the rest of the ICD‐9 codes in CCS 152 on the nonacute list will enable the algorithm to continue to identify planned procedures for chronic pancreatitis. | ||
| Planned | Planned | 0 | |||
| Unplanned | Unplanned | 1 | |||
| Inaccurate | |||||
| Unplanned | Planned | 0 | |||
| Planned | Unplanned | 2 | |||
| Biliary tract disease (CCS 149) | Accurate | This CCS is a mix of acute and chronic diagnoses. Of 14 charts classified as planned with CCS 149 in the principal diagnosis field, 12 were misclassified (of which 10 were associated with cholecystectomy). Separating out the acute and nonacute diagnoses will increase the accuracy of the algorithm while still ensuring that planned cholecystectomies and other procedures can be identified. Of the ICD‐9 codes in CCS 149, the following will be added to the acute diagnosis list: 574.0, 574.3, 574.6, 574.8, 575.0, 575.12, 576.1. | |||
| Planned | Planned | 2 | |||
| Unplanned | Unplanned | 3 | |||
| Inaccurate | |||||
| Unplanned | Planned | 0 | |||
| Planned | Unplanned | 12 | |||
| Consider for change after additional study | Diagnostic cardiac catheterization (CCS 47) | Accurate | The algorithm misclassified as planned 25/38 (66%) unplanned readmissions in which diagnostic catheterizations were the only qualifying planned procedure. It also correctly identified 3/3 (100%) planned readmissions in which diagnostic cardiac catheterizations were the only qualifying planned procedure. This is the highest volume procedure in national data. | ||
| Planned | Planned | 3* | |||
| Unplanned | Unplanned | 13* | |||
| Inaccurate | |||||
| Unplanned | Planned | 0* | |||
| Planned | Unplanned | 25* | |||
| Insertion, revision, replacement, removal of cardiac pacemaker or cardioverter/defibrillator (CCS 48) | Accurate | The algorithm misclassified as planned 4/5 (80%) unplanned readmissions in which cardiac devices were the only qualifying procedure. However, it also correctly identified 7/8 (87.5%) planned readmissions in which cardiac devices were the only qualifying planned procedure. CCS 48 is the second most common planned procedure category nationally. | |||
| Planned | Planned | 7 | |||
| Unplanned | Unplanned | 1 | |||
| Inaccurate | |||||
| Unplanned | Planned | 1 | |||
| Planned | Unplanned | 4 | |||
The revised algorithm (v3.0) had a weighted sensitivity of 49.8%, weighted specificity of 96.5%, positive predictive value of 58.7%, and negative predictive value of 94.5% (Table 2). In aggregate, these changes would increase the reported unplanned readmission rate from 16.0% to 16.1% in the hospital‐wide readmission measure, using 2011 to 2012 data, and would decrease the fraction of all readmissions considered planned from 7.8% to 7.2%.
DISCUSSION
We developed an algorithm based on administrative data that in its currently implemented form is very accurate at identifying unplanned readmissions, ensuring that readmissions included in publicly reported readmission measures are likely to be truly unplanned. However, nearly half of readmissions the algorithm classifies as planned are actually unplanned. That is, the algorithm is overcautious in excluding unplanned readmissions that could have counted as outcomes, particularly among admissions that include diagnostic cardiac catheterization or placement of cardiac devices (pacemakers, defibrillators). However, these errors only occur within the 7.8% of readmissions that are classified as planned and therefore do not affect overall readmission rates dramatically. A perfect algorithm would reclassify approximately half of these planned readmissions as unplanned, increasing the overall readmission rate by 0.6 percentage points.
On the other hand, the algorithm also only identifies approximately half of true planned readmissions as planned. Because the true prevalence of planned readmissions is low (approximately 9% of readmissions based on weighted chart review prevalence, or an absolute rate of 1.4%), this low sensitivity has a small effect on algorithm performance. Removing all true planned readmissions from the measure outcome would decrease the overall readmission rate by 0.8 percentage points, similar to the expected 0.6 percentage point increase that would result from better identifying unplanned readmissions; thus, a perfect algorithm would likely decrease the reported unplanned readmission rate by a net 0.2%. Overall, the existing algorithm appears to come close to the true prevalence of planned readmissions, despite inaccuracy on an individual‐case basis. The algorithm performed best at large hospitals, which are at greatest risk of being statistical outliers and of accruing penalties under the Hospital Readmissions Reduction Program.[10]
We identified several changes that marginally improved the performance of the algorithm by reducing the number of unplanned readmissions that are incorrectly removed from the measure, while avoiding the inappropriate inclusion of planned readmissions in the outcome. This revised algorithm, v3.0, was applied to public reporting of readmission rates at the end of 2014. Overall, implementing these changes increases the reported readmission rate very slightly. We also identified other procedures associated with high inaccuracy rates, removal of which would have larger impact on reporting rates, and which therefore merit further evaluation.
There are other potential methods of identifying planned readmissions. For instance, as of October 1, 2013, new administrative billing codes were created to allow hospitals to indicate that a patient was discharged with a planned acute‐care hospital inpatient readmission, without limitation as to when it will take place.[11] This code must be used at the time of the index admission to indicate that a future planned admission is expected, and was specified only to be used for neonates and patients with acute myocardial infarction. This approach, however, would omit planned readmissions that are not known to the initial discharging team, potentially missing planned readmissions. Conversely, some patients discharged with a plan for readmission may be unexpectedly readmitted for an unplanned reason. Given that the new codes were not available at the time we conducted the validation study, we were not able to determine how often the billing codes accurately identified planned readmissions. This would be an important area to consider for future study.
An alternative approach would be to create indicator codes to be applied at the time of readmission that would indicate whether that admission was planned or unplanned. Such a code would have the advantage of allowing each planned readmission to be flagged by the admitting clinicians at the time of admission rather than by an algorithm that inherently cannot be perfect. However, identifying planned readmissions at the time of readmission would also create opportunity for gaming and inconsistent application of definitions between hospitals; additional checks would need to be put in place to guard against these possibilities.
Our study has some limitations. We relied on the opinion of chart abstractors to determine whether a readmission was planned or unplanned; in a few cases, such as smoldering wounds that ultimately require surgical intervention, that determination is debatable. Abstractions were done at local institutions to minimize risks to patient privacy, and therefore we could not centrally verify determinations of planned status except by reviewing source of admission, dates of procedures, and narrative comments reported by the abstractors. Finally, we did not have sufficient volume of planned procedures to determine accuracy of the algorithm for less common procedure categories or individual procedures within categories.
In summary, we developed an algorithm to identify planned readmissions from administrative data that had high specificity and moderate sensitivity, and refined it based on chart validation. This algorithm is in use in public reporting of readmission measures to maximize the probability that the reported readmission rates represent truly unplanned readmissions.[12]
Disclosures: Financial supportThis work was performed under contract HHSM‐500‐2008‐0025I/HHSM‐500‐T0001, Modification No. 000008, titled Measure Instrument Development and Support, funded by the Centers for Medicare and Medicaid Services (CMS), an agency of the US Department of Health and Human Services. Drs. Horwitz and Ross are supported by the National Institute on Aging (K08 AG038336 and K08 AG032886, respectively) and by the American Federation for Aging Research through the Paul B. Beeson Career Development Award Program. Dr. Krumholz is supported by grant U01 HL105270‐05 (Center for Cardiovascular Outcomes Research at Yale University) from the National Heart, Lung, and Blood Institute. No funding source had any role in the study design; in the collection, analysis, and interpretation of data; or in the writing of the article. The CMS reviewed and approved the use of its data for this work and approved submission of the manuscript. All authors have completed the Unified Competing Interest form at
- , , , et al. Development, validation, and results of a measure of 30‐day readmission following hospitalization for pneumonia. J Hosp Med. 2011;6(3):142–150.
- , , , et al. An administrative claims measure suitable for profiling hospital performance based on 30‐day all‐cause readmission rates among patients with acute myocardial infarction. Circ Cardiovasc Qual Outcomes. 2011;4(2):243–252.
- , , , et al. An administrative claims measure suitable for profiling hospital performance on the basis of 30‐day all‐cause readmission rates among patients with heart failure. Circ Cardiovasc Qual Outcomes. 2008;1:29–37.
- , , , et al. Hospital‐level 30‐day all‐cause risk‐standardized readmission rate following elective primary total hip arthroplasty (THA) and/or total knee arthroplasty (TKA). Available at: http://www.qualitynet.org/dcs/ContentServer?c=Page161(supp10 l):S66–S75.
- , , A meta‐analysis of hospital 30‐day avoidable readmission rates. J Eval Clin Pract. 2011;18(6):1211–1218.
- , , , , Proportion of hospital readmissions deemed avoidable: a systematic review. CMAJ. 2011;183(7):E391–E402.
- , , , et al. Centers for Medicare 3(4):477–492.
- , Characteristics of hospitals receiving penalties under the Hospital Readmissions Reduction Program. JAMA. 2013;309(4):342–343.
- Centers for Medicare and Medicaid Services. Inpatient Prospective Payment System/Long‐Term Care Hospital (IPPS/LTCH) final rule. Fed Regist. 2013;78:50533–50534.
- , , Massachusetts health reforms: uninsurance remains low, self‐reported health status improves as state prepares to tackle costs. Health Aff (Millwood). 2012;31(2):444–451.
The Centers for Medicare & Medicaid Services (CMS) publicly reports all‐cause risk‐standardized readmission rates after acute‐care hospitalization for acute myocardial infarction, pneumonia, heart failure, total hip and knee arthroplasty, chronic obstructive pulmonary disease, stroke, and for patients hospital‐wide.[1, 2, 3, 4, 5] Ideally, these measures should capture unplanned readmissions that arise from acute clinical events requiring urgent rehospitalization. Planned readmissions, which are scheduled admissions usually involving nonurgent procedures, may not be a signal of quality of care. Including planned readmissions in readmission quality measures could create a disincentive to provide appropriate care to patients who are scheduled for elective or necessary procedures unrelated to the quality of the prior admission. Accordingly, under contract to the CMS, we were asked to develop an algorithm to identify planned readmissions. A version of this algorithm is now incorporated into all publicly reported readmission measures.
Given the widespread use of the planned readmission algorithm in public reporting and its implications for hospital quality measurement and evaluation, the objective of this study was to describe the development process, and to validate and refine the algorithm by reviewing charts of readmitted patients.
METHODS
Algorithm Development
To create a planned readmission algorithm, we first defined planned. We determined that readmissions for obstetrical delivery, maintenance chemotherapy, major organ transplant, and rehabilitation should always be considered planned in the sense that they are desired and/or inevitable, even if not specifically planned on a certain date. Apart from these specific types of readmissions, we defined planned readmissions as nonacute readmissions for scheduled procedures, because the vast majority of planned admissions are related to procedures. We also defined readmissions for acute illness or for complications of care as unplanned for the purposes of a quality measure. Even if such readmissions included a potentially planned procedure, because complications of care represent an important dimension of quality that should not be excluded from outcome measurement, these admissions should not be removed from the measure outcome. This definition of planned readmissions does not imply that all unplanned readmissions are unexpected or avoidable. However, it has proven very difficult to reliably define avoidable readmissions, even by expert review of charts, and we did not attempt to do so here.[6, 7]
In the second stage, we operationalized this definition into an algorithm. We used the Agency for Healthcare Research and Quality's Clinical Classification Software (CCS) codes to group thousands of individual procedure and diagnosis International Classification of Disease, Ninth Revision, Clinical Modification (ICD‐9‐CM) codes into clinically coherent, mutually exclusive procedure CCS categories and mutually exclusive diagnosis CCS categories, respectively. Clinicians on the investigative team reviewed the procedure categories to identify those that are commonly planned and that would require inpatient admission. We also reviewed the diagnosis categories to identify acute diagnoses unlikely to accompany elective procedures. We then created a flow diagram through which every readmission could be run to determine whether it was planned or unplanned based on our categorizations of procedures and diagnoses (Figure 1, and Supporting Information, Appendix A, in the online version of this article). This version of the algorithm (v1.0) was submitted to the National Quality Forum (NQF) as part of the hospital‐wide readmission measure. The measure (NQR #1789) received endorsement in April 2012.
In the third stage of development, we posted the algorithm for 2 public comment periods and recruited 27 outside experts to review and refine the algorithm following a standardized, structured process (see Supporting Information, Appendix B, in the online version of this article). Because the measures publicly report and hold hospitals accountable for unplanned readmission rates, we felt it most important that the algorithm include as few planned readmissions in the reported, unplanned outcome as possible (ie, have high negative predictive value). Therefore, in equivocal situations in which experts felt procedure categories were equally often planned or unplanned, we added those procedures to the potentially planned list. We also solicited feedback from hospitals on algorithm performance during a confidential test run of the hospital‐wide readmission measure in the fall of 2012. Based on all of this feedback, we made a number of changes to the algorithm, which was then identified as v2.1. Version 2.1 of the algorithm was submitted to the NQF as part of the endorsement process for the acute myocardial infarction and heart failure readmission measures and was endorsed by the NQF in January 2013. The algorithm (v2.1) is now applied, adapted if necessary, to all publicly reported readmission measures.[8]
Algorithm Validation: Study Cohort
We recruited 2 hospital systems to participate in a chart validation study of the accuracy of the planned readmission algorithm (v2.1). Within these 2 health systems, we selected 7 hospitals with varying bed size, teaching status, and safety‐net status. Each included 1 large academic teaching hospital that serves as a regional referral center. For each hospital's index admissions, we applied the inclusion and exclusion criteria from the hospital‐wide readmission measure. Index admissions were included for patients age 65 years or older; enrolled in Medicare fee‐for‐service (FFS); discharged from a nonfederal, short‐stay, acute‐care hospital or critical access hospital; without an in‐hospital death; not transferred to another acute‐care facility; and enrolled in Part A Medicare for 1 year prior to discharge. We excluded index admissions for patients without at least 30 days postdischarge enrollment in FFS Medicare, discharged against medical advice, admitted for medical treatment of cancer or primary psychiatric disease, admitted to a Prospective Payment System‐exempt cancer hospital, or who died during the index hospitalization. In addition, for this study, we included only index admissions that were followed by a readmission to a hospital within the participating health system between July 1, 2011 and June 30, 2012. Institutional review board approval was obtained from each of the participating health systems, which granted waivers of signed informed consent and Health Insurance Portability and Accountability Act waivers.
Algorithm Validation: Sample Size Calculation
We determined a priori that the minimum acceptable positive predictive value, or proportion of all readmissions the algorithm labels planned that are truly planned, would be 60%, and the minimum acceptable negative predictive value, or proportion of all readmissions the algorithm labels as unplanned that are truly unplanned, would be 80%. We calculated the sample size required to be confident of these values 10% and determined we would need a total of 291 planned charts and 162 unplanned charts. We inflated these numbers by 20% to account for missing or unobtainable charts for a total of 550 charts. To achieve this sample size, we included all eligible readmissions from all participating hospitals that were categorized as planned. At the 5 smaller hospitals, we randomly selected an equal number of unplanned readmissions occurring at any hospital in its healthcare system. At the 2 largest hospitals, we randomly selected 50 unplanned readmissions occurring at any hospital in its healthcare system.
Algorithm Validation: Data Abstraction
We developed an abstraction tool, tested and refined it using sample charts, and built the final the tool into a secure, password‐protected Microsoft Access 2007 (Microsoft Corp., Redmond, WA) database (see Supporting Information, Appendix C, in the online version of this article). Experienced chart abstractors with RN or MD degrees from each hospital site participated in a 1‐hour training session to become familiar with reviewing medical charts, defining planned/unplanned readmissions, and the data abstraction process. For each readmission, we asked abstractors to review as needed: emergency department triage and physician notes, admission history and physical, operative report, discharge summary, and/or discharge summary from a prior admission. The abstractors verified the accuracy of the administrative billing data, including procedures and principal diagnosis. In addition, they abstracted the source of admission and dates of all major procedures. Then the abstractors provided their opinion and supporting rationale as to whether a readmission was planned or unplanned. They were not asked to determine whether the readmission was preventable. To determine the inter‐rater reliability of data abstraction, an independent abstractor at each health system recoded a random sample of 10% of the charts.
Statistical Analysis
To ensure that we had obtained a representative sample of charts, we identified the 10 most commonly planned procedures among cases identified as planned by the algorithm in the validation cohort and then compared this with planned cases nationally. To confirm the reliability of the abstraction process, we used the kappa statistic to determine the inter‐rater reliability of the determination of planned or unplanned status. Additionally, the full study team, including 5 practicing clinicians, reviewed the details of every chart abstraction in which the algorithm was found to have misclassified the readmission as planned or unplanned. In 11 cases we determined that the abstractor had misunderstood the definition of planned readmission (ie, not all direct admissions are necessarily planned) and we reclassified the chart review assignment accordingly.
We calculated sensitivity, specificity, positive predictive value, and negative predictive value of the algorithm for the validation cohort as a whole, weighted to account for the prevalence of planned readmissions as defined by the algorithm in the national data (7.8%). Weighting is necessary because we did not obtain a pure random sample, but rather selected a stratified sample that oversampled algorithm‐identified planned readmissions.[9] We also calculated these rates separately for large hospitals (>600 beds) and for small hospitals (600 beds).
Finally, we examined performance of the algorithm for individual procedures and diagnoses to determine whether any procedures or diagnoses should be added or removed from the algorithm. First, we reviewed the diagnoses, procedures, and brief narratives provided by the abstractors for all cases in which the algorithm misclassified the readmission as either planned or unplanned. Second, we calculated the positive predictive value for each procedure that had been flagged as planned by the algorithm, and reviewed all readmissions (correctly and incorrectly classified) in which procedures with low positive predictive value took place. We also calculated the frequency with which the procedure was the only qualifying procedure resulting in an accurate or inaccurate classification. Third, to identify changes that should be made to the lists of acute and nonacute diagnoses, we reviewed the principal diagnosis for all readmissions misclassified by the algorithm as either planned or unplanned, and examined the specific ICD‐9‐CM codes within each CCS group that were most commonly associated with misclassifications.
After determining the changes that should be made to the algorithm based on these analyses, we recalculated the sensitivity, specificity, positive predictive value, and negative predictive value of the proposed revised algorithm (v3.0). All analyses used SAS version 9.3 (SAS Institute, Cary, NC).
RESULTS
Study Cohort
Characteristics of participating hospitals are shown in Table 1. Hospitals represented in this sample ranged in size, teaching status, and safety net status, although all were nonprofit. We selected 663 readmissions for review, 363 planned and 300 unplanned. Overall we were able to select 80% of hospitals planned cases for review; the remainder occurred at hospitals outside the participating hospital system. Abstractors were able to locate and review 634 (96%) of the eligible charts (range, 86%100% per hospital). The kappa statistic for inter‐rater reliability was 0.83.
| Description | Hospitals, N | Readmissions Selected for Review, N* | Readmissions Reviewed, N (% of Eligible) | Unplanned Readmissions Reviewed, N | Planned Readmissions Reviewed, N | % of Hospital's Planned Readmissions Reviewed* | |
|---|---|---|---|---|---|---|---|
| |||||||
| All hospitals | 7 | 663 | 634 (95.6) | 283 | 351 | 77.3 | |
| No. of beds | >600 | 2 | 346 | 339 (98.0) | 116 | 223 | 84.5 |
| >300600 | 2 | 190 | 173 (91.1) | 85 | 88 | 87.1 | |
| <300 | 3 | 127 | 122 (96.0) | 82 | 40 | 44.9 | |
| Ownership | Government | 0 | |||||
| For profit | 0 | ||||||
| Not for profit | 7 | 663 | 634 (95.6) | 283 | 351 | 77.3 | |
| Teaching status | Teaching | 2 | 346 | 339 (98.0) | 116 | 223 | 84.5 |
| Nonteaching | 5 | 317 | 295 (93.1) | 167 | 128 | 67.4 | |
| Safety net status | Safety net | 2 | 346 | 339 (98.0) | 116 | 223 | 84.5 |
| Nonsafety net | 5 | 317 | 295 (93.1) | 167 | 128 | 67.4 | |
| Region | New England | 3 | 409 | 392 (95.8) | 155 | 237 | 85.9 |
| South Central | 4 | 254 | 242 (95.3) | 128 | 114 | 64.0 | |
The study sample included 57/67 (85%) of the procedure or condition categories on the potentially planned list. The most common procedure CCS categories among planned readmissions (v2.1) in the validation cohort were very similar to those in the national dataset (see Supporting Information, Appendix D, in the online version of this article). Of the top 20 most commonly planned procedure CCS categories in the validation set, all but 2, therapeutic radiology for cancer treatment (CCS 211) and peripheral vascular bypass (CCS 55), were among the top 20 most commonly planned procedure CCS categories in the national data.
Test Characteristics of Algorithm
The weighted test characteristics of the current algorithm (v2.1) are shown in Table 2. Overall, the algorithm correctly identified 266 readmissions as unplanned and 181 readmissions as planned, and misidentified 170 readmissions as planned and 15 as unplanned. Once weighted to account for the stratified sampling design, the overall prevalence of true planned readmissions was 8.9% of readmissions. The weighted sensitivity was 45.1% overall and was higher in large teaching centers than in smaller community hospitals. The weighted specificity was 95.9%. The positive predictive value was 51.6%, and the negative predictive value was 94.7%.
| Cohort | Sensitivity | Specificity | Positive Predictive Value | Negative Predictive Value |
|---|---|---|---|---|
| Algorithm v2.1 | ||||
| Full cohort | 45.1% | 95.9% | 51.6% | 94.7% |
| Large hospitals | 50.9% | 96.1% | 53.8% | 95.6% |
| Small hospitals | 40.2% | 95.5% | 47.7% | 94.0% |
| Revised algorithm v3.0 | ||||
| Full cohort | 49.8% | 96.5% | 58.7% | 94.5% |
| Large hospitals | 57.1% | 96.8% | 63.0% | 95.9% |
| Small hospitals | 42.6% | 95.9% | 52.6% | 93.9% |
Accuracy of Individual Diagnoses and Procedures
The positive predictive value of the algorithm for individual procedure categories varied widely, from 0% to 100% among procedures with at least 10 cases (Table 3). The procedure for which the algorithm was least accurate was CCS 211, therapeutic radiology for cancer treatment (0% positive predictive value). By contrast, maintenance chemotherapy (90%) and other therapeutic procedures, hemic and lymphatic system (100%) were most accurate. Common procedures with less than 50% positive predictive value (ie, that the algorithm commonly misclassified as planned) were diagnostic cardiac catheterization (25%); debridement of wound, infection, or burn (25%); amputation of lower extremity (29%); insertion, revision, replacement, removal of cardiac pacemaker or cardioverter/defibrillator (33%); and other hernia repair (43%). Of these, diagnostic cardiac catheterization and cardiac devices are the first and second most common procedures nationally, respectively.
| Readmission Procedure CCS Code | Total Categorized as Planned by Algorithm, N | Verified as Planned by Chart Review, N | Positive Predictive Value |
|---|---|---|---|
| |||
| 47 Diagnostic cardiac catheterization; coronary arteriography | 44 | 11 | 25% |
| 224 Cancer chemotherapy | 40 | 22 | 55% |
| 157 Amputation of lower extremity | 31 | 9 | 29% |
| 49 Other operating room heart procedures | 27 | 16 | 59% |
| 48 Insertion, revision, replacement, removal of cardiac pacemaker or cardioverter/defibrillator | 24 | 8 | 33% |
| 43 Heart valve procedures | 20 | 16 | 80% |
| Maintenance chemotherapy (diagnosis CCS 45) | 20 | 18 | 90% |
| 78 Colorectal resection | 18 | 9 | 50% |
| 169 Debridement of wound, infection or burn | 16 | 4 | 25% |
| 84 Cholecystectomy and common duct exploration | 16 | 5 | 31% |
| 99 Other OR gastrointestinal therapeutic procedures | 16 | 8 | 50% |
| 158 Spinal fusion | 15 | 11 | 73% |
| 142 Partial excision bone | 14 | 10 | 71% |
| 86 Other hernia repair | 14 | 6 | 42% |
| 44 Coronary artery bypass graft | 13 | 10 | 77% |
| 67 Other therapeutic procedures, hemic and lymphatic system | 13 | 13 | 100% |
| 211 Therapeutic radiology for cancer treatment | 12 | 0 | 0% |
| 45 Percutaneous transluminal coronary angioplasty | 11 | 7 | 64% |
| Total | 497 | 272 | 54.7% |
The readmissions with least abstractor agreement were those involving CCS 157 (amputation of lower extremity) and CCS 169 (debridement of wound, infection or burn). Readmissions for these procedures were nearly always performed as a consequence of acute worsening of chronic conditions such as osteomyelitis or ulceration. Abstractors were divided over whether these readmissions were appropriate to call planned.
Changes to the Algorithm
We determined that the accuracy of the algorithm would be improved by removing 2 procedure categories from the planned procedure list (therapeutic radiation [CCS 211] and cancer chemotherapy [CCS 224]), adding 1 diagnosis category to the acute diagnosis list (hypertension with complications [CCS 99]), and splitting 2 diagnosis condition categories into acute and nonacute ICD‐9‐CM codes (pancreatic disorders [CCS 149] and biliary tract disease [CCS 152]). Detailed rationales for each modification to the planned readmission algorithm are described in Table 4. We felt further examination of diagnostic cardiac catheterization and cardiac devices was warranted given their high frequency, despite low positive predictive value. We also elected not to alter the categorization of amputation or debridement because it was not easy to determine whether these admissions were planned or unplanned even with chart review. We plan further analyses of these procedure categories.
| Action | Diagnosis or Procedure Category | Algorithm | Chart | N | Rationale for Change |
|---|---|---|---|---|---|
| |||||
| Remove from planned procedure list | Therapeutic radiation (CCS 211) | Accurate | The algorithm was inaccurate in every case. All therapeutic radiology during readmissions was performed because of acute illness (pain crisis, neurologic crisis) or because scheduled treatment occurred during an unplanned readmission. In national data, this ranks as the 25th most common planned procedure identified by the algorithm v2.1. | ||
| Planned | Planned | 0 | |||
| Unplanned | Unplanned | 0 | |||
| Inaccurate | |||||
| Unplanned | Planned | 0 | |||
| Planned | Unplanned | 12 | |||
| Cancer chemotherapy (CCS 224) | Accurate | Of the 22 correctly identified as planned, 18 (82%) would already have been categorized as planned because of a principal diagnosis of maintenance chemotherapy. Therefore, removing CCS 224 from the planned procedure list would only miss a small fraction of planned readmissions but would avoid a large number of misclassifications. In national data, this ranks as the 8th most common planned procedure identified by the algorithm v2.1. | |||
| Planned | Planned | 22 | |||
| Unplanned | Unplanned | 0 | |||
| Inaccurate | |||||
| Unplanned | Planned | 0 | |||
| Planned | Unplanned | 18 | |||
| Add to planned procedure list | None | The abstractors felt a planned readmission was missed by the algorithm in 15 cases. A handful of these cases were missed because the planned procedure was not on the current planned procedure list; however, those procedures (eg, abdominal paracentesis, colonoscopy, endoscopy) were nearly always unplanned overall and should therefore not be added as procedures that potentially qualify as an admission as planned. | |||
| Remove from acute diagnosis list | None | The abstractors felt a planned readmission was missed by the algorithm in 15 cases. The relevant disqualifying acute diagnoses were much more often associated with unplanned readmissions in our dataset. | |||
| Add to acute diagnosis list | Hypertension with complications (CCS 99) | Accurate | This CCS was associated with only 1 planned readmission (for elective nephrectomy, a very rare procedure). Every other time this CCS appeared in the dataset, it was associated with an unplanned readmission (12/13, 92%); 10 of those, however, were misclassified by the algorithm as planned because they were not excluded by diagnosis (91% error rate). Consequently, adding this CCS to the acute diagnosis list is likely to miss only a very small fraction of planned readmissions, while making the overall algorithm much more accurate. | ||
| Planned | Planned | 1 | |||
| Unplanned | Unplanned | 2 | |||
| Inaccurate | |||||
| Unplanned | Planned | 0 | |||
| Planned | Unplanned | 10 | |||
| Split diagnosis condition category into component ICD‐9 codes | Pancreatic disorders (CCS 152) | Accurate | ICD‐9 code 577.0 (acute pancreatitis) is the only acute code in this CCS. Acute pancreatitis was present in 2 cases that were misclassified as planned. Clinically, there is no situation in which a planned procedure would reasonably be performed in the setting of acute pancreatitis. Moving ICD‐9 code 577.0 to the acute list and leaving the rest of the ICD‐9 codes in CCS 152 on the nonacute list will enable the algorithm to continue to identify planned procedures for chronic pancreatitis. | ||
| Planned | Planned | 0 | |||
| Unplanned | Unplanned | 1 | |||
| Inaccurate | |||||
| Unplanned | Planned | 0 | |||
| Planned | Unplanned | 2 | |||
| Biliary tract disease (CCS 149) | Accurate | This CCS is a mix of acute and chronic diagnoses. Of 14 charts classified as planned with CCS 149 in the principal diagnosis field, 12 were misclassified (of which 10 were associated with cholecystectomy). Separating out the acute and nonacute diagnoses will increase the accuracy of the algorithm while still ensuring that planned cholecystectomies and other procedures can be identified. Of the ICD‐9 codes in CCS 149, the following will be added to the acute diagnosis list: 574.0, 574.3, 574.6, 574.8, 575.0, 575.12, 576.1. | |||
| Planned | Planned | 2 | |||
| Unplanned | Unplanned | 3 | |||
| Inaccurate | |||||
| Unplanned | Planned | 0 | |||
| Planned | Unplanned | 12 | |||
| Consider for change after additional study | Diagnostic cardiac catheterization (CCS 47) | Accurate | The algorithm misclassified as planned 25/38 (66%) unplanned readmissions in which diagnostic catheterizations were the only qualifying planned procedure. It also correctly identified 3/3 (100%) planned readmissions in which diagnostic cardiac catheterizations were the only qualifying planned procedure. This is the highest volume procedure in national data. | ||
| Planned | Planned | 3* | |||
| Unplanned | Unplanned | 13* | |||
| Inaccurate | |||||
| Unplanned | Planned | 0* | |||
| Planned | Unplanned | 25* | |||
| Insertion, revision, replacement, removal of cardiac pacemaker or cardioverter/defibrillator (CCS 48) | Accurate | The algorithm misclassified as planned 4/5 (80%) unplanned readmissions in which cardiac devices were the only qualifying procedure. However, it also correctly identified 7/8 (87.5%) planned readmissions in which cardiac devices were the only qualifying planned procedure. CCS 48 is the second most common planned procedure category nationally. | |||
| Planned | Planned | 7 | |||
| Unplanned | Unplanned | 1 | |||
| Inaccurate | |||||
| Unplanned | Planned | 1 | |||
| Planned | Unplanned | 4 | |||
The revised algorithm (v3.0) had a weighted sensitivity of 49.8%, weighted specificity of 96.5%, positive predictive value of 58.7%, and negative predictive value of 94.5% (Table 2). In aggregate, these changes would increase the reported unplanned readmission rate from 16.0% to 16.1% in the hospital‐wide readmission measure, using 2011 to 2012 data, and would decrease the fraction of all readmissions considered planned from 7.8% to 7.2%.
DISCUSSION
We developed an algorithm based on administrative data that in its currently implemented form is very accurate at identifying unplanned readmissions, ensuring that readmissions included in publicly reported readmission measures are likely to be truly unplanned. However, nearly half of readmissions the algorithm classifies as planned are actually unplanned. That is, the algorithm is overcautious in excluding unplanned readmissions that could have counted as outcomes, particularly among admissions that include diagnostic cardiac catheterization or placement of cardiac devices (pacemakers, defibrillators). However, these errors only occur within the 7.8% of readmissions that are classified as planned and therefore do not affect overall readmission rates dramatically. A perfect algorithm would reclassify approximately half of these planned readmissions as unplanned, increasing the overall readmission rate by 0.6 percentage points.
On the other hand, the algorithm also only identifies approximately half of true planned readmissions as planned. Because the true prevalence of planned readmissions is low (approximately 9% of readmissions based on weighted chart review prevalence, or an absolute rate of 1.4%), this low sensitivity has a small effect on algorithm performance. Removing all true planned readmissions from the measure outcome would decrease the overall readmission rate by 0.8 percentage points, similar to the expected 0.6 percentage point increase that would result from better identifying unplanned readmissions; thus, a perfect algorithm would likely decrease the reported unplanned readmission rate by a net 0.2%. Overall, the existing algorithm appears to come close to the true prevalence of planned readmissions, despite inaccuracy on an individual‐case basis. The algorithm performed best at large hospitals, which are at greatest risk of being statistical outliers and of accruing penalties under the Hospital Readmissions Reduction Program.[10]
We identified several changes that marginally improved the performance of the algorithm by reducing the number of unplanned readmissions that are incorrectly removed from the measure, while avoiding the inappropriate inclusion of planned readmissions in the outcome. This revised algorithm, v3.0, was applied to public reporting of readmission rates at the end of 2014. Overall, implementing these changes increases the reported readmission rate very slightly. We also identified other procedures associated with high inaccuracy rates, removal of which would have larger impact on reporting rates, and which therefore merit further evaluation.
There are other potential methods of identifying planned readmissions. For instance, as of October 1, 2013, new administrative billing codes were created to allow hospitals to indicate that a patient was discharged with a planned acute‐care hospital inpatient readmission, without limitation as to when it will take place.[11] This code must be used at the time of the index admission to indicate that a future planned admission is expected, and was specified only to be used for neonates and patients with acute myocardial infarction. This approach, however, would omit planned readmissions that are not known to the initial discharging team, potentially missing planned readmissions. Conversely, some patients discharged with a plan for readmission may be unexpectedly readmitted for an unplanned reason. Given that the new codes were not available at the time we conducted the validation study, we were not able to determine how often the billing codes accurately identified planned readmissions. This would be an important area to consider for future study.
An alternative approach would be to create indicator codes to be applied at the time of readmission that would indicate whether that admission was planned or unplanned. Such a code would have the advantage of allowing each planned readmission to be flagged by the admitting clinicians at the time of admission rather than by an algorithm that inherently cannot be perfect. However, identifying planned readmissions at the time of readmission would also create opportunity for gaming and inconsistent application of definitions between hospitals; additional checks would need to be put in place to guard against these possibilities.
Our study has some limitations. We relied on the opinion of chart abstractors to determine whether a readmission was planned or unplanned; in a few cases, such as smoldering wounds that ultimately require surgical intervention, that determination is debatable. Abstractions were done at local institutions to minimize risks to patient privacy, and therefore we could not centrally verify determinations of planned status except by reviewing source of admission, dates of procedures, and narrative comments reported by the abstractors. Finally, we did not have sufficient volume of planned procedures to determine accuracy of the algorithm for less common procedure categories or individual procedures within categories.
In summary, we developed an algorithm to identify planned readmissions from administrative data that had high specificity and moderate sensitivity, and refined it based on chart validation. This algorithm is in use in public reporting of readmission measures to maximize the probability that the reported readmission rates represent truly unplanned readmissions.[12]
Disclosures: Financial supportThis work was performed under contract HHSM‐500‐2008‐0025I/HHSM‐500‐T0001, Modification No. 000008, titled Measure Instrument Development and Support, funded by the Centers for Medicare and Medicaid Services (CMS), an agency of the US Department of Health and Human Services. Drs. Horwitz and Ross are supported by the National Institute on Aging (K08 AG038336 and K08 AG032886, respectively) and by the American Federation for Aging Research through the Paul B. Beeson Career Development Award Program. Dr. Krumholz is supported by grant U01 HL105270‐05 (Center for Cardiovascular Outcomes Research at Yale University) from the National Heart, Lung, and Blood Institute. No funding source had any role in the study design; in the collection, analysis, and interpretation of data; or in the writing of the article. The CMS reviewed and approved the use of its data for this work and approved submission of the manuscript. All authors have completed the Unified Competing Interest form at
- , , , et al. Development, validation, and results of a measure of 30‐day readmission following hospitalization for pneumonia. J Hosp Med. 2011;6(3):142–150.
- , , , et al. An administrative claims measure suitable for profiling hospital performance based on 30‐day all‐cause readmission rates among patients with acute myocardial infarction. Circ Cardiovasc Qual Outcomes. 2011;4(2):243–252.
- , , , et al. An administrative claims measure suitable for profiling hospital performance on the basis of 30‐day all‐cause readmission rates among patients with heart failure. Circ Cardiovasc Qual Outcomes. 2008;1:29–37.
- , , , et al. Hospital‐level 30‐day all‐cause risk‐standardized readmission rate following elective primary total hip arthroplasty (THA) and/or total knee arthroplasty (TKA). Available at: http://www.qualitynet.org/dcs/ContentServer?c=Page161(supp10 l):S66–S75.
- , , A meta‐analysis of hospital 30‐day avoidable readmission rates. J Eval Clin Pract. 2011;18(6):1211–1218.
- , , , , Proportion of hospital readmissions deemed avoidable: a systematic review. CMAJ. 2011;183(7):E391–E402.
- , , , et al. Centers for Medicare 3(4):477–492.
- , Characteristics of hospitals receiving penalties under the Hospital Readmissions Reduction Program. JAMA. 2013;309(4):342–343.
- Centers for Medicare and Medicaid Services. Inpatient Prospective Payment System/Long‐Term Care Hospital (IPPS/LTCH) final rule. Fed Regist. 2013;78:50533–50534.
- , , Massachusetts health reforms: uninsurance remains low, self‐reported health status improves as state prepares to tackle costs. Health Aff (Millwood). 2012;31(2):444–451.
© 2015 Society of Hospital Medicine
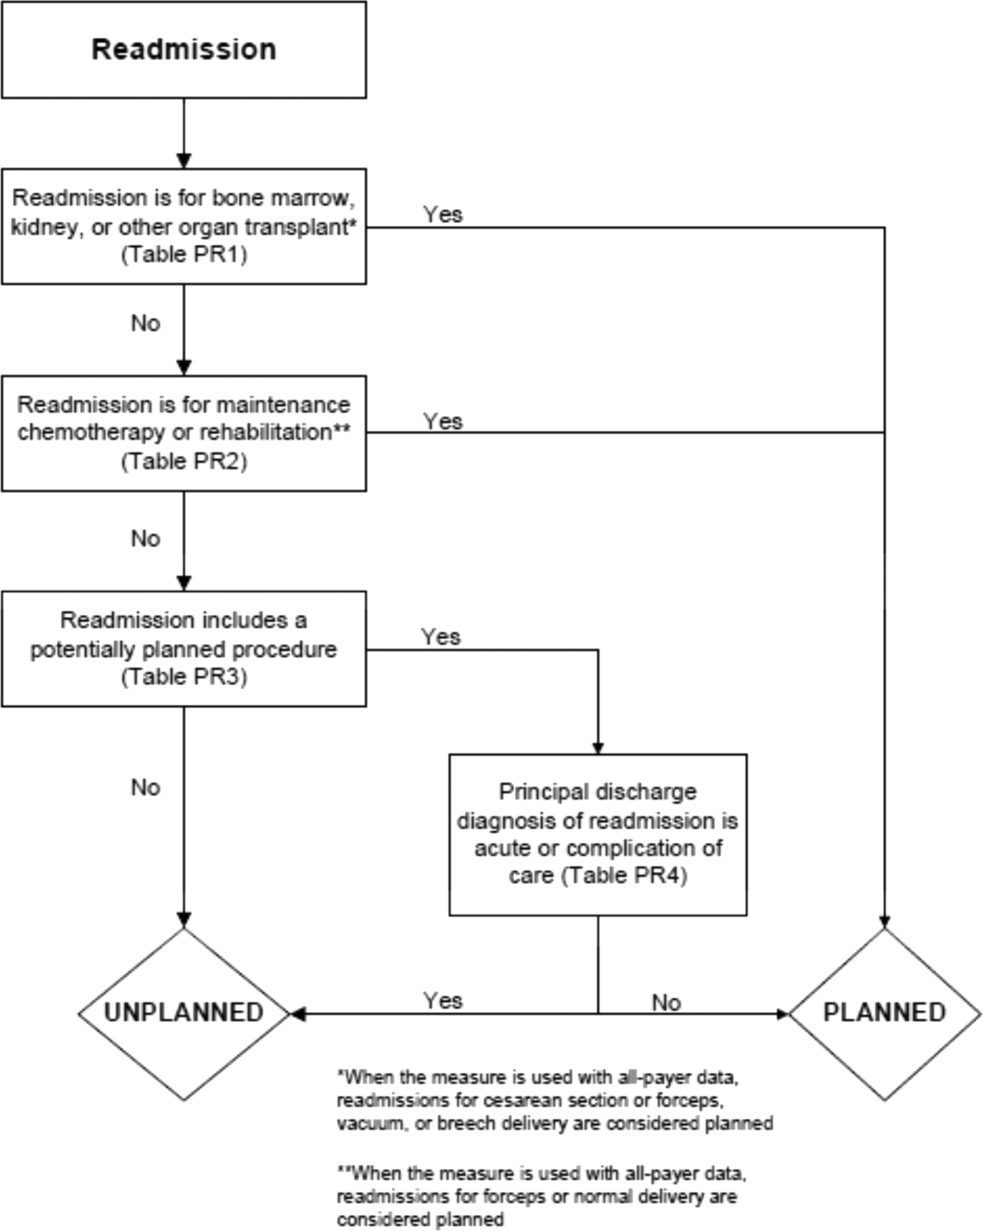
Glucose Management and Inpatient Mortality
Patients with diabetes currently comprise over 8% of the US population (over 25 million people) and more than 20% of hospitalized patients.[1, 2] Hospitalizations of patients with diabetes account for 23% of total hospital costs in the United States,[2] and patients with diabetes have worse outcomes after hospitalization for a variety of common medical conditions,[3, 4, 5, 6] as well as in intensive care unit (ICU) settings.[7, 8] Individuals with diabetes have historically experienced higher inpatient mortality than individuals without diabetes.[9] However, we recently reported that patients with diabetes at our large academic medical center have experienced a disproportionate reduction in in‐hospital mortality relative to patients without diabetes over the past decade.[10] This surprising trend begs further inquiry.
Improvement in in‐hospital mortality among patients with diabetes may stem from improved inpatient glycemic management. The landmark 2001 study by van den Berghe et al. demonstrating that intensive insulin therapy reduced postsurgical mortality among ICU patients ushered in an era of intensive inpatient glucose control.[11] However, follow‐up multicenter studies have not been able to replicate these results.[12, 13, 14, 15] In non‐ICU and nonsurgical settings, intensive glucose control has not yet been shown to have any mortality benefit, although it may impact other morbidities, such as postoperative infections.[16] Consequently, less stringent glycemic targets are now recommended.[17] Nonetheless, hospitals are being held accountable for certain aspects of inpatient glucose control. For example, the Centers for Medicare & Medicaid Services (CMS) began asking hospitals to report inpatient glucose control in cardiac surgery patients in 2004.[18] This measure is now publicly reported, and as of 2013 is included in the CMS Value‐Based Purchasing Program, which financially penalizes hospitals that do not meet targets.
Outpatient diabetes standards have also evolved in the past decade. The Diabetes Control and Complications Trial in 1993 and the United Kingdom Prospective Diabetes Study in 1997 demonstrated that better glycemic control in type 1 and newly diagnosed type 2 diabetes patients, respectively, improved clinical outcomes, and prompted guidelines for pharmacologic treatment of diabetic patients.[19, 20] However, subsequent randomized clinical trials have failed to establish a clear beneficial effect of intensive glucose control on primary cardiovascular endpoints among higher‐risk patients with longstanding type 2 diabetes,[21, 22, 23] and clinical practice recommendations now accept a more individualized approach to glycemic control.[24] Nonetheless, clinicians are also being held accountable for outpatient glucose control.[25]
To better understand the disproportionate reduction in mortality among hospitalized patients with diabetes that we observed, we first examined whether it was limited to surgical patients or patients in the ICU, the populations that have been demonstrated to benefit from intensive inpatient glucose control. Furthermore, given recent improvements in inpatient and outpatient glycemic control,[26, 27] we examined whether inpatient or outpatient glucose control explained the mortality trends. Results from this study contribute empirical evidence on real‐world effects of efforts to improve inpatient and outpatient glycemic control.
METHODS
Setting
During the study period, YaleNew Haven Hospital (YNHH) was an urban academic medical center in New Haven, Connecticut, with over 950 beds and an average of approximately 32,000 annual adult nonobstetric admissions. YNHH conducted a variety of inpatient glucose control initiatives during the study period. The surgical ICU began an informal medical teamdirected insulin infusion protocol in 2000 to 2001. In 2002, the medical ICU instituted a formal insulin infusion protocol with a target of 100 to 140 mg/dL, which spread to remaining hospital ICUs by the end of 2003. In 2005, YNHH launched a consultative inpatient diabetes management team to assist clinicians in controlling glucose in non‐ICU patients with diabetes. This team covered approximately 10 to 15 patients at a time and consisted of an advanced‐practice nurse practitioner, a supervising endocrinologist and endocrinology fellow, and a nurse educator to provide diabetic teaching. Additionally, in 2005, basal‐boluscorrection insulin order sets became available. The surgical ICU implemented a stringent insulin infusion protocol with target glucose of 80 to 110 mg/dL in 2006, but relaxed it (goal 80150 mg/dL) in 2007. Similarly, in 2006, YNHH made ICU insulin infusion recommendations more stringent in remaining ICUs (goal 90130 mg/dL), but relaxed them in 2010 (goal 120160 mg/dL), based on emerging data from clinical trials and prevailing national guidelines.
Participants and Data Sources
We included all adult, nonobstetric discharges from YNHH between January 1, 2000 and December 31, 2010. Repeat visits by the same patient were linked by medical record number. We obtained data from YNHH administrative billing, laboratory, and point‐of‐care capillary blood glucose databases. The Yale Human Investigation Committee approved our study design and granted a Health Insurance Portability and Accountability Act waiver and a waiver of patient consent.
Variables
Our primary endpoint was in‐hospital mortality. The primary exposure of interest was whether a patient had diabetes mellitus, defined as the presence of International Classification of Diseases, Ninth Revision codes 249.x, 250.x, V4585, V5391, or V6546 in any of the primary or secondary diagnosis codes in the index admission, or in any hospital encounter in the year prior to the index admission.
We assessed 2 effect‐modifying variables: ICU status (as measured by a charge for at least 1 night in the ICU) and service assignment to surgery (including neurosurgery and orthopedics), compared to medicine (including neurology). Independent explanatory variables included time between the start of the study and patient admission (measured as days/365), diabetes status, inpatient glucose control, and long‐term glucose control (as measured by hemoglobin A1c at any time in the 180 days prior to hospital admission in order to have adequate sample size). We assessed inpatient blood glucose control through point‐of‐care blood glucose meters (OneTouch SureStep; LifeScan, Inc., Milipitas, CA) at YNHH. We used 4 validated measures of inpatient glucose control: the proportion of days in each hospitalization in which there was any hypoglycemic episode (blood glucose value <70 mg/dL), the proportion of days in which there was any severely hyperglycemic episode (blood glucose value >299 mg/dL), the proportion of days in which mean blood glucose was considered to be within adequate control (all blood glucose values between 70 and 179 mg/dL), and the standard deviation of mean glucose during hospitalization as a measure of glycemic variability.[28]
Covariates included gender, age at time of admission, length of stay in days, race (defined by hospital registration), payer, Elixhauser comorbidity dummy variables (revised to exclude diabetes and to use only secondary diagnosis codes),[29] and primary discharge diagnosis grouped using Clinical Classifications Software,[30] based on established associations with in‐hospital mortality.
Statistical Analysis
We summarized demographic characteristics numerically and graphically for patients with and without diabetes and compared them using [2] and t tests. We summarized changes in inpatient and outpatient measures of glucose control over time numerically and graphically, and compared across years using the Wilcoxon rank sum test adjusted for multiple hypothesis testing.
We stratified all analyses first by ICU status and then by service assignment (medicine vs surgery). Statistical analyses within each stratum paralleled our previous approach to the full study cohort.[10] Taking each stratum separately (ie, only ICU patients or only medicine patients), we used a difference‐in‐differences approach comparing changes over time in in‐hospital mortality among patients with diabetes compared to those without diabetes. This approach enabled us to determine whether patients with diabetes had a different time trend in risk of in‐hospital mortality than those without diabetes. That is, for each stratum, we constructed multivariate logistic regression models including time in years, diabetes status, and the interaction between time and diabetes status as well as the aforementioned covariates. We calculated odds of death and confidence intervals for each additional year for patients with diabetes by exponentiating the sum of parameter estimates for time and the diabetes‐time interaction term. We evaluated all 2‐way interactions between year or diabetes status and the covariates in a multiple degree of freedom likelihood ratio test. We investigated nonlinearity of the relation between mortality and time by evaluating first and second‐order polynomials.
Because we found a significant decline in mortality risk for patients with versus without diabetes among ICU patients but not among non‐ICU patients, and because service assignment was not found to be an effect modifier, we then limited our sample to ICU patients with diabetes to better understand the role of inpatient and outpatient glucose control in accounting for observed mortality trends. First, we determined the relation between the measures of inpatient glucose control and changes in mortality over time using logistic regression. Then, we repeated this analysis in the subsets of patients who had inpatient glucose data and both inpatient and outpatient glycemic control data, adding inpatient and outpatient measures sequentially. Given the high level of missing outpatient glycemic control data, we compared demographic characteristics for diabetic ICU patients with and without such data using [2] and t tests, and found that patients with data were younger and less likely to be white and had longer mean length of stay, slightly worse performance on several measures of inpatient glucose control, and lower mortality (see Supporting Table 1 in the online version of this article).
| Characteristic | Overall, N=322,939 | Any ICU Stay, N=54,646 | No ICU Stay, N=268,293 | Medical Service, N=196,325 | Surgical Service, N=126,614 |
|---|---|---|---|---|---|
| |||||
| Died during admission, n (%) | 7,587 (2.3) | 5,439 (10.0) | 2,147 (0.8) | 5,705 (2.9) | 1,883 (1.5) |
| Diabetes, n (%) | 76,758 (23.8) | 14,364 (26.3) | 62,394 (23.2) | 55,453 (28.2) | 21,305 (16.8) |
| Age, y, mean (SD) | 55.5 (20.0) | 61.0 (17.0) | 54.4 (21.7) | 60.3 (18.9) | 48.0 (23.8) |
| Age, full range (interquartile range) | 0118 (4273) | 18112 (4975) | 0118 (4072) | 0118 (4776) | 0111 (3266) |
| Female, n (%) | 159,227 (49.3) | 23,208 (42.5) | 134,296 (50.1) | 99,805 (50.8) | 59,422 (46.9) |
| White race, n (%) | 226,586 (70.2) | 41,982 (76.8) | 184,604 (68.8) | 132,749 (67.6) | 93,838 (74.1) |
| Insurance, n (%) | |||||
| Medicaid | 54,590 (16.9) | 7,222 (13.2) | 47,378 (17.7) | 35,229 (17.9) | 19,361 (15.3) |
| Medicare | 141,638 (43.9) | 27,458 (50.2) | 114,180 (42.6) | 100,615 (51.2) | 41,023 (32.4) |
| Commercial | 113,013 (35.0) | 18,248 (33.4) | 94,765 (35.3) | 53,510 (27.2) | 59,503 (47.0) |
| Uninsured | 13,521 (4.2) | 1,688 (3.1) | 11,833 (4.4) | 6,878 (3.5) | 6,643 (5.2) |
| Length of stay, d, mean (SD) | 5.4 (9.5) | 11.8 (17.8) | 4.2 (6.2) | 5.46 (10.52) | 5.42 (9.75) |
| Service, n (%) | |||||
| Medicine | 184,495 (57.1) | 27,190 (49.8) | 157,305 (58.6) | 184,496 (94.0) | |
| Surgery | 126,614 (39.2) | 25,602 (46.9) | 101,012 (37.7) | 126,614 (100%) | |
| Neurology | 11,829 (3.7) | 1,853 (3.4) | 9,976 (3.7) | 11,829 (6.0) | |
To explore the effects of dependence among observations from patients with multiple encounters, we compared parameter estimates derived from a model with all patient encounters (including repeated admissions for the same patient) with those from a model with a randomly sampled single visit per patient, and observed that there was no difference in parameter estimates between the 2 classes of models. For all analyses, we used a type I error of 5% (2 sided) to test for statistical significance using SAS version 9.3 (SAS Institute, Cary, NC) or R software (
RESULTS
We included 322,938 patient admissions. Of this sample, 54,645 (16.9%) had spent at least 1 night in the ICU. Overall, 76,758 patients (23.8%) had diabetes, representing 26.3% of ICU patients, 23.2% of non‐ICU patients, 28.2% of medical patients, and 16.8% of surgical patients (see Table 1 for demographic characteristics).
Mortality Trends Within Strata
Among ICU patients, the overall mortality rate was 9.9%: 10.5% of patients with diabetes and 9.8% of patients without diabetes. Among non‐ICU patients, the overall mortality rate was 0.8%: 0.9% of patients with diabetes and 0.7% of patients without diabetes.
Among medical patients, the overall mortality rate was 2.9%: 3.1% of patients with diabetes and 2.8% of patients without diabetes. Among surgical patients, the overall mortality rate was 1.4%: 1.8% of patients with diabetes and 1.4% of patients without diabetes. Figure 1 shows quarterly in‐hospital mortality for patients with and without diabetes from 2000 to 2010 stratified by ICU status and by service assignment.

Table 2 describes the difference‐in‐differences regression analyses, stratified by ICU status and service assignment. Among ICU patients (Table 2, model 1), each successive year was associated with a 2.6% relative reduction in the adjusted odds of mortality (odds ratio [OR]: 0.974, 95% confidence interval [CI]: 0.963‐0.985) for patients without diabetes compared to a 7.8% relative reduction for those with diabetes (OR: 0.923, 95% CI: 0.906‐0.940). In other words, patients with diabetes compared to patients without diabetes had a significantly greater decline in odds of adjusted mortality of 5.3% per year (OR: 0.947, 95% CI: 0.927‐0.967). As a result, the adjusted odds of mortality among patients with versus without diabetes decreased from 1.352 in 2000 to 0.772 in 2010.
| Independent Variables | ICU Patients, N=54,646, OR (95% CI) | Non‐ICU Patients, N=268,293, OR (95% CI) | Medical Patients, N=196,325, OR (95% CI) | Surgical Patients, N=126,614, OR (95% CI) |
|---|---|---|---|---|
| Model 1 | Model 2 | Model 3 | Model 4 | |
| ||||
| Year | 0.974 (0.963‐0.985) | 0.925 (0.909‐0.940) | 0.943 (0.933‐0.954) | 0.995 (0.977‐1.103) |
| Diabetes | 1.352 (1.562‐1.171) | 0.958 (0.783‐1.173) | 1.186 (1.037‐1.356) | 1.213 (0.942‐1.563) |
| Diabetes*year | 0.947 (0.927‐0.967) | 0.977 (0.946‐1.008) | 0.961 (0.942‐0.980) | 0.955 (0.918‐0.994) |
| C statistic | 0.812 | 0.907 | 0.880 | 0.919 |
Among non‐ICU patients (Table 2, model 2), each successive year was associated with a 7.5% relative reduction in the adjusted odds of mortality (OR: 0.925, 95% CI: 0.909‐0.940) for patients without diabetes compared to a 9.6% relative reduction for those with diabetes (OR: 0.904, 95% CI: 0.879‐0.929); this greater decline in odds of adjusted mortality of 2.3% per year (OR: 0.977, 95% CI: 0.946‐1.008; P=0.148) was not statistically significant.
We found greater decline in odds of mortality among patients with diabetes than among patients without diabetes over time in both medical patients (3.9% greater decline per year; OR: 0.961, 95% CI: 0.942‐0.980) and surgical patients (4.5% greater decline per year; OR: 0.955, 95% CI: 0.918‐0.994), without a difference between the 2. Detailed results are shown in Table 2, models 3 and 4.
Glycemic Control
Among ICU patients with diabetes (N=14,364), at least 2 inpatient point‐of‐care glucose readings were available for 13,136 (91.5%), with a mean of 4.67 readings per day, whereas hemoglobin A1c data were available for only 5321 patients (37.0%). Both inpatient glucose data and hemoglobin A1c were available for 4989 patients (34.7%). Figure 2 shows trends in inpatient and outpatient glycemic control measures among ICU patients with diabetes over the study period. Mean hemoglobin A1c decreased from 7.7 in 2000 to 7.3 in 2010. Mean hospitalization glucose began at 187.2, reached a nadir of 162.4 in the third quarter (Q3) of 2007, and rose subsequently to 174.4 with loosened glucose control targets. Standard deviation of mean glucose and percentage of patient‐days with a severe hyperglycemic episode followed a similar pattern, though with nadirs in Q4 2007 and Q2 2008, respectively, whereas percentage of patient‐days with a hypoglycemic episode rose from 1.46% in 2000, peaked at 3.00% in Q3 2005, and returned to 2.15% in 2010. All changes in glucose control are significant with P<0.001.
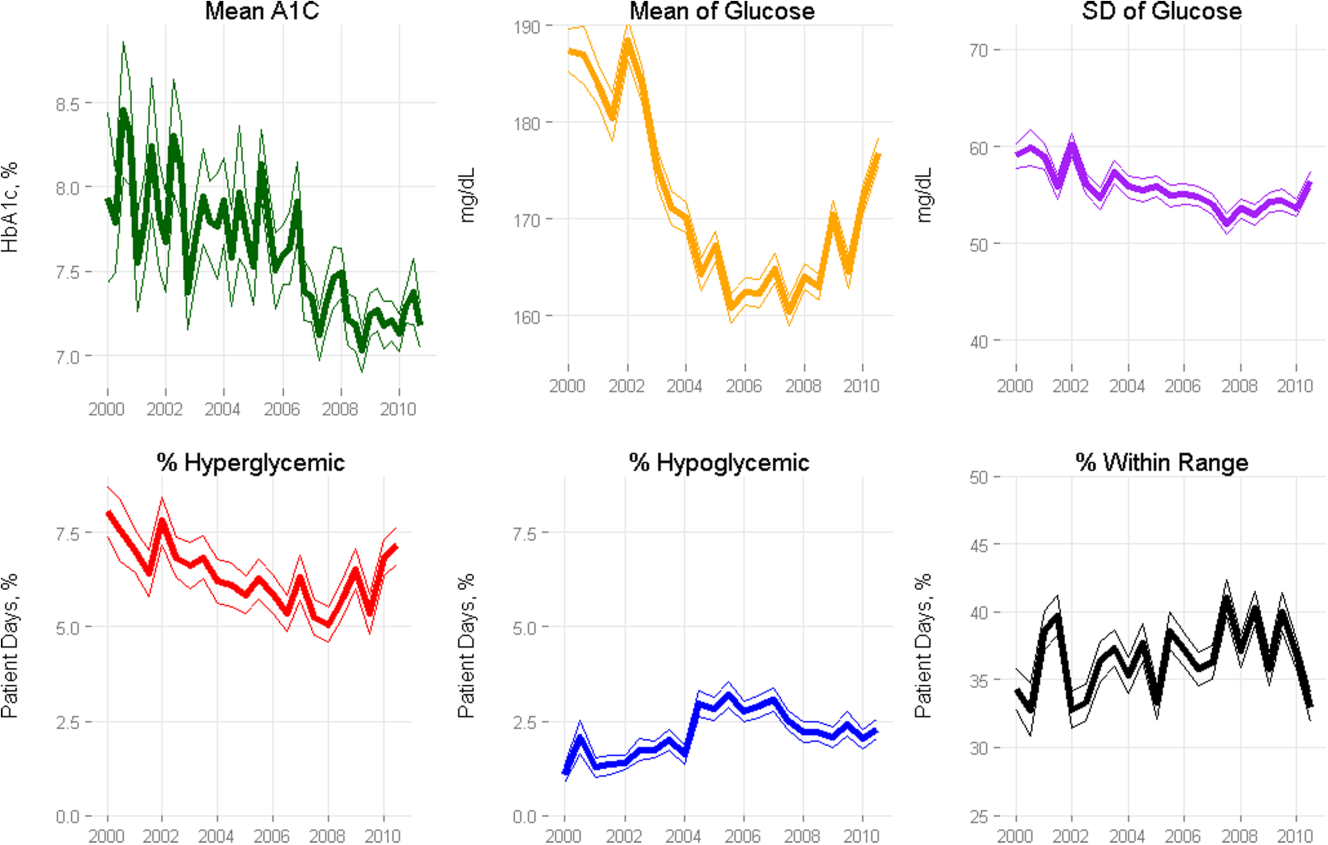
Mortality Trends and Glycemic Control
To determine whether glucose control explained the excess decline in odds of mortality among patients with diabetes in the ICU, we restricted our sample to ICU patients with diabetes and examined the association of diabetes with mortality after including measures of glucose control.
We first verified that the overall adjusted mortality trend among ICU patients with diabetes for whom we had measures of inpatient glucose control was similar to that of the full sample of ICU patients with diabetes. Similar to the full sample, we found that the adjusted excess odds of death significantly declined by a relative 7.3% each successive year (OR: 0.927, 95% CI: 0.907‐0.947; Table 3, model 1). We then included measures of inpatient glucose control in the model and found, as expected, that a higher percentage of days with severe hyperglycemia and with hypoglycemia was associated with an increased odds of death (P<0.001 for both; Table 3, model 2). Nonetheless, after including measures of inpatient glucose control, we found that the rate of change of excess odds of death for patients with diabetes was unchanged (OR: 0.926, 95% CI: 0.905‐0.947).
| Patients With Inpatient Glucose Control Measures, n=13,136 | Patients With Inpatient and Outpatient Glucose Control Measures, n=4,989 | ||||
|---|---|---|---|---|---|
| Independent Variables | Model 1, OR (95% CI) | Model 2, OR (95% CI) | Model 3, OR (95% CI) | Model 4, OR (95% CI) | Model 5, OR (95% CI) |
| |||||
| Year | 0.927 (0.907‐0.947) | 0.926 (0.905‐0.947) | 0.958 (0.919‐0.998) | 0.956 (0.916‐0.997) | 0.953 (0.914‐0.994) |
| % Severe hyperglycemic days | 1.016 (1.010‐1.021) | 1.009 (0.998‐1.020) | 1.010 (0.999‐1.021) | ||
| % Hypoglycemic days | 1.047 (1.040‐1.055) | 1.051 (1.037‐1.065) | 1.049 (1.036‐1.063) | ||
| % Normoglycemic days | 0.997 (0.994‐1.000) | 0.994 (0.989‐0.999) | 0.993 (0.988‐0.998) | ||
| SD of mean glucose | 0.996 (0.992‐1.000) | 0.993 (0.986‐1.000) | 0.994 (0.987‐1.002) | ||
| Mean HbA1c | 0.892 (0.828‐0.961) | ||||
| C statistic | 0.806 | 0.825 | 0.825 | 0.838 | 0.841 |
We then restricted our sample to patients with diabetes with both inpatient and outpatient glycemic control data and found that, in this subpopulation, the adjusted excess odds of death among patients with diabetes relative to those without significantly declined by a relative 4.2% each progressive year (OR: 0.958, 95% CI: 0.918‐0.998; Table 3, model 3). Including measures of inpatient glucose control in the model did not significantly change the rate of change of excess odds of death (OR: 0.956, 95% CI: 0.916‐0.997; Table 3, model 4), nor did including both measures of inpatient and outpatient glycemic control (OR: 0.953, 95% CI: 0.914‐0.994; Table 3, model 5).
DISCUSSION
We conducted a difference‐in‐difference analysis of in‐hospital mortality rates among adult patients with diabetes compared to patients without diabetes over 10 years, stratifying by ICU status and service assignment. For patients with any ICU stay, we found that the reduction in odds of mortality for patients with diabetes has been 3 times larger than the reduction in odds of mortality for patients without diabetes. For those without an ICU stay, we found no significant difference between patients with and without diabetes in the rate at which in‐hospital mortality declined. We did not find stratification by assignment to a medical or surgical service to be an effect modifier. Finally, despite the fact that our institution achieved better aggregate inpatient glucose control, less severe hyperglycemia, and better long‐term glucose control over the course of the decade, we did not find that either inpatient or outpatient glucose control explained the trend in mortality for patients with diabetes in the ICU. Our study is unique in its inclusion of all hospitalized patients and its ability to simultaneously assess whether both inpatient and outpatient glucose control are explanatory factors in the observed mortality trends.
The fact that improved inpatient glucose control did not explain the trend in mortality for patients with diabetes in the ICU is consistent with the majority of the literature on intensive inpatient glucose control. In randomized trials, intensive glucose control appears to be of greater benefit for patients without diabetes than for patients with diabetes.[31] In fact, in 1 study, patients with diabetes were the only group that did not benefit from intensive glucose control.[32] In our study, it is possible that the rise in hypoglycemia nullified some of the benefits of glucose control. Nationally, hospital admissions for hypoglycemia among Medicare beneficiaries now outnumber admissions for hyperglycemia.[27]
We also do not find that the decline in hemoglobin A1c attenuated the reduction in mortality in the minority of patients for whom these data were available. This is concordant with evidence from 3 randomized clinical trials that have failed to establish a clear beneficial effect of intensive outpatient glucose control on primary cardiovascular endpoints among older, high‐risk patients with type 2 diabetes using glucose‐lowering agents.[21, 22, 23] It is notable, however, that the population for whom we had available hemoglobin A1c results was not representative of the overall population of ICU patients with diabetes. Consequently, there may be an association of outpatient glucose control with inpatient mortality in the overall population of ICU patients with diabetes that we were not able to detect.
The decline in mortality among ICU patients with diabetes in our study may stem from factors other than glycemic control. It is possible that patients were diagnosed earlier in their course of disease in later years of the study period, making the population of patients with diabetes younger or healthier. Of note, however, our risk adjustment models were very robust, with C statistics from 0.82 to 0.92, suggesting that we were able to account for much of the mortality risk attributable to patient clinical and demographic factors. More intensive glucose management may have nonglycemic benefits, such as closer patient observation, which may themselves affect mortality. Alternatively, improved cardiovascular management for patients with diabetes may have decreased the incidence of cardiovascular events. During the study period, evidence from large clinical trials demonstrated the importance of tight blood pressure and lipid management in improving outcomes for patients with diabetes,[33, 34, 35, 36] guidelines for lipid management for patients with diabetes changed,[37] and fewer patients developed cardiovascular complications.[38] Finally, it is possible that our findings can be explained by an improvement in treatment of complications for which patients with diabetes previously have had disproportionately worse outcomes, such as percutaneous coronary intervention.[39]
Our findings may have important implications for both clinicians and policymakers. Changes in inpatient glucose management have required substantial additional resources on the part of hospitals. Our evidence regarding the questionable impact of inpatient glucose control on in‐hospital mortality trends for patients with diabetes is disappointing and highlights the need for multifaceted evaluation of the impact of such quality initiatives. There may, for instance, be benefits from tighter blood glucose control in the hospital beyond mortality, such as reduced infections, costs, or length of stay. On the outpatient side, our more limited data are consistent with recent studies that have not been able to show a mortality benefit in older diabetic patients from more stringent glycemic control. A reassessment of prevailing diabetes‐related quality measures, as recently called for by some,[40, 41] seems reasonable.
Our study must be interpreted in light of its limitations. It is possible that the improvements in glucose management were too small to result in a mortality benefit. The overall reduction of 25 mg dL achieved at our institution is less than the 33 to 50 mg/dL difference between intensive and conventional groups in those randomized clinical trials that have found reductions in mortality.[11, 42] In addition, an increase in mean glucose during the last 1 to 2 years of the observation period (in response to prevailing guidelines) could potentially have attenuated any benefit on mortality. The study does not include other important clinical endpoints, such as infections, complications, length of stay, and hospital costs. Additionally, we did not examine postdischarge mortality, which might have shown a different pattern. The small proportion of patients with hemoglobin A1c results may have hampered our ability to detect an effect of outpatient glucose control. Consequently, our findings regarding outpatient glucose control are only suggestive. Finally, our findings represent the experience of a single, large academic medical center and may not be generalizable to all settings.
Overall, we found that patients with diabetes in the ICU have experienced a disproportionate reduction in in‐hospital mortality over time that does not appear to be explained by improvements in either inpatient or outpatient glucose control. Although improved glycemic control may have other benefits, it does not appear to impact in‐hospital mortality. Our real‐world empirical results contribute to the discourse among clinicians and policymakers with regards to refocusing the approach to managing glucose in‐hospital and readjudication of diabetes‐related quality measures.
Acknowledgments
The authors would like to acknowledge the YaleNew Haven Hospital diabetes management team: Gael Ulisse, APRN, Helen Psarakis, APRN, Anne Kaisen, APRN, and the Yale Endocrine Fellows.
Disclosures: Design and conduct of the study: N. B., J. D., S. I., T. B., L. H. Collection, management, analysis, and interpretation of the data: N. B., B. J., J. D., J. R., J. B., S. I., L. H. Preparation, review, or approval of the manuscript: N. B., B. J., J. D., J. R., S. I., T. B., L. H. Leora Horwitz, MD, had full access to all the data in the study and takes responsibility for the integrity of the data and the accuracy of the data analysis. Dr. Horwitz is supported by the National Institute on Aging (K08 AG038336) and by the American Federation for Aging Research through the Paul B. Beeson Career Development Award Program. This publication was also made possible by CTSA grant number UL1 RR024139 from the National Center for Research Resources and the National Center for Advancing Translational Science, components of the National Institutes of Health (NIH), and NIH roadmap for Medical Research. Its contents are solely the responsibility of the authors and do not necessarily represent the official view of the NIH. No funding source had any role in design and conduct of the study; collection, management, analysis, and interpretation of the data; preparation, review, or approval of the manuscript; or decision to submit the manuscript for publication. Silvio E. Inzucchi, MD, serves on a Data Safety Monitoring Board for Novo Nordisk, a manufacturer of insulin products used in the hospital setting. The remaining authors declare no conflicts of interest.
- National Diabetes Information Clearinghouse. National Diabetes Statistics; 2011. Available at: http://diabetes.niddk.nih.gov/dm/pubs/america/index.aspx. Accessed November 12, 2013.
- Healthcare Cost and Utilization Project. Statistical brief #93; 2010. Available at: http://www.hcup‐us.ahrq.gov/reports/statbriefs/sb93.pdf. Accessed November 12, 2013.
- , , , et al. Association between diabetes mellitus and post‐discharge outcomes in patients hospitalized with heart failure: findings from the EVEREST trial. Eur J Heart Fail. 2013;15(2):194–202.
- , , , et al. Influence of diabetes mellitus on clinical outcome in the thrombolytic era of acute myocardial infarction. GUSTO‐I Investigators. Global Utilization of Streptokinase and Tissue Plasminogen Activator for Occluded Coronary Arteries. J Am Coll Cardiol. 1997;30(1):171–179.
- , , , , , . Type 2 diabetes and pneumonia outcomes: a population‐based cohort study. Diabetes Care. 2007;30(9):2251–2257.
- , , , . Prevalence and outcomes of diabetes, hypertension and cardiovascular disease in COPD. Eur Respir J. 2008;32(4):962–969.
- , , , , . The role of body mass index and diabetes in the development of acute organ failure and subsequent mortality in an observational cohort. Crit Care. 2006;10(5):R137.
- , , , , , . Type 2 diabetes and 1‐year mortality in intensive care unit patients. Eur J Clin Invest. 2013;43(3):238–247.
- , , . Excess mortality during hospital stays among patients with recorded diabetes compared with those without diabetes. Diabet Med. 2013;30(12):1393–1402.
- , , , et al. Decade‐long trends in mortality among patients with and without diabetes mellitus at a major academic medical center. JAMA Intern Med. 2014;174(7):1187–1188.
- , , , et al. Intensive insulin therapy in critically ill patients. N Engl J Med. 2001;345(19):1359–1367.
- , , , et al. Intensive versus conventional glucose control in critically ill patients. N Engl J Med. 2009;360(13):1283–1297.
- , , , et al. A prospective randomised multi‐centre controlled trial on tight glucose control by intensive insulin therapy in adult intensive care units: the Glucontrol study. Intensive Care Med. 2009;35(10):1738–1748.
- , , , et al. Intensive versus conventional insulin therapy: a randomized controlled trial in medical and surgical critically ill patients. Crit Care Med. 2008;36(12):3190–3197.
- , , , et al. Intensive insulin therapy in the medical ICU. N Engl J Med. 2006;354(5):449–461.
- , , , et al. Glycemic control in non‐critically ill hospitalized patients: a systematic review and meta‐analysis. J Clin Endocrinol Metab. 2012;97(1):49–58.
- , , , et al. American Association of Clinical Endocrinologists and American Diabetes Association consensus statement on inpatient glycemic control. Diabetes Care. 2009;32(6):1119–1131.
- Agency for Healthcare Research and Quality National Quality Measures Clearinghouse. Percent of cardiac surgery patients with controlled 6 A.M. postoperative blood glucose; 2012. Available at: http://www.qualitymeasures.ahrq.gov/content.aspx?id=35532. Accessed November 12, 2013.
- The effect of intensive treatment of diabetes on the development and progression of long‐term complications in insulin‐dependent diabetes mellitus. The Diabetes Control and Complications Trial Research Group. N Engl J Med. 1993;329(14):977–986.
- , , , et al. Intensive blood‐glucose control with sulphonylureas or insulin compared with conventional treatment and risk of complications in patients with type 2 diabetes (UKPDS 33). Lancet. 1998;352(9131):837–853.
- Effects of intensive glucose lowering in type 2 diabetes. N Engl J Med. 2008;358(24):2545–2559.
- , , , et al. Glucose control and vascular complications in veterans with type 2 diabetes. N Engl J Med. 2009;360(2):129–139.
- , , , et al. Intensive blood glucose control and vascular outcomes in patients with type 2 diabetes. N Engl J Med. 2008;358(24):2560–2572.
- . Standards of medical care in diabetes—2014. Diabetes Care. 2014;37(suppl 1):S14–S80.
- National Committee for Quality Assurance. HEDIS 2013. Available at: http://www.ncqa.org/HEDISQualityMeasurement.aspx. Accessed November 12, 2013.
- , , , . Is glycemic control improving in US adults? Diabetes Care. 2008;31(1):81–86.
- , , , et al. National trends in US hospital admissions for hyperglycemia and hypoglycemia among medicare beneficiaries, 1999 to 2011. JAMA Intern Med. 2014;174(7):1116–1124.
- , , , et al. "Glucometrics"—assessing the quality of inpatient glucose management. Diabetes Technol Ther. 2006;8(5):560–569.
- , , , , . A modification of the Elixhauser comorbidity measures into a point system for hospital death using administrative data. Med Care. 2009;47(6):626–633.
- Healthcare Cost and Utilization Project. Clinical Classifications Software (CCS) for ICD‐9‐CM; 2013. Available at: http://www.hcup‐us.ahrq.gov/toolssoftware/ccs/ccs.jsp. Accessed November 12, 2013.
- , , , , . The impact of premorbid diabetic status on the relationship between the three domains of glycemic control and mortality in critically ill patients. Curr Opin Clin Nutr Metab Care. 2012;15(2):151–160.
- , , , et al. Intensive insulin therapy in mixed medical/surgical intensive care units: benefit versus harm. Diabetes. 2006;55(11):3151–3159.
- Tight blood pressure control and risk of macrovascular and microvascular complications in type 2 diabetes: UKPDS 38. UK Prospective Diabetes Study Group. BMJ. 1998;317(7160):703–713.
- , , , et al. Effects of a fixed combination of perindopril and indapamide on macrovascular and microvascular outcomes in patients with type 2 diabetes mellitus (the ADVANCE trial): a randomised controlled trial. Lancet. 2007;370(9590):829–840.
- , , , , . MRC/BHF heart protection study of cholesterol‐lowering with simvastatin in 5963 people with diabetes: a randomised placebo‐controlled trial. Lancet. 2003;361(9374):2005–2016.
- , , , et al. Primary prevention of cardiovascular disease with atorvastatin in type 2 diabetes in the Collaborative Atorvastatin Diabetes Study (CARDS): multicentre randomised placebo‐controlled trial. Lancet. 2004;364(9435):685–696.
- , , , . Expert panel on detection, evaluation and treatment of high blood cholesterol in adults. Executive summary of the third report of the national cholesterol education program (NCEP) adult treatment panel (atp III). JAMA. 2001;285(19):2486–2497.
- , , , et al. Changes in diabetes‐related complications in the United States, 1990–2010. N Engl J Med. 2014;370(16):1514–1523.
- , , . Coronary heart disease in patients with diabetes: part II: recent advances in coronary revascularization. J Am Coll Cardiol. 2007;49(6):643–656.
- , , , et al. Management of hyperglycemia in type 2 diabetes: a patient‐centered approach position statement of the American Diabetes Association (ADA) and the European Association for the Study of Diabetes (EASD). Diabetes Care. 2012;35(6):1364–1379.
- , , , , . Assessing potential glycemic overtreatment in persons at hypoglycemic risk. JAMA Intern Med. 2013;174(2):259–268.
- , , , . Glycometabolic state at admission: important risk marker of mortality in conventionally treated patients with diabetes mellitus and acute myocardial infarction: long‐term results from the Diabetes and Insulin‐Glucose Infusion in Acute Myocardial Infarction (DIGAMI) study. Circulation. 1999;99(20):2626–2632.
Patients with diabetes currently comprise over 8% of the US population (over 25 million people) and more than 20% of hospitalized patients.[1, 2] Hospitalizations of patients with diabetes account for 23% of total hospital costs in the United States,[2] and patients with diabetes have worse outcomes after hospitalization for a variety of common medical conditions,[3, 4, 5, 6] as well as in intensive care unit (ICU) settings.[7, 8] Individuals with diabetes have historically experienced higher inpatient mortality than individuals without diabetes.[9] However, we recently reported that patients with diabetes at our large academic medical center have experienced a disproportionate reduction in in‐hospital mortality relative to patients without diabetes over the past decade.[10] This surprising trend begs further inquiry.
Improvement in in‐hospital mortality among patients with diabetes may stem from improved inpatient glycemic management. The landmark 2001 study by van den Berghe et al. demonstrating that intensive insulin therapy reduced postsurgical mortality among ICU patients ushered in an era of intensive inpatient glucose control.[11] However, follow‐up multicenter studies have not been able to replicate these results.[12, 13, 14, 15] In non‐ICU and nonsurgical settings, intensive glucose control has not yet been shown to have any mortality benefit, although it may impact other morbidities, such as postoperative infections.[16] Consequently, less stringent glycemic targets are now recommended.[17] Nonetheless, hospitals are being held accountable for certain aspects of inpatient glucose control. For example, the Centers for Medicare & Medicaid Services (CMS) began asking hospitals to report inpatient glucose control in cardiac surgery patients in 2004.[18] This measure is now publicly reported, and as of 2013 is included in the CMS Value‐Based Purchasing Program, which financially penalizes hospitals that do not meet targets.
Outpatient diabetes standards have also evolved in the past decade. The Diabetes Control and Complications Trial in 1993 and the United Kingdom Prospective Diabetes Study in 1997 demonstrated that better glycemic control in type 1 and newly diagnosed type 2 diabetes patients, respectively, improved clinical outcomes, and prompted guidelines for pharmacologic treatment of diabetic patients.[19, 20] However, subsequent randomized clinical trials have failed to establish a clear beneficial effect of intensive glucose control on primary cardiovascular endpoints among higher‐risk patients with longstanding type 2 diabetes,[21, 22, 23] and clinical practice recommendations now accept a more individualized approach to glycemic control.[24] Nonetheless, clinicians are also being held accountable for outpatient glucose control.[25]
To better understand the disproportionate reduction in mortality among hospitalized patients with diabetes that we observed, we first examined whether it was limited to surgical patients or patients in the ICU, the populations that have been demonstrated to benefit from intensive inpatient glucose control. Furthermore, given recent improvements in inpatient and outpatient glycemic control,[26, 27] we examined whether inpatient or outpatient glucose control explained the mortality trends. Results from this study contribute empirical evidence on real‐world effects of efforts to improve inpatient and outpatient glycemic control.
METHODS
Setting
During the study period, YaleNew Haven Hospital (YNHH) was an urban academic medical center in New Haven, Connecticut, with over 950 beds and an average of approximately 32,000 annual adult nonobstetric admissions. YNHH conducted a variety of inpatient glucose control initiatives during the study period. The surgical ICU began an informal medical teamdirected insulin infusion protocol in 2000 to 2001. In 2002, the medical ICU instituted a formal insulin infusion protocol with a target of 100 to 140 mg/dL, which spread to remaining hospital ICUs by the end of 2003. In 2005, YNHH launched a consultative inpatient diabetes management team to assist clinicians in controlling glucose in non‐ICU patients with diabetes. This team covered approximately 10 to 15 patients at a time and consisted of an advanced‐practice nurse practitioner, a supervising endocrinologist and endocrinology fellow, and a nurse educator to provide diabetic teaching. Additionally, in 2005, basal‐boluscorrection insulin order sets became available. The surgical ICU implemented a stringent insulin infusion protocol with target glucose of 80 to 110 mg/dL in 2006, but relaxed it (goal 80150 mg/dL) in 2007. Similarly, in 2006, YNHH made ICU insulin infusion recommendations more stringent in remaining ICUs (goal 90130 mg/dL), but relaxed them in 2010 (goal 120160 mg/dL), based on emerging data from clinical trials and prevailing national guidelines.
Participants and Data Sources
We included all adult, nonobstetric discharges from YNHH between January 1, 2000 and December 31, 2010. Repeat visits by the same patient were linked by medical record number. We obtained data from YNHH administrative billing, laboratory, and point‐of‐care capillary blood glucose databases. The Yale Human Investigation Committee approved our study design and granted a Health Insurance Portability and Accountability Act waiver and a waiver of patient consent.
Variables
Our primary endpoint was in‐hospital mortality. The primary exposure of interest was whether a patient had diabetes mellitus, defined as the presence of International Classification of Diseases, Ninth Revision codes 249.x, 250.x, V4585, V5391, or V6546 in any of the primary or secondary diagnosis codes in the index admission, or in any hospital encounter in the year prior to the index admission.
We assessed 2 effect‐modifying variables: ICU status (as measured by a charge for at least 1 night in the ICU) and service assignment to surgery (including neurosurgery and orthopedics), compared to medicine (including neurology). Independent explanatory variables included time between the start of the study and patient admission (measured as days/365), diabetes status, inpatient glucose control, and long‐term glucose control (as measured by hemoglobin A1c at any time in the 180 days prior to hospital admission in order to have adequate sample size). We assessed inpatient blood glucose control through point‐of‐care blood glucose meters (OneTouch SureStep; LifeScan, Inc., Milipitas, CA) at YNHH. We used 4 validated measures of inpatient glucose control: the proportion of days in each hospitalization in which there was any hypoglycemic episode (blood glucose value <70 mg/dL), the proportion of days in which there was any severely hyperglycemic episode (blood glucose value >299 mg/dL), the proportion of days in which mean blood glucose was considered to be within adequate control (all blood glucose values between 70 and 179 mg/dL), and the standard deviation of mean glucose during hospitalization as a measure of glycemic variability.[28]
Covariates included gender, age at time of admission, length of stay in days, race (defined by hospital registration), payer, Elixhauser comorbidity dummy variables (revised to exclude diabetes and to use only secondary diagnosis codes),[29] and primary discharge diagnosis grouped using Clinical Classifications Software,[30] based on established associations with in‐hospital mortality.
Statistical Analysis
We summarized demographic characteristics numerically and graphically for patients with and without diabetes and compared them using [2] and t tests. We summarized changes in inpatient and outpatient measures of glucose control over time numerically and graphically, and compared across years using the Wilcoxon rank sum test adjusted for multiple hypothesis testing.
We stratified all analyses first by ICU status and then by service assignment (medicine vs surgery). Statistical analyses within each stratum paralleled our previous approach to the full study cohort.[10] Taking each stratum separately (ie, only ICU patients or only medicine patients), we used a difference‐in‐differences approach comparing changes over time in in‐hospital mortality among patients with diabetes compared to those without diabetes. This approach enabled us to determine whether patients with diabetes had a different time trend in risk of in‐hospital mortality than those without diabetes. That is, for each stratum, we constructed multivariate logistic regression models including time in years, diabetes status, and the interaction between time and diabetes status as well as the aforementioned covariates. We calculated odds of death and confidence intervals for each additional year for patients with diabetes by exponentiating the sum of parameter estimates for time and the diabetes‐time interaction term. We evaluated all 2‐way interactions between year or diabetes status and the covariates in a multiple degree of freedom likelihood ratio test. We investigated nonlinearity of the relation between mortality and time by evaluating first and second‐order polynomials.
Because we found a significant decline in mortality risk for patients with versus without diabetes among ICU patients but not among non‐ICU patients, and because service assignment was not found to be an effect modifier, we then limited our sample to ICU patients with diabetes to better understand the role of inpatient and outpatient glucose control in accounting for observed mortality trends. First, we determined the relation between the measures of inpatient glucose control and changes in mortality over time using logistic regression. Then, we repeated this analysis in the subsets of patients who had inpatient glucose data and both inpatient and outpatient glycemic control data, adding inpatient and outpatient measures sequentially. Given the high level of missing outpatient glycemic control data, we compared demographic characteristics for diabetic ICU patients with and without such data using [2] and t tests, and found that patients with data were younger and less likely to be white and had longer mean length of stay, slightly worse performance on several measures of inpatient glucose control, and lower mortality (see Supporting Table 1 in the online version of this article).
| Characteristic | Overall, N=322,939 | Any ICU Stay, N=54,646 | No ICU Stay, N=268,293 | Medical Service, N=196,325 | Surgical Service, N=126,614 |
|---|---|---|---|---|---|
| |||||
| Died during admission, n (%) | 7,587 (2.3) | 5,439 (10.0) | 2,147 (0.8) | 5,705 (2.9) | 1,883 (1.5) |
| Diabetes, n (%) | 76,758 (23.8) | 14,364 (26.3) | 62,394 (23.2) | 55,453 (28.2) | 21,305 (16.8) |
| Age, y, mean (SD) | 55.5 (20.0) | 61.0 (17.0) | 54.4 (21.7) | 60.3 (18.9) | 48.0 (23.8) |
| Age, full range (interquartile range) | 0118 (4273) | 18112 (4975) | 0118 (4072) | 0118 (4776) | 0111 (3266) |
| Female, n (%) | 159,227 (49.3) | 23,208 (42.5) | 134,296 (50.1) | 99,805 (50.8) | 59,422 (46.9) |
| White race, n (%) | 226,586 (70.2) | 41,982 (76.8) | 184,604 (68.8) | 132,749 (67.6) | 93,838 (74.1) |
| Insurance, n (%) | |||||
| Medicaid | 54,590 (16.9) | 7,222 (13.2) | 47,378 (17.7) | 35,229 (17.9) | 19,361 (15.3) |
| Medicare | 141,638 (43.9) | 27,458 (50.2) | 114,180 (42.6) | 100,615 (51.2) | 41,023 (32.4) |
| Commercial | 113,013 (35.0) | 18,248 (33.4) | 94,765 (35.3) | 53,510 (27.2) | 59,503 (47.0) |
| Uninsured | 13,521 (4.2) | 1,688 (3.1) | 11,833 (4.4) | 6,878 (3.5) | 6,643 (5.2) |
| Length of stay, d, mean (SD) | 5.4 (9.5) | 11.8 (17.8) | 4.2 (6.2) | 5.46 (10.52) | 5.42 (9.75) |
| Service, n (%) | |||||
| Medicine | 184,495 (57.1) | 27,190 (49.8) | 157,305 (58.6) | 184,496 (94.0) | |
| Surgery | 126,614 (39.2) | 25,602 (46.9) | 101,012 (37.7) | 126,614 (100%) | |
| Neurology | 11,829 (3.7) | 1,853 (3.4) | 9,976 (3.7) | 11,829 (6.0) | |
To explore the effects of dependence among observations from patients with multiple encounters, we compared parameter estimates derived from a model with all patient encounters (including repeated admissions for the same patient) with those from a model with a randomly sampled single visit per patient, and observed that there was no difference in parameter estimates between the 2 classes of models. For all analyses, we used a type I error of 5% (2 sided) to test for statistical significance using SAS version 9.3 (SAS Institute, Cary, NC) or R software (
RESULTS
We included 322,938 patient admissions. Of this sample, 54,645 (16.9%) had spent at least 1 night in the ICU. Overall, 76,758 patients (23.8%) had diabetes, representing 26.3% of ICU patients, 23.2% of non‐ICU patients, 28.2% of medical patients, and 16.8% of surgical patients (see Table 1 for demographic characteristics).
Mortality Trends Within Strata
Among ICU patients, the overall mortality rate was 9.9%: 10.5% of patients with diabetes and 9.8% of patients without diabetes. Among non‐ICU patients, the overall mortality rate was 0.8%: 0.9% of patients with diabetes and 0.7% of patients without diabetes.
Among medical patients, the overall mortality rate was 2.9%: 3.1% of patients with diabetes and 2.8% of patients without diabetes. Among surgical patients, the overall mortality rate was 1.4%: 1.8% of patients with diabetes and 1.4% of patients without diabetes. Figure 1 shows quarterly in‐hospital mortality for patients with and without diabetes from 2000 to 2010 stratified by ICU status and by service assignment.
Table 2 describes the difference‐in‐differences regression analyses, stratified by ICU status and service assignment. Among ICU patients (Table 2, model 1), each successive year was associated with a 2.6% relative reduction in the adjusted odds of mortality (odds ratio [OR]: 0.974, 95% confidence interval [CI]: 0.963‐0.985) for patients without diabetes compared to a 7.8% relative reduction for those with diabetes (OR: 0.923, 95% CI: 0.906‐0.940). In other words, patients with diabetes compared to patients without diabetes had a significantly greater decline in odds of adjusted mortality of 5.3% per year (OR: 0.947, 95% CI: 0.927‐0.967). As a result, the adjusted odds of mortality among patients with versus without diabetes decreased from 1.352 in 2000 to 0.772 in 2010.
| Independent Variables | ICU Patients, N=54,646, OR (95% CI) | Non‐ICU Patients, N=268,293, OR (95% CI) | Medical Patients, N=196,325, OR (95% CI) | Surgical Patients, N=126,614, OR (95% CI) |
|---|---|---|---|---|
| Model 1 | Model 2 | Model 3 | Model 4 | |
| ||||
| Year | 0.974 (0.963‐0.985) | 0.925 (0.909‐0.940) | 0.943 (0.933‐0.954) | 0.995 (0.977‐1.103) |
| Diabetes | 1.352 (1.562‐1.171) | 0.958 (0.783‐1.173) | 1.186 (1.037‐1.356) | 1.213 (0.942‐1.563) |
| Diabetes*year | 0.947 (0.927‐0.967) | 0.977 (0.946‐1.008) | 0.961 (0.942‐0.980) | 0.955 (0.918‐0.994) |
| C statistic | 0.812 | 0.907 | 0.880 | 0.919 |
Among non‐ICU patients (Table 2, model 2), each successive year was associated with a 7.5% relative reduction in the adjusted odds of mortality (OR: 0.925, 95% CI: 0.909‐0.940) for patients without diabetes compared to a 9.6% relative reduction for those with diabetes (OR: 0.904, 95% CI: 0.879‐0.929); this greater decline in odds of adjusted mortality of 2.3% per year (OR: 0.977, 95% CI: 0.946‐1.008; P=0.148) was not statistically significant.
We found greater decline in odds of mortality among patients with diabetes than among patients without diabetes over time in both medical patients (3.9% greater decline per year; OR: 0.961, 95% CI: 0.942‐0.980) and surgical patients (4.5% greater decline per year; OR: 0.955, 95% CI: 0.918‐0.994), without a difference between the 2. Detailed results are shown in Table 2, models 3 and 4.
Glycemic Control
Among ICU patients with diabetes (N=14,364), at least 2 inpatient point‐of‐care glucose readings were available for 13,136 (91.5%), with a mean of 4.67 readings per day, whereas hemoglobin A1c data were available for only 5321 patients (37.0%). Both inpatient glucose data and hemoglobin A1c were available for 4989 patients (34.7%). Figure 2 shows trends in inpatient and outpatient glycemic control measures among ICU patients with diabetes over the study period. Mean hemoglobin A1c decreased from 7.7 in 2000 to 7.3 in 2010. Mean hospitalization glucose began at 187.2, reached a nadir of 162.4 in the third quarter (Q3) of 2007, and rose subsequently to 174.4 with loosened glucose control targets. Standard deviation of mean glucose and percentage of patient‐days with a severe hyperglycemic episode followed a similar pattern, though with nadirs in Q4 2007 and Q2 2008, respectively, whereas percentage of patient‐days with a hypoglycemic episode rose from 1.46% in 2000, peaked at 3.00% in Q3 2005, and returned to 2.15% in 2010. All changes in glucose control are significant with P<0.001.
Mortality Trends and Glycemic Control
To determine whether glucose control explained the excess decline in odds of mortality among patients with diabetes in the ICU, we restricted our sample to ICU patients with diabetes and examined the association of diabetes with mortality after including measures of glucose control.
We first verified that the overall adjusted mortality trend among ICU patients with diabetes for whom we had measures of inpatient glucose control was similar to that of the full sample of ICU patients with diabetes. Similar to the full sample, we found that the adjusted excess odds of death significantly declined by a relative 7.3% each successive year (OR: 0.927, 95% CI: 0.907‐0.947; Table 3, model 1). We then included measures of inpatient glucose control in the model and found, as expected, that a higher percentage of days with severe hyperglycemia and with hypoglycemia was associated with an increased odds of death (P<0.001 for both; Table 3, model 2). Nonetheless, after including measures of inpatient glucose control, we found that the rate of change of excess odds of death for patients with diabetes was unchanged (OR: 0.926, 95% CI: 0.905‐0.947).
| Patients With Inpatient Glucose Control Measures, n=13,136 | Patients With Inpatient and Outpatient Glucose Control Measures, n=4,989 | ||||
|---|---|---|---|---|---|
| Independent Variables | Model 1, OR (95% CI) | Model 2, OR (95% CI) | Model 3, OR (95% CI) | Model 4, OR (95% CI) | Model 5, OR (95% CI) |
| |||||
| Year | 0.927 (0.907‐0.947) | 0.926 (0.905‐0.947) | 0.958 (0.919‐0.998) | 0.956 (0.916‐0.997) | 0.953 (0.914‐0.994) |
| % Severe hyperglycemic days | 1.016 (1.010‐1.021) | 1.009 (0.998‐1.020) | 1.010 (0.999‐1.021) | ||
| % Hypoglycemic days | 1.047 (1.040‐1.055) | 1.051 (1.037‐1.065) | 1.049 (1.036‐1.063) | ||
| % Normoglycemic days | 0.997 (0.994‐1.000) | 0.994 (0.989‐0.999) | 0.993 (0.988‐0.998) | ||
| SD of mean glucose | 0.996 (0.992‐1.000) | 0.993 (0.986‐1.000) | 0.994 (0.987‐1.002) | ||
| Mean HbA1c | 0.892 (0.828‐0.961) | ||||
| C statistic | 0.806 | 0.825 | 0.825 | 0.838 | 0.841 |
We then restricted our sample to patients with diabetes with both inpatient and outpatient glycemic control data and found that, in this subpopulation, the adjusted excess odds of death among patients with diabetes relative to those without significantly declined by a relative 4.2% each progressive year (OR: 0.958, 95% CI: 0.918‐0.998; Table 3, model 3). Including measures of inpatient glucose control in the model did not significantly change the rate of change of excess odds of death (OR: 0.956, 95% CI: 0.916‐0.997; Table 3, model 4), nor did including both measures of inpatient and outpatient glycemic control (OR: 0.953, 95% CI: 0.914‐0.994; Table 3, model 5).
DISCUSSION
We conducted a difference‐in‐difference analysis of in‐hospital mortality rates among adult patients with diabetes compared to patients without diabetes over 10 years, stratifying by ICU status and service assignment. For patients with any ICU stay, we found that the reduction in odds of mortality for patients with diabetes has been 3 times larger than the reduction in odds of mortality for patients without diabetes. For those without an ICU stay, we found no significant difference between patients with and without diabetes in the rate at which in‐hospital mortality declined. We did not find stratification by assignment to a medical or surgical service to be an effect modifier. Finally, despite the fact that our institution achieved better aggregate inpatient glucose control, less severe hyperglycemia, and better long‐term glucose control over the course of the decade, we did not find that either inpatient or outpatient glucose control explained the trend in mortality for patients with diabetes in the ICU. Our study is unique in its inclusion of all hospitalized patients and its ability to simultaneously assess whether both inpatient and outpatient glucose control are explanatory factors in the observed mortality trends.
The fact that improved inpatient glucose control did not explain the trend in mortality for patients with diabetes in the ICU is consistent with the majority of the literature on intensive inpatient glucose control. In randomized trials, intensive glucose control appears to be of greater benefit for patients without diabetes than for patients with diabetes.[31] In fact, in 1 study, patients with diabetes were the only group that did not benefit from intensive glucose control.[32] In our study, it is possible that the rise in hypoglycemia nullified some of the benefits of glucose control. Nationally, hospital admissions for hypoglycemia among Medicare beneficiaries now outnumber admissions for hyperglycemia.[27]
We also do not find that the decline in hemoglobin A1c attenuated the reduction in mortality in the minority of patients for whom these data were available. This is concordant with evidence from 3 randomized clinical trials that have failed to establish a clear beneficial effect of intensive outpatient glucose control on primary cardiovascular endpoints among older, high‐risk patients with type 2 diabetes using glucose‐lowering agents.[21, 22, 23] It is notable, however, that the population for whom we had available hemoglobin A1c results was not representative of the overall population of ICU patients with diabetes. Consequently, there may be an association of outpatient glucose control with inpatient mortality in the overall population of ICU patients with diabetes that we were not able to detect.
The decline in mortality among ICU patients with diabetes in our study may stem from factors other than glycemic control. It is possible that patients were diagnosed earlier in their course of disease in later years of the study period, making the population of patients with diabetes younger or healthier. Of note, however, our risk adjustment models were very robust, with C statistics from 0.82 to 0.92, suggesting that we were able to account for much of the mortality risk attributable to patient clinical and demographic factors. More intensive glucose management may have nonglycemic benefits, such as closer patient observation, which may themselves affect mortality. Alternatively, improved cardiovascular management for patients with diabetes may have decreased the incidence of cardiovascular events. During the study period, evidence from large clinical trials demonstrated the importance of tight blood pressure and lipid management in improving outcomes for patients with diabetes,[33, 34, 35, 36] guidelines for lipid management for patients with diabetes changed,[37] and fewer patients developed cardiovascular complications.[38] Finally, it is possible that our findings can be explained by an improvement in treatment of complications for which patients with diabetes previously have had disproportionately worse outcomes, such as percutaneous coronary intervention.[39]
Our findings may have important implications for both clinicians and policymakers. Changes in inpatient glucose management have required substantial additional resources on the part of hospitals. Our evidence regarding the questionable impact of inpatient glucose control on in‐hospital mortality trends for patients with diabetes is disappointing and highlights the need for multifaceted evaluation of the impact of such quality initiatives. There may, for instance, be benefits from tighter blood glucose control in the hospital beyond mortality, such as reduced infections, costs, or length of stay. On the outpatient side, our more limited data are consistent with recent studies that have not been able to show a mortality benefit in older diabetic patients from more stringent glycemic control. A reassessment of prevailing diabetes‐related quality measures, as recently called for by some,[40, 41] seems reasonable.
Our study must be interpreted in light of its limitations. It is possible that the improvements in glucose management were too small to result in a mortality benefit. The overall reduction of 25 mg dL achieved at our institution is less than the 33 to 50 mg/dL difference between intensive and conventional groups in those randomized clinical trials that have found reductions in mortality.[11, 42] In addition, an increase in mean glucose during the last 1 to 2 years of the observation period (in response to prevailing guidelines) could potentially have attenuated any benefit on mortality. The study does not include other important clinical endpoints, such as infections, complications, length of stay, and hospital costs. Additionally, we did not examine postdischarge mortality, which might have shown a different pattern. The small proportion of patients with hemoglobin A1c results may have hampered our ability to detect an effect of outpatient glucose control. Consequently, our findings regarding outpatient glucose control are only suggestive. Finally, our findings represent the experience of a single, large academic medical center and may not be generalizable to all settings.
Overall, we found that patients with diabetes in the ICU have experienced a disproportionate reduction in in‐hospital mortality over time that does not appear to be explained by improvements in either inpatient or outpatient glucose control. Although improved glycemic control may have other benefits, it does not appear to impact in‐hospital mortality. Our real‐world empirical results contribute to the discourse among clinicians and policymakers with regards to refocusing the approach to managing glucose in‐hospital and readjudication of diabetes‐related quality measures.
Acknowledgments
The authors would like to acknowledge the YaleNew Haven Hospital diabetes management team: Gael Ulisse, APRN, Helen Psarakis, APRN, Anne Kaisen, APRN, and the Yale Endocrine Fellows.
Disclosures: Design and conduct of the study: N. B., J. D., S. I., T. B., L. H. Collection, management, analysis, and interpretation of the data: N. B., B. J., J. D., J. R., J. B., S. I., L. H. Preparation, review, or approval of the manuscript: N. B., B. J., J. D., J. R., S. I., T. B., L. H. Leora Horwitz, MD, had full access to all the data in the study and takes responsibility for the integrity of the data and the accuracy of the data analysis. Dr. Horwitz is supported by the National Institute on Aging (K08 AG038336) and by the American Federation for Aging Research through the Paul B. Beeson Career Development Award Program. This publication was also made possible by CTSA grant number UL1 RR024139 from the National Center for Research Resources and the National Center for Advancing Translational Science, components of the National Institutes of Health (NIH), and NIH roadmap for Medical Research. Its contents are solely the responsibility of the authors and do not necessarily represent the official view of the NIH. No funding source had any role in design and conduct of the study; collection, management, analysis, and interpretation of the data; preparation, review, or approval of the manuscript; or decision to submit the manuscript for publication. Silvio E. Inzucchi, MD, serves on a Data Safety Monitoring Board for Novo Nordisk, a manufacturer of insulin products used in the hospital setting. The remaining authors declare no conflicts of interest.
- National Diabetes Information Clearinghouse. National Diabetes Statistics; 2011. Available at: http://diabetes.niddk.nih.gov/dm/pubs/america/index.aspx. Accessed November 12, 2013.
- Healthcare Cost and Utilization Project. Statistical brief #93; 2010. Available at: http://www.hcup‐us.ahrq.gov/reports/statbriefs/sb93.pdf. Accessed November 12, 2013.
- , , , et al. Association between diabetes mellitus and post‐discharge outcomes in patients hospitalized with heart failure: findings from the EVEREST trial. Eur J Heart Fail. 2013;15(2):194–202.
- , , , et al. Influence of diabetes mellitus on clinical outcome in the thrombolytic era of acute myocardial infarction. GUSTO‐I Investigators. Global Utilization of Streptokinase and Tissue Plasminogen Activator for Occluded Coronary Arteries. J Am Coll Cardiol. 1997;30(1):171–179.
- , , , , , . Type 2 diabetes and pneumonia outcomes: a population‐based cohort study. Diabetes Care. 2007;30(9):2251–2257.
- , , , . Prevalence and outcomes of diabetes, hypertension and cardiovascular disease in COPD. Eur Respir J. 2008;32(4):962–969.
- , , , , . The role of body mass index and diabetes in the development of acute organ failure and subsequent mortality in an observational cohort. Crit Care. 2006;10(5):R137.
- , , , , , . Type 2 diabetes and 1‐year mortality in intensive care unit patients. Eur J Clin Invest. 2013;43(3):238–247.
- , , . Excess mortality during hospital stays among patients with recorded diabetes compared with those without diabetes. Diabet Med. 2013;30(12):1393–1402.
- , , , et al. Decade‐long trends in mortality among patients with and without diabetes mellitus at a major academic medical center. JAMA Intern Med. 2014;174(7):1187–1188.
- , , , et al. Intensive insulin therapy in critically ill patients. N Engl J Med. 2001;345(19):1359–1367.
- , , , et al. Intensive versus conventional glucose control in critically ill patients. N Engl J Med. 2009;360(13):1283–1297.
- , , , et al. A prospective randomised multi‐centre controlled trial on tight glucose control by intensive insulin therapy in adult intensive care units: the Glucontrol study. Intensive Care Med. 2009;35(10):1738–1748.
- , , , et al. Intensive versus conventional insulin therapy: a randomized controlled trial in medical and surgical critically ill patients. Crit Care Med. 2008;36(12):3190–3197.
- , , , et al. Intensive insulin therapy in the medical ICU. N Engl J Med. 2006;354(5):449–461.
- , , , et al. Glycemic control in non‐critically ill hospitalized patients: a systematic review and meta‐analysis. J Clin Endocrinol Metab. 2012;97(1):49–58.
- , , , et al. American Association of Clinical Endocrinologists and American Diabetes Association consensus statement on inpatient glycemic control. Diabetes Care. 2009;32(6):1119–1131.
- Agency for Healthcare Research and Quality National Quality Measures Clearinghouse. Percent of cardiac surgery patients with controlled 6 A.M. postoperative blood glucose; 2012. Available at: http://www.qualitymeasures.ahrq.gov/content.aspx?id=35532. Accessed November 12, 2013.
- The effect of intensive treatment of diabetes on the development and progression of long‐term complications in insulin‐dependent diabetes mellitus. The Diabetes Control and Complications Trial Research Group. N Engl J Med. 1993;329(14):977–986.
- , , , et al. Intensive blood‐glucose control with sulphonylureas or insulin compared with conventional treatment and risk of complications in patients with type 2 diabetes (UKPDS 33). Lancet. 1998;352(9131):837–853.
- Effects of intensive glucose lowering in type 2 diabetes. N Engl J Med. 2008;358(24):2545–2559.
- , , , et al. Glucose control and vascular complications in veterans with type 2 diabetes. N Engl J Med. 2009;360(2):129–139.
- , , , et al. Intensive blood glucose control and vascular outcomes in patients with type 2 diabetes. N Engl J Med. 2008;358(24):2560–2572.
- . Standards of medical care in diabetes—2014. Diabetes Care. 2014;37(suppl 1):S14–S80.
- National Committee for Quality Assurance. HEDIS 2013. Available at: http://www.ncqa.org/HEDISQualityMeasurement.aspx. Accessed November 12, 2013.
- , , , . Is glycemic control improving in US adults? Diabetes Care. 2008;31(1):81–86.
- , , , et al. National trends in US hospital admissions for hyperglycemia and hypoglycemia among medicare beneficiaries, 1999 to 2011. JAMA Intern Med. 2014;174(7):1116–1124.
- , , , et al. "Glucometrics"—assessing the quality of inpatient glucose management. Diabetes Technol Ther. 2006;8(5):560–569.
- , , , , . A modification of the Elixhauser comorbidity measures into a point system for hospital death using administrative data. Med Care. 2009;47(6):626–633.
- Healthcare Cost and Utilization Project. Clinical Classifications Software (CCS) for ICD‐9‐CM; 2013. Available at: http://www.hcup‐us.ahrq.gov/toolssoftware/ccs/ccs.jsp. Accessed November 12, 2013.
- , , , , . The impact of premorbid diabetic status on the relationship between the three domains of glycemic control and mortality in critically ill patients. Curr Opin Clin Nutr Metab Care. 2012;15(2):151–160.
- , , , et al. Intensive insulin therapy in mixed medical/surgical intensive care units: benefit versus harm. Diabetes. 2006;55(11):3151–3159.
- Tight blood pressure control and risk of macrovascular and microvascular complications in type 2 diabetes: UKPDS 38. UK Prospective Diabetes Study Group. BMJ. 1998;317(7160):703–713.
- , , , et al. Effects of a fixed combination of perindopril and indapamide on macrovascular and microvascular outcomes in patients with type 2 diabetes mellitus (the ADVANCE trial): a randomised controlled trial. Lancet. 2007;370(9590):829–840.
- , , , , . MRC/BHF heart protection study of cholesterol‐lowering with simvastatin in 5963 people with diabetes: a randomised placebo‐controlled trial. Lancet. 2003;361(9374):2005–2016.
- , , , et al. Primary prevention of cardiovascular disease with atorvastatin in type 2 diabetes in the Collaborative Atorvastatin Diabetes Study (CARDS): multicentre randomised placebo‐controlled trial. Lancet. 2004;364(9435):685–696.
- , , , . Expert panel on detection, evaluation and treatment of high blood cholesterol in adults. Executive summary of the third report of the national cholesterol education program (NCEP) adult treatment panel (atp III). JAMA. 2001;285(19):2486–2497.
- , , , et al. Changes in diabetes‐related complications in the United States, 1990–2010. N Engl J Med. 2014;370(16):1514–1523.
- , , . Coronary heart disease in patients with diabetes: part II: recent advances in coronary revascularization. J Am Coll Cardiol. 2007;49(6):643–656.
- , , , et al. Management of hyperglycemia in type 2 diabetes: a patient‐centered approach position statement of the American Diabetes Association (ADA) and the European Association for the Study of Diabetes (EASD). Diabetes Care. 2012;35(6):1364–1379.
- , , , , . Assessing potential glycemic overtreatment in persons at hypoglycemic risk. JAMA Intern Med. 2013;174(2):259–268.
- , , , . Glycometabolic state at admission: important risk marker of mortality in conventionally treated patients with diabetes mellitus and acute myocardial infarction: long‐term results from the Diabetes and Insulin‐Glucose Infusion in Acute Myocardial Infarction (DIGAMI) study. Circulation. 1999;99(20):2626–2632.
© 2015 Society of Hospital Medicine
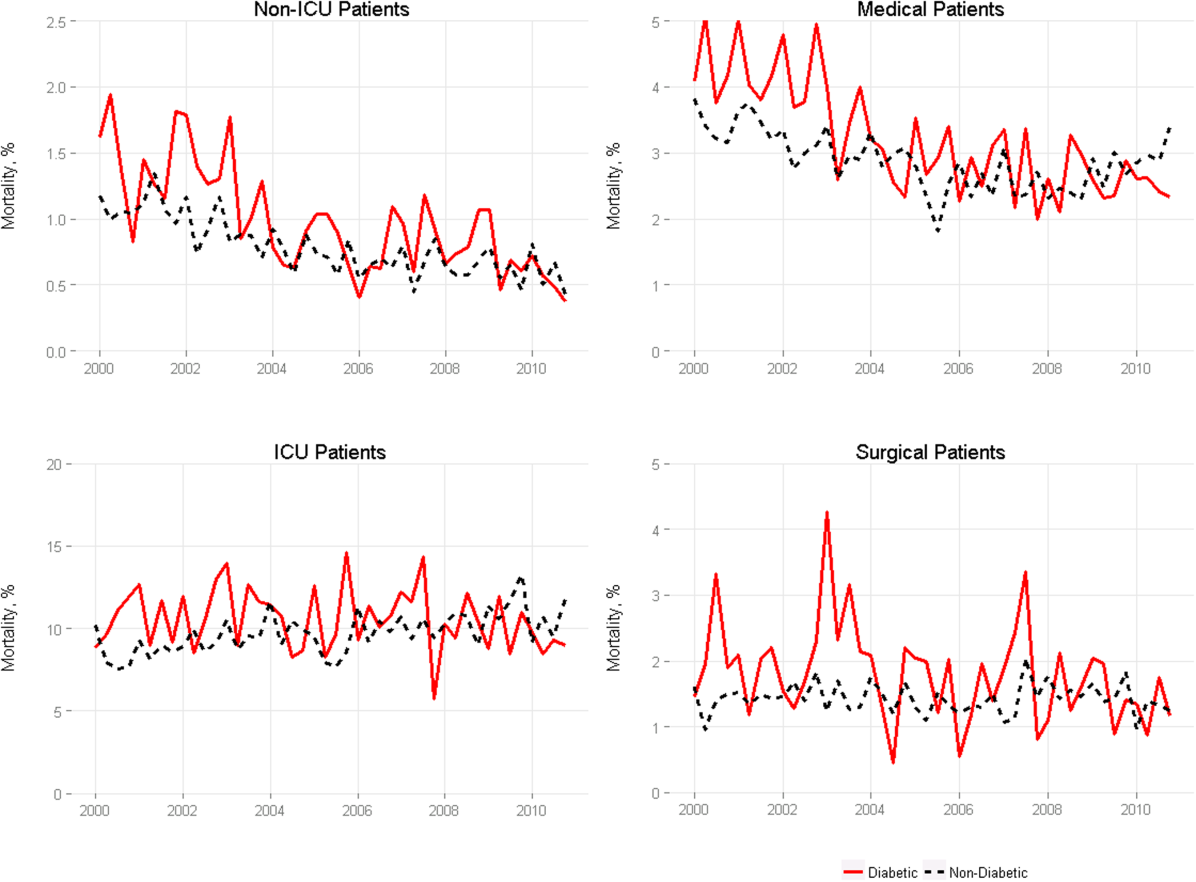
Introducing Choosing Wisely®
In this issue of the Journal of Hospital Medicine, we introduce a new recurring feature, Choosing Wisely: Next Steps in Improving Healthcare Value, sponsored by the American Board of Internal Medicine Foundation. The Choosing Wisely campaign is a collaborative initiative led by the American Board of Internal Medicine Foundation, in which specialty societies develop priority lists of activities that physicians should question doing routinely. The program has been broadly embraced by both patient and provider stakeholder groups. More than 35 specialty societies have contributed 26 published lists, including the Society of Hospital Medicine, which published 2 lists, 1 for adults and 1 for pediatrics. These included suggestions such as avoiding urinary catheters for convenience or monitoring of output, avoiding stress ulcer prophylaxis for low‐ to medium‐risk patients, and avoiding routine daily laboratory testing in clinically stable patients. A recent study estimated that up to $5 billion might be saved if just the primary care‐related recommendations were implemented.[1]
THE NEED FOR CHANGE
The Choosing Wisely campaign has so far focused primarily on identifying individual treatments that are not beneficial and potentially harmful to patients. At the Journal of Hospital Medicine, we believe the discipline of hospital medicine is well‐positioned to advance the broader discussion about achieving the triple aim: better healthcare, better health, and better value. Inpatient care represents only 7% of US healthcare encounters but 29% of healthcare expenditures (over $375 billion annually).[2] Patients aged 65 years and over account for 41% of all hospital costs and 34% of all hospital stays. Accordingly, without a change in current utilization patterns, the aging of the baby boomer generation will have a marked impact on expenditures for hospital care. Healthcare costs are increasingly edging out discretionary federal and municipal spending on critical services such as education and scientific research. Historically, federal discretionary spending has averaged 8.3% of gross domestic product (GDP). In 2014, it dropped to 7.2% and is projected to decline to 5.1% in 2024. By comparison, federal spending for Medicare, Medicaid, and health insurance subsidies was 2.1% in 1990[3] but in 2014 is estimated at 4.8% of GDP, rising to 5.7% by 2024.[4]
In conjunction with the deleterious consequences of unchecked growth in healthcare costs on national fiscal health, hospitals are feeling intense and increasing pressure to improve quality and value. In fiscal year 2015, hospitals will be at risk for up to 5.5% of Medicare payments under the parameters of the Hospital Readmission Reduction Program (maximum penalty 3% of base diagnosis‐related group [DRG] payments), Value‐Based Purchasing (maximum withholding 1.5% of base DRG payments), and the Hospital Acquired Conditions Program (maximum penalty 1% of all payments). Simultaneously, long‐standing subsidies are being phased out, including payments to teaching hospitals or for disproportionate share of care delivered to uninsured populations. The challenge for hospital medicine will be to take a leadership role in defining national priorities for change, organizing and guiding a pivot toward lower‐intensity care settings and services, and most importantly, promoting innovation in hospital‐based healthcare delivery.
EXISTING INNOVATIONS
The passage of the Affordable Care Act gave the Centers for Medicare & Medicaid Services (CMS) a platform for spurring innovation in healthcare delivery. In addition to deploying the payment penalty programs described above, the CMS Center for Medicare & Medicaid Innovation has a $10 billion budget to test alternate models of care. Demonstration projects to date include Accountable Care Organization pilots (ACOs, encouraging hospitals to join with community clinicians to provide integrated and coordinated care), the Bundled Payment program (paying providers a lump fee for an extended episode of care rather than service volume), a Comprehensive End Stage Renal Disease Care Initiative, and a variety of other tests of novel delivery and payment models that directly involve hospital medicine.[5] Private insurers are following suit, with an increasing proportion of hospital contracts involving shared savings or risk.
Hospitals are already responding to this new era of cost sharing and cross‐continuum accountability in a variety of creative ways. The University of Utah has developed an award‐winning cost accounting system that integrates highly detailed patient‐level cost data with clinical information to create a value‐driven outcomes tool that enables the hospital to consider costs as they relate to the results of care delivery. In this way, the hospital can justify maintaining high cost/better outcome activities, while targeting high cost/worse outcome practices for improvement.[6] Boston Children's Hospital is leading a group of healthcare systems in the development and application of a series of Standardized Clinical Assessment and Management Plans (SCAMPs), designed to improve patient care while decreasing unnecessary utilization (particularly in cases where existing evidence or guidelines are insufficient or outdated). Unlike traditional clinical care pathways or clinical guidelines, SCAMPs are developed iteratively based on actual internal practices, especially deviations from the standard plan, and their relationship to outcomes.[7, 8]
Local innovations, however, are of limited national importance in bending the cost curve unless broadly disseminated. The last decade has brought a new degree of cross‐institution collaboration to hospital care. Regional consortiums to improve care have existed for years, often prompted by CMS‐funded quality improvement organizations and demonstration projects.[9, 10] CMS's Partnership for Patients program has aimed to reduce hospital‐acquired conditions and readmissions by enrolling hospitals in 26 regional Hospital Engagement Networks.[11] Increasingly, however, hospitals are voluntarily engaging in collaboratives to improve the quality and value of their care. Over 500 US hospitals participate in the American College of Surgeons National Surgical Quality Improvement Program to improve surgical outcomes, nearly 1000 joined the Door‐to‐Balloon Alliance to improve percutaneous catheterization outcomes, and over 1000 joined the Hospital2Home collaborative to improve care transitions.[12, 13, 14] In 2008, the Premier hospital alliance formed QUEST (Quality, Efficiency, Safety and Transparency), a collaborative of approximately 350 members committed to improving a wide range of outcomes, from cost and efficiency to safety and mortality. Most recently, the High Value Healthcare Collaborative was formed, encompassing 19 large healthcare delivery organizations and over 70 million patients, with the central objective of creating a true learning healthcare system. In principle, these boundary‐spanning collaboratives should accelerate change nationally and serve as transformational agents. In practice, outcomes from these efforts have been variable, largely depending on the degree to which hospitals are able to share data, evaluate outcomes, and identify generalizable improvement interventions that can be reliably adopted.
Last, the focus of hospital care has already begun to extend beyond inpatient care. Hospitals already care for more outpatients than they do inpatients, and that trend is expected to continue. In 2012, hospitals treated 34.4 million inpatient admissions, but cared for nearly 675 million outpatient visits, only a fraction of which were emergency department visits or observation stays. From 2011 to 2012, outpatient visits to hospitals increased 2.9%, whereas inpatient admissions declined 1.2%.[15] Hospitals are buying up outpatient practices, creating infusion centers to provide intravenous‐based therapy to outpatients, establishing postdischarge clinics to transition their discharged patients, chartering their own visiting nurse agencies, and testing a host of other outpatient‐focused activities. Combined with an enhanced focus on postacute transitions following an inpatient admission as part of the care continuum, this broadening reach of hospital medicine brings a host of new opportunities for innovation in care delivery and payment models.
CHOOSING WISELY: NEXT STEPS IN IMPROVING HEALTHCARE VALUE
This series will consider a wide range of ways in which hospital medicine can help drive improvements in healthcare value, both from a conceptual standpoint (what to do and why?), as well as demonstration of practical application of these principles (how?). A companion series, Choosing Wisely: Things We Do For No Reason, will focus more explicitly on services such as blood transfusions or diagnostic tests such as creatinine kinase that are commonly overutilized. Example topics of interest for Next Steps include:
- Best methodologies for improvement science in hospital settings, including Lean healthcare, behavioral economics, human factors engineering
- Strategies for reconciling system‐level standardization with the delivery of personalized, patient‐centered care
- Impacts of national policies on hospital‐based improvement efforts: how do ACOs, bundled payments, and medical homes alter hospital practice?
- Reports on creative new ideas to help achieve value: changes in clinical workflow or care pathways, radical physical plant redesign, electronic medical record innovations, payment incentives, provider accountability and more
- Results of models that move the reach of hospital medicine beyond the walls as an integrated part of the care continuum.
We welcome unsolicited proposals for series topics submitted as a 500‐word precis to: nextsteps@hospitalmedicine.org.
Disclosures
Choosing Wisely: Next Steps in Improving Healthcare Value is sponsored by the American Board of Internal Medicine Foundation. Dr. Horwitz is supported by the National Institute on Aging (K08 AG038336) and by the American Federation for Aging Research through the Paul B. Beeson Career Development Award Program. The authors report no conflicts of interest.
- , , , . “Top 5” lists top $5 billion. Arch Intern Med. 2011;171(20):1858–1859.
- Healthcare Cost and Utilization Project. Statistical brief #146. Available at: http://www.hcup‐us.ahrq.gov/reports/statbriefs/sb146.pdf. Published January 2013. Accessed October 18, 2014.
- Centers for Medicare 32(5):911–920.
- Institute for Relevant Clinical Data Analytics, Inc. Relevant clinical data analytics I. SCAMPs mission statement. 2014. Available at: http://www.scamps.org/index.htm. Accessed October 18, 2014.
- , , , . The long‐term effect of premier pay for performance on patient outcomes. N Engl J Med. 2012;366(17):1606–1615.
- . Effects of the Premier Hospital Quality Incentive Demonstration on Medicare patient mortality and cost. Health Serv Res. 2009;44(3):821–842.
- Centers for Medicare 1(1):97–104.
- American College of Cardiology. Quality Improvement for Institutions. Hospital to home. 2014. Available at: http://cvquality.acc.org/Initiatives/H2H.aspx. Accessed October 19, 2014.
- American College of Surgeons. National Surgical Quality Improvement Program. 2014. Available at: http://site.acsnsqip.org/. Accessed October 19, 2014.
- . Hospitals on the rebound, show stronger operating margins. Modern Healthcare website. Available at: http://www. modernhealthcare.com/article/20140103/NEWS/301039973. Published January 3, 2014. Accessed October 18, 2014.
In this issue of the Journal of Hospital Medicine, we introduce a new recurring feature, Choosing Wisely: Next Steps in Improving Healthcare Value, sponsored by the American Board of Internal Medicine Foundation. The Choosing Wisely campaign is a collaborative initiative led by the American Board of Internal Medicine Foundation, in which specialty societies develop priority lists of activities that physicians should question doing routinely. The program has been broadly embraced by both patient and provider stakeholder groups. More than 35 specialty societies have contributed 26 published lists, including the Society of Hospital Medicine, which published 2 lists, 1 for adults and 1 for pediatrics. These included suggestions such as avoiding urinary catheters for convenience or monitoring of output, avoiding stress ulcer prophylaxis for low‐ to medium‐risk patients, and avoiding routine daily laboratory testing in clinically stable patients. A recent study estimated that up to $5 billion might be saved if just the primary care‐related recommendations were implemented.[1]
THE NEED FOR CHANGE
The Choosing Wisely campaign has so far focused primarily on identifying individual treatments that are not beneficial and potentially harmful to patients. At the Journal of Hospital Medicine, we believe the discipline of hospital medicine is well‐positioned to advance the broader discussion about achieving the triple aim: better healthcare, better health, and better value. Inpatient care represents only 7% of US healthcare encounters but 29% of healthcare expenditures (over $375 billion annually).[2] Patients aged 65 years and over account for 41% of all hospital costs and 34% of all hospital stays. Accordingly, without a change in current utilization patterns, the aging of the baby boomer generation will have a marked impact on expenditures for hospital care. Healthcare costs are increasingly edging out discretionary federal and municipal spending on critical services such as education and scientific research. Historically, federal discretionary spending has averaged 8.3% of gross domestic product (GDP). In 2014, it dropped to 7.2% and is projected to decline to 5.1% in 2024. By comparison, federal spending for Medicare, Medicaid, and health insurance subsidies was 2.1% in 1990[3] but in 2014 is estimated at 4.8% of GDP, rising to 5.7% by 2024.[4]
In conjunction with the deleterious consequences of unchecked growth in healthcare costs on national fiscal health, hospitals are feeling intense and increasing pressure to improve quality and value. In fiscal year 2015, hospitals will be at risk for up to 5.5% of Medicare payments under the parameters of the Hospital Readmission Reduction Program (maximum penalty 3% of base diagnosis‐related group [DRG] payments), Value‐Based Purchasing (maximum withholding 1.5% of base DRG payments), and the Hospital Acquired Conditions Program (maximum penalty 1% of all payments). Simultaneously, long‐standing subsidies are being phased out, including payments to teaching hospitals or for disproportionate share of care delivered to uninsured populations. The challenge for hospital medicine will be to take a leadership role in defining national priorities for change, organizing and guiding a pivot toward lower‐intensity care settings and services, and most importantly, promoting innovation in hospital‐based healthcare delivery.
EXISTING INNOVATIONS
The passage of the Affordable Care Act gave the Centers for Medicare & Medicaid Services (CMS) a platform for spurring innovation in healthcare delivery. In addition to deploying the payment penalty programs described above, the CMS Center for Medicare & Medicaid Innovation has a $10 billion budget to test alternate models of care. Demonstration projects to date include Accountable Care Organization pilots (ACOs, encouraging hospitals to join with community clinicians to provide integrated and coordinated care), the Bundled Payment program (paying providers a lump fee for an extended episode of care rather than service volume), a Comprehensive End Stage Renal Disease Care Initiative, and a variety of other tests of novel delivery and payment models that directly involve hospital medicine.[5] Private insurers are following suit, with an increasing proportion of hospital contracts involving shared savings or risk.
Hospitals are already responding to this new era of cost sharing and cross‐continuum accountability in a variety of creative ways. The University of Utah has developed an award‐winning cost accounting system that integrates highly detailed patient‐level cost data with clinical information to create a value‐driven outcomes tool that enables the hospital to consider costs as they relate to the results of care delivery. In this way, the hospital can justify maintaining high cost/better outcome activities, while targeting high cost/worse outcome practices for improvement.[6] Boston Children's Hospital is leading a group of healthcare systems in the development and application of a series of Standardized Clinical Assessment and Management Plans (SCAMPs), designed to improve patient care while decreasing unnecessary utilization (particularly in cases where existing evidence or guidelines are insufficient or outdated). Unlike traditional clinical care pathways or clinical guidelines, SCAMPs are developed iteratively based on actual internal practices, especially deviations from the standard plan, and their relationship to outcomes.[7, 8]
Local innovations, however, are of limited national importance in bending the cost curve unless broadly disseminated. The last decade has brought a new degree of cross‐institution collaboration to hospital care. Regional consortiums to improve care have existed for years, often prompted by CMS‐funded quality improvement organizations and demonstration projects.[9, 10] CMS's Partnership for Patients program has aimed to reduce hospital‐acquired conditions and readmissions by enrolling hospitals in 26 regional Hospital Engagement Networks.[11] Increasingly, however, hospitals are voluntarily engaging in collaboratives to improve the quality and value of their care. Over 500 US hospitals participate in the American College of Surgeons National Surgical Quality Improvement Program to improve surgical outcomes, nearly 1000 joined the Door‐to‐Balloon Alliance to improve percutaneous catheterization outcomes, and over 1000 joined the Hospital2Home collaborative to improve care transitions.[12, 13, 14] In 2008, the Premier hospital alliance formed QUEST (Quality, Efficiency, Safety and Transparency), a collaborative of approximately 350 members committed to improving a wide range of outcomes, from cost and efficiency to safety and mortality. Most recently, the High Value Healthcare Collaborative was formed, encompassing 19 large healthcare delivery organizations and over 70 million patients, with the central objective of creating a true learning healthcare system. In principle, these boundary‐spanning collaboratives should accelerate change nationally and serve as transformational agents. In practice, outcomes from these efforts have been variable, largely depending on the degree to which hospitals are able to share data, evaluate outcomes, and identify generalizable improvement interventions that can be reliably adopted.
Last, the focus of hospital care has already begun to extend beyond inpatient care. Hospitals already care for more outpatients than they do inpatients, and that trend is expected to continue. In 2012, hospitals treated 34.4 million inpatient admissions, but cared for nearly 675 million outpatient visits, only a fraction of which were emergency department visits or observation stays. From 2011 to 2012, outpatient visits to hospitals increased 2.9%, whereas inpatient admissions declined 1.2%.[15] Hospitals are buying up outpatient practices, creating infusion centers to provide intravenous‐based therapy to outpatients, establishing postdischarge clinics to transition their discharged patients, chartering their own visiting nurse agencies, and testing a host of other outpatient‐focused activities. Combined with an enhanced focus on postacute transitions following an inpatient admission as part of the care continuum, this broadening reach of hospital medicine brings a host of new opportunities for innovation in care delivery and payment models.
CHOOSING WISELY: NEXT STEPS IN IMPROVING HEALTHCARE VALUE
This series will consider a wide range of ways in which hospital medicine can help drive improvements in healthcare value, both from a conceptual standpoint (what to do and why?), as well as demonstration of practical application of these principles (how?). A companion series, Choosing Wisely: Things We Do For No Reason, will focus more explicitly on services such as blood transfusions or diagnostic tests such as creatinine kinase that are commonly overutilized. Example topics of interest for Next Steps include:
- Best methodologies for improvement science in hospital settings, including Lean healthcare, behavioral economics, human factors engineering
- Strategies for reconciling system‐level standardization with the delivery of personalized, patient‐centered care
- Impacts of national policies on hospital‐based improvement efforts: how do ACOs, bundled payments, and medical homes alter hospital practice?
- Reports on creative new ideas to help achieve value: changes in clinical workflow or care pathways, radical physical plant redesign, electronic medical record innovations, payment incentives, provider accountability and more
- Results of models that move the reach of hospital medicine beyond the walls as an integrated part of the care continuum.
We welcome unsolicited proposals for series topics submitted as a 500‐word precis to: nextsteps@hospitalmedicine.org.
Disclosures
Choosing Wisely: Next Steps in Improving Healthcare Value is sponsored by the American Board of Internal Medicine Foundation. Dr. Horwitz is supported by the National Institute on Aging (K08 AG038336) and by the American Federation for Aging Research through the Paul B. Beeson Career Development Award Program. The authors report no conflicts of interest.
- , , , . “Top 5” lists top $5 billion. Arch Intern Med. 2011;171(20):1858–1859.
- Healthcare Cost and Utilization Project. Statistical brief #146. Available at: http://www.hcup‐us.ahrq.gov/reports/statbriefs/sb146.pdf. Published January 2013. Accessed October 18, 2014.
- Centers for Medicare 32(5):911–920.
- Institute for Relevant Clinical Data Analytics, Inc. Relevant clinical data analytics I. SCAMPs mission statement. 2014. Available at: http://www.scamps.org/index.htm. Accessed October 18, 2014.
- , , , . The long‐term effect of premier pay for performance on patient outcomes. N Engl J Med. 2012;366(17):1606–1615.
- . Effects of the Premier Hospital Quality Incentive Demonstration on Medicare patient mortality and cost. Health Serv Res. 2009;44(3):821–842.
- Centers for Medicare 1(1):97–104.
- American College of Cardiology. Quality Improvement for Institutions. Hospital to home. 2014. Available at: http://cvquality.acc.org/Initiatives/H2H.aspx. Accessed October 19, 2014.
- American College of Surgeons. National Surgical Quality Improvement Program. 2014. Available at: http://site.acsnsqip.org/. Accessed October 19, 2014.
- . Hospitals on the rebound, show stronger operating margins. Modern Healthcare website. Available at: http://www. modernhealthcare.com/article/20140103/NEWS/301039973. Published January 3, 2014. Accessed October 18, 2014.
Hospitalist Sign‐out
Hospital medicine is a main component of healthcare in the United States and is growing.[1] In 1995, 9% of inpatient care performed by general internists to Medicare patients was provided by hospitalists; by 2006, this had increased to 37%.[2] The estimated 30,000 practicing hospitalists account for 19% of all practicing general internists[2, 3, 4] and have had a major impact on the treatment of inpatients at US hospitals.[5] Other specialties are adopting the hospital‐based physician model.[6, 7] The hospitalist model does have unique challenges. One notable aspect of hospitalist care, which is frequently shift based, is the transfer of care among providers at shift change.
The Society of Hospital Medicine recognizes patient handoffs/sign‐outs as a core competency for hospitalists,[8] but there is little literature evaluating hospitalist sign‐out quality.[9] A systematic review in 2009 found no studies of hospitalist handoffs.[8] Furthermore, early work suggests that hospitalist handoffs are not consistently effective.[10] In a recent survey, 13% of hospitalists reported they had received an incomplete handoff, and 16% of hospitalists reported at least 1 near‐miss attributed to incomplete communication.[11] Last, hospitalists perform no better than housestaff on evaluations of sign‐out quality.[12]
Cross‐coverage situations, in which sign‐out is key, have been shown to place patients at risk.[13, 14] One study showed 7.1 problems related to sign‐out per 100 patient‐days.[15] Failure during sign‐out can ultimately threaten patient safety.[16] Therefore, evaluating the quality of hospitalist sign‐outs by assessing how well the sign‐out prepares the night team for overnight events is necessary to improve hospitalist sign‐outs and ultimately increase patient safety.
METHODS
Study Setting
The study took place at YaleNew Haven Hospital (YNHH), the primary teaching affiliate for the Yale School of Medicine, in New Haven, Connecticut. YNHH is a 966‐bed, urban, academic medical center. The Hospitalist Service is a nonteaching service composed of 56.1 full‐time‐equivalent (FTE) attending physicians and 26.8 FTE midlevel providers. In fiscal year 2012, the YNHH Hospitalist Service cared for 13,764 discharges, or approximately 70% of general medical discharges. Similar patients are cared for by both hospitalists and housestaff. Patients on the hospitalist service are assigned an attending physician as well as a midlevel provider during the daytime. Between the departure of the day team and the arrival of the night team, typically a 2‐hour window, a skeleton crew covers the entire service and admits patients. The same skeleton crew coverage plan exists in the approximately 2.5‐hour morning gap between the departure of the night team and arrival of the day team. Overnight, care is generally provided by attending hospitalist physicians alone. Clinical fellows and internal medicine residents occasionally fill the night hospitalist role.
Sign‐out Procedure
The YNHH Hospitalist Service uses a written sign‐out[17] created via template built into the electronic health record (EHR), Sunrise Clinical Manager (version 5.5; Allscripts, Chicago, IL) and is the major mechanism for shift‐to‐shift information transfer. A free text summary of the patient's medical course and condition is created by the provider preparing the sign‐out, as is a separate list of to do items. The free text box is titled History (general hospital course, new events of the day, overall clinical condition). A representative narrative example is, 87 y/o gentleman PMHx AF on coumadin, diastolic CHF (EF 40%), NIDDM2, first degree AV block, GIB in setting of supratherapeutic INR, depression, COPD p/w worsening low back pain in setting of L1 compression frx of? age. HD stable. An option exists to include a medication list pulled from the active orders in the EHR when the sign‐out report is printed. The sign‐out is typically created by the hospitalist attending on the day of admission and then updated daily by the mid‐level provider under the supervision of the attending physician, in accordance with internal standards set by the service. Formal sign‐out training is included as part of orientation for new hires, and ongoing sign‐out education is provided, as needed, by a physician assistant charged with continuous quality improvement for the entire service. The service maintains an expectation for the entire team to provide accurate and updated sign‐out at every shift change. Attending hospitalists or mid‐level providers update the sign‐out on weekends. Because the day team has generally left the hospital prior to the arrival of the night team, verbal sign‐out occurs rarely. Should a verbal sign‐out be given to the night team, it will be provided by the daytime team directly to the night team either via telephone or the day team member staying in the hospital until arrival of the night team.
Participants
All full‐time and regularly scheduled part‐time attending physicians on the YNHH hospitalist night team were eligible to participate. We excluded temporary physicians on service, including clinical fellows and resident moonlighters. Hospitalists could not participate more than once. Written informed consent was obtained of all hospitalists at the start of their shift.
Data Collection
Hospitalists who consented were provided a single pocket card during their shift. For every inquiry that involved a patient that the hospitalist was covering, the hospitalist recorded who originated the inquiry, the clinical significance, the sufficiency of written sign‐out, which information was used other than the written sign‐out, and information regarding the anticipation of the event by the daytime team (Figure 1).

Data were collected on 6 days and distributed from April 30, 2012 through June 12, 2012. Dates were chosen based on staffing to maximize the number of eligible physicians each night and included both weekdays and weekend days. The written sign‐out for the entire service was printed for each night data collection took place.
Main Predictors
Our main predictor variables were characteristics of the inquiry (topic area, clinical importance of the inquiry as assessed by the hospitalist), characteristics of the patient (days since admission), and characteristics of the written sign‐out (whether it included any anticipatory guidance and a composite quality score). We identified elements of the composite quality score based on prior research and expert recommendations.[8, 18, 19, 20] To create the composite quality score, we gave 1 point for each of the following elements: diagnosis or presenting symptoms, general hospital course (a description of any event occurring during hospitalization but prior to date of data collection), current clinical condition (a description of objective data, symptoms, or stability/trajectory in the last 24 hours), and whether the sign‐out had been updated within the last 24 hours. The composite score could range from 0 to 4.
Main Outcome Measures
Our primary outcome measure was the quality and utility of the written‐only sign‐out as defined via a subjective assessment of sufficiency by the covering physician (ie, whether the written sign‐out was adequate to answer the query without seeking any supplemental information). For this outcome, we excluded inquiries for which hospitalists had determined a sign‐out was not necessary to address the inquiry or event.
Statistical Analysis
Data analysis was conducted using SAS 9.2 (SAS Institute, Cary, NC). We used a cutoff of P<0.05 for statistical significance; all tests were 2‐tailed. We assessed characteristics of overnight inquiries using descriptive statistics and determined the association of the main predictors with sufficient sign‐out using 2 tests. We constructed a multivariate logistic regression model using a priori‐determined clinically relevant predictors to test predictors of sign‐out sufficiency. The study was approved by the Human Investigation Committee of Yale University.
RESULTS
Hospitalists recorded 124 inquiries about 96 patients. Altogether, 15 of 19 (79%) eligible hospitalists returned surveys. Of the 96 patients, we obtained the written sign‐out for 68 (71%). The remainder were new patients for whom the sign‐out had not yet been prepared, or patients who had not yet been assigned to the hospitalist service at the time the sign‐out report was printed.
Hospitalists referenced the sign‐out for 89 (74%) inquiries, and the sign‐out was considered sufficient to respond to 27 (30%) of these inquiries (ie, the sign‐out was adequate to answer the inquiry without any supplemental information). Hospitalists physically saw the patient for 14 (12%) inquiries. Nurses were the originator for most inquiries (102 [82%]). The most common inquiry topics were medications (55 [45%]), plan of care (26 [21%]) and clinical changes (26 [21%]). Ninety‐five (77%) inquiries were considered to be somewhat or very clinically important by the hospitalist (Table 1).
| Inquiry originator, No. (% of 124) | |
| Nurse | 102 (82) |
| Patient | 13 (10) |
| Consultant | 6 (5) |
| Respiratory therapy | 3 (2) |
| Inquiry subject, No. (% of 122) | |
| Medication | 55 (45) |
| Plan of care | 26 (21) |
| Clinical change | 26 (21) |
| Order reconciliation | 15 (12) |
| Missing | 2 |
| Clinical importance of inquiry, No. (% of 123) | |
| Very | 33 (27) |
| Somewhat | 62 (50) |
| Not at all | 28 (23) |
| Missing | 1 |
| Sufficiency of sign‐out alone in answering inquiry, No. (% of 121) | |
| Yes | 27 (22) |
| No | 62 (51) |
| Sign‐out not necessary for inquiry | 32 (26) |
| Missing | 3 |
| Days since admission, No. (% of 124) | |
| Less than 2 | 69 (44.4) |
| 2 or more | 55 (55.6) |
| Reference(s) used when sign‐out insufficient, No. (% of 62) | |
| Physician notes | 37 (60) |
| Nurse | 11 (18) |
| Labs/studies | 10 (16) |
| Orders | 9 (15) |
| Patient | 7 (11) |
| Other | 7 (11) |
| Was the event predicted by the primary team? No. (% of 119) | |
| Yes | 17 (14) |
| No | 102 (86) |
| Missing | 5 |
| If no, could this event have been predicted, No. (% of 102) | |
| Yes | 47 (46) |
| No | 55 (54) |
| Of all events that could have been predicted, how many were predicted? No. (% of 64) | |
| Predicted | 17 (27) |
| Not predicted | 47 (73) |
| Did you physically see the patient? No. (% of 117) | |
| Yes | 14 (12) |
| No | 103 (88) |
| Missing | 7 |
| Composite score, No. (% of 68) | |
| 0 or 1 | 0 (0) |
| 2 | 3 (4) |
| 3 | 31 (46) |
| 4 | 34 (50) |
| Anticipatory guidance/to‐do tasks, No. (% of 96) | |
| 0 | 69(72) |
| 1 | 21 (22) |
| 2 or more | 6 (6) |
No written sign‐outs had a composite score of 0 or 1; 3 (4%) had a composite score of 2; 31 (46%) had a composite score of 3; and 34 (50%) had a composite score of 4. Seventy‐two percent of written sign‐outs included neither anticipatory guidance nor tasks, 21% had 1 anticipatory guidance item or task, and 6% had 2 or more anticipatory guidance items and/or tasks.
The primary team caring for a patient did not predict 102 (86%) inquiries, and hospitalists rated 47 (46%) of those unpredicted events as possible for the primary team to predict. Five responses to this question were incomplete and excluded. Of the 64 events predicted by the primary team or rated as predictable by the night hospitalists, 17 (27%) were predicted by the primary team (Table 1).
Sign‐out was considered sufficient in isolation to answer the majority of order reconciliation inquiries (5 [71%]), but was less effective at helping to answer inquiries about clinical change (7 [29%]), medications (10 [28%]), and plan of care (5 [24%]) (P=0.001). (Table 2) Ninety‐five events were rated as either very or somewhat clinically important, but this did not affect the likelihood of sign‐out being sufficient in isolation relative to the not at all clinically important group. Specifically, 33% of sign‐outs were rated sufficient in the very important group, 19% in the somewhat important group, and 50% in the not at all group (P=0.059).
| Predictor | Number of inquiries (%) for which sign‐out was sufficient in isolationb | p value | |
|---|---|---|---|
| |||
| Question topic | 0.001 | ||
| Order reconciliation (oxygen/telemetry) | 5/7 (71) | ||
| Clinical change (vitals, symptoms, labs) | 7/24 (29) | ||
| Medicationa (with clinical question) | 10/36 (28) | ||
| Plan of care (discharge, goals of care, procedure) | 5/21 (24) | ||
| Clinically important | 0.059 | ||
| Not at all | 8 (50) | ||
| Somewhat | 8 (19) | ||
| Very | 10 (33) | ||
| Days since admission | 0.015 | ||
| Less than 2 days | 21 (40) | ||
| 2 or more days | 6 (16) | ||
| Anticipatory guidance and tasks | 0.006 | ||
| 2 or more | 3 (60) | ||
| 1 | 3 (14) | ||
| 0 | 21 (34) | ||
| Composite score | 0.144 | ||
| <4 | 5 (15) | ||
| 4 | 10 (29) | ||
Sign‐out was considered sufficient in isolation more frequently for inquiries about patients admitted <2 days prior to data collection than for inquiries about patients admitted more than 2 days prior to data collection (21 [40%] vs 6 [16%], respectively) (P=0.015) (Table 2).
Sign‐outs with 2 or more anticipatory guidance items were considered sufficient in isolation more often than sign‐outs with 1 or fewer anticipatory guidance item (60% for 2 or more, 14% for 1, 34% for 0; P=0.006) (Table 2). The composite score was grouped into 2 categoriesscore <4 and score=4with no statistical difference in sign‐out sufficiency between the 2 groups (P=0.22) (Table 2).
In multivariable analysis, no predictor variable was significantly associated with sufficient sign‐out (Table 3).
| Adjusted OR (95% CI) | p value | ||
|---|---|---|---|
| Question topic | 0.58 | ||
| Order reconciliation (oxygen/telemetry) | Reference | ||
| Clinical change (vitals, symptoms, labs) | 0.29 (0.01 6.70) | ||
| Medication (+/‐ vitals or symptoms) | 0.17 (0.01 3.83) | ||
| Plan of care (discharge, goals of care, IV, CPAP, procedure) | 0.15 (0.01 3.37) | ||
| Clinically important | 0.85 | ||
| Not at All | Reference | ||
| Somewhat | 0.69 (0.12 4.04) | ||
| Very | 0.57 (0.08 3.88) | ||
| Days since admission | 0.332 (0.09 1.19) | 0.074 | |
| Anticipatory guidance and tasks | 0.26 | ||
| 2 or more | Reference | ||
| 1 | 0.13 (0.01 1.51) | ||
| 0 | 0.21 (0.02 2.11) | ||
| Composite Score | 0.22 | ||
| <4 | Reference | ||
| 4 | 2.2 (0.62 7.77) |
DISCUSSION
In this study of written sign‐out among hospitalists and physician‐extenders on a hospitalist service, we found that the sign‐out was used to answer three‐quarters of overnight inquiries, despite the advanced level of training (completion of all postgraduate medical education) of the covering clinicians and the presence of a robust EHR. The effectiveness of the written sign‐out, however, was not as consistently high as its use. Overall, the sign‐out was sufficient to answer less than a third of inquiries in which it was referenced. Thus, although most studies of sign‐out quality have focused on trainees, our results make it clear that hospitalists also rely on sign‐out, and its effectiveness can be improved.
There are few studies of attending‐level sign‐outs. Hinami et al. found that nearly 1 in 5 hospitalists was uncertain of the care plan after assuming care of a new set of patients, despite having received a handoff from the departing hospitalist.[11] Handoffs between emergency physicians and hospitalists have repeatedly been noted to have content omissions and to contribute to adverse events.[7, 12, 21, 22] Ilan et al. videotaped attending handoffs in the intensive care unit and found that they did not follow any of 3 commonly recommended structures; however, this study did not assess the effectiveness of the handoffs.[23] Williams et al. found that the transfer of patient information among surgical team members, including attending surgeons, was suboptimal, and these problems were commonly related to decreased surgeon familiarity with a particular patient, a theme common to hospital medicine, and a contributor to adverse events and decreased efficiency.[24]
This study extends the literature in several ways. By studying overnight events, we generate a comprehensive view of the information sources hospitalists use to care for patients overnight. Interestingly, our results were similar to the overnight information‐gathering habits of trainees in a study of pediatric trainees.[25] Furthermore, by linking each inquiry to the accompanying written sign‐out, we are able to analyze which characteristics of a written sign‐out are associated with sign‐out effectiveness, and we are able to describe the utility of written sign‐out to answer different types of clinical scenarios.
Our data show that hospitalists rely heavily on written sign‐out to care for patients overnight, with the physician note being the most‐utilized secondary reference used by covering physicians. The written sign‐out was most useful for order clarification compared to other topics, and the patient was only seen for 12% of inquiries. Most notable, however, was the suggestion that sign‐outs with more anticipatory guidance were more likely to be effective for overnight care, as were sign‐outs created earlier in the hospital course. Future efforts to improve the utility of the written sign‐out might focus on these items, whether through training or audit/feedback.
The use of electronic handoff tools has been shown to increase the ease of use, efficiency, and perceptions of patient safety and quality in several studies.[3, 26, 27] This study relied on an electronic tool as the only means of information transfer during sign‐out. Without the confounding effect of verbal information transfer, we are better able to understand the efficacy of the written component alone. Nonetheless, most expert opinion statements as well as The Joint Commission include a recommendation for verbal and written components to handoff communication.[8, 20, 28, 29, 30] It is possible that sign‐outs would more often have been rated sufficient if the handoff process had reliably included verbal handoff. Future studies are warranted to compare written‐only to written‐plus‐verbal sign‐out, to determine the added benefit of verbal communication. With a robust EHR, it is also an open question whether sign‐out needs to be sufficient to answer overnight inquiries or whether it would be acceptable or even preferable to have overnight staff consistently review the EHR directly, especially as the physician notes are the most common nonsign‐out reference used. Nonetheless, the fact that hospitalists rely heavily on written sign‐out despite the availability of other information sources suggests that hospitalists find specific benefit in written sign‐out.
Limitations of this study include the relatively small sample size, the limited collection time period, and the single‐site nature. The YNHH Hospitalist Service uses only written documents to sign out, so the external validity to programs that use verbal sign‐out is limited. The written‐only nature, however, removes the variable of the discussion at time of sign‐out, improving the purity of the written sign‐out assessment. We did not assess workload, which might have affected sign‐out quality. The interpretation of the composite score is limited, due to little variation in scoring in our sample, as well as lack of validation in other studies. An additional limitation is that sign‐outs are not entirely drafted by the hospitalist attendings. Hospitalists draft the initial sign‐out document, but it is updated on subsequent days by the mid‐level provider under the direction of the hospitalist attending. It is therefore possible that sign‐outs maintained directly by hospitalists would have been of different quality. In this regard it is interesting to note that in a different study of verbal sign‐out we were not able to detect a difference in quality among hospitalists, trainees, and midlevels.[12] Last, hindsight bias may be present, as the covering physician's perspective of the event includes more information than available to the provider creating the sign‐out document.
Overall, we found that attending hospitalists rely heavily on written sign‐out documents to address overnight inquiries, but those sign‐outs are not reliably effective. Future work to better understand the roles of written and verbal components in sign‐out is needed to help improve the safety of overnight care.
Disclosures
Disclosures: Dr. Horwitz is supported by the National Institute on Aging (K08 AG038336) and by the American Federation for Aging Research through the Paul B. Beeson Career Development Award Program. Dr. Horwitz is also a Pepper Scholar with support from the Claude D. Pepper Older Americans Independence Center at Yale University School of Medicine (#P30AG021342 NIH/NIA). Dr. Fogerty had full access to all of the data in the study and takes responsibility for the integrity of the data and the accuracy of the data analysis. The authors do not have conflicts of interest to report. Dr. Schoenfeld was a medical student at the Yale University School of Medicine, New Haven, Connecticut at the time of the study. She is now a resident at Massachusetts General Hospital in Boston, Massachusetts.
- , , , . The status of hospital medicine groups in the United States. J Hosp Med. 2006;1(2):75–80.
- , , , . Growth in the care of older patients by hospitalists in the United States. N Engl J Med. 2009;360(11):1102–1112.
- , , , et al. The Veterans Affairs shift change physician‐to‐physician handoff project. Jt Comm J Qual Patient Saf. 2010;36(2):62–71.
- , . The evolution and future of hospital medicine. Mt Sinai J Med. 2008;75(5):418–423.
- . The hospitalist movement—time to move on. N Engl J Med. 2007;357(25):2627–2629.
- , , . Invited article: is it time for neurohospitalists? Neurology. 2008;70(15):1282–1288.
- , , , . Survey of obstetric and gynecologic hospitalists and laborists. Am J Obstet Gynecol. 2010;203(2):177.e171–e174.
- , , , , , . Hospitalist handoffs: a systematic review and task force recommendations. J Hosp Med. 2009;4(7):433–440.
- , , , , . Core competencies in hospital medicine: development and methodology. J Hosp Med. 2006;1(1):48–56.
- , , , , . Gaining efficiency and satisfaction in the handoff process. J Hosp Med. 2010;5(9):547–552.
- , , , . Understanding communication during hospitalist service changes: a mixed methods study. J Hosp Med. 2009;4(9):535–540.
- , , , et al. Development of a handoff evaluation tool for shift‐to‐shift physician handoffs: the handoff CEX. J Hosp Med. 2013;8(4):191–200.
- , , , , . Does housestaff discontinuity of care increase the risk for preventable adverse events? Ann Intern Med. 1994;121(11):866–872.
- , , , et al. Effect of short call admission on length of stay and quality of care for acute decompensated heart failure. Circulation. 2008;117(20):2637–2644.
- , , , , . Consequences of inadequate sign‐out for patient care. Arch Intern Med. 2008;168(16):1755–1760.
- , , , , . Communication failures in patient sign‐out and suggestions for improvement: a critical incident analysis. Qual Saf Health Care. 2005;14(6):401–407.
- , , , et al. An institution‐wide handoff task force to standardise and improve physician handoffs. BMJ Qual Saf. 2012;21(10):863–871.
- , , , , . What are covering doctors told about their patients? Analysis of sign‐out among internal medicine house staff. Qual Saf Health Care. 2009;18(4):248–255.
- , , , . Transfers of patient care between house staff on internal medicine wards: a national survey. Arch Intern Med. 2006;166(11):1173–1177.
- , , , . A theoretical framework and competency‐based approach to improving handoffs. Qual Saf Health Care. 2008;17(1):11–14.
- , , . Communicating in the “gray zone”: perceptions about emergency physician hospitalist handoffs and patient safety. Acad Emerg Med. 2007;14(10):884–894.
- , , , , , . Dropping the baton: a qualitative analysis of failures during the transition from emergency department to inpatient care. Ann Emerg Med. 2009;53(6):701–710.e704.
- , , , , , . Handover patterns: an observational study of critical care physicians. BMC Health Serv Res. 2012;12:11.
- , , , et al. Surgeon information transfer and communication: factors affecting quality and efficiency of inpatient care. Ann Surg. 2007;245(2):159–169.
- , , , , . Answering questions on call: Pediatric resident physicians' use of handoffs and other resources. J Hosp Med. 2013;8:328–333.
- , , , , . A randomized, controlled trial evaluating the impact of a computerized rounding and sign‐out system on continuity of care and resident work hours. J Am Coll Surg. 2005;200(4):538–545.
- , , , et al. Resident sign‐out and patient hand‐offs: opportunities for improvement. Teach Learn Med. 2011;23(2):105–111.
- , . A model for building a standardized hand‐off protocol. Jt Comm J Qual Patient Saf. 2006;32(11):646–655.
- , , , et al. The patient handoff: a comprehensive curricular blueprint for resident education to improve continuity of care. Acad Med. 2012;87(4):411–418.
- The Joint Commission. 2013 Comprehensive Accreditation Manuals. Oak Brook, IL: The Joint Commission; 2012.
Hospital medicine is a main component of healthcare in the United States and is growing.[1] In 1995, 9% of inpatient care performed by general internists to Medicare patients was provided by hospitalists; by 2006, this had increased to 37%.[2] The estimated 30,000 practicing hospitalists account for 19% of all practicing general internists[2, 3, 4] and have had a major impact on the treatment of inpatients at US hospitals.[5] Other specialties are adopting the hospital‐based physician model.[6, 7] The hospitalist model does have unique challenges. One notable aspect of hospitalist care, which is frequently shift based, is the transfer of care among providers at shift change.
The Society of Hospital Medicine recognizes patient handoffs/sign‐outs as a core competency for hospitalists,[8] but there is little literature evaluating hospitalist sign‐out quality.[9] A systematic review in 2009 found no studies of hospitalist handoffs.[8] Furthermore, early work suggests that hospitalist handoffs are not consistently effective.[10] In a recent survey, 13% of hospitalists reported they had received an incomplete handoff, and 16% of hospitalists reported at least 1 near‐miss attributed to incomplete communication.[11] Last, hospitalists perform no better than housestaff on evaluations of sign‐out quality.[12]
Cross‐coverage situations, in which sign‐out is key, have been shown to place patients at risk.[13, 14] One study showed 7.1 problems related to sign‐out per 100 patient‐days.[15] Failure during sign‐out can ultimately threaten patient safety.[16] Therefore, evaluating the quality of hospitalist sign‐outs by assessing how well the sign‐out prepares the night team for overnight events is necessary to improve hospitalist sign‐outs and ultimately increase patient safety.
METHODS
Study Setting
The study took place at YaleNew Haven Hospital (YNHH), the primary teaching affiliate for the Yale School of Medicine, in New Haven, Connecticut. YNHH is a 966‐bed, urban, academic medical center. The Hospitalist Service is a nonteaching service composed of 56.1 full‐time‐equivalent (FTE) attending physicians and 26.8 FTE midlevel providers. In fiscal year 2012, the YNHH Hospitalist Service cared for 13,764 discharges, or approximately 70% of general medical discharges. Similar patients are cared for by both hospitalists and housestaff. Patients on the hospitalist service are assigned an attending physician as well as a midlevel provider during the daytime. Between the departure of the day team and the arrival of the night team, typically a 2‐hour window, a skeleton crew covers the entire service and admits patients. The same skeleton crew coverage plan exists in the approximately 2.5‐hour morning gap between the departure of the night team and arrival of the day team. Overnight, care is generally provided by attending hospitalist physicians alone. Clinical fellows and internal medicine residents occasionally fill the night hospitalist role.
Sign‐out Procedure
The YNHH Hospitalist Service uses a written sign‐out[17] created via template built into the electronic health record (EHR), Sunrise Clinical Manager (version 5.5; Allscripts, Chicago, IL) and is the major mechanism for shift‐to‐shift information transfer. A free text summary of the patient's medical course and condition is created by the provider preparing the sign‐out, as is a separate list of to do items. The free text box is titled History (general hospital course, new events of the day, overall clinical condition). A representative narrative example is, 87 y/o gentleman PMHx AF on coumadin, diastolic CHF (EF 40%), NIDDM2, first degree AV block, GIB in setting of supratherapeutic INR, depression, COPD p/w worsening low back pain in setting of L1 compression frx of? age. HD stable. An option exists to include a medication list pulled from the active orders in the EHR when the sign‐out report is printed. The sign‐out is typically created by the hospitalist attending on the day of admission and then updated daily by the mid‐level provider under the supervision of the attending physician, in accordance with internal standards set by the service. Formal sign‐out training is included as part of orientation for new hires, and ongoing sign‐out education is provided, as needed, by a physician assistant charged with continuous quality improvement for the entire service. The service maintains an expectation for the entire team to provide accurate and updated sign‐out at every shift change. Attending hospitalists or mid‐level providers update the sign‐out on weekends. Because the day team has generally left the hospital prior to the arrival of the night team, verbal sign‐out occurs rarely. Should a verbal sign‐out be given to the night team, it will be provided by the daytime team directly to the night team either via telephone or the day team member staying in the hospital until arrival of the night team.
Participants
All full‐time and regularly scheduled part‐time attending physicians on the YNHH hospitalist night team were eligible to participate. We excluded temporary physicians on service, including clinical fellows and resident moonlighters. Hospitalists could not participate more than once. Written informed consent was obtained of all hospitalists at the start of their shift.
Data Collection
Hospitalists who consented were provided a single pocket card during their shift. For every inquiry that involved a patient that the hospitalist was covering, the hospitalist recorded who originated the inquiry, the clinical significance, the sufficiency of written sign‐out, which information was used other than the written sign‐out, and information regarding the anticipation of the event by the daytime team (Figure 1).
Data were collected on 6 days and distributed from April 30, 2012 through June 12, 2012. Dates were chosen based on staffing to maximize the number of eligible physicians each night and included both weekdays and weekend days. The written sign‐out for the entire service was printed for each night data collection took place.
Main Predictors
Our main predictor variables were characteristics of the inquiry (topic area, clinical importance of the inquiry as assessed by the hospitalist), characteristics of the patient (days since admission), and characteristics of the written sign‐out (whether it included any anticipatory guidance and a composite quality score). We identified elements of the composite quality score based on prior research and expert recommendations.[8, 18, 19, 20] To create the composite quality score, we gave 1 point for each of the following elements: diagnosis or presenting symptoms, general hospital course (a description of any event occurring during hospitalization but prior to date of data collection), current clinical condition (a description of objective data, symptoms, or stability/trajectory in the last 24 hours), and whether the sign‐out had been updated within the last 24 hours. The composite score could range from 0 to 4.
Main Outcome Measures
Our primary outcome measure was the quality and utility of the written‐only sign‐out as defined via a subjective assessment of sufficiency by the covering physician (ie, whether the written sign‐out was adequate to answer the query without seeking any supplemental information). For this outcome, we excluded inquiries for which hospitalists had determined a sign‐out was not necessary to address the inquiry or event.
Statistical Analysis
Data analysis was conducted using SAS 9.2 (SAS Institute, Cary, NC). We used a cutoff of P<0.05 for statistical significance; all tests were 2‐tailed. We assessed characteristics of overnight inquiries using descriptive statistics and determined the association of the main predictors with sufficient sign‐out using 2 tests. We constructed a multivariate logistic regression model using a priori‐determined clinically relevant predictors to test predictors of sign‐out sufficiency. The study was approved by the Human Investigation Committee of Yale University.
RESULTS
Hospitalists recorded 124 inquiries about 96 patients. Altogether, 15 of 19 (79%) eligible hospitalists returned surveys. Of the 96 patients, we obtained the written sign‐out for 68 (71%). The remainder were new patients for whom the sign‐out had not yet been prepared, or patients who had not yet been assigned to the hospitalist service at the time the sign‐out report was printed.
Hospitalists referenced the sign‐out for 89 (74%) inquiries, and the sign‐out was considered sufficient to respond to 27 (30%) of these inquiries (ie, the sign‐out was adequate to answer the inquiry without any supplemental information). Hospitalists physically saw the patient for 14 (12%) inquiries. Nurses were the originator for most inquiries (102 [82%]). The most common inquiry topics were medications (55 [45%]), plan of care (26 [21%]) and clinical changes (26 [21%]). Ninety‐five (77%) inquiries were considered to be somewhat or very clinically important by the hospitalist (Table 1).
| Inquiry originator, No. (% of 124) | |
| Nurse | 102 (82) |
| Patient | 13 (10) |
| Consultant | 6 (5) |
| Respiratory therapy | 3 (2) |
| Inquiry subject, No. (% of 122) | |
| Medication | 55 (45) |
| Plan of care | 26 (21) |
| Clinical change | 26 (21) |
| Order reconciliation | 15 (12) |
| Missing | 2 |
| Clinical importance of inquiry, No. (% of 123) | |
| Very | 33 (27) |
| Somewhat | 62 (50) |
| Not at all | 28 (23) |
| Missing | 1 |
| Sufficiency of sign‐out alone in answering inquiry, No. (% of 121) | |
| Yes | 27 (22) |
| No | 62 (51) |
| Sign‐out not necessary for inquiry | 32 (26) |
| Missing | 3 |
| Days since admission, No. (% of 124) | |
| Less than 2 | 69 (44.4) |
| 2 or more | 55 (55.6) |
| Reference(s) used when sign‐out insufficient, No. (% of 62) | |
| Physician notes | 37 (60) |
| Nurse | 11 (18) |
| Labs/studies | 10 (16) |
| Orders | 9 (15) |
| Patient | 7 (11) |
| Other | 7 (11) |
| Was the event predicted by the primary team? No. (% of 119) | |
| Yes | 17 (14) |
| No | 102 (86) |
| Missing | 5 |
| If no, could this event have been predicted, No. (% of 102) | |
| Yes | 47 (46) |
| No | 55 (54) |
| Of all events that could have been predicted, how many were predicted? No. (% of 64) | |
| Predicted | 17 (27) |
| Not predicted | 47 (73) |
| Did you physically see the patient? No. (% of 117) | |
| Yes | 14 (12) |
| No | 103 (88) |
| Missing | 7 |
| Composite score, No. (% of 68) | |
| 0 or 1 | 0 (0) |
| 2 | 3 (4) |
| 3 | 31 (46) |
| 4 | 34 (50) |
| Anticipatory guidance/to‐do tasks, No. (% of 96) | |
| 0 | 69(72) |
| 1 | 21 (22) |
| 2 or more | 6 (6) |
No written sign‐outs had a composite score of 0 or 1; 3 (4%) had a composite score of 2; 31 (46%) had a composite score of 3; and 34 (50%) had a composite score of 4. Seventy‐two percent of written sign‐outs included neither anticipatory guidance nor tasks, 21% had 1 anticipatory guidance item or task, and 6% had 2 or more anticipatory guidance items and/or tasks.
The primary team caring for a patient did not predict 102 (86%) inquiries, and hospitalists rated 47 (46%) of those unpredicted events as possible for the primary team to predict. Five responses to this question were incomplete and excluded. Of the 64 events predicted by the primary team or rated as predictable by the night hospitalists, 17 (27%) were predicted by the primary team (Table 1).
Sign‐out was considered sufficient in isolation to answer the majority of order reconciliation inquiries (5 [71%]), but was less effective at helping to answer inquiries about clinical change (7 [29%]), medications (10 [28%]), and plan of care (5 [24%]) (P=0.001). (Table 2) Ninety‐five events were rated as either very or somewhat clinically important, but this did not affect the likelihood of sign‐out being sufficient in isolation relative to the not at all clinically important group. Specifically, 33% of sign‐outs were rated sufficient in the very important group, 19% in the somewhat important group, and 50% in the not at all group (P=0.059).
| Predictor | Number of inquiries (%) for which sign‐out was sufficient in isolationb | p value | |
|---|---|---|---|
| |||
| Question topic | 0.001 | ||
| Order reconciliation (oxygen/telemetry) | 5/7 (71) | ||
| Clinical change (vitals, symptoms, labs) | 7/24 (29) | ||
| Medicationa (with clinical question) | 10/36 (28) | ||
| Plan of care (discharge, goals of care, procedure) | 5/21 (24) | ||
| Clinically important | 0.059 | ||
| Not at all | 8 (50) | ||
| Somewhat | 8 (19) | ||
| Very | 10 (33) | ||
| Days since admission | 0.015 | ||
| Less than 2 days | 21 (40) | ||
| 2 or more days | 6 (16) | ||
| Anticipatory guidance and tasks | 0.006 | ||
| 2 or more | 3 (60) | ||
| 1 | 3 (14) | ||
| 0 | 21 (34) | ||
| Composite score | 0.144 | ||
| <4 | 5 (15) | ||
| 4 | 10 (29) | ||
Sign‐out was considered sufficient in isolation more frequently for inquiries about patients admitted <2 days prior to data collection than for inquiries about patients admitted more than 2 days prior to data collection (21 [40%] vs 6 [16%], respectively) (P=0.015) (Table 2).
Sign‐outs with 2 or more anticipatory guidance items were considered sufficient in isolation more often than sign‐outs with 1 or fewer anticipatory guidance item (60% for 2 or more, 14% for 1, 34% for 0; P=0.006) (Table 2). The composite score was grouped into 2 categoriesscore <4 and score=4with no statistical difference in sign‐out sufficiency between the 2 groups (P=0.22) (Table 2).
In multivariable analysis, no predictor variable was significantly associated with sufficient sign‐out (Table 3).
| Adjusted OR (95% CI) | p value | ||
|---|---|---|---|
| Question topic | 0.58 | ||
| Order reconciliation (oxygen/telemetry) | Reference | ||
| Clinical change (vitals, symptoms, labs) | 0.29 (0.01 6.70) | ||
| Medication (+/‐ vitals or symptoms) | 0.17 (0.01 3.83) | ||
| Plan of care (discharge, goals of care, IV, CPAP, procedure) | 0.15 (0.01 3.37) | ||
| Clinically important | 0.85 | ||
| Not at All | Reference | ||
| Somewhat | 0.69 (0.12 4.04) | ||
| Very | 0.57 (0.08 3.88) | ||
| Days since admission | 0.332 (0.09 1.19) | 0.074 | |
| Anticipatory guidance and tasks | 0.26 | ||
| 2 or more | Reference | ||
| 1 | 0.13 (0.01 1.51) | ||
| 0 | 0.21 (0.02 2.11) | ||
| Composite Score | 0.22 | ||
| <4 | Reference | ||
| 4 | 2.2 (0.62 7.77) |
DISCUSSION
In this study of written sign‐out among hospitalists and physician‐extenders on a hospitalist service, we found that the sign‐out was used to answer three‐quarters of overnight inquiries, despite the advanced level of training (completion of all postgraduate medical education) of the covering clinicians and the presence of a robust EHR. The effectiveness of the written sign‐out, however, was not as consistently high as its use. Overall, the sign‐out was sufficient to answer less than a third of inquiries in which it was referenced. Thus, although most studies of sign‐out quality have focused on trainees, our results make it clear that hospitalists also rely on sign‐out, and its effectiveness can be improved.
There are few studies of attending‐level sign‐outs. Hinami et al. found that nearly 1 in 5 hospitalists was uncertain of the care plan after assuming care of a new set of patients, despite having received a handoff from the departing hospitalist.[11] Handoffs between emergency physicians and hospitalists have repeatedly been noted to have content omissions and to contribute to adverse events.[7, 12, 21, 22] Ilan et al. videotaped attending handoffs in the intensive care unit and found that they did not follow any of 3 commonly recommended structures; however, this study did not assess the effectiveness of the handoffs.[23] Williams et al. found that the transfer of patient information among surgical team members, including attending surgeons, was suboptimal, and these problems were commonly related to decreased surgeon familiarity with a particular patient, a theme common to hospital medicine, and a contributor to adverse events and decreased efficiency.[24]
This study extends the literature in several ways. By studying overnight events, we generate a comprehensive view of the information sources hospitalists use to care for patients overnight. Interestingly, our results were similar to the overnight information‐gathering habits of trainees in a study of pediatric trainees.[25] Furthermore, by linking each inquiry to the accompanying written sign‐out, we are able to analyze which characteristics of a written sign‐out are associated with sign‐out effectiveness, and we are able to describe the utility of written sign‐out to answer different types of clinical scenarios.
Our data show that hospitalists rely heavily on written sign‐out to care for patients overnight, with the physician note being the most‐utilized secondary reference used by covering physicians. The written sign‐out was most useful for order clarification compared to other topics, and the patient was only seen for 12% of inquiries. Most notable, however, was the suggestion that sign‐outs with more anticipatory guidance were more likely to be effective for overnight care, as were sign‐outs created earlier in the hospital course. Future efforts to improve the utility of the written sign‐out might focus on these items, whether through training or audit/feedback.
The use of electronic handoff tools has been shown to increase the ease of use, efficiency, and perceptions of patient safety and quality in several studies.[3, 26, 27] This study relied on an electronic tool as the only means of information transfer during sign‐out. Without the confounding effect of verbal information transfer, we are better able to understand the efficacy of the written component alone. Nonetheless, most expert opinion statements as well as The Joint Commission include a recommendation for verbal and written components to handoff communication.[8, 20, 28, 29, 30] It is possible that sign‐outs would more often have been rated sufficient if the handoff process had reliably included verbal handoff. Future studies are warranted to compare written‐only to written‐plus‐verbal sign‐out, to determine the added benefit of verbal communication. With a robust EHR, it is also an open question whether sign‐out needs to be sufficient to answer overnight inquiries or whether it would be acceptable or even preferable to have overnight staff consistently review the EHR directly, especially as the physician notes are the most common nonsign‐out reference used. Nonetheless, the fact that hospitalists rely heavily on written sign‐out despite the availability of other information sources suggests that hospitalists find specific benefit in written sign‐out.
Limitations of this study include the relatively small sample size, the limited collection time period, and the single‐site nature. The YNHH Hospitalist Service uses only written documents to sign out, so the external validity to programs that use verbal sign‐out is limited. The written‐only nature, however, removes the variable of the discussion at time of sign‐out, improving the purity of the written sign‐out assessment. We did not assess workload, which might have affected sign‐out quality. The interpretation of the composite score is limited, due to little variation in scoring in our sample, as well as lack of validation in other studies. An additional limitation is that sign‐outs are not entirely drafted by the hospitalist attendings. Hospitalists draft the initial sign‐out document, but it is updated on subsequent days by the mid‐level provider under the direction of the hospitalist attending. It is therefore possible that sign‐outs maintained directly by hospitalists would have been of different quality. In this regard it is interesting to note that in a different study of verbal sign‐out we were not able to detect a difference in quality among hospitalists, trainees, and midlevels.[12] Last, hindsight bias may be present, as the covering physician's perspective of the event includes more information than available to the provider creating the sign‐out document.
Overall, we found that attending hospitalists rely heavily on written sign‐out documents to address overnight inquiries, but those sign‐outs are not reliably effective. Future work to better understand the roles of written and verbal components in sign‐out is needed to help improve the safety of overnight care.
Disclosures
Disclosures: Dr. Horwitz is supported by the National Institute on Aging (K08 AG038336) and by the American Federation for Aging Research through the Paul B. Beeson Career Development Award Program. Dr. Horwitz is also a Pepper Scholar with support from the Claude D. Pepper Older Americans Independence Center at Yale University School of Medicine (#P30AG021342 NIH/NIA). Dr. Fogerty had full access to all of the data in the study and takes responsibility for the integrity of the data and the accuracy of the data analysis. The authors do not have conflicts of interest to report. Dr. Schoenfeld was a medical student at the Yale University School of Medicine, New Haven, Connecticut at the time of the study. She is now a resident at Massachusetts General Hospital in Boston, Massachusetts.
- , , , . The status of hospital medicine groups in the United States. J Hosp Med. 2006;1(2):75–80.
- , , , . Growth in the care of older patients by hospitalists in the United States. N Engl J Med. 2009;360(11):1102–1112.
- , , , et al. The Veterans Affairs shift change physician‐to‐physician handoff project. Jt Comm J Qual Patient Saf. 2010;36(2):62–71.
- , . The evolution and future of hospital medicine. Mt Sinai J Med. 2008;75(5):418–423.
- . The hospitalist movement—time to move on. N Engl J Med. 2007;357(25):2627–2629.
- , , . Invited article: is it time for neurohospitalists? Neurology. 2008;70(15):1282–1288.
- , , , . Survey of obstetric and gynecologic hospitalists and laborists. Am J Obstet Gynecol. 2010;203(2):177.e171–e174.
- , , , , , . Hospitalist handoffs: a systematic review and task force recommendations. J Hosp Med. 2009;4(7):433–440.
- , , , , . Core competencies in hospital medicine: development and methodology. J Hosp Med. 2006;1(1):48–56.
- , , , , . Gaining efficiency and satisfaction in the handoff process. J Hosp Med. 2010;5(9):547–552.
- , , , . Understanding communication during hospitalist service changes: a mixed methods study. J Hosp Med. 2009;4(9):535–540.
- , , , et al. Development of a handoff evaluation tool for shift‐to‐shift physician handoffs: the handoff CEX. J Hosp Med. 2013;8(4):191–200.
- , , , , . Does housestaff discontinuity of care increase the risk for preventable adverse events? Ann Intern Med. 1994;121(11):866–872.
- , , , et al. Effect of short call admission on length of stay and quality of care for acute decompensated heart failure. Circulation. 2008;117(20):2637–2644.
- , , , , . Consequences of inadequate sign‐out for patient care. Arch Intern Med. 2008;168(16):1755–1760.
- , , , , . Communication failures in patient sign‐out and suggestions for improvement: a critical incident analysis. Qual Saf Health Care. 2005;14(6):401–407.
- , , , et al. An institution‐wide handoff task force to standardise and improve physician handoffs. BMJ Qual Saf. 2012;21(10):863–871.
- , , , , . What are covering doctors told about their patients? Analysis of sign‐out among internal medicine house staff. Qual Saf Health Care. 2009;18(4):248–255.
- , , , . Transfers of patient care between house staff on internal medicine wards: a national survey. Arch Intern Med. 2006;166(11):1173–1177.
- , , , . A theoretical framework and competency‐based approach to improving handoffs. Qual Saf Health Care. 2008;17(1):11–14.
- , , . Communicating in the “gray zone”: perceptions about emergency physician hospitalist handoffs and patient safety. Acad Emerg Med. 2007;14(10):884–894.
- , , , , , . Dropping the baton: a qualitative analysis of failures during the transition from emergency department to inpatient care. Ann Emerg Med. 2009;53(6):701–710.e704.
- , , , , , . Handover patterns: an observational study of critical care physicians. BMC Health Serv Res. 2012;12:11.
- , , , et al. Surgeon information transfer and communication: factors affecting quality and efficiency of inpatient care. Ann Surg. 2007;245(2):159–169.
- , , , , . Answering questions on call: Pediatric resident physicians' use of handoffs and other resources. J Hosp Med. 2013;8:328–333.
- , , , , . A randomized, controlled trial evaluating the impact of a computerized rounding and sign‐out system on continuity of care and resident work hours. J Am Coll Surg. 2005;200(4):538–545.
- , , , et al. Resident sign‐out and patient hand‐offs: opportunities for improvement. Teach Learn Med. 2011;23(2):105–111.
- , . A model for building a standardized hand‐off protocol. Jt Comm J Qual Patient Saf. 2006;32(11):646–655.
- , , , et al. The patient handoff: a comprehensive curricular blueprint for resident education to improve continuity of care. Acad Med. 2012;87(4):411–418.
- The Joint Commission. 2013 Comprehensive Accreditation Manuals. Oak Brook, IL: The Joint Commission; 2012.
© 2013 Society of Hospital Medicine
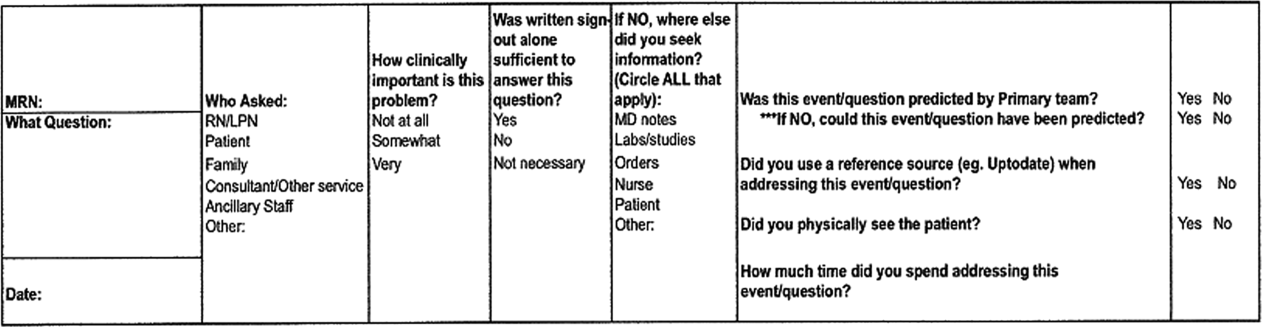
Evidence Needing a Lift
In this issue of the Journal of Hospital Medicine, Hansen and colleagues provide a first, early look at the effectiveness of the BOOST intervention to reduce 30‐day readmissions among hospitalized patients.[1] BOOST[2] is 1 of a number of care transition improvement methodologies that have been applied to the problem of readmissions, each of which has evidence to support its effectiveness in its initial settings[3, 4] but has proven to be difficult to translate to other sites.[5, 6, 7]
BOOST stands in contrast with other, largely research protocol‐derived, programs in that it allows sites to tailor adoption of recommendations to local contexts and is therefore potentially more feasible to implement. Feasibility and practicality has led BOOST to be adopted in large national settings, even if it has had little evidence to support its effectiveness to date.
Given the nonstandardized and ad hoc nature of most multicenter collaboratives generally, and the flexibility of the BOOST model specifically, the BOOST authors are to be commended for undertaking any evaluation at all. Perhaps, not surprisingly, they encountered many of the problems associated with a multicenter studydropout of sites, problematic data, and limited evidence for adoption of the intervention at participating hospitals. Although these represent real‐world experiences of a quality‐improvement program, as a group they pose a number of problems that limit the study's robustness, and generate important caveats that readers should use to temper their interpretation of the authors' findings.
The first caveat relates to the substantial number of sites that either dropped out of BOOST or failed to submit data after enlisting in the collaborative. Although this may be common in quality improvement collaboratives, similar problems would not be permissible in a trial of a new drug or device. Dropout and selected ability to contribute data suggest that the ability to fully adopt BOOST may not be universal, and raises the possibility of bias, because the least successful sites may have had less interest in remaining engaged and submitting data.
The second caveat relates to how readmission rates were assessed. Because sites provided rates of readmissions at the unit level rather than the actual counts of admissions or readmissions, the authors were unable to conduct statistical analyses typically performed for these interventions, such as time series or difference‐in‐difference analyses. More importantly, one cannot discern whether their results are driven by a small absolute but large relative change in the number of readmissions at small sites. That is, large percentage changes of low statistical significance could have misleadingly affected the overall results. Conversely, we cannot identify large sites where a similar relative reduction could be statistically significant and more broadly interpreted as representing the real effectiveness of BOOST efforts.
The third caveat is in regard to the data describing the sites' performance. The effectiveness of BOOST in this analysis varied greatly among sites, with only 1 site showing a strong reduction in readmission rate, and nearly all others showing no statistical improvements. In fact, it appears that their overall results were almost entirely driven by the improvements at that 1 site.
Variable effectiveness of an intervention can be related to variable adoption or contextual factors (such as availability of personnel to implement the program). Although these authors have data on BOOST programmatic adoption, they do not have qualitative data on local barriers and facilitators to BOOST implementation, which at this stage of evaluation would be particularly valuable in understanding the results. Analyzing site‐level effectiveness is of growing relevance to multicenter quality improvement collaboratives,[8, 9] but this evaluation provides little insight into reasons for variable success across institutions.
Finally, their study design does not allow us to understand a number of key questions. How many patients were involved in the intervention? How many patients received all BOOST‐recommended interventions? Which of these interventions seemed most effective in which patients? To what degree did patient severity of illness, cognitive status, social supports, or access to primary care influence readmission risk? Such information would help frame cost‐effective deployment of BOOST or related tools.
In the end, it seems unlikely that this iteration of the BOOST program produced broad reductions in readmission rates. Having said this, the authors provide the necessary start down the road toward a fuller understanding of real‐world efforts to reduce readmissions. Stated alternately, the nuances and flaws of this study provide ample fodder for others working in the field. BOOST is in good stead with other care transition models that have not translated well from their initial research environment to real‐world practices. The question now is: Do any of these interventions actually work in clinical practice settings, and will we ever know? Even more fundamentally, how important and meaningful are these hospital‐based care transition interventions? Where is the engagement with primary care? Where are the primary care outcomes? Does BOOST truly impact outcomes other than readmission?[10]
Doing high‐quality research in the context of a rapidly evolving quality improvement program is hard. Doing it at more than 1 site is harder. BOOST's flexibility is both a great source of strength and a clear challenge to rigorous evaluation. However, when the costs of care transition programs are so high, and the potential consequences of high readmission rates are so great for patients and for hospitals, the need to address these issues with real data and better evidence is paramount. We look forward to the next phase of BOOST and to the growth and refinement of the evidence base for how to improve care coordination and transitions effectively.
- , , , et al. Project BOOST: effectiveness of a multihospital effort to reduce rehospitalization. J Hosp Med. 2013;8:421–427.
- , . BOOSTing the hospital discharge. J Hosp Med. 2009;4:209–210.
- , , , et al. A reengineered hospital discharge program to decrease rehospitalization: a randomized trial. Ann Intern Med. 2009;150:178–187.
- , , , et al. Comprehensive discharge planning and home follow‐up of hospitalized elders: a randomized clinical trial. JAMA. 1999;281:613–620.
- , , , et al. Effectiveness and cost of a transitional care program for heart failure: a prospective study with concurrent controls. Arch Intern Med. 2011;171:1238–1243.
- . Hospitals question Medicare rules on readmissions. New York Times. March 29, 2013. Available at: http://www.nytimes.com/2013/03/30/business/hospitals‐question‐fairness‐of‐new‐medicare‐rules.html?pagewanted=all
In this issue of the Journal of Hospital Medicine, Hansen and colleagues provide a first, early look at the effectiveness of the BOOST intervention to reduce 30‐day readmissions among hospitalized patients.[1] BOOST[2] is 1 of a number of care transition improvement methodologies that have been applied to the problem of readmissions, each of which has evidence to support its effectiveness in its initial settings[3, 4] but has proven to be difficult to translate to other sites.[5, 6, 7]
BOOST stands in contrast with other, largely research protocol‐derived, programs in that it allows sites to tailor adoption of recommendations to local contexts and is therefore potentially more feasible to implement. Feasibility and practicality has led BOOST to be adopted in large national settings, even if it has had little evidence to support its effectiveness to date.
Given the nonstandardized and ad hoc nature of most multicenter collaboratives generally, and the flexibility of the BOOST model specifically, the BOOST authors are to be commended for undertaking any evaluation at all. Perhaps, not surprisingly, they encountered many of the problems associated with a multicenter studydropout of sites, problematic data, and limited evidence for adoption of the intervention at participating hospitals. Although these represent real‐world experiences of a quality‐improvement program, as a group they pose a number of problems that limit the study's robustness, and generate important caveats that readers should use to temper their interpretation of the authors' findings.
The first caveat relates to the substantial number of sites that either dropped out of BOOST or failed to submit data after enlisting in the collaborative. Although this may be common in quality improvement collaboratives, similar problems would not be permissible in a trial of a new drug or device. Dropout and selected ability to contribute data suggest that the ability to fully adopt BOOST may not be universal, and raises the possibility of bias, because the least successful sites may have had less interest in remaining engaged and submitting data.
The second caveat relates to how readmission rates were assessed. Because sites provided rates of readmissions at the unit level rather than the actual counts of admissions or readmissions, the authors were unable to conduct statistical analyses typically performed for these interventions, such as time series or difference‐in‐difference analyses. More importantly, one cannot discern whether their results are driven by a small absolute but large relative change in the number of readmissions at small sites. That is, large percentage changes of low statistical significance could have misleadingly affected the overall results. Conversely, we cannot identify large sites where a similar relative reduction could be statistically significant and more broadly interpreted as representing the real effectiveness of BOOST efforts.
The third caveat is in regard to the data describing the sites' performance. The effectiveness of BOOST in this analysis varied greatly among sites, with only 1 site showing a strong reduction in readmission rate, and nearly all others showing no statistical improvements. In fact, it appears that their overall results were almost entirely driven by the improvements at that 1 site.
Variable effectiveness of an intervention can be related to variable adoption or contextual factors (such as availability of personnel to implement the program). Although these authors have data on BOOST programmatic adoption, they do not have qualitative data on local barriers and facilitators to BOOST implementation, which at this stage of evaluation would be particularly valuable in understanding the results. Analyzing site‐level effectiveness is of growing relevance to multicenter quality improvement collaboratives,[8, 9] but this evaluation provides little insight into reasons for variable success across institutions.
Finally, their study design does not allow us to understand a number of key questions. How many patients were involved in the intervention? How many patients received all BOOST‐recommended interventions? Which of these interventions seemed most effective in which patients? To what degree did patient severity of illness, cognitive status, social supports, or access to primary care influence readmission risk? Such information would help frame cost‐effective deployment of BOOST or related tools.
In the end, it seems unlikely that this iteration of the BOOST program produced broad reductions in readmission rates. Having said this, the authors provide the necessary start down the road toward a fuller understanding of real‐world efforts to reduce readmissions. Stated alternately, the nuances and flaws of this study provide ample fodder for others working in the field. BOOST is in good stead with other care transition models that have not translated well from their initial research environment to real‐world practices. The question now is: Do any of these interventions actually work in clinical practice settings, and will we ever know? Even more fundamentally, how important and meaningful are these hospital‐based care transition interventions? Where is the engagement with primary care? Where are the primary care outcomes? Does BOOST truly impact outcomes other than readmission?[10]
Doing high‐quality research in the context of a rapidly evolving quality improvement program is hard. Doing it at more than 1 site is harder. BOOST's flexibility is both a great source of strength and a clear challenge to rigorous evaluation. However, when the costs of care transition programs are so high, and the potential consequences of high readmission rates are so great for patients and for hospitals, the need to address these issues with real data and better evidence is paramount. We look forward to the next phase of BOOST and to the growth and refinement of the evidence base for how to improve care coordination and transitions effectively.
- , , , et al. Project BOOST: effectiveness of a multihospital effort to reduce rehospitalization. J Hosp Med. 2013;8:421–427.
- , . BOOSTing the hospital discharge. J Hosp Med. 2009;4:209–210.
- , , , et al. A reengineered hospital discharge program to decrease rehospitalization: a randomized trial. Ann Intern Med. 2009;150:178–187.
- , , , et al. Comprehensive discharge planning and home follow‐up of hospitalized elders: a randomized clinical trial. JAMA. 1999;281:613–620.
- , , , et al. Effectiveness and cost of a transitional care program for heart failure: a prospective study with concurrent controls. Arch Intern Med. 2011;171:1238–1243.
- . Hospitals question Medicare rules on readmissions. New York Times. March 29, 2013. Available at: http://www.nytimes.com/2013/03/30/business/hospitals‐question‐fairness‐of‐new‐medicare‐rules.html?pagewanted=all
Handoff CEX
Transfers among trainee physicians within the hospital typically occur at least twice a day and have been increasing among trainees as work hours have declined.[1] The 2011 Accreditation Council for Graduate Medical Education (ACGME) guidelines,[2] which restrict intern working hours to 16 hours from a previous maximum of 30, have likely increased the frequency of physician trainee handoffs even further. Similarly, transfers among hospitalist attendings occur at least twice a day, given typical shifts of 8 to 12 hours.
Given the frequency of transfers, and the potential for harm generated by failed transitions,[3, 4, 5, 6] the end‐of‐shift written and verbal handoffs have assumed increasingly greater importance in hospital care among both trainees and hospitalist attendings.
The ACGME now requires that programs assess the competency of trainees in handoff communication.[2] Yet, there are few tools for assessing the quality of sign‐out communication. Those that exist primarily focus on the written sign‐out, and are rarely validated.[7, 8, 9, 10, 11, 12] Furthermore, it is uncertain whether such assessments must be done by supervisors or whether peers can participate in the evaluation. In this prospective multi‐institutional study we assess the performance characteristics of a verbal sign‐out evaluation tool for internal medicine housestaff and hospitalist attendings, and examine whether it can be used by peers as well as by external evaluators. This tool has previously been found to effectively discriminate between experienced and inexperienced nurses conducting nursing handoffs.[13]
METHODS
Tool Design and Measures
The Handoff CEX (clinical evaluation exercise) is a structured assessment based on the format of the mini‐CEX, an instrument used to assess the quality of history and physical examination by trainees for which validation studies have previously been conducted.[14, 15, 16, 17] We developed the tool based on themes we identified from our own expertise,[1, 5, 6, 8, 18, 19, 20, 21, 22, 23, 24, 25, 26, 27, 28, 29] the ACGME core competencies for trainees,[2] and the literature to maximize content validity. First, standardization has numerous demonstrable benefits for safety in general and handoffs in particular.[30, 31, 32] Consequently we created a domain for organization in which standardization was a characteristic of high performance.
Second, there is evidence that people engaged in conversation routinely overestimate peer comprehension,[27] and that explicit strategies to combat this overestimation, such as confirming understanding, explicitly assigning tasks rather than using open‐ended language, and using concrete language, are effective.[33] Accordingly we created a domain for communication skills, which is also an ACGME competency.
Third, although there were no formal guidelines for sign‐out content when we developed this tool, our own research had demonstrated that the content elements most often missing and felt to be important by stakeholders were related to clinical condition and explicating thinking processes,[5, 6] so we created a domain for content that highlighted these areas and met the ACGME competency of medical knowledge. In accordance with standards for evaluation of learners, we incorporated a domain for judgment to identify where trainees were in the RIME spectrum of reporter, interpreter, master, and educator.
Next, we added a section for professionalism in accordance with the ACGME core competencies of professionalism and patient care.[34] To avoid the disinclination of peers to label each other unprofessional, we labeled the professionalism domain as patient‐focused on the tool.
Finally, we included a domain for setting because of an extensive literature demonstrating increased handoff failures in noisy or interruptive settings.[35, 36, 37] We then revised the tool slightly based on our experiences among nurses and students.[13, 38] The final tool included the 6 domains described above and an assessment of overall competency. Each domain was scored on a 9‐point scale and included descriptive anchors at high and low ends of performance. We further divided the scale into 3 main sections: unsatisfactory (score 13), satisfactory (46), and superior (79). We designed 2 tools, 1 to assess the person providing the handoff and 1 to assess the handoff recipient, each with its own descriptive anchors. The recipient tool did not include a content domain (see Supporting Information, Appendix 1, in the online version of this article).
Setting and Subjects
We tested the tool in 2 different urban academic medical centers: the University of Chicago Medicine (UCM) and Yale‐New Haven Hospital (Yale). At UCM, we tested the tool among hospitalists, nurse practitioners, and physician assistants during the Monday and Tuesday morning and Friday evening sign‐out sessions. At Yale, we tested the tool among housestaff during the evening sign‐out session from the primary team to the on‐call covering team.
The UCM is a 550‐bed urban academic medical center in which the nonteaching hospitalist service cares for patients with liver disease, or end‐stage renal or lung disease awaiting transplant, and a small fraction of general medicine and oncology patients when the housestaff service exceeds its cap. No formal training on sign‐out is provided to attending or midlevel providers. The nonteaching hospitalist service operates as a separate service from the housestaff service and consists of 38 hospitalist clinicians (hospitalist attendings, nurse practitioners, and physicians assistants). There are 2 handoffs each day. In the morning the departing night hospitalist hands off to the incoming daytime hospitalist or midlevel provider. These handoffs occur at 7:30 am in a dedicated room. In the evening the daytime hospitalist or midlevel provider hands off to an incoming night hospitalist. This handoff occurs at 5:30 pm or 7:30 pm in a dedicated location. The written sign‐out is maintained on a Microsoft Word (Microsoft Corp., Redmond, WA) document on a password‐protected server and updated daily.
Yale is a 946‐bed urban academic medical center with a large internal medicine training program. Formal sign‐out education that covers the main domains of the tool is provided to new interns during the first 3 months of the year,[19] and a templated electronic medical record‐based electronic written handoff report is produced by the housestaff for all patients.[22] Approximately half of inpatient medicine patients are cared for by housestaff teams, which are entirely separate from the hospitalist service. Housestaff sign‐out occurs between 4 pm and 7 pm every night. At a minimum, the departing intern signs out to the incoming intern; this handoff is typically supervised by at least 1 second‐ or third‐year resident. All patients are signed out verbally; in addition, the written handoff report is provided to the incoming team. Most handoffs occur in a quiet charting room.
Data Collection
Data collection at UCM occurred between March and December 2010 on 3 days of each week: Mondays, Tuesdays, and Fridays. On Mondays and Tuesdays the morning handoffs were observed; on Fridays the evening handoffs were observed. Data collection at Yale occurred between March and May 2011. Only evening handoffs from the primary team to the overnight coverage were observed. At both sites, participants provided verbal informed consent prior to data collection. At the time of an eligible sign‐out session, a research assistant (D.R. at Yale, P.S. at UCM) provided the evaluation tools to all members of the incoming and outgoing teams, and observed the sign‐out session himself. Each person providing a handoff was asked to evaluate the recipient of the handoff; each person receiving a handoff was asked to evaluate the provider of the handoff. In addition, the trained third‐party observer (D.R., P.S.) evaluated both the provider and recipient of the handoff. The external evaluators were trained in principles of effective communication and the use of the tool, with specific review of anchors at each end of each domain. One evaluator had a DO degree and was completing an MPH degree. The second evaluator was an experienced clinical research assistant whose training consisted of supervised observation of 10 handoffs by a physician investigator. At Yale, if a resident was present, she or he was also asked to evaluate both the provider and recipient of the handoff. Consequently, every sign‐out session included at least 2 evaluations of each participant, 1 by a peer evaluator and 1 by a consistent external evaluator who did not know the patients. At Yale, many sign‐outs also included a third evaluation by a resident supervisor.
The study was approved by the institutional review boards at both UCM and Yale.
Statistical Analysis
We obtained mean, median, and interquartile range of scores for each subdomain of the tool as well as the overall assessment of handoff quality. We assessed convergent construct validity by assessing performance of the tool in different contexts. To do so, we determined whether scores differed by type of participant (provider or recipient), by site, by training level of evaluatee, or by type of evaluator (external, resident supervisor, or peer) by using Wilcoxon rank sum tests and Kruskal‐Wallis tests. For the assessment of differences in ratings by training level, we used evaluations of sign‐out providers only, because the 2 sites differed in scores for recipients. We also assessed construct validity by using Spearman rank correlation coefficients to describe the internal consistency of the tool in terms of the correlation between domains of the tool, and we conducted an exploratory factor analysis to gain insight into whether the subdomains of the tool were measuring the same construct. In conducting this analysis, we restricted the dataset to evaluations of sign‐out providers only, and used a principal components estimation method, a promax rotation, and squared multiple correlation communality priors. Finally, we conducted some preliminary studies of reliability by testing whether different types of evaluators provided similar assessments. We calculated a weighted kappa using Fleiss‐Cohen weights for external versus peer scores and again for supervising resident versus peer scores (Yale only). We were not able to assess test‐retest reliability by nature of the sign‐out process. Statistical significance was defined by a P value 0.05, and analyses were performed using SAS 9.2 (SAS Institute, Cary, NC).
RESULTS
A total of 149 handoff sessions were observed: 89 at UCM and 60 at Yale. Each site conducted a similar total number of evaluations: 336 at UCM, 337 at Yale. These sessions involved 97 unique individuals, 34 at UCM and 63 at Yale. Overall scores were high at both sites, but a wide range of scores was applied (Table 1).
| Domain | Provider, N=343 | Recipient, N=330 | P Value | ||||
|---|---|---|---|---|---|---|---|
| Median (IQR) | Mean (SD) | Range | Median (IQR) | Mean (SD) | Range | ||
| |||||||
| Setting | 7 (69) | 7.0 (1.7) | 29 | 7 (69) | 7.3 (1.6) | 29 | 0.05 |
| Organization | 7 (68) | 7.2 (1.5) | 29 | 8 (69) | 7.4 (1.4) | 29 | 0.07 |
| Communication | 7 (69) | 7.2 (1.6) | 19 | 8 (79) | 7.4 (1.5) | 29 | 0.22 |
| Content | 7 (68) | 7.0 (1.6) | 29 | ||||
| Judgment | 8 (68) | 7.3 (1.4) | 39 | 8 (79) | 7.5 (1.4) | 39 | 0.06 |
| Professionalism | 8 (79) | 7.4 (1.5) | 29 | 8 (79) | 7.6 (1.4) | 39 | 0.23 |
| Overall | 7 (68) | 7.1 (1.5) | 29 | 7 (68) | 7.4 (1.4) | 29 | 0.02 |
Handoff Providers
A total of 343 evaluations of handoff providers were completed regarding 67 unique individuals. For each domain, scores spanned the full range from unsatisfactory to superior. The highest rated domain on the handoff provider evaluation tool was professionalism (median: 8; interquartile range [IQR]: 79). The lowest rated domain was content (median: 7; IQR: 68) (Table 1).
Handoff Recipients
A total of 330 evaluations of handoff recipients were completed regarding 58 unique individuals. For each domain, scores spanned the full range from unsatisfactory to superior. The highest rated domain on the handoff provider evaluation tool was professionalism, with a median of 8 (IQR: 79). The lowest rated domain was setting, with a median score of 7 (IQR: 6‐9) (Table 1).
Validity Testing
Comparing provider scores to recipient scores, recipients received significantly higher scores for overall assessment (Table 1). Scores at UCM and Yale were similar in all domains for providers but were slightly lower at UCM in several domains for recipients (see Supporting Information, Appendix 2, in the online version of this article). Scores did not differ significantly by training level (Table 2). Third‐party external evaluators consistently gave lower marks for the same handoff than peer evaluators did (Table 3).
| Domain | Median (Range) | P Value | |||
|---|---|---|---|---|---|
| NP/PA, N=33 | Subintern or Intern, N=170 | Resident, N=44 | Hospitalist, N=95 | ||
| |||||
| Setting | 7 (29) | 7 (39) | 7 (49) | 7 (29) | 0.89 |
| Organization | 8 (49) | 7 (29) | 7 (49) | 8 (39) | 0.11 |
| Communication | 8 (49) | 7 (29) | 7 (49) | 8 (19) | 0.72 |
| Content | 7 (39) | 7 (29) | 7 (49) | 7 (29) | 0.92 |
| Judgment | 8 (59) | 7 (39) | 8 (49) | 8 (49) | 0.09 |
| Professionalism | 8 (49) | 7 (29) | 8 (39) | 8 (49) | 0.82 |
| Overall | 7 (39) | 7 (29) | 8 (49) | 7 (29) | 0.28 |
| Provider, Median (Range) | Recipient, Median (Range) | |||||||
|---|---|---|---|---|---|---|---|---|
| Domain | Peer, N=152 | Resident, Supervisor, N=43 | External, N=147 | P Value | Peer, N=145 | Resident Supervisor, N=43 | External, N=142 | P Value |
| ||||||||
| Setting | 8 (39) | 7 (39) | 7 (29) | 0.02 | 8 (29) | 7 (39) | 7 (29) | <0.001 |
| Organization | 8 (39) | 8 (39) | 7 (29) | 0.18 | 8 (39) | 8 (69) | 7 (29) | <0.001 |
| Communication | 8 (39) | 8 (39) | 7 (19) | <0.001 | 8 (39) | 8 (49) | 7 (29) | <0.001 |
| Content | 8 (39) | 8 (29) | 7 (29) | <0.001 | N/A | N/A | N/A | N/A |
| Judgment | 8 (49) | 8 (39) | 7 (39) | <0.001 | 8 (39) | 8 (49) | 7 (39) | <0.001 |
| Professionalism | 8 (39) | 8 (59) | 7 (29) | 0.02 | 8 (39) | 8 (69) | 7 (39) | <0.001 |
| Overall | 8 (39) | 8 (39) | 7 (29) | 0.001 | 8 (29) | 8 (49) | 7 (29) | <0.001 |
Spearman rank correlation coefficients among the CEX subdomains for provider scores ranged from 0.71 to 0.86, except for setting (Table 4). Setting was less well correlated with the other subdomains, with correlation coefficients ranging from 0.39 to 0.41. Correlations between individual domains and the overall rating ranged from 0.80 to 0.86, except setting, which had a correlation of 0.55. Every correlation was significant at P<0.001. Correlation coefficients for recipient scores were very similar to those for provider scores (see Supporting Information, Appendix 3, in the online version of this article).
| Spearman Correlation Coefficients | ||||||
|---|---|---|---|---|---|---|
| Setting | Organization | Communication | Content | Judgment | Professionalism | |
| ||||||
| Setting | 1.000 | 0.40 | 0.40 | 0.39 | 0.39 | 0.41 |
| Organization | 0.40 | 1.00 | 0.80 | 0.71 | 0.77 | 0.73 |
| Communication | 0.40 | 0.80 | 1.00 | 0.79 | 0.82 | 0.77 |
| Content | 0.39 | 0.71 | 0.79 | 1.00 | 0.80 | 0.74 |
| Judgment | 0.39 | 0.77 | 0.82 | 0.80 | 1.00 | 0.78 |
| Professionalism | 0.41 | 0.73 | 0.77 | 0.74 | 0.78 | 1.00 |
| Overall | 0.55 | 0.80 | 0.84 | 0.83 | 0.86 | 0.82 |
We analyzed 343 provider evaluations in the factor analysis; there were 6 missing values. The scree plot of eigenvalues did not support more than 1 factor; however, the rotated factor pattern for standardized regression coefficients for the first factor and the final communality estimates showed the setting component yielding smaller values than did other scale components (see Supporting Information, Appendix 4, in the online version of this article).
Reliability Testing
Weighted kappa scores for provider evaluations ranged from 0.28 (95% confidence interval [CI]: 0.01, 0.56) for setting to 0.59 (95% CI: 0.38, 0.80) for organization, and were generally higher for resident versus peer comparisons than for external versus peer comparisons. Weighted kappa scores for recipient evaluation were slightly lower for external versus peer evaluations, but agreement was no better than chance for resident versus peer evaluations (Table 5).
| Domain | Provider | Recipient | ||
|---|---|---|---|---|
| External vs Peer, N=144 (95% CI) | Resident vs Peer, N=42 (95% CI) | External vs Peer, N=134 (95% CI) | Resident vs Peer, N=43 (95% CI) | |
| ||||
| Setting | 0.39 (0.24, 0.54) | 0.28 (0.01, 0.56) | 0.34 (0.20, 0.48) | 0.48 (0.27, 0.69) |
| Organization | 0.43 (0.29, 0.58) | 0.59 (0.39, 0.80) | 0.39 (0.22, 0.55) | 0.03 (0.23, 0.29) |
| Communication | 0.34 (0.19, 0.49) | 0.52 (0.37, 0.68) | 0.36 (0.22, 0.51) | 0.02 (0.18, 0.23) |
| Content | 0.38 (0.25, 0.51) | 0.53 (0.27, 0.80) | N/A (N/A) | N/A (N/A) |
| Judgment | 0.36 (0.22, 0.49) | 0.54 (0.25, 0.83) | 0.28 (0.15, 0.42) | 0.12 (0.34, 0.09) |
| Professionalism | 0.47 (0.32, 0.63) | 0.47 (0.23, 0.72) | 0.35 (0.18, 0.51) | 0.01 (0.29, 0.26) |
| Overall | 0.50 (0.36, 0.64) | 0.45 (0.24, 0.67) | 0.31 (0.16, 0.48) | 0.07 (0.20, 0.34) |
DISCUSSION
In this study we found that an evaluation tool for direct observation of housestaff and hospitalists generated a range of scores and was well validated in the sense of performing similarly across 2 different institutions and among both trainees and attendings, while having high internal consistency. However, external evaluators gave consistently lower marks than peer evaluators at both sites, resulting in low reliability when comparing these 2 groups of raters.
It has traditionally been difficult to conduct direct evaluations of handoffs, because they may occur at haphazard times, in variable locations, and without very much advance notice. For this reason, several attempts have been made to incorporate peers in evaluations of handoff practices.[5, 39, 40] Using peers to conduct evaluations also has the advantage that peers are more likely to be familiar with the patients being handed off and might recognize handoff flaws that external evaluators would miss. Nonetheless, peer evaluations have some important liabilities. Peers may be unwilling or unable to provide honest critiques of their colleagues given that they must work closely together for years. Trainee peers may also lack sufficient clinical expertise or experience to accurately assess competence. In our study, we found that peers gave consistently higher marks to their colleagues than did external evaluators, suggesting they may have found it difficult to criticize their colleagues. We conclude that peer evaluation alone is likely an insufficient means of evaluating handoff quality.
Supervising residents gave very similar marks as intern peers, suggesting that they also are unwilling to criticize, are insufficiently experienced to evaluate, or alternatively, that the peer evaluations were reasonable. We suspect the latter is unlikely given that external evaluator scores were consistently lower than peers. One would expect the external evaluators to be biased toward higher scores given that they are not familiar with the patients and are not able to comment on inaccuracies or omissions in the sign‐out.
The tool appeared to perform less well in most cases for recipients than for providers, with a narrower range of scores and low‐weighted kappa scores. Although recipients play a key role in ensuring a high‐quality sign‐out by paying close attention, ensuring it is a bidirectional conversation, asking appropriate questions, and reading back key information, it may be that evaluators were unable to place these activities within the same domains that were used for the provider evaluation. An altogether different recipient evaluation approach may be necessary.[41]
In general, scores were clustered at the top of the score range, as is typical for evaluations. One strategy to spread out scores further would be to refine the tool by adding anchors for satisfactory performance not just the extremes. A second approach might be to reduce the grading scale to only 3 points (unsatisfactory, satisfactory, superior) to force more scores to the middle. However, this approach might limit the discrimination ability of the tool.
We have previously studied the use of this tool among nurses. In that study, we also found consistently higher scores by peers than by external evaluators. We did, however, find a positive effect of experience, in which more experienced nurses received higher scores on average. We did not observe a similar training effect in this study. There are several possible explanations for the lack of a training effect. It is possible that the types of handoffs assessed played a role. At UCM, some assessed handoffs were night staff to day staff, which might be lower quality than day staff to night staff handoffs, whereas at Yale, all handoffs were day to night teams. Thus, average scores at UCM (primarily hospitalists) might have been lowered by the type of handoff provided. Given that hospitalist evaluations were conducted exclusively at UCM and housestaff evaluations exclusively at Yale, lack of difference between hospitalists and housestaff may also have been related to differences in evaluation practice or handoff practice at the 2 sites, not necessarily related to training level. Third, in our experience, attending physicians provide briefer less‐comprehensive sign‐outs than trainees, particularly when communicating with equally experienced attendings; these sign‐outs may appropriately be scored lower on the tool. Fourth, the great majority of the hospitalists at UCM were within 5 years of residency and therefore not very much more experienced than the trainees. Finally, it is possible that skills do not improve over time given widespread lack of observation and feedback during training years for this important skill.
The high internal consistency of most of the subdomains and the loading of all subdomains except setting onto 1 factor are evidence of convergent construct validity, but also suggest that evaluators have difficulty distinguishing among components of sign‐out quality. Internal consistency may also reflect a halo effect, in which scores on different domains are all influenced by a common overall judgment.[42] We are currently testing a shorter version of the tool including domains only for content, professionalism, and setting in addition to overall score. The fact that setting did not correlate as well with the other domains suggests that sign‐out practitioners may not have or exercise control over their surroundings. Consequently, it may ultimately be reasonable to drop this domain from the tool, or alternatively, to refocus on the need to ensure a quiet setting during sign‐out skills training.
There are several limitations to this study. External evaluations were conducted by personnel who were not familiar with the patients, and they may therefore have overestimated the quality of sign‐out. Studying different types of physicians at different sites might have limited our ability to identify differences by training level. As is commonly seen in evaluation studies, scores were skewed to the high end, although we did observe some use of the full range of the tool. Finally, we were limited in our ability to test inter‐rater reliability because of the multiple sources of variability in the data (numerous different raters, with different backgrounds at different settings, rating different individuals).
In summary, we developed a handoff evaluation tool that was easily completed by housestaff and attendings without training, that performed similarly in a variety of different settings at 2 institutions, and that can in principle be used either for peer evaluations or for external evaluations, although peer evaluations may be positively biased. Further work will be done to refine and simplify the tool.
ACKNOWLEDGMENTS
Disclosures: Development and evaluation of the sign‐out CEX was supported by a grant from the Agency for Healthcare Research and Quality (1R03HS018278‐01). Dr. Arora is supported by a National Institute on Aging (K23 AG033763). Dr. Horwitz is supported by the National Institute on Aging (K08 AG038336) and by the American Federation for Aging Research through the Paul B. Beeson Career Development Award Program. Dr. Horwitz is also a Pepper Scholar with support from the Claude D. Pepper Older Americans Independence Center at Yale University School of Medicine (P30AG021342 NIH/NIA). No funding source had any role in the study design; in the collection, analysis, and interpretation of data; in the writing of the report; or in the decision to submit the article for publication. The content is solely the responsibility of the authors and does not necessarily represent the official views of the Agency for Healthcare Research and Quality, the National Institute on Aging, the National Institutes of Health, or the American Federation for Aging Research. Dr. Horwitz had full access to all of the data in the study and takes responsibility for the integrity of the data and the accuracy of the data analysis. An earlier version of this work was presented as a poster presentation at the Society of General Internal Medicine Annual Meeting in Orlando, Florida on May 9, 2012. Dr. Rand is now with the Department of Medicine, University of Vermont College of Medicine, Burlington, Vermont. Mr. Staisiunas is now with the Law School, Marquette University, Milwaukee, Wisconsin. The authors declare they have no conflicts of interest.
Appendix
A
PROVIDER HAND‐OFF CEX TOOL
RECIPIENT HAND‐OFF CEX TOOL
Appendix
B
Handoff CEX scores by site of evaluation
| Domain | Provider | Recipient | ||||
| Median (Range) | P‐value | Median (Range) | P‐value | |||
| UC | Yale | UC | Yale | |||
| N=172 | N=170 | N=163 | N=167 | |||
| Setting | 7 (29) | 7 (39) | 0.32 | 7 (29) | 7 (39) | 0.36 |
| Organization | 8 (29) | 7 (39) | 0.30 | 7 (29) | 8 (59) | 0.001 |
| Communication | 7 (19) | 7 (39) | 0.67 | 7 (29) | 8 (49) | 0.03 |
| Content | 7 (29) | 7 (29) | N/A | N/A | N/A | |
| Judgment | 8 (39) | 7 (39) | 0.60 | 7 (39) | 8 (49) | 0.001 |
| Professionalism | 8 (29) | 8 (39) | 0.67 | 8 (39) | 8 (49) | 0.35 |
| Overall | 7 (29) | 7 (39) | 0.41 | 7 (29) | 8 (49) | 0.005 |
Appendix
C
Spearman correlation, recipients (N=330)
| SpearmanCorrelationCoefficients | |||||
| Setting | Organization | Communication | Judgment | Professionalism | |
| Setting | 1.0 | 0.46 | 0.48 | 0.47 | 0.40 |
| Organization | 0.46 | 1.00 | 0.78 | 0.75 | 0.75 |
| Communication | 0.48 | 0.78 | 1.00 | 0.85 | 0.77 |
| Judgment | 0.47 | 0.75 | 0.85 | 1.00 | 0.74 |
| Professionalism | 0.40 | 0.75 | 0.77 | 0.74 | 1.00 |
| Overall | 0.60 | 0.77 | 0.84 | 0.82 | 0.77 |
All p values <0.0001
Appendix
D
Factor analysis results for provider evaluations
| Rotated Factor Pattern (Standardized Regression Coefficients) N=336 | ||
| Factor1 | Factor2 | |
| Organization | 0.64 | 0.27 |
| Communication | 0.79 | 0.16 |
| Content | 0.82 | 0.06 |
| Judgment | 0.86 | 0.06 |
| Professionalism | 0.66 | 0.23 |
| Setting | 0.18 | 0.29 |
- , , , . Transfers of patient care between house staff on internal medicine wards: a national survey. Arch Intern Med. 2006;166(11):1173–1177.
- Accreditation Council for Graduate Medical Education. Common program requirements. 2011; http://www.acgme‐2010standards.org/pdf/Common_Program_Requirements_07012011.pdf. Accessed August 23, 2011.
- , , , , . Does housestaff discontinuity of care increase the risk for preventable adverse events? Ann Intern Med. 1994;121(11):866–872.
- , , . Communication failures: an insidious contributor to medical mishaps. Acad Med. 2004;79(2):186–194.
- , , , , . Communication failures in patient sign‐out and suggestions for improvement: a critical incident analysis. Qual Saf Health Care. 2005;14(6):401–407.
- , , , , . Consequences of inadequate sign‐out for patient care. Arch Intern Med. 2008;168(16):1755–1760.
- , , , . Adequacy of information transferred at resident sign‐out (in‐hospital handover of care): a prospective survey. Qual Saf Health Care. 2008;17(1):6–10.
- , , , , . What are covering doctors told about their patients? Analysis of sign‐out among internal medicine house staff. Qual Saf Health Care. 2009;18(4):248–255.
- , . Using direct observation, formal evaluation, and an interactive curriculum to improve the sign‐out practices of internal medicine interns. Acad Med. 2010;85(7):1182–1188.
- , , , . Doctors' handovers in hospitals: a literature review. Qual Saf Health Care. 2011;20(2):128–133.
- , , , et al. Resident sign‐out and patient hand‐offs: opportunities for improvement. Teach Learn Med. 2011;23(2):105–111.
- , , , et al. Use of an appreciative inquiry approach to improve resident sign‐out in an era of multiple shift changes. J Gen Intern Med. 2012;27(3):287–291.
- , , , , , . Validation of a handoff assessment tool: the Handoff CEX [published online ahead of print June 7, 2012]. J Clin Nurs. doi: 10.1111/j.1365–2702.2012.04131.x.
- , , , . The mini‐CEX (clinical evaluation exercise): a preliminary investigation. Ann Intern Med. 1995;123(10):795–799.
- , , , . Examiner differences in the mini‐CEX. Adv Health Sci Educ Theory Pract. 1997;2(1):27–33.
- , , , . Assessing the reliability and validity of the mini‐clinical evaluation exercise for internal medicine residency training. Acad Med. 2002;77(9):900–904.
- , , , , . Construct validity of the miniclinical evaluation exercise (miniCEX). Acad Med. 2003;78(8):826–830.
- , , , , , . Dropping the baton: a qualitative analysis of failures during the transition from emergency department to inpatient care. Ann Emerg Med. 2009;53(6):701–710.e4.
- , , . Development and implementation of an oral sign‐out skills curriculum. J Gen Intern Med. 2007;22(10):1470–1474.
- , , , . Mixed methods evaluation of oral sign‐out practices. J Gen Intern Med. 2007;22(S1):S114.
- , , , et al. Evaluation of an asynchronous physician voicemail sign‐out for emergency department admissions. Ann Emerg Med. 2009;54(3):368–378.
- , , , et al. An institution‐wide handoff task force to standardise and improve physician handoffs. BMJ Qual Saf. 2012;21(10):863–871.
- , . A model for building a standardized hand‐off protocol. Jt Comm J Qual Patient Saf. 2006;32(11):646–655.
- , , , , . Medication discrepancies in resident sign‐outs and their potential to harm. J Gen Intern Med. 2007;22(12):1751–1755.
- , , , . A theoretical framework and competency‐based approach to improving handoffs. Qual Saf Health Care. 2008;17(1):11–14.
- , , , , , . Hospitalist handoffs: a systematic review and task force recommendations. J Hosp Med. 2009;4(7):433–440.
- , , , , . Interns overestimate the effectiveness of their hand‐off communication. Pediatrics. 2010;125(3):491–496.
- , . Improving clinical handovers: creating local solutions for a global problem. Qual Saf Health Care. 2009;18(4):244–245.
- , , , , . Managing discontinuity in academic medical centers: strategies for a safe and effective resident sign‐out. J Hosp Med. 2006;1(4):257–266.
- , , . Standardized sign‐out reduces intern perception of medical errors on the general internal medicine ward. Teach Learn Med. 2009;21(2):121–126.
- , , . SBAR: a shared mental model for improving communication between clinicians. Jt Comm J Qual Patient Saf. 2006;32(3):167–175.
- . Structuring flexibility: the potential good, bad and ugly in standardisation of handovers. Qual Saf Health Care. 2008;17(1):4–5.
- , , , , . Handoff strategies in settings with high consequences for failure: lessons for health care operations. Int J Qual Health Care. 2004;16(2):125–132.
- , , , , , . Residents' perceptions of professionalism in training and practice: barriers, promoters, and duty hour requirements. J Gen Intern Med. 2006;21(7):758–763.
- , . Communication behaviours in a hospital setting: an observational study. BMJ. 1998;316(7132):673–676.
- , , , , . Communication loads on clinical staff in the emergency department. Med J Aust. 2002;176(9):415–418.
- , . A systematic review of failures in handoff communication during intrahospital transfers. Jt Comm J Qual Patient Saf. 2011;37(6):274–284.
- , , , et al. Hand‐off education and evaluation: piloting the observed simulated hand‐off experience (OSHE). J Gen Intern Med. 2010;25(2):129–134.
- , , , et al. Handoffs causing patient harm: a survey of medical and surgical house staff. Jt Comm J Qual Patient Saf. 2008;34(10):563–570.
- , , . A prospective observational study of physician handoff for intensive‐care‐unit‐to‐ward patient transfers. Am J Med. 2011;124(9):860–867.
- , , , , . Characterizing physician listening behavior during hospitalist handoffs using the HEAR checklist (published online ahead of print December 20, 2012]. BMJ Qual Saf. doi:10.1136/bmjqs‐2012‐001138.
- . A constant error in psychological ratings. J Appl Psychol. 1920;4(1):25.
Transfers among trainee physicians within the hospital typically occur at least twice a day and have been increasing among trainees as work hours have declined.[1] The 2011 Accreditation Council for Graduate Medical Education (ACGME) guidelines,[2] which restrict intern working hours to 16 hours from a previous maximum of 30, have likely increased the frequency of physician trainee handoffs even further. Similarly, transfers among hospitalist attendings occur at least twice a day, given typical shifts of 8 to 12 hours.
Given the frequency of transfers, and the potential for harm generated by failed transitions,[3, 4, 5, 6] the end‐of‐shift written and verbal handoffs have assumed increasingly greater importance in hospital care among both trainees and hospitalist attendings.
The ACGME now requires that programs assess the competency of trainees in handoff communication.[2] Yet, there are few tools for assessing the quality of sign‐out communication. Those that exist primarily focus on the written sign‐out, and are rarely validated.[7, 8, 9, 10, 11, 12] Furthermore, it is uncertain whether such assessments must be done by supervisors or whether peers can participate in the evaluation. In this prospective multi‐institutional study we assess the performance characteristics of a verbal sign‐out evaluation tool for internal medicine housestaff and hospitalist attendings, and examine whether it can be used by peers as well as by external evaluators. This tool has previously been found to effectively discriminate between experienced and inexperienced nurses conducting nursing handoffs.[13]
METHODS
Tool Design and Measures
The Handoff CEX (clinical evaluation exercise) is a structured assessment based on the format of the mini‐CEX, an instrument used to assess the quality of history and physical examination by trainees for which validation studies have previously been conducted.[14, 15, 16, 17] We developed the tool based on themes we identified from our own expertise,[1, 5, 6, 8, 18, 19, 20, 21, 22, 23, 24, 25, 26, 27, 28, 29] the ACGME core competencies for trainees,[2] and the literature to maximize content validity. First, standardization has numerous demonstrable benefits for safety in general and handoffs in particular.[30, 31, 32] Consequently we created a domain for organization in which standardization was a characteristic of high performance.
Second, there is evidence that people engaged in conversation routinely overestimate peer comprehension,[27] and that explicit strategies to combat this overestimation, such as confirming understanding, explicitly assigning tasks rather than using open‐ended language, and using concrete language, are effective.[33] Accordingly we created a domain for communication skills, which is also an ACGME competency.
Third, although there were no formal guidelines for sign‐out content when we developed this tool, our own research had demonstrated that the content elements most often missing and felt to be important by stakeholders were related to clinical condition and explicating thinking processes,[5, 6] so we created a domain for content that highlighted these areas and met the ACGME competency of medical knowledge. In accordance with standards for evaluation of learners, we incorporated a domain for judgment to identify where trainees were in the RIME spectrum of reporter, interpreter, master, and educator.
Next, we added a section for professionalism in accordance with the ACGME core competencies of professionalism and patient care.[34] To avoid the disinclination of peers to label each other unprofessional, we labeled the professionalism domain as patient‐focused on the tool.
Finally, we included a domain for setting because of an extensive literature demonstrating increased handoff failures in noisy or interruptive settings.[35, 36, 37] We then revised the tool slightly based on our experiences among nurses and students.[13, 38] The final tool included the 6 domains described above and an assessment of overall competency. Each domain was scored on a 9‐point scale and included descriptive anchors at high and low ends of performance. We further divided the scale into 3 main sections: unsatisfactory (score 13), satisfactory (46), and superior (79). We designed 2 tools, 1 to assess the person providing the handoff and 1 to assess the handoff recipient, each with its own descriptive anchors. The recipient tool did not include a content domain (see Supporting Information, Appendix 1, in the online version of this article).
Setting and Subjects
We tested the tool in 2 different urban academic medical centers: the University of Chicago Medicine (UCM) and Yale‐New Haven Hospital (Yale). At UCM, we tested the tool among hospitalists, nurse practitioners, and physician assistants during the Monday and Tuesday morning and Friday evening sign‐out sessions. At Yale, we tested the tool among housestaff during the evening sign‐out session from the primary team to the on‐call covering team.
The UCM is a 550‐bed urban academic medical center in which the nonteaching hospitalist service cares for patients with liver disease, or end‐stage renal or lung disease awaiting transplant, and a small fraction of general medicine and oncology patients when the housestaff service exceeds its cap. No formal training on sign‐out is provided to attending or midlevel providers. The nonteaching hospitalist service operates as a separate service from the housestaff service and consists of 38 hospitalist clinicians (hospitalist attendings, nurse practitioners, and physicians assistants). There are 2 handoffs each day. In the morning the departing night hospitalist hands off to the incoming daytime hospitalist or midlevel provider. These handoffs occur at 7:30 am in a dedicated room. In the evening the daytime hospitalist or midlevel provider hands off to an incoming night hospitalist. This handoff occurs at 5:30 pm or 7:30 pm in a dedicated location. The written sign‐out is maintained on a Microsoft Word (Microsoft Corp., Redmond, WA) document on a password‐protected server and updated daily.
Yale is a 946‐bed urban academic medical center with a large internal medicine training program. Formal sign‐out education that covers the main domains of the tool is provided to new interns during the first 3 months of the year,[19] and a templated electronic medical record‐based electronic written handoff report is produced by the housestaff for all patients.[22] Approximately half of inpatient medicine patients are cared for by housestaff teams, which are entirely separate from the hospitalist service. Housestaff sign‐out occurs between 4 pm and 7 pm every night. At a minimum, the departing intern signs out to the incoming intern; this handoff is typically supervised by at least 1 second‐ or third‐year resident. All patients are signed out verbally; in addition, the written handoff report is provided to the incoming team. Most handoffs occur in a quiet charting room.
Data Collection
Data collection at UCM occurred between March and December 2010 on 3 days of each week: Mondays, Tuesdays, and Fridays. On Mondays and Tuesdays the morning handoffs were observed; on Fridays the evening handoffs were observed. Data collection at Yale occurred between March and May 2011. Only evening handoffs from the primary team to the overnight coverage were observed. At both sites, participants provided verbal informed consent prior to data collection. At the time of an eligible sign‐out session, a research assistant (D.R. at Yale, P.S. at UCM) provided the evaluation tools to all members of the incoming and outgoing teams, and observed the sign‐out session himself. Each person providing a handoff was asked to evaluate the recipient of the handoff; each person receiving a handoff was asked to evaluate the provider of the handoff. In addition, the trained third‐party observer (D.R., P.S.) evaluated both the provider and recipient of the handoff. The external evaluators were trained in principles of effective communication and the use of the tool, with specific review of anchors at each end of each domain. One evaluator had a DO degree and was completing an MPH degree. The second evaluator was an experienced clinical research assistant whose training consisted of supervised observation of 10 handoffs by a physician investigator. At Yale, if a resident was present, she or he was also asked to evaluate both the provider and recipient of the handoff. Consequently, every sign‐out session included at least 2 evaluations of each participant, 1 by a peer evaluator and 1 by a consistent external evaluator who did not know the patients. At Yale, many sign‐outs also included a third evaluation by a resident supervisor.
The study was approved by the institutional review boards at both UCM and Yale.
Statistical Analysis
We obtained mean, median, and interquartile range of scores for each subdomain of the tool as well as the overall assessment of handoff quality. We assessed convergent construct validity by assessing performance of the tool in different contexts. To do so, we determined whether scores differed by type of participant (provider or recipient), by site, by training level of evaluatee, or by type of evaluator (external, resident supervisor, or peer) by using Wilcoxon rank sum tests and Kruskal‐Wallis tests. For the assessment of differences in ratings by training level, we used evaluations of sign‐out providers only, because the 2 sites differed in scores for recipients. We also assessed construct validity by using Spearman rank correlation coefficients to describe the internal consistency of the tool in terms of the correlation between domains of the tool, and we conducted an exploratory factor analysis to gain insight into whether the subdomains of the tool were measuring the same construct. In conducting this analysis, we restricted the dataset to evaluations of sign‐out providers only, and used a principal components estimation method, a promax rotation, and squared multiple correlation communality priors. Finally, we conducted some preliminary studies of reliability by testing whether different types of evaluators provided similar assessments. We calculated a weighted kappa using Fleiss‐Cohen weights for external versus peer scores and again for supervising resident versus peer scores (Yale only). We were not able to assess test‐retest reliability by nature of the sign‐out process. Statistical significance was defined by a P value 0.05, and analyses were performed using SAS 9.2 (SAS Institute, Cary, NC).
RESULTS
A total of 149 handoff sessions were observed: 89 at UCM and 60 at Yale. Each site conducted a similar total number of evaluations: 336 at UCM, 337 at Yale. These sessions involved 97 unique individuals, 34 at UCM and 63 at Yale. Overall scores were high at both sites, but a wide range of scores was applied (Table 1).
| Domain | Provider, N=343 | Recipient, N=330 | P Value | ||||
|---|---|---|---|---|---|---|---|
| Median (IQR) | Mean (SD) | Range | Median (IQR) | Mean (SD) | Range | ||
| |||||||
| Setting | 7 (69) | 7.0 (1.7) | 29 | 7 (69) | 7.3 (1.6) | 29 | 0.05 |
| Organization | 7 (68) | 7.2 (1.5) | 29 | 8 (69) | 7.4 (1.4) | 29 | 0.07 |
| Communication | 7 (69) | 7.2 (1.6) | 19 | 8 (79) | 7.4 (1.5) | 29 | 0.22 |
| Content | 7 (68) | 7.0 (1.6) | 29 | ||||
| Judgment | 8 (68) | 7.3 (1.4) | 39 | 8 (79) | 7.5 (1.4) | 39 | 0.06 |
| Professionalism | 8 (79) | 7.4 (1.5) | 29 | 8 (79) | 7.6 (1.4) | 39 | 0.23 |
| Overall | 7 (68) | 7.1 (1.5) | 29 | 7 (68) | 7.4 (1.4) | 29 | 0.02 |
Handoff Providers
A total of 343 evaluations of handoff providers were completed regarding 67 unique individuals. For each domain, scores spanned the full range from unsatisfactory to superior. The highest rated domain on the handoff provider evaluation tool was professionalism (median: 8; interquartile range [IQR]: 79). The lowest rated domain was content (median: 7; IQR: 68) (Table 1).
Handoff Recipients
A total of 330 evaluations of handoff recipients were completed regarding 58 unique individuals. For each domain, scores spanned the full range from unsatisfactory to superior. The highest rated domain on the handoff provider evaluation tool was professionalism, with a median of 8 (IQR: 79). The lowest rated domain was setting, with a median score of 7 (IQR: 6‐9) (Table 1).
Validity Testing
Comparing provider scores to recipient scores, recipients received significantly higher scores for overall assessment (Table 1). Scores at UCM and Yale were similar in all domains for providers but were slightly lower at UCM in several domains for recipients (see Supporting Information, Appendix 2, in the online version of this article). Scores did not differ significantly by training level (Table 2). Third‐party external evaluators consistently gave lower marks for the same handoff than peer evaluators did (Table 3).
| Domain | Median (Range) | P Value | |||
|---|---|---|---|---|---|
| NP/PA, N=33 | Subintern or Intern, N=170 | Resident, N=44 | Hospitalist, N=95 | ||
| |||||
| Setting | 7 (29) | 7 (39) | 7 (49) | 7 (29) | 0.89 |
| Organization | 8 (49) | 7 (29) | 7 (49) | 8 (39) | 0.11 |
| Communication | 8 (49) | 7 (29) | 7 (49) | 8 (19) | 0.72 |
| Content | 7 (39) | 7 (29) | 7 (49) | 7 (29) | 0.92 |
| Judgment | 8 (59) | 7 (39) | 8 (49) | 8 (49) | 0.09 |
| Professionalism | 8 (49) | 7 (29) | 8 (39) | 8 (49) | 0.82 |
| Overall | 7 (39) | 7 (29) | 8 (49) | 7 (29) | 0.28 |
| Provider, Median (Range) | Recipient, Median (Range) | |||||||
|---|---|---|---|---|---|---|---|---|
| Domain | Peer, N=152 | Resident, Supervisor, N=43 | External, N=147 | P Value | Peer, N=145 | Resident Supervisor, N=43 | External, N=142 | P Value |
| ||||||||
| Setting | 8 (39) | 7 (39) | 7 (29) | 0.02 | 8 (29) | 7 (39) | 7 (29) | <0.001 |
| Organization | 8 (39) | 8 (39) | 7 (29) | 0.18 | 8 (39) | 8 (69) | 7 (29) | <0.001 |
| Communication | 8 (39) | 8 (39) | 7 (19) | <0.001 | 8 (39) | 8 (49) | 7 (29) | <0.001 |
| Content | 8 (39) | 8 (29) | 7 (29) | <0.001 | N/A | N/A | N/A | N/A |
| Judgment | 8 (49) | 8 (39) | 7 (39) | <0.001 | 8 (39) | 8 (49) | 7 (39) | <0.001 |
| Professionalism | 8 (39) | 8 (59) | 7 (29) | 0.02 | 8 (39) | 8 (69) | 7 (39) | <0.001 |
| Overall | 8 (39) | 8 (39) | 7 (29) | 0.001 | 8 (29) | 8 (49) | 7 (29) | <0.001 |
Spearman rank correlation coefficients among the CEX subdomains for provider scores ranged from 0.71 to 0.86, except for setting (Table 4). Setting was less well correlated with the other subdomains, with correlation coefficients ranging from 0.39 to 0.41. Correlations between individual domains and the overall rating ranged from 0.80 to 0.86, except setting, which had a correlation of 0.55. Every correlation was significant at P<0.001. Correlation coefficients for recipient scores were very similar to those for provider scores (see Supporting Information, Appendix 3, in the online version of this article).
| Spearman Correlation Coefficients | ||||||
|---|---|---|---|---|---|---|
| Setting | Organization | Communication | Content | Judgment | Professionalism | |
| ||||||
| Setting | 1.000 | 0.40 | 0.40 | 0.39 | 0.39 | 0.41 |
| Organization | 0.40 | 1.00 | 0.80 | 0.71 | 0.77 | 0.73 |
| Communication | 0.40 | 0.80 | 1.00 | 0.79 | 0.82 | 0.77 |
| Content | 0.39 | 0.71 | 0.79 | 1.00 | 0.80 | 0.74 |
| Judgment | 0.39 | 0.77 | 0.82 | 0.80 | 1.00 | 0.78 |
| Professionalism | 0.41 | 0.73 | 0.77 | 0.74 | 0.78 | 1.00 |
| Overall | 0.55 | 0.80 | 0.84 | 0.83 | 0.86 | 0.82 |
We analyzed 343 provider evaluations in the factor analysis; there were 6 missing values. The scree plot of eigenvalues did not support more than 1 factor; however, the rotated factor pattern for standardized regression coefficients for the first factor and the final communality estimates showed the setting component yielding smaller values than did other scale components (see Supporting Information, Appendix 4, in the online version of this article).
Reliability Testing
Weighted kappa scores for provider evaluations ranged from 0.28 (95% confidence interval [CI]: 0.01, 0.56) for setting to 0.59 (95% CI: 0.38, 0.80) for organization, and were generally higher for resident versus peer comparisons than for external versus peer comparisons. Weighted kappa scores for recipient evaluation were slightly lower for external versus peer evaluations, but agreement was no better than chance for resident versus peer evaluations (Table 5).
| Domain | Provider | Recipient | ||
|---|---|---|---|---|
| External vs Peer, N=144 (95% CI) | Resident vs Peer, N=42 (95% CI) | External vs Peer, N=134 (95% CI) | Resident vs Peer, N=43 (95% CI) | |
| ||||
| Setting | 0.39 (0.24, 0.54) | 0.28 (0.01, 0.56) | 0.34 (0.20, 0.48) | 0.48 (0.27, 0.69) |
| Organization | 0.43 (0.29, 0.58) | 0.59 (0.39, 0.80) | 0.39 (0.22, 0.55) | 0.03 (0.23, 0.29) |
| Communication | 0.34 (0.19, 0.49) | 0.52 (0.37, 0.68) | 0.36 (0.22, 0.51) | 0.02 (0.18, 0.23) |
| Content | 0.38 (0.25, 0.51) | 0.53 (0.27, 0.80) | N/A (N/A) | N/A (N/A) |
| Judgment | 0.36 (0.22, 0.49) | 0.54 (0.25, 0.83) | 0.28 (0.15, 0.42) | 0.12 (0.34, 0.09) |
| Professionalism | 0.47 (0.32, 0.63) | 0.47 (0.23, 0.72) | 0.35 (0.18, 0.51) | 0.01 (0.29, 0.26) |
| Overall | 0.50 (0.36, 0.64) | 0.45 (0.24, 0.67) | 0.31 (0.16, 0.48) | 0.07 (0.20, 0.34) |
DISCUSSION
In this study we found that an evaluation tool for direct observation of housestaff and hospitalists generated a range of scores and was well validated in the sense of performing similarly across 2 different institutions and among both trainees and attendings, while having high internal consistency. However, external evaluators gave consistently lower marks than peer evaluators at both sites, resulting in low reliability when comparing these 2 groups of raters.
It has traditionally been difficult to conduct direct evaluations of handoffs, because they may occur at haphazard times, in variable locations, and without very much advance notice. For this reason, several attempts have been made to incorporate peers in evaluations of handoff practices.[5, 39, 40] Using peers to conduct evaluations also has the advantage that peers are more likely to be familiar with the patients being handed off and might recognize handoff flaws that external evaluators would miss. Nonetheless, peer evaluations have some important liabilities. Peers may be unwilling or unable to provide honest critiques of their colleagues given that they must work closely together for years. Trainee peers may also lack sufficient clinical expertise or experience to accurately assess competence. In our study, we found that peers gave consistently higher marks to their colleagues than did external evaluators, suggesting they may have found it difficult to criticize their colleagues. We conclude that peer evaluation alone is likely an insufficient means of evaluating handoff quality.
Supervising residents gave very similar marks as intern peers, suggesting that they also are unwilling to criticize, are insufficiently experienced to evaluate, or alternatively, that the peer evaluations were reasonable. We suspect the latter is unlikely given that external evaluator scores were consistently lower than peers. One would expect the external evaluators to be biased toward higher scores given that they are not familiar with the patients and are not able to comment on inaccuracies or omissions in the sign‐out.
The tool appeared to perform less well in most cases for recipients than for providers, with a narrower range of scores and low‐weighted kappa scores. Although recipients play a key role in ensuring a high‐quality sign‐out by paying close attention, ensuring it is a bidirectional conversation, asking appropriate questions, and reading back key information, it may be that evaluators were unable to place these activities within the same domains that were used for the provider evaluation. An altogether different recipient evaluation approach may be necessary.[41]
In general, scores were clustered at the top of the score range, as is typical for evaluations. One strategy to spread out scores further would be to refine the tool by adding anchors for satisfactory performance not just the extremes. A second approach might be to reduce the grading scale to only 3 points (unsatisfactory, satisfactory, superior) to force more scores to the middle. However, this approach might limit the discrimination ability of the tool.
We have previously studied the use of this tool among nurses. In that study, we also found consistently higher scores by peers than by external evaluators. We did, however, find a positive effect of experience, in which more experienced nurses received higher scores on average. We did not observe a similar training effect in this study. There are several possible explanations for the lack of a training effect. It is possible that the types of handoffs assessed played a role. At UCM, some assessed handoffs were night staff to day staff, which might be lower quality than day staff to night staff handoffs, whereas at Yale, all handoffs were day to night teams. Thus, average scores at UCM (primarily hospitalists) might have been lowered by the type of handoff provided. Given that hospitalist evaluations were conducted exclusively at UCM and housestaff evaluations exclusively at Yale, lack of difference between hospitalists and housestaff may also have been related to differences in evaluation practice or handoff practice at the 2 sites, not necessarily related to training level. Third, in our experience, attending physicians provide briefer less‐comprehensive sign‐outs than trainees, particularly when communicating with equally experienced attendings; these sign‐outs may appropriately be scored lower on the tool. Fourth, the great majority of the hospitalists at UCM were within 5 years of residency and therefore not very much more experienced than the trainees. Finally, it is possible that skills do not improve over time given widespread lack of observation and feedback during training years for this important skill.
The high internal consistency of most of the subdomains and the loading of all subdomains except setting onto 1 factor are evidence of convergent construct validity, but also suggest that evaluators have difficulty distinguishing among components of sign‐out quality. Internal consistency may also reflect a halo effect, in which scores on different domains are all influenced by a common overall judgment.[42] We are currently testing a shorter version of the tool including domains only for content, professionalism, and setting in addition to overall score. The fact that setting did not correlate as well with the other domains suggests that sign‐out practitioners may not have or exercise control over their surroundings. Consequently, it may ultimately be reasonable to drop this domain from the tool, or alternatively, to refocus on the need to ensure a quiet setting during sign‐out skills training.
There are several limitations to this study. External evaluations were conducted by personnel who were not familiar with the patients, and they may therefore have overestimated the quality of sign‐out. Studying different types of physicians at different sites might have limited our ability to identify differences by training level. As is commonly seen in evaluation studies, scores were skewed to the high end, although we did observe some use of the full range of the tool. Finally, we were limited in our ability to test inter‐rater reliability because of the multiple sources of variability in the data (numerous different raters, with different backgrounds at different settings, rating different individuals).
In summary, we developed a handoff evaluation tool that was easily completed by housestaff and attendings without training, that performed similarly in a variety of different settings at 2 institutions, and that can in principle be used either for peer evaluations or for external evaluations, although peer evaluations may be positively biased. Further work will be done to refine and simplify the tool.
ACKNOWLEDGMENTS
Disclosures: Development and evaluation of the sign‐out CEX was supported by a grant from the Agency for Healthcare Research and Quality (1R03HS018278‐01). Dr. Arora is supported by a National Institute on Aging (K23 AG033763). Dr. Horwitz is supported by the National Institute on Aging (K08 AG038336) and by the American Federation for Aging Research through the Paul B. Beeson Career Development Award Program. Dr. Horwitz is also a Pepper Scholar with support from the Claude D. Pepper Older Americans Independence Center at Yale University School of Medicine (P30AG021342 NIH/NIA). No funding source had any role in the study design; in the collection, analysis, and interpretation of data; in the writing of the report; or in the decision to submit the article for publication. The content is solely the responsibility of the authors and does not necessarily represent the official views of the Agency for Healthcare Research and Quality, the National Institute on Aging, the National Institutes of Health, or the American Federation for Aging Research. Dr. Horwitz had full access to all of the data in the study and takes responsibility for the integrity of the data and the accuracy of the data analysis. An earlier version of this work was presented as a poster presentation at the Society of General Internal Medicine Annual Meeting in Orlando, Florida on May 9, 2012. Dr. Rand is now with the Department of Medicine, University of Vermont College of Medicine, Burlington, Vermont. Mr. Staisiunas is now with the Law School, Marquette University, Milwaukee, Wisconsin. The authors declare they have no conflicts of interest.
Appendix
A
PROVIDER HAND‐OFF CEX TOOL
RECIPIENT HAND‐OFF CEX TOOL
Appendix
B
Handoff CEX scores by site of evaluation
| Domain | Provider | Recipient | ||||
| Median (Range) | P‐value | Median (Range) | P‐value | |||
| UC | Yale | UC | Yale | |||
| N=172 | N=170 | N=163 | N=167 | |||
| Setting | 7 (29) | 7 (39) | 0.32 | 7 (29) | 7 (39) | 0.36 |
| Organization | 8 (29) | 7 (39) | 0.30 | 7 (29) | 8 (59) | 0.001 |
| Communication | 7 (19) | 7 (39) | 0.67 | 7 (29) | 8 (49) | 0.03 |
| Content | 7 (29) | 7 (29) | N/A | N/A | N/A | |
| Judgment | 8 (39) | 7 (39) | 0.60 | 7 (39) | 8 (49) | 0.001 |
| Professionalism | 8 (29) | 8 (39) | 0.67 | 8 (39) | 8 (49) | 0.35 |
| Overall | 7 (29) | 7 (39) | 0.41 | 7 (29) | 8 (49) | 0.005 |
Appendix
C
Spearman correlation, recipients (N=330)
| SpearmanCorrelationCoefficients | |||||
| Setting | Organization | Communication | Judgment | Professionalism | |
| Setting | 1.0 | 0.46 | 0.48 | 0.47 | 0.40 |
| Organization | 0.46 | 1.00 | 0.78 | 0.75 | 0.75 |
| Communication | 0.48 | 0.78 | 1.00 | 0.85 | 0.77 |
| Judgment | 0.47 | 0.75 | 0.85 | 1.00 | 0.74 |
| Professionalism | 0.40 | 0.75 | 0.77 | 0.74 | 1.00 |
| Overall | 0.60 | 0.77 | 0.84 | 0.82 | 0.77 |
All p values <0.0001
Appendix
D
Factor analysis results for provider evaluations
| Rotated Factor Pattern (Standardized Regression Coefficients) N=336 | ||
| Factor1 | Factor2 | |
| Organization | 0.64 | 0.27 |
| Communication | 0.79 | 0.16 |
| Content | 0.82 | 0.06 |
| Judgment | 0.86 | 0.06 |
| Professionalism | 0.66 | 0.23 |
| Setting | 0.18 | 0.29 |
- , , , . Transfers of patient care between house staff on internal medicine wards: a national survey. Arch Intern Med. 2006;166(11):1173–1177.
- Accreditation Council for Graduate Medical Education. Common program requirements. 2011; http://www.acgme‐2010standards.org/pdf/Common_Program_Requirements_07012011.pdf. Accessed August 23, 2011.
- , , , , . Does housestaff discontinuity of care increase the risk for preventable adverse events? Ann Intern Med. 1994;121(11):866–872.
- , , . Communication failures: an insidious contributor to medical mishaps. Acad Med. 2004;79(2):186–194.
- , , , , . Communication failures in patient sign‐out and suggestions for improvement: a critical incident analysis. Qual Saf Health Care. 2005;14(6):401–407.
- , , , , . Consequences of inadequate sign‐out for patient care. Arch Intern Med. 2008;168(16):1755–1760.
- , , , . Adequacy of information transferred at resident sign‐out (in‐hospital handover of care): a prospective survey. Qual Saf Health Care. 2008;17(1):6–10.
- , , , , . What are covering doctors told about their patients? Analysis of sign‐out among internal medicine house staff. Qual Saf Health Care. 2009;18(4):248–255.
- , . Using direct observation, formal evaluation, and an interactive curriculum to improve the sign‐out practices of internal medicine interns. Acad Med. 2010;85(7):1182–1188.
- , , , . Doctors' handovers in hospitals: a literature review. Qual Saf Health Care. 2011;20(2):128–133.
- , , , et al. Resident sign‐out and patient hand‐offs: opportunities for improvement. Teach Learn Med. 2011;23(2):105–111.
- , , , et al. Use of an appreciative inquiry approach to improve resident sign‐out in an era of multiple shift changes. J Gen Intern Med. 2012;27(3):287–291.
- , , , , , . Validation of a handoff assessment tool: the Handoff CEX [published online ahead of print June 7, 2012]. J Clin Nurs. doi: 10.1111/j.1365–2702.2012.04131.x.
- , , , . The mini‐CEX (clinical evaluation exercise): a preliminary investigation. Ann Intern Med. 1995;123(10):795–799.
- , , , . Examiner differences in the mini‐CEX. Adv Health Sci Educ Theory Pract. 1997;2(1):27–33.
- , , , . Assessing the reliability and validity of the mini‐clinical evaluation exercise for internal medicine residency training. Acad Med. 2002;77(9):900–904.
- , , , , . Construct validity of the miniclinical evaluation exercise (miniCEX). Acad Med. 2003;78(8):826–830.
- , , , , , . Dropping the baton: a qualitative analysis of failures during the transition from emergency department to inpatient care. Ann Emerg Med. 2009;53(6):701–710.e4.
- , , . Development and implementation of an oral sign‐out skills curriculum. J Gen Intern Med. 2007;22(10):1470–1474.
- , , , . Mixed methods evaluation of oral sign‐out practices. J Gen Intern Med. 2007;22(S1):S114.
- , , , et al. Evaluation of an asynchronous physician voicemail sign‐out for emergency department admissions. Ann Emerg Med. 2009;54(3):368–378.
- , , , et al. An institution‐wide handoff task force to standardise and improve physician handoffs. BMJ Qual Saf. 2012;21(10):863–871.
- , . A model for building a standardized hand‐off protocol. Jt Comm J Qual Patient Saf. 2006;32(11):646–655.
- , , , , . Medication discrepancies in resident sign‐outs and their potential to harm. J Gen Intern Med. 2007;22(12):1751–1755.
- , , , . A theoretical framework and competency‐based approach to improving handoffs. Qual Saf Health Care. 2008;17(1):11–14.
- , , , , , . Hospitalist handoffs: a systematic review and task force recommendations. J Hosp Med. 2009;4(7):433–440.
- , , , , . Interns overestimate the effectiveness of their hand‐off communication. Pediatrics. 2010;125(3):491–496.
- , . Improving clinical handovers: creating local solutions for a global problem. Qual Saf Health Care. 2009;18(4):244–245.
- , , , , . Managing discontinuity in academic medical centers: strategies for a safe and effective resident sign‐out. J Hosp Med. 2006;1(4):257–266.
- , , . Standardized sign‐out reduces intern perception of medical errors on the general internal medicine ward. Teach Learn Med. 2009;21(2):121–126.
- , , . SBAR: a shared mental model for improving communication between clinicians. Jt Comm J Qual Patient Saf. 2006;32(3):167–175.
- . Structuring flexibility: the potential good, bad and ugly in standardisation of handovers. Qual Saf Health Care. 2008;17(1):4–5.
- , , , , . Handoff strategies in settings with high consequences for failure: lessons for health care operations. Int J Qual Health Care. 2004;16(2):125–132.
- , , , , , . Residents' perceptions of professionalism in training and practice: barriers, promoters, and duty hour requirements. J Gen Intern Med. 2006;21(7):758–763.
- , . Communication behaviours in a hospital setting: an observational study. BMJ. 1998;316(7132):673–676.
- , , , , . Communication loads on clinical staff in the emergency department. Med J Aust. 2002;176(9):415–418.
- , . A systematic review of failures in handoff communication during intrahospital transfers. Jt Comm J Qual Patient Saf. 2011;37(6):274–284.
- , , , et al. Hand‐off education and evaluation: piloting the observed simulated hand‐off experience (OSHE). J Gen Intern Med. 2010;25(2):129–134.
- , , , et al. Handoffs causing patient harm: a survey of medical and surgical house staff. Jt Comm J Qual Patient Saf. 2008;34(10):563–570.
- , , . A prospective observational study of physician handoff for intensive‐care‐unit‐to‐ward patient transfers. Am J Med. 2011;124(9):860–867.
- , , , , . Characterizing physician listening behavior during hospitalist handoffs using the HEAR checklist (published online ahead of print December 20, 2012]. BMJ Qual Saf. doi:10.1136/bmjqs‐2012‐001138.
- . A constant error in psychological ratings. J Appl Psychol. 1920;4(1):25.
Copyright © 2013 Society of Hospital Medicine
Discharge Summary Quality
Hospitalized patients are often cared for by physicians who do not follow them in the community, creating a discontinuity of care that must be bridged through communication. This communication between inpatient and outpatient physicians occurs, in part via a discharge summary, which is intended to summarize events during hospitalization and prepare the outpatient physician to resume care of the patient. Yet, this form of communication has long been problematic.[1, 2, 3] In a 1960 study, only 30% of discharge letters were received by the primary care physician within 48 hours of discharge.[1]
More recent studies have shown little improvement. Direct communication between hospital and outpatient physicians is rare, and discharge summaries are still largely unavailable at the time of follow‐up.[4] In 1 study, primary care physicians were unaware of 62% of laboratory tests or study results that were pending on discharge,[5] in part because this information is missing from most discharge summaries.[6] Deficits such as these persist despite the fact that the rate of postdischarge completion of recommended tests, referrals, or procedures is significantly increased when the recommendation is included in the discharge summary.[7]
Regulatory mandates for discharge summaries from the Centers for Medicare and Medicaid Services[8] and from The Joint Commission[9] appear to be generally met[10, 11]; however, these mandates have no requirements for timeliness stricter than 30 days, do not require that summaries be transmitted to outpatient physicians, and do not require several content elements that might be useful to outside physicians such as condition of the patient at discharge, cognitive and functional status, goals of care, or pending studies. Expert opinion guidelines have more comprehensive recommendations,[12, 13] but it is uncertain how widely they are followed.
The existence of a discharge summary does not necessarily mean it serves a patient well in the transitional period.[11, 14, 15] Discharge summaries are a complex intervention, and we do not yet understand the best ways discharge summaries may fulfill needs specific to transitional care. Furthermore, it is uncertain what factors improve aspects of discharge summary quality as defined by timeliness, transmission, and content.[6, 16]
The goal of the DIagnosing Systemic failures, Complexities and HARm in GEriatric discharges study (DISCHARGE) was to comprehensively assess the discharge process for older patients discharged to the community. In this article we examine discharge summaries of patients enrolled in the study to determine the timeliness, transmission to outside physicians, and content of the summaries. We further examine the effect of provider training level and timeliness of dictation on discharge summary quality.
METHODS
Study Cohort
The DISCHARGE study was a prospective, observational cohort study of patients 65 years or older discharged to home from YaleNew Haven Hospital (YNHH) who were admitted with acute coronary syndrome (ACS), community‐acquired pneumonia, or heart failure (HF). Patients were screened by physicians for eligibility within 24 hours of admission using specialty society guidelines[17, 18, 19, 20] and were enrolled by telephone within 1 week of discharge. Additional inclusion criteria included speaking English or Spanish, and ability of the patient or caregiver to participate in a telephone interview. Patients enrolled in hospice were excluded, as were patients who failed the Mini‐Cog mental status screen (3‐item recall and a clock draw)[21] while in the hospital or appeared confused or delirious during the telephone interview. Caregivers of cognitively impaired patients were eligible for enrollment instead if the patient provided permission.
Study Setting
YNHH is a 966‐bed urban tertiary care hospital with statistically lower than the national average mortality for acute myocardial infarction, HF, and pneumonia but statistically higher than the national average for 30‐day readmission rates for HF and pneumonia at the time this study was conducted. Advanced practice registered nurses (APRNs) working under the supervision of private or university cardiologists provided care for cardiology service patients. Housestaff under the supervision of university or hospitalist attending physicians, or physician assistants or APRNs under the supervision of hospitalist attending physicians provided care for patients on medical services. Discharge summaries were typically dictated by APRNs for cardiology patients, by 2nd‐ or 3rd‐year residents for housestaff patients, and by hospitalists for hospitalist patients. A dictation guideline was provided to housestaff and hospitalists (see Supporting Information, Appendix 1, in the online version of this article); this guideline suggested including basic demographic information, disposition and diagnoses, the admission history and physical, hospital course, discharge medications, and follow‐up appointments. Additionally, housestaff received a lecture about discharge summaries at the start of their 2nd year. Discharge instructions including medications and follow‐up appointment information were automatically appended to the discharge summaries. Summaries were sent by the medical records department only to physicians in the system who were listed by the dictating physician as needing to receive a copy of the summary; no summary was automatically sent (ie, to the primary care physician) if not requested by the dictating physician.
Data Collection
Experienced registered nurses trained in chart abstraction conducted explicit reviews of medical charts using a standardized review tool. The tool included 24 questions about the discharge summary applicable to all 3 conditions, with 7 additional questions for patients with HF and 1 additional question for patients with ACS. These questions included the 6 elements required by The Joint Commission for all discharge summaries (reason for hospitalization, significant findings, procedures and treatment provided, patient's discharge condition, patient and family instructions, and attending physician's signature)[9] as well as the 7 elements (principal diagnosis and problem list, medication list, transferring physician name and contact information, cognitive status of the patient, test results, and pending test results) recommended by the Transitions of Care Consensus Conference (TOCCC), a recent consensus statement produced by 6 major medical societies.[13] Each content element is shown in (see Supporting Information, Appendix 2, in the online version of this article), which also indicates the elements included in the 2 guidelines.
Main Measures
We assessed quality in 3 main domains: timeliness, transmission, and content. We defined timeliness as days between discharge date and dictation date (not final signature date, which may occur later), and measured both median timeliness and proportion of discharge summaries completed on the day of discharge. We defined transmission as successful fax or mail of the discharge summary to an outside physician as reported by the medical records department, and measured the proportion of discharge summaries sent to any outside physician as well as the median number of physicians per discharge summary who were scheduled to follow‐up with the patient postdischarge but who did not receive a copy of the summary. We defined 21 individual content items and assessed the frequency of each individual content item. We also measured compliance with The Joint Commission mandates and TOCCC recommendations, which included several of the individual content items.
To measure compliance with The Joint Commission requirements, we created a composite score in which 1 point was provided for the presence of each of the 6 required elements (maximum score=6). Every discharge summary received 1 point for attending physician signature, because all discharge summaries were electronically signed. Discharge instructions to family/patients were automatically appended to every discharge summary; however, we gave credit for patient and family instructions only to those that included any information about signs and symptoms to monitor for at home. We defined discharge condition as any information about functional status, cognitive status, physical exam, or laboratory findings at discharge.
To measure compliance with specialty society recommendations for discharge summaries, we created a composite score in which 1 point was provided for the presence of each of the 7 recommended elements (maximum score=7). Every discharge summary received 1 point for discharge medications, because these are automatically appended.
We obtained data on age, race, gender, and length of stay from hospital administrative databases. The study was approved by the Yale Human Investigation Committee, and verbal informed consent was obtained from all study participants.
Statistical Analysis
Characteristics of the sample are described with counts and percentages or means and standard deviations. Medians and interquartile ranges (IQRs) or counts and percentages were calculated for summary measures of timeliness, transmission, and content. We assessed differences in quality measures between APRNs, housestaff, and hospitalists using 2 tests. We conducted multivariable logistic regression analyses for timeliness and for transmission to any outside physician. All discharge summaries included at least 4 of The Joint Commission elements; consequently, we coded this content outcome as an ordinal variable with 3 levels indicating inclusion of 4, 5, or 6 of The Joint Commission elements. We coded the TOCCC content outcome as a 3‐level variable indicating <4, 4, or >4 elements satisfied. Accordingly, proportional odds models were used, in which the reported odds ratios (ORs) can be interpreted as the average effect of the explanatory variable on the odds of having more recommendations, for any dichotomization of the outcome. Residual analysis and goodness‐of‐fit statistics were used to assess model fit; the proportional odds assumption was tested. Statistical analyses were conducted with SAS 9.2 (SAS Institute, Cary, NC). P values <0.05 were interpreted as statistically significant for 2‐sided tests.
RESULTS
Enrollment and Study Sample
A total of 3743 patients over 64 years old were discharged home from the medical service at YNHH during the study period; 3028 patients were screened for eligibility within 24 hours of admission. We identified 635 eligible admissions and enrolled 395 patients (62.2%) in the study. Of these, 377 granted permission for chart review and were included in this analysis (Figure 1).

The study sample had a mean age of 77.1 years (standard deviation: 7.8); 205 (54.4%) were male and 310 (82.5%) were non‐Hispanic white. A total of 195 (51.7%) had ACS, 91 (24.1%) had pneumonia, and 146 (38.7%) had HF; 54 (14.3%) patients had more than 1 qualifying condition. There were similar numbers of patients on the cardiology, medicine housestaff, and medicine hospitalist teams (Table 1).
| Characteristic | N (%) or Mean (SD) |
|---|---|
| |
| Condition | |
| Acute coronary syndrome | 195 (51.7) |
| Community‐acquired pneumonia | 91 (24.1) |
| Heart failure | 146 (38.7) |
| Training level of summary dictator | |
| APRN | 140 (37.1) |
| House staff | 123 (32.6) |
| Hospitalist | 114 (30.2) |
| Length of stay, mean, d | 3.5 (2.5) |
| Total number of medications | 8.9 (3.3) |
| Identify a usual source of care | 360 (96.0) |
| Age, mean, y | 77.1 (7.8) |
| Male | 205 (54.4) |
| English‐speaking | 366 (98.1) |
| Race/ethnicity | |
| Non‐Hispanic white | 310 (82.5) |
| Non‐Hispanic black | 44 (11.7) |
| Hispanic | 15 (4.0) |
| Other | 7 (1.9) |
| High school graduate or GED Admission source | 268 (73.4) |
| Emergency department | 248 (66.0) |
| Direct transfer from hospital or nursing facility | 94 (25.0) |
| Direct admission from office | 34 (9.0) |
Timeliness
Discharge summaries were completed for 376/377 patients, of which 174 (46.3%) were dictated on the day of discharge. However, 122 (32.4%) summaries were dictated more than 48 hours after discharge, including 93 (24.7%) that were dictated more than 1 week after discharge (see Supporting Information, Appendix 3, in the online version of this article).
Summaries dictated by hospitalists were most likely to be done on the day of discharge (35.3% APRNs, 38.2% housestaff, 68.4% hospitalists, P<0.001). After adjustment for diagnosis and length of stay, hospitalists were still significantly more likely to produce a timely discharge summary than APRNs (OR: 2.82; 95% confidence interval [CI]: 1.56‐5.09), whereas housestaff were no different than APRNs (OR: 0.84; 95% CI: 0.48‐1.46).
Transmission
A total of 144 (38.3%) discharge summaries were not sent to any physician besides the inpatient attending, and 209/374 (55.9%) were not sent to at least 1 physician listed as having a follow‐up appointment planned with the patient. Each discharge summary was sent to a median of 1 physician besides the dictating physician (IQR: 01). However, for each summary, a median of 1 physician (IQR: 01) who had a scheduled follow‐up with the patient did not receive the summary. Summaries dictated by hospitalists were most likely to be sent to at least 1 outside physician (54.7% APRNs, 58.5% housestaff, 73.7% hospitalists, P=0.006). Summaries dictated on the day of discharge were more likely than delayed summaries to be sent to at least 1 outside physician (75.9% vs 49.5%, P<0.001). After adjustment for diagnosis and length of stay, there was no longer a difference in likelihood of transmitting a discharge summary to any outpatient physician according to training level; however, dictations completed on the day of discharge remained significantly more likely to be transmitted to an outside physician (OR: 3.05; 95% CI: 1.88‐4.93) (Table 2).
| Explanatory Variable | Proportion Transmitted to at Least 1 Outside Physician | OR for Transmission to Any Outside Physician (95% CI) | Adjusted P Value |
|---|---|---|---|
| |||
| Training level | 0.52 | ||
| APRN | 54.7% | REF | |
| Housestaff | 58.5% | 1.17 (0.66‐2.06) | |
| Hospitalist | 73.7% | 1.46 (0.76‐2.79) | |
| Timeliness | |||
| Dictated after discharge | 49.5% | REF | <0.001 |
| Dictated day of discharge | 75.9% | 3.05 (1.88‐4.93) | |
| Acute coronary syndrome vs nota | 52.1 % | 1.05 (0.49‐2.26) | 0.89 |
| Pneumonia vs nota | 69.2 % | 1.59 (0.66‐3.79) | 0.30 |
| Heart failure vs nota | 74.7 % | 3.32 (1.61‐6.84) | 0.001 |
| Length of stay, d | 0.91 (0.83‐1.00) | 0.06 | |
Content
Rate of inclusion of each content element is shown in Table 3, overall and by training level. Nearly every discharge summary included information about admitting diagnosis, hospital course, and procedures or tests performed during the hospitalization. However, few summaries included information about the patient's condition at discharge. Less than half included discharge laboratory results; less than one‐third included functional capacity, cognitive capacity, or discharge physical exam. Only 4.1% overall of discharge summaries for patients with HF included the patient's weight at discharge; best were hospitalists who still included this information in only 7.7% of summaries. Information about postdischarge care, including home social support, pending tests, or recommended follow‐up tests/procedures was also rarely specified. Last, only 6.2% of discharge summaries included the name and contact number of the inpatient physician; this information was least likely to be provided by housestaff (1.6%) and most likely to be provided by hospitalists (15.2%) (P<0.001).
| Discharge Summary Component | Overall, n=377, n (%) | APRN, n=140, n (%) | Housestaff, n=123, n (%) | Hospitalist, n=114, n (%) | P Value |
|---|---|---|---|---|---|
| |||||
| Diagnosisab | 368 (97.9) | 136 (97.8) | 120 (97.6) | 112 (98.3) | 1.00 |
| Discharge second diagnosisb | 289 (76.9) | 100 (71.9) | 89 (72.4) | 100 (87.7) | <0.001 |
| Hospital coursea | 375 (100.0) | 138 (100) | 123 (100) | 114 (100) | N/A |
| Procedures/tests performed during admissionab | 374 (99.7) | 138 (99.3) | 123 (100) | 113 (100) | N/A |
| Patient and family instructionsa | 371 (98.4) | 136 (97.1) | 122 (99.2) | 113 (99.1) | .43 |
| Social support or living situation of patient | 148 (39.5) | 18 (12.9) | 62 (50.4) | 68 (60.2) | <0.001 |
| Functional capacity at dischargea | 99 (26.4) | 37 (26.6) | 32 (26.0) | 30 (26.6) | 0.99 |
| Cognitive capacity at dischargeab | 30 (8.0) | 6 (4.4) | 11 (8.9) | 13 (11.5) | 0.10 |
| Physical exam at dischargea | 62 (16.7) | 19 (13.8) | 16 (13.1) | 27 (24.1) | 0.04 |
| Laboratory results at time of dischargea | 164 (43.9) | 63 (45.3) | 50 (40.7) | 51 (45.5) | 0.68 |
| Back to baseline or other nonspecific remark about discharge statusa | 71 (19.0) | 30 (21.6) | 18 (14.8) | 23 (20.4) | 0.34 |
| Any test or result still pending or specific comment that nothing is pendingb | 46 (12.2) | 9 (6.4) | 20 (16.3) | 17 (14.9) | 0.03 |
| Recommendation for follow‐up tests/procedures | 157 (41.9) | 43 (30.9) | 54 (43.9) | 60 (53.1) | 0.002 |
| Call‐back number of responsible in‐house physicianb | 23 (6.2) | 4 (2.9) | 2 (1.6) | 17 (15.2) | <0.001 |
| Resuscitation status | 27 (7.7) | 2 (1.5) | 18 (15.4) | 7 (6.7) | <0.001 |
| Etiology of heart failurec | 120 (82.8) | 44 (81.5) | 34 (87.2) | 42 (80.8) | 0.69 |
| Reason/trigger for exacerbationc | 86 (58.9) | 30 (55.6) | 27 (67.5) | 29 (55.8) | 0.43 |
| Ejection fractionc | 107 (73.3) | 40 (74.1) | 32 (80.0) | 35 (67.3) | 0.39 |
| Discharge weightc | 6 (4.1) | 1 (1.9) | 1 (2.5) | 4 (7.7) | 0.33 |
| Target weight rangec | 5 (3.4) | 0 (0) | 2 (5.0) | 3 (5.8) | 0.22 |
| Discharge creatinine or GFRc | 34 (23.3) | 14 (25.9) | 10 (25.0) | 10 (19.2) | 0.69 |
| If stent placed, whether drug‐eluting or notd | 89 (81.7) | 58 (87.9) | 27 (81.8) | 4 (40.0) | 0.001 |
On average, summaries included 5.6 of the 6 Joint Commission elements and 4.0 of the 7 TOCCC elements. A total of 63.0% of discharge summaries included all 6 elements required by The Joint Commission, whereas no discharge summary included all 7 TOCCC elements.
APRNs, housestaff and hospitalists included the same average number of The Joint Commission elements (5.6 each), but hospitalists on average included slightly more TOCCC elements (4.3) than did housestaff (4.0) or APRNs (3.8) (P<0.001). Summaries dictated on the day of discharge included an average of 4.2 TOCCC elements, compared to 3.9 TOCCC elements in delayed discharge. In multivariable analyses adjusted for diagnosis and length of stay, there was still no difference by training level in presence of The Joint Commission elements, but hospitalists were significantly more likely to include more TOCCC elements than APRNs (OR: 2.70; 95% CI: 1.49‐4.90) (Table 4). Summaries dictated on the day of discharge were significantly more likely to include more TOCCC elements (OR: 1.92; 95% CI: 1.23‐2.99).
| Explanatory Variable | Average Number of TOCCC Elements Included | OR (95% CI) | Adjusted P Value |
|---|---|---|---|
| |||
| Training level | 0.004 | ||
| APRN | 3.8 | REF | |
| Housestaff | 4.0 | 1.54 (0.90‐2.62) | |
| Hospitalist | 4.3 | 2.70 (1.49‐4.90) | |
| Timeliness | |||
| Dictated after discharge | 3.9 | REF | |
| Dictated day of discharge | 4.2 | 1.92 (1.23‐2.99) | 0.004 |
| Acute coronary syndrome vs nota | 3.9 | 0.72 (0.37‐1.39) | 0.33 |
| Pneumonia vs nota | 4.2 | 1.02 (0.49‐2.14) | 0.95 |
| Heart failure vs nota | 4.1 | 1.49 (0.80‐2.78) | 0.21 |
| Length of stay, d | 0.99 (0.90‐1.07) | 0.73 | |
No discharge summary included all 7 TOCCC‐endorsed content elements, was dictated on the day of discharge, and was sent to an outside physician.
DISCUSSION
In this prospective single‐site study of medical patients with 3 common conditions, we found that discharge summaries were completed relatively promptly, but were often not sent to the appropriate outpatient physicians. We also found that summaries were uniformly excellent at providing details of the hospitalization, but less reliable at providing details relevant to transitional care such as the patient's condition on discharge or existence of pending tests. On average, summaries included 57% of the elements included in consensus guidelines by 6 major medical societies. The content of discharge summaries dictated by hospitalists was slightly more comprehensive than that of APRNs and trainees, but no group exhibited high performance. In fact, not one discharge summary fully met all 3 quality criteria of timeliness, transmission, and content.
Our study, unlike most in the field, focused on multiple dimensions of discharge summary quality simultaneously. For instance, previous studies have found that timely receipt of a discharge summary does not reduce readmission rates.[11, 14, 15] Yet, if the content of the discharge summary is inadequate for postdischarge care, the summary may not be useful even if it is received by the follow‐up visit. Conversely, high‐quality content is ineffective if the summary is not sent to the outpatient physician.
This study suggests several avenues for improving summary quality. Timely discharge summaries in this study were more likely to include key content and to be transmitted to the appropriate physician. Strategies to improve discharge summary quality should therefore prioritize timely summaries, which can be expected to have downstream benefits for other aspects of quality. Some studies have found that templates improve discharge summary content.[22] In our institution, a template exists, but it favors a hospitalization‐focused rather than transition‐focused approach to the discharge summary. For instance, it includes instructions to dictate the admission exam, but not the discharge exam. Thus, designing templates specifically for transitional care is key. Maximizing capabilities of electronic records may help; many content elements that were commonly missing (e.g., pending results, discharge vitals, discharge weight) could be automatically inserted from electronic records. Likewise, automatic transmission of the summary to care providers listed in the electronic record might ameliorate many transmission failures. Some efforts have been made to convert existing electronic data into discharge summaries.[23, 24, 25] However, these activities are very preliminary, and some studies have found the quality of electronic summaries to be lower than dictated or handwritten summaries.[26] As with all automated or electronic applications, it will be essential to consider workflow, readability, and ability to synthesize information prior to adoption.
Hospitalists consistently produced highest‐quality summaries, even though they did not receive explicit training, suggesting experience may be beneficial,[27, 28, 29] or that the hospitalist community focus on transitional care has been effective. In addition, hospitalists at our institution explicitly prioritize timely and comprehensive discharge dictations, because their business relies on maintaining good relationships with outpatient physicians who contract for their services. Housestaff and APRNs have no such incentives or policies; rather, they typically consider discharge summaries to be a useful source of patient history at the time of an admission or readmission. Other academic centers have found similar results.[6, 16] Nonetheless, even though hospitalists had slightly better performance in our study, large gaps in the quality of summaries remained for all groups including hospitalists.
This study has several limitations. First, as a single‐site study at an academic hospital, it may not be generalizable to other hospitals or other settings. It is noteworthy, however, that the average time to dictation in this study was much lower than that of other studies,[4, 14, 30, 31, 32] suggesting that practices at this institution are at least no worse and possibly better than elsewhere. Second, although there are some mandates and expert opinion‐based guidelines for discharge summary content, there is no validated evidence base to confirm what content ought to be present in discharge summaries to improve patient outcomes. Third, we had too few readmissions in the dataset to have enough power to determine whether discharge summary content, timeliness, or transmission predicts readmission. Fourth, we did not determine whether the information in discharge summaries was accurate or complete; we merely assessed whether it was present. For example, we gave every discharge summary full credit for including discharge medications because they are automatically appended. Yet medication reconciliation errors at discharge are common.[33, 34] In fact, in the DISCHARGE study cohort, more than a quarter of discharge medication lists contained a suspected error.[35]
In summary, this study demonstrated the inadequacy of the contemporary discharge summary for conveying information that is critical to the transition from hospital to home. It may be that hospital culture treats hospitalizations as discrete and self‐contained events rather than as components of a larger episode of care. As interest in reducing readmissions rises, reframing the discharge summary to serve as a transitional tool and targeting it for quality assessment will likely be necessary.
Acknowledgments
The authors would like to acknowledge Amy Browning and the staff of the Center for Outcomes Research and Evaluation Follow‐Up Center for conducting patient interviews, Mark Abroms and Katherine Herman for patient recruitment and screening, and Peter Charpentier for Web site development.
Disclosures
At the time this study was conducted, Dr. Horwitz was supported by the CTSA Grant UL1 RR024139 and KL2 RR024138 from the National Center for Advancing Translational Sciences (NCATS), a component of the National Institutes of Health (NIH), and NIH roadmap for Medical Research, and was a Centers of Excellence Scholar in Geriatric Medicine by the John A. Hartford Foundation and the American Federation for Aging Research. Dr. Horwitz is now supported by the National Institute on Aging (K08 AG038336) and by the American Federation for Aging Research through the Paul B. Beeson Career Development Award Program. This work was also supported by a grant from the Claude D. Pepper Older Americans Independence Center at Yale University School of Medicine (P30AG021342 NIH/NIA). Dr. Krumholz is supported by grant U01 HL105270‐01 (Center for Cardiovascular Outcomes Research at Yale University) from the National Heart, Lung, and Blood Institute. No funding source had any role in the study design; in the collection, analysis, and interpretation of data; in the writing of the report; or in the decision to submit the article for publication. The content is solely the responsibility of the authors and does not necessarily represent the official views of the National Institute on Aging, the National Center for Advancing Translational Sciences, the National Institutes of Health, The John A. Hartford Foundation, the National Heart, Lung, and Blood Institute, or the American Federation for Aging Research. Dr. Horwitz had full access to all of the data in the study and takes responsibility for the integrity of the data and the accuracy of the data analysis. An earlier version of this work was presented as an oral presentation at the Society of General Internal Medicine Annual Meeting in Orlando, Florida on May 12, 2012. Dr. Krumholz chairs a cardiac scientific advisory board for UnitedHealth. Dr. Krumholz receives support from the Centers of Medicare and Medicaid Services (CMS) to develop and maintain performance measures that are used for public reporting, including readmission measures.
APPENDIX
A
Dictation guidelines provided to house staff and hospitalists
DICTATION GUIDELINES
FORMAT OF DISCHARGE SUMMARY
- Your name(spell it out), andPatient name(spell it out as well)
- Medical record number, date of admission, date of discharge
- Attending physician
- Disposition
- Principal and other diagnoses, Principal and other operations/procedures
- Copies to be sent to other physicians
- Begin narrative: CC, HPI, PMHx, Medications on admit, Social, Family Hx, Physical exam on admission, Data (labs on admission, plus labs relevant to workup, significant changes at discharge, admission EKG, radiologic and other data),Hospital course by problem, discharge meds, follow‐up appointments
APPENDIX
B
| Diagnosis |
| Discharge Second Diagnosis |
| Hospital course |
| Procedures/tests performed during admission |
| Patient and Family Instructions |
| Social support or living situation of patient |
| Functional capacity at discharge |
| Cognitive capacity at discharge |
| Physical exam at discharge |
| Laboratory results at time of discharge |
| Back to baseline or other nonspecific remark about discharge status |
| Any test or result still pending |
| Specific comment that nothing is pending |
| Recommendation for follow up tests/procedures |
| Call back number of responsible in‐house physician |
| Resuscitation status |
| Etiology of heart failure |
| Reason/trigger for exacerbation |
| Ejection fraction |
| Discharge weight |
| Target weight range |
| Discharge creatinine or GFR |
| If stent placed, whether drug‐eluting or not |
| Composite element | Data elements abstracted that qualify as meeting measure |
|---|---|
| Reason for hospitalization | Diagnosis |
| Significant findings | Hospital course |
| Procedures and treatment provided | Procedures/tests performed during admission |
| Patient's discharge condition | Functional capacity at discharge, Cognitive capacity at discharge, Physical exam at discharge, Laboratory results at time of discharge, Back to baseline or other nonspecific remark about discharge status |
| Patient and family instructions | Signs and symptoms to monitor at home |
| Attending physician's signature | Attending signature |
| Composite element | Data elements abstracted that qualify as meeting measure |
|---|---|
| Principal diagnosis | Diagnosis |
| Problem list | Discharge second diagnosis |
| Medication list | [Automatically appended; full credit to every summary] |
| Transferring physician name and contact information | Call back number of responsible in‐house physician |
| Cognitive status of the patient | Cognitive capacity at discharge |
| Test results | Procedures/tests performed during admission |
| Pending test results | Any test or result still pending or specific comment that nothing is pending |
APPENDIX
C
Histogram of days between discharge and dictation
- , , . Value of the specialist's report. Br Med J. 1960;2(5213):1663–1664.
- , . Communications between general practitioners and consultants. Br Med J. 1974;4(5942):456–459.
- , , . A functional hospital discharge summary. J Pediatr. 1975;86(1):97–98.
- , , , , , . Deficits in communication and information transfer between hospital‐based and primary care physicians: implications for patient safety and continuity of care. JAMA. 2007;297(8):831–841.
- , , , et al. Patient safety concerns arising from test results that return after hospital discharge. Ann Intern Med. 2005;143(2):121–128.
- , , , et al. Adequacy of hospital discharge summaries in documenting tests with pending results and outpatient follow‐up providers. J Gen Intern Med. 2009;24(9):1002–1006.
- , , . Tying up loose ends: discharging patients with unresolved medical issues. Arch Intern Med. 2007;167(12):1305–1311.
- Centers for Medicare and Medicaid Services. Condition of participation: medical record services. 42. Vol 482.C.F.R. § 482.24 (2012).
- Joint Commission on Accreditation of Healthcare Organizations. Hospital Accreditation Standards. Standard IM 6.10 EP 7–9. Oakbrook Terrace, IL: The Joint Commission; 2008.
- , . Documentation of mandated discharge summary components in transitions from acute to subacute care. In: Agency for Healthcare Research and Quality, ed. Advances in Patient Safety: New Directions and Alternative Approaches. Vol 2: Culture and Redesign. AHRQ Publication No. 08-0034‐2. Rockville, MD: Agency for Healthcare Research and Quality; 2008:179–188.
- , , , et al. Hospital discharge documentation and risk of rehospitalisation. BMJ Qual Saf. 2011;20(9):773–778.
- , , , et al. Transition of care for hospitalized elderly patients‐development of a discharge checklist for hospitalists. J Hosp Med. 2006;1(6):354–360.
- , , , et al. Transitions of Care Consensus Policy Statement American College of Physicians‐Society of General Internal Medicine‐Society of Hospital Medicine‐American Geriatrics Society‐American College of Emergency Physicians‐Society of Academic Emergency Medicine. J Gen Intern Med. 2009;24(8):971–976.
- , , , et al. Association of communication between hospital‐based physicians and primary care providers with patient outcomes. J Gen Intern Med. 2009;24(3):381–386.
- , , , . Effect of discharge summary availability during post‐discharge visits on hospital readmission. J Gen Intern Med. 2002;17(3):186–192.
- , , , , . Provider characteristics, clinical‐work processes and their relationship to discharge summary quality for sub‐acute care patients. J Gen Intern Med. 2012;27(1):78–84.
- , , , et al. ACC/AHA 2007 guidelines for the management of patients with unstable angina/non‐ST‐elevation myocardial infarction: a report of the American College of Cardiology/American Heart Association Task Force on Practice Guidelines (Writing Committee to Revise the 2002 Guidelines for the Management of Patients With Unstable Angina/Non‐ST‐Elevation Myocardial Infarction) developed in collaboration with the American College of Emergency Physicians, the Society for Cardiovascular Angiography and Interventions, and the Society of Thoracic Surgeons endorsed by the American Association of Cardiovascular and Pulmonary Rehabilitation and the Society for Academic Emergency Medicine. J Am Coll Cardiol. 2007;50(7):e1–e157.
- , , . Universal definition of myocardial infarction. Eur Heart J. 2007;28(20):2525–2538.
- , , , et al. ESC guidelines for the diagnosis and treatment of acute and chronic heart failure 2008: the Task Force for the diagnosis and treatment of acute and chronic heart failure 2008 of the European Society of Cardiology. Developed in collaboration with the Heart Failure Association of the ESC (HFA) and endorsed by the European Society of Intensive Care Medicine (ESICM). Eur J Heart Fail. 2008;10(10):933–989.
- , , , et al. Infectious Diseases Society of America/American Thoracic Society consensus guidelines on the management of community‐acquired pneumonia in adults. Clin Infect Dis. 2007;44(suppl 2):S27–S72.
- , , , et al. Clock drawing in Alzheimer's disease. A novel measure of dementia severity. J Am Geriatr Soc. 1989;37(8):725–729.
- , , , , . Assessing quality and efficiency of discharge summaries. Am J Med Qual. 2005;20(6):337–343.
- , , , et al. Electronic versus dictated hospital discharge summaries: a randomized controlled trial. J Gen Intern Med. 2009;24(9):995–1001.
- , , , . Dictated versus database‐generated discharge summaries: a randomized clinical trial. CMAJ. 1999;160(3):319–326.
- , , , , . Computerised updating of clinical summaries: new opportunities for clinical practice and research? BMJ. 1988;297(6662):1504–1506.
- , , . Evaluation of electronic discharge summaries: a comparison of documentation in electronic and handwritten discharge summaries. Int J Med Inform. 2008;77(9):613–620.
- , , , , . Did I do as best as the system would let me? Healthcare professional views on hospital to home care transitions. J Gen Intern Med. 2012;27(12):1649–1656.
- , , , , . Learning by doing—resident perspectives on developing competency in high‐quality discharge care. J Gen Intern Med. 2012;27(9):1188–1194.
- , , , , . Out of sight, out of mind: housestaff perceptions of quality‐limiting factors in discharge care at teaching hospitals. J Hosp Med. 2012;7(5):376–381.
- , , . Dissemination of discharge summaries. Not reaching follow‐up physicians. Can Fam Physician. 2002;48:737–742.
- , , , . Primary care physician attitudes regarding communication with hospitalists. Am J Med. 2001;111(9B):15S–20S.
- , , , . General practitioner‐hospital communications: a review of discharge summaries. J Qual Clin Pract. 2001;21(4):104–108.
- , , . Accuracy of information on medicines in hospital discharge summaries. Intern Med J. 2006;36(4):221–225.
- , , . Accuracy of medication documentation in hospital discharge summaries: A retrospective analysis of medication transcription errors in manual and electronic discharge summaries. Int J Med Inform. 2010;79(1):58–64.
- , , , . Medication reconciliation accuracy and patient understanding of intended medication changes on hospital discharge. J Gen Intern Med. 2012;27(11):1513–1520.
Hospitalized patients are often cared for by physicians who do not follow them in the community, creating a discontinuity of care that must be bridged through communication. This communication between inpatient and outpatient physicians occurs, in part via a discharge summary, which is intended to summarize events during hospitalization and prepare the outpatient physician to resume care of the patient. Yet, this form of communication has long been problematic.[1, 2, 3] In a 1960 study, only 30% of discharge letters were received by the primary care physician within 48 hours of discharge.[1]
More recent studies have shown little improvement. Direct communication between hospital and outpatient physicians is rare, and discharge summaries are still largely unavailable at the time of follow‐up.[4] In 1 study, primary care physicians were unaware of 62% of laboratory tests or study results that were pending on discharge,[5] in part because this information is missing from most discharge summaries.[6] Deficits such as these persist despite the fact that the rate of postdischarge completion of recommended tests, referrals, or procedures is significantly increased when the recommendation is included in the discharge summary.[7]
Regulatory mandates for discharge summaries from the Centers for Medicare and Medicaid Services[8] and from The Joint Commission[9] appear to be generally met[10, 11]; however, these mandates have no requirements for timeliness stricter than 30 days, do not require that summaries be transmitted to outpatient physicians, and do not require several content elements that might be useful to outside physicians such as condition of the patient at discharge, cognitive and functional status, goals of care, or pending studies. Expert opinion guidelines have more comprehensive recommendations,[12, 13] but it is uncertain how widely they are followed.
The existence of a discharge summary does not necessarily mean it serves a patient well in the transitional period.[11, 14, 15] Discharge summaries are a complex intervention, and we do not yet understand the best ways discharge summaries may fulfill needs specific to transitional care. Furthermore, it is uncertain what factors improve aspects of discharge summary quality as defined by timeliness, transmission, and content.[6, 16]
The goal of the DIagnosing Systemic failures, Complexities and HARm in GEriatric discharges study (DISCHARGE) was to comprehensively assess the discharge process for older patients discharged to the community. In this article we examine discharge summaries of patients enrolled in the study to determine the timeliness, transmission to outside physicians, and content of the summaries. We further examine the effect of provider training level and timeliness of dictation on discharge summary quality.
METHODS
Study Cohort
The DISCHARGE study was a prospective, observational cohort study of patients 65 years or older discharged to home from YaleNew Haven Hospital (YNHH) who were admitted with acute coronary syndrome (ACS), community‐acquired pneumonia, or heart failure (HF). Patients were screened by physicians for eligibility within 24 hours of admission using specialty society guidelines[17, 18, 19, 20] and were enrolled by telephone within 1 week of discharge. Additional inclusion criteria included speaking English or Spanish, and ability of the patient or caregiver to participate in a telephone interview. Patients enrolled in hospice were excluded, as were patients who failed the Mini‐Cog mental status screen (3‐item recall and a clock draw)[21] while in the hospital or appeared confused or delirious during the telephone interview. Caregivers of cognitively impaired patients were eligible for enrollment instead if the patient provided permission.
Study Setting
YNHH is a 966‐bed urban tertiary care hospital with statistically lower than the national average mortality for acute myocardial infarction, HF, and pneumonia but statistically higher than the national average for 30‐day readmission rates for HF and pneumonia at the time this study was conducted. Advanced practice registered nurses (APRNs) working under the supervision of private or university cardiologists provided care for cardiology service patients. Housestaff under the supervision of university or hospitalist attending physicians, or physician assistants or APRNs under the supervision of hospitalist attending physicians provided care for patients on medical services. Discharge summaries were typically dictated by APRNs for cardiology patients, by 2nd‐ or 3rd‐year residents for housestaff patients, and by hospitalists for hospitalist patients. A dictation guideline was provided to housestaff and hospitalists (see Supporting Information, Appendix 1, in the online version of this article); this guideline suggested including basic demographic information, disposition and diagnoses, the admission history and physical, hospital course, discharge medications, and follow‐up appointments. Additionally, housestaff received a lecture about discharge summaries at the start of their 2nd year. Discharge instructions including medications and follow‐up appointment information were automatically appended to the discharge summaries. Summaries were sent by the medical records department only to physicians in the system who were listed by the dictating physician as needing to receive a copy of the summary; no summary was automatically sent (ie, to the primary care physician) if not requested by the dictating physician.
Data Collection
Experienced registered nurses trained in chart abstraction conducted explicit reviews of medical charts using a standardized review tool. The tool included 24 questions about the discharge summary applicable to all 3 conditions, with 7 additional questions for patients with HF and 1 additional question for patients with ACS. These questions included the 6 elements required by The Joint Commission for all discharge summaries (reason for hospitalization, significant findings, procedures and treatment provided, patient's discharge condition, patient and family instructions, and attending physician's signature)[9] as well as the 7 elements (principal diagnosis and problem list, medication list, transferring physician name and contact information, cognitive status of the patient, test results, and pending test results) recommended by the Transitions of Care Consensus Conference (TOCCC), a recent consensus statement produced by 6 major medical societies.[13] Each content element is shown in (see Supporting Information, Appendix 2, in the online version of this article), which also indicates the elements included in the 2 guidelines.
Main Measures
We assessed quality in 3 main domains: timeliness, transmission, and content. We defined timeliness as days between discharge date and dictation date (not final signature date, which may occur later), and measured both median timeliness and proportion of discharge summaries completed on the day of discharge. We defined transmission as successful fax or mail of the discharge summary to an outside physician as reported by the medical records department, and measured the proportion of discharge summaries sent to any outside physician as well as the median number of physicians per discharge summary who were scheduled to follow‐up with the patient postdischarge but who did not receive a copy of the summary. We defined 21 individual content items and assessed the frequency of each individual content item. We also measured compliance with The Joint Commission mandates and TOCCC recommendations, which included several of the individual content items.
To measure compliance with The Joint Commission requirements, we created a composite score in which 1 point was provided for the presence of each of the 6 required elements (maximum score=6). Every discharge summary received 1 point for attending physician signature, because all discharge summaries were electronically signed. Discharge instructions to family/patients were automatically appended to every discharge summary; however, we gave credit for patient and family instructions only to those that included any information about signs and symptoms to monitor for at home. We defined discharge condition as any information about functional status, cognitive status, physical exam, or laboratory findings at discharge.
To measure compliance with specialty society recommendations for discharge summaries, we created a composite score in which 1 point was provided for the presence of each of the 7 recommended elements (maximum score=7). Every discharge summary received 1 point for discharge medications, because these are automatically appended.
We obtained data on age, race, gender, and length of stay from hospital administrative databases. The study was approved by the Yale Human Investigation Committee, and verbal informed consent was obtained from all study participants.
Statistical Analysis
Characteristics of the sample are described with counts and percentages or means and standard deviations. Medians and interquartile ranges (IQRs) or counts and percentages were calculated for summary measures of timeliness, transmission, and content. We assessed differences in quality measures between APRNs, housestaff, and hospitalists using 2 tests. We conducted multivariable logistic regression analyses for timeliness and for transmission to any outside physician. All discharge summaries included at least 4 of The Joint Commission elements; consequently, we coded this content outcome as an ordinal variable with 3 levels indicating inclusion of 4, 5, or 6 of The Joint Commission elements. We coded the TOCCC content outcome as a 3‐level variable indicating <4, 4, or >4 elements satisfied. Accordingly, proportional odds models were used, in which the reported odds ratios (ORs) can be interpreted as the average effect of the explanatory variable on the odds of having more recommendations, for any dichotomization of the outcome. Residual analysis and goodness‐of‐fit statistics were used to assess model fit; the proportional odds assumption was tested. Statistical analyses were conducted with SAS 9.2 (SAS Institute, Cary, NC). P values <0.05 were interpreted as statistically significant for 2‐sided tests.
RESULTS
Enrollment and Study Sample
A total of 3743 patients over 64 years old were discharged home from the medical service at YNHH during the study period; 3028 patients were screened for eligibility within 24 hours of admission. We identified 635 eligible admissions and enrolled 395 patients (62.2%) in the study. Of these, 377 granted permission for chart review and were included in this analysis (Figure 1).
The study sample had a mean age of 77.1 years (standard deviation: 7.8); 205 (54.4%) were male and 310 (82.5%) were non‐Hispanic white. A total of 195 (51.7%) had ACS, 91 (24.1%) had pneumonia, and 146 (38.7%) had HF; 54 (14.3%) patients had more than 1 qualifying condition. There were similar numbers of patients on the cardiology, medicine housestaff, and medicine hospitalist teams (Table 1).
| Characteristic | N (%) or Mean (SD) |
|---|---|
| |
| Condition | |
| Acute coronary syndrome | 195 (51.7) |
| Community‐acquired pneumonia | 91 (24.1) |
| Heart failure | 146 (38.7) |
| Training level of summary dictator | |
| APRN | 140 (37.1) |
| House staff | 123 (32.6) |
| Hospitalist | 114 (30.2) |
| Length of stay, mean, d | 3.5 (2.5) |
| Total number of medications | 8.9 (3.3) |
| Identify a usual source of care | 360 (96.0) |
| Age, mean, y | 77.1 (7.8) |
| Male | 205 (54.4) |
| English‐speaking | 366 (98.1) |
| Race/ethnicity | |
| Non‐Hispanic white | 310 (82.5) |
| Non‐Hispanic black | 44 (11.7) |
| Hispanic | 15 (4.0) |
| Other | 7 (1.9) |
| High school graduate or GED Admission source | 268 (73.4) |
| Emergency department | 248 (66.0) |
| Direct transfer from hospital or nursing facility | 94 (25.0) |
| Direct admission from office | 34 (9.0) |
Timeliness
Discharge summaries were completed for 376/377 patients, of which 174 (46.3%) were dictated on the day of discharge. However, 122 (32.4%) summaries were dictated more than 48 hours after discharge, including 93 (24.7%) that were dictated more than 1 week after discharge (see Supporting Information, Appendix 3, in the online version of this article).
Summaries dictated by hospitalists were most likely to be done on the day of discharge (35.3% APRNs, 38.2% housestaff, 68.4% hospitalists, P<0.001). After adjustment for diagnosis and length of stay, hospitalists were still significantly more likely to produce a timely discharge summary than APRNs (OR: 2.82; 95% confidence interval [CI]: 1.56‐5.09), whereas housestaff were no different than APRNs (OR: 0.84; 95% CI: 0.48‐1.46).
Transmission
A total of 144 (38.3%) discharge summaries were not sent to any physician besides the inpatient attending, and 209/374 (55.9%) were not sent to at least 1 physician listed as having a follow‐up appointment planned with the patient. Each discharge summary was sent to a median of 1 physician besides the dictating physician (IQR: 01). However, for each summary, a median of 1 physician (IQR: 01) who had a scheduled follow‐up with the patient did not receive the summary. Summaries dictated by hospitalists were most likely to be sent to at least 1 outside physician (54.7% APRNs, 58.5% housestaff, 73.7% hospitalists, P=0.006). Summaries dictated on the day of discharge were more likely than delayed summaries to be sent to at least 1 outside physician (75.9% vs 49.5%, P<0.001). After adjustment for diagnosis and length of stay, there was no longer a difference in likelihood of transmitting a discharge summary to any outpatient physician according to training level; however, dictations completed on the day of discharge remained significantly more likely to be transmitted to an outside physician (OR: 3.05; 95% CI: 1.88‐4.93) (Table 2).
| Explanatory Variable | Proportion Transmitted to at Least 1 Outside Physician | OR for Transmission to Any Outside Physician (95% CI) | Adjusted P Value |
|---|---|---|---|
| |||
| Training level | 0.52 | ||
| APRN | 54.7% | REF | |
| Housestaff | 58.5% | 1.17 (0.66‐2.06) | |
| Hospitalist | 73.7% | 1.46 (0.76‐2.79) | |
| Timeliness | |||
| Dictated after discharge | 49.5% | REF | <0.001 |
| Dictated day of discharge | 75.9% | 3.05 (1.88‐4.93) | |
| Acute coronary syndrome vs nota | 52.1 % | 1.05 (0.49‐2.26) | 0.89 |
| Pneumonia vs nota | 69.2 % | 1.59 (0.66‐3.79) | 0.30 |
| Heart failure vs nota | 74.7 % | 3.32 (1.61‐6.84) | 0.001 |
| Length of stay, d | 0.91 (0.83‐1.00) | 0.06 | |
Content
Rate of inclusion of each content element is shown in Table 3, overall and by training level. Nearly every discharge summary included information about admitting diagnosis, hospital course, and procedures or tests performed during the hospitalization. However, few summaries included information about the patient's condition at discharge. Less than half included discharge laboratory results; less than one‐third included functional capacity, cognitive capacity, or discharge physical exam. Only 4.1% overall of discharge summaries for patients with HF included the patient's weight at discharge; best were hospitalists who still included this information in only 7.7% of summaries. Information about postdischarge care, including home social support, pending tests, or recommended follow‐up tests/procedures was also rarely specified. Last, only 6.2% of discharge summaries included the name and contact number of the inpatient physician; this information was least likely to be provided by housestaff (1.6%) and most likely to be provided by hospitalists (15.2%) (P<0.001).
| Discharge Summary Component | Overall, n=377, n (%) | APRN, n=140, n (%) | Housestaff, n=123, n (%) | Hospitalist, n=114, n (%) | P Value |
|---|---|---|---|---|---|
| |||||
| Diagnosisab | 368 (97.9) | 136 (97.8) | 120 (97.6) | 112 (98.3) | 1.00 |
| Discharge second diagnosisb | 289 (76.9) | 100 (71.9) | 89 (72.4) | 100 (87.7) | <0.001 |
| Hospital coursea | 375 (100.0) | 138 (100) | 123 (100) | 114 (100) | N/A |
| Procedures/tests performed during admissionab | 374 (99.7) | 138 (99.3) | 123 (100) | 113 (100) | N/A |
| Patient and family instructionsa | 371 (98.4) | 136 (97.1) | 122 (99.2) | 113 (99.1) | .43 |
| Social support or living situation of patient | 148 (39.5) | 18 (12.9) | 62 (50.4) | 68 (60.2) | <0.001 |
| Functional capacity at dischargea | 99 (26.4) | 37 (26.6) | 32 (26.0) | 30 (26.6) | 0.99 |
| Cognitive capacity at dischargeab | 30 (8.0) | 6 (4.4) | 11 (8.9) | 13 (11.5) | 0.10 |
| Physical exam at dischargea | 62 (16.7) | 19 (13.8) | 16 (13.1) | 27 (24.1) | 0.04 |
| Laboratory results at time of dischargea | 164 (43.9) | 63 (45.3) | 50 (40.7) | 51 (45.5) | 0.68 |
| Back to baseline or other nonspecific remark about discharge statusa | 71 (19.0) | 30 (21.6) | 18 (14.8) | 23 (20.4) | 0.34 |
| Any test or result still pending or specific comment that nothing is pendingb | 46 (12.2) | 9 (6.4) | 20 (16.3) | 17 (14.9) | 0.03 |
| Recommendation for follow‐up tests/procedures | 157 (41.9) | 43 (30.9) | 54 (43.9) | 60 (53.1) | 0.002 |
| Call‐back number of responsible in‐house physicianb | 23 (6.2) | 4 (2.9) | 2 (1.6) | 17 (15.2) | <0.001 |
| Resuscitation status | 27 (7.7) | 2 (1.5) | 18 (15.4) | 7 (6.7) | <0.001 |
| Etiology of heart failurec | 120 (82.8) | 44 (81.5) | 34 (87.2) | 42 (80.8) | 0.69 |
| Reason/trigger for exacerbationc | 86 (58.9) | 30 (55.6) | 27 (67.5) | 29 (55.8) | 0.43 |
| Ejection fractionc | 107 (73.3) | 40 (74.1) | 32 (80.0) | 35 (67.3) | 0.39 |
| Discharge weightc | 6 (4.1) | 1 (1.9) | 1 (2.5) | 4 (7.7) | 0.33 |
| Target weight rangec | 5 (3.4) | 0 (0) | 2 (5.0) | 3 (5.8) | 0.22 |
| Discharge creatinine or GFRc | 34 (23.3) | 14 (25.9) | 10 (25.0) | 10 (19.2) | 0.69 |
| If stent placed, whether drug‐eluting or notd | 89 (81.7) | 58 (87.9) | 27 (81.8) | 4 (40.0) | 0.001 |
On average, summaries included 5.6 of the 6 Joint Commission elements and 4.0 of the 7 TOCCC elements. A total of 63.0% of discharge summaries included all 6 elements required by The Joint Commission, whereas no discharge summary included all 7 TOCCC elements.
APRNs, housestaff and hospitalists included the same average number of The Joint Commission elements (5.6 each), but hospitalists on average included slightly more TOCCC elements (4.3) than did housestaff (4.0) or APRNs (3.8) (P<0.001). Summaries dictated on the day of discharge included an average of 4.2 TOCCC elements, compared to 3.9 TOCCC elements in delayed discharge. In multivariable analyses adjusted for diagnosis and length of stay, there was still no difference by training level in presence of The Joint Commission elements, but hospitalists were significantly more likely to include more TOCCC elements than APRNs (OR: 2.70; 95% CI: 1.49‐4.90) (Table 4). Summaries dictated on the day of discharge were significantly more likely to include more TOCCC elements (OR: 1.92; 95% CI: 1.23‐2.99).
| Explanatory Variable | Average Number of TOCCC Elements Included | OR (95% CI) | Adjusted P Value |
|---|---|---|---|
| |||
| Training level | 0.004 | ||
| APRN | 3.8 | REF | |
| Housestaff | 4.0 | 1.54 (0.90‐2.62) | |
| Hospitalist | 4.3 | 2.70 (1.49‐4.90) | |
| Timeliness | |||
| Dictated after discharge | 3.9 | REF | |
| Dictated day of discharge | 4.2 | 1.92 (1.23‐2.99) | 0.004 |
| Acute coronary syndrome vs nota | 3.9 | 0.72 (0.37‐1.39) | 0.33 |
| Pneumonia vs nota | 4.2 | 1.02 (0.49‐2.14) | 0.95 |
| Heart failure vs nota | 4.1 | 1.49 (0.80‐2.78) | 0.21 |
| Length of stay, d | 0.99 (0.90‐1.07) | 0.73 | |
No discharge summary included all 7 TOCCC‐endorsed content elements, was dictated on the day of discharge, and was sent to an outside physician.
DISCUSSION
In this prospective single‐site study of medical patients with 3 common conditions, we found that discharge summaries were completed relatively promptly, but were often not sent to the appropriate outpatient physicians. We also found that summaries were uniformly excellent at providing details of the hospitalization, but less reliable at providing details relevant to transitional care such as the patient's condition on discharge or existence of pending tests. On average, summaries included 57% of the elements included in consensus guidelines by 6 major medical societies. The content of discharge summaries dictated by hospitalists was slightly more comprehensive than that of APRNs and trainees, but no group exhibited high performance. In fact, not one discharge summary fully met all 3 quality criteria of timeliness, transmission, and content.
Our study, unlike most in the field, focused on multiple dimensions of discharge summary quality simultaneously. For instance, previous studies have found that timely receipt of a discharge summary does not reduce readmission rates.[11, 14, 15] Yet, if the content of the discharge summary is inadequate for postdischarge care, the summary may not be useful even if it is received by the follow‐up visit. Conversely, high‐quality content is ineffective if the summary is not sent to the outpatient physician.
This study suggests several avenues for improving summary quality. Timely discharge summaries in this study were more likely to include key content and to be transmitted to the appropriate physician. Strategies to improve discharge summary quality should therefore prioritize timely summaries, which can be expected to have downstream benefits for other aspects of quality. Some studies have found that templates improve discharge summary content.[22] In our institution, a template exists, but it favors a hospitalization‐focused rather than transition‐focused approach to the discharge summary. For instance, it includes instructions to dictate the admission exam, but not the discharge exam. Thus, designing templates specifically for transitional care is key. Maximizing capabilities of electronic records may help; many content elements that were commonly missing (e.g., pending results, discharge vitals, discharge weight) could be automatically inserted from electronic records. Likewise, automatic transmission of the summary to care providers listed in the electronic record might ameliorate many transmission failures. Some efforts have been made to convert existing electronic data into discharge summaries.[23, 24, 25] However, these activities are very preliminary, and some studies have found the quality of electronic summaries to be lower than dictated or handwritten summaries.[26] As with all automated or electronic applications, it will be essential to consider workflow, readability, and ability to synthesize information prior to adoption.
Hospitalists consistently produced highest‐quality summaries, even though they did not receive explicit training, suggesting experience may be beneficial,[27, 28, 29] or that the hospitalist community focus on transitional care has been effective. In addition, hospitalists at our institution explicitly prioritize timely and comprehensive discharge dictations, because their business relies on maintaining good relationships with outpatient physicians who contract for their services. Housestaff and APRNs have no such incentives or policies; rather, they typically consider discharge summaries to be a useful source of patient history at the time of an admission or readmission. Other academic centers have found similar results.[6, 16] Nonetheless, even though hospitalists had slightly better performance in our study, large gaps in the quality of summaries remained for all groups including hospitalists.
This study has several limitations. First, as a single‐site study at an academic hospital, it may not be generalizable to other hospitals or other settings. It is noteworthy, however, that the average time to dictation in this study was much lower than that of other studies,[4, 14, 30, 31, 32] suggesting that practices at this institution are at least no worse and possibly better than elsewhere. Second, although there are some mandates and expert opinion‐based guidelines for discharge summary content, there is no validated evidence base to confirm what content ought to be present in discharge summaries to improve patient outcomes. Third, we had too few readmissions in the dataset to have enough power to determine whether discharge summary content, timeliness, or transmission predicts readmission. Fourth, we did not determine whether the information in discharge summaries was accurate or complete; we merely assessed whether it was present. For example, we gave every discharge summary full credit for including discharge medications because they are automatically appended. Yet medication reconciliation errors at discharge are common.[33, 34] In fact, in the DISCHARGE study cohort, more than a quarter of discharge medication lists contained a suspected error.[35]
In summary, this study demonstrated the inadequacy of the contemporary discharge summary for conveying information that is critical to the transition from hospital to home. It may be that hospital culture treats hospitalizations as discrete and self‐contained events rather than as components of a larger episode of care. As interest in reducing readmissions rises, reframing the discharge summary to serve as a transitional tool and targeting it for quality assessment will likely be necessary.
Acknowledgments
The authors would like to acknowledge Amy Browning and the staff of the Center for Outcomes Research and Evaluation Follow‐Up Center for conducting patient interviews, Mark Abroms and Katherine Herman for patient recruitment and screening, and Peter Charpentier for Web site development.
Disclosures
At the time this study was conducted, Dr. Horwitz was supported by the CTSA Grant UL1 RR024139 and KL2 RR024138 from the National Center for Advancing Translational Sciences (NCATS), a component of the National Institutes of Health (NIH), and NIH roadmap for Medical Research, and was a Centers of Excellence Scholar in Geriatric Medicine by the John A. Hartford Foundation and the American Federation for Aging Research. Dr. Horwitz is now supported by the National Institute on Aging (K08 AG038336) and by the American Federation for Aging Research through the Paul B. Beeson Career Development Award Program. This work was also supported by a grant from the Claude D. Pepper Older Americans Independence Center at Yale University School of Medicine (P30AG021342 NIH/NIA). Dr. Krumholz is supported by grant U01 HL105270‐01 (Center for Cardiovascular Outcomes Research at Yale University) from the National Heart, Lung, and Blood Institute. No funding source had any role in the study design; in the collection, analysis, and interpretation of data; in the writing of the report; or in the decision to submit the article for publication. The content is solely the responsibility of the authors and does not necessarily represent the official views of the National Institute on Aging, the National Center for Advancing Translational Sciences, the National Institutes of Health, The John A. Hartford Foundation, the National Heart, Lung, and Blood Institute, or the American Federation for Aging Research. Dr. Horwitz had full access to all of the data in the study and takes responsibility for the integrity of the data and the accuracy of the data analysis. An earlier version of this work was presented as an oral presentation at the Society of General Internal Medicine Annual Meeting in Orlando, Florida on May 12, 2012. Dr. Krumholz chairs a cardiac scientific advisory board for UnitedHealth. Dr. Krumholz receives support from the Centers of Medicare and Medicaid Services (CMS) to develop and maintain performance measures that are used for public reporting, including readmission measures.
APPENDIX
A
Dictation guidelines provided to house staff and hospitalists
DICTATION GUIDELINES
FORMAT OF DISCHARGE SUMMARY
- Your name(spell it out), andPatient name(spell it out as well)
- Medical record number, date of admission, date of discharge
- Attending physician
- Disposition
- Principal and other diagnoses, Principal and other operations/procedures
- Copies to be sent to other physicians
- Begin narrative: CC, HPI, PMHx, Medications on admit, Social, Family Hx, Physical exam on admission, Data (labs on admission, plus labs relevant to workup, significant changes at discharge, admission EKG, radiologic and other data),Hospital course by problem, discharge meds, follow‐up appointments
APPENDIX
B
| Diagnosis |
| Discharge Second Diagnosis |
| Hospital course |
| Procedures/tests performed during admission |
| Patient and Family Instructions |
| Social support or living situation of patient |
| Functional capacity at discharge |
| Cognitive capacity at discharge |
| Physical exam at discharge |
| Laboratory results at time of discharge |
| Back to baseline or other nonspecific remark about discharge status |
| Any test or result still pending |
| Specific comment that nothing is pending |
| Recommendation for follow up tests/procedures |
| Call back number of responsible in‐house physician |
| Resuscitation status |
| Etiology of heart failure |
| Reason/trigger for exacerbation |
| Ejection fraction |
| Discharge weight |
| Target weight range |
| Discharge creatinine or GFR |
| If stent placed, whether drug‐eluting or not |
| Composite element | Data elements abstracted that qualify as meeting measure |
|---|---|
| Reason for hospitalization | Diagnosis |
| Significant findings | Hospital course |
| Procedures and treatment provided | Procedures/tests performed during admission |
| Patient's discharge condition | Functional capacity at discharge, Cognitive capacity at discharge, Physical exam at discharge, Laboratory results at time of discharge, Back to baseline or other nonspecific remark about discharge status |
| Patient and family instructions | Signs and symptoms to monitor at home |
| Attending physician's signature | Attending signature |
| Composite element | Data elements abstracted that qualify as meeting measure |
|---|---|
| Principal diagnosis | Diagnosis |
| Problem list | Discharge second diagnosis |
| Medication list | [Automatically appended; full credit to every summary] |
| Transferring physician name and contact information | Call back number of responsible in‐house physician |
| Cognitive status of the patient | Cognitive capacity at discharge |
| Test results | Procedures/tests performed during admission |
| Pending test results | Any test or result still pending or specific comment that nothing is pending |
APPENDIX
C
Histogram of days between discharge and dictation
- , , . Value of the specialist's report. Br Med J. 1960;2(5213):1663–1664.
- , . Communications between general practitioners and consultants. Br Med J. 1974;4(5942):456–459.
- , , . A functional hospital discharge summary. J Pediatr. 1975;86(1):97–98.
- , , , , , . Deficits in communication and information transfer between hospital‐based and primary care physicians: implications for patient safety and continuity of care. JAMA. 2007;297(8):831–841.
- , , , et al. Patient safety concerns arising from test results that return after hospital discharge. Ann Intern Med. 2005;143(2):121–128.
- , , , et al. Adequacy of hospital discharge summaries in documenting tests with pending results and outpatient follow‐up providers. J Gen Intern Med. 2009;24(9):1002–1006.
- , , . Tying up loose ends: discharging patients with unresolved medical issues. Arch Intern Med. 2007;167(12):1305–1311.
- Centers for Medicare and Medicaid Services. Condition of participation: medical record services. 42. Vol 482.C.F.R. § 482.24 (2012).
- Joint Commission on Accreditation of Healthcare Organizations. Hospital Accreditation Standards. Standard IM 6.10 EP 7–9. Oakbrook Terrace, IL: The Joint Commission; 2008.
- , . Documentation of mandated discharge summary components in transitions from acute to subacute care. In: Agency for Healthcare Research and Quality, ed. Advances in Patient Safety: New Directions and Alternative Approaches. Vol 2: Culture and Redesign. AHRQ Publication No. 08-0034‐2. Rockville, MD: Agency for Healthcare Research and Quality; 2008:179–188.
- , , , et al. Hospital discharge documentation and risk of rehospitalisation. BMJ Qual Saf. 2011;20(9):773–778.
- , , , et al. Transition of care for hospitalized elderly patients‐development of a discharge checklist for hospitalists. J Hosp Med. 2006;1(6):354–360.
- , , , et al. Transitions of Care Consensus Policy Statement American College of Physicians‐Society of General Internal Medicine‐Society of Hospital Medicine‐American Geriatrics Society‐American College of Emergency Physicians‐Society of Academic Emergency Medicine. J Gen Intern Med. 2009;24(8):971–976.
- , , , et al. Association of communication between hospital‐based physicians and primary care providers with patient outcomes. J Gen Intern Med. 2009;24(3):381–386.
- , , , . Effect of discharge summary availability during post‐discharge visits on hospital readmission. J Gen Intern Med. 2002;17(3):186–192.
- , , , , . Provider characteristics, clinical‐work processes and their relationship to discharge summary quality for sub‐acute care patients. J Gen Intern Med. 2012;27(1):78–84.
- , , , et al. ACC/AHA 2007 guidelines for the management of patients with unstable angina/non‐ST‐elevation myocardial infarction: a report of the American College of Cardiology/American Heart Association Task Force on Practice Guidelines (Writing Committee to Revise the 2002 Guidelines for the Management of Patients With Unstable Angina/Non‐ST‐Elevation Myocardial Infarction) developed in collaboration with the American College of Emergency Physicians, the Society for Cardiovascular Angiography and Interventions, and the Society of Thoracic Surgeons endorsed by the American Association of Cardiovascular and Pulmonary Rehabilitation and the Society for Academic Emergency Medicine. J Am Coll Cardiol. 2007;50(7):e1–e157.
- , , . Universal definition of myocardial infarction. Eur Heart J. 2007;28(20):2525–2538.
- , , , et al. ESC guidelines for the diagnosis and treatment of acute and chronic heart failure 2008: the Task Force for the diagnosis and treatment of acute and chronic heart failure 2008 of the European Society of Cardiology. Developed in collaboration with the Heart Failure Association of the ESC (HFA) and endorsed by the European Society of Intensive Care Medicine (ESICM). Eur J Heart Fail. 2008;10(10):933–989.
- , , , et al. Infectious Diseases Society of America/American Thoracic Society consensus guidelines on the management of community‐acquired pneumonia in adults. Clin Infect Dis. 2007;44(suppl 2):S27–S72.
- , , , et al. Clock drawing in Alzheimer's disease. A novel measure of dementia severity. J Am Geriatr Soc. 1989;37(8):725–729.
- , , , , . Assessing quality and efficiency of discharge summaries. Am J Med Qual. 2005;20(6):337–343.
- , , , et al. Electronic versus dictated hospital discharge summaries: a randomized controlled trial. J Gen Intern Med. 2009;24(9):995–1001.
- , , , . Dictated versus database‐generated discharge summaries: a randomized clinical trial. CMAJ. 1999;160(3):319–326.
- , , , , . Computerised updating of clinical summaries: new opportunities for clinical practice and research? BMJ. 1988;297(6662):1504–1506.
- , , . Evaluation of electronic discharge summaries: a comparison of documentation in electronic and handwritten discharge summaries. Int J Med Inform. 2008;77(9):613–620.
- , , , , . Did I do as best as the system would let me? Healthcare professional views on hospital to home care transitions. J Gen Intern Med. 2012;27(12):1649–1656.
- , , , , . Learning by doing—resident perspectives on developing competency in high‐quality discharge care. J Gen Intern Med. 2012;27(9):1188–1194.
- , , , , . Out of sight, out of mind: housestaff perceptions of quality‐limiting factors in discharge care at teaching hospitals. J Hosp Med. 2012;7(5):376–381.
- , , . Dissemination of discharge summaries. Not reaching follow‐up physicians. Can Fam Physician. 2002;48:737–742.
- , , , . Primary care physician attitudes regarding communication with hospitalists. Am J Med. 2001;111(9B):15S–20S.
- , , , . General practitioner‐hospital communications: a review of discharge summaries. J Qual Clin Pract. 2001;21(4):104–108.
- , , . Accuracy of information on medicines in hospital discharge summaries. Intern Med J. 2006;36(4):221–225.
- , , . Accuracy of medication documentation in hospital discharge summaries: A retrospective analysis of medication transcription errors in manual and electronic discharge summaries. Int J Med Inform. 2010;79(1):58–64.
- , , , . Medication reconciliation accuracy and patient understanding of intended medication changes on hospital discharge. J Gen Intern Med. 2012;27(11):1513–1520.
Copyright © 2013 Society of Hospital Medicine