User login
Patient Safety Indicator-12 Rarely Identifies Problems with Quality of Care in Perioperative Venous Thromboembolism
Perioperative venous thromboembolism (VTE) is a major contributor to the morbidity and mortality of hospitalized patients. The historical incidence of postoperative VTE varied between 15%-80% depending on the type of procedure and monitoring strategies. Higher incidences of VTE occurred with major surgery (15%-40%), knee or hip arthroplasty (40%-60%), and trauma (60%-80%).1 The use of VTE prophylaxis with subcutaneous heparin reduced DVTs by 70% and PEs by 50%.2 A recent study from Olmstead County showed improved adherence to inpatient VTE prophylaxis from 2005 to 2010 but no difference in VTE incidence. However, 52% of VTE events were associated with hospitalization.3 As such, VTE continues to be a healthcare-associated adverse event, and surgery remains a significant risk factor for thrombosis.4
The Agency for Healthcare Research and Quality (AHRQ) released Patient Safety Indicators (PSI) in 2003 to provide a means of screening for adverse events.5 Over time, PSIs have been adopted as a measure of hospital performance and are utilized in several pay-for-performance programs. PSI-90 is a composite measure of several other PSIs and is a core metric in the Centers for Medicare and Medicaid Services (CMS) Hospital-Acquired Condition Reduction Program and the Hospital Value-Based Purchasing Program which impacts up to 2% of a hospital’s Medicare payments.6,7 One component of PSI-90 is PSI-12, which captures perioperative VTE. PSI-12 events are identified using software that screens medical records based on International Classification of Diseases (ICD)-9/10 codes for thrombosis and procedure codes at time of discharge.8
Over the last several years, there has been concern regarding the validity of including PSI-12 in pay-for-performance metrics. Common areas for concern include PSI-12’s accuracy in detecting true postoperative VTE9 in addition to surveillance bias.10,11 However, some note that PSI-12 is useful when applied with its original intent: as a screening tool for hospitals to identify specific areas to implement improvements.9,12The aim of our study was to review all PSI-12 events at our institution to evaluate the accuracy of PSI-12 and identify areas for improvement to prevent VTE events in surgical patients. While several other studies have looked at the positive predictive values, accuracy, or surveillance bias of PSI-12, to the best of our knowledge, few, if any, previous studies have reported PSI-12 events in relation to their timing, type of prophylaxis used, and mitigating factors to identify areas for quality improvement.
METHODS
PSI-12 events were identified between June 2015 and June 2017 using AHRQ software (version 5). Cases were also identified through Vizient and reviewed to ensure congruence between the methods. Patients’ electronic medical records were reviewed for patient demographics, type of VTE event, platelet count at VTE diagnosis, procedure type, and both the timing and type of VTE prophylaxis. Summary statistics were calculated.
We considered perioperative VTE pharmacologic prophylaxis appropriate if started within 24 hours of a low bleeding risk procedure or 72 hours of a high-bleeding risk procedure.13 Mechanical prophylaxis was considered appropriate if pharmacologic prophylaxis was not used because of procedure risk, thrombocytopenia, or active bleeding. The medication administration record was reviewed to determine if prophylaxis was ordered, given, and/or refused.
RESULTS
During the two-year period, 18,084 surgeries were performed, and 161 cases of VTE events were identified. A detailed chart review and correction of documentation led to the exclusion of seven cases (4%) because the VTE event occurred prior to admission (n = 5) or were incidental findings that did not meet the Uniform Hospital Discharge Data Set definition for reporting (n = 2). In total, 154 (0.9% of all surgeries) cases were considered PSI-12 events. Pulmonary embolism (PE) occurred in most cases (n = 97, 62.9%), followed by deep vein thrombosis (DVT) (n = 37, 24.0%). Twenty cases (12.9%) experienced concurrent PE and DVT. Within the PE group, 16 cases (14%) were subsegmental PE only. Eight patients (14% of DVT cases) had only a distal DVT. The mean age of patients was 56 years (+/− 16 years), and the majority (59%) were male. The clinical specialties with the most events included neurosurgery (21%), orthopedics (14%), general surgery (13%), and trauma (11%). Fourteen patients (9%) died during the hospitalization, and of these, six (43%) had either sudden death or death attributed to PE (Table 1).
Cases were also reviewed for the type of VTE prophylactic strategy administered at the time of the event. The top three prophylactic strategies were subcutaneous unfractionated heparin (61%), mechanical prophylaxis only (51%), and enoxaparin (31%). Nine cases of VTE occurred during therapeutic anticoagulation (6%; Table 1).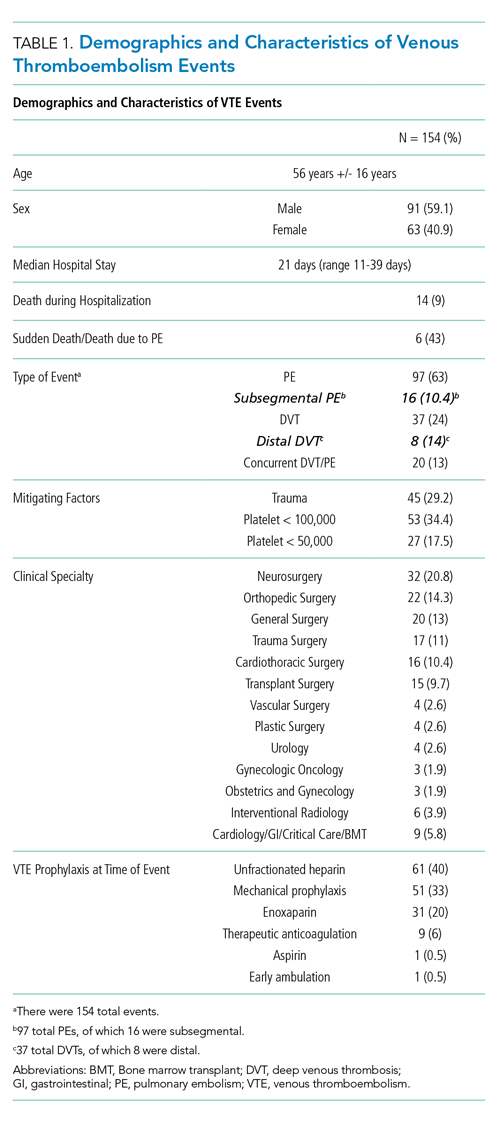
We also evaluated the timing of VTE in relation to hospitalization and procedure. Overall, the median length of hospital stay was 21 days (range: 11-39 days). VTE occurred early in the hospitalization; 21% of cases of VTE occurred within three days of admission, and 43.5% occurred within seven days of admission (Figure 1). With regard to VTE timing in relation to the procedure, 4.5% of cases of VTE occurred prior to the procedure, 33% occurred within three days of the procedure, and 53% occurred within seven days (Figure 2).
Absence of guideline-appropriate VTE prophylaxis was identified in only nine (6%) cases: seven patients had delayed initiation of pharmacologic prophylaxis, and two had pharmacologic prophylaxis held for unknown reasons. When accounting for pharmacologic prophylaxis missed based on patient refusal (n = 10 patients), the number of patients without guideline- appropriate VTE prophylaxis increased to 17 cases (11%), as two of the cases with patient refusal were found to have other quality issues present. Pharmacologic prophylaxis was given to 125 patients during their hospitalization. A median of 8% of ordered doses was refused, and an additional 8% of doses were held for a procedure (Table 2). We evaluated other factors that could have influenced the rate or type of VTE prophylactic strategies toward the use of mechanical prophylaxis, including thrombocytopenia and trauma. Although 11% of cases were treated primarily by the trauma teams (Table 1), a trauma-related procedure accounted for 29% of PSI-12 cases. Thrombocytopenia (platelets of less than 100,000) occurred in 53 cases (34%), with 27 patients (18%) having a platelet count of less than 50,000.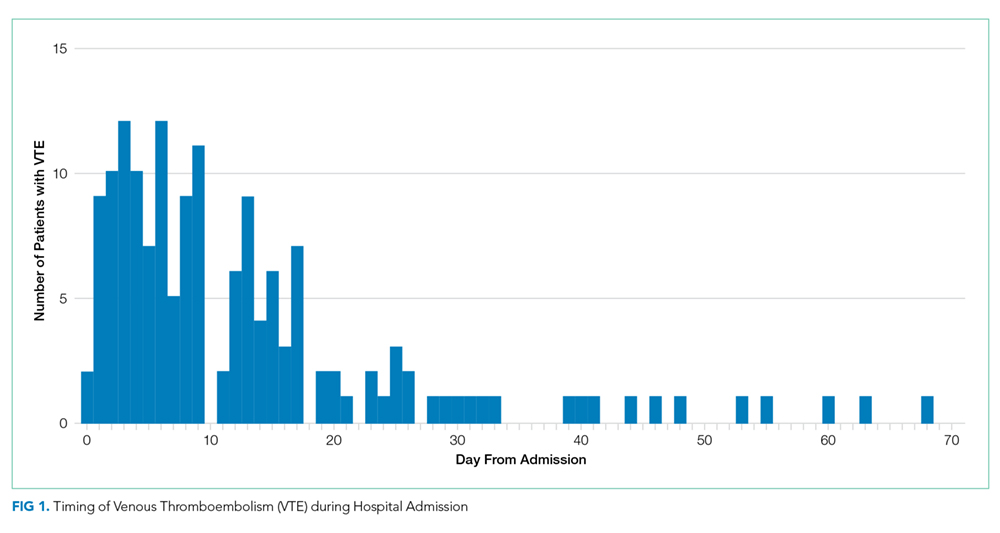
DISCUSSION
Utilizing AHRQ version 5 software for PSI-12, our institution identified 154 cases of perioperative VTE. Most of these cases were a pulmonary embolism, occurred within a week of admission, and were associated with surgical specialties that portend a higher risk of VTE. Very few of these cases were deficient in guideline-directed VTE prophylaxis, and several cases had associated factors such as trauma and thrombocytopenia that may have appropriately influenced the decision to use mechanical only prophylaxis. Sixteen percent of pharmacologic VTE prophylactic doses were refused or held for a procedure, a known but rarely quantified influence on rates of pharmacologic prophylaxis. The use of patient-level data and adjudication of the clinical decision that affected the administration of VTE prophylaxis is a major strength of this work. In all, our data raise several questions about the accuracy of PSI-12 in identifying preventable postoperative VTE, especially as it is utilized as a marker for pay-for-performance measures in addition to identifying further areas for research and improvement.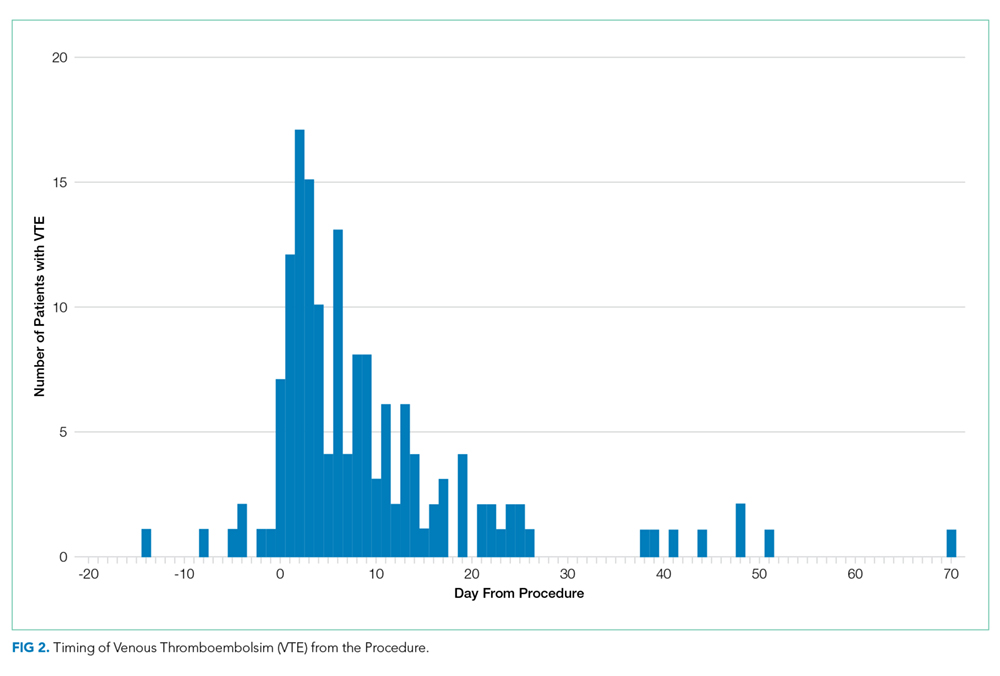
Our results align with previous studies that suggest that PSI-12 is an inaccurate measure of performance quality. A study by Bilimoria et al. in 2013 noted that surveillance biases associated with PSI-12, showing that hospitals with higher compliance to appropriate VTE prophylaxis paradoxically had worse outcomes.10 Furthermore, Blay et al. recently published a study evaluating PSI-90 scores for hospitals with and without the VTE measure included. Their results indicated that larger hospitals (teaching hospitals, level I trauma centers, etc) caring for sicker patients were noted to improve by 8%-25% when the VTE measure was removed.11 Similarly, our data indicate that the PSI-12 may not be an accurate measure of quality performance, as only 6% of cases were noted to be deficient in appropriate guideline-directed prophylaxis. Even when accounting for the refusal of doses of pharmacologic prophylaxis, this figure only increased to 11%.
Procedures included in the current PSI-12 algorithm also vary in the risk they pose to developing VTE. For example, the current version of PSI-12 includes surgical Medicare Severity Diagnosis Related Groups (MS-DRGs) for procedures with a high risk of VTE such as orthopedic, abdominal, or thoracic procedures.14,15, However, it is worth noting that procedures such as tracheostomy and ocular surgery are also included.14 The variation in risk for development of VTE is reflected in the Caprini score, a perioperative risk stratification tool. These latter procedures only contribute one point, whereas trauma would add five points each to the total score, and make the patient a high VTE risk from the procedure alone.16 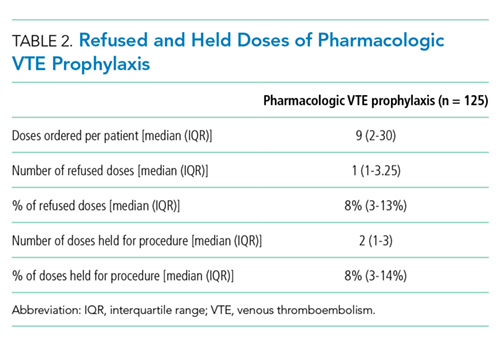
While most of our cases of VTE occurred within higher risk surgical subspecialties, 15 (10%) of our cases were within the clinical specialties of interventional radiology, cardiology, gastroenterology, and bone marrow transplant. One procedure of notable conflict includes bronchoalveolar lavage (BAL), which is included as an operating room procedure per the current version of PSI-12 software,17 but is no longer recognized by CMS as a surgical MS-DRG for reimbursement. The PSI-12 observed-to-expected rates take the DRG and comorbidity codes into consideration, but which DRG is selected does not always reflect the procedure type or the risk of VTE associated with the procedure.
Regarding the type of VTE event, our data revealed that PE was the predominant event, accounting for 62% of cases. This is different compared with other studies, such as the population-based studies in which PE and DVT account for approximately 40%-42% of events, respectively, and approximately 15% with concurrent PE and DVT. 9,18 Borzecki et al. however, noted similar rates to our study, with 55% as PE only, 38% as DVT only, and 8% had both PE and DVT. This study also found a positive correlation between PSI-12 rates and VTE imaging rates, such that if more CT scans were completed, more PEs could be found.19 Our data identified 16 of the 97 cases of PE were subsegmental PE, a subset of VTE whose clinical significance has been questioned.20 Excluding these cases brings the percentage closer to 52%. Also, screening ultrasounds are not performed at our institution. Asymptomatic or minimally symptomatic DVTs could be missed.
Further, this study also highlights that the reliability of PSI-12 is dependent on accurate documentation and coding. This is most evident when reviewing studies that evaluated the positive predictive value (PPV) of this measure.9,12,21 A study of 28 Veteran’s Affairs hospitals from 2003 to 2007 used the AHRQ version 3 software to assess the PPV of PSI-12. Out of the 112 cases flagged by the AHRQ PSI software, only 48 were true events of postoperative DVT, yielding a PPV of only 43%. False-positive results were primarily patients with VTE present on admission and cases that were diagnosed after admission but prior to the index procedure. They also noted that coding inaccuracies were present in 38% of cases.9 Similarly, Henderson et al. conducted a retrospective review of 112 postsurgical discharges noting a PPV of 54%, with most false-positives resulting from superficial clots identified by PSI-12 related to coding ambiguity.12 Our data similarly showed false-positive results as seven cases were excluded based on chart review and documentation correction, and 4.5% were preprocedural. However, there is some discordance with previous studies, as our data yields a PPV of 91% for VTE when accounting for preprocedural events as well as those excluded based on chart review. One explanation is an improvement in documentation strategies and coding, as our institution has adopted strategies to review cases and clarify documentation prior to billing to improve accuracy, and inclusion of a checkbox to indicate that a diagnosis was present on admission. Another possibility is improved accuracy with ICD-10 coding, as shown in a paper by Quan et al. that found a 79% PPV of PSI-12, which improved to 89% when cases present on admission were excluded.21 Lastly, we used newer versions of the AHRQ software, which could have improved the accuracy of detection. Despite these improvements in PSI-12 identifying true cases of postoperative VTE, as our data show, there is still much to be desired in terms of identifying issues with the quality of care and inclusion of PSI-12 in pay-for-performance.
Our study has several limitations. As a retrospective review, a major limiting factor is that data obtained are subject to the accuracy of documentation within the provider and nursing notes. As such, we focused on broad topics such as VTE events, the type of VTE event, and timing of the event in relation to admission and procedure. We actively review cases at discharge prior to billing to correct documentation if required. However, a prolonged hospital stay could lead to a review of the case weeks to months later. A real-time alert for a VTE event in a patient with surgery could improve documentation.
Further, although mechanical only prophylaxis was present on chart review, it is impossible to know both the rate of compliance with this method and whether it contributed to some events.
Despite these limitations, our goals of evaluating the validity of PSI-12 and identifying areas for improved measurement and techniques for DVT prophylaxis were met. As previously discussed, our data suggest that PSI-12 has several limitations in identifying quality of care issues with the prevention of DVT. For example, PSI-12 included many cases in which pharmacologic prophylaxis was appropriately not given. Approximately 50% of cases occurred in patients who were thrombocytopenic (platelets < 100,000), and 29% of events occurred in trauma patients. In addition, 33% of cases identified were within three days of the procedure, which, in cases of high-bleeding risk procedures, is an appropriate time to refrain from pharmacologic anticoagulation.13 In cases such as these, it may be worth evaluating alternative forms of mechanical only prophylaxis, or other strategies to mitigate this risk.
This study also highlights areas for further research. Many of the VTE events in this study occurred while patients were treated with appropriate prophylaxis, as other studies have also shown.22,23 Gangireddy et al. looked at demographic and clinical information surrounding postoperative VTE and found several other risk factors that incur a higher risk of VTE, including steroid use, infections, and myocardial infarction.24 Perhaps future studies could target these groups as potential points for increased prophylactic strategies. As noted by Lau et al. appropriate VTE prophylaxis involves risk stratification, ordering the appropriate prophylaxis by clinicians, patient acceptance of prescribed therapy, and nursing administration of prescribed therapy.25 As exemplified by our data, despite appropriate prophylaxis being ordered, eight events were associated solely with the refusal of pharmacologic prophylaxis. An ideal VTE metric would identify patients with a VTE who had a defective VTE prophylactic process,25 but the cost associated with manual data abstraction may limit the inclusion of a process metric into pay-for-performance. Additional research also needs to identify whether modifications to PSI-12 can improve its accuracy and predictive value, such as the exclusion of VTE prior to a procedure, modifications to what counts as a procedure, or utilizing markers to assess adherence to VTE prophylactic rates. These points are especially important to consider if PSI-12 is to remain as one of the key factors in pay-for-performance outcome measures. Lastly, understanding the effectiveness and patient adherence to oral VTE prophylactic regimens could also decrease the rates of refusal of VTE prophylaxis.
Overall, VTE remains a large contributor to morbidity and mortality among hospitalized surgical patients. While there is utility in PSI-12 as a screening tool to identify these events and potential areas for improved processes to decrease VTE, its usefulness for detection of true quality issues and its utilization in pay-for-performance is questionable. The universally high rates of VTE prophylaxis question the need for a VTE prophylactic metric. However, if these metrics are going to continue to be used in determining payments, modifications to the current processes and algorithms are needed to improve accuracy in identifying issues in quality of care.
1. Valsami S, Asmis LM. A brief review of 50 years of perioperative thrombosis and hemostasis management. Semin Hematol. 2013;50(2):79-87. https://doi.org/10.1053/j.seminhematol.2013.04.001.
2. Collins R, Scrimgeour A, Yusuf S, Peto R. Reduction in fatal pulmonary embolism and venous thrombosis by perioperative administration of subcutaneous heparin. N Engl J Med. 1988;318(18):1162-1173. https://doi.org/10.1056/NEJM198805053181805.
3. Heit JA, Crusan DJ, Ashrani AA, Petterson TM, Bailey KR. Effect of a near-universal hospitalization-based prophylaxis regimen on annual number of venous thromboembolism events in the US. Blood. 2017;130(2):109-114. https://doi.org/10.1182/blood-2016-12-758995.
4. Landrigan CP, Parry GJ, Bones CB, Hackbarth AD, Goldmann DA, Sharek PJ. Temporal trends in rates of patient harm resulting from medical care. N Engl J Med. 2010;363(22):2124-2134. https://doi.org/10.1056/NEJMsa1004404.
5. Agency for Healthcare Research and Quality. Patient Safety Indicators Brochure. 2015 Edition. https://www.qualityindicators.ahrq.gov/Downloads/Modules/PSI/V50/PSI_Brochure.pdf. Accessed 10 Jun 2019.
6. Centers for Medicare & Medicaid Services. CMS Hospital Value-Based Purchasing Program Results for Fiscal Year 2018. 2017. https://www.cms.gov/newsroom/fact-sheets/cms-hospital-value-based-purchasing-program-results-fiscal-year-2018. Accessed June 10, 2019.
7. Rajaram R, Barnard C, Bilimoria KY. Concerns about using the patient safety indicator-90 composite in pay-for-performance programs. JAMA. 2015;313(9):897-898. https://doi.org/10.1001/jamacardio.2018.2382.
8. Agency for Healthcare Research and Quality. Patient Safety Indicator 12 (PSI 12) Perioperative Pulmonary Embolism or Deep Vein Thrombosis Rate. 2017. https://www.qualityindicators.ahrq.gov/Downloads/Modules/PSI/V60-ICD09/TechSpecs/PSI_12_Perioperative_Pulmonary_Embolism_or_Deep_Vein_Thrombosis_Rate.pdf. Accessed June 9, 2019.
9. Kaafarani HM, Borzecki AM, Itani KM, et al. Validity of selected patient safety indicators: opportunities and concerns. J Am Coll Surg. 2011;212(6):924-934. https://doi.org/10.1016/j.jamcollsurg.2010.07.007.
10. Bilimoria KY, Chung J, Ju MH, et al. Evaluation of surveillance bias and the validity of the venous thromboembolism quality measure. JAMA. 2013;310(14):1482-1489. https://doi.org/10.1001/jama.2013.280048.
11. Blay E, Jr., Huang R, Chung JW, et al. Evaluating the impact of the venous thromboembolism outcome measure on the PSI 90 composite quality metric. Jt Comm J Qual Patient Saf. 2019;45(3):148-155. https://doi.org/10.1016/j.jcjq.2018.08.009
12. Henderson KE, Recktenwald A, Reichley RM, et al. Clinical validation of the AHRQ postoperative venous thromboembolism patient safety indicator. Jt Comm J Qual Patient Saf. 2009;35(7):370-376.
13. Douketis JD, Spyropoulos AC, Spencer FA, et al. Perioperative management of antithrombotic therapy: antithrombotic therapy and prevention of thrombosis, 9th ed: American College of Chest Physicians Evidence-Based Clinical Practice Guidelines. Chest. 2012;141(2):e326S-e350S. https://doi.org/10.1378/chest.11-2298.
14. Agency for Healthcare Research and Quality. Appendix E: Surgical Discharge MS-DRGs. 2018. https://www.qualityindicators.ahrq.gov/Downloads/Modules/PSI/V2018/TechSpecs/PSI_Appendix_E.pdf. Accessed June 9, 2019.
15. Anderson FA, Jr., Spencer FA. Risk factors for venous thromboembolism. Circulation. 2003;107(23 Suppl 1):I9-16. https://doi.org/10.1161/01.CIR.0000078469.07362.E6.
16. Caprini JA. Thrombosis risk assessment as a guide to quality patient care. Dis Mon. 2005;51(2-3):70-78. https://doi.org/10.1016/j.disamonth.2005.02.003.
17. Agency for Healthcare Research and Quality. Appendix A: Operating Room Procedure Codes. 2018. https://www.qualityindicators.ahrq.gov/Downloads/Modules/PSI/V2018/TechSpecs/PSI_Appendix_A.pdf. Accessed June 9, 2019
18. Silverstein MD, Heit JA, Mohr DN, Petterson TM, O’Fallon WM, Melton LJ, 3rd. Trends in the incidence of deep vein thrombosis and pulmonary embolism: a 25-year population-based study. Arch Intern Med. 1998;158(6):585-593. https://doi.org/10.1001/archinte.158.6.585.
19. Borzecki AM, Chen Q, O’Brien W, et al. The patient safety indicator perioperative pulmonary embolism or deep vein thrombosis: is there associated surveillance bias in the veterans health administration? Am J Surg. 2018;216(5):974-979. https://doi.org/10.1016/j.amjsurg.2018.06.023.
20. Carrier M, Righini M, Wells PS, et al. Subsegmental pulmonary embolism diagnosed by computed tomography: incidence and clinical implications. A systematic review and meta-analysis of the management outcome studies. J Thromb Haemost. 2010;8(8):1716-1722. https://doi.org/10.1111/j.1538-7836.2010.03938.x.
21. Quan H, Eastwood C, Cunningham CT, et al. Validity of AHRQ patient safety indicators derived from ICD-10 hospital discharge abstract data (chart review study). BMJ Open. 2013;3(10):e003716. https://doi.org/10.1136/bmjopen-2013-003716.
22. Flanders SA, Greene MT, Grant P, et al. Hospital performance for pharmacologic venous thromboembolism prophylaxis and rate of venous thromboembolism: a cohort study. JAMA Intern Med. 2014;174(10):1577-1584. https://doi.org/10.1001/jamainternmed.2014.3384.
23. Wang TF, Wong CA, Milligan PE, Thoelke MS, Woeltje KF, Gage BF. Risk factors for inpatient venous thromboembolism despite thromboprophylaxis. Thromb Res. 2014;133(1):25-29. https://doi.org/10.1016/j.thromres.2013.09.011.
24. Gangireddy C, Rectenwald JR, Upchurch GR, et al. Risk factors and clinical impact of postoperative symptomatic venous thromboembolism. J Vass Surg. 2007;45(2):335-341; discussion 341-332. https://doi.org/10.1016/j.jvs.2006.10.034.
25. Lau BD, Streiff MB, Pronovost PJ, Haut ER. Venous thromboembolism quality measures fail to accurately measure quality. Circulation. 2018;137(12):1278-1284. https://doi.org/10.1161/CIRCULATIONAHA.116.026897.
Perioperative venous thromboembolism (VTE) is a major contributor to the morbidity and mortality of hospitalized patients. The historical incidence of postoperative VTE varied between 15%-80% depending on the type of procedure and monitoring strategies. Higher incidences of VTE occurred with major surgery (15%-40%), knee or hip arthroplasty (40%-60%), and trauma (60%-80%).1 The use of VTE prophylaxis with subcutaneous heparin reduced DVTs by 70% and PEs by 50%.2 A recent study from Olmstead County showed improved adherence to inpatient VTE prophylaxis from 2005 to 2010 but no difference in VTE incidence. However, 52% of VTE events were associated with hospitalization.3 As such, VTE continues to be a healthcare-associated adverse event, and surgery remains a significant risk factor for thrombosis.4
The Agency for Healthcare Research and Quality (AHRQ) released Patient Safety Indicators (PSI) in 2003 to provide a means of screening for adverse events.5 Over time, PSIs have been adopted as a measure of hospital performance and are utilized in several pay-for-performance programs. PSI-90 is a composite measure of several other PSIs and is a core metric in the Centers for Medicare and Medicaid Services (CMS) Hospital-Acquired Condition Reduction Program and the Hospital Value-Based Purchasing Program which impacts up to 2% of a hospital’s Medicare payments.6,7 One component of PSI-90 is PSI-12, which captures perioperative VTE. PSI-12 events are identified using software that screens medical records based on International Classification of Diseases (ICD)-9/10 codes for thrombosis and procedure codes at time of discharge.8
Over the last several years, there has been concern regarding the validity of including PSI-12 in pay-for-performance metrics. Common areas for concern include PSI-12’s accuracy in detecting true postoperative VTE9 in addition to surveillance bias.10,11 However, some note that PSI-12 is useful when applied with its original intent: as a screening tool for hospitals to identify specific areas to implement improvements.9,12The aim of our study was to review all PSI-12 events at our institution to evaluate the accuracy of PSI-12 and identify areas for improvement to prevent VTE events in surgical patients. While several other studies have looked at the positive predictive values, accuracy, or surveillance bias of PSI-12, to the best of our knowledge, few, if any, previous studies have reported PSI-12 events in relation to their timing, type of prophylaxis used, and mitigating factors to identify areas for quality improvement.
METHODS
PSI-12 events were identified between June 2015 and June 2017 using AHRQ software (version 5). Cases were also identified through Vizient and reviewed to ensure congruence between the methods. Patients’ electronic medical records were reviewed for patient demographics, type of VTE event, platelet count at VTE diagnosis, procedure type, and both the timing and type of VTE prophylaxis. Summary statistics were calculated.
We considered perioperative VTE pharmacologic prophylaxis appropriate if started within 24 hours of a low bleeding risk procedure or 72 hours of a high-bleeding risk procedure.13 Mechanical prophylaxis was considered appropriate if pharmacologic prophylaxis was not used because of procedure risk, thrombocytopenia, or active bleeding. The medication administration record was reviewed to determine if prophylaxis was ordered, given, and/or refused.
RESULTS
During the two-year period, 18,084 surgeries were performed, and 161 cases of VTE events were identified. A detailed chart review and correction of documentation led to the exclusion of seven cases (4%) because the VTE event occurred prior to admission (n = 5) or were incidental findings that did not meet the Uniform Hospital Discharge Data Set definition for reporting (n = 2). In total, 154 (0.9% of all surgeries) cases were considered PSI-12 events. Pulmonary embolism (PE) occurred in most cases (n = 97, 62.9%), followed by deep vein thrombosis (DVT) (n = 37, 24.0%). Twenty cases (12.9%) experienced concurrent PE and DVT. Within the PE group, 16 cases (14%) were subsegmental PE only. Eight patients (14% of DVT cases) had only a distal DVT. The mean age of patients was 56 years (+/− 16 years), and the majority (59%) were male. The clinical specialties with the most events included neurosurgery (21%), orthopedics (14%), general surgery (13%), and trauma (11%). Fourteen patients (9%) died during the hospitalization, and of these, six (43%) had either sudden death or death attributed to PE (Table 1).
Cases were also reviewed for the type of VTE prophylactic strategy administered at the time of the event. The top three prophylactic strategies were subcutaneous unfractionated heparin (61%), mechanical prophylaxis only (51%), and enoxaparin (31%). Nine cases of VTE occurred during therapeutic anticoagulation (6%; Table 1).
We also evaluated the timing of VTE in relation to hospitalization and procedure. Overall, the median length of hospital stay was 21 days (range: 11-39 days). VTE occurred early in the hospitalization; 21% of cases of VTE occurred within three days of admission, and 43.5% occurred within seven days of admission (Figure 1). With regard to VTE timing in relation to the procedure, 4.5% of cases of VTE occurred prior to the procedure, 33% occurred within three days of the procedure, and 53% occurred within seven days (Figure 2).
Absence of guideline-appropriate VTE prophylaxis was identified in only nine (6%) cases: seven patients had delayed initiation of pharmacologic prophylaxis, and two had pharmacologic prophylaxis held for unknown reasons. When accounting for pharmacologic prophylaxis missed based on patient refusal (n = 10 patients), the number of patients without guideline- appropriate VTE prophylaxis increased to 17 cases (11%), as two of the cases with patient refusal were found to have other quality issues present. Pharmacologic prophylaxis was given to 125 patients during their hospitalization. A median of 8% of ordered doses was refused, and an additional 8% of doses were held for a procedure (Table 2). We evaluated other factors that could have influenced the rate or type of VTE prophylactic strategies toward the use of mechanical prophylaxis, including thrombocytopenia and trauma. Although 11% of cases were treated primarily by the trauma teams (Table 1), a trauma-related procedure accounted for 29% of PSI-12 cases. Thrombocytopenia (platelets of less than 100,000) occurred in 53 cases (34%), with 27 patients (18%) having a platelet count of less than 50,000.
DISCUSSION
Utilizing AHRQ version 5 software for PSI-12, our institution identified 154 cases of perioperative VTE. Most of these cases were a pulmonary embolism, occurred within a week of admission, and were associated with surgical specialties that portend a higher risk of VTE. Very few of these cases were deficient in guideline-directed VTE prophylaxis, and several cases had associated factors such as trauma and thrombocytopenia that may have appropriately influenced the decision to use mechanical only prophylaxis. Sixteen percent of pharmacologic VTE prophylactic doses were refused or held for a procedure, a known but rarely quantified influence on rates of pharmacologic prophylaxis. The use of patient-level data and adjudication of the clinical decision that affected the administration of VTE prophylaxis is a major strength of this work. In all, our data raise several questions about the accuracy of PSI-12 in identifying preventable postoperative VTE, especially as it is utilized as a marker for pay-for-performance measures in addition to identifying further areas for research and improvement.
Our results align with previous studies that suggest that PSI-12 is an inaccurate measure of performance quality. A study by Bilimoria et al. in 2013 noted that surveillance biases associated with PSI-12, showing that hospitals with higher compliance to appropriate VTE prophylaxis paradoxically had worse outcomes.10 Furthermore, Blay et al. recently published a study evaluating PSI-90 scores for hospitals with and without the VTE measure included. Their results indicated that larger hospitals (teaching hospitals, level I trauma centers, etc) caring for sicker patients were noted to improve by 8%-25% when the VTE measure was removed.11 Similarly, our data indicate that the PSI-12 may not be an accurate measure of quality performance, as only 6% of cases were noted to be deficient in appropriate guideline-directed prophylaxis. Even when accounting for the refusal of doses of pharmacologic prophylaxis, this figure only increased to 11%.
Procedures included in the current PSI-12 algorithm also vary in the risk they pose to developing VTE. For example, the current version of PSI-12 includes surgical Medicare Severity Diagnosis Related Groups (MS-DRGs) for procedures with a high risk of VTE such as orthopedic, abdominal, or thoracic procedures.14,15, However, it is worth noting that procedures such as tracheostomy and ocular surgery are also included.14 The variation in risk for development of VTE is reflected in the Caprini score, a perioperative risk stratification tool. These latter procedures only contribute one point, whereas trauma would add five points each to the total score, and make the patient a high VTE risk from the procedure alone.16
While most of our cases of VTE occurred within higher risk surgical subspecialties, 15 (10%) of our cases were within the clinical specialties of interventional radiology, cardiology, gastroenterology, and bone marrow transplant. One procedure of notable conflict includes bronchoalveolar lavage (BAL), which is included as an operating room procedure per the current version of PSI-12 software,17 but is no longer recognized by CMS as a surgical MS-DRG for reimbursement. The PSI-12 observed-to-expected rates take the DRG and comorbidity codes into consideration, but which DRG is selected does not always reflect the procedure type or the risk of VTE associated with the procedure.
Regarding the type of VTE event, our data revealed that PE was the predominant event, accounting for 62% of cases. This is different compared with other studies, such as the population-based studies in which PE and DVT account for approximately 40%-42% of events, respectively, and approximately 15% with concurrent PE and DVT. 9,18 Borzecki et al. however, noted similar rates to our study, with 55% as PE only, 38% as DVT only, and 8% had both PE and DVT. This study also found a positive correlation between PSI-12 rates and VTE imaging rates, such that if more CT scans were completed, more PEs could be found.19 Our data identified 16 of the 97 cases of PE were subsegmental PE, a subset of VTE whose clinical significance has been questioned.20 Excluding these cases brings the percentage closer to 52%. Also, screening ultrasounds are not performed at our institution. Asymptomatic or minimally symptomatic DVTs could be missed.
Further, this study also highlights that the reliability of PSI-12 is dependent on accurate documentation and coding. This is most evident when reviewing studies that evaluated the positive predictive value (PPV) of this measure.9,12,21 A study of 28 Veteran’s Affairs hospitals from 2003 to 2007 used the AHRQ version 3 software to assess the PPV of PSI-12. Out of the 112 cases flagged by the AHRQ PSI software, only 48 were true events of postoperative DVT, yielding a PPV of only 43%. False-positive results were primarily patients with VTE present on admission and cases that were diagnosed after admission but prior to the index procedure. They also noted that coding inaccuracies were present in 38% of cases.9 Similarly, Henderson et al. conducted a retrospective review of 112 postsurgical discharges noting a PPV of 54%, with most false-positives resulting from superficial clots identified by PSI-12 related to coding ambiguity.12 Our data similarly showed false-positive results as seven cases were excluded based on chart review and documentation correction, and 4.5% were preprocedural. However, there is some discordance with previous studies, as our data yields a PPV of 91% for VTE when accounting for preprocedural events as well as those excluded based on chart review. One explanation is an improvement in documentation strategies and coding, as our institution has adopted strategies to review cases and clarify documentation prior to billing to improve accuracy, and inclusion of a checkbox to indicate that a diagnosis was present on admission. Another possibility is improved accuracy with ICD-10 coding, as shown in a paper by Quan et al. that found a 79% PPV of PSI-12, which improved to 89% when cases present on admission were excluded.21 Lastly, we used newer versions of the AHRQ software, which could have improved the accuracy of detection. Despite these improvements in PSI-12 identifying true cases of postoperative VTE, as our data show, there is still much to be desired in terms of identifying issues with the quality of care and inclusion of PSI-12 in pay-for-performance.
Our study has several limitations. As a retrospective review, a major limiting factor is that data obtained are subject to the accuracy of documentation within the provider and nursing notes. As such, we focused on broad topics such as VTE events, the type of VTE event, and timing of the event in relation to admission and procedure. We actively review cases at discharge prior to billing to correct documentation if required. However, a prolonged hospital stay could lead to a review of the case weeks to months later. A real-time alert for a VTE event in a patient with surgery could improve documentation.
Further, although mechanical only prophylaxis was present on chart review, it is impossible to know both the rate of compliance with this method and whether it contributed to some events.
Despite these limitations, our goals of evaluating the validity of PSI-12 and identifying areas for improved measurement and techniques for DVT prophylaxis were met. As previously discussed, our data suggest that PSI-12 has several limitations in identifying quality of care issues with the prevention of DVT. For example, PSI-12 included many cases in which pharmacologic prophylaxis was appropriately not given. Approximately 50% of cases occurred in patients who were thrombocytopenic (platelets < 100,000), and 29% of events occurred in trauma patients. In addition, 33% of cases identified were within three days of the procedure, which, in cases of high-bleeding risk procedures, is an appropriate time to refrain from pharmacologic anticoagulation.13 In cases such as these, it may be worth evaluating alternative forms of mechanical only prophylaxis, or other strategies to mitigate this risk.
This study also highlights areas for further research. Many of the VTE events in this study occurred while patients were treated with appropriate prophylaxis, as other studies have also shown.22,23 Gangireddy et al. looked at demographic and clinical information surrounding postoperative VTE and found several other risk factors that incur a higher risk of VTE, including steroid use, infections, and myocardial infarction.24 Perhaps future studies could target these groups as potential points for increased prophylactic strategies. As noted by Lau et al. appropriate VTE prophylaxis involves risk stratification, ordering the appropriate prophylaxis by clinicians, patient acceptance of prescribed therapy, and nursing administration of prescribed therapy.25 As exemplified by our data, despite appropriate prophylaxis being ordered, eight events were associated solely with the refusal of pharmacologic prophylaxis. An ideal VTE metric would identify patients with a VTE who had a defective VTE prophylactic process,25 but the cost associated with manual data abstraction may limit the inclusion of a process metric into pay-for-performance. Additional research also needs to identify whether modifications to PSI-12 can improve its accuracy and predictive value, such as the exclusion of VTE prior to a procedure, modifications to what counts as a procedure, or utilizing markers to assess adherence to VTE prophylactic rates. These points are especially important to consider if PSI-12 is to remain as one of the key factors in pay-for-performance outcome measures. Lastly, understanding the effectiveness and patient adherence to oral VTE prophylactic regimens could also decrease the rates of refusal of VTE prophylaxis.
Overall, VTE remains a large contributor to morbidity and mortality among hospitalized surgical patients. While there is utility in PSI-12 as a screening tool to identify these events and potential areas for improved processes to decrease VTE, its usefulness for detection of true quality issues and its utilization in pay-for-performance is questionable. The universally high rates of VTE prophylaxis question the need for a VTE prophylactic metric. However, if these metrics are going to continue to be used in determining payments, modifications to the current processes and algorithms are needed to improve accuracy in identifying issues in quality of care.
1. Valsami S, Asmis LM. A brief review of 50 years of perioperative thrombosis and hemostasis management. Semin Hematol. 2013;50(2):79-87. https://doi.org/10.1053/j.seminhematol.2013.04.001.
2. Collins R, Scrimgeour A, Yusuf S, Peto R. Reduction in fatal pulmonary embolism and venous thrombosis by perioperative administration of subcutaneous heparin. N Engl J Med. 1988;318(18):1162-1173. https://doi.org/10.1056/NEJM198805053181805.
3. Heit JA, Crusan DJ, Ashrani AA, Petterson TM, Bailey KR. Effect of a near-universal hospitalization-based prophylaxis regimen on annual number of venous thromboembolism events in the US. Blood. 2017;130(2):109-114. https://doi.org/10.1182/blood-2016-12-758995.
4. Landrigan CP, Parry GJ, Bones CB, Hackbarth AD, Goldmann DA, Sharek PJ. Temporal trends in rates of patient harm resulting from medical care. N Engl J Med. 2010;363(22):2124-2134. https://doi.org/10.1056/NEJMsa1004404.
5. Agency for Healthcare Research and Quality. Patient Safety Indicators Brochure. 2015 Edition. https://www.qualityindicators.ahrq.gov/Downloads/Modules/PSI/V50/PSI_Brochure.pdf. Accessed 10 Jun 2019.
6. Centers for Medicare & Medicaid Services. CMS Hospital Value-Based Purchasing Program Results for Fiscal Year 2018. 2017. https://www.cms.gov/newsroom/fact-sheets/cms-hospital-value-based-purchasing-program-results-fiscal-year-2018. Accessed June 10, 2019.
7. Rajaram R, Barnard C, Bilimoria KY. Concerns about using the patient safety indicator-90 composite in pay-for-performance programs. JAMA. 2015;313(9):897-898. https://doi.org/10.1001/jamacardio.2018.2382.
8. Agency for Healthcare Research and Quality. Patient Safety Indicator 12 (PSI 12) Perioperative Pulmonary Embolism or Deep Vein Thrombosis Rate. 2017. https://www.qualityindicators.ahrq.gov/Downloads/Modules/PSI/V60-ICD09/TechSpecs/PSI_12_Perioperative_Pulmonary_Embolism_or_Deep_Vein_Thrombosis_Rate.pdf. Accessed June 9, 2019.
9. Kaafarani HM, Borzecki AM, Itani KM, et al. Validity of selected patient safety indicators: opportunities and concerns. J Am Coll Surg. 2011;212(6):924-934. https://doi.org/10.1016/j.jamcollsurg.2010.07.007.
10. Bilimoria KY, Chung J, Ju MH, et al. Evaluation of surveillance bias and the validity of the venous thromboembolism quality measure. JAMA. 2013;310(14):1482-1489. https://doi.org/10.1001/jama.2013.280048.
11. Blay E, Jr., Huang R, Chung JW, et al. Evaluating the impact of the venous thromboembolism outcome measure on the PSI 90 composite quality metric. Jt Comm J Qual Patient Saf. 2019;45(3):148-155. https://doi.org/10.1016/j.jcjq.2018.08.009
12. Henderson KE, Recktenwald A, Reichley RM, et al. Clinical validation of the AHRQ postoperative venous thromboembolism patient safety indicator. Jt Comm J Qual Patient Saf. 2009;35(7):370-376.
13. Douketis JD, Spyropoulos AC, Spencer FA, et al. Perioperative management of antithrombotic therapy: antithrombotic therapy and prevention of thrombosis, 9th ed: American College of Chest Physicians Evidence-Based Clinical Practice Guidelines. Chest. 2012;141(2):e326S-e350S. https://doi.org/10.1378/chest.11-2298.
14. Agency for Healthcare Research and Quality. Appendix E: Surgical Discharge MS-DRGs. 2018. https://www.qualityindicators.ahrq.gov/Downloads/Modules/PSI/V2018/TechSpecs/PSI_Appendix_E.pdf. Accessed June 9, 2019.
15. Anderson FA, Jr., Spencer FA. Risk factors for venous thromboembolism. Circulation. 2003;107(23 Suppl 1):I9-16. https://doi.org/10.1161/01.CIR.0000078469.07362.E6.
16. Caprini JA. Thrombosis risk assessment as a guide to quality patient care. Dis Mon. 2005;51(2-3):70-78. https://doi.org/10.1016/j.disamonth.2005.02.003.
17. Agency for Healthcare Research and Quality. Appendix A: Operating Room Procedure Codes. 2018. https://www.qualityindicators.ahrq.gov/Downloads/Modules/PSI/V2018/TechSpecs/PSI_Appendix_A.pdf. Accessed June 9, 2019
18. Silverstein MD, Heit JA, Mohr DN, Petterson TM, O’Fallon WM, Melton LJ, 3rd. Trends in the incidence of deep vein thrombosis and pulmonary embolism: a 25-year population-based study. Arch Intern Med. 1998;158(6):585-593. https://doi.org/10.1001/archinte.158.6.585.
19. Borzecki AM, Chen Q, O’Brien W, et al. The patient safety indicator perioperative pulmonary embolism or deep vein thrombosis: is there associated surveillance bias in the veterans health administration? Am J Surg. 2018;216(5):974-979. https://doi.org/10.1016/j.amjsurg.2018.06.023.
20. Carrier M, Righini M, Wells PS, et al. Subsegmental pulmonary embolism diagnosed by computed tomography: incidence and clinical implications. A systematic review and meta-analysis of the management outcome studies. J Thromb Haemost. 2010;8(8):1716-1722. https://doi.org/10.1111/j.1538-7836.2010.03938.x.
21. Quan H, Eastwood C, Cunningham CT, et al. Validity of AHRQ patient safety indicators derived from ICD-10 hospital discharge abstract data (chart review study). BMJ Open. 2013;3(10):e003716. https://doi.org/10.1136/bmjopen-2013-003716.
22. Flanders SA, Greene MT, Grant P, et al. Hospital performance for pharmacologic venous thromboembolism prophylaxis and rate of venous thromboembolism: a cohort study. JAMA Intern Med. 2014;174(10):1577-1584. https://doi.org/10.1001/jamainternmed.2014.3384.
23. Wang TF, Wong CA, Milligan PE, Thoelke MS, Woeltje KF, Gage BF. Risk factors for inpatient venous thromboembolism despite thromboprophylaxis. Thromb Res. 2014;133(1):25-29. https://doi.org/10.1016/j.thromres.2013.09.011.
24. Gangireddy C, Rectenwald JR, Upchurch GR, et al. Risk factors and clinical impact of postoperative symptomatic venous thromboembolism. J Vass Surg. 2007;45(2):335-341; discussion 341-332. https://doi.org/10.1016/j.jvs.2006.10.034.
25. Lau BD, Streiff MB, Pronovost PJ, Haut ER. Venous thromboembolism quality measures fail to accurately measure quality. Circulation. 2018;137(12):1278-1284. https://doi.org/10.1161/CIRCULATIONAHA.116.026897.
© 2019 Society of Hospital Medicine
Variation in Readmission Rates by EDs
Readmissions of Medicare beneficiaries within 30 days of discharge are frequent and costly.[1] Concern about readmissions has prompted the Centers for Medicare & Medicaid Services (CMS) to reduce payments to hospitals with excess readmissions.[2] Research has identified a number of patient clinical and socio‐demographic factors associated with readmissions.[3] However, interventions designed to reduce readmissions have met with limited success. In a systematic review, no single intervention was regularly effective in reducing readmissions, despite the fact that interventions have targeted both predischarge, transition of care, and postdischarge processes of care.[4]
The different trajectories of care experienced by patients after hospital discharge, and their effect on risk of readmission, have been incompletely studied. Although early outpatient follow‐up after discharge is associated with lower readmission rates,[5, 6] a factor that has been minimally studied is the role of the emergency department (ED) and the ED provider in readmissions. The ED and ED providers feature prominently in the care received by patients shortly after discharge from a hospital. About a quarter of all hospitalized Medicare patients are evaluated in an ED within 30 days of discharge,[7, 8] and a majority of readmissions within 30 days of discharge are precipitated by an ED visit.[9] Hence, we asked whether when a recently discharged patient is seen in an ED, does the rate of readmission vary by ED provider and by ED facility?
We used Texas Medicare claims data to examine patients visiting the ED within 30 days of discharge from an initial hospitalization to determine if their risk of readmission varies by the ED provider caring for them and by the ED facility they visit.
METHODS
Sources of Data
We used claims from the years 2007 to 2011 for 100% of Texas Medicare beneficiaries, including Medicare beneficiary summary files, Medicare Provider Analysis and Review (MedPAR) files, Outpatient Standard Analytical Files (OutSAF), and Medicare Carrier files. We obtained diagnosis‐related group associated information, including weights, and Major Diagnostic Category from CMS, and used Provider of Services files to determine facility characteristics.
Establishment of the Study Cohort
From 2008 through 2011 MedPAR files, we initially selected all hospital discharges from acute‐care hospitals in Texas. From these 3,191,160 admissions, we excluded those discharged dead or transferred to other acute‐care hospitals (N=230,343), those who were younger than 66 years at admission (N=736,685) and those without complete Parts A and B enrollment or with any health maintenance organization enrollment in the 12 months prior to and 2 months after the admission of interest (N=596,427). From the remaining 1,627,705 discharges, we identified 302,949 discharges that were followed by at least 1 ED visit within 30 days.
We applied the algorithm developed by Kaskie et al. to identify ED visits.[10] We identified claims for ED services with Current Procedural Terminology (CPT) codes 99281‐99285 from Carrier files and bundled claims with overlapping dates or those that were within 1 day of each other. Then we identified claims for ED services using the same CPT codes from OutSAF and bundled those with overlapping dates or those that were within 3 days of each other. Finally, we bundled Carrier and OutSAF claims with overlapping dates and defined them as the same ED visit. From these, we retained only the first ED visit. We excluded those receiving care from multiple ED providers during the ED visit (N=38,565), and those who had a readmission before the first ED visit (N=1436), leaving 262,948 ED visits. For patients who had more than 1 hospitalization followed by an ED visit in a given year, we selected the first hospitalization, resulting in 199,143 ED visits. We then selected ED providers associated with at least 30 ED visits in this cohort, resulting in 1922 ED providers and 174,209 ED visits. For analyses where we examined both ED provider and facility variation in admission rates, we eliminated ED providers that generated charges from more than 1 ED facility, resulting in 525 providers and 48,883 ED visits at 143 ED facilities.
Measures
Patient Characteristics
We categorized beneficiaries by age, gender, and ethnicity using Medicare beneficiary summary files. We used the Medicaid indicator as a proxy of low socioeconomic status. We obtained information on weekend admission, emergent admission, discharge destination, and diagnosis‐related groupt (DRG) from MedPAR files. We identified comorbidities using the claims from MedPAR, Carrier, and OutSAF files in the year prior to the admission.[11] We identified total hospitalizations and outpatient visits in the prior year from MedPAR files and Carrier files, respectively. We obtained education status at the level of zip code of residence from the 2011 American Community Survey estimates from the United States Census Bureau. We determined urban or rural residence using the 2013 Rural‐Urban Continuum Codes developed by the United States Department of Agriculture.
ED Facility Characteristics
We used the provider number of the ED facility to link to the Provider of Services files and obtained information on medical school affiliation, facility size, and for profit status.
Study Outcomes
The outcome of this study was readmission after an ED visit within 30 days of discharge from an initial hospitalization. We defined readmission after an ED visit as a hospitalization starting the day of or the day following the ED visit
Statistical Analyses
We performed 2‐level analyses where patients were clustered with ED providers to examine variation among ED providers. The effect of ED providers was modeled as a random effect to account for the correlation among the patients cared for by the same ED provider. We derived ED provider‐specific estimates from models adjusted for patient age, gender, race/ethnicity, rural or urban residence, Medicaid eligibility, education at the zip code level of residence, and characteristics of the initial admission (emergency admission, weekend admission, discharge destination, its major diagnostic category and DRG weight). We also adjusted for comorbidities, number of hospitalizations, and number of physician visits in the year before the initial admission.
We also conducted 2‐level analyses where patients were nested in ED facilities and 3‐level analyses where patients were nested in ED providers and ED providers were nested in ED facilities. We adjusted for all factors described above. We computed the change in the variance between 2‐level and 2‐level analyses to determine the variation in readmission rates that was explained by the ED provider and the ED facility. All analyses were performed with SAS version 9.2 (SAS Institute Inc., Cary, NC).
RESULTS
We identified 174,209 patients who visited an ED within 30 days of discharge from an initial hospitalization. Table 1 describes the characteristics of these patients as well as the readmission rates associated with these characteristics. The rate of readmission of our cohort of 1,627,705 discharges with or without a following ED visit was 16.2%, whereas the rate of readmission following an ED visit in our final cohort of 174,209 patients was 52.67%. This readmission rate increased with age, from 49.31% for patients between 66 and 70 years of age to 55.33% for patients older than 85 years. There were minor variations by gender and ethnicity. Patients residing in metropolitan areas or in zip codes with low education levels had higher readmission rates, as did those whose original admission was classified as emergency or those who were not discharged home.
| Patient Characteristic | No. of ED Visits (%) | % Readmitted | Odds Ratio (95% CI)a |
|---|---|---|---|
| MeanSD, Median (Q1Q3) | Odds Ratio (95% CI)a | ||
| |||
| Overall | 174,209 (100) | 52.67 | |
| Age, y | |||
| 6670 | 32,962 (18.92) | 49.31 | 1.00 |
| 7175 | 34,979 (20.08) | 51.48 | 1.10 (1.06‐1.13)b |
| 7680 | 36,728 (21.08) | 53.01 | 1.15 (1.12‐1.19)b |
| 8185 | 34,784 (19.97) | 54.05 | 1.19 (1.15‐1.23)b |
| >85 | 34,756 (19.95) | 55.33 | 1.25 (1.21‐1.29)b |
| Gender | |||
| Male | 71,049 (40.78) | 52.95 | 1.02 (1.00‐1.04) |
| Female | 103,160 (59.22) | 52.48 | 1.00 |
| Race | |||
| Non‐Hispanic white | 124,312 (71.36) | 52.77 | 1.00 |
| Black | 16,809 (9.65) | 51.45 | 0.84 (0.81‐0.87)b |
| Hispanic | 30,618 (17.58) | 52.70 | 0.88 (0.85‐0.91)b |
| Other | 2,470 (1.42) | 55.71 | 1.06 (0.97‐1.15) |
| Rural/urban residence | |||
| Metropolitan | 136,739 (78.49) | 53.88 | 1.00 |
| Nonmetropolitan | 35,000 (20.09) | 48.16 | 0.96 (0.93‐0.99)b |
| Rural | 2,448 (1.41) | 50.04 | 1.04 (0.95‐1.13) |
| Medicaid eligible | |||
| No | 128,909 (74.00) | 52.65 | 1.00 |
| Yes | 45,300 (26.00) | 52.72 | 0.97 (0.94‐0.99)b |
| Education levelc | |||
| 1st quartile (lowest) | 43,863 (25.18) | 54.61 | 1.00 |
| 2nd quartile | 43,316 (24.86) | 53.92 | 1.00 (0.97‐1.03) |
| 3rd quartile | 43,571 (25.01) | 50.72 | 0.99 (0.96‐1.02) |
| 4th quartile (highest) | 43,318 (24.87) | 51.98 | 1.01 (0.97‐1.04) |
| Emergency admission | |||
| No | 99,101 (56.89) | 51.15 | 1.00 |
| Yes | 75,108 (43.11) | 54.68 | 1.07 (1.05‐1.09)b |
| Weekend admission | |||
| No | 131,266 (75.35) | 52.45 | 1.00 |
| Yes | 42,943 (24.65) | 53.35 | 1.01 (0.99‐1.04) |
| Discharge destination | |||
| Home | 122,542 (70.34) | 50.90 | 1.00 |
| Inpatient rehabilitation facility | 9,512 (5.46) | 55.48 | 1.31 (1.25‐1.37)b |
| Skilled nursing facility | 37,248 (21.38) | 57.25 | 1.29 (1.26‐1.33)b |
| Other | 4,907 (2.82) | 56.88 | 1.14 (1.07‐1.21)b |
| DRG weight (per unit) | 1.561.27, 0.82 (1.16‐1.83) | 1.06 (1.05‐1.07)b | |
| Hospitalization in the prior year (per hospitalization) | 1.031.49, 0.00 (1.00‐2.00) | 1.04 (1.03‐1.04)b | |
| Physician visits in the prior year (per 10 visits) | 11.759.80, 5.00 (10.00‐17.00) | 0.97 (0.96‐0.98)b | |
Table 1 also presents the odds of readmission adjusted for all other factors in the table and also adjusted for clustering within ED providers in a 2‐level model. Increasing age, white race, metropolitan residence, nonhome discharge, higher severity of illness, more hospitalizations in the prior year, fewer physician visits in the prior year, and an emergency initial admission were each associated with a higher readmission rate.
We next generated estimates of readmission rates for each ED provider from the adjusted 2‐level models. Figure 1 shows the adjusted cumulative readmission rates for the 1922 ED providers. This figure shows the mean value and 95% confidence intervals of the readmission rates for each provider. Dark vertical lines indicate providers whose readmission rate differed significantly from the mean adjusted readmission rate of 52.1% for all providers. Of the ED providers, 14.2% had significantly higher readmission rates. The mean readmission rate for these 272 providers was 67.2%. Of the ED providers, 14.7% had significantly lower readmission rates. The mean readmission rate for these 283 providers was 36.8%.

To determine the contribution of the ED facility to the variation in readmission rates, we restricted our analysis to 48,883 patients (28.06% of our cohort) seen by 525 ED providers who were associated with only 1 facility (total of 143 facilities). Table 2 describes the unadjusted readmission rates stratified by specific characteristics of those facilities. The unadjusted readmission rate increased with the size of the associated hospital, from 47.61% for hospitals with less than 100 beds to 57.06% for hospitals with more than 400 beds. The readmission rate for nonprofit facilities was 53.81% and for for‐profit facilities was 57.39%. Facilities with no medical school affiliation had a readmission rate of 54.51%, whereas those with a major affiliation had a readmission rate of 58.72%.
| ED Facility Characteristic | No. of ED Visits (%) | % Readmitted | Odds Ratio (95% CI)a |
|---|---|---|---|
| |||
| Overall | 48,883 | ||
| Total beds | |||
| 100 | 3,936 (8.05) | 47.61 | 1.00 |
| 101200 | 6,251 (12.79) | 52.07 | 1.38 (1.06‐1.81)b |
| 201400 | 13,000 (26.59) | 56.26 | 1.69 (1.32‐2.17)b |
| >400 | 25,696 (52.57) | 57.06 | 1.77 (1.35‐2.33)b |
| Type of control | |||
| Nonprofit | 24,999 (51.14) | 53.81 | 1.00 |
| Proprietary | 17,108 (35.00) | 57.39 | 1.32 (1.09‐1.61)b |
| Government | 6,776 (13.86) | 56.60 | 1.11 (0.88‐1.41) |
| Medical school affiliation | |||
| Major | 6,487 (13.27) | 58.72 | 1.00 |
| Limited | 7,066 (14.45) | 56.37 | 0.85 (0.58‐1.25) |
| Graduate | 3,164 (6.47) | 56.19 | 0.71 (0.44‐1.15) |
| No affiliation | 32,166 (65.80) | 54.51 | 0.78 (0.57‐1.05) |
| If the same hospital patient was discharged from | |||
| Yes | 38,532 (78.82) | 55.64 | 0.96 (0.91‐1.00) |
| No | 10,351 (21.18) | 54.73 | 1.00 |
With this smaller cohort, we performed 2 types of 2‐level models, where patients clustered within ED facilities and ER providers, respectively, and a 3‐level model accounting for clustering of patients within providers and of providers within facilities. From the facility‐patient 2‐level model, the variance of the ED facility was 0.2718 (95% confidence interval [CI]: 0.2083‐0.3696). From the provider‐patient 2‐level model, the variance of ED provider was 0.2532 (95% CI: 0.2166‐0.3002). However, when the 3‐level model was performed, the variance of ED provider decreased to 0.0893 (95% CI: 0.0723‐0.1132) and the variance of ED facility dropped to 0.2316 (95% CI: 0.1704‐0.3331) . This indicates 65% of the variation among ED providers was explained by the ED facility, and in contrast, 15% of the variation among ED facilities was explained by ED providers.
Table 2 also shows the adjusted odds of readmission generated from the 3‐level model. Patients receiving care in ED facilities in hospitals with more beds and in for‐profit hospitals were at higher risk for readmission. It is possible that patients seen at the ED associated with the discharging hospital had a lower risk of readmission. This finding was close to being statistically significant (P=0.051).
We repeated all the above analyses using an outcome of readmission anytime between the ED visit and 30 days after discharge from the initial hospitalization (rather than readmission on the day of or after the ED visit). All analyses produced results similar to the results presented above. For example, Figure 2 shows the adjusted cumulative readmission rates for the 1922 ED providers using this outcome. Of the ED providers, 12.8% had higher and 12.5% had lower readmission rates as compared to the mean readmission rate for all ED providers. The Spearman correlation coefficient between the rank of ED providers in immediate readmission rate (Figure 1) and readmission rate within 30 days of hospital discharge (Figure 2) was 0.94 (P<0.001).
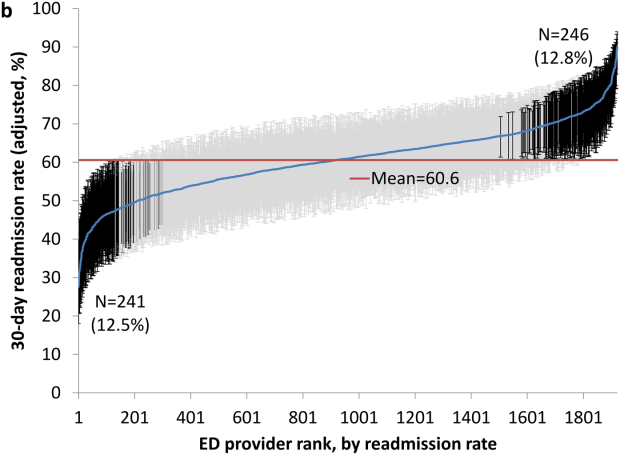
DISCUSSION
This study found substantial variation in readmission rates by ED provider, despite controlling for patient clinical and sociodemographic factors. In 3‐level models, the ED facility explained a substantial part of the variation by ED provider, with patients seen at larger facilities and for‐profit facilities having higher readmission rates.
Variation among ED facilities and ED providers in readmission rates has not previously been studied. There is literature on the variation in ED facility and ED provider admission rates. As readmissions are a subset of all admissions, this literature provides context to our findings. Abualenain et al. examined admission rates for 89 ED physicians for adult patients presenting with an acute medical or surgical complaint at 3 EDs in a health system.[12] After adjusting for patient and clinical characteristics, admission rates varied from 21% to 49% among physicians and from 27% to 41% among 3 facilities. Two other studies from single hospitals have found similar variation among providers.[13, 14] The reasons for the variation among ED providers presumably relate to subjective aspects of clinical assessment and the reluctance of providers to rely solely on objective scales, even when they are available.[14, 15] Variation in admission rates among different facilities may relate to clustering of providers with similar practice styles within facilities, lack of clinical guidelines for certain conditions, as well as differences among facilities in the socioeconomic status and access to primary care of their clientele.[12, 16, 17] For example, Pines et al. have shown that ED facility admission rates are higher in communities with fewer primary care physicians per capita and are influenced by the prevailing county level admission rates.[16] Capp et al. showed persistent variation in admission rates across hospitals, despite adjusting for clinical criteria such as vital signs, chief complaints, and severity of illness.[18]
Structural differences in ED facilities may also influence the decision to admit. We found that patients visiting ED facilities in hospitals with more beds had a higher readmission rate. ED facility systems of care such as observation units or protocols are associated with lower admission rates.[19, 20] Finally, certain hospitals may actively influence the admission practice patterns of their ED providers. We noted that patients seen at for‐profit ED facilities had a greater risk of readmission. A similar finding has been described by Pines et al., who noted higher admission rates at for‐profit facilities.[16] In an extreme example, a recent Justice Department lawsuit alleged that a for‐profit hospital chain used software systems and financial incentives to ED providers to increase admissions.[21]
It is possible that the providers with low readmission rates may have inappropriately released patients who truly should have been admitted. A signal that this occurred would be if these patients were readmitted in the days after the ED visits. We examined this possibility by additionally examining readmissions occurring anytime between the ED visit until 30 days after discharge from the initial hospitalization. The results were similar to when we only included readmissions that occurred immediately following the ED visit, with a very high correlation (r=0.94) between the ranking of the ED providers by readmission rates in both circumstances. This suggests that the decisions of the ED providers with low readmission rates to admit or release from the ED were likely appropriate.
Our research has limitations. We studied patients with fee‐for‐service Medicare in a single large state in the United States over a 4‐year period. Our findings may not be generalizable to younger patient populations, other regions with different sociodemographic patterns and healthcare systems, or other time periods. We could not control for many factors that may impact the risk of readmission but are not measured in Medicare databases (eg, clinical data such as vital signs, measures of quality of transition from discharging hospital, ED provider workload). To attribute care to a single ED provider, we excluded patients who were taken care of by multiple ED providers. These patients may have different needs from our study population (eg, more complex issues and longer stays in the ED) and may bias our results.
This study provides a new direction for research and quality improvement targeting readmissions. Research should extend beyond the discharge transition and examine the entire trajectory of posthospitalization care to better understand readmissions. Based directly on this study, research could investigate the practice patterns of ED providers and systems of care at ED facilities that affect readmissions rates. Such investigation could inform quality improvement efforts to standardize care for patients in the ED.
CMS policies hold hospitals accountable for readmissions of the patients they discharge, but do not address the admission process in the ED that leads to readmissions of recently discharged patients. Given the present study, and the fact that the proportion of all hospital admissions that occur through the ED has grown to 44%,[22] consideration of the role of the ED in public policy efforts to discourage unnecessary inpatient care may be appropriate.
In summary, this study shows that a recently discharged patient's chances of being readmitted depends partly on the ED provider who evaluates them and on the ED facility at which they seek care. ED provider practice patterns and ED facility systems of care may be a target for interventions aimed at decreasing readmission rates.
Disclosures
This research was supported by grants from the National Institutes of Health (AG033134 and K05CA134923) and from the Agency for Healthcare Research and Quality (R24H5022134). The authors report no conflicts of interest.
- , , Rehospitalizations among patients in the Medicare Fee‐for‐Service Program. N Engl J Med. 2009;360:1418–1428.
- Centers for Medicare 306:1688–1698.
- , , , , Interventions to reduce 30‐day rehospitalization: a systematic review. Ann Intern Med. 2011;155:520–528.
- , , , , Outpatient follow‐up visit and 30‐day emergency department visit and readmission in patients hospitalized for chronic obstructive pulmonary disease. Arch Intern Med. 2010;170:1664–1670.
- , , , et al. Relationship between early physician follow‐up and 30‐day readmission among Medicare beneficiaries hospitalized for heart failure. JAMA. 2010;303:1716–1722.
- , , After hospitalization: a Dartmouth Atlas report on post‐acute care for Medicare beneficiaries. Dartmouth Atlas website. Available at: www.dartmouthatlas.org/downloads/reports/Post_discharge_events_092811.pdf. Accessed August 8, 2013.
- , , , Emergency department visits after hospital discharge: a missing part of the equation. Ann Emerg Med. 2013;62:145–150.
- , , , Emergency department visits after surgery are common for Medicare patients, suggesting opportunities to improve care. Health Aff (Millwood). 2013;32:1600–1607.
- , , , et al. Defining emergency department episodes by severity and intensity: a 15‐year study of Medicare beneficiaries. BMC Health Serv Res. 2010;10:1–13.
- , , , Comorbidity measures for use with administrative data. Med Care. 1998;36:8–27.
- , , , , , Emergency department physician‐level and hospital‐level variation in admission rates. Ann Emerg Med. 2013;61:638–643.
- , , , et al. Hospital admission decision for patients with community‐acquired pneumonia: variability among physicians in an emergency department. Ann Emerg Med. 2012;59:35–41.
- , , Individual emergency physician admission rates: predictably unpredictable. CJEM. 2009;11(2):149–155.
- , , , , , Reasons why emergency department providers do not rely on the pneumonia severity index to determine the initial site of treatment for patients with pneumonia. Clin Infect Dis. 2009;49:e100–e108.
- , , Variation in emergency department admission rates across the United States. Med Care Res Rev. 2013;70:218–231.
- , , , , , Variation in US hospital emergency department admission rates by clinical condition. Med Care. 2015;53:237–244.
- , , , et al. Hospital variation in risk‐standardized hospital admission rates from US EDs among adults. Am J Emerg Med. 2014;32:837–843.
- , , The effect of an observation unit on the rate of ED admission and discharge for pyelonephritis. Am J Emerg Med. 2010;28:682–688.
- , , , , , Protocol‐driven emergency department observation units offer savings, shorter stays, and reduced admissions. Health Aff (Millwood). 2013;32:2149–2156.
- , Hospital chain said to scheme to inflate bills. New York Times. January 23, 2014. Available at: http://www.nytimes.com/2014/01/24/business/hospital‐chain‐said‐to‐scheme‐to‐inflate‐bills.html?emc=eta1367:391–393.
Readmissions of Medicare beneficiaries within 30 days of discharge are frequent and costly.[1] Concern about readmissions has prompted the Centers for Medicare & Medicaid Services (CMS) to reduce payments to hospitals with excess readmissions.[2] Research has identified a number of patient clinical and socio‐demographic factors associated with readmissions.[3] However, interventions designed to reduce readmissions have met with limited success. In a systematic review, no single intervention was regularly effective in reducing readmissions, despite the fact that interventions have targeted both predischarge, transition of care, and postdischarge processes of care.[4]
The different trajectories of care experienced by patients after hospital discharge, and their effect on risk of readmission, have been incompletely studied. Although early outpatient follow‐up after discharge is associated with lower readmission rates,[5, 6] a factor that has been minimally studied is the role of the emergency department (ED) and the ED provider in readmissions. The ED and ED providers feature prominently in the care received by patients shortly after discharge from a hospital. About a quarter of all hospitalized Medicare patients are evaluated in an ED within 30 days of discharge,[7, 8] and a majority of readmissions within 30 days of discharge are precipitated by an ED visit.[9] Hence, we asked whether when a recently discharged patient is seen in an ED, does the rate of readmission vary by ED provider and by ED facility?
We used Texas Medicare claims data to examine patients visiting the ED within 30 days of discharge from an initial hospitalization to determine if their risk of readmission varies by the ED provider caring for them and by the ED facility they visit.
METHODS
Sources of Data
We used claims from the years 2007 to 2011 for 100% of Texas Medicare beneficiaries, including Medicare beneficiary summary files, Medicare Provider Analysis and Review (MedPAR) files, Outpatient Standard Analytical Files (OutSAF), and Medicare Carrier files. We obtained diagnosis‐related group associated information, including weights, and Major Diagnostic Category from CMS, and used Provider of Services files to determine facility characteristics.
Establishment of the Study Cohort
From 2008 through 2011 MedPAR files, we initially selected all hospital discharges from acute‐care hospitals in Texas. From these 3,191,160 admissions, we excluded those discharged dead or transferred to other acute‐care hospitals (N=230,343), those who were younger than 66 years at admission (N=736,685) and those without complete Parts A and B enrollment or with any health maintenance organization enrollment in the 12 months prior to and 2 months after the admission of interest (N=596,427). From the remaining 1,627,705 discharges, we identified 302,949 discharges that were followed by at least 1 ED visit within 30 days.
We applied the algorithm developed by Kaskie et al. to identify ED visits.[10] We identified claims for ED services with Current Procedural Terminology (CPT) codes 99281‐99285 from Carrier files and bundled claims with overlapping dates or those that were within 1 day of each other. Then we identified claims for ED services using the same CPT codes from OutSAF and bundled those with overlapping dates or those that were within 3 days of each other. Finally, we bundled Carrier and OutSAF claims with overlapping dates and defined them as the same ED visit. From these, we retained only the first ED visit. We excluded those receiving care from multiple ED providers during the ED visit (N=38,565), and those who had a readmission before the first ED visit (N=1436), leaving 262,948 ED visits. For patients who had more than 1 hospitalization followed by an ED visit in a given year, we selected the first hospitalization, resulting in 199,143 ED visits. We then selected ED providers associated with at least 30 ED visits in this cohort, resulting in 1922 ED providers and 174,209 ED visits. For analyses where we examined both ED provider and facility variation in admission rates, we eliminated ED providers that generated charges from more than 1 ED facility, resulting in 525 providers and 48,883 ED visits at 143 ED facilities.
Measures
Patient Characteristics
We categorized beneficiaries by age, gender, and ethnicity using Medicare beneficiary summary files. We used the Medicaid indicator as a proxy of low socioeconomic status. We obtained information on weekend admission, emergent admission, discharge destination, and diagnosis‐related groupt (DRG) from MedPAR files. We identified comorbidities using the claims from MedPAR, Carrier, and OutSAF files in the year prior to the admission.[11] We identified total hospitalizations and outpatient visits in the prior year from MedPAR files and Carrier files, respectively. We obtained education status at the level of zip code of residence from the 2011 American Community Survey estimates from the United States Census Bureau. We determined urban or rural residence using the 2013 Rural‐Urban Continuum Codes developed by the United States Department of Agriculture.
ED Facility Characteristics
We used the provider number of the ED facility to link to the Provider of Services files and obtained information on medical school affiliation, facility size, and for profit status.
Study Outcomes
The outcome of this study was readmission after an ED visit within 30 days of discharge from an initial hospitalization. We defined readmission after an ED visit as a hospitalization starting the day of or the day following the ED visit
Statistical Analyses
We performed 2‐level analyses where patients were clustered with ED providers to examine variation among ED providers. The effect of ED providers was modeled as a random effect to account for the correlation among the patients cared for by the same ED provider. We derived ED provider‐specific estimates from models adjusted for patient age, gender, race/ethnicity, rural or urban residence, Medicaid eligibility, education at the zip code level of residence, and characteristics of the initial admission (emergency admission, weekend admission, discharge destination, its major diagnostic category and DRG weight). We also adjusted for comorbidities, number of hospitalizations, and number of physician visits in the year before the initial admission.
We also conducted 2‐level analyses where patients were nested in ED facilities and 3‐level analyses where patients were nested in ED providers and ED providers were nested in ED facilities. We adjusted for all factors described above. We computed the change in the variance between 2‐level and 2‐level analyses to determine the variation in readmission rates that was explained by the ED provider and the ED facility. All analyses were performed with SAS version 9.2 (SAS Institute Inc., Cary, NC).
RESULTS
We identified 174,209 patients who visited an ED within 30 days of discharge from an initial hospitalization. Table 1 describes the characteristics of these patients as well as the readmission rates associated with these characteristics. The rate of readmission of our cohort of 1,627,705 discharges with or without a following ED visit was 16.2%, whereas the rate of readmission following an ED visit in our final cohort of 174,209 patients was 52.67%. This readmission rate increased with age, from 49.31% for patients between 66 and 70 years of age to 55.33% for patients older than 85 years. There were minor variations by gender and ethnicity. Patients residing in metropolitan areas or in zip codes with low education levels had higher readmission rates, as did those whose original admission was classified as emergency or those who were not discharged home.
| Patient Characteristic | No. of ED Visits (%) | % Readmitted | Odds Ratio (95% CI)a |
|---|---|---|---|
| MeanSD, Median (Q1Q3) | Odds Ratio (95% CI)a | ||
| |||
| Overall | 174,209 (100) | 52.67 | |
| Age, y | |||
| 6670 | 32,962 (18.92) | 49.31 | 1.00 |
| 7175 | 34,979 (20.08) | 51.48 | 1.10 (1.06‐1.13)b |
| 7680 | 36,728 (21.08) | 53.01 | 1.15 (1.12‐1.19)b |
| 8185 | 34,784 (19.97) | 54.05 | 1.19 (1.15‐1.23)b |
| >85 | 34,756 (19.95) | 55.33 | 1.25 (1.21‐1.29)b |
| Gender | |||
| Male | 71,049 (40.78) | 52.95 | 1.02 (1.00‐1.04) |
| Female | 103,160 (59.22) | 52.48 | 1.00 |
| Race | |||
| Non‐Hispanic white | 124,312 (71.36) | 52.77 | 1.00 |
| Black | 16,809 (9.65) | 51.45 | 0.84 (0.81‐0.87)b |
| Hispanic | 30,618 (17.58) | 52.70 | 0.88 (0.85‐0.91)b |
| Other | 2,470 (1.42) | 55.71 | 1.06 (0.97‐1.15) |
| Rural/urban residence | |||
| Metropolitan | 136,739 (78.49) | 53.88 | 1.00 |
| Nonmetropolitan | 35,000 (20.09) | 48.16 | 0.96 (0.93‐0.99)b |
| Rural | 2,448 (1.41) | 50.04 | 1.04 (0.95‐1.13) |
| Medicaid eligible | |||
| No | 128,909 (74.00) | 52.65 | 1.00 |
| Yes | 45,300 (26.00) | 52.72 | 0.97 (0.94‐0.99)b |
| Education levelc | |||
| 1st quartile (lowest) | 43,863 (25.18) | 54.61 | 1.00 |
| 2nd quartile | 43,316 (24.86) | 53.92 | 1.00 (0.97‐1.03) |
| 3rd quartile | 43,571 (25.01) | 50.72 | 0.99 (0.96‐1.02) |
| 4th quartile (highest) | 43,318 (24.87) | 51.98 | 1.01 (0.97‐1.04) |
| Emergency admission | |||
| No | 99,101 (56.89) | 51.15 | 1.00 |
| Yes | 75,108 (43.11) | 54.68 | 1.07 (1.05‐1.09)b |
| Weekend admission | |||
| No | 131,266 (75.35) | 52.45 | 1.00 |
| Yes | 42,943 (24.65) | 53.35 | 1.01 (0.99‐1.04) |
| Discharge destination | |||
| Home | 122,542 (70.34) | 50.90 | 1.00 |
| Inpatient rehabilitation facility | 9,512 (5.46) | 55.48 | 1.31 (1.25‐1.37)b |
| Skilled nursing facility | 37,248 (21.38) | 57.25 | 1.29 (1.26‐1.33)b |
| Other | 4,907 (2.82) | 56.88 | 1.14 (1.07‐1.21)b |
| DRG weight (per unit) | 1.561.27, 0.82 (1.16‐1.83) | 1.06 (1.05‐1.07)b | |
| Hospitalization in the prior year (per hospitalization) | 1.031.49, 0.00 (1.00‐2.00) | 1.04 (1.03‐1.04)b | |
| Physician visits in the prior year (per 10 visits) | 11.759.80, 5.00 (10.00‐17.00) | 0.97 (0.96‐0.98)b | |
Table 1 also presents the odds of readmission adjusted for all other factors in the table and also adjusted for clustering within ED providers in a 2‐level model. Increasing age, white race, metropolitan residence, nonhome discharge, higher severity of illness, more hospitalizations in the prior year, fewer physician visits in the prior year, and an emergency initial admission were each associated with a higher readmission rate.
We next generated estimates of readmission rates for each ED provider from the adjusted 2‐level models. Figure 1 shows the adjusted cumulative readmission rates for the 1922 ED providers. This figure shows the mean value and 95% confidence intervals of the readmission rates for each provider. Dark vertical lines indicate providers whose readmission rate differed significantly from the mean adjusted readmission rate of 52.1% for all providers. Of the ED providers, 14.2% had significantly higher readmission rates. The mean readmission rate for these 272 providers was 67.2%. Of the ED providers, 14.7% had significantly lower readmission rates. The mean readmission rate for these 283 providers was 36.8%.
To determine the contribution of the ED facility to the variation in readmission rates, we restricted our analysis to 48,883 patients (28.06% of our cohort) seen by 525 ED providers who were associated with only 1 facility (total of 143 facilities). Table 2 describes the unadjusted readmission rates stratified by specific characteristics of those facilities. The unadjusted readmission rate increased with the size of the associated hospital, from 47.61% for hospitals with less than 100 beds to 57.06% for hospitals with more than 400 beds. The readmission rate for nonprofit facilities was 53.81% and for for‐profit facilities was 57.39%. Facilities with no medical school affiliation had a readmission rate of 54.51%, whereas those with a major affiliation had a readmission rate of 58.72%.
| ED Facility Characteristic | No. of ED Visits (%) | % Readmitted | Odds Ratio (95% CI)a |
|---|---|---|---|
| |||
| Overall | 48,883 | ||
| Total beds | |||
| 100 | 3,936 (8.05) | 47.61 | 1.00 |
| 101200 | 6,251 (12.79) | 52.07 | 1.38 (1.06‐1.81)b |
| 201400 | 13,000 (26.59) | 56.26 | 1.69 (1.32‐2.17)b |
| >400 | 25,696 (52.57) | 57.06 | 1.77 (1.35‐2.33)b |
| Type of control | |||
| Nonprofit | 24,999 (51.14) | 53.81 | 1.00 |
| Proprietary | 17,108 (35.00) | 57.39 | 1.32 (1.09‐1.61)b |
| Government | 6,776 (13.86) | 56.60 | 1.11 (0.88‐1.41) |
| Medical school affiliation | |||
| Major | 6,487 (13.27) | 58.72 | 1.00 |
| Limited | 7,066 (14.45) | 56.37 | 0.85 (0.58‐1.25) |
| Graduate | 3,164 (6.47) | 56.19 | 0.71 (0.44‐1.15) |
| No affiliation | 32,166 (65.80) | 54.51 | 0.78 (0.57‐1.05) |
| If the same hospital patient was discharged from | |||
| Yes | 38,532 (78.82) | 55.64 | 0.96 (0.91‐1.00) |
| No | 10,351 (21.18) | 54.73 | 1.00 |
With this smaller cohort, we performed 2 types of 2‐level models, where patients clustered within ED facilities and ER providers, respectively, and a 3‐level model accounting for clustering of patients within providers and of providers within facilities. From the facility‐patient 2‐level model, the variance of the ED facility was 0.2718 (95% confidence interval [CI]: 0.2083‐0.3696). From the provider‐patient 2‐level model, the variance of ED provider was 0.2532 (95% CI: 0.2166‐0.3002). However, when the 3‐level model was performed, the variance of ED provider decreased to 0.0893 (95% CI: 0.0723‐0.1132) and the variance of ED facility dropped to 0.2316 (95% CI: 0.1704‐0.3331) . This indicates 65% of the variation among ED providers was explained by the ED facility, and in contrast, 15% of the variation among ED facilities was explained by ED providers.
Table 2 also shows the adjusted odds of readmission generated from the 3‐level model. Patients receiving care in ED facilities in hospitals with more beds and in for‐profit hospitals were at higher risk for readmission. It is possible that patients seen at the ED associated with the discharging hospital had a lower risk of readmission. This finding was close to being statistically significant (P=0.051).
We repeated all the above analyses using an outcome of readmission anytime between the ED visit and 30 days after discharge from the initial hospitalization (rather than readmission on the day of or after the ED visit). All analyses produced results similar to the results presented above. For example, Figure 2 shows the adjusted cumulative readmission rates for the 1922 ED providers using this outcome. Of the ED providers, 12.8% had higher and 12.5% had lower readmission rates as compared to the mean readmission rate for all ED providers. The Spearman correlation coefficient between the rank of ED providers in immediate readmission rate (Figure 1) and readmission rate within 30 days of hospital discharge (Figure 2) was 0.94 (P<0.001).
DISCUSSION
This study found substantial variation in readmission rates by ED provider, despite controlling for patient clinical and sociodemographic factors. In 3‐level models, the ED facility explained a substantial part of the variation by ED provider, with patients seen at larger facilities and for‐profit facilities having higher readmission rates.
Variation among ED facilities and ED providers in readmission rates has not previously been studied. There is literature on the variation in ED facility and ED provider admission rates. As readmissions are a subset of all admissions, this literature provides context to our findings. Abualenain et al. examined admission rates for 89 ED physicians for adult patients presenting with an acute medical or surgical complaint at 3 EDs in a health system.[12] After adjusting for patient and clinical characteristics, admission rates varied from 21% to 49% among physicians and from 27% to 41% among 3 facilities. Two other studies from single hospitals have found similar variation among providers.[13, 14] The reasons for the variation among ED providers presumably relate to subjective aspects of clinical assessment and the reluctance of providers to rely solely on objective scales, even when they are available.[14, 15] Variation in admission rates among different facilities may relate to clustering of providers with similar practice styles within facilities, lack of clinical guidelines for certain conditions, as well as differences among facilities in the socioeconomic status and access to primary care of their clientele.[12, 16, 17] For example, Pines et al. have shown that ED facility admission rates are higher in communities with fewer primary care physicians per capita and are influenced by the prevailing county level admission rates.[16] Capp et al. showed persistent variation in admission rates across hospitals, despite adjusting for clinical criteria such as vital signs, chief complaints, and severity of illness.[18]
Structural differences in ED facilities may also influence the decision to admit. We found that patients visiting ED facilities in hospitals with more beds had a higher readmission rate. ED facility systems of care such as observation units or protocols are associated with lower admission rates.[19, 20] Finally, certain hospitals may actively influence the admission practice patterns of their ED providers. We noted that patients seen at for‐profit ED facilities had a greater risk of readmission. A similar finding has been described by Pines et al., who noted higher admission rates at for‐profit facilities.[16] In an extreme example, a recent Justice Department lawsuit alleged that a for‐profit hospital chain used software systems and financial incentives to ED providers to increase admissions.[21]
It is possible that the providers with low readmission rates may have inappropriately released patients who truly should have been admitted. A signal that this occurred would be if these patients were readmitted in the days after the ED visits. We examined this possibility by additionally examining readmissions occurring anytime between the ED visit until 30 days after discharge from the initial hospitalization. The results were similar to when we only included readmissions that occurred immediately following the ED visit, with a very high correlation (r=0.94) between the ranking of the ED providers by readmission rates in both circumstances. This suggests that the decisions of the ED providers with low readmission rates to admit or release from the ED were likely appropriate.
Our research has limitations. We studied patients with fee‐for‐service Medicare in a single large state in the United States over a 4‐year period. Our findings may not be generalizable to younger patient populations, other regions with different sociodemographic patterns and healthcare systems, or other time periods. We could not control for many factors that may impact the risk of readmission but are not measured in Medicare databases (eg, clinical data such as vital signs, measures of quality of transition from discharging hospital, ED provider workload). To attribute care to a single ED provider, we excluded patients who were taken care of by multiple ED providers. These patients may have different needs from our study population (eg, more complex issues and longer stays in the ED) and may bias our results.
This study provides a new direction for research and quality improvement targeting readmissions. Research should extend beyond the discharge transition and examine the entire trajectory of posthospitalization care to better understand readmissions. Based directly on this study, research could investigate the practice patterns of ED providers and systems of care at ED facilities that affect readmissions rates. Such investigation could inform quality improvement efforts to standardize care for patients in the ED.
CMS policies hold hospitals accountable for readmissions of the patients they discharge, but do not address the admission process in the ED that leads to readmissions of recently discharged patients. Given the present study, and the fact that the proportion of all hospital admissions that occur through the ED has grown to 44%,[22] consideration of the role of the ED in public policy efforts to discourage unnecessary inpatient care may be appropriate.
In summary, this study shows that a recently discharged patient's chances of being readmitted depends partly on the ED provider who evaluates them and on the ED facility at which they seek care. ED provider practice patterns and ED facility systems of care may be a target for interventions aimed at decreasing readmission rates.
Disclosures
This research was supported by grants from the National Institutes of Health (AG033134 and K05CA134923) and from the Agency for Healthcare Research and Quality (R24H5022134). The authors report no conflicts of interest.
- , , Rehospitalizations among patients in the Medicare Fee‐for‐Service Program. N Engl J Med. 2009;360:1418–1428.
- Centers for Medicare 306:1688–1698.
- , , , , Interventions to reduce 30‐day rehospitalization: a systematic review. Ann Intern Med. 2011;155:520–528.
- , , , , Outpatient follow‐up visit and 30‐day emergency department visit and readmission in patients hospitalized for chronic obstructive pulmonary disease. Arch Intern Med. 2010;170:1664–1670.
- , , , et al. Relationship between early physician follow‐up and 30‐day readmission among Medicare beneficiaries hospitalized for heart failure. JAMA. 2010;303:1716–1722.
- , , After hospitalization: a Dartmouth Atlas report on post‐acute care for Medicare beneficiaries. Dartmouth Atlas website. Available at: www.dartmouthatlas.org/downloads/reports/Post_discharge_events_092811.pdf. Accessed August 8, 2013.
- , , , Emergency department visits after hospital discharge: a missing part of the equation. Ann Emerg Med. 2013;62:145–150.
- , , , Emergency department visits after surgery are common for Medicare patients, suggesting opportunities to improve care. Health Aff (Millwood). 2013;32:1600–1607.
- , , , et al. Defining emergency department episodes by severity and intensity: a 15‐year study of Medicare beneficiaries. BMC Health Serv Res. 2010;10:1–13.
- , , , Comorbidity measures for use with administrative data. Med Care. 1998;36:8–27.
- , , , , , Emergency department physician‐level and hospital‐level variation in admission rates. Ann Emerg Med. 2013;61:638–643.
- , , , et al. Hospital admission decision for patients with community‐acquired pneumonia: variability among physicians in an emergency department. Ann Emerg Med. 2012;59:35–41.
- , , Individual emergency physician admission rates: predictably unpredictable. CJEM. 2009;11(2):149–155.
- , , , , , Reasons why emergency department providers do not rely on the pneumonia severity index to determine the initial site of treatment for patients with pneumonia. Clin Infect Dis. 2009;49:e100–e108.
- , , Variation in emergency department admission rates across the United States. Med Care Res Rev. 2013;70:218–231.
- , , , , , Variation in US hospital emergency department admission rates by clinical condition. Med Care. 2015;53:237–244.
- , , , et al. Hospital variation in risk‐standardized hospital admission rates from US EDs among adults. Am J Emerg Med. 2014;32:837–843.
- , , The effect of an observation unit on the rate of ED admission and discharge for pyelonephritis. Am J Emerg Med. 2010;28:682–688.
- , , , , , Protocol‐driven emergency department observation units offer savings, shorter stays, and reduced admissions. Health Aff (Millwood). 2013;32:2149–2156.
- , Hospital chain said to scheme to inflate bills. New York Times. January 23, 2014. Available at: http://www.nytimes.com/2014/01/24/business/hospital‐chain‐said‐to‐scheme‐to‐inflate‐bills.html?emc=eta1367:391–393.
© 2015 Society of Hospital Medicine
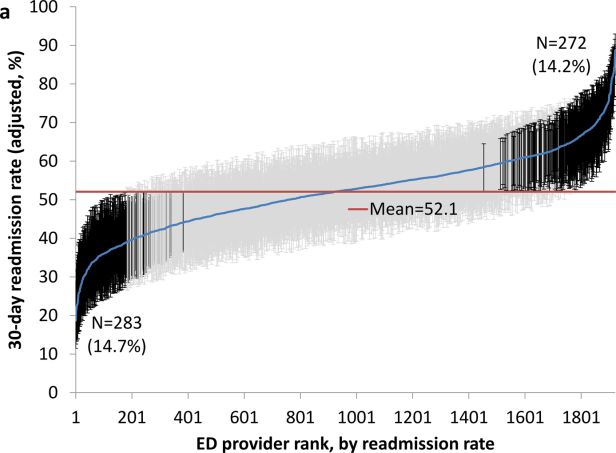
Localizing General Medical Teams
Localizing inpatient general medical teams to nursing units has high intuitive validity for improving physician productivity, hospital efficiency, and patient outcomes. Motion or the moving of personnel between tasksso prominent if teams are not localizedis 1 of the 7 wastes in lean thinking.1 In a timemotion study, where hospitalists cared for patients on up to 5 different wards, O'Leary et al2 have reported large parts of hospitalists' workdays spent in indirect patient care (69%), paging (13%), and travel (3%). Localization could increase the amount of time available for direct patient care, decrease time spent for (and interruptions due to) paging, and decrease travel time, all leading to greater productivity.
O'Leary et al3 have also reported the beneficial effects of localization of medical inpatients on communication between nurses and physicians, who could identify each other more often, and reported greater communication (specifically face‐to‐face communication) with each other following localization. This improvement in communication and effective multidisciplinary rounds could lead to safer care4 and better outcomes.
Further investigations about the effect of localization are limited. Roy et al5 have compared the outcomes of patients localized to 2 inpatient pods medically staffed by hospitalists and physician assistants (PAs) to geographically dispersed, but structurally different, house staff teams. They noticed significantly lower costs, slight but nonsignificant increase in length of stay, and no difference in mortality or readmissions, but it is impossible to tease out the affect of localization versus the affect of team composition. In a before‐and‐after study, Findlay et al6 have reported a decrease in mortality and complication rates in clinically homogenous surgical patients (proximal hip fractures) when cared for by junior trainee physicians localized to a unit, but their experience cannot be extrapolated to the much more diverse general medical population.
In our hospital, each general medical team could admit patients dispersed over 14 different units. An internal group, commissioned to evaluate our hospitalist practice, recommended reducing this dispersal to improve physician productivity, hospital efficiency, and outcomes of care. We therefore conducted a project to evaluate the impact of localizing general medical inpatient teams to a single nursing unit.
METHODS
Setting
We conducted our project at a 490 bed, urban academic medical center in the midwestern United States where of the 10 total general medical teams, 6 were traditional resident‐based teams and 4 consisted of a hospitalist paired with a PA (H‐PA teams). We focused our study on the 4 H‐PA teams. The hospitalists could be assigned to any H‐PA team and staffed them for 2 weeks (including weekends). The PAs were always assigned to the same team but took weekends off. An in‐house hospitalist provided overnight cross‐coverage for the H‐PA teams. Prior to our intervention, these teams could admit patients to any of the 14 nursing units at our hospital. They admitted patients from 7 AM to 3 PM, and also accepted care of patients admitted overnight after the resident teams had reached their admission limits (overflow). A Faculty Admitting Medical Officer (AMO) balanced the existing workload of the teams against the number and complexity of incoming patients to decide team assignment for the patients. The AMO was given guidelines (soft caps) to limit total admissions to H‐PA teams to 5 per team per day (3 on a weekend), and to not exceed a total patient census of 16 for an H‐PA team.
Intervention
Starting April 1, 2010, until July 15, 2010, we localized patients admitted to 2 of our 4 H‐PA teams on a single 32‐bed nursing unit. The patients of the other 2 H‐PA teams remained dispersed throughout the hospital.
Transition
April 1, 2010 was a scheduled switch day for the hospitalists on the H‐PA teams. We took advantage of this switch day and reassigned all patients cared for by H‐PA teams on our localized unit to the 2 localized teams. Similarly, all patients on nonlocalized units cared for by H‐PA teams were reassigned to the 2 nonlocalized teams. All patients cared for by resident teams on the localized unit, that were anticipated to be discharged soon, stayed until discharge; those that had a longer stay anticipated were transferred to a nonlocalized unit.
Patient Assignment
The 4 H‐PA teams continued to accept patients between 7 AM and 3 PM, as well as overflow patients. Patients with sickle cell crises were admitted exclusively to the nonlocalized teams, as they were cared for on a specialized nursing unit. No other patient characteristic was used to decide team assignment.
The AMO balanced the existing workload of the teams against the number and complexity of incoming patients to decide team assignment for the patients, but if these factors were equivocal, the AMO was now asked to preferentially admit to the localized teams. The admission soft cap for the H‐PA teams remained the same (5 on weekdays and 3 on weekends). The soft cap on the total census of 16 patients for the nonlocalized teams remained, but we imposed hard caps on the total census for the localized teams. These hard caps were 16 for each localized team for the month of April (to fill a 32‐bed unit), then decreased to 12 for the month of May, as informal feedback from the teams suggested a need to decrease workload, and then rebalanced to 14 for the remaining study period.
Evaluation
Clinical Outcomes
Using both concurrent and historical controls, we evaluated the impact of localization on the following clinical outcome measures: length of stay (LOS), charges, and 30‐day readmission rates.
Inclusion Criteria
We included all patients assigned to localized and nonlocalized teams between the period April 1, 2010 to July 15, 2010, and discharged before July 16, 2010, in our intervention group and concurrent control group, respectively. We included all patients assigned to any of the 4 H‐PA teams during the period January 1, 2010 and March 31, 2010 in the historical control group.
Exclusion Criteria
From the historical control group, we excluded patients assigned to one particular H‐PA team during the period January 1, 2010 to February 28, 2010, during which the PA assigned to that team was on leave. We excluded, from all groups, patients with a diagnosis of sickle cell disease and hospitalizations that straddled the start of the intervention. Further, we excluded repeat admissions for each patient.
Data Collection
We used admission logs to determine team assignment and linked them to our hospital's discharge abstract database to get patient level data. We grouped the principal diagnosis, International Classification of Diseases, Ninth Revision, Clinical Modification (ICD‐9‐CM) codes into clinically relevant categories using the Healthcare Cost and Utilization Project Clinical Classification Software for ICD‐9‐CM (Rockville, MD, www.hcup‐us.ahrq.gov/toolssoftware/ccs/ccs.jsp). We created comorbidity measures using Healthcare Cost and Utilization Project Comorbidity Software, version 3.4 (Rockville, MD, www.hcup‐us.ahrq.gov/toolssoftware/comorbidity/comorbidity.jsp).
We calculated LOS by subtracting the discharge day and time from the admission day and time. We summed all charges accrued during the entire hospital stay, but did not include professional fees. The LOS and charges included time spent and charges accrued in the intensive care unit (ICU). As ICU care was not under the control of the general medical teams and could have a significant impact on outcomes reflecting resource utilization, we compared LOS and charges only for 2 subsets of patients: patients not initially admitted to ICU before care by medical teams, and patients never requiring ICU care. We considered any repeat hospitalization to our hospital within 30 days following a discharge to be a readmission, except those for a planned procedure or for inpatient rehabilitation. We compared readmission rates for all patients irrespective of ICU stay, as discharge planning for all patients was under the direct control of the general medical teams.
Data Analysis
We performed unadjusted descriptive statistics using medians and interquartile ranges for continuous variables, and frequencies and percentages for categorical variables. We used chi‐square tests of association, and KruskalWallis analysis of variance, to compare baseline characteristics of patients assigned to localized and control teams.
We used regression models with random effects to risk adjust for a wide variety of variables. We included age, gender, race, insurance, admission source, time, day of week, discharge time, and total number of comorbidities as fixed effects in all models. We then added individual comorbidity measures one by one as fixed effects, including them only if significant at P < 0.01. We always added a variable identifying the admitting physician as a random effect, to account for dependence between admissions to the same physician. We log transformed LOS and charges because they were extremely skewed in nature. We analyzed readmissions after excluding patients who died. We evaluated the affect of our intervention on clinical outcomes using both historical and concurrent controls. We report P values for both overall 3‐way comparisons, as well as each of the 2‐way comparisonsintervention versus historical control and intervention versus concurrent control.
Productivity and Workflow Measures
We also evaluated the impact of localization on the following productivity and workflow measures: number of pages received, number of patient encounters, relative value units (RVUs) generated, and steps walked by PAs.
Data Collection
We queried our in‐house paging systems for the number of pages received by intervention and concurrent control teams between 7 AM and 6 PM (usual workday). We queried our professional billing data to determine the number of encounters per day and RVUs generated by the intervention, as well as historical and concurrent control teams, as a measure of productivity.
During the last 15 days of our intervention (July 1 July 15, 2010), we received 4 pedometers and we asked the PAs to record the number of steps taken during their workday. We chose PAs, rather than physicians, as the PAs had purely clinical duties and their walking activity would reflect activity for solely clinical purposes.
Data Analysis
For productivity and workflow measures, we adjusted for the day of the week and used random effects models to adjust for clustering of data by physician and physician assistant.
Statistical Software
We performed the statistical analysis using R software, versions 2.9.0 (The R Project for Statistical Computing, Vienna, Austria, http://www.R‐project.org).
Ethical Concerns
The study protocol was approved by our institutional review board.
RESULTS
Study Population
There were 2431 hospitalizations to the 4 H‐PA teams during the study period. Data from 37 hospitalizations was excluded because of missing data. After applying all exclusion criteria, our final study sample consisted of a total of 1826 first hospitalizations for patients: 783 historical controls, 478 concurrent controls, and 565 localized patients.
Patients in the control groups and intervention group were similar in age, gender, race, and insurance status. Patients in the intervention group were more likely to be admitted over the weekend, but had similar probability of being discharged over the weekend or having had an ICU stay. Historical controls were admitted more often between 6 AM and 12 noon, while during the intervention period, patients were more likely to be admitted between midnight and 6 AM. The discharge time was similar across all groups. The 5 most common diagnoses were similar across the groups (Table 1).
| Historical Control | Intervention Localized Teams | Concurrent Control | P Value | |
|---|---|---|---|---|
| ||||
| Patients | 783 | 565 | 478 | |
| Age median (IQR) | 57 (4575) | 57 (4573) | 56 (4470) | 0.186 |
| Age groups, n (%) | ||||
| <30 | 65 (8.3) | 37 (6.6) | 46 (9.6) | |
| 3039 | 76 (9.7) | 62 (11.0) | 47 (9.8) | |
| 4049 | 114 (14.6) | 85 (15.0) | 68 (14.2) | |
| 5059 | 162 (20.7) | 124 (22.0) | 118 (24.7) | 0.145 |
| 6069 | 119 (15.2) | 84 (14.9) | 76 (16.0) | |
| 7079 | 100 (12.8) | 62 (11.0) | 58 (12.1) | |
| 8089 | 113 (14.4) | 95 (16.8) | 51 (10.7) | |
| >89 | 34 (4.3) | 16 (2.88) | 14 (2.9) | |
| Female gender, n (%) | 434 (55.4) | 327 (57.9) | 264 (55.2) | 0.602 |
| Race: Black, n (%) | 285 (36.4) | 229 (40.5) | 200 (41.8) | 0.111 |
| Observation status, n (%) | 165 (21.1) | 108 (19.1) | 108 (22.6) | 0.380 |
| Insurance, n (%) | ||||
| Commercial | 171 (21.8) | 101 (17.9) | 101 (21.1) | |
| Medicare | 376 (48.0) | 278 (49.2) | 218 (45.6) | 0.225 |
| Medicaid | 179 (22.8) | 126 (22.3) | 117 (24.5) | |
| Uninsured | 54 (7.3) | 60 (10.6) | 42 (8.8) | |
| Weekend admission, n (%) | 137 (17.5) | 116 (20.5) | 65 (13.6) | 0.013 |
| Weekend discharge, n (%) | 132 (16.9) | 107 (18.9) | 91 (19.0) | 0.505 |
| Source of admission | ||||
| ED, n (%) | 654 (83.5) | 450 (79.7) | 370 (77.4) | 0.022 |
| No ICU stay, n (%) | 600 (76.6) | 440 (77.9) | 383 (80.1) | 0.348 |
| Admission time, n (%) | ||||
| 00000559 | 239 (30.5) | 208 (36.8) | 172 (36.0) | |
| 06001159 | 296 (37.8) | 157 (27.8) | 154 (32.2) | 0.007 |
| 12001759 | 183 (23.4) | 147 (26.0) | 105 (22.0) | |
| 18002359 | 65 (8.3) | 53 (9.4) | 47 (9.8) | |
| Discharge time, n (%) | ||||
| 00001159 | 67 (8.6) | 45 (8.0) | 43 (9.0) | |
| 12001759 | 590 (75.4) | 417 (73.8) | 364 (76.2) | 0.658 |
| 18002359 | 126 (16.1) | 103 (18.2) | 71 (14.9) | |
| Inpatient deaths, n | 13 | 13 | 6 | |
| Top 5 primary diagnoses (%) | ||||
| 1 | Chest pain (11.5) | Chest pain (13.3) | Chest pain (11.9) | |
| 2 | Septicemia (6.4) | Septicemia (5.1) | Septicemia (3.8) | |
| 3 | Diabetes w/cm (4.6) | Pneumonia (4.9) | Diabetes w/cm (3.3) | n/a |
| 4 | Pneumonia (2.8) | Diabetes w/cm (4.1) | Pneumonia (3.3) | |
| 5 | UTI (2.7) | COPD (3.2) | UTI (2.9) | |
Clinical Outcomes
Unadjusted Analyses
The risk of 30‐day readmission was no different between the intervention and control groups. In patients without an initial ICU stay, and without any ICU stay, charges incurred and LOS were no different between the intervention and control groups (Table 2).
| Historical Control | Intervention Localized Teams | Concurrent Control | P Value | |
|---|---|---|---|---|
| ||||
| 30‐day readmissions n (%) | 118 (15.3) | 69 (12.5) | 66 (14.0) | 0.346 |
| Charges: excluding patients initially admitted to ICU | ||||
| Median (IQR) in $ | 9346 (621614,520) | 9724 (665715,390) | 9902 (661115,670) | 0.393 |
| Charges: excluding all patients with an ICU stay | ||||
| Median (IQR) in $ | 9270 (618713,990) | 9509 (660114,940) | 9846 (658015,400) | 0.283 |
| Length of stay: excluding patients initially admitted to ICU | ||||
| Median (IQR) in days | 1.81 (1.223.35) | 2.16 (1.214.02) | 1.89 (1.193.50) | 0.214 |
| Length of stay: excluding all patients with an ICU stay | ||||
| Median (IQR) in days | 1.75 (1.203.26) | 2.12 (1.203.74) | 1.84 (1.193.42) | 0.236 |
Adjusted Analysis
The risk of 30‐day readmission was no different between the intervention and control groups. In patients without an initial ICU stay, and without any ICU stay, charges incurred were no different between the intervention and control groups; LOS was about 11% higher in the localized group as compared to historical controls, and about 9% higher as compared to the concurrent control group. The difference in LOS was not statistically significant on an overall 3‐way comparison (Table 3).
| Localized Teams in Comparison to | |||
|---|---|---|---|
| Historical Control | Concurrent Control | Overall P Value | |
| |||
| 30‐day risk of readmission OR (CI) | 0.85 (0.611.19) | 0.94 (0.651.37) | 0.630 |
| P value | 0.351 | 0.751 | |
| Charges: excluding patients initially admitted to ICU | |||
| % change | 2% higher | 4% lower | 0.367 |
| (CI) | (6% lower to 11% higher) | (12% lower to 5%higher) | |
| P value | 0.572 | 0.427 | |
| Charges: excluding all patients with an ICU stay | |||
| % change | 2% higher | 5% lower | 0.314 |
| (CI) | (6% lower to 10% higher) | (13% lower to 4% higher) | |
| P value | 0.695 | 0.261 | |
| Length of stay: excluding patients initially admitted to ICU | |||
| % change | 11% higher | 9% higher | 0.105 |
| (CI) | (1% to 22% higher) | (3% lower to 21% higher) | |
| P value | 0.038 | 0.138 | |
| Length of stay: excluding all patients with an ICU stay | |||
| % change | 10% higher | 8% higher | 0.133 |
| (CI) | (0% to 22% higher) | (3% lower to 20% higher) | |
| P value | 0.047 | 0.171 | |
Productivity and Workflow Measures
Unadjusted Analyses
The localized teams received fewer pages as compared to concurrently nonlocalized teams. Localized teams had more patient encounters per day and generated more RVUs per day as compared to both historical and concurrent control groups. Physician assistants on localized teams took fewer steps during their work day (Table 4).
| Historical Control | Intervention Localized Teams | Concurrent Control | P Value | |
|---|---|---|---|---|
| ||||
| Pages received/day (7 AM6 PM) Median (IQR) | No data | 15 (921) | 28 (12.540) | <0.001 |
| Total encounters/day Median (IQR) | 10 (813) | 12 (1013) | 11 (913) | <0.001 |
| RVU/day | ||||
| Mean (SD) | 19.9 (6.76) | 22.6 (5.6) | 21.2 (6.7) | <0.001 |
| Steps/day Median (IQR) | No data | 4661 (3922 5166) | 5554 (50606544) | <0.001 |
Adjusted Analysis
On adjusting for clustering by physician and day of week, the significant differences in pages received, total patient encounters, and RVUs generated persisted, while the difference in steps walked by PAs was attenuated to a statistically nonsignificant level (Table 5). The increase in RVU productivity was sustained through various periods of hard caps (data not shown).
| Localized Teams in Comparison to | |||
|---|---|---|---|
| Historical Control | Concurrent Control | Overall P Value | |
| |||
| Pages received (7 AM 6 PM) %(CI) | No data | 51% fewer (4854) | |
| P value | P < 0.001 | ||
| Total encounters | 0.89 more | 1.02 more | |
| N (CI) | (0.371.41) | (0.461.58) | |
| P value | P < 0.001 | P < 0.001 | P < 0.001 |
| RVU/day | 2.20 more | 1.36 more | |
| N (CI) | (1.103.29) | (0.172.55) | |
| P value | P < 0.001 | P = 0.024 | P < 0.001 |
| Steps/day | 1186 fewer (791 more to | ||
| N (CI) | No data | 3164 fewer) | |
| P value | P = 0.240 | ||
DISCUSSION
We found that general medical patients admitted to H‐PA teams and localized to a single nursing unit had similar risk of 30‐day readmission and charges, but may have had a higher length of stay compared to historical and concurrent controls. The localized teams received far fewer pages, had more patient encounters, generated more RVUs, and walked less during their work day. Taken together, these findings imply that in our study, localization led to greater team productivity and a possible decrease in hospital efficiency, with no significant impact on readmissions or charges incurred.
The higher productivity was likely mediated by the preferential assignments of more patients to the localized teams, and improvements in workflow (such as fewer pages and fewer steps walked), which allowed them to provide more care with the same resources as the control teams. Kocher and Sahni7 recently pointed out that the healthcare sector has experienced no gains in labor productivity in the past 20 years. Our intervention fits their prescription for redesigning healthcare delivery models to achieve higher productivity.
The possibility of a higher LOS associated with localization was a counterintuitive finding, and similar to that reported by Roy et al.5 We propose 3 hypotheses to explain this:
Selection bias: Higher workload of the localized teams led to compromised efficiency and a higher length of stay (eg, localized teams had fewer observation admissions, more hospitalizations with an ICU stay, and the AMO was asked to preferentially admit patients to localized teams).
Localization provided teams the opportunity to spend more time with their patients (by decreasing nonvalue‐added tasks) and to consequently address more issues before transitioning to outpatient care, or to provide higher quality of care.
Gaming: By having a hard cap on total number of occupied beds, we provided a perverse incentive to the localized teams to retain patients longer to keep assigned beds occupied, thereby delaying new admissions to avoid higher workload.
Our study cannot tell us which of these hypotheses represents the dominant phenomenon that led to this surprising finding. Hypothesis 3 is most worrying, and we suggest that others looking to localize their medical teams consider the possibility of unintended perverse incentives.
Differences were more pronounced between the historical control group and the intervention group, as opposed to the intervention group and concurrent controls. This may have occurred if we contaminated the concurrent control by decreasing the number of units they had to go to, by sequestering 1 unit for the intervention team.
Our report has limitations. It is a nonrandomized, quasi‐experimental investigation using a single institution's administrative databases. Our intervention was small in scale (localizing 2 out of 10 general medical teams on 1 out of 14 nursing units). What impact a wider implementation of localization may have on emergency department throughput and hospital occupancy remains to be studied. Nevertheless, our research is the first report, to our knowledge, investigating a wide variety of outcomes of localizing inpatient medical teams, and adds significantly to the limited research on this topic. It also provides significant operational details for other institutions to use when localizing medical teams.
We conclude that our intervention of localization of medical teams to a single nursing unit led to higher productivity and better workflow, but did not impact readmissions or charges incurred. We caution others designing similar localization interventions to protect against possible perverse incentives for inefficient care.
Acknowledgements
Disclosure: Nothing to report.
- . Reducing waste in US health care systems. JAMA. 2007;297(8):871–874.
- , , . How hospitalists spend their time: insights on efficiency and safety. J Hosp Med. 2006;1(2):88–93.
- , , , et al. Impact of localizing physicians to hospital units on nurse–physician communication and agreement on the plan of care. J Gen Intern Med. 2009;24(11):1223–1227.
- , , , et al. Structured interdisciplinary rounds in a medical teaching unit: improving patient safety. Arch Intern Med. 2011;171(7):678–684.
- , , , et al. Implementation of a physician assistant/hospitalist service in an academic medical center: impact on efficiency and patient outcomes. J Hosp Med. 2008;3(5):361–368.
- , , , , . Ward‐based rather than team‐based junior surgical doctors reduce mortality for patients with a fracture of the proximal femur: results from a two‐year observational study. J Bone Joint Surg Br. 2011;93‐B(3):393–398.
- , . Rethinking health care labor. N Engl J Med. 2011;365(15):1370–1372.
Localizing inpatient general medical teams to nursing units has high intuitive validity for improving physician productivity, hospital efficiency, and patient outcomes. Motion or the moving of personnel between tasksso prominent if teams are not localizedis 1 of the 7 wastes in lean thinking.1 In a timemotion study, where hospitalists cared for patients on up to 5 different wards, O'Leary et al2 have reported large parts of hospitalists' workdays spent in indirect patient care (69%), paging (13%), and travel (3%). Localization could increase the amount of time available for direct patient care, decrease time spent for (and interruptions due to) paging, and decrease travel time, all leading to greater productivity.
O'Leary et al3 have also reported the beneficial effects of localization of medical inpatients on communication between nurses and physicians, who could identify each other more often, and reported greater communication (specifically face‐to‐face communication) with each other following localization. This improvement in communication and effective multidisciplinary rounds could lead to safer care4 and better outcomes.
Further investigations about the effect of localization are limited. Roy et al5 have compared the outcomes of patients localized to 2 inpatient pods medically staffed by hospitalists and physician assistants (PAs) to geographically dispersed, but structurally different, house staff teams. They noticed significantly lower costs, slight but nonsignificant increase in length of stay, and no difference in mortality or readmissions, but it is impossible to tease out the affect of localization versus the affect of team composition. In a before‐and‐after study, Findlay et al6 have reported a decrease in mortality and complication rates in clinically homogenous surgical patients (proximal hip fractures) when cared for by junior trainee physicians localized to a unit, but their experience cannot be extrapolated to the much more diverse general medical population.
In our hospital, each general medical team could admit patients dispersed over 14 different units. An internal group, commissioned to evaluate our hospitalist practice, recommended reducing this dispersal to improve physician productivity, hospital efficiency, and outcomes of care. We therefore conducted a project to evaluate the impact of localizing general medical inpatient teams to a single nursing unit.
METHODS
Setting
We conducted our project at a 490 bed, urban academic medical center in the midwestern United States where of the 10 total general medical teams, 6 were traditional resident‐based teams and 4 consisted of a hospitalist paired with a PA (H‐PA teams). We focused our study on the 4 H‐PA teams. The hospitalists could be assigned to any H‐PA team and staffed them for 2 weeks (including weekends). The PAs were always assigned to the same team but took weekends off. An in‐house hospitalist provided overnight cross‐coverage for the H‐PA teams. Prior to our intervention, these teams could admit patients to any of the 14 nursing units at our hospital. They admitted patients from 7 AM to 3 PM, and also accepted care of patients admitted overnight after the resident teams had reached their admission limits (overflow). A Faculty Admitting Medical Officer (AMO) balanced the existing workload of the teams against the number and complexity of incoming patients to decide team assignment for the patients. The AMO was given guidelines (soft caps) to limit total admissions to H‐PA teams to 5 per team per day (3 on a weekend), and to not exceed a total patient census of 16 for an H‐PA team.
Intervention
Starting April 1, 2010, until July 15, 2010, we localized patients admitted to 2 of our 4 H‐PA teams on a single 32‐bed nursing unit. The patients of the other 2 H‐PA teams remained dispersed throughout the hospital.
Transition
April 1, 2010 was a scheduled switch day for the hospitalists on the H‐PA teams. We took advantage of this switch day and reassigned all patients cared for by H‐PA teams on our localized unit to the 2 localized teams. Similarly, all patients on nonlocalized units cared for by H‐PA teams were reassigned to the 2 nonlocalized teams. All patients cared for by resident teams on the localized unit, that were anticipated to be discharged soon, stayed until discharge; those that had a longer stay anticipated were transferred to a nonlocalized unit.
Patient Assignment
The 4 H‐PA teams continued to accept patients between 7 AM and 3 PM, as well as overflow patients. Patients with sickle cell crises were admitted exclusively to the nonlocalized teams, as they were cared for on a specialized nursing unit. No other patient characteristic was used to decide team assignment.
The AMO balanced the existing workload of the teams against the number and complexity of incoming patients to decide team assignment for the patients, but if these factors were equivocal, the AMO was now asked to preferentially admit to the localized teams. The admission soft cap for the H‐PA teams remained the same (5 on weekdays and 3 on weekends). The soft cap on the total census of 16 patients for the nonlocalized teams remained, but we imposed hard caps on the total census for the localized teams. These hard caps were 16 for each localized team for the month of April (to fill a 32‐bed unit), then decreased to 12 for the month of May, as informal feedback from the teams suggested a need to decrease workload, and then rebalanced to 14 for the remaining study period.
Evaluation
Clinical Outcomes
Using both concurrent and historical controls, we evaluated the impact of localization on the following clinical outcome measures: length of stay (LOS), charges, and 30‐day readmission rates.
Inclusion Criteria
We included all patients assigned to localized and nonlocalized teams between the period April 1, 2010 to July 15, 2010, and discharged before July 16, 2010, in our intervention group and concurrent control group, respectively. We included all patients assigned to any of the 4 H‐PA teams during the period January 1, 2010 and March 31, 2010 in the historical control group.
Exclusion Criteria
From the historical control group, we excluded patients assigned to one particular H‐PA team during the period January 1, 2010 to February 28, 2010, during which the PA assigned to that team was on leave. We excluded, from all groups, patients with a diagnosis of sickle cell disease and hospitalizations that straddled the start of the intervention. Further, we excluded repeat admissions for each patient.
Data Collection
We used admission logs to determine team assignment and linked them to our hospital's discharge abstract database to get patient level data. We grouped the principal diagnosis, International Classification of Diseases, Ninth Revision, Clinical Modification (ICD‐9‐CM) codes into clinically relevant categories using the Healthcare Cost and Utilization Project Clinical Classification Software for ICD‐9‐CM (Rockville, MD, www.hcup‐us.ahrq.gov/toolssoftware/ccs/ccs.jsp). We created comorbidity measures using Healthcare Cost and Utilization Project Comorbidity Software, version 3.4 (Rockville, MD, www.hcup‐us.ahrq.gov/toolssoftware/comorbidity/comorbidity.jsp).
We calculated LOS by subtracting the discharge day and time from the admission day and time. We summed all charges accrued during the entire hospital stay, but did not include professional fees. The LOS and charges included time spent and charges accrued in the intensive care unit (ICU). As ICU care was not under the control of the general medical teams and could have a significant impact on outcomes reflecting resource utilization, we compared LOS and charges only for 2 subsets of patients: patients not initially admitted to ICU before care by medical teams, and patients never requiring ICU care. We considered any repeat hospitalization to our hospital within 30 days following a discharge to be a readmission, except those for a planned procedure or for inpatient rehabilitation. We compared readmission rates for all patients irrespective of ICU stay, as discharge planning for all patients was under the direct control of the general medical teams.
Data Analysis
We performed unadjusted descriptive statistics using medians and interquartile ranges for continuous variables, and frequencies and percentages for categorical variables. We used chi‐square tests of association, and KruskalWallis analysis of variance, to compare baseline characteristics of patients assigned to localized and control teams.
We used regression models with random effects to risk adjust for a wide variety of variables. We included age, gender, race, insurance, admission source, time, day of week, discharge time, and total number of comorbidities as fixed effects in all models. We then added individual comorbidity measures one by one as fixed effects, including them only if significant at P < 0.01. We always added a variable identifying the admitting physician as a random effect, to account for dependence between admissions to the same physician. We log transformed LOS and charges because they were extremely skewed in nature. We analyzed readmissions after excluding patients who died. We evaluated the affect of our intervention on clinical outcomes using both historical and concurrent controls. We report P values for both overall 3‐way comparisons, as well as each of the 2‐way comparisonsintervention versus historical control and intervention versus concurrent control.
Productivity and Workflow Measures
We also evaluated the impact of localization on the following productivity and workflow measures: number of pages received, number of patient encounters, relative value units (RVUs) generated, and steps walked by PAs.
Data Collection
We queried our in‐house paging systems for the number of pages received by intervention and concurrent control teams between 7 AM and 6 PM (usual workday). We queried our professional billing data to determine the number of encounters per day and RVUs generated by the intervention, as well as historical and concurrent control teams, as a measure of productivity.
During the last 15 days of our intervention (July 1 July 15, 2010), we received 4 pedometers and we asked the PAs to record the number of steps taken during their workday. We chose PAs, rather than physicians, as the PAs had purely clinical duties and their walking activity would reflect activity for solely clinical purposes.
Data Analysis
For productivity and workflow measures, we adjusted for the day of the week and used random effects models to adjust for clustering of data by physician and physician assistant.
Statistical Software
We performed the statistical analysis using R software, versions 2.9.0 (The R Project for Statistical Computing, Vienna, Austria, http://www.R‐project.org).
Ethical Concerns
The study protocol was approved by our institutional review board.
RESULTS
Study Population
There were 2431 hospitalizations to the 4 H‐PA teams during the study period. Data from 37 hospitalizations was excluded because of missing data. After applying all exclusion criteria, our final study sample consisted of a total of 1826 first hospitalizations for patients: 783 historical controls, 478 concurrent controls, and 565 localized patients.
Patients in the control groups and intervention group were similar in age, gender, race, and insurance status. Patients in the intervention group were more likely to be admitted over the weekend, but had similar probability of being discharged over the weekend or having had an ICU stay. Historical controls were admitted more often between 6 AM and 12 noon, while during the intervention period, patients were more likely to be admitted between midnight and 6 AM. The discharge time was similar across all groups. The 5 most common diagnoses were similar across the groups (Table 1).
| Historical Control | Intervention Localized Teams | Concurrent Control | P Value | |
|---|---|---|---|---|
| ||||
| Patients | 783 | 565 | 478 | |
| Age median (IQR) | 57 (4575) | 57 (4573) | 56 (4470) | 0.186 |
| Age groups, n (%) | ||||
| <30 | 65 (8.3) | 37 (6.6) | 46 (9.6) | |
| 3039 | 76 (9.7) | 62 (11.0) | 47 (9.8) | |
| 4049 | 114 (14.6) | 85 (15.0) | 68 (14.2) | |
| 5059 | 162 (20.7) | 124 (22.0) | 118 (24.7) | 0.145 |
| 6069 | 119 (15.2) | 84 (14.9) | 76 (16.0) | |
| 7079 | 100 (12.8) | 62 (11.0) | 58 (12.1) | |
| 8089 | 113 (14.4) | 95 (16.8) | 51 (10.7) | |
| >89 | 34 (4.3) | 16 (2.88) | 14 (2.9) | |
| Female gender, n (%) | 434 (55.4) | 327 (57.9) | 264 (55.2) | 0.602 |
| Race: Black, n (%) | 285 (36.4) | 229 (40.5) | 200 (41.8) | 0.111 |
| Observation status, n (%) | 165 (21.1) | 108 (19.1) | 108 (22.6) | 0.380 |
| Insurance, n (%) | ||||
| Commercial | 171 (21.8) | 101 (17.9) | 101 (21.1) | |
| Medicare | 376 (48.0) | 278 (49.2) | 218 (45.6) | 0.225 |
| Medicaid | 179 (22.8) | 126 (22.3) | 117 (24.5) | |
| Uninsured | 54 (7.3) | 60 (10.6) | 42 (8.8) | |
| Weekend admission, n (%) | 137 (17.5) | 116 (20.5) | 65 (13.6) | 0.013 |
| Weekend discharge, n (%) | 132 (16.9) | 107 (18.9) | 91 (19.0) | 0.505 |
| Source of admission | ||||
| ED, n (%) | 654 (83.5) | 450 (79.7) | 370 (77.4) | 0.022 |
| No ICU stay, n (%) | 600 (76.6) | 440 (77.9) | 383 (80.1) | 0.348 |
| Admission time, n (%) | ||||
| 00000559 | 239 (30.5) | 208 (36.8) | 172 (36.0) | |
| 06001159 | 296 (37.8) | 157 (27.8) | 154 (32.2) | 0.007 |
| 12001759 | 183 (23.4) | 147 (26.0) | 105 (22.0) | |
| 18002359 | 65 (8.3) | 53 (9.4) | 47 (9.8) | |
| Discharge time, n (%) | ||||
| 00001159 | 67 (8.6) | 45 (8.0) | 43 (9.0) | |
| 12001759 | 590 (75.4) | 417 (73.8) | 364 (76.2) | 0.658 |
| 18002359 | 126 (16.1) | 103 (18.2) | 71 (14.9) | |
| Inpatient deaths, n | 13 | 13 | 6 | |
| Top 5 primary diagnoses (%) | ||||
| 1 | Chest pain (11.5) | Chest pain (13.3) | Chest pain (11.9) | |
| 2 | Septicemia (6.4) | Septicemia (5.1) | Septicemia (3.8) | |
| 3 | Diabetes w/cm (4.6) | Pneumonia (4.9) | Diabetes w/cm (3.3) | n/a |
| 4 | Pneumonia (2.8) | Diabetes w/cm (4.1) | Pneumonia (3.3) | |
| 5 | UTI (2.7) | COPD (3.2) | UTI (2.9) | |
Clinical Outcomes
Unadjusted Analyses
The risk of 30‐day readmission was no different between the intervention and control groups. In patients without an initial ICU stay, and without any ICU stay, charges incurred and LOS were no different between the intervention and control groups (Table 2).
| Historical Control | Intervention Localized Teams | Concurrent Control | P Value | |
|---|---|---|---|---|
| ||||
| 30‐day readmissions n (%) | 118 (15.3) | 69 (12.5) | 66 (14.0) | 0.346 |
| Charges: excluding patients initially admitted to ICU | ||||
| Median (IQR) in $ | 9346 (621614,520) | 9724 (665715,390) | 9902 (661115,670) | 0.393 |
| Charges: excluding all patients with an ICU stay | ||||
| Median (IQR) in $ | 9270 (618713,990) | 9509 (660114,940) | 9846 (658015,400) | 0.283 |
| Length of stay: excluding patients initially admitted to ICU | ||||
| Median (IQR) in days | 1.81 (1.223.35) | 2.16 (1.214.02) | 1.89 (1.193.50) | 0.214 |
| Length of stay: excluding all patients with an ICU stay | ||||
| Median (IQR) in days | 1.75 (1.203.26) | 2.12 (1.203.74) | 1.84 (1.193.42) | 0.236 |
Adjusted Analysis
The risk of 30‐day readmission was no different between the intervention and control groups. In patients without an initial ICU stay, and without any ICU stay, charges incurred were no different between the intervention and control groups; LOS was about 11% higher in the localized group as compared to historical controls, and about 9% higher as compared to the concurrent control group. The difference in LOS was not statistically significant on an overall 3‐way comparison (Table 3).
| Localized Teams in Comparison to | |||
|---|---|---|---|
| Historical Control | Concurrent Control | Overall P Value | |
| |||
| 30‐day risk of readmission OR (CI) | 0.85 (0.611.19) | 0.94 (0.651.37) | 0.630 |
| P value | 0.351 | 0.751 | |
| Charges: excluding patients initially admitted to ICU | |||
| % change | 2% higher | 4% lower | 0.367 |
| (CI) | (6% lower to 11% higher) | (12% lower to 5%higher) | |
| P value | 0.572 | 0.427 | |
| Charges: excluding all patients with an ICU stay | |||
| % change | 2% higher | 5% lower | 0.314 |
| (CI) | (6% lower to 10% higher) | (13% lower to 4% higher) | |
| P value | 0.695 | 0.261 | |
| Length of stay: excluding patients initially admitted to ICU | |||
| % change | 11% higher | 9% higher | 0.105 |
| (CI) | (1% to 22% higher) | (3% lower to 21% higher) | |
| P value | 0.038 | 0.138 | |
| Length of stay: excluding all patients with an ICU stay | |||
| % change | 10% higher | 8% higher | 0.133 |
| (CI) | (0% to 22% higher) | (3% lower to 20% higher) | |
| P value | 0.047 | 0.171 | |
Productivity and Workflow Measures
Unadjusted Analyses
The localized teams received fewer pages as compared to concurrently nonlocalized teams. Localized teams had more patient encounters per day and generated more RVUs per day as compared to both historical and concurrent control groups. Physician assistants on localized teams took fewer steps during their work day (Table 4).
| Historical Control | Intervention Localized Teams | Concurrent Control | P Value | |
|---|---|---|---|---|
| ||||
| Pages received/day (7 AM6 PM) Median (IQR) | No data | 15 (921) | 28 (12.540) | <0.001 |
| Total encounters/day Median (IQR) | 10 (813) | 12 (1013) | 11 (913) | <0.001 |
| RVU/day | ||||
| Mean (SD) | 19.9 (6.76) | 22.6 (5.6) | 21.2 (6.7) | <0.001 |
| Steps/day Median (IQR) | No data | 4661 (3922 5166) | 5554 (50606544) | <0.001 |
Adjusted Analysis
On adjusting for clustering by physician and day of week, the significant differences in pages received, total patient encounters, and RVUs generated persisted, while the difference in steps walked by PAs was attenuated to a statistically nonsignificant level (Table 5). The increase in RVU productivity was sustained through various periods of hard caps (data not shown).
| Localized Teams in Comparison to | |||
|---|---|---|---|
| Historical Control | Concurrent Control | Overall P Value | |
| |||
| Pages received (7 AM 6 PM) %(CI) | No data | 51% fewer (4854) | |
| P value | P < 0.001 | ||
| Total encounters | 0.89 more | 1.02 more | |
| N (CI) | (0.371.41) | (0.461.58) | |
| P value | P < 0.001 | P < 0.001 | P < 0.001 |
| RVU/day | 2.20 more | 1.36 more | |
| N (CI) | (1.103.29) | (0.172.55) | |
| P value | P < 0.001 | P = 0.024 | P < 0.001 |
| Steps/day | 1186 fewer (791 more to | ||
| N (CI) | No data | 3164 fewer) | |
| P value | P = 0.240 | ||
DISCUSSION
We found that general medical patients admitted to H‐PA teams and localized to a single nursing unit had similar risk of 30‐day readmission and charges, but may have had a higher length of stay compared to historical and concurrent controls. The localized teams received far fewer pages, had more patient encounters, generated more RVUs, and walked less during their work day. Taken together, these findings imply that in our study, localization led to greater team productivity and a possible decrease in hospital efficiency, with no significant impact on readmissions or charges incurred.
The higher productivity was likely mediated by the preferential assignments of more patients to the localized teams, and improvements in workflow (such as fewer pages and fewer steps walked), which allowed them to provide more care with the same resources as the control teams. Kocher and Sahni7 recently pointed out that the healthcare sector has experienced no gains in labor productivity in the past 20 years. Our intervention fits their prescription for redesigning healthcare delivery models to achieve higher productivity.
The possibility of a higher LOS associated with localization was a counterintuitive finding, and similar to that reported by Roy et al.5 We propose 3 hypotheses to explain this:
Selection bias: Higher workload of the localized teams led to compromised efficiency and a higher length of stay (eg, localized teams had fewer observation admissions, more hospitalizations with an ICU stay, and the AMO was asked to preferentially admit patients to localized teams).
Localization provided teams the opportunity to spend more time with their patients (by decreasing nonvalue‐added tasks) and to consequently address more issues before transitioning to outpatient care, or to provide higher quality of care.
Gaming: By having a hard cap on total number of occupied beds, we provided a perverse incentive to the localized teams to retain patients longer to keep assigned beds occupied, thereby delaying new admissions to avoid higher workload.
Our study cannot tell us which of these hypotheses represents the dominant phenomenon that led to this surprising finding. Hypothesis 3 is most worrying, and we suggest that others looking to localize their medical teams consider the possibility of unintended perverse incentives.
Differences were more pronounced between the historical control group and the intervention group, as opposed to the intervention group and concurrent controls. This may have occurred if we contaminated the concurrent control by decreasing the number of units they had to go to, by sequestering 1 unit for the intervention team.
Our report has limitations. It is a nonrandomized, quasi‐experimental investigation using a single institution's administrative databases. Our intervention was small in scale (localizing 2 out of 10 general medical teams on 1 out of 14 nursing units). What impact a wider implementation of localization may have on emergency department throughput and hospital occupancy remains to be studied. Nevertheless, our research is the first report, to our knowledge, investigating a wide variety of outcomes of localizing inpatient medical teams, and adds significantly to the limited research on this topic. It also provides significant operational details for other institutions to use when localizing medical teams.
We conclude that our intervention of localization of medical teams to a single nursing unit led to higher productivity and better workflow, but did not impact readmissions or charges incurred. We caution others designing similar localization interventions to protect against possible perverse incentives for inefficient care.
Acknowledgements
Disclosure: Nothing to report.
- . Reducing waste in US health care systems. JAMA. 2007;297(8):871–874.
- , , . How hospitalists spend their time: insights on efficiency and safety. J Hosp Med. 2006;1(2):88–93.
- , , , et al. Impact of localizing physicians to hospital units on nurse–physician communication and agreement on the plan of care. J Gen Intern Med. 2009;24(11):1223–1227.
- , , , et al. Structured interdisciplinary rounds in a medical teaching unit: improving patient safety. Arch Intern Med. 2011;171(7):678–684.
- , , , et al. Implementation of a physician assistant/hospitalist service in an academic medical center: impact on efficiency and patient outcomes. J Hosp Med. 2008;3(5):361–368.
- , , , , . Ward‐based rather than team‐based junior surgical doctors reduce mortality for patients with a fracture of the proximal femur: results from a two‐year observational study. J Bone Joint Surg Br. 2011;93‐B(3):393–398.
- , . Rethinking health care labor. N Engl J Med. 2011;365(15):1370–1372.
Copyright © 2012 Society of Hospital Medicine
Effort of Inpatient Work
In internal medicine residency training, the most commonly used metric for measuring workload of physicians is the number of patients being followed or the number being admitted. There are data to support the importance of these census numbers. One study conducted at an academic medical center demonstrated that for patients admitted to medical services, the number of patients admitted on a call night was positively associated with mortality, even after adjustment in multivariable models.1
The problem with a census is that it is only a rough indicator of the amount of work that a given intern or resident will have. In a focus group study that our group conducted with internal medicine residents, several contributors to patient care errors were identified. Workload was identified as a major factor contributing to patient care mistakes.2 In describing workload, residents noted not only census but the complexity of the patient as contributing factors to workload.
A more comprehensive method than relying on census data has been used in anesthesia.3, 4 In 2 studies, anesthesiologists were asked to rate the effort or intensity associated with the tasks that they performed in the operating room.4, 5 In subsequent studies, this group used a trained observer to record the tasks anesthesiologists performed during a case.6, 7 Work density was calculated by multiplying the duration of each task by the previously developed task intensity score. In this way, work per unit of time can be calculated as can a cumulative workload score for a certain duration of time.
These methods provide the background for the work that we conducted in this study. The purpose of this study was to assign a task effort score to the tasks performed during periods that include admitting patients to the hospital.
METHODS
Study Site
A single 500‐bed Midwest academic institution. Residents rotate through 3 hospitals (a private community hospital, a Veterans hospital, and an academic medical center) during a typical 3‐year internal medicine residency program.
Study Design and Subjects
A cross‐sectional survey was conducted. Subjects recruited for the survey included internal medicine interns and residents, internal medicine ward attending physicians and hospitalists. Attending physicians had to have been on the wards in the past year. The survey was conducted in November, when all eligible house staff should have had at least 1 ward month. Nearly every hospitalist recruited had spent time on both teaching and nonteaching services.
Task List Compilation and Survey Development
An expert panel was convened consisting of 10 physicians representing 3 hospitals, including residents and faculty, some of which were hospitalists. During the session, the participants developed a task list and discussed the work intensity associated with some of the tasks. The task list was reviewed by the study team and organized into categories. The final list included 99 tasks divided into 6 categories: (1) direct patient care, (2) indirect patient care, (3) search for/finding things, (4) educational/academic activities, (5) personal/downtime activities, and (6) other. Table 1 gives examples of items found in each category. We used the terminology that the study participants used to describe their work (eg, they used the term eyeballing a patient to describe the process of making an initial assessment of the patient's status). This list of 99 items was formatted into a survey to allow study participants to rate each task across 3 domains: physical effort, mental effort, and psychological effort, based on previous studies in anesthesia4 (see Supporting Information). The term mental refers to cognitive effort, whereas psychological refers to emotional effort. We used the same scales with the same anchors as described in the anesthesia literature,4 but substituted the internal medicine specific tasks. Each item was rated on a 7‐point Likert‐type scale (1 = almost no stress or effort; 7 = most effort). The survey also included demographic information regarding the respondent and instructions. The instructions directed respondents to rate each item based on their average experience in performing each task. They were further instructed not to rate tasks they had never performed.
| Categories of Tasks | Examples |
|---|---|
| |
| Direct patient care | Conducting the physical examination, hand washing, putting on isolation gear |
| Indirect patient care | Writing H&P, writing orders, ordering additional labs or tests |
| Searching for/finding things | Finding a computer, finding materials for procedures, finding the patient |
| Personal/downtime activities | Eating dinner, sleep, socializing, calling family members |
| Educational/academic activities | Literature search, teaching medical students, preparing a talk |
| Other | Transporting patients, traveling from place to place, billing |
Survey Process
The potential survey participants were notified via e‐mail that they would be asked to complete the survey during a regularly scheduled meeting. The interns, residents, and faculty met during separate time slots. Data from residents and interns were obtained from teaching sessions they were required to attend (as long as their schedule permitted them to). Survey data for attending physicians were obtained from a general internal medicine meeting and a hospitalist meeting. Because of the type of meeting, subspecialists were less likely to have been included. The objectives of the study and its voluntary nature were presented to the groups, and the survey was given to all attendees at the meetings. Due to the anonymous nature of the survey, a waiver of written informed consent was granted. Time was reserved during the course of the meeting to complete the survey. Before distributing the survey, we counted the total number of people in the room so that a participation rate could be calculated. Respondents were instructed to place the survey in a designated envelope after completing it or to return a blank survey if they did not wish to complete it. There was no time limit for completion of the survey. At all of these sessions, this survey was one part of the meeting agenda.
Data Analysis
Surveys were entered into a Microsoft Excel (Redmond, WA) spreadsheet and then transferred into Stata version 8.0 (College Station, TX), which was used for analysis. Our analysis focused on (1) the description of the effort associated with individual tasks, (2) the description of the effort associated with task categories and comparisons across key categories, and (3) a comparison of effort across the task categories' physical, mental, and psychological domains.
Each task had 3 individual domain scores associated with it: physical, mental (ie, cognitive work), and psychological (ie, emotional work). A composite task effort score was calculated for each task by determining the mean of the 3 domain scores for that task.
An overall effort score was calculated for each of the 6 task categories by determining the mean of the composite task effort scores within each category. We used the composite effort score for each task to calculate the Cronbach's value for each category except other. We compared the overall category effort scores for direct versus indirect patient care using 2‐tailed paired t tests with a significance level of P < 0.05. We further evaluated differences in overall category effort scores for direct patient care between physicians of different genders and between house staff and faculty, using 2‐tailed unpaired t tests, with a significance level of P < 0.05.
Finally, we compared the physical, mental, and psychological domain scores for direct versus indirect patient care categories, using paired t tests.
Ethics
This study was approved by the Institutional Review Board at the Medical College of Wisconsin.
RESULTS
The study participation rate was 69% (59/85). The sample consisted of 31 (52%) women and 40 (68%) house staff (see Table 2). The mean age was 34 years. This participation rate represents approximately 1/3 of the internal medicine house staff and a smaller percentage of the faculty that would have been eligible.
| Demographic | Value |
|---|---|
| |
| Age, y, mean (SD) | 34 (8.8) |
| Female gender, no. (%) | 31 (52) |
| Physician description, no. (%) | |
| Intern | 7 (12) |
| Resident | 33 (56) |
| Hospitalist | 4 (7) |
| Nonhospitalist faculty | 15 (25) |
Individual Task Effort
The mean composite effort score of all 99 tasks is provided in the Supporting Information Table. Overall, the most difficult task was going to codes (in the direct patient care category), with a mean composite rating of 5.37 (standard deviation [SD] 1.5); this was also the most difficult psychological task (5.78 [SD 1.65]). The most difficult mental task was transferring an unstable patient to the intensive care unit (5.47 [SD 1.53]). The most difficult physical task was placing a central line (5.02 [SD 1.63]). The easiest task was using the Internet (in the personal/downtime activities category), with a mean composite rating of 1.41 (SD 0.74); this was also the easiest mental (1.52 [SD 1.01]), psychological (1.3 [SD 0.68]), and physical (1.42 [SD 0.76]) task.
Analysis of Task Categories
The overall and domain characteristics of each task category are given in Table 3. Categories contained between 5 and 41 tasks. The Cronbach's ranged from 0.83 for the personal/downtime activities category to 0.98 for the direct patient care category. The mean overall effort ranged from least difficult for the personal/downtime category (1.72 [SD 0.76]) to most difficult for the education category (3.61 [SD 1.06]).
| Category | No. of Items | Cronbach's | Effort Score, Mean (SD)* | |||
|---|---|---|---|---|---|---|
| Composite Effort | Physical Effort | Mental Effort | Psychological Effort | |||
| ||||||
| Direct patient care | 32 | 0.97 | 3.55 (0.91) | 3.22 (1.06) | 3.89 (0.99) | 3.52 (1.04) |
| Indirect patient care | 41 | 0.98 | 3.21 (0.92) | 2.71 (1.09) | 3.80 (1.02) | 3.20 (1.08) |
| Education | 8 | 0.92 | 3.61 (1.06) | 3.12 (1.26) | 4.27 (1.17) | 3.43 (1.30) |
| Finding things | 5 | 0.85 | 2.94 (0.91) | 3.59 (1.23) | 2.43 (1.05) | 2.79 (1.13) |
| Personal | 7 | 0.83 | 1.72 (0.76) | 1.86 (0.92) | 1.69 (0.85) | 1.63 (0.72) |
| Other | 6 | NC | NC | NC | NC | NC |
Using paired t tests, we determined that the direct patient care category was more difficult than the indirect patient care category overall (3.58 versus 3.21, P < 0.001). Direct patient care was statistically significantly more challenging than indirect patient care on the physical (3.23 vs 2.71; P < 0.001), mental (3.90 vs 3.84; P < 0.05), and psychological domains (3.57 vs 3.20; P < 0.001) as well. There were no significant differences between men and women or between house staff and faculty on the difficulty of direct patient care. We found a trend toward increased difficulty of indirect patient care for house staff versus faculty (3.36 vs 2.92; P 0.10), but no differences by gender.
DISCUSSION
In this study, we used a comprehensive list of tasks performed by internal medicine doctors while admitting patients and produced a numeric assessment of the effort associated with each. The list was generated by an expert panel and comprised 6 categories and 99 items. Residents and attending physicians then rated each task based on level of difficulty, specifically looking at the mental, psychological, and physical effort required by each.
Indirect patient care was the task category in our study that had the most tasks associated with it (41 out of 99). Direct patient care included 32 items, but 10 of these were procedures (eg, lumbar puncture), some of which are uncommonly performed. Several time‐motion studies have been performed to document the work done by residents815 and hospitalists.16, 17 Although our study did not assess the time spent on each task, the distribution of tasks across categories is consistent with these time‐motion studies, which show that the amount of time spent in direct patient care is a small fraction of the amount of time spent in the hospital,12 and that work such as interprofessional communication10 and documentation16 consume the majority of time.
This project allowed us to consider the effort required for inpatient internal medicine work on a more granular level than has been described previously. Although the difficulty of tasks associated with anesthesia and surgical work has been described,3, 4, 7, 1820 our study is a unique contribution to the internal medicine literature. Understanding the difficulty of tasks performed by inpatient physicians is an important step toward better management of workload. With concerns about burnout in hospitalists21, 22 and residents,2325 it seems wise to take the difficulty of the work they do into consideration in a more proactive manner. In addition, understanding workload may have patient safety applications. In one study of mistakes made by house staff, 51% of the survey respondents identified workload as a contributing factor.26
We assessed effort for inpatient work by generating a task list and then measuring 3 domains of each task: physical, mental, and psychological. As a result, we were able to further quantify the difficulty of work completed by physicians. Recent work from outside of medicine suggests that individuals have a finite capacity for mental workload, and when this is breached, decision‐making quality is impaired.27 This suggests that it is important to take work intensity into account when assigning work to individuals. For example, a detailed assessment of workload at the task level combined with the amount of time spent on each task would allow us to know how much effort is typically involved with admitting a new patient. This information would allow for more equal distribution of workload across admitting teams. In addition, these methods could be expanded to understand how much effort is involved in the discharge process. This could be taken into account at the beginning of a day when allocating work such as admissions and discharges between members of a team.
This methodology has the potential to be used in other ways to help quantify the effort required for the work that physicians do. Many departments are struggling to develop a system for giving credit to faculty for the time they spend on nonpatient care activities. Perhaps these methods could be used to develop effort scores associated with administrative tasks, and administrative relative value units could be calculated accordingly. Similar techniques have been used with educational relative value units.28
We know from the nursing literature that workload is related to both burnout and patient safety. Burnout is a process related to the emotional work of providing care to people.29 Our methods clearly incorporate the psychological stress of work into the workload assessment. Evaluating the amount of time spent on tasks with high psychological scores may be helpful in identifying work patterns that are more likely to produce burnout in physicians and nurses.
With respect to patient safety, higher patient‐to‐nurse ratios are associated with failure to rescue30 and nosocomial infections.31 Furthermore, researchers have demonstrated that systems issues can add substantially to nursing workload.32 Methods such as those described in our study take into account both patient‐related and systems‐related tasks, and therefore could result in more detailed workload assessments. With more detailed information about contributors to workload, better predictions about optimal staffing could be made, which would ultimately lead to fewer adverse patient events.
Our study has limitations. First, the initial task list was based on the compilation efforts from only 10 physicians. However, this group of physicians represented 3 hospitals and included both resident and attending physicians. Second, the survey data were gathered from a single institution. Although we included trainees and faculty, more participants would be needed to answer questions about how experience and setting/environmental factors affect these assessments. However, participants were instructed to reflect on their whole experience with each task, which presumably includes multiple institutions and training levels. Third, the sample size is fairly small, with more house staff than faculty (hospitalists and nonhospitalists) represented. Regardless, this study is the first attempt to define and quantify workload for internal medicine physicians using these methods. In future studies, we will expand the number of institutions and levels of experience to validate our current data. Finally, the difficulty of the tasks is clearly a subjective assessment. Although this methodology has face validity, further work needs to be done to validate these findings against other measurements of workload, such as census, or more general subjective workload assessments, such as the NASA task load index.33
In conclusion, we have described the tasks performed by inpatient physicians and the difficulty associated with them. Moreover, we have described a methodology that could be replicated at other centers for the purpose of validating our findings or quantifying workload of other types of tasks. We believe that this is the first step toward a more comprehensive understanding of the workload encountered by inpatient physicians. Because workload has implications for physician burnout and patient safety, it is essential that we fully understand the contributors to workload, including the innate difficulty of the tasks that comprise it.
Acknowledgements
The authors Alexis Visotcky, MS, and Sergey Tarima, PhD, for their assistance with statistics.
This work was presented in poster form at the Society of Hospital Medicine Annual Meeting in April 2010, the Society of General Internal Medicine Annual Meeting in May 2010, and the Society of General Internal Medicine regional meeting in September 2010.
Funding Source: The study team was supported by the following funds during this work: VA grants PPO 0925901 (Marilyn M. Schapira and Kathlyn E. Fletcher) and IIR 07201 (Marilyn M. Schapira, Siddhartha Singh, and Kathlyn E. Fletcher).
- ,,,,.House staff team workload and organization effects on patient outcomes in an academic general internal medicine inpatient service.Arch Intern Med.2007;167:47–52.
- ,,, et al.The work hour rules and contributors to patient care mistakes: A focus group study with internal medicine residentsJ Hosp Med.2008;3:228–237.
- ,,.Multiple measures of anesthesia workload during teaching and nonteaching cases.Anesth Analg.2004;98:1419–1425.
- ,,,,.Developing a technique to measure anesthesiologists' real‐time workload.Proceedings of the Human Factors and Ergonomics Society Annual Meeting.2000;44:241–244.
- ,,, et al.Quantitative description of the workload associated with airway management procedures.J Clin Anesth.2000;12:273–282.
- ,,,,,.An objective methodology for task analysis and workload assessment in anesthesia providers.Anesthesiology.1994;80:77–92.
- ,.Effects of intraoperative reading on vigilance and workload during anesthesia care in an academic medical center.Anesthesiology.2009;110:275–283.
- ,,.Resident work hours: what they are really doing.Arch Surg.2004;139:490–493; discussion, 493–494.
- ,,,,,.Analyzing the time and value of housestaff inpatient work.J Gen Intern Med.1998;13:534–540.
- ,,,.All in a day's work: an observational study to quantify how and with whom doctors on hospital wards spend their time.[see comment].Med J Aust.2008;188:506–509.
- ,,,,.How do house officers spend their nights? A time study of internal medicine house staff on call.N Engl J Med.1989;320:1673–1677.
- ,,,,.Systematic review of time studies evaluating physicians in the hospital setting.J Hosp Med.2010;5:353–359.
- ,,.Time analysis of a general medicine service: results from a random work sampling study.J Gen Intern Med.1994;9:272–277.
- ,,,.A phenomenology of scut.Ann Intern Med.1991;115:372–376.
- ,,, et al.The on‐call experience of interns in internal medicine. Medical Education Task Force of Henry Ford Hospital.Arch Intern Med.1990;150:2294–2297.
- ,,, et al.Where did the day go? A time‐motion study of hospitalists.J Hosp Med.2010;5:323–328.
- ,,.How hospitalists spend their time: insights on efficiency and safety.J Hosp Med.2006;1:88–93.
- ,,, et al.Differences in day and night shift clinical performance in anesthesiology.Hum Factors.2008;50:276–290.
- ,,,,.Assessment of the intrarater and interrater reliability of an established clinical task analysis methodology.Anesthesiology.2002;96:1129–1139.
- ,,.The effect of electronic record keeping and transesophageal echocardiography on task distribution, workload, and vigilance during cardiac anesthesia.Anesthesiology.1997;87:144–155.
- .Fight burnout while fostering experience: investing in hospitalist programs now can fight burnout later.ACP Hospitalist. July2008.
- .Hospitalist burnout: recognize it in yourself and others, and avoid or eliminate it.The Hospitalist. March2006.
- ,,,.Burnout and internal medicine resident work‐hour restrictions.Arch Intern Med.2005;165:2595–2600.
- ,,,,.The effects of work‐hour limitations on resident well‐being, patient care, and education in an internal medicine residency program.Arch Intern Med.2005;165:2601–2606.
- ,,,.Burnout and self‐reported patient care in an internal medicine residency program.Ann Intern Med.2002;136:358–367.
- ,,,.Do house officers learn from their mistakes?Qual Saf Health Care.2003;12:221–226; discussion, 227–228.
- ,,.Extraneous factors in judicial decisions.Proc Natl Acad Sci U S A.2011;108:6889–6892.
- ,.Quantifying physician teaching productivity using clinical relative value units.J Gen Intern Med.1999;14:617–621.
- .Maslach Burnout Inventory Manual.3rd ed.Palo Alto, CA:Consulting Psychology Press;1986.
- ,,,,.Hospital nurse staffing and patient mortality, nurse burnout, and job dissatisfaction.JAMA.2002;288:1987–1993.
- ,,,,.Patient density, nurse‐to‐patient ratio and nosocomial infection risk in a pediatric cardiac intensive care unit.Pediatr Infect Dis J.1997;16:1045–1048.
- ,.Operational failures and interruptions in hospital nursing.Health Serv Res.2006;41:643–662.
- ,.Development of NASA‐TLX (Task Load Index): results of empirical and theoretical research. In: Hancock PA, Meshkati N, eds.Human Mental Workload.Amsterdam, Netherlands:North Holland Press;1988:239–250.
In internal medicine residency training, the most commonly used metric for measuring workload of physicians is the number of patients being followed or the number being admitted. There are data to support the importance of these census numbers. One study conducted at an academic medical center demonstrated that for patients admitted to medical services, the number of patients admitted on a call night was positively associated with mortality, even after adjustment in multivariable models.1
The problem with a census is that it is only a rough indicator of the amount of work that a given intern or resident will have. In a focus group study that our group conducted with internal medicine residents, several contributors to patient care errors were identified. Workload was identified as a major factor contributing to patient care mistakes.2 In describing workload, residents noted not only census but the complexity of the patient as contributing factors to workload.
A more comprehensive method than relying on census data has been used in anesthesia.3, 4 In 2 studies, anesthesiologists were asked to rate the effort or intensity associated with the tasks that they performed in the operating room.4, 5 In subsequent studies, this group used a trained observer to record the tasks anesthesiologists performed during a case.6, 7 Work density was calculated by multiplying the duration of each task by the previously developed task intensity score. In this way, work per unit of time can be calculated as can a cumulative workload score for a certain duration of time.
These methods provide the background for the work that we conducted in this study. The purpose of this study was to assign a task effort score to the tasks performed during periods that include admitting patients to the hospital.
METHODS
Study Site
A single 500‐bed Midwest academic institution. Residents rotate through 3 hospitals (a private community hospital, a Veterans hospital, and an academic medical center) during a typical 3‐year internal medicine residency program.
Study Design and Subjects
A cross‐sectional survey was conducted. Subjects recruited for the survey included internal medicine interns and residents, internal medicine ward attending physicians and hospitalists. Attending physicians had to have been on the wards in the past year. The survey was conducted in November, when all eligible house staff should have had at least 1 ward month. Nearly every hospitalist recruited had spent time on both teaching and nonteaching services.
Task List Compilation and Survey Development
An expert panel was convened consisting of 10 physicians representing 3 hospitals, including residents and faculty, some of which were hospitalists. During the session, the participants developed a task list and discussed the work intensity associated with some of the tasks. The task list was reviewed by the study team and organized into categories. The final list included 99 tasks divided into 6 categories: (1) direct patient care, (2) indirect patient care, (3) search for/finding things, (4) educational/academic activities, (5) personal/downtime activities, and (6) other. Table 1 gives examples of items found in each category. We used the terminology that the study participants used to describe their work (eg, they used the term eyeballing a patient to describe the process of making an initial assessment of the patient's status). This list of 99 items was formatted into a survey to allow study participants to rate each task across 3 domains: physical effort, mental effort, and psychological effort, based on previous studies in anesthesia4 (see Supporting Information). The term mental refers to cognitive effort, whereas psychological refers to emotional effort. We used the same scales with the same anchors as described in the anesthesia literature,4 but substituted the internal medicine specific tasks. Each item was rated on a 7‐point Likert‐type scale (1 = almost no stress or effort; 7 = most effort). The survey also included demographic information regarding the respondent and instructions. The instructions directed respondents to rate each item based on their average experience in performing each task. They were further instructed not to rate tasks they had never performed.
| Categories of Tasks | Examples |
|---|---|
| |
| Direct patient care | Conducting the physical examination, hand washing, putting on isolation gear |
| Indirect patient care | Writing H&P, writing orders, ordering additional labs or tests |
| Searching for/finding things | Finding a computer, finding materials for procedures, finding the patient |
| Personal/downtime activities | Eating dinner, sleep, socializing, calling family members |
| Educational/academic activities | Literature search, teaching medical students, preparing a talk |
| Other | Transporting patients, traveling from place to place, billing |
Survey Process
The potential survey participants were notified via e‐mail that they would be asked to complete the survey during a regularly scheduled meeting. The interns, residents, and faculty met during separate time slots. Data from residents and interns were obtained from teaching sessions they were required to attend (as long as their schedule permitted them to). Survey data for attending physicians were obtained from a general internal medicine meeting and a hospitalist meeting. Because of the type of meeting, subspecialists were less likely to have been included. The objectives of the study and its voluntary nature were presented to the groups, and the survey was given to all attendees at the meetings. Due to the anonymous nature of the survey, a waiver of written informed consent was granted. Time was reserved during the course of the meeting to complete the survey. Before distributing the survey, we counted the total number of people in the room so that a participation rate could be calculated. Respondents were instructed to place the survey in a designated envelope after completing it or to return a blank survey if they did not wish to complete it. There was no time limit for completion of the survey. At all of these sessions, this survey was one part of the meeting agenda.
Data Analysis
Surveys were entered into a Microsoft Excel (Redmond, WA) spreadsheet and then transferred into Stata version 8.0 (College Station, TX), which was used for analysis. Our analysis focused on (1) the description of the effort associated with individual tasks, (2) the description of the effort associated with task categories and comparisons across key categories, and (3) a comparison of effort across the task categories' physical, mental, and psychological domains.
Each task had 3 individual domain scores associated with it: physical, mental (ie, cognitive work), and psychological (ie, emotional work). A composite task effort score was calculated for each task by determining the mean of the 3 domain scores for that task.
An overall effort score was calculated for each of the 6 task categories by determining the mean of the composite task effort scores within each category. We used the composite effort score for each task to calculate the Cronbach's value for each category except other. We compared the overall category effort scores for direct versus indirect patient care using 2‐tailed paired t tests with a significance level of P < 0.05. We further evaluated differences in overall category effort scores for direct patient care between physicians of different genders and between house staff and faculty, using 2‐tailed unpaired t tests, with a significance level of P < 0.05.
Finally, we compared the physical, mental, and psychological domain scores for direct versus indirect patient care categories, using paired t tests.
Ethics
This study was approved by the Institutional Review Board at the Medical College of Wisconsin.
RESULTS
The study participation rate was 69% (59/85). The sample consisted of 31 (52%) women and 40 (68%) house staff (see Table 2). The mean age was 34 years. This participation rate represents approximately 1/3 of the internal medicine house staff and a smaller percentage of the faculty that would have been eligible.
| Demographic | Value |
|---|---|
| |
| Age, y, mean (SD) | 34 (8.8) |
| Female gender, no. (%) | 31 (52) |
| Physician description, no. (%) | |
| Intern | 7 (12) |
| Resident | 33 (56) |
| Hospitalist | 4 (7) |
| Nonhospitalist faculty | 15 (25) |
Individual Task Effort
The mean composite effort score of all 99 tasks is provided in the Supporting Information Table. Overall, the most difficult task was going to codes (in the direct patient care category), with a mean composite rating of 5.37 (standard deviation [SD] 1.5); this was also the most difficult psychological task (5.78 [SD 1.65]). The most difficult mental task was transferring an unstable patient to the intensive care unit (5.47 [SD 1.53]). The most difficult physical task was placing a central line (5.02 [SD 1.63]). The easiest task was using the Internet (in the personal/downtime activities category), with a mean composite rating of 1.41 (SD 0.74); this was also the easiest mental (1.52 [SD 1.01]), psychological (1.3 [SD 0.68]), and physical (1.42 [SD 0.76]) task.
Analysis of Task Categories
The overall and domain characteristics of each task category are given in Table 3. Categories contained between 5 and 41 tasks. The Cronbach's ranged from 0.83 for the personal/downtime activities category to 0.98 for the direct patient care category. The mean overall effort ranged from least difficult for the personal/downtime category (1.72 [SD 0.76]) to most difficult for the education category (3.61 [SD 1.06]).
| Category | No. of Items | Cronbach's | Effort Score, Mean (SD)* | |||
|---|---|---|---|---|---|---|
| Composite Effort | Physical Effort | Mental Effort | Psychological Effort | |||
| ||||||
| Direct patient care | 32 | 0.97 | 3.55 (0.91) | 3.22 (1.06) | 3.89 (0.99) | 3.52 (1.04) |
| Indirect patient care | 41 | 0.98 | 3.21 (0.92) | 2.71 (1.09) | 3.80 (1.02) | 3.20 (1.08) |
| Education | 8 | 0.92 | 3.61 (1.06) | 3.12 (1.26) | 4.27 (1.17) | 3.43 (1.30) |
| Finding things | 5 | 0.85 | 2.94 (0.91) | 3.59 (1.23) | 2.43 (1.05) | 2.79 (1.13) |
| Personal | 7 | 0.83 | 1.72 (0.76) | 1.86 (0.92) | 1.69 (0.85) | 1.63 (0.72) |
| Other | 6 | NC | NC | NC | NC | NC |
Using paired t tests, we determined that the direct patient care category was more difficult than the indirect patient care category overall (3.58 versus 3.21, P < 0.001). Direct patient care was statistically significantly more challenging than indirect patient care on the physical (3.23 vs 2.71; P < 0.001), mental (3.90 vs 3.84; P < 0.05), and psychological domains (3.57 vs 3.20; P < 0.001) as well. There were no significant differences between men and women or between house staff and faculty on the difficulty of direct patient care. We found a trend toward increased difficulty of indirect patient care for house staff versus faculty (3.36 vs 2.92; P 0.10), but no differences by gender.
DISCUSSION
In this study, we used a comprehensive list of tasks performed by internal medicine doctors while admitting patients and produced a numeric assessment of the effort associated with each. The list was generated by an expert panel and comprised 6 categories and 99 items. Residents and attending physicians then rated each task based on level of difficulty, specifically looking at the mental, psychological, and physical effort required by each.
Indirect patient care was the task category in our study that had the most tasks associated with it (41 out of 99). Direct patient care included 32 items, but 10 of these were procedures (eg, lumbar puncture), some of which are uncommonly performed. Several time‐motion studies have been performed to document the work done by residents815 and hospitalists.16, 17 Although our study did not assess the time spent on each task, the distribution of tasks across categories is consistent with these time‐motion studies, which show that the amount of time spent in direct patient care is a small fraction of the amount of time spent in the hospital,12 and that work such as interprofessional communication10 and documentation16 consume the majority of time.
This project allowed us to consider the effort required for inpatient internal medicine work on a more granular level than has been described previously. Although the difficulty of tasks associated with anesthesia and surgical work has been described,3, 4, 7, 1820 our study is a unique contribution to the internal medicine literature. Understanding the difficulty of tasks performed by inpatient physicians is an important step toward better management of workload. With concerns about burnout in hospitalists21, 22 and residents,2325 it seems wise to take the difficulty of the work they do into consideration in a more proactive manner. In addition, understanding workload may have patient safety applications. In one study of mistakes made by house staff, 51% of the survey respondents identified workload as a contributing factor.26
We assessed effort for inpatient work by generating a task list and then measuring 3 domains of each task: physical, mental, and psychological. As a result, we were able to further quantify the difficulty of work completed by physicians. Recent work from outside of medicine suggests that individuals have a finite capacity for mental workload, and when this is breached, decision‐making quality is impaired.27 This suggests that it is important to take work intensity into account when assigning work to individuals. For example, a detailed assessment of workload at the task level combined with the amount of time spent on each task would allow us to know how much effort is typically involved with admitting a new patient. This information would allow for more equal distribution of workload across admitting teams. In addition, these methods could be expanded to understand how much effort is involved in the discharge process. This could be taken into account at the beginning of a day when allocating work such as admissions and discharges between members of a team.
This methodology has the potential to be used in other ways to help quantify the effort required for the work that physicians do. Many departments are struggling to develop a system for giving credit to faculty for the time they spend on nonpatient care activities. Perhaps these methods could be used to develop effort scores associated with administrative tasks, and administrative relative value units could be calculated accordingly. Similar techniques have been used with educational relative value units.28
We know from the nursing literature that workload is related to both burnout and patient safety. Burnout is a process related to the emotional work of providing care to people.29 Our methods clearly incorporate the psychological stress of work into the workload assessment. Evaluating the amount of time spent on tasks with high psychological scores may be helpful in identifying work patterns that are more likely to produce burnout in physicians and nurses.
With respect to patient safety, higher patient‐to‐nurse ratios are associated with failure to rescue30 and nosocomial infections.31 Furthermore, researchers have demonstrated that systems issues can add substantially to nursing workload.32 Methods such as those described in our study take into account both patient‐related and systems‐related tasks, and therefore could result in more detailed workload assessments. With more detailed information about contributors to workload, better predictions about optimal staffing could be made, which would ultimately lead to fewer adverse patient events.
Our study has limitations. First, the initial task list was based on the compilation efforts from only 10 physicians. However, this group of physicians represented 3 hospitals and included both resident and attending physicians. Second, the survey data were gathered from a single institution. Although we included trainees and faculty, more participants would be needed to answer questions about how experience and setting/environmental factors affect these assessments. However, participants were instructed to reflect on their whole experience with each task, which presumably includes multiple institutions and training levels. Third, the sample size is fairly small, with more house staff than faculty (hospitalists and nonhospitalists) represented. Regardless, this study is the first attempt to define and quantify workload for internal medicine physicians using these methods. In future studies, we will expand the number of institutions and levels of experience to validate our current data. Finally, the difficulty of the tasks is clearly a subjective assessment. Although this methodology has face validity, further work needs to be done to validate these findings against other measurements of workload, such as census, or more general subjective workload assessments, such as the NASA task load index.33
In conclusion, we have described the tasks performed by inpatient physicians and the difficulty associated with them. Moreover, we have described a methodology that could be replicated at other centers for the purpose of validating our findings or quantifying workload of other types of tasks. We believe that this is the first step toward a more comprehensive understanding of the workload encountered by inpatient physicians. Because workload has implications for physician burnout and patient safety, it is essential that we fully understand the contributors to workload, including the innate difficulty of the tasks that comprise it.
Acknowledgements
The authors Alexis Visotcky, MS, and Sergey Tarima, PhD, for their assistance with statistics.
This work was presented in poster form at the Society of Hospital Medicine Annual Meeting in April 2010, the Society of General Internal Medicine Annual Meeting in May 2010, and the Society of General Internal Medicine regional meeting in September 2010.
Funding Source: The study team was supported by the following funds during this work: VA grants PPO 0925901 (Marilyn M. Schapira and Kathlyn E. Fletcher) and IIR 07201 (Marilyn M. Schapira, Siddhartha Singh, and Kathlyn E. Fletcher).
- ,,,,.House staff team workload and organization effects on patient outcomes in an academic general internal medicine inpatient service.Arch Intern Med.2007;167:47–52.
- ,,, et al.The work hour rules and contributors to patient care mistakes: A focus group study with internal medicine residentsJ Hosp Med.2008;3:228–237.
- ,,.Multiple measures of anesthesia workload during teaching and nonteaching cases.Anesth Analg.2004;98:1419–1425.
- ,,,,.Developing a technique to measure anesthesiologists' real‐time workload.Proceedings of the Human Factors and Ergonomics Society Annual Meeting.2000;44:241–244.
- ,,, et al.Quantitative description of the workload associated with airway management procedures.J Clin Anesth.2000;12:273–282.
- ,,,,,.An objective methodology for task analysis and workload assessment in anesthesia providers.Anesthesiology.1994;80:77–92.
- ,.Effects of intraoperative reading on vigilance and workload during anesthesia care in an academic medical center.Anesthesiology.2009;110:275–283.
- ,,.Resident work hours: what they are really doing.Arch Surg.2004;139:490–493; discussion, 493–494.
- ,,,,,.Analyzing the time and value of housestaff inpatient work.J Gen Intern Med.1998;13:534–540.
- ,,,.All in a day's work: an observational study to quantify how and with whom doctors on hospital wards spend their time.[see comment].Med J Aust.2008;188:506–509.
- ,,,,.How do house officers spend their nights? A time study of internal medicine house staff on call.N Engl J Med.1989;320:1673–1677.
- ,,,,.Systematic review of time studies evaluating physicians in the hospital setting.J Hosp Med.2010;5:353–359.
- ,,.Time analysis of a general medicine service: results from a random work sampling study.J Gen Intern Med.1994;9:272–277.
- ,,,.A phenomenology of scut.Ann Intern Med.1991;115:372–376.
- ,,, et al.The on‐call experience of interns in internal medicine. Medical Education Task Force of Henry Ford Hospital.Arch Intern Med.1990;150:2294–2297.
- ,,, et al.Where did the day go? A time‐motion study of hospitalists.J Hosp Med.2010;5:323–328.
- ,,.How hospitalists spend their time: insights on efficiency and safety.J Hosp Med.2006;1:88–93.
- ,,, et al.Differences in day and night shift clinical performance in anesthesiology.Hum Factors.2008;50:276–290.
- ,,,,.Assessment of the intrarater and interrater reliability of an established clinical task analysis methodology.Anesthesiology.2002;96:1129–1139.
- ,,.The effect of electronic record keeping and transesophageal echocardiography on task distribution, workload, and vigilance during cardiac anesthesia.Anesthesiology.1997;87:144–155.
- .Fight burnout while fostering experience: investing in hospitalist programs now can fight burnout later.ACP Hospitalist. July2008.
- .Hospitalist burnout: recognize it in yourself and others, and avoid or eliminate it.The Hospitalist. March2006.
- ,,,.Burnout and internal medicine resident work‐hour restrictions.Arch Intern Med.2005;165:2595–2600.
- ,,,,.The effects of work‐hour limitations on resident well‐being, patient care, and education in an internal medicine residency program.Arch Intern Med.2005;165:2601–2606.
- ,,,.Burnout and self‐reported patient care in an internal medicine residency program.Ann Intern Med.2002;136:358–367.
- ,,,.Do house officers learn from their mistakes?Qual Saf Health Care.2003;12:221–226; discussion, 227–228.
- ,,.Extraneous factors in judicial decisions.Proc Natl Acad Sci U S A.2011;108:6889–6892.
- ,.Quantifying physician teaching productivity using clinical relative value units.J Gen Intern Med.1999;14:617–621.
- .Maslach Burnout Inventory Manual.3rd ed.Palo Alto, CA:Consulting Psychology Press;1986.
- ,,,,.Hospital nurse staffing and patient mortality, nurse burnout, and job dissatisfaction.JAMA.2002;288:1987–1993.
- ,,,,.Patient density, nurse‐to‐patient ratio and nosocomial infection risk in a pediatric cardiac intensive care unit.Pediatr Infect Dis J.1997;16:1045–1048.
- ,.Operational failures and interruptions in hospital nursing.Health Serv Res.2006;41:643–662.
- ,.Development of NASA‐TLX (Task Load Index): results of empirical and theoretical research. In: Hancock PA, Meshkati N, eds.Human Mental Workload.Amsterdam, Netherlands:North Holland Press;1988:239–250.
Copyright © 2012 Society of Hospital Medicine
Physician Assistant‐Based General Medical Inpatient Care
In 2003 the Accreditation Council for Graduate Medical Education (ACGME) prescribed residency reform in the form of work hour restrictions without prescribing alternatives to resident based care.1 As a response, many academic medical centers have developed innovative models for providing inpatient care, some of which incorporate Physician Assistants (PAs).2 With further restrictions in resident work hours possible,3 teaching hospitals may increase use of these alternate models to provide inpatient care. Widespread implementation of such new and untested models could impact the care of the approximately 20 million hospitalizations that occur every year in US teaching hospitals.4
Few reports have compared the care delivered by these alternate models with the care provided by traditional resident‐based models of care.58 Roy et al.8 have provided the only recent comparison of a PA‐based model of care with a resident‐based model. They showed lower adjusted costs of inpatient care associated with PA based care but other outcomes were similar to resident‐based teams.
The objective of this study is to provide a valid and usable comparison of the outcomes of a hospitalist‐PA (H‐PA) model of inpatient care with the traditional resident‐based model. This will add to the quantity and quality of the limited research on PA‐based inpatient care, and informs the anticipated increase in the involvement of PAs in this arena.
Methods
Study Design and Setting
We conducted a retrospective cohort study at a 430‐bed urban academic medical center in the Midwestern United States.
Models of General Medical (GM) Inpatient Care at the Study Hospital During the Study Period
In November 2004, as a response to the ACGME‐mandated work hour regulations, we formed 2 Hospitalist‐PA teams (H‐PA) to supplement the 6 preexisting general medicine resident teams (RES).
The H‐PA and RES teams differed in staffing, admitting times and weekend/overnight cross coverage structure (Table 1). There were no predesigned differences between the teams in the ward location of their patients, availability of laboratory/radiology services, specialty consultation, social services/case management resources, nursing resources or documentation requirements for admission, daily care, and discharge.
| H‐PA Teams | RES Teams | |
|---|---|---|
| Attending physician | Always a hospitalist | Hospitalist, non‐hospitalist general internist or rarely a specialist |
| Attending physician role | Supervisory for some patients (about half) and sole care provider for others. | Supervisory for all patients |
| Team composition | One attending paired with 1 PA | Attending + senior resident + (2) interns + (2‐3) medical students |
| Rotation schedule | ||
| Attending | Every 2 weeks | Every 2 weeks |
| Physician assistant | Off on weekends | |
| House staff & medical students | Every month | |
| Weekend | No new admissions & hospitalist manages all patients | Accept new admissions |
| Admission times (weekdays) | 7 AM to 3 PM | Noon to 7 AM |
| Source of admissions | Emergency room, clinics, other hospitals | Emergency room, clinics, other hospitals |
| Number of admissions (weekdays) | 4‐6 patients per day per team | Noon to 5 PM: 2 teams admit a maximum of 9 patients total |
| 5 PM to 7 AM: 3 teams admit a maximum 5 patients each. | ||
| Overnight coverageroles and responsibilities | One in‐house faculty | 3 on call interns |
| Cross‐covering 2 H‐PA teams | Cross‐covering 2 teams each | |
| Performing triage | Admitting up to 5 patients each | |
| Admitting patients if necessary | ||
| Assisting residents if necessary | ||
| General medical consultation |
Admission Schedule for H‐PA or RES Teams
The admitting schedule was designed to decrease the workload of the house staff and to do so specifically during the periods of peak educational activity (morning report, attending‐led teaching rounds, and noon report). A faculty admitting medical officer (AMO) assigned patients strictly based on the time an admission was requested. Importantly, the request for admission preceded the time of actual admission recorded when the patient reached the ward. The time difference between request for admission and actual admission depended on the source of admission and the delay associated with assigning a patient room. The AMO assigned 8 to 12 new patients to the H‐PA teams every weekday between 7 AM and 3 PM and to the RES teams between noon and 7 AM the next day. There was a designed period of overlap from noon to 3 PM during which both H‐PA and RES teams could admit patients. This period allowed for flexibility in assigning patients to either type of team depending on their workload. The AMO did not use patient complexity or teaching value to assign patients.
Exceptions to Admission Schedule
Patients admitted overnight after the on call RES had reached their admission limits were assigned to H‐PA teams the next morning. In addition, recently discharged patients who were readmitted while the discharging hospitalist (H‐PA teams) or the discharging resident (RES teams) was still scheduled for inpatient duties, were assigned back to the discharging team irrespective of the admitting schedule.
The same medicine team cared for a patient from admission to discharge but on transfer to the intensive care unit (ICU), an intensivist led critical care team assumed care. On transfer out of the ICU these patients were assigned back to the original team irrespective of admitting schedulethe so called bounce back rule to promote inpatient continuity of care. But if the residents (RES teams) or the hospitalist (H‐PA teams) had changedthe bounce back rule was no longer in effect and these patients were assigned to a team according to the admission schedule.
Study Population and Study Period
We included all hospitalizations of adult patients to GM teams if both their date of admission and their date of discharge fell within the study period (January 1, 2005 to December 31, 2006). We excluded hospitalizations with admissions during the weekendwhen H‐PA teams did not admit patients; hospitalizations to GM services with transfer to nonGM service (excluding ICU) and hospitalizations involving comanagement with specialty servicesas the contribution of GM teams for these was variable; and hospitalizations of private patients.
Data Collection and Team Assignment
We collected patient data from our hospital's discharge abstract database. This database did not contain team information so to assign teams we matched the discharging attending and the day of discharge to the type of team that the discharging attending was leading that day.
We collected patient age, gender, race, insurance status, zip‐code, primary care provider, source of admission, ward type, time and day of admission, and time and day of discharge for use as independent variables. The time of admission captured in the database was the time of actual admission and not the time the admission was requested.
We grouped the principal diagnosis International Statistical Classification of Diseases and Related Health Problems, 9th edition (ICD‐9) codes into clinically relevant categories using the Clinical Classification Software.9 We created comorbidity measures using Healthcare Cost and Utilization Project Comorbidity Software, version 3.4.10
Outcome Measures
We used length of stay (LOS), charges, readmissions within 7, 14, and 30 days and inpatient mortality as our outcome measures. We calculated LOS by subtracting the discharge day and time from the admission day and time. The LOS included time spent in the ICU. We summed all charges accrued during the entire hospitalization including any stay in the ICU but did not include professional fees. We considered any repeat hospitalization to our hospital within 7, 14, and 30 days following a discharge to be a readmission except that we excluded readmissions for a planned procedure or for inpatient rehabilitation.
Statistical Analysis
Descriptive Analysis
We performed unadjusted descriptive statistics at the level of an individual hospitalization using medians and interquartile ranges for continuous data and frequencies and percentages for categorical data. We used chi‐square tests of association and KruskalWallis analysis of variance to compare H‐PA and RES teams.
Missing Data
Because we lacked data on whether a primary outpatient care provider was available for 284 (2.9%) of our study hospitalizations, we dropped them from our multivariable analyses. We used an arbitrary discharge time of noon for the 11 hospitalizations which did not have a discharge time recorded.
Multivariable Analysis
We used multivariable mixed models to risk adjust for a wide variety of variables. We included age, gender, race, insurance, presence of primary care physician, and total number of comorbidities as fixed effects in all models because of the high face validity of these variables. We then added admission source, ward, time, day of week, discharge day of week, and comorbidity measures one by one as fixed effects, including them only if significant at P < 0.01. For assessing LOS, charges, and readmissions, we added a variable identifying each patient as a random effect to account for multiple admissions for the same patient. We then added variables identifying attending physician, principal diagnostic group, and ZIP code of residence as random effects to account for clustering of hospitalizations within these categories, including them only if significant at P < 0.01. For the model assessing mortality we included variables for attending physician, principal diagnostic group, and ZIP code of residence as random effects if significant at P < 0.01. We log transformed LOS and charges because they were extremely skewed in nature. Readmissions were analyzed after excluding patients who died or were discharged alive within 7, 14, or 30 days of the end of the study period.
Sensitivity Analyses
To assess the influence of LOS outliers, we changed LOS to 6 hours if it was less than 6 hours, and 45 days if it was more than 45 daysa process called winsorizing. We consider winsorizing superior to dropping outliers because it acknowledges that outliers contribute information, but prevent them from being too influential. We chose the 6 hour cut off because we believed that was the minimum time required to admit and then discharge a patient. We chose the upper limit of 45 days on reviewing the frequency distribution for outliers. Similarly, we winsorized charges at the first and 99th percentile after reviewing the frequency distribution for outliers. We then log transformed the winsorized data before analysis.
Inpatient deaths reduce the LOS and charges associated with a hospitalization. Thus excess mortality may provide a false concession in terms of lower LOS or charges. To check if this occurred in our study we repeated the analyses after excluding inpatient deaths.
ICU stays are associated with higher LOS, charges, and mortality. In our model of care, some patients transferred to the ICU are not cared for by the original team on transfer out. Moreover, care in the ICU is not controlled by the team that discharges them. Since this might obscure differences in outcomes achieved by RES vs. H‐PA teams, we repeated these analyses after excluding hospitalizations with an ICU stay.
Since mortality can only occur during 1 hospitalization per patient, we repeated the mortality analysis using only each patient's first admission or last admission and using a randomly selected single admission for each patient.
Subgroup Analysis
To limit the effect of different physician characteristics on H‐PA and RES teams we separately analyzed the hospitalizations under the care of hospitalists who served on both H‐PA and RES teams.
To limit the effect of different admission schedules of H‐PA and RES teams we analyzed the hospitalizations with admission times between 11.00 AM and 4.00 PM. Such hospitalizations were likely to be assigned during the noon to 3 PM period when they could be assigned to either an H‐PA or RES team.
Interactions
Finally we explored interactions between the type of team and the fixed effect variables included in each model.
Statistical Software
We performed the statistical analysis using SAS software version 9.0 for UNIX (SAS Institute, Inc., Cary, NC) and R software (The R Project for Statistical Computing).
This study protocol was approved by the hospital's institutional review board.
Results
Study Population
Of the 52,391 hospitalizations to our hospital during the study period, 13,058 were admitted to general medicine. We excluded 3102 weekend admissions and 209 who met other exclusion criteria. We could not determine the team assignment for 66. Of the remaining 9681 hospitalizations, we assigned 2171 to H‐PA teams and 7510 to RES teams (Figure 1).

Descriptive Analysis
We compare patients assigned to H‐PA and RES teams in Table 2. They were similar in age, gender, race, having a primary care provider or not, and insurance status. Clinically, they had similar comorbidities and a similar distribution of common principal diagnoses. Consistent with their admitting schedule, H‐PA teams admitted and discharged more patients earlier in the day and admitted more patients earlier in the work week. Patients cared for by H‐PA teams were admitted from the Emergency Room (ER) less often and were more likely to reside on wards designated as nonmedicine by nursing specialty. Hospitalizations to H‐PA teams more often included an ICU stay.
| H‐PA (n = 2171) | RES (n = 7510) | P Value | |
|---|---|---|---|
| |||
| Age | |||
| Mean | 56.80 | 57.04 | |
| Median | 56 | 56 | 0.15 |
| Interquartile range | 43‐72 | 43‐73 | |
| Age group (years), n (%) | |||
| < 20 | 10 (0.5) | 57 (0.8) | |
| 20‐29 | 186 (8.6) | 632 (8.7) | |
| 30‐39 | 221 (10.2) | 766 (10.3) | |
| 40‐49 | 387 (17.8) | 1341 (18.1) | |
| 50‐59 | 434 (20.0) | 1492 (20.2) | 0.28 |
| 60‐69 | 325 (15.0) | 974 (12.8) | |
| 70‐79 | 271 (12.5) | 1035 (13.6) | |
| 80‐89 | 262 (12.0) | 951(12.3) | |
| 90< | 75 (3.5) | 262 (3.4) | |
| Female, n (%) | 1175 (54.1) | 4138 (55.1) | 0.42 |
| Race, n (%) | |||
| White | 1282 (59.1) | 4419 (58.9) | |
| Black | 793 (36.5) | 2754 (36.7) | 0.98 |
| Other | 96 (4.4) | 337 (4.5) | |
| Primary care provider, n (%) | 0.16 | ||
| Yes | 1537 (73.2) | 5451 (74.7) | |
| Missing: 284 | 71 (3.3) | 213 (2.8) | |
| Insurance status, n (%) | |||
| Commercial/worker's comp | 440 (20.3) | 1442 (19.2) | |
| Medicare | 1017 (46.8) | 3589 (47.8) | 0.52 |
| Medicaid/others | 714 (32.9) | 2479 (33.0) | |
| Time of admission, n (%) | |||
| 0000‐0259 | 167 (7.7) | 1068 (14.2) | |
| 0300‐0559 | 244 (11.2) | 485 (6.5) | |
| 0600‐0859 | 456 (21.0) | 270 (3.6) | |
| 0900‐1159 | 782 (36.0) | 1146 (15.3) | <0.001 |
| 1200‐1459 | 299 (13.8) | 1750 (23.3) | |
| 1500‐1759 | 155 (7.1) | 1676 (22.3) | |
| 1800‐2359 | 68 (3.1) | 1115 (14.9) | |
| Time of discharge, n (%) | |||
| 2100‐0859 | 36 (1.7) | 174 (2.3) | |
| 0900‐1159 | 275 (12.7) | 495 (6.6) | |
| 1200‐1459 | 858 (39.6) | 2608 (34.8) | <0.001 |
| 1500‐1759 | 749 (34.6) | 3122 (41.6) | |
| 1800‐2059 | 249 (11.5) | 1104 (14.7) | |
| Missing | 4 | 7 | |
| Day of week of admission, n (%) | |||
| Monday | 462 (21.3) | 1549 (20.6) | |
| Tuesday | 499 (23.0) | 1470 (19.6) | |
| Wednesday | 430 (19.8) | 1479 (19.7) | 0.001 |
| Thursday | 400 (18.4) | 1482 (19.7) | |
| Friday | 380 (17.5) | 1530 (20.4) | |
| Day of week of discharge, n (%) | |||
| Monday | 207 (9.5) | 829 (11.0) | |
| Tuesday | 268 (12.3) | 973 (13.0) | |
| Wednesday | 334 (15.4) | 1142 (15.2) | |
| Thursday | 362 (16.7) | 1297 (17.3) | 0.16 |
| Friday | 485 (22.3) | 1523 (20.3) | |
| Saturday | 330 (15.2) | 1165 (15.5) | |
| Sunday | 185 (8.5) | 581 (7.7) | |
| Admit to non‐medicine wards, n (%) | 1332 (61.4) | 2624 (34.9) | <0.001 |
| Transfer to ICU (at least once), n (%) | 299 (13.8) | 504 (6.7) | <0.001 |
| Admit from ER No (%) | 1663 (76.6) | 6063 (80.7) | <0.001 |
| 10 most frequent diagnosis (%) | Pneumonia (4.9) | Pneumonia (5.5) | |
| Congestive heart failure; nonhypertensive (4.2) | Congestive heart failure; nonhypertensive (3.9) | ||
| Sickle cell anemia (3.9) | Nonspecific chest pain (3.7) | ||
| Chronic obstructive pulmonary disease and Bronchiectasis (3.3) | Urinary tract infections(3.6) | ||
| Diabetes mellitus with complications (3.2) | Skin and subcutaneous tissue infections (3.3) | ||
| Urinary tract infections (3.2) | Sickle cell anemia (3.3) | ||
| Asthma (3.0) | Pancreatic disorders (not diabetes) (2.8) | ||
| Nonspecific chest pain (3.0) | Asthma (2.8) | ||
| Pancreatic disorders (not diabetes) (2.9) | Chronic obstructive pulmonary disease and Bronchiectasis (2.6) | ||
| Septicemia (2.2) | Diabetes mellitus with complications (2.6) | ||
| Average number of comorbidities mean (95% CI) | 0.39 (0.37‐0.42) | 0.38 (0.36‐0.39) | 0.23 |
In unadjusted comparisons of outcomes (Table 3), hospitalizations on H‐PA teams had higher lengths of stay and charges than hospitalizations on RES teams, possibly higher inpatient mortality rates but similar unadjusted readmission rates at 7, 14, and 30 days
| H‐PA (n = 2171) | RES (n = 7150) | % Difference* (CI) | P Value | |
|---|---|---|---|---|
| ||||
| LOS | Median (IQR) | Median (IQR) | ||
| Days | 3.17 (2.03‐5.30) | 2.99 (1.80‐5.08) | +8.9% (4.71‐13.29%) | <0.001 |
| Charges | ||||
| US Dollars | 9390 (6196‐16,239) | 9044 (6106‐14,805) | +5.56% (1.96‐9.28%) | 0.002 |
| Readmissions | n (%) | n (%) | Odds Ratio (CI) | |
| Within 7 days | 147 (6.96) | 571 (7.78) | 0.88 (0.73‐1.06) | 0.19 |
| Within14 days | 236 (11.34) | 924 (12.76) | 0.87 (0.75‐1.01) | 0.07 |
| Within 30 days | 383 (18.91) | 1436 (20.31) | 0.91 (0.80‐1.03) | 0.14 |
| Inpatient deaths | 39 (1.8) | 95 (1.3) | 1.36 (0.90‐2.00) | 0.06 |
Multivariable Analysis
LOS
Hospitalizations to H‐PA teams were associated with a 6.73% longer LOS (P = 0.005) (Table 4). This difference persisted when we used the winsorized data (6.45% increase, P = 0.006), excluded inpatient deaths (6.81% increase, P = 0.005), or excluded hospitalizations that involved an ICU stay (6.40%increase, P = 0.011) (Table 5).
| Overall | Subgroup: Restricted to Physicians Attending on Both H‐PA and RES Teams* | Subgroup: Restricted to Hospitalizations Between 11.00 AM and 4.00 PM | ||||
|---|---|---|---|---|---|---|
| % Difference (CI) | P Value | % Difference (CI) | P Value | % Difference (CI) | P Value | |
| ||||||
| LOS | 6.73% (1.99% to 11.70%) | 0.005 | 5.44% (0.65% to 11.91%) | 0.08 | 2.97% (4.47% to 10.98%) | 0.44 |
| Charges | 2.75% (1.30% to 6.97%) | 0.19 | 1.55% (3.76% to 7.16%) | 0.57 | 6.45% (0.62% to 14.03%) | 0.07 |
| Risk of Readmission | Adjusted OR (95%CI) | P Value | Adjusted OR (95% CI) | P Value | Adjusted OR (95% CI) | P Value |
| Within 7 days | 0.88 (0.64‐1.20) | 0.42 | 0.74 (0.40‐1.35) | 0.32 | 0.90 (0.40‐2.00) | 0.78 |
| Within14 days | 0.90 (0.69‐1.19) | 0.46 | 0.71 (0.51‐0.99) | 0.05 | 0.87 (0.36‐2.13) | 0.77 |
| Within 30 days | 0.89 (0.75‐1.06) | 0.20 | 0.75 (0.51‐1.08) | 0.12 | 0.92 (0.55‐1.54) | 0.75 |
| Inpatient mortality | 1.27 (0.82‐1.97) | 0.28 | 1.46 (0.67‐3.17) | 0.33 | 1.14 (0.47‐2.74) | 0.77 |
| Analysis With Winsorized Data | Analysis After Excluding Inpatient Deaths | Analysis After Excluding Patients With ICU Stays | ||||
|---|---|---|---|---|---|---|
| % Difference (CI) | P Value | % Difference (CI) | P Value | % Difference (CI) | P Value | |
| ||||||
| LOS | 6.45% (4.04 to 8.91%) | 0.006 | 6.81% (2.03 to 11.80%) | 0.005 | 6.40% (1.46 to 11.58%) | 0.011 |
| Charges | 2.67 (1.27 to 6.76%) | 0.187 | 2.89% (1.16 to 7.11%) | 0.164 | 0.74% (3.11 to 4.76%) | 0.710 |
Charges
Hospitalizations to H‐PA and RES teams were associated with similar charges (Table 4). The results were similar when we used winsorized data, excluded inpatient deaths or excluded hospitalizations involving an ICU stay (Table 5).
Readmissions
The risk of readmission at 7, 14, and 30 days was similar between hospitalizations to H‐PA and RES teams (Table 4).
Mortality
The risk of inpatient death was similar between all hospitalizations to H‐PA and RES teams or only hospitalizations without an ICU stay (Table 4). The results also remained the same in analyses restricted to first admissions, last admissions, or 1 randomly selected admission per patient.
Sub‐Group Analysis
On restricting the multivariable analyses to the subset of hospitalists who staffed both types of teams (Table 4), the increase in LOS associated with H‐PA care was no longer significant (5.44% higher, P = 0.081). The charges, risk of readmission at 7 and 30 days, and risk of inpatient mortality remained similar. The risk of readmission at 14 days was slightly lower following hospitalizations to H‐PA teams (odds ratio 0.71, 95% confidence interval [CI] 0.51‐0.99).
The increase in LOS associated with H‐PA care was further attenuated in analyses of the subset of admissions between 11.00 AM and 4.00 PM (2.97% higher, P = 0.444). The difference in charges approached significance (6.45% higher, P = 0.07), but risk of readmission at 7, 14, and 30 days and risk of inpatient mortality were no different (Table 4).
Interactions
On adding interaction terms between the team assignment and the fixed effect variables in each model we detected that the effect of H‐PA care on LOS (P < 0.001) and charges (P < 0.001) varied by time of admission (Figure 2a and b). Hospitalizations to H‐PA teams from 6.00 PM to 6.00 AM had greater relative increases in LOS as compared to hospitalizations to RES teams during those times. Similarly, hospitalizations during the period 3.00 PM to 3.00 AM had relatively higher charges associated with H‐PA care compared to RES care.
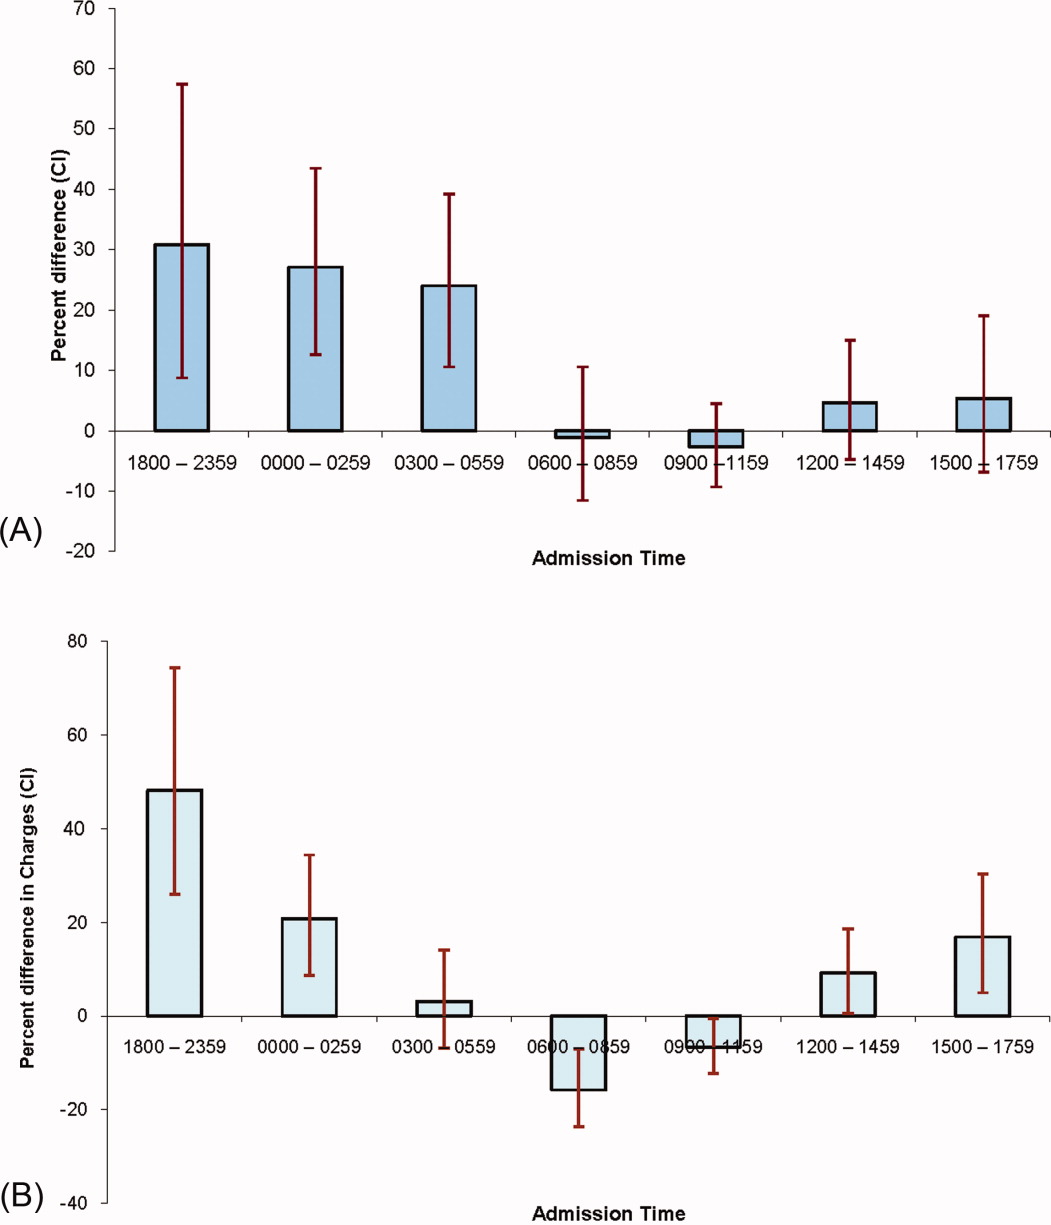
Discussion
We found that hospitalizations to our H‐PA teams had longer LOS but similar charges, readmission rates, and mortality as compared to traditional resident‐based teams. These findings were robust to multiple sensitivity and subgroup analyses but when we examined times when both types of teams could receive admissions, the difference in LOS was markedly attenuated and nonsignificant.
We note that most prior reports comparing PA‐based models of inpatient care predate the ACGME work hour regulations. In a randomized control trial (1987‐1988) Simmer et al.5 showed lower lengths of stay and charges but possibly higher risk of readmission for PA based teams as compared to resident based teams. Van Rhee et al.7 conducted a nonrandomized retrospective cohort study (1994‐1995) using administrative data which showed lower resource utilization for PA‐based inpatient care. Our results from 2005 to 2006 reflect the important changes in the organization and delivery of inpatient care since these previous investigations.
Roy et al.8 report the only previously published comparison of PA and resident based GM inpatient care after the ACGME mandated work hour regulations. They found PA‐based care was associated with lower costs, whereas we found similar charges for admissions to RES and H‐PA teams. They also found that LOS was similar for PA and resident‐based care, while we found a higher LOS for admissions to our H‐PA team. We note that although the design of Roy's study was similar to our own, patients cared for by PA‐based teams were geographically localized in their model. This may contribute to the differences in results noted between our studies.
Despite no designed differences in patients assigned to either type of team other than time of admission we noted some differences between the H‐PA and RES teams in the descriptive analysis. These differences, such as a higher proportion of hospitalizations to H‐PA teams being admitted from the ER, residing on nonmedicine wards or having an ICU stay are likely a result of our system of assigning admissions to H‐PA teams early during the workday. For example patients on H‐PA teams were more often located on nonmedicine wards as a result of later discharges and bed availability on medicine wards. The difference that deserves special comment is the much higher proportion (13.8% vs. 6.7%) of hospitalizations with an ICU stay on the H‐PA teams. Hospitalizations directly to the ICU were excluded from our study which means that the hospitalizations with an ICU stay in our study were initially admitted to either H‐PA or RES teams and then transferred to the ICU. Transfers out of the ICU usually occur early in the workday when H‐PA teams accepted patients per our admission schedule. These patients may have been preferentially assigned to H‐PA teams, if on returning from the ICU the original team's resident had changed (and the bounce back rule was not in effect). Importantly, the conclusions of our research are not altered on controlling for this difference in the teams by excluding hospitalizations with an ICU stay.
Hospitalizations to H‐PA teams were associated with higher resource utilization if they occurred later in the day or overnight (Figure 2a and b). During these times a transition of care occurred shortly after admission. For a late day admission the H‐PA teams would transfer care for overnight cross cover soon after the admission and for patients admitted overnight as overflow they would assume care of a patient from the nighttime covering physician performing the admission. On the other hand, on RES teams, interns admitting patients overnight continued to care for their patients for part of the following day (30‐hour call). Similar findings of higher resource utilization associated with transfer of care after admission in the daytime11 and nighttime12 have been previously reported. An alternative hypothesis for our findings is that the hospital maybe busier and thus less efficient during times when H‐PA teams had to admit later in the day or accept patients admitted overnight as overflow. Future research to determine the cause of this significant interaction between team assignment and time of admission on resource utilization is important as the large increases in LOS (up to 30%) and charges (up to 50%) noted, could have a potentially large impact if a higher proportion of hospitalizations were affected by this phenomenon.
Our H‐PA teams were assigned equally complex patients as our RES teams, in contrast to previous reports.8, 13 This was accomplished while improving the resident's educational experience and we have previously reported increases in our resident's board pass rates and in‐service training exam scores with that introduction of our H‐PA teams.14 We thus believe that selection of less complex patients to H‐PA teams such as ours is unnecessary and may give them a second tier status in academic settings.
Our report has limitations. It is a retrospective, nonrandomized investigation using a single institution's administrative database and has the limitations of not being able to account for unmeasured confounders, severity of illness, errors in the database, selection bias and has limited generalizability. We measured charges not actual costs,15 but we feel charges are a true reflection of relative resource use when compared between similar patients within a single institution. We also did not account for the readmissions that occur to other hospitals16 and our results do not reflect resource utilization for the healthcare system in total. For example, we could not tell if higher LOS on H‐PA teams resulted in lower readmissions for their patients in all hospitals in the region, which may reveal an overall resource savings. Additionally, we measured in‐hospital mortality and could not capture deaths related to hospital care that may occur shortly after discharge.
ACGME has proposed revised standards that may further restrict resident duty hours when they take effect in July 2011.3 This may lead to further decreases in resident‐based inpatient care. Teaching hospitals will need to continue to develop alternate models for inpatient care that do not depend on house staff. Our findings provide important evidence to inform the development of such models. Our study shows that one such model: PAs paired with hospitalists, accepting admissions early in the workday, with hospitalist coverage over the weekend and nights can care for GM inpatients as complex as those cared for by resident‐based teams without increasing readmission rates, inpatient mortality, or charges but at the cost of slightly higher LOS.
- ACGME‐Common Program Requirements for Resident Duty Hours. Available at: http://www.acgme.org/acWebsite/dutyHours/dh_ComProgrRequirmentsDutyHours0707.pdf. Accessed July 2010.
- ,,,,.Non‐housestaff medicine services in academic centers: models and challenges.J Hosp Med.2008;3(3):247–255.
- ACGME. Duty Hours: Proposed Standards for Review and comment. Available at: http://acgme‐2010standards.org/pdf/Proposed_Standards. pdf. Accessed July 22,2010.
- Agency for Health Care Policy and Research. HCUPnet: A tool for identifying, tracking, and analyzing national hospital statistics. Available at: http://hcup.ahrq.gov/HCUPnet.asp. Accessed July2010.
- ,,,,.A randomized, controlled trial of an attending staff service in general internal medicine.Med Care.1991;29(7 suppl):JS31–JS40.
- ,.Replacing an academic internal medicine residency program with a physician assistant‐‐hospitalist model: a Comparative Analysis Study.Am J Med Qual.2009;24(2):132–139.
- ,,.Resource use by physician assistant services versus teaching services.JAAPA.2002;15(1):33–42.
- ,,, et al.Implementation of a physician assistant/hospitalist service in an academic medical center: impact on efficiency and patient outcomes.J Hosp Med.2008;3(5):361–368.
- AHRQ. Clinical Classifications Software (CCS) for ICD‐9‐CM. Available at: http://www.hcup‐us.ahrq.gov/toolssoftware/ccs/ccs.jsp#overview. Accessed July2010.
- AHRQ. HCUP: Comorbidity Software, Version 3.4.;Available at: http://www.hcup‐us.ahrq.gov/toolssoftware/comorbidity/comorbidity.jsp. Accessed July2010.
- ,,, et al.Effect of short call admission on length of stay and quality of care for acute decompensated heart failure.Circulation.2008;117(20):2637–2644.
- ,,,.Post‐call transfer of resident responsibility: its effect on patient care.J Gen Intern Med.1990;5(6):501–505.
- ,,,,,.The effect of nonteaching services on the distribution of inpatient cases for internal medicine residents.Acad Med.2009:84(2):220–225.
- ,,, et al.Allowing for better resident education and improving patient care: hospitalist‐physician assistant teams fill in the gaps.J Hosp Med.2007;2[S2]:1–39.
- .The distinction between cost and charges.Ann Intern Med.1982;96(1):102–109.
- ,,.Rehospitalizations among patients in the Medicare Fee‐for‐Service Program.N Engl J Med.2009;360(14):1418–1428.
In 2003 the Accreditation Council for Graduate Medical Education (ACGME) prescribed residency reform in the form of work hour restrictions without prescribing alternatives to resident based care.1 As a response, many academic medical centers have developed innovative models for providing inpatient care, some of which incorporate Physician Assistants (PAs).2 With further restrictions in resident work hours possible,3 teaching hospitals may increase use of these alternate models to provide inpatient care. Widespread implementation of such new and untested models could impact the care of the approximately 20 million hospitalizations that occur every year in US teaching hospitals.4
Few reports have compared the care delivered by these alternate models with the care provided by traditional resident‐based models of care.58 Roy et al.8 have provided the only recent comparison of a PA‐based model of care with a resident‐based model. They showed lower adjusted costs of inpatient care associated with PA based care but other outcomes were similar to resident‐based teams.
The objective of this study is to provide a valid and usable comparison of the outcomes of a hospitalist‐PA (H‐PA) model of inpatient care with the traditional resident‐based model. This will add to the quantity and quality of the limited research on PA‐based inpatient care, and informs the anticipated increase in the involvement of PAs in this arena.
Methods
Study Design and Setting
We conducted a retrospective cohort study at a 430‐bed urban academic medical center in the Midwestern United States.
Models of General Medical (GM) Inpatient Care at the Study Hospital During the Study Period
In November 2004, as a response to the ACGME‐mandated work hour regulations, we formed 2 Hospitalist‐PA teams (H‐PA) to supplement the 6 preexisting general medicine resident teams (RES).
The H‐PA and RES teams differed in staffing, admitting times and weekend/overnight cross coverage structure (Table 1). There were no predesigned differences between the teams in the ward location of their patients, availability of laboratory/radiology services, specialty consultation, social services/case management resources, nursing resources or documentation requirements for admission, daily care, and discharge.
| H‐PA Teams | RES Teams | |
|---|---|---|
| Attending physician | Always a hospitalist | Hospitalist, non‐hospitalist general internist or rarely a specialist |
| Attending physician role | Supervisory for some patients (about half) and sole care provider for others. | Supervisory for all patients |
| Team composition | One attending paired with 1 PA | Attending + senior resident + (2) interns + (2‐3) medical students |
| Rotation schedule | ||
| Attending | Every 2 weeks | Every 2 weeks |
| Physician assistant | Off on weekends | |
| House staff & medical students | Every month | |
| Weekend | No new admissions & hospitalist manages all patients | Accept new admissions |
| Admission times (weekdays) | 7 AM to 3 PM | Noon to 7 AM |
| Source of admissions | Emergency room, clinics, other hospitals | Emergency room, clinics, other hospitals |
| Number of admissions (weekdays) | 4‐6 patients per day per team | Noon to 5 PM: 2 teams admit a maximum of 9 patients total |
| 5 PM to 7 AM: 3 teams admit a maximum 5 patients each. | ||
| Overnight coverageroles and responsibilities | One in‐house faculty | 3 on call interns |
| Cross‐covering 2 H‐PA teams | Cross‐covering 2 teams each | |
| Performing triage | Admitting up to 5 patients each | |
| Admitting patients if necessary | ||
| Assisting residents if necessary | ||
| General medical consultation |
Admission Schedule for H‐PA or RES Teams
The admitting schedule was designed to decrease the workload of the house staff and to do so specifically during the periods of peak educational activity (morning report, attending‐led teaching rounds, and noon report). A faculty admitting medical officer (AMO) assigned patients strictly based on the time an admission was requested. Importantly, the request for admission preceded the time of actual admission recorded when the patient reached the ward. The time difference between request for admission and actual admission depended on the source of admission and the delay associated with assigning a patient room. The AMO assigned 8 to 12 new patients to the H‐PA teams every weekday between 7 AM and 3 PM and to the RES teams between noon and 7 AM the next day. There was a designed period of overlap from noon to 3 PM during which both H‐PA and RES teams could admit patients. This period allowed for flexibility in assigning patients to either type of team depending on their workload. The AMO did not use patient complexity or teaching value to assign patients.
Exceptions to Admission Schedule
Patients admitted overnight after the on call RES had reached their admission limits were assigned to H‐PA teams the next morning. In addition, recently discharged patients who were readmitted while the discharging hospitalist (H‐PA teams) or the discharging resident (RES teams) was still scheduled for inpatient duties, were assigned back to the discharging team irrespective of the admitting schedule.
The same medicine team cared for a patient from admission to discharge but on transfer to the intensive care unit (ICU), an intensivist led critical care team assumed care. On transfer out of the ICU these patients were assigned back to the original team irrespective of admitting schedulethe so called bounce back rule to promote inpatient continuity of care. But if the residents (RES teams) or the hospitalist (H‐PA teams) had changedthe bounce back rule was no longer in effect and these patients were assigned to a team according to the admission schedule.
Study Population and Study Period
We included all hospitalizations of adult patients to GM teams if both their date of admission and their date of discharge fell within the study period (January 1, 2005 to December 31, 2006). We excluded hospitalizations with admissions during the weekendwhen H‐PA teams did not admit patients; hospitalizations to GM services with transfer to nonGM service (excluding ICU) and hospitalizations involving comanagement with specialty servicesas the contribution of GM teams for these was variable; and hospitalizations of private patients.
Data Collection and Team Assignment
We collected patient data from our hospital's discharge abstract database. This database did not contain team information so to assign teams we matched the discharging attending and the day of discharge to the type of team that the discharging attending was leading that day.
We collected patient age, gender, race, insurance status, zip‐code, primary care provider, source of admission, ward type, time and day of admission, and time and day of discharge for use as independent variables. The time of admission captured in the database was the time of actual admission and not the time the admission was requested.
We grouped the principal diagnosis International Statistical Classification of Diseases and Related Health Problems, 9th edition (ICD‐9) codes into clinically relevant categories using the Clinical Classification Software.9 We created comorbidity measures using Healthcare Cost and Utilization Project Comorbidity Software, version 3.4.10
Outcome Measures
We used length of stay (LOS), charges, readmissions within 7, 14, and 30 days and inpatient mortality as our outcome measures. We calculated LOS by subtracting the discharge day and time from the admission day and time. The LOS included time spent in the ICU. We summed all charges accrued during the entire hospitalization including any stay in the ICU but did not include professional fees. We considered any repeat hospitalization to our hospital within 7, 14, and 30 days following a discharge to be a readmission except that we excluded readmissions for a planned procedure or for inpatient rehabilitation.
Statistical Analysis
Descriptive Analysis
We performed unadjusted descriptive statistics at the level of an individual hospitalization using medians and interquartile ranges for continuous data and frequencies and percentages for categorical data. We used chi‐square tests of association and KruskalWallis analysis of variance to compare H‐PA and RES teams.
Missing Data
Because we lacked data on whether a primary outpatient care provider was available for 284 (2.9%) of our study hospitalizations, we dropped them from our multivariable analyses. We used an arbitrary discharge time of noon for the 11 hospitalizations which did not have a discharge time recorded.
Multivariable Analysis
We used multivariable mixed models to risk adjust for a wide variety of variables. We included age, gender, race, insurance, presence of primary care physician, and total number of comorbidities as fixed effects in all models because of the high face validity of these variables. We then added admission source, ward, time, day of week, discharge day of week, and comorbidity measures one by one as fixed effects, including them only if significant at P < 0.01. For assessing LOS, charges, and readmissions, we added a variable identifying each patient as a random effect to account for multiple admissions for the same patient. We then added variables identifying attending physician, principal diagnostic group, and ZIP code of residence as random effects to account for clustering of hospitalizations within these categories, including them only if significant at P < 0.01. For the model assessing mortality we included variables for attending physician, principal diagnostic group, and ZIP code of residence as random effects if significant at P < 0.01. We log transformed LOS and charges because they were extremely skewed in nature. Readmissions were analyzed after excluding patients who died or were discharged alive within 7, 14, or 30 days of the end of the study period.
Sensitivity Analyses
To assess the influence of LOS outliers, we changed LOS to 6 hours if it was less than 6 hours, and 45 days if it was more than 45 daysa process called winsorizing. We consider winsorizing superior to dropping outliers because it acknowledges that outliers contribute information, but prevent them from being too influential. We chose the 6 hour cut off because we believed that was the minimum time required to admit and then discharge a patient. We chose the upper limit of 45 days on reviewing the frequency distribution for outliers. Similarly, we winsorized charges at the first and 99th percentile after reviewing the frequency distribution for outliers. We then log transformed the winsorized data before analysis.
Inpatient deaths reduce the LOS and charges associated with a hospitalization. Thus excess mortality may provide a false concession in terms of lower LOS or charges. To check if this occurred in our study we repeated the analyses after excluding inpatient deaths.
ICU stays are associated with higher LOS, charges, and mortality. In our model of care, some patients transferred to the ICU are not cared for by the original team on transfer out. Moreover, care in the ICU is not controlled by the team that discharges them. Since this might obscure differences in outcomes achieved by RES vs. H‐PA teams, we repeated these analyses after excluding hospitalizations with an ICU stay.
Since mortality can only occur during 1 hospitalization per patient, we repeated the mortality analysis using only each patient's first admission or last admission and using a randomly selected single admission for each patient.
Subgroup Analysis
To limit the effect of different physician characteristics on H‐PA and RES teams we separately analyzed the hospitalizations under the care of hospitalists who served on both H‐PA and RES teams.
To limit the effect of different admission schedules of H‐PA and RES teams we analyzed the hospitalizations with admission times between 11.00 AM and 4.00 PM. Such hospitalizations were likely to be assigned during the noon to 3 PM period when they could be assigned to either an H‐PA or RES team.
Interactions
Finally we explored interactions between the type of team and the fixed effect variables included in each model.
Statistical Software
We performed the statistical analysis using SAS software version 9.0 for UNIX (SAS Institute, Inc., Cary, NC) and R software (The R Project for Statistical Computing).
This study protocol was approved by the hospital's institutional review board.
Results
Study Population
Of the 52,391 hospitalizations to our hospital during the study period, 13,058 were admitted to general medicine. We excluded 3102 weekend admissions and 209 who met other exclusion criteria. We could not determine the team assignment for 66. Of the remaining 9681 hospitalizations, we assigned 2171 to H‐PA teams and 7510 to RES teams (Figure 1).
Descriptive Analysis
We compare patients assigned to H‐PA and RES teams in Table 2. They were similar in age, gender, race, having a primary care provider or not, and insurance status. Clinically, they had similar comorbidities and a similar distribution of common principal diagnoses. Consistent with their admitting schedule, H‐PA teams admitted and discharged more patients earlier in the day and admitted more patients earlier in the work week. Patients cared for by H‐PA teams were admitted from the Emergency Room (ER) less often and were more likely to reside on wards designated as nonmedicine by nursing specialty. Hospitalizations to H‐PA teams more often included an ICU stay.
| H‐PA (n = 2171) | RES (n = 7510) | P Value | |
|---|---|---|---|
| |||
| Age | |||
| Mean | 56.80 | 57.04 | |
| Median | 56 | 56 | 0.15 |
| Interquartile range | 43‐72 | 43‐73 | |
| Age group (years), n (%) | |||
| < 20 | 10 (0.5) | 57 (0.8) | |
| 20‐29 | 186 (8.6) | 632 (8.7) | |
| 30‐39 | 221 (10.2) | 766 (10.3) | |
| 40‐49 | 387 (17.8) | 1341 (18.1) | |
| 50‐59 | 434 (20.0) | 1492 (20.2) | 0.28 |
| 60‐69 | 325 (15.0) | 974 (12.8) | |
| 70‐79 | 271 (12.5) | 1035 (13.6) | |
| 80‐89 | 262 (12.0) | 951(12.3) | |
| 90< | 75 (3.5) | 262 (3.4) | |
| Female, n (%) | 1175 (54.1) | 4138 (55.1) | 0.42 |
| Race, n (%) | |||
| White | 1282 (59.1) | 4419 (58.9) | |
| Black | 793 (36.5) | 2754 (36.7) | 0.98 |
| Other | 96 (4.4) | 337 (4.5) | |
| Primary care provider, n (%) | 0.16 | ||
| Yes | 1537 (73.2) | 5451 (74.7) | |
| Missing: 284 | 71 (3.3) | 213 (2.8) | |
| Insurance status, n (%) | |||
| Commercial/worker's comp | 440 (20.3) | 1442 (19.2) | |
| Medicare | 1017 (46.8) | 3589 (47.8) | 0.52 |
| Medicaid/others | 714 (32.9) | 2479 (33.0) | |
| Time of admission, n (%) | |||
| 0000‐0259 | 167 (7.7) | 1068 (14.2) | |
| 0300‐0559 | 244 (11.2) | 485 (6.5) | |
| 0600‐0859 | 456 (21.0) | 270 (3.6) | |
| 0900‐1159 | 782 (36.0) | 1146 (15.3) | <0.001 |
| 1200‐1459 | 299 (13.8) | 1750 (23.3) | |
| 1500‐1759 | 155 (7.1) | 1676 (22.3) | |
| 1800‐2359 | 68 (3.1) | 1115 (14.9) | |
| Time of discharge, n (%) | |||
| 2100‐0859 | 36 (1.7) | 174 (2.3) | |
| 0900‐1159 | 275 (12.7) | 495 (6.6) | |
| 1200‐1459 | 858 (39.6) | 2608 (34.8) | <0.001 |
| 1500‐1759 | 749 (34.6) | 3122 (41.6) | |
| 1800‐2059 | 249 (11.5) | 1104 (14.7) | |
| Missing | 4 | 7 | |
| Day of week of admission, n (%) | |||
| Monday | 462 (21.3) | 1549 (20.6) | |
| Tuesday | 499 (23.0) | 1470 (19.6) | |
| Wednesday | 430 (19.8) | 1479 (19.7) | 0.001 |
| Thursday | 400 (18.4) | 1482 (19.7) | |
| Friday | 380 (17.5) | 1530 (20.4) | |
| Day of week of discharge, n (%) | |||
| Monday | 207 (9.5) | 829 (11.0) | |
| Tuesday | 268 (12.3) | 973 (13.0) | |
| Wednesday | 334 (15.4) | 1142 (15.2) | |
| Thursday | 362 (16.7) | 1297 (17.3) | 0.16 |
| Friday | 485 (22.3) | 1523 (20.3) | |
| Saturday | 330 (15.2) | 1165 (15.5) | |
| Sunday | 185 (8.5) | 581 (7.7) | |
| Admit to non‐medicine wards, n (%) | 1332 (61.4) | 2624 (34.9) | <0.001 |
| Transfer to ICU (at least once), n (%) | 299 (13.8) | 504 (6.7) | <0.001 |
| Admit from ER No (%) | 1663 (76.6) | 6063 (80.7) | <0.001 |
| 10 most frequent diagnosis (%) | Pneumonia (4.9) | Pneumonia (5.5) | |
| Congestive heart failure; nonhypertensive (4.2) | Congestive heart failure; nonhypertensive (3.9) | ||
| Sickle cell anemia (3.9) | Nonspecific chest pain (3.7) | ||
| Chronic obstructive pulmonary disease and Bronchiectasis (3.3) | Urinary tract infections(3.6) | ||
| Diabetes mellitus with complications (3.2) | Skin and subcutaneous tissue infections (3.3) | ||
| Urinary tract infections (3.2) | Sickle cell anemia (3.3) | ||
| Asthma (3.0) | Pancreatic disorders (not diabetes) (2.8) | ||
| Nonspecific chest pain (3.0) | Asthma (2.8) | ||
| Pancreatic disorders (not diabetes) (2.9) | Chronic obstructive pulmonary disease and Bronchiectasis (2.6) | ||
| Septicemia (2.2) | Diabetes mellitus with complications (2.6) | ||
| Average number of comorbidities mean (95% CI) | 0.39 (0.37‐0.42) | 0.38 (0.36‐0.39) | 0.23 |
In unadjusted comparisons of outcomes (Table 3), hospitalizations on H‐PA teams had higher lengths of stay and charges than hospitalizations on RES teams, possibly higher inpatient mortality rates but similar unadjusted readmission rates at 7, 14, and 30 days
| H‐PA (n = 2171) | RES (n = 7150) | % Difference* (CI) | P Value | |
|---|---|---|---|---|
| ||||
| LOS | Median (IQR) | Median (IQR) | ||
| Days | 3.17 (2.03‐5.30) | 2.99 (1.80‐5.08) | +8.9% (4.71‐13.29%) | <0.001 |
| Charges | ||||
| US Dollars | 9390 (6196‐16,239) | 9044 (6106‐14,805) | +5.56% (1.96‐9.28%) | 0.002 |
| Readmissions | n (%) | n (%) | Odds Ratio (CI) | |
| Within 7 days | 147 (6.96) | 571 (7.78) | 0.88 (0.73‐1.06) | 0.19 |
| Within14 days | 236 (11.34) | 924 (12.76) | 0.87 (0.75‐1.01) | 0.07 |
| Within 30 days | 383 (18.91) | 1436 (20.31) | 0.91 (0.80‐1.03) | 0.14 |
| Inpatient deaths | 39 (1.8) | 95 (1.3) | 1.36 (0.90‐2.00) | 0.06 |
Multivariable Analysis
LOS
Hospitalizations to H‐PA teams were associated with a 6.73% longer LOS (P = 0.005) (Table 4). This difference persisted when we used the winsorized data (6.45% increase, P = 0.006), excluded inpatient deaths (6.81% increase, P = 0.005), or excluded hospitalizations that involved an ICU stay (6.40%increase, P = 0.011) (Table 5).
| Overall | Subgroup: Restricted to Physicians Attending on Both H‐PA and RES Teams* | Subgroup: Restricted to Hospitalizations Between 11.00 AM and 4.00 PM | ||||
|---|---|---|---|---|---|---|
| % Difference (CI) | P Value | % Difference (CI) | P Value | % Difference (CI) | P Value | |
| ||||||
| LOS | 6.73% (1.99% to 11.70%) | 0.005 | 5.44% (0.65% to 11.91%) | 0.08 | 2.97% (4.47% to 10.98%) | 0.44 |
| Charges | 2.75% (1.30% to 6.97%) | 0.19 | 1.55% (3.76% to 7.16%) | 0.57 | 6.45% (0.62% to 14.03%) | 0.07 |
| Risk of Readmission | Adjusted OR (95%CI) | P Value | Adjusted OR (95% CI) | P Value | Adjusted OR (95% CI) | P Value |
| Within 7 days | 0.88 (0.64‐1.20) | 0.42 | 0.74 (0.40‐1.35) | 0.32 | 0.90 (0.40‐2.00) | 0.78 |
| Within14 days | 0.90 (0.69‐1.19) | 0.46 | 0.71 (0.51‐0.99) | 0.05 | 0.87 (0.36‐2.13) | 0.77 |
| Within 30 days | 0.89 (0.75‐1.06) | 0.20 | 0.75 (0.51‐1.08) | 0.12 | 0.92 (0.55‐1.54) | 0.75 |
| Inpatient mortality | 1.27 (0.82‐1.97) | 0.28 | 1.46 (0.67‐3.17) | 0.33 | 1.14 (0.47‐2.74) | 0.77 |
| Analysis With Winsorized Data | Analysis After Excluding Inpatient Deaths | Analysis After Excluding Patients With ICU Stays | ||||
|---|---|---|---|---|---|---|
| % Difference (CI) | P Value | % Difference (CI) | P Value | % Difference (CI) | P Value | |
| ||||||
| LOS | 6.45% (4.04 to 8.91%) | 0.006 | 6.81% (2.03 to 11.80%) | 0.005 | 6.40% (1.46 to 11.58%) | 0.011 |
| Charges | 2.67 (1.27 to 6.76%) | 0.187 | 2.89% (1.16 to 7.11%) | 0.164 | 0.74% (3.11 to 4.76%) | 0.710 |
Charges
Hospitalizations to H‐PA and RES teams were associated with similar charges (Table 4). The results were similar when we used winsorized data, excluded inpatient deaths or excluded hospitalizations involving an ICU stay (Table 5).
Readmissions
The risk of readmission at 7, 14, and 30 days was similar between hospitalizations to H‐PA and RES teams (Table 4).
Mortality
The risk of inpatient death was similar between all hospitalizations to H‐PA and RES teams or only hospitalizations without an ICU stay (Table 4). The results also remained the same in analyses restricted to first admissions, last admissions, or 1 randomly selected admission per patient.
Sub‐Group Analysis
On restricting the multivariable analyses to the subset of hospitalists who staffed both types of teams (Table 4), the increase in LOS associated with H‐PA care was no longer significant (5.44% higher, P = 0.081). The charges, risk of readmission at 7 and 30 days, and risk of inpatient mortality remained similar. The risk of readmission at 14 days was slightly lower following hospitalizations to H‐PA teams (odds ratio 0.71, 95% confidence interval [CI] 0.51‐0.99).
The increase in LOS associated with H‐PA care was further attenuated in analyses of the subset of admissions between 11.00 AM and 4.00 PM (2.97% higher, P = 0.444). The difference in charges approached significance (6.45% higher, P = 0.07), but risk of readmission at 7, 14, and 30 days and risk of inpatient mortality were no different (Table 4).
Interactions
On adding interaction terms between the team assignment and the fixed effect variables in each model we detected that the effect of H‐PA care on LOS (P < 0.001) and charges (P < 0.001) varied by time of admission (Figure 2a and b). Hospitalizations to H‐PA teams from 6.00 PM to 6.00 AM had greater relative increases in LOS as compared to hospitalizations to RES teams during those times. Similarly, hospitalizations during the period 3.00 PM to 3.00 AM had relatively higher charges associated with H‐PA care compared to RES care.
Discussion
We found that hospitalizations to our H‐PA teams had longer LOS but similar charges, readmission rates, and mortality as compared to traditional resident‐based teams. These findings were robust to multiple sensitivity and subgroup analyses but when we examined times when both types of teams could receive admissions, the difference in LOS was markedly attenuated and nonsignificant.
We note that most prior reports comparing PA‐based models of inpatient care predate the ACGME work hour regulations. In a randomized control trial (1987‐1988) Simmer et al.5 showed lower lengths of stay and charges but possibly higher risk of readmission for PA based teams as compared to resident based teams. Van Rhee et al.7 conducted a nonrandomized retrospective cohort study (1994‐1995) using administrative data which showed lower resource utilization for PA‐based inpatient care. Our results from 2005 to 2006 reflect the important changes in the organization and delivery of inpatient care since these previous investigations.
Roy et al.8 report the only previously published comparison of PA and resident based GM inpatient care after the ACGME mandated work hour regulations. They found PA‐based care was associated with lower costs, whereas we found similar charges for admissions to RES and H‐PA teams. They also found that LOS was similar for PA and resident‐based care, while we found a higher LOS for admissions to our H‐PA team. We note that although the design of Roy's study was similar to our own, patients cared for by PA‐based teams were geographically localized in their model. This may contribute to the differences in results noted between our studies.
Despite no designed differences in patients assigned to either type of team other than time of admission we noted some differences between the H‐PA and RES teams in the descriptive analysis. These differences, such as a higher proportion of hospitalizations to H‐PA teams being admitted from the ER, residing on nonmedicine wards or having an ICU stay are likely a result of our system of assigning admissions to H‐PA teams early during the workday. For example patients on H‐PA teams were more often located on nonmedicine wards as a result of later discharges and bed availability on medicine wards. The difference that deserves special comment is the much higher proportion (13.8% vs. 6.7%) of hospitalizations with an ICU stay on the H‐PA teams. Hospitalizations directly to the ICU were excluded from our study which means that the hospitalizations with an ICU stay in our study were initially admitted to either H‐PA or RES teams and then transferred to the ICU. Transfers out of the ICU usually occur early in the workday when H‐PA teams accepted patients per our admission schedule. These patients may have been preferentially assigned to H‐PA teams, if on returning from the ICU the original team's resident had changed (and the bounce back rule was not in effect). Importantly, the conclusions of our research are not altered on controlling for this difference in the teams by excluding hospitalizations with an ICU stay.
Hospitalizations to H‐PA teams were associated with higher resource utilization if they occurred later in the day or overnight (Figure 2a and b). During these times a transition of care occurred shortly after admission. For a late day admission the H‐PA teams would transfer care for overnight cross cover soon after the admission and for patients admitted overnight as overflow they would assume care of a patient from the nighttime covering physician performing the admission. On the other hand, on RES teams, interns admitting patients overnight continued to care for their patients for part of the following day (30‐hour call). Similar findings of higher resource utilization associated with transfer of care after admission in the daytime11 and nighttime12 have been previously reported. An alternative hypothesis for our findings is that the hospital maybe busier and thus less efficient during times when H‐PA teams had to admit later in the day or accept patients admitted overnight as overflow. Future research to determine the cause of this significant interaction between team assignment and time of admission on resource utilization is important as the large increases in LOS (up to 30%) and charges (up to 50%) noted, could have a potentially large impact if a higher proportion of hospitalizations were affected by this phenomenon.
Our H‐PA teams were assigned equally complex patients as our RES teams, in contrast to previous reports.8, 13 This was accomplished while improving the resident's educational experience and we have previously reported increases in our resident's board pass rates and in‐service training exam scores with that introduction of our H‐PA teams.14 We thus believe that selection of less complex patients to H‐PA teams such as ours is unnecessary and may give them a second tier status in academic settings.
Our report has limitations. It is a retrospective, nonrandomized investigation using a single institution's administrative database and has the limitations of not being able to account for unmeasured confounders, severity of illness, errors in the database, selection bias and has limited generalizability. We measured charges not actual costs,15 but we feel charges are a true reflection of relative resource use when compared between similar patients within a single institution. We also did not account for the readmissions that occur to other hospitals16 and our results do not reflect resource utilization for the healthcare system in total. For example, we could not tell if higher LOS on H‐PA teams resulted in lower readmissions for their patients in all hospitals in the region, which may reveal an overall resource savings. Additionally, we measured in‐hospital mortality and could not capture deaths related to hospital care that may occur shortly after discharge.
ACGME has proposed revised standards that may further restrict resident duty hours when they take effect in July 2011.3 This may lead to further decreases in resident‐based inpatient care. Teaching hospitals will need to continue to develop alternate models for inpatient care that do not depend on house staff. Our findings provide important evidence to inform the development of such models. Our study shows that one such model: PAs paired with hospitalists, accepting admissions early in the workday, with hospitalist coverage over the weekend and nights can care for GM inpatients as complex as those cared for by resident‐based teams without increasing readmission rates, inpatient mortality, or charges but at the cost of slightly higher LOS.
- ACGME‐Common Program Requirements for Resident Duty Hours. Available at: http://www.acgme.org/acWebsite/dutyHours/dh_ComProgrRequirmentsDutyHours0707.pdf. Accessed July 2010.
- ,,,,.Non‐housestaff medicine services in academic centers: models and challenges.J Hosp Med.2008;3(3):247–255.
- ACGME. Duty Hours: Proposed Standards for Review and comment. Available at: http://acgme‐2010standards.org/pdf/Proposed_Standards. pdf. Accessed July 22,2010.
- Agency for Health Care Policy and Research. HCUPnet: A tool for identifying, tracking, and analyzing national hospital statistics. Available at: http://hcup.ahrq.gov/HCUPnet.asp. Accessed July2010.
- ,,,,.A randomized, controlled trial of an attending staff service in general internal medicine.Med Care.1991;29(7 suppl):JS31–JS40.
- ,.Replacing an academic internal medicine residency program with a physician assistant‐‐hospitalist model: a Comparative Analysis Study.Am J Med Qual.2009;24(2):132–139.
- ,,.Resource use by physician assistant services versus teaching services.JAAPA.2002;15(1):33–42.
- ,,, et al.Implementation of a physician assistant/hospitalist service in an academic medical center: impact on efficiency and patient outcomes.J Hosp Med.2008;3(5):361–368.
- AHRQ. Clinical Classifications Software (CCS) for ICD‐9‐CM. Available at: http://www.hcup‐us.ahrq.gov/toolssoftware/ccs/ccs.jsp#overview. Accessed July2010.
- AHRQ. HCUP: Comorbidity Software, Version 3.4.;Available at: http://www.hcup‐us.ahrq.gov/toolssoftware/comorbidity/comorbidity.jsp. Accessed July2010.
- ,,, et al.Effect of short call admission on length of stay and quality of care for acute decompensated heart failure.Circulation.2008;117(20):2637–2644.
- ,,,.Post‐call transfer of resident responsibility: its effect on patient care.J Gen Intern Med.1990;5(6):501–505.
- ,,,,,.The effect of nonteaching services on the distribution of inpatient cases for internal medicine residents.Acad Med.2009:84(2):220–225.
- ,,, et al.Allowing for better resident education and improving patient care: hospitalist‐physician assistant teams fill in the gaps.J Hosp Med.2007;2[S2]:1–39.
- .The distinction between cost and charges.Ann Intern Med.1982;96(1):102–109.
- ,,.Rehospitalizations among patients in the Medicare Fee‐for‐Service Program.N Engl J Med.2009;360(14):1418–1428.
Copyright © 2011 Society of Hospital Medicine