User login
Localizing General Medical Teams
Localizing inpatient general medical teams to nursing units has high intuitive validity for improving physician productivity, hospital efficiency, and patient outcomes. Motion or the moving of personnel between tasksso prominent if teams are not localizedis 1 of the 7 wastes in lean thinking.1 In a timemotion study, where hospitalists cared for patients on up to 5 different wards, O'Leary et al2 have reported large parts of hospitalists' workdays spent in indirect patient care (69%), paging (13%), and travel (3%). Localization could increase the amount of time available for direct patient care, decrease time spent for (and interruptions due to) paging, and decrease travel time, all leading to greater productivity.
O'Leary et al3 have also reported the beneficial effects of localization of medical inpatients on communication between nurses and physicians, who could identify each other more often, and reported greater communication (specifically face‐to‐face communication) with each other following localization. This improvement in communication and effective multidisciplinary rounds could lead to safer care4 and better outcomes.
Further investigations about the effect of localization are limited. Roy et al5 have compared the outcomes of patients localized to 2 inpatient pods medically staffed by hospitalists and physician assistants (PAs) to geographically dispersed, but structurally different, house staff teams. They noticed significantly lower costs, slight but nonsignificant increase in length of stay, and no difference in mortality or readmissions, but it is impossible to tease out the affect of localization versus the affect of team composition. In a before‐and‐after study, Findlay et al6 have reported a decrease in mortality and complication rates in clinically homogenous surgical patients (proximal hip fractures) when cared for by junior trainee physicians localized to a unit, but their experience cannot be extrapolated to the much more diverse general medical population.
In our hospital, each general medical team could admit patients dispersed over 14 different units. An internal group, commissioned to evaluate our hospitalist practice, recommended reducing this dispersal to improve physician productivity, hospital efficiency, and outcomes of care. We therefore conducted a project to evaluate the impact of localizing general medical inpatient teams to a single nursing unit.
METHODS
Setting
We conducted our project at a 490 bed, urban academic medical center in the midwestern United States where of the 10 total general medical teams, 6 were traditional resident‐based teams and 4 consisted of a hospitalist paired with a PA (H‐PA teams). We focused our study on the 4 H‐PA teams. The hospitalists could be assigned to any H‐PA team and staffed them for 2 weeks (including weekends). The PAs were always assigned to the same team but took weekends off. An in‐house hospitalist provided overnight cross‐coverage for the H‐PA teams. Prior to our intervention, these teams could admit patients to any of the 14 nursing units at our hospital. They admitted patients from 7 AM to 3 PM, and also accepted care of patients admitted overnight after the resident teams had reached their admission limits (overflow). A Faculty Admitting Medical Officer (AMO) balanced the existing workload of the teams against the number and complexity of incoming patients to decide team assignment for the patients. The AMO was given guidelines (soft caps) to limit total admissions to H‐PA teams to 5 per team per day (3 on a weekend), and to not exceed a total patient census of 16 for an H‐PA team.
Intervention
Starting April 1, 2010, until July 15, 2010, we localized patients admitted to 2 of our 4 H‐PA teams on a single 32‐bed nursing unit. The patients of the other 2 H‐PA teams remained dispersed throughout the hospital.
Transition
April 1, 2010 was a scheduled switch day for the hospitalists on the H‐PA teams. We took advantage of this switch day and reassigned all patients cared for by H‐PA teams on our localized unit to the 2 localized teams. Similarly, all patients on nonlocalized units cared for by H‐PA teams were reassigned to the 2 nonlocalized teams. All patients cared for by resident teams on the localized unit, that were anticipated to be discharged soon, stayed until discharge; those that had a longer stay anticipated were transferred to a nonlocalized unit.
Patient Assignment
The 4 H‐PA teams continued to accept patients between 7 AM and 3 PM, as well as overflow patients. Patients with sickle cell crises were admitted exclusively to the nonlocalized teams, as they were cared for on a specialized nursing unit. No other patient characteristic was used to decide team assignment.
The AMO balanced the existing workload of the teams against the number and complexity of incoming patients to decide team assignment for the patients, but if these factors were equivocal, the AMO was now asked to preferentially admit to the localized teams. The admission soft cap for the H‐PA teams remained the same (5 on weekdays and 3 on weekends). The soft cap on the total census of 16 patients for the nonlocalized teams remained, but we imposed hard caps on the total census for the localized teams. These hard caps were 16 for each localized team for the month of April (to fill a 32‐bed unit), then decreased to 12 for the month of May, as informal feedback from the teams suggested a need to decrease workload, and then rebalanced to 14 for the remaining study period.
Evaluation
Clinical Outcomes
Using both concurrent and historical controls, we evaluated the impact of localization on the following clinical outcome measures: length of stay (LOS), charges, and 30‐day readmission rates.
Inclusion Criteria
We included all patients assigned to localized and nonlocalized teams between the period April 1, 2010 to July 15, 2010, and discharged before July 16, 2010, in our intervention group and concurrent control group, respectively. We included all patients assigned to any of the 4 H‐PA teams during the period January 1, 2010 and March 31, 2010 in the historical control group.
Exclusion Criteria
From the historical control group, we excluded patients assigned to one particular H‐PA team during the period January 1, 2010 to February 28, 2010, during which the PA assigned to that team was on leave. We excluded, from all groups, patients with a diagnosis of sickle cell disease and hospitalizations that straddled the start of the intervention. Further, we excluded repeat admissions for each patient.
Data Collection
We used admission logs to determine team assignment and linked them to our hospital's discharge abstract database to get patient level data. We grouped the principal diagnosis, International Classification of Diseases, Ninth Revision, Clinical Modification (ICD‐9‐CM) codes into clinically relevant categories using the Healthcare Cost and Utilization Project Clinical Classification Software for ICD‐9‐CM (Rockville, MD, www.hcup‐us.ahrq.gov/toolssoftware/ccs/ccs.jsp). We created comorbidity measures using Healthcare Cost and Utilization Project Comorbidity Software, version 3.4 (Rockville, MD, www.hcup‐us.ahrq.gov/toolssoftware/comorbidity/comorbidity.jsp).
We calculated LOS by subtracting the discharge day and time from the admission day and time. We summed all charges accrued during the entire hospital stay, but did not include professional fees. The LOS and charges included time spent and charges accrued in the intensive care unit (ICU). As ICU care was not under the control of the general medical teams and could have a significant impact on outcomes reflecting resource utilization, we compared LOS and charges only for 2 subsets of patients: patients not initially admitted to ICU before care by medical teams, and patients never requiring ICU care. We considered any repeat hospitalization to our hospital within 30 days following a discharge to be a readmission, except those for a planned procedure or for inpatient rehabilitation. We compared readmission rates for all patients irrespective of ICU stay, as discharge planning for all patients was under the direct control of the general medical teams.
Data Analysis
We performed unadjusted descriptive statistics using medians and interquartile ranges for continuous variables, and frequencies and percentages for categorical variables. We used chi‐square tests of association, and KruskalWallis analysis of variance, to compare baseline characteristics of patients assigned to localized and control teams.
We used regression models with random effects to risk adjust for a wide variety of variables. We included age, gender, race, insurance, admission source, time, day of week, discharge time, and total number of comorbidities as fixed effects in all models. We then added individual comorbidity measures one by one as fixed effects, including them only if significant at P < 0.01. We always added a variable identifying the admitting physician as a random effect, to account for dependence between admissions to the same physician. We log transformed LOS and charges because they were extremely skewed in nature. We analyzed readmissions after excluding patients who died. We evaluated the affect of our intervention on clinical outcomes using both historical and concurrent controls. We report P values for both overall 3‐way comparisons, as well as each of the 2‐way comparisonsintervention versus historical control and intervention versus concurrent control.
Productivity and Workflow Measures
We also evaluated the impact of localization on the following productivity and workflow measures: number of pages received, number of patient encounters, relative value units (RVUs) generated, and steps walked by PAs.
Data Collection
We queried our in‐house paging systems for the number of pages received by intervention and concurrent control teams between 7 AM and 6 PM (usual workday). We queried our professional billing data to determine the number of encounters per day and RVUs generated by the intervention, as well as historical and concurrent control teams, as a measure of productivity.
During the last 15 days of our intervention (July 1 July 15, 2010), we received 4 pedometers and we asked the PAs to record the number of steps taken during their workday. We chose PAs, rather than physicians, as the PAs had purely clinical duties and their walking activity would reflect activity for solely clinical purposes.
Data Analysis
For productivity and workflow measures, we adjusted for the day of the week and used random effects models to adjust for clustering of data by physician and physician assistant.
Statistical Software
We performed the statistical analysis using R software, versions 2.9.0 (The R Project for Statistical Computing, Vienna, Austria, http://www.R‐project.org).
Ethical Concerns
The study protocol was approved by our institutional review board.
RESULTS
Study Population
There were 2431 hospitalizations to the 4 H‐PA teams during the study period. Data from 37 hospitalizations was excluded because of missing data. After applying all exclusion criteria, our final study sample consisted of a total of 1826 first hospitalizations for patients: 783 historical controls, 478 concurrent controls, and 565 localized patients.
Patients in the control groups and intervention group were similar in age, gender, race, and insurance status. Patients in the intervention group were more likely to be admitted over the weekend, but had similar probability of being discharged over the weekend or having had an ICU stay. Historical controls were admitted more often between 6 AM and 12 noon, while during the intervention period, patients were more likely to be admitted between midnight and 6 AM. The discharge time was similar across all groups. The 5 most common diagnoses were similar across the groups (Table 1).
| Historical Control | Intervention Localized Teams | Concurrent Control | P Value | |
|---|---|---|---|---|
| ||||
| Patients | 783 | 565 | 478 | |
| Age median (IQR) | 57 (4575) | 57 (4573) | 56 (4470) | 0.186 |
| Age groups, n (%) | ||||
| <30 | 65 (8.3) | 37 (6.6) | 46 (9.6) | |
| 3039 | 76 (9.7) | 62 (11.0) | 47 (9.8) | |
| 4049 | 114 (14.6) | 85 (15.0) | 68 (14.2) | |
| 5059 | 162 (20.7) | 124 (22.0) | 118 (24.7) | 0.145 |
| 6069 | 119 (15.2) | 84 (14.9) | 76 (16.0) | |
| 7079 | 100 (12.8) | 62 (11.0) | 58 (12.1) | |
| 8089 | 113 (14.4) | 95 (16.8) | 51 (10.7) | |
| >89 | 34 (4.3) | 16 (2.88) | 14 (2.9) | |
| Female gender, n (%) | 434 (55.4) | 327 (57.9) | 264 (55.2) | 0.602 |
| Race: Black, n (%) | 285 (36.4) | 229 (40.5) | 200 (41.8) | 0.111 |
| Observation status, n (%) | 165 (21.1) | 108 (19.1) | 108 (22.6) | 0.380 |
| Insurance, n (%) | ||||
| Commercial | 171 (21.8) | 101 (17.9) | 101 (21.1) | |
| Medicare | 376 (48.0) | 278 (49.2) | 218 (45.6) | 0.225 |
| Medicaid | 179 (22.8) | 126 (22.3) | 117 (24.5) | |
| Uninsured | 54 (7.3) | 60 (10.6) | 42 (8.8) | |
| Weekend admission, n (%) | 137 (17.5) | 116 (20.5) | 65 (13.6) | 0.013 |
| Weekend discharge, n (%) | 132 (16.9) | 107 (18.9) | 91 (19.0) | 0.505 |
| Source of admission | ||||
| ED, n (%) | 654 (83.5) | 450 (79.7) | 370 (77.4) | 0.022 |
| No ICU stay, n (%) | 600 (76.6) | 440 (77.9) | 383 (80.1) | 0.348 |
| Admission time, n (%) | ||||
| 00000559 | 239 (30.5) | 208 (36.8) | 172 (36.0) | |
| 06001159 | 296 (37.8) | 157 (27.8) | 154 (32.2) | 0.007 |
| 12001759 | 183 (23.4) | 147 (26.0) | 105 (22.0) | |
| 18002359 | 65 (8.3) | 53 (9.4) | 47 (9.8) | |
| Discharge time, n (%) | ||||
| 00001159 | 67 (8.6) | 45 (8.0) | 43 (9.0) | |
| 12001759 | 590 (75.4) | 417 (73.8) | 364 (76.2) | 0.658 |
| 18002359 | 126 (16.1) | 103 (18.2) | 71 (14.9) | |
| Inpatient deaths, n | 13 | 13 | 6 | |
| Top 5 primary diagnoses (%) | ||||
| 1 | Chest pain (11.5) | Chest pain (13.3) | Chest pain (11.9) | |
| 2 | Septicemia (6.4) | Septicemia (5.1) | Septicemia (3.8) | |
| 3 | Diabetes w/cm (4.6) | Pneumonia (4.9) | Diabetes w/cm (3.3) | n/a |
| 4 | Pneumonia (2.8) | Diabetes w/cm (4.1) | Pneumonia (3.3) | |
| 5 | UTI (2.7) | COPD (3.2) | UTI (2.9) | |
Clinical Outcomes
Unadjusted Analyses
The risk of 30‐day readmission was no different between the intervention and control groups. In patients without an initial ICU stay, and without any ICU stay, charges incurred and LOS were no different between the intervention and control groups (Table 2).
| Historical Control | Intervention Localized Teams | Concurrent Control | P Value | |
|---|---|---|---|---|
| ||||
| 30‐day readmissions n (%) | 118 (15.3) | 69 (12.5) | 66 (14.0) | 0.346 |
| Charges: excluding patients initially admitted to ICU | ||||
| Median (IQR) in $ | 9346 (621614,520) | 9724 (665715,390) | 9902 (661115,670) | 0.393 |
| Charges: excluding all patients with an ICU stay | ||||
| Median (IQR) in $ | 9270 (618713,990) | 9509 (660114,940) | 9846 (658015,400) | 0.283 |
| Length of stay: excluding patients initially admitted to ICU | ||||
| Median (IQR) in days | 1.81 (1.223.35) | 2.16 (1.214.02) | 1.89 (1.193.50) | 0.214 |
| Length of stay: excluding all patients with an ICU stay | ||||
| Median (IQR) in days | 1.75 (1.203.26) | 2.12 (1.203.74) | 1.84 (1.193.42) | 0.236 |
Adjusted Analysis
The risk of 30‐day readmission was no different between the intervention and control groups. In patients without an initial ICU stay, and without any ICU stay, charges incurred were no different between the intervention and control groups; LOS was about 11% higher in the localized group as compared to historical controls, and about 9% higher as compared to the concurrent control group. The difference in LOS was not statistically significant on an overall 3‐way comparison (Table 3).
| Localized Teams in Comparison to | |||
|---|---|---|---|
| Historical Control | Concurrent Control | Overall P Value | |
| |||
| 30‐day risk of readmission OR (CI) | 0.85 (0.611.19) | 0.94 (0.651.37) | 0.630 |
| P value | 0.351 | 0.751 | |
| Charges: excluding patients initially admitted to ICU | |||
| % change | 2% higher | 4% lower | 0.367 |
| (CI) | (6% lower to 11% higher) | (12% lower to 5%higher) | |
| P value | 0.572 | 0.427 | |
| Charges: excluding all patients with an ICU stay | |||
| % change | 2% higher | 5% lower | 0.314 |
| (CI) | (6% lower to 10% higher) | (13% lower to 4% higher) | |
| P value | 0.695 | 0.261 | |
| Length of stay: excluding patients initially admitted to ICU | |||
| % change | 11% higher | 9% higher | 0.105 |
| (CI) | (1% to 22% higher) | (3% lower to 21% higher) | |
| P value | 0.038 | 0.138 | |
| Length of stay: excluding all patients with an ICU stay | |||
| % change | 10% higher | 8% higher | 0.133 |
| (CI) | (0% to 22% higher) | (3% lower to 20% higher) | |
| P value | 0.047 | 0.171 | |
Productivity and Workflow Measures
Unadjusted Analyses
The localized teams received fewer pages as compared to concurrently nonlocalized teams. Localized teams had more patient encounters per day and generated more RVUs per day as compared to both historical and concurrent control groups. Physician assistants on localized teams took fewer steps during their work day (Table 4).
| Historical Control | Intervention Localized Teams | Concurrent Control | P Value | |
|---|---|---|---|---|
| ||||
| Pages received/day (7 AM6 PM) Median (IQR) | No data | 15 (921) | 28 (12.540) | <0.001 |
| Total encounters/day Median (IQR) | 10 (813) | 12 (1013) | 11 (913) | <0.001 |
| RVU/day | ||||
| Mean (SD) | 19.9 (6.76) | 22.6 (5.6) | 21.2 (6.7) | <0.001 |
| Steps/day Median (IQR) | No data | 4661 (3922 5166) | 5554 (50606544) | <0.001 |
Adjusted Analysis
On adjusting for clustering by physician and day of week, the significant differences in pages received, total patient encounters, and RVUs generated persisted, while the difference in steps walked by PAs was attenuated to a statistically nonsignificant level (Table 5). The increase in RVU productivity was sustained through various periods of hard caps (data not shown).
| Localized Teams in Comparison to | |||
|---|---|---|---|
| Historical Control | Concurrent Control | Overall P Value | |
| |||
| Pages received (7 AM 6 PM) %(CI) | No data | 51% fewer (4854) | |
| P value | P < 0.001 | ||
| Total encounters | 0.89 more | 1.02 more | |
| N (CI) | (0.371.41) | (0.461.58) | |
| P value | P < 0.001 | P < 0.001 | P < 0.001 |
| RVU/day | 2.20 more | 1.36 more | |
| N (CI) | (1.103.29) | (0.172.55) | |
| P value | P < 0.001 | P = 0.024 | P < 0.001 |
| Steps/day | 1186 fewer (791 more to | ||
| N (CI) | No data | 3164 fewer) | |
| P value | P = 0.240 | ||
DISCUSSION
We found that general medical patients admitted to H‐PA teams and localized to a single nursing unit had similar risk of 30‐day readmission and charges, but may have had a higher length of stay compared to historical and concurrent controls. The localized teams received far fewer pages, had more patient encounters, generated more RVUs, and walked less during their work day. Taken together, these findings imply that in our study, localization led to greater team productivity and a possible decrease in hospital efficiency, with no significant impact on readmissions or charges incurred.
The higher productivity was likely mediated by the preferential assignments of more patients to the localized teams, and improvements in workflow (such as fewer pages and fewer steps walked), which allowed them to provide more care with the same resources as the control teams. Kocher and Sahni7 recently pointed out that the healthcare sector has experienced no gains in labor productivity in the past 20 years. Our intervention fits their prescription for redesigning healthcare delivery models to achieve higher productivity.
The possibility of a higher LOS associated with localization was a counterintuitive finding, and similar to that reported by Roy et al.5 We propose 3 hypotheses to explain this:
Selection bias: Higher workload of the localized teams led to compromised efficiency and a higher length of stay (eg, localized teams had fewer observation admissions, more hospitalizations with an ICU stay, and the AMO was asked to preferentially admit patients to localized teams).
Localization provided teams the opportunity to spend more time with their patients (by decreasing nonvalue‐added tasks) and to consequently address more issues before transitioning to outpatient care, or to provide higher quality of care.
Gaming: By having a hard cap on total number of occupied beds, we provided a perverse incentive to the localized teams to retain patients longer to keep assigned beds occupied, thereby delaying new admissions to avoid higher workload.
Our study cannot tell us which of these hypotheses represents the dominant phenomenon that led to this surprising finding. Hypothesis 3 is most worrying, and we suggest that others looking to localize their medical teams consider the possibility of unintended perverse incentives.
Differences were more pronounced between the historical control group and the intervention group, as opposed to the intervention group and concurrent controls. This may have occurred if we contaminated the concurrent control by decreasing the number of units they had to go to, by sequestering 1 unit for the intervention team.
Our report has limitations. It is a nonrandomized, quasi‐experimental investigation using a single institution's administrative databases. Our intervention was small in scale (localizing 2 out of 10 general medical teams on 1 out of 14 nursing units). What impact a wider implementation of localization may have on emergency department throughput and hospital occupancy remains to be studied. Nevertheless, our research is the first report, to our knowledge, investigating a wide variety of outcomes of localizing inpatient medical teams, and adds significantly to the limited research on this topic. It also provides significant operational details for other institutions to use when localizing medical teams.
We conclude that our intervention of localization of medical teams to a single nursing unit led to higher productivity and better workflow, but did not impact readmissions or charges incurred. We caution others designing similar localization interventions to protect against possible perverse incentives for inefficient care.
Acknowledgements
Disclosure: Nothing to report.
- . Reducing waste in US health care systems. JAMA. 2007;297(8):871–874.
- , , . How hospitalists spend their time: insights on efficiency and safety. J Hosp Med. 2006;1(2):88–93.
- , , , et al. Impact of localizing physicians to hospital units on nurse–physician communication and agreement on the plan of care. J Gen Intern Med. 2009;24(11):1223–1227.
- , , , et al. Structured interdisciplinary rounds in a medical teaching unit: improving patient safety. Arch Intern Med. 2011;171(7):678–684.
- , , , et al. Implementation of a physician assistant/hospitalist service in an academic medical center: impact on efficiency and patient outcomes. J Hosp Med. 2008;3(5):361–368.
- , , , , . Ward‐based rather than team‐based junior surgical doctors reduce mortality for patients with a fracture of the proximal femur: results from a two‐year observational study. J Bone Joint Surg Br. 2011;93‐B(3):393–398.
- , . Rethinking health care labor. N Engl J Med. 2011;365(15):1370–1372.
Localizing inpatient general medical teams to nursing units has high intuitive validity for improving physician productivity, hospital efficiency, and patient outcomes. Motion or the moving of personnel between tasksso prominent if teams are not localizedis 1 of the 7 wastes in lean thinking.1 In a timemotion study, where hospitalists cared for patients on up to 5 different wards, O'Leary et al2 have reported large parts of hospitalists' workdays spent in indirect patient care (69%), paging (13%), and travel (3%). Localization could increase the amount of time available for direct patient care, decrease time spent for (and interruptions due to) paging, and decrease travel time, all leading to greater productivity.
O'Leary et al3 have also reported the beneficial effects of localization of medical inpatients on communication between nurses and physicians, who could identify each other more often, and reported greater communication (specifically face‐to‐face communication) with each other following localization. This improvement in communication and effective multidisciplinary rounds could lead to safer care4 and better outcomes.
Further investigations about the effect of localization are limited. Roy et al5 have compared the outcomes of patients localized to 2 inpatient pods medically staffed by hospitalists and physician assistants (PAs) to geographically dispersed, but structurally different, house staff teams. They noticed significantly lower costs, slight but nonsignificant increase in length of stay, and no difference in mortality or readmissions, but it is impossible to tease out the affect of localization versus the affect of team composition. In a before‐and‐after study, Findlay et al6 have reported a decrease in mortality and complication rates in clinically homogenous surgical patients (proximal hip fractures) when cared for by junior trainee physicians localized to a unit, but their experience cannot be extrapolated to the much more diverse general medical population.
In our hospital, each general medical team could admit patients dispersed over 14 different units. An internal group, commissioned to evaluate our hospitalist practice, recommended reducing this dispersal to improve physician productivity, hospital efficiency, and outcomes of care. We therefore conducted a project to evaluate the impact of localizing general medical inpatient teams to a single nursing unit.
METHODS
Setting
We conducted our project at a 490 bed, urban academic medical center in the midwestern United States where of the 10 total general medical teams, 6 were traditional resident‐based teams and 4 consisted of a hospitalist paired with a PA (H‐PA teams). We focused our study on the 4 H‐PA teams. The hospitalists could be assigned to any H‐PA team and staffed them for 2 weeks (including weekends). The PAs were always assigned to the same team but took weekends off. An in‐house hospitalist provided overnight cross‐coverage for the H‐PA teams. Prior to our intervention, these teams could admit patients to any of the 14 nursing units at our hospital. They admitted patients from 7 AM to 3 PM, and also accepted care of patients admitted overnight after the resident teams had reached their admission limits (overflow). A Faculty Admitting Medical Officer (AMO) balanced the existing workload of the teams against the number and complexity of incoming patients to decide team assignment for the patients. The AMO was given guidelines (soft caps) to limit total admissions to H‐PA teams to 5 per team per day (3 on a weekend), and to not exceed a total patient census of 16 for an H‐PA team.
Intervention
Starting April 1, 2010, until July 15, 2010, we localized patients admitted to 2 of our 4 H‐PA teams on a single 32‐bed nursing unit. The patients of the other 2 H‐PA teams remained dispersed throughout the hospital.
Transition
April 1, 2010 was a scheduled switch day for the hospitalists on the H‐PA teams. We took advantage of this switch day and reassigned all patients cared for by H‐PA teams on our localized unit to the 2 localized teams. Similarly, all patients on nonlocalized units cared for by H‐PA teams were reassigned to the 2 nonlocalized teams. All patients cared for by resident teams on the localized unit, that were anticipated to be discharged soon, stayed until discharge; those that had a longer stay anticipated were transferred to a nonlocalized unit.
Patient Assignment
The 4 H‐PA teams continued to accept patients between 7 AM and 3 PM, as well as overflow patients. Patients with sickle cell crises were admitted exclusively to the nonlocalized teams, as they were cared for on a specialized nursing unit. No other patient characteristic was used to decide team assignment.
The AMO balanced the existing workload of the teams against the number and complexity of incoming patients to decide team assignment for the patients, but if these factors were equivocal, the AMO was now asked to preferentially admit to the localized teams. The admission soft cap for the H‐PA teams remained the same (5 on weekdays and 3 on weekends). The soft cap on the total census of 16 patients for the nonlocalized teams remained, but we imposed hard caps on the total census for the localized teams. These hard caps were 16 for each localized team for the month of April (to fill a 32‐bed unit), then decreased to 12 for the month of May, as informal feedback from the teams suggested a need to decrease workload, and then rebalanced to 14 for the remaining study period.
Evaluation
Clinical Outcomes
Using both concurrent and historical controls, we evaluated the impact of localization on the following clinical outcome measures: length of stay (LOS), charges, and 30‐day readmission rates.
Inclusion Criteria
We included all patients assigned to localized and nonlocalized teams between the period April 1, 2010 to July 15, 2010, and discharged before July 16, 2010, in our intervention group and concurrent control group, respectively. We included all patients assigned to any of the 4 H‐PA teams during the period January 1, 2010 and March 31, 2010 in the historical control group.
Exclusion Criteria
From the historical control group, we excluded patients assigned to one particular H‐PA team during the period January 1, 2010 to February 28, 2010, during which the PA assigned to that team was on leave. We excluded, from all groups, patients with a diagnosis of sickle cell disease and hospitalizations that straddled the start of the intervention. Further, we excluded repeat admissions for each patient.
Data Collection
We used admission logs to determine team assignment and linked them to our hospital's discharge abstract database to get patient level data. We grouped the principal diagnosis, International Classification of Diseases, Ninth Revision, Clinical Modification (ICD‐9‐CM) codes into clinically relevant categories using the Healthcare Cost and Utilization Project Clinical Classification Software for ICD‐9‐CM (Rockville, MD, www.hcup‐us.ahrq.gov/toolssoftware/ccs/ccs.jsp). We created comorbidity measures using Healthcare Cost and Utilization Project Comorbidity Software, version 3.4 (Rockville, MD, www.hcup‐us.ahrq.gov/toolssoftware/comorbidity/comorbidity.jsp).
We calculated LOS by subtracting the discharge day and time from the admission day and time. We summed all charges accrued during the entire hospital stay, but did not include professional fees. The LOS and charges included time spent and charges accrued in the intensive care unit (ICU). As ICU care was not under the control of the general medical teams and could have a significant impact on outcomes reflecting resource utilization, we compared LOS and charges only for 2 subsets of patients: patients not initially admitted to ICU before care by medical teams, and patients never requiring ICU care. We considered any repeat hospitalization to our hospital within 30 days following a discharge to be a readmission, except those for a planned procedure or for inpatient rehabilitation. We compared readmission rates for all patients irrespective of ICU stay, as discharge planning for all patients was under the direct control of the general medical teams.
Data Analysis
We performed unadjusted descriptive statistics using medians and interquartile ranges for continuous variables, and frequencies and percentages for categorical variables. We used chi‐square tests of association, and KruskalWallis analysis of variance, to compare baseline characteristics of patients assigned to localized and control teams.
We used regression models with random effects to risk adjust for a wide variety of variables. We included age, gender, race, insurance, admission source, time, day of week, discharge time, and total number of comorbidities as fixed effects in all models. We then added individual comorbidity measures one by one as fixed effects, including them only if significant at P < 0.01. We always added a variable identifying the admitting physician as a random effect, to account for dependence between admissions to the same physician. We log transformed LOS and charges because they were extremely skewed in nature. We analyzed readmissions after excluding patients who died. We evaluated the affect of our intervention on clinical outcomes using both historical and concurrent controls. We report P values for both overall 3‐way comparisons, as well as each of the 2‐way comparisonsintervention versus historical control and intervention versus concurrent control.
Productivity and Workflow Measures
We also evaluated the impact of localization on the following productivity and workflow measures: number of pages received, number of patient encounters, relative value units (RVUs) generated, and steps walked by PAs.
Data Collection
We queried our in‐house paging systems for the number of pages received by intervention and concurrent control teams between 7 AM and 6 PM (usual workday). We queried our professional billing data to determine the number of encounters per day and RVUs generated by the intervention, as well as historical and concurrent control teams, as a measure of productivity.
During the last 15 days of our intervention (July 1 July 15, 2010), we received 4 pedometers and we asked the PAs to record the number of steps taken during their workday. We chose PAs, rather than physicians, as the PAs had purely clinical duties and their walking activity would reflect activity for solely clinical purposes.
Data Analysis
For productivity and workflow measures, we adjusted for the day of the week and used random effects models to adjust for clustering of data by physician and physician assistant.
Statistical Software
We performed the statistical analysis using R software, versions 2.9.0 (The R Project for Statistical Computing, Vienna, Austria, http://www.R‐project.org).
Ethical Concerns
The study protocol was approved by our institutional review board.
RESULTS
Study Population
There were 2431 hospitalizations to the 4 H‐PA teams during the study period. Data from 37 hospitalizations was excluded because of missing data. After applying all exclusion criteria, our final study sample consisted of a total of 1826 first hospitalizations for patients: 783 historical controls, 478 concurrent controls, and 565 localized patients.
Patients in the control groups and intervention group were similar in age, gender, race, and insurance status. Patients in the intervention group were more likely to be admitted over the weekend, but had similar probability of being discharged over the weekend or having had an ICU stay. Historical controls were admitted more often between 6 AM and 12 noon, while during the intervention period, patients were more likely to be admitted between midnight and 6 AM. The discharge time was similar across all groups. The 5 most common diagnoses were similar across the groups (Table 1).
| Historical Control | Intervention Localized Teams | Concurrent Control | P Value | |
|---|---|---|---|---|
| ||||
| Patients | 783 | 565 | 478 | |
| Age median (IQR) | 57 (4575) | 57 (4573) | 56 (4470) | 0.186 |
| Age groups, n (%) | ||||
| <30 | 65 (8.3) | 37 (6.6) | 46 (9.6) | |
| 3039 | 76 (9.7) | 62 (11.0) | 47 (9.8) | |
| 4049 | 114 (14.6) | 85 (15.0) | 68 (14.2) | |
| 5059 | 162 (20.7) | 124 (22.0) | 118 (24.7) | 0.145 |
| 6069 | 119 (15.2) | 84 (14.9) | 76 (16.0) | |
| 7079 | 100 (12.8) | 62 (11.0) | 58 (12.1) | |
| 8089 | 113 (14.4) | 95 (16.8) | 51 (10.7) | |
| >89 | 34 (4.3) | 16 (2.88) | 14 (2.9) | |
| Female gender, n (%) | 434 (55.4) | 327 (57.9) | 264 (55.2) | 0.602 |
| Race: Black, n (%) | 285 (36.4) | 229 (40.5) | 200 (41.8) | 0.111 |
| Observation status, n (%) | 165 (21.1) | 108 (19.1) | 108 (22.6) | 0.380 |
| Insurance, n (%) | ||||
| Commercial | 171 (21.8) | 101 (17.9) | 101 (21.1) | |
| Medicare | 376 (48.0) | 278 (49.2) | 218 (45.6) | 0.225 |
| Medicaid | 179 (22.8) | 126 (22.3) | 117 (24.5) | |
| Uninsured | 54 (7.3) | 60 (10.6) | 42 (8.8) | |
| Weekend admission, n (%) | 137 (17.5) | 116 (20.5) | 65 (13.6) | 0.013 |
| Weekend discharge, n (%) | 132 (16.9) | 107 (18.9) | 91 (19.0) | 0.505 |
| Source of admission | ||||
| ED, n (%) | 654 (83.5) | 450 (79.7) | 370 (77.4) | 0.022 |
| No ICU stay, n (%) | 600 (76.6) | 440 (77.9) | 383 (80.1) | 0.348 |
| Admission time, n (%) | ||||
| 00000559 | 239 (30.5) | 208 (36.8) | 172 (36.0) | |
| 06001159 | 296 (37.8) | 157 (27.8) | 154 (32.2) | 0.007 |
| 12001759 | 183 (23.4) | 147 (26.0) | 105 (22.0) | |
| 18002359 | 65 (8.3) | 53 (9.4) | 47 (9.8) | |
| Discharge time, n (%) | ||||
| 00001159 | 67 (8.6) | 45 (8.0) | 43 (9.0) | |
| 12001759 | 590 (75.4) | 417 (73.8) | 364 (76.2) | 0.658 |
| 18002359 | 126 (16.1) | 103 (18.2) | 71 (14.9) | |
| Inpatient deaths, n | 13 | 13 | 6 | |
| Top 5 primary diagnoses (%) | ||||
| 1 | Chest pain (11.5) | Chest pain (13.3) | Chest pain (11.9) | |
| 2 | Septicemia (6.4) | Septicemia (5.1) | Septicemia (3.8) | |
| 3 | Diabetes w/cm (4.6) | Pneumonia (4.9) | Diabetes w/cm (3.3) | n/a |
| 4 | Pneumonia (2.8) | Diabetes w/cm (4.1) | Pneumonia (3.3) | |
| 5 | UTI (2.7) | COPD (3.2) | UTI (2.9) | |
Clinical Outcomes
Unadjusted Analyses
The risk of 30‐day readmission was no different between the intervention and control groups. In patients without an initial ICU stay, and without any ICU stay, charges incurred and LOS were no different between the intervention and control groups (Table 2).
| Historical Control | Intervention Localized Teams | Concurrent Control | P Value | |
|---|---|---|---|---|
| ||||
| 30‐day readmissions n (%) | 118 (15.3) | 69 (12.5) | 66 (14.0) | 0.346 |
| Charges: excluding patients initially admitted to ICU | ||||
| Median (IQR) in $ | 9346 (621614,520) | 9724 (665715,390) | 9902 (661115,670) | 0.393 |
| Charges: excluding all patients with an ICU stay | ||||
| Median (IQR) in $ | 9270 (618713,990) | 9509 (660114,940) | 9846 (658015,400) | 0.283 |
| Length of stay: excluding patients initially admitted to ICU | ||||
| Median (IQR) in days | 1.81 (1.223.35) | 2.16 (1.214.02) | 1.89 (1.193.50) | 0.214 |
| Length of stay: excluding all patients with an ICU stay | ||||
| Median (IQR) in days | 1.75 (1.203.26) | 2.12 (1.203.74) | 1.84 (1.193.42) | 0.236 |
Adjusted Analysis
The risk of 30‐day readmission was no different between the intervention and control groups. In patients without an initial ICU stay, and without any ICU stay, charges incurred were no different between the intervention and control groups; LOS was about 11% higher in the localized group as compared to historical controls, and about 9% higher as compared to the concurrent control group. The difference in LOS was not statistically significant on an overall 3‐way comparison (Table 3).
| Localized Teams in Comparison to | |||
|---|---|---|---|
| Historical Control | Concurrent Control | Overall P Value | |
| |||
| 30‐day risk of readmission OR (CI) | 0.85 (0.611.19) | 0.94 (0.651.37) | 0.630 |
| P value | 0.351 | 0.751 | |
| Charges: excluding patients initially admitted to ICU | |||
| % change | 2% higher | 4% lower | 0.367 |
| (CI) | (6% lower to 11% higher) | (12% lower to 5%higher) | |
| P value | 0.572 | 0.427 | |
| Charges: excluding all patients with an ICU stay | |||
| % change | 2% higher | 5% lower | 0.314 |
| (CI) | (6% lower to 10% higher) | (13% lower to 4% higher) | |
| P value | 0.695 | 0.261 | |
| Length of stay: excluding patients initially admitted to ICU | |||
| % change | 11% higher | 9% higher | 0.105 |
| (CI) | (1% to 22% higher) | (3% lower to 21% higher) | |
| P value | 0.038 | 0.138 | |
| Length of stay: excluding all patients with an ICU stay | |||
| % change | 10% higher | 8% higher | 0.133 |
| (CI) | (0% to 22% higher) | (3% lower to 20% higher) | |
| P value | 0.047 | 0.171 | |
Productivity and Workflow Measures
Unadjusted Analyses
The localized teams received fewer pages as compared to concurrently nonlocalized teams. Localized teams had more patient encounters per day and generated more RVUs per day as compared to both historical and concurrent control groups. Physician assistants on localized teams took fewer steps during their work day (Table 4).
| Historical Control | Intervention Localized Teams | Concurrent Control | P Value | |
|---|---|---|---|---|
| ||||
| Pages received/day (7 AM6 PM) Median (IQR) | No data | 15 (921) | 28 (12.540) | <0.001 |
| Total encounters/day Median (IQR) | 10 (813) | 12 (1013) | 11 (913) | <0.001 |
| RVU/day | ||||
| Mean (SD) | 19.9 (6.76) | 22.6 (5.6) | 21.2 (6.7) | <0.001 |
| Steps/day Median (IQR) | No data | 4661 (3922 5166) | 5554 (50606544) | <0.001 |
Adjusted Analysis
On adjusting for clustering by physician and day of week, the significant differences in pages received, total patient encounters, and RVUs generated persisted, while the difference in steps walked by PAs was attenuated to a statistically nonsignificant level (Table 5). The increase in RVU productivity was sustained through various periods of hard caps (data not shown).
| Localized Teams in Comparison to | |||
|---|---|---|---|
| Historical Control | Concurrent Control | Overall P Value | |
| |||
| Pages received (7 AM 6 PM) %(CI) | No data | 51% fewer (4854) | |
| P value | P < 0.001 | ||
| Total encounters | 0.89 more | 1.02 more | |
| N (CI) | (0.371.41) | (0.461.58) | |
| P value | P < 0.001 | P < 0.001 | P < 0.001 |
| RVU/day | 2.20 more | 1.36 more | |
| N (CI) | (1.103.29) | (0.172.55) | |
| P value | P < 0.001 | P = 0.024 | P < 0.001 |
| Steps/day | 1186 fewer (791 more to | ||
| N (CI) | No data | 3164 fewer) | |
| P value | P = 0.240 | ||
DISCUSSION
We found that general medical patients admitted to H‐PA teams and localized to a single nursing unit had similar risk of 30‐day readmission and charges, but may have had a higher length of stay compared to historical and concurrent controls. The localized teams received far fewer pages, had more patient encounters, generated more RVUs, and walked less during their work day. Taken together, these findings imply that in our study, localization led to greater team productivity and a possible decrease in hospital efficiency, with no significant impact on readmissions or charges incurred.
The higher productivity was likely mediated by the preferential assignments of more patients to the localized teams, and improvements in workflow (such as fewer pages and fewer steps walked), which allowed them to provide more care with the same resources as the control teams. Kocher and Sahni7 recently pointed out that the healthcare sector has experienced no gains in labor productivity in the past 20 years. Our intervention fits their prescription for redesigning healthcare delivery models to achieve higher productivity.
The possibility of a higher LOS associated with localization was a counterintuitive finding, and similar to that reported by Roy et al.5 We propose 3 hypotheses to explain this:
Selection bias: Higher workload of the localized teams led to compromised efficiency and a higher length of stay (eg, localized teams had fewer observation admissions, more hospitalizations with an ICU stay, and the AMO was asked to preferentially admit patients to localized teams).
Localization provided teams the opportunity to spend more time with their patients (by decreasing nonvalue‐added tasks) and to consequently address more issues before transitioning to outpatient care, or to provide higher quality of care.
Gaming: By having a hard cap on total number of occupied beds, we provided a perverse incentive to the localized teams to retain patients longer to keep assigned beds occupied, thereby delaying new admissions to avoid higher workload.
Our study cannot tell us which of these hypotheses represents the dominant phenomenon that led to this surprising finding. Hypothesis 3 is most worrying, and we suggest that others looking to localize their medical teams consider the possibility of unintended perverse incentives.
Differences were more pronounced between the historical control group and the intervention group, as opposed to the intervention group and concurrent controls. This may have occurred if we contaminated the concurrent control by decreasing the number of units they had to go to, by sequestering 1 unit for the intervention team.
Our report has limitations. It is a nonrandomized, quasi‐experimental investigation using a single institution's administrative databases. Our intervention was small in scale (localizing 2 out of 10 general medical teams on 1 out of 14 nursing units). What impact a wider implementation of localization may have on emergency department throughput and hospital occupancy remains to be studied. Nevertheless, our research is the first report, to our knowledge, investigating a wide variety of outcomes of localizing inpatient medical teams, and adds significantly to the limited research on this topic. It also provides significant operational details for other institutions to use when localizing medical teams.
We conclude that our intervention of localization of medical teams to a single nursing unit led to higher productivity and better workflow, but did not impact readmissions or charges incurred. We caution others designing similar localization interventions to protect against possible perverse incentives for inefficient care.
Acknowledgements
Disclosure: Nothing to report.
- . Reducing waste in US health care systems. JAMA. 2007;297(8):871–874.
- , , . How hospitalists spend their time: insights on efficiency and safety. J Hosp Med. 2006;1(2):88–93.
- , , , et al. Impact of localizing physicians to hospital units on nurse–physician communication and agreement on the plan of care. J Gen Intern Med. 2009;24(11):1223–1227.
- , , , et al. Structured interdisciplinary rounds in a medical teaching unit: improving patient safety. Arch Intern Med. 2011;171(7):678–684.
- , , , et al. Implementation of a physician assistant/hospitalist service in an academic medical center: impact on efficiency and patient outcomes. J Hosp Med. 2008;3(5):361–368.
- , , , , . Ward‐based rather than team‐based junior surgical doctors reduce mortality for patients with a fracture of the proximal femur: results from a two‐year observational study. J Bone Joint Surg Br. 2011;93‐B(3):393–398.
- , . Rethinking health care labor. N Engl J Med. 2011;365(15):1370–1372.
Copyright © 2012 Society of Hospital Medicine
Physician Assistant‐Based General Medical Inpatient Care
In 2003 the Accreditation Council for Graduate Medical Education (ACGME) prescribed residency reform in the form of work hour restrictions without prescribing alternatives to resident based care.1 As a response, many academic medical centers have developed innovative models for providing inpatient care, some of which incorporate Physician Assistants (PAs).2 With further restrictions in resident work hours possible,3 teaching hospitals may increase use of these alternate models to provide inpatient care. Widespread implementation of such new and untested models could impact the care of the approximately 20 million hospitalizations that occur every year in US teaching hospitals.4
Few reports have compared the care delivered by these alternate models with the care provided by traditional resident‐based models of care.58 Roy et al.8 have provided the only recent comparison of a PA‐based model of care with a resident‐based model. They showed lower adjusted costs of inpatient care associated with PA based care but other outcomes were similar to resident‐based teams.
The objective of this study is to provide a valid and usable comparison of the outcomes of a hospitalist‐PA (H‐PA) model of inpatient care with the traditional resident‐based model. This will add to the quantity and quality of the limited research on PA‐based inpatient care, and informs the anticipated increase in the involvement of PAs in this arena.
Methods
Study Design and Setting
We conducted a retrospective cohort study at a 430‐bed urban academic medical center in the Midwestern United States.
Models of General Medical (GM) Inpatient Care at the Study Hospital During the Study Period
In November 2004, as a response to the ACGME‐mandated work hour regulations, we formed 2 Hospitalist‐PA teams (H‐PA) to supplement the 6 preexisting general medicine resident teams (RES).
The H‐PA and RES teams differed in staffing, admitting times and weekend/overnight cross coverage structure (Table 1). There were no predesigned differences between the teams in the ward location of their patients, availability of laboratory/radiology services, specialty consultation, social services/case management resources, nursing resources or documentation requirements for admission, daily care, and discharge.
| H‐PA Teams | RES Teams | |
|---|---|---|
| Attending physician | Always a hospitalist | Hospitalist, non‐hospitalist general internist or rarely a specialist |
| Attending physician role | Supervisory for some patients (about half) and sole care provider for others. | Supervisory for all patients |
| Team composition | One attending paired with 1 PA | Attending + senior resident + (2) interns + (2‐3) medical students |
| Rotation schedule | ||
| Attending | Every 2 weeks | Every 2 weeks |
| Physician assistant | Off on weekends | |
| House staff & medical students | Every month | |
| Weekend | No new admissions & hospitalist manages all patients | Accept new admissions |
| Admission times (weekdays) | 7 AM to 3 PM | Noon to 7 AM |
| Source of admissions | Emergency room, clinics, other hospitals | Emergency room, clinics, other hospitals |
| Number of admissions (weekdays) | 4‐6 patients per day per team | Noon to 5 PM: 2 teams admit a maximum of 9 patients total |
| 5 PM to 7 AM: 3 teams admit a maximum 5 patients each. | ||
| Overnight coverageroles and responsibilities | One in‐house faculty | 3 on call interns |
| Cross‐covering 2 H‐PA teams | Cross‐covering 2 teams each | |
| Performing triage | Admitting up to 5 patients each | |
| Admitting patients if necessary | ||
| Assisting residents if necessary | ||
| General medical consultation |
Admission Schedule for H‐PA or RES Teams
The admitting schedule was designed to decrease the workload of the house staff and to do so specifically during the periods of peak educational activity (morning report, attending‐led teaching rounds, and noon report). A faculty admitting medical officer (AMO) assigned patients strictly based on the time an admission was requested. Importantly, the request for admission preceded the time of actual admission recorded when the patient reached the ward. The time difference between request for admission and actual admission depended on the source of admission and the delay associated with assigning a patient room. The AMO assigned 8 to 12 new patients to the H‐PA teams every weekday between 7 AM and 3 PM and to the RES teams between noon and 7 AM the next day. There was a designed period of overlap from noon to 3 PM during which both H‐PA and RES teams could admit patients. This period allowed for flexibility in assigning patients to either type of team depending on their workload. The AMO did not use patient complexity or teaching value to assign patients.
Exceptions to Admission Schedule
Patients admitted overnight after the on call RES had reached their admission limits were assigned to H‐PA teams the next morning. In addition, recently discharged patients who were readmitted while the discharging hospitalist (H‐PA teams) or the discharging resident (RES teams) was still scheduled for inpatient duties, were assigned back to the discharging team irrespective of the admitting schedule.
The same medicine team cared for a patient from admission to discharge but on transfer to the intensive care unit (ICU), an intensivist led critical care team assumed care. On transfer out of the ICU these patients were assigned back to the original team irrespective of admitting schedulethe so called bounce back rule to promote inpatient continuity of care. But if the residents (RES teams) or the hospitalist (H‐PA teams) had changedthe bounce back rule was no longer in effect and these patients were assigned to a team according to the admission schedule.
Study Population and Study Period
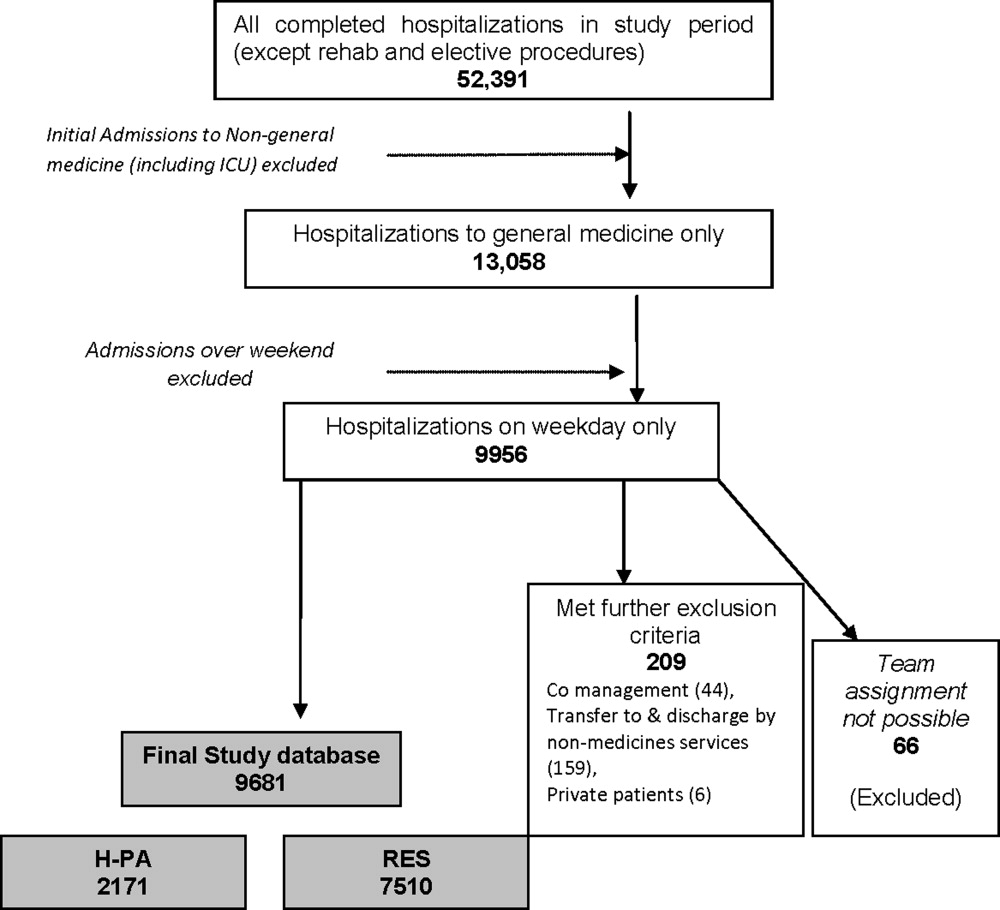
We included all hospitalizations of adult patients to GM teams if both their date of admission and their date of discharge fell within the study period (January 1, 2005 to December 31, 2006). We excluded hospitalizations with admissions during the weekendwhen H‐PA teams did not admit patients; hospitalizations to GM services with transfer to nonGM service (excluding ICU) and hospitalizations involving comanagement with specialty servicesas the contribution of GM teams for these was variable; and hospitalizations of private patients.
Data Collection and Team Assignment
We collected patient data from our hospital's discharge abstract database. This database did not contain team information so to assign teams we matched the discharging attending and the day of discharge to the type of team that the discharging attending was leading that day.
We collected patient age, gender, race, insurance status, zip‐code, primary care provider, source of admission, ward type, time and day of admission, and time and day of discharge for use as independent variables. The time of admission captured in the database was the time of actual admission and not the time the admission was requested.
We grouped the principal diagnosis International Statistical Classification of Diseases and Related Health Problems, 9th edition (ICD‐9) codes into clinically relevant categories using the Clinical Classification Software.9 We created comorbidity measures using Healthcare Cost and Utilization Project Comorbidity Software, version 3.4.10
Outcome Measures
We used length of stay (LOS), charges, readmissions within 7, 14, and 30 days and inpatient mortality as our outcome measures. We calculated LOS by subtracting the discharge day and time from the admission day and time. The LOS included time spent in the ICU. We summed all charges accrued during the entire hospitalization including any stay in the ICU but did not include professional fees. We considered any repeat hospitalization to our hospital within 7, 14, and 30 days following a discharge to be a readmission except that we excluded readmissions for a planned procedure or for inpatient rehabilitation.
Statistical Analysis
Descriptive Analysis
We performed unadjusted descriptive statistics at the level of an individual hospitalization using medians and interquartile ranges for continuous data and frequencies and percentages for categorical data. We used chi‐square tests of association and KruskalWallis analysis of variance to compare H‐PA and RES teams.
Missing Data
Because we lacked data on whether a primary outpatient care provider was available for 284 (2.9%) of our study hospitalizations, we dropped them from our multivariable analyses. We used an arbitrary discharge time of noon for the 11 hospitalizations which did not have a discharge time recorded.
Multivariable Analysis
We used multivariable mixed models to risk adjust for a wide variety of variables. We included age, gender, race, insurance, presence of primary care physician, and total number of comorbidities as fixed effects in all models because of the high face validity of these variables. We then added admission source, ward, time, day of week, discharge day of week, and comorbidity measures one by one as fixed effects, including them only if significant at P < 0.01. For assessing LOS, charges, and readmissions, we added a variable identifying each patient as a random effect to account for multiple admissions for the same patient. We then added variables identifying attending physician, principal diagnostic group, and ZIP code of residence as random effects to account for clustering of hospitalizations within these categories, including them only if significant at P < 0.01. For the model assessing mortality we included variables for attending physician, principal diagnostic group, and ZIP code of residence as random effects if significant at P < 0.01. We log transformed LOS and charges because they were extremely skewed in nature. Readmissions were analyzed after excluding patients who died or were discharged alive within 7, 14, or 30 days of the end of the study period.
Sensitivity Analyses
To assess the influence of LOS outliers, we changed LOS to 6 hours if it was less than 6 hours, and 45 days if it was more than 45 daysa process called winsorizing. We consider winsorizing superior to dropping outliers because it acknowledges that outliers contribute information, but prevent them from being too influential. We chose the 6 hour cut off because we believed that was the minimum time required to admit and then discharge a patient. We chose the upper limit of 45 days on reviewing the frequency distribution for outliers. Similarly, we winsorized charges at the first and 99th percentile after reviewing the frequency distribution for outliers. We then log transformed the winsorized data before analysis.
Inpatient deaths reduce the LOS and charges associated with a hospitalization. Thus excess mortality may provide a false concession in terms of lower LOS or charges. To check if this occurred in our study we repeated the analyses after excluding inpatient deaths.
ICU stays are associated with higher LOS, charges, and mortality. In our model of care, some patients transferred to the ICU are not cared for by the original team on transfer out. Moreover, care in the ICU is not controlled by the team that discharges them. Since this might obscure differences in outcomes achieved by RES vs. H‐PA teams, we repeated these analyses after excluding hospitalizations with an ICU stay.
Since mortality can only occur during 1 hospitalization per patient, we repeated the mortality analysis using only each patient's first admission or last admission and using a randomly selected single admission for each patient.
Subgroup Analysis
To limit the effect of different physician characteristics on H‐PA and RES teams we separately analyzed the hospitalizations under the care of hospitalists who served on both H‐PA and RES teams.
To limit the effect of different admission schedules of H‐PA and RES teams we analyzed the hospitalizations with admission times between 11.00 AM and 4.00 PM. Such hospitalizations were likely to be assigned during the noon to 3 PM period when they could be assigned to either an H‐PA or RES team.
Interactions
Finally we explored interactions between the type of team and the fixed effect variables included in each model.
Statistical Software
We performed the statistical analysis using SAS software version 9.0 for UNIX (SAS Institute, Inc., Cary, NC) and R software (The R Project for Statistical Computing).
This study protocol was approved by the hospital's institutional review board.
Results
Study Population
Of the 52,391 hospitalizations to our hospital during the study period, 13,058 were admitted to general medicine. We excluded 3102 weekend admissions and 209 who met other exclusion criteria. We could not determine the team assignment for 66. Of the remaining 9681 hospitalizations, we assigned 2171 to H‐PA teams and 7510 to RES teams (Figure 1).

Descriptive Analysis
We compare patients assigned to H‐PA and RES teams in Table 2. They were similar in age, gender, race, having a primary care provider or not, and insurance status. Clinically, they had similar comorbidities and a similar distribution of common principal diagnoses. Consistent with their admitting schedule, H‐PA teams admitted and discharged more patients earlier in the day and admitted more patients earlier in the work week. Patients cared for by H‐PA teams were admitted from the Emergency Room (ER) less often and were more likely to reside on wards designated as nonmedicine by nursing specialty. Hospitalizations to H‐PA teams more often included an ICU stay.
| H‐PA (n = 2171) | RES (n = 7510) | P Value | |
|---|---|---|---|
| |||
| Age | |||
| Mean | 56.80 | 57.04 | |
| Median | 56 | 56 | 0.15 |
| Interquartile range | 43‐72 | 43‐73 | |
| Age group (years), n (%) | |||
| < 20 | 10 (0.5) | 57 (0.8) | |
| 20‐29 | 186 (8.6) | 632 (8.7) | |
| 30‐39 | 221 (10.2) | 766 (10.3) | |
| 40‐49 | 387 (17.8) | 1341 (18.1) | |
| 50‐59 | 434 (20.0) | 1492 (20.2) | 0.28 |
| 60‐69 | 325 (15.0) | 974 (12.8) | |
| 70‐79 | 271 (12.5) | 1035 (13.6) | |
| 80‐89 | 262 (12.0) | 951(12.3) | |
| 90< | 75 (3.5) | 262 (3.4) | |
| Female, n (%) | 1175 (54.1) | 4138 (55.1) | 0.42 |
| Race, n (%) | |||
| White | 1282 (59.1) | 4419 (58.9) | |
| Black | 793 (36.5) | 2754 (36.7) | 0.98 |
| Other | 96 (4.4) | 337 (4.5) | |
| Primary care provider, n (%) | 0.16 | ||
| Yes | 1537 (73.2) | 5451 (74.7) | |
| Missing: 284 | 71 (3.3) | 213 (2.8) | |
| Insurance status, n (%) | |||
| Commercial/worker's comp | 440 (20.3) | 1442 (19.2) | |
| Medicare | 1017 (46.8) | 3589 (47.8) | 0.52 |
| Medicaid/others | 714 (32.9) | 2479 (33.0) | |
| Time of admission, n (%) | |||
| 0000‐0259 | 167 (7.7) | 1068 (14.2) | |
| 0300‐0559 | 244 (11.2) | 485 (6.5) | |
| 0600‐0859 | 456 (21.0) | 270 (3.6) | |
| 0900‐1159 | 782 (36.0) | 1146 (15.3) | <0.001 |
| 1200‐1459 | 299 (13.8) | 1750 (23.3) | |
| 1500‐1759 | 155 (7.1) | 1676 (22.3) | |
| 1800‐2359 | 68 (3.1) | 1115 (14.9) | |
| Time of discharge, n (%) | |||
| 2100‐0859 | 36 (1.7) | 174 (2.3) | |
| 0900‐1159 | 275 (12.7) | 495 (6.6) | |
| 1200‐1459 | 858 (39.6) | 2608 (34.8) | <0.001 |
| 1500‐1759 | 749 (34.6) | 3122 (41.6) | |
| 1800‐2059 | 249 (11.5) | 1104 (14.7) | |
| Missing | 4 | 7 | |
| Day of week of admission, n (%) | |||
| Monday | 462 (21.3) | 1549 (20.6) | |
| Tuesday | 499 (23.0) | 1470 (19.6) | |
| Wednesday | 430 (19.8) | 1479 (19.7) | 0.001 |
| Thursday | 400 (18.4) | 1482 (19.7) | |
| Friday | 380 (17.5) | 1530 (20.4) | |
| Day of week of discharge, n (%) | |||
| Monday | 207 (9.5) | 829 (11.0) | |
| Tuesday | 268 (12.3) | 973 (13.0) | |
| Wednesday | 334 (15.4) | 1142 (15.2) | |
| Thursday | 362 (16.7) | 1297 (17.3) | 0.16 |
| Friday | 485 (22.3) | 1523 (20.3) | |
| Saturday | 330 (15.2) | 1165 (15.5) | |
| Sunday | 185 (8.5) | 581 (7.7) | |
| Admit to non‐medicine wards, n (%) | 1332 (61.4) | 2624 (34.9) | <0.001 |
| Transfer to ICU (at least once), n (%) | 299 (13.8) | 504 (6.7) | <0.001 |
| Admit from ER No (%) | 1663 (76.6) | 6063 (80.7) | <0.001 |
| 10 most frequent diagnosis (%) | Pneumonia (4.9) | Pneumonia (5.5) | |
| Congestive heart failure; nonhypertensive (4.2) | Congestive heart failure; nonhypertensive (3.9) | ||
| Sickle cell anemia (3.9) | Nonspecific chest pain (3.7) | ||
| Chronic obstructive pulmonary disease and Bronchiectasis (3.3) | Urinary tract infections(3.6) | ||
| Diabetes mellitus with complications (3.2) | Skin and subcutaneous tissue infections (3.3) | ||
| Urinary tract infections (3.2) | Sickle cell anemia (3.3) | ||
| Asthma (3.0) | Pancreatic disorders (not diabetes) (2.8) | ||
| Nonspecific chest pain (3.0) | Asthma (2.8) | ||
| Pancreatic disorders (not diabetes) (2.9) | Chronic obstructive pulmonary disease and Bronchiectasis (2.6) | ||
| Septicemia (2.2) | Diabetes mellitus with complications (2.6) | ||
| Average number of comorbidities mean (95% CI) | 0.39 (0.37‐0.42) | 0.38 (0.36‐0.39) | 0.23 |
In unadjusted comparisons of outcomes (Table 3), hospitalizations on H‐PA teams had higher lengths of stay and charges than hospitalizations on RES teams, possibly higher inpatient mortality rates but similar unadjusted readmission rates at 7, 14, and 30 days
| H‐PA (n = 2171) | RES (n = 7150) | % Difference* (CI) | P Value | |
|---|---|---|---|---|
| ||||
| LOS | Median (IQR) | Median (IQR) | ||
| Days | 3.17 (2.03‐5.30) | 2.99 (1.80‐5.08) | +8.9% (4.71‐13.29%) | <0.001 |
| Charges | ||||
| US Dollars | 9390 (6196‐16,239) | 9044 (6106‐14,805) | +5.56% (1.96‐9.28%) | 0.002 |
| Readmissions | n (%) | n (%) | Odds Ratio (CI) | |
| Within 7 days | 147 (6.96) | 571 (7.78) | 0.88 (0.73‐1.06) | 0.19 |
| Within14 days | 236 (11.34) | 924 (12.76) | 0.87 (0.75‐1.01) | 0.07 |
| Within 30 days | 383 (18.91) | 1436 (20.31) | 0.91 (0.80‐1.03) | 0.14 |
| Inpatient deaths | 39 (1.8) | 95 (1.3) | 1.36 (0.90‐2.00) | 0.06 |
Multivariable Analysis
LOS
Hospitalizations to H‐PA teams were associated with a 6.73% longer LOS (P = 0.005) (Table 4). This difference persisted when we used the winsorized data (6.45% increase, P = 0.006), excluded inpatient deaths (6.81% increase, P = 0.005), or excluded hospitalizations that involved an ICU stay (6.40%increase, P = 0.011) (Table 5).
| Overall | Subgroup: Restricted to Physicians Attending on Both H‐PA and RES Teams* | Subgroup: Restricted to Hospitalizations Between 11.00 AM and 4.00 PM | ||||
|---|---|---|---|---|---|---|
| % Difference (CI) | P Value | % Difference (CI) | P Value | % Difference (CI) | P Value | |
| ||||||
| LOS | 6.73% (1.99% to 11.70%) | 0.005 | 5.44% (0.65% to 11.91%) | 0.08 | 2.97% (4.47% to 10.98%) | 0.44 |
| Charges | 2.75% (1.30% to 6.97%) | 0.19 | 1.55% (3.76% to 7.16%) | 0.57 | 6.45% (0.62% to 14.03%) | 0.07 |
| Risk of Readmission | Adjusted OR (95%CI) | P Value | Adjusted OR (95% CI) | P Value | Adjusted OR (95% CI) | P Value |
| Within 7 days | 0.88 (0.64‐1.20) | 0.42 | 0.74 (0.40‐1.35) | 0.32 | 0.90 (0.40‐2.00) | 0.78 |
| Within14 days | 0.90 (0.69‐1.19) | 0.46 | 0.71 (0.51‐0.99) | 0.05 | 0.87 (0.36‐2.13) | 0.77 |
| Within 30 days | 0.89 (0.75‐1.06) | 0.20 | 0.75 (0.51‐1.08) | 0.12 | 0.92 (0.55‐1.54) | 0.75 |
| Inpatient mortality | 1.27 (0.82‐1.97) | 0.28 | 1.46 (0.67‐3.17) | 0.33 | 1.14 (0.47‐2.74) | 0.77 |
| Analysis With Winsorized Data | Analysis After Excluding Inpatient Deaths | Analysis After Excluding Patients With ICU Stays | ||||
|---|---|---|---|---|---|---|
| % Difference (CI) | P Value | % Difference (CI) | P Value | % Difference (CI) | P Value | |
| ||||||
| LOS | 6.45% (4.04 to 8.91%) | 0.006 | 6.81% (2.03 to 11.80%) | 0.005 | 6.40% (1.46 to 11.58%) | 0.011 |
| Charges | 2.67 (1.27 to 6.76%) | 0.187 | 2.89% (1.16 to 7.11%) | 0.164 | 0.74% (3.11 to 4.76%) | 0.710 |
Charges
Hospitalizations to H‐PA and RES teams were associated with similar charges (Table 4). The results were similar when we used winsorized data, excluded inpatient deaths or excluded hospitalizations involving an ICU stay (Table 5).
Readmissions
The risk of readmission at 7, 14, and 30 days was similar between hospitalizations to H‐PA and RES teams (Table 4).
Mortality
The risk of inpatient death was similar between all hospitalizations to H‐PA and RES teams or only hospitalizations without an ICU stay (Table 4). The results also remained the same in analyses restricted to first admissions, last admissions, or 1 randomly selected admission per patient.
Sub‐Group Analysis
On restricting the multivariable analyses to the subset of hospitalists who staffed both types of teams (Table 4), the increase in LOS associated with H‐PA care was no longer significant (5.44% higher, P = 0.081). The charges, risk of readmission at 7 and 30 days, and risk of inpatient mortality remained similar. The risk of readmission at 14 days was slightly lower following hospitalizations to H‐PA teams (odds ratio 0.71, 95% confidence interval [CI] 0.51‐0.99).
The increase in LOS associated with H‐PA care was further attenuated in analyses of the subset of admissions between 11.00 AM and 4.00 PM (2.97% higher, P = 0.444). The difference in charges approached significance (6.45% higher, P = 0.07), but risk of readmission at 7, 14, and 30 days and risk of inpatient mortality were no different (Table 4).
Interactions
On adding interaction terms between the team assignment and the fixed effect variables in each model we detected that the effect of H‐PA care on LOS (P < 0.001) and charges (P < 0.001) varied by time of admission (Figure 2a and b). Hospitalizations to H‐PA teams from 6.00 PM to 6.00 AM had greater relative increases in LOS as compared to hospitalizations to RES teams during those times. Similarly, hospitalizations during the period 3.00 PM to 3.00 AM had relatively higher charges associated with H‐PA care compared to RES care.
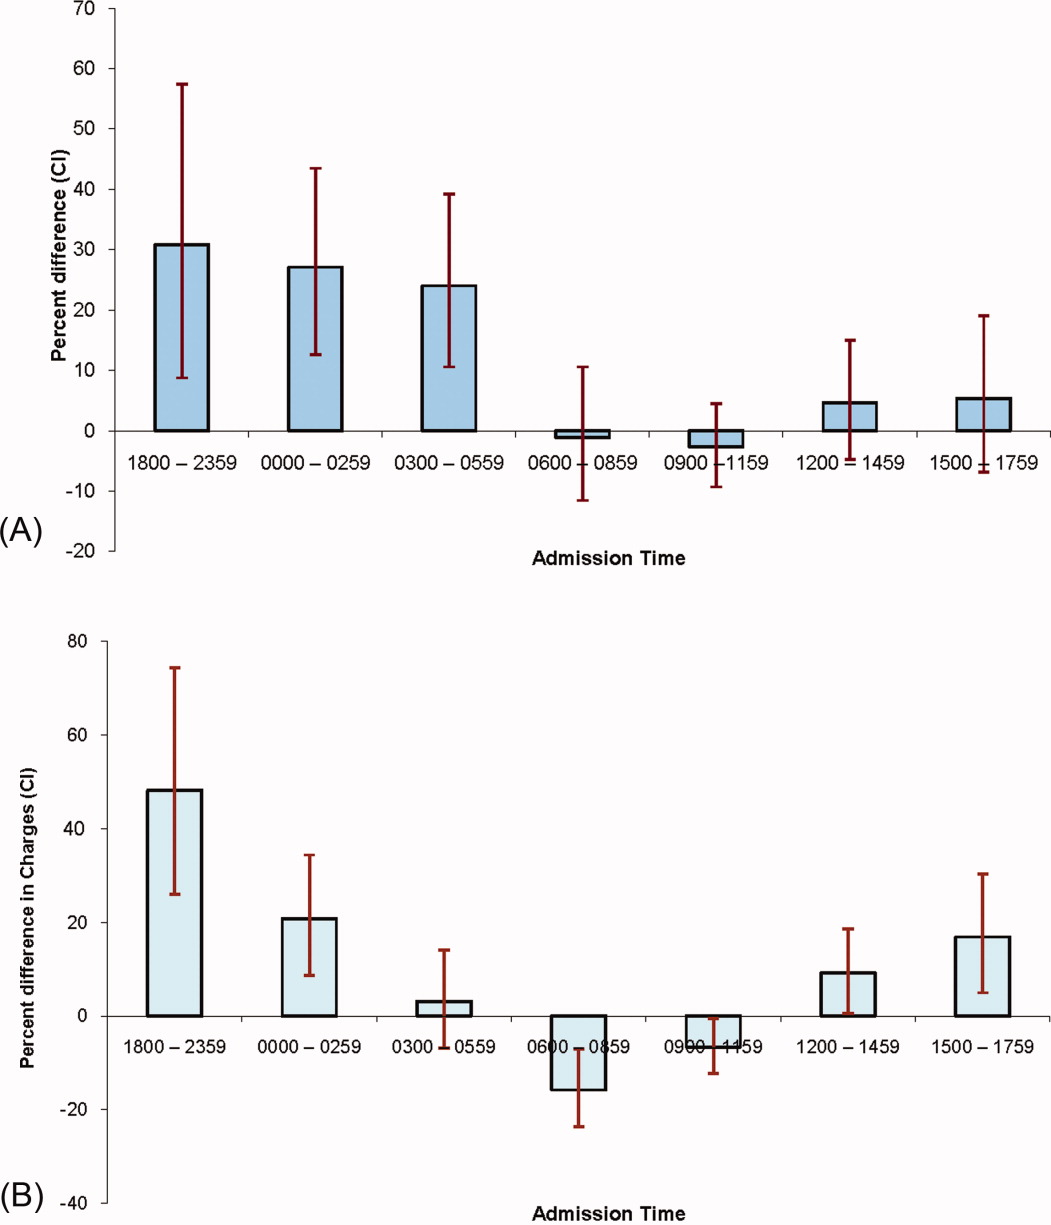
Discussion
We found that hospitalizations to our H‐PA teams had longer LOS but similar charges, readmission rates, and mortality as compared to traditional resident‐based teams. These findings were robust to multiple sensitivity and subgroup analyses but when we examined times when both types of teams could receive admissions, the difference in LOS was markedly attenuated and nonsignificant.
We note that most prior reports comparing PA‐based models of inpatient care predate the ACGME work hour regulations. In a randomized control trial (1987‐1988) Simmer et al.5 showed lower lengths of stay and charges but possibly higher risk of readmission for PA based teams as compared to resident based teams. Van Rhee et al.7 conducted a nonrandomized retrospective cohort study (1994‐1995) using administrative data which showed lower resource utilization for PA‐based inpatient care. Our results from 2005 to 2006 reflect the important changes in the organization and delivery of inpatient care since these previous investigations.
Roy et al.8 report the only previously published comparison of PA and resident based GM inpatient care after the ACGME mandated work hour regulations. They found PA‐based care was associated with lower costs, whereas we found similar charges for admissions to RES and H‐PA teams. They also found that LOS was similar for PA and resident‐based care, while we found a higher LOS for admissions to our H‐PA team. We note that although the design of Roy's study was similar to our own, patients cared for by PA‐based teams were geographically localized in their model. This may contribute to the differences in results noted between our studies.
Despite no designed differences in patients assigned to either type of team other than time of admission we noted some differences between the H‐PA and RES teams in the descriptive analysis. These differences, such as a higher proportion of hospitalizations to H‐PA teams being admitted from the ER, residing on nonmedicine wards or having an ICU stay are likely a result of our system of assigning admissions to H‐PA teams early during the workday. For example patients on H‐PA teams were more often located on nonmedicine wards as a result of later discharges and bed availability on medicine wards. The difference that deserves special comment is the much higher proportion (13.8% vs. 6.7%) of hospitalizations with an ICU stay on the H‐PA teams. Hospitalizations directly to the ICU were excluded from our study which means that the hospitalizations with an ICU stay in our study were initially admitted to either H‐PA or RES teams and then transferred to the ICU. Transfers out of the ICU usually occur early in the workday when H‐PA teams accepted patients per our admission schedule. These patients may have been preferentially assigned to H‐PA teams, if on returning from the ICU the original team's resident had changed (and the bounce back rule was not in effect). Importantly, the conclusions of our research are not altered on controlling for this difference in the teams by excluding hospitalizations with an ICU stay.
Hospitalizations to H‐PA teams were associated with higher resource utilization if they occurred later in the day or overnight (Figure 2a and b). During these times a transition of care occurred shortly after admission. For a late day admission the H‐PA teams would transfer care for overnight cross cover soon after the admission and for patients admitted overnight as overflow they would assume care of a patient from the nighttime covering physician performing the admission. On the other hand, on RES teams, interns admitting patients overnight continued to care for their patients for part of the following day (30‐hour call). Similar findings of higher resource utilization associated with transfer of care after admission in the daytime11 and nighttime12 have been previously reported. An alternative hypothesis for our findings is that the hospital maybe busier and thus less efficient during times when H‐PA teams had to admit later in the day or accept patients admitted overnight as overflow. Future research to determine the cause of this significant interaction between team assignment and time of admission on resource utilization is important as the large increases in LOS (up to 30%) and charges (up to 50%) noted, could have a potentially large impact if a higher proportion of hospitalizations were affected by this phenomenon.
Our H‐PA teams were assigned equally complex patients as our RES teams, in contrast to previous reports.8, 13 This was accomplished while improving the resident's educational experience and we have previously reported increases in our resident's board pass rates and in‐service training exam scores with that introduction of our H‐PA teams.14 We thus believe that selection of less complex patients to H‐PA teams such as ours is unnecessary and may give them a second tier status in academic settings.
Our report has limitations. It is a retrospective, nonrandomized investigation using a single institution's administrative database and has the limitations of not being able to account for unmeasured confounders, severity of illness, errors in the database, selection bias and has limited generalizability. We measured charges not actual costs,15 but we feel charges are a true reflection of relative resource use when compared between similar patients within a single institution. We also did not account for the readmissions that occur to other hospitals16 and our results do not reflect resource utilization for the healthcare system in total. For example, we could not tell if higher LOS on H‐PA teams resulted in lower readmissions for their patients in all hospitals in the region, which may reveal an overall resource savings. Additionally, we measured in‐hospital mortality and could not capture deaths related to hospital care that may occur shortly after discharge.
ACGME has proposed revised standards that may further restrict resident duty hours when they take effect in July 2011.3 This may lead to further decreases in resident‐based inpatient care. Teaching hospitals will need to continue to develop alternate models for inpatient care that do not depend on house staff. Our findings provide important evidence to inform the development of such models. Our study shows that one such model: PAs paired with hospitalists, accepting admissions early in the workday, with hospitalist coverage over the weekend and nights can care for GM inpatients as complex as those cared for by resident‐based teams without increasing readmission rates, inpatient mortality, or charges but at the cost of slightly higher LOS.
- ACGME‐Common Program Requirements for Resident Duty Hours. Available at: http://www.acgme.org/acWebsite/dutyHours/dh_ComProgrRequirmentsDutyHours0707.pdf. Accessed July 2010.
- ,,,,.Non‐housestaff medicine services in academic centers: models and challenges.J Hosp Med.2008;3(3):247–255.
- ACGME. Duty Hours: Proposed Standards for Review and comment. Available at: http://acgme‐2010standards.org/pdf/Proposed_Standards. pdf. Accessed July 22,2010.
- Agency for Health Care Policy and Research. HCUPnet: A tool for identifying, tracking, and analyzing national hospital statistics. Available at: http://hcup.ahrq.gov/HCUPnet.asp. Accessed July2010.
- ,,,,.A randomized, controlled trial of an attending staff service in general internal medicine.Med Care.1991;29(7 suppl):JS31–JS40.
- ,.Replacing an academic internal medicine residency program with a physician assistant‐‐hospitalist model: a Comparative Analysis Study.Am J Med Qual.2009;24(2):132–139.
- ,,.Resource use by physician assistant services versus teaching services.JAAPA.2002;15(1):33–42.
- ,,, et al.Implementation of a physician assistant/hospitalist service in an academic medical center: impact on efficiency and patient outcomes.J Hosp Med.2008;3(5):361–368.
- AHRQ. Clinical Classifications Software (CCS) for ICD‐9‐CM. Available at: http://www.hcup‐us.ahrq.gov/toolssoftware/ccs/ccs.jsp#overview. Accessed July2010.
- AHRQ. HCUP: Comorbidity Software, Version 3.4.;Available at: http://www.hcup‐us.ahrq.gov/toolssoftware/comorbidity/comorbidity.jsp. Accessed July2010.
- ,,, et al.Effect of short call admission on length of stay and quality of care for acute decompensated heart failure.Circulation.2008;117(20):2637–2644.
- ,,,.Post‐call transfer of resident responsibility: its effect on patient care.J Gen Intern Med.1990;5(6):501–505.
- ,,,,,.The effect of nonteaching services on the distribution of inpatient cases for internal medicine residents.Acad Med.2009:84(2):220–225.
- ,,, et al.Allowing for better resident education and improving patient care: hospitalist‐physician assistant teams fill in the gaps.J Hosp Med.2007;2[S2]:1–39.
- .The distinction between cost and charges.Ann Intern Med.1982;96(1):102–109.
- ,,.Rehospitalizations among patients in the Medicare Fee‐for‐Service Program.N Engl J Med.2009;360(14):1418–1428.
In 2003 the Accreditation Council for Graduate Medical Education (ACGME) prescribed residency reform in the form of work hour restrictions without prescribing alternatives to resident based care.1 As a response, many academic medical centers have developed innovative models for providing inpatient care, some of which incorporate Physician Assistants (PAs).2 With further restrictions in resident work hours possible,3 teaching hospitals may increase use of these alternate models to provide inpatient care. Widespread implementation of such new and untested models could impact the care of the approximately 20 million hospitalizations that occur every year in US teaching hospitals.4
Few reports have compared the care delivered by these alternate models with the care provided by traditional resident‐based models of care.58 Roy et al.8 have provided the only recent comparison of a PA‐based model of care with a resident‐based model. They showed lower adjusted costs of inpatient care associated with PA based care but other outcomes were similar to resident‐based teams.
The objective of this study is to provide a valid and usable comparison of the outcomes of a hospitalist‐PA (H‐PA) model of inpatient care with the traditional resident‐based model. This will add to the quantity and quality of the limited research on PA‐based inpatient care, and informs the anticipated increase in the involvement of PAs in this arena.
Methods
Study Design and Setting
We conducted a retrospective cohort study at a 430‐bed urban academic medical center in the Midwestern United States.
Models of General Medical (GM) Inpatient Care at the Study Hospital During the Study Period
In November 2004, as a response to the ACGME‐mandated work hour regulations, we formed 2 Hospitalist‐PA teams (H‐PA) to supplement the 6 preexisting general medicine resident teams (RES).
The H‐PA and RES teams differed in staffing, admitting times and weekend/overnight cross coverage structure (Table 1). There were no predesigned differences between the teams in the ward location of their patients, availability of laboratory/radiology services, specialty consultation, social services/case management resources, nursing resources or documentation requirements for admission, daily care, and discharge.
| H‐PA Teams | RES Teams | |
|---|---|---|
| Attending physician | Always a hospitalist | Hospitalist, non‐hospitalist general internist or rarely a specialist |
| Attending physician role | Supervisory for some patients (about half) and sole care provider for others. | Supervisory for all patients |
| Team composition | One attending paired with 1 PA | Attending + senior resident + (2) interns + (2‐3) medical students |
| Rotation schedule | ||
| Attending | Every 2 weeks | Every 2 weeks |
| Physician assistant | Off on weekends | |
| House staff & medical students | Every month | |
| Weekend | No new admissions & hospitalist manages all patients | Accept new admissions |
| Admission times (weekdays) | 7 AM to 3 PM | Noon to 7 AM |
| Source of admissions | Emergency room, clinics, other hospitals | Emergency room, clinics, other hospitals |
| Number of admissions (weekdays) | 4‐6 patients per day per team | Noon to 5 PM: 2 teams admit a maximum of 9 patients total |
| 5 PM to 7 AM: 3 teams admit a maximum 5 patients each. | ||
| Overnight coverageroles and responsibilities | One in‐house faculty | 3 on call interns |
| Cross‐covering 2 H‐PA teams | Cross‐covering 2 teams each | |
| Performing triage | Admitting up to 5 patients each | |
| Admitting patients if necessary | ||
| Assisting residents if necessary | ||
| General medical consultation |
Admission Schedule for H‐PA or RES Teams
The admitting schedule was designed to decrease the workload of the house staff and to do so specifically during the periods of peak educational activity (morning report, attending‐led teaching rounds, and noon report). A faculty admitting medical officer (AMO) assigned patients strictly based on the time an admission was requested. Importantly, the request for admission preceded the time of actual admission recorded when the patient reached the ward. The time difference between request for admission and actual admission depended on the source of admission and the delay associated with assigning a patient room. The AMO assigned 8 to 12 new patients to the H‐PA teams every weekday between 7 AM and 3 PM and to the RES teams between noon and 7 AM the next day. There was a designed period of overlap from noon to 3 PM during which both H‐PA and RES teams could admit patients. This period allowed for flexibility in assigning patients to either type of team depending on their workload. The AMO did not use patient complexity or teaching value to assign patients.
Exceptions to Admission Schedule
Patients admitted overnight after the on call RES had reached their admission limits were assigned to H‐PA teams the next morning. In addition, recently discharged patients who were readmitted while the discharging hospitalist (H‐PA teams) or the discharging resident (RES teams) was still scheduled for inpatient duties, were assigned back to the discharging team irrespective of the admitting schedule.
The same medicine team cared for a patient from admission to discharge but on transfer to the intensive care unit (ICU), an intensivist led critical care team assumed care. On transfer out of the ICU these patients were assigned back to the original team irrespective of admitting schedulethe so called bounce back rule to promote inpatient continuity of care. But if the residents (RES teams) or the hospitalist (H‐PA teams) had changedthe bounce back rule was no longer in effect and these patients were assigned to a team according to the admission schedule.
Study Population and Study Period
We included all hospitalizations of adult patients to GM teams if both their date of admission and their date of discharge fell within the study period (January 1, 2005 to December 31, 2006). We excluded hospitalizations with admissions during the weekendwhen H‐PA teams did not admit patients; hospitalizations to GM services with transfer to nonGM service (excluding ICU) and hospitalizations involving comanagement with specialty servicesas the contribution of GM teams for these was variable; and hospitalizations of private patients.
Data Collection and Team Assignment
We collected patient data from our hospital's discharge abstract database. This database did not contain team information so to assign teams we matched the discharging attending and the day of discharge to the type of team that the discharging attending was leading that day.
We collected patient age, gender, race, insurance status, zip‐code, primary care provider, source of admission, ward type, time and day of admission, and time and day of discharge for use as independent variables. The time of admission captured in the database was the time of actual admission and not the time the admission was requested.
We grouped the principal diagnosis International Statistical Classification of Diseases and Related Health Problems, 9th edition (ICD‐9) codes into clinically relevant categories using the Clinical Classification Software.9 We created comorbidity measures using Healthcare Cost and Utilization Project Comorbidity Software, version 3.4.10
Outcome Measures
We used length of stay (LOS), charges, readmissions within 7, 14, and 30 days and inpatient mortality as our outcome measures. We calculated LOS by subtracting the discharge day and time from the admission day and time. The LOS included time spent in the ICU. We summed all charges accrued during the entire hospitalization including any stay in the ICU but did not include professional fees. We considered any repeat hospitalization to our hospital within 7, 14, and 30 days following a discharge to be a readmission except that we excluded readmissions for a planned procedure or for inpatient rehabilitation.
Statistical Analysis
Descriptive Analysis
We performed unadjusted descriptive statistics at the level of an individual hospitalization using medians and interquartile ranges for continuous data and frequencies and percentages for categorical data. We used chi‐square tests of association and KruskalWallis analysis of variance to compare H‐PA and RES teams.
Missing Data
Because we lacked data on whether a primary outpatient care provider was available for 284 (2.9%) of our study hospitalizations, we dropped them from our multivariable analyses. We used an arbitrary discharge time of noon for the 11 hospitalizations which did not have a discharge time recorded.
Multivariable Analysis
We used multivariable mixed models to risk adjust for a wide variety of variables. We included age, gender, race, insurance, presence of primary care physician, and total number of comorbidities as fixed effects in all models because of the high face validity of these variables. We then added admission source, ward, time, day of week, discharge day of week, and comorbidity measures one by one as fixed effects, including them only if significant at P < 0.01. For assessing LOS, charges, and readmissions, we added a variable identifying each patient as a random effect to account for multiple admissions for the same patient. We then added variables identifying attending physician, principal diagnostic group, and ZIP code of residence as random effects to account for clustering of hospitalizations within these categories, including them only if significant at P < 0.01. For the model assessing mortality we included variables for attending physician, principal diagnostic group, and ZIP code of residence as random effects if significant at P < 0.01. We log transformed LOS and charges because they were extremely skewed in nature. Readmissions were analyzed after excluding patients who died or were discharged alive within 7, 14, or 30 days of the end of the study period.
Sensitivity Analyses
To assess the influence of LOS outliers, we changed LOS to 6 hours if it was less than 6 hours, and 45 days if it was more than 45 daysa process called winsorizing. We consider winsorizing superior to dropping outliers because it acknowledges that outliers contribute information, but prevent them from being too influential. We chose the 6 hour cut off because we believed that was the minimum time required to admit and then discharge a patient. We chose the upper limit of 45 days on reviewing the frequency distribution for outliers. Similarly, we winsorized charges at the first and 99th percentile after reviewing the frequency distribution for outliers. We then log transformed the winsorized data before analysis.
Inpatient deaths reduce the LOS and charges associated with a hospitalization. Thus excess mortality may provide a false concession in terms of lower LOS or charges. To check if this occurred in our study we repeated the analyses after excluding inpatient deaths.
ICU stays are associated with higher LOS, charges, and mortality. In our model of care, some patients transferred to the ICU are not cared for by the original team on transfer out. Moreover, care in the ICU is not controlled by the team that discharges them. Since this might obscure differences in outcomes achieved by RES vs. H‐PA teams, we repeated these analyses after excluding hospitalizations with an ICU stay.
Since mortality can only occur during 1 hospitalization per patient, we repeated the mortality analysis using only each patient's first admission or last admission and using a randomly selected single admission for each patient.
Subgroup Analysis
To limit the effect of different physician characteristics on H‐PA and RES teams we separately analyzed the hospitalizations under the care of hospitalists who served on both H‐PA and RES teams.
To limit the effect of different admission schedules of H‐PA and RES teams we analyzed the hospitalizations with admission times between 11.00 AM and 4.00 PM. Such hospitalizations were likely to be assigned during the noon to 3 PM period when they could be assigned to either an H‐PA or RES team.
Interactions
Finally we explored interactions between the type of team and the fixed effect variables included in each model.
Statistical Software
We performed the statistical analysis using SAS software version 9.0 for UNIX (SAS Institute, Inc., Cary, NC) and R software (The R Project for Statistical Computing).
This study protocol was approved by the hospital's institutional review board.
Results
Study Population
Of the 52,391 hospitalizations to our hospital during the study period, 13,058 were admitted to general medicine. We excluded 3102 weekend admissions and 209 who met other exclusion criteria. We could not determine the team assignment for 66. Of the remaining 9681 hospitalizations, we assigned 2171 to H‐PA teams and 7510 to RES teams (Figure 1).
Descriptive Analysis
We compare patients assigned to H‐PA and RES teams in Table 2. They were similar in age, gender, race, having a primary care provider or not, and insurance status. Clinically, they had similar comorbidities and a similar distribution of common principal diagnoses. Consistent with their admitting schedule, H‐PA teams admitted and discharged more patients earlier in the day and admitted more patients earlier in the work week. Patients cared for by H‐PA teams were admitted from the Emergency Room (ER) less often and were more likely to reside on wards designated as nonmedicine by nursing specialty. Hospitalizations to H‐PA teams more often included an ICU stay.
| H‐PA (n = 2171) | RES (n = 7510) | P Value | |
|---|---|---|---|
| |||
| Age | |||
| Mean | 56.80 | 57.04 | |
| Median | 56 | 56 | 0.15 |
| Interquartile range | 43‐72 | 43‐73 | |
| Age group (years), n (%) | |||
| < 20 | 10 (0.5) | 57 (0.8) | |
| 20‐29 | 186 (8.6) | 632 (8.7) | |
| 30‐39 | 221 (10.2) | 766 (10.3) | |
| 40‐49 | 387 (17.8) | 1341 (18.1) | |
| 50‐59 | 434 (20.0) | 1492 (20.2) | 0.28 |
| 60‐69 | 325 (15.0) | 974 (12.8) | |
| 70‐79 | 271 (12.5) | 1035 (13.6) | |
| 80‐89 | 262 (12.0) | 951(12.3) | |
| 90< | 75 (3.5) | 262 (3.4) | |
| Female, n (%) | 1175 (54.1) | 4138 (55.1) | 0.42 |
| Race, n (%) | |||
| White | 1282 (59.1) | 4419 (58.9) | |
| Black | 793 (36.5) | 2754 (36.7) | 0.98 |
| Other | 96 (4.4) | 337 (4.5) | |
| Primary care provider, n (%) | 0.16 | ||
| Yes | 1537 (73.2) | 5451 (74.7) | |
| Missing: 284 | 71 (3.3) | 213 (2.8) | |
| Insurance status, n (%) | |||
| Commercial/worker's comp | 440 (20.3) | 1442 (19.2) | |
| Medicare | 1017 (46.8) | 3589 (47.8) | 0.52 |
| Medicaid/others | 714 (32.9) | 2479 (33.0) | |
| Time of admission, n (%) | |||
| 0000‐0259 | 167 (7.7) | 1068 (14.2) | |
| 0300‐0559 | 244 (11.2) | 485 (6.5) | |
| 0600‐0859 | 456 (21.0) | 270 (3.6) | |
| 0900‐1159 | 782 (36.0) | 1146 (15.3) | <0.001 |
| 1200‐1459 | 299 (13.8) | 1750 (23.3) | |
| 1500‐1759 | 155 (7.1) | 1676 (22.3) | |
| 1800‐2359 | 68 (3.1) | 1115 (14.9) | |
| Time of discharge, n (%) | |||
| 2100‐0859 | 36 (1.7) | 174 (2.3) | |
| 0900‐1159 | 275 (12.7) | 495 (6.6) | |
| 1200‐1459 | 858 (39.6) | 2608 (34.8) | <0.001 |
| 1500‐1759 | 749 (34.6) | 3122 (41.6) | |
| 1800‐2059 | 249 (11.5) | 1104 (14.7) | |
| Missing | 4 | 7 | |
| Day of week of admission, n (%) | |||
| Monday | 462 (21.3) | 1549 (20.6) | |
| Tuesday | 499 (23.0) | 1470 (19.6) | |
| Wednesday | 430 (19.8) | 1479 (19.7) | 0.001 |
| Thursday | 400 (18.4) | 1482 (19.7) | |
| Friday | 380 (17.5) | 1530 (20.4) | |
| Day of week of discharge, n (%) | |||
| Monday | 207 (9.5) | 829 (11.0) | |
| Tuesday | 268 (12.3) | 973 (13.0) | |
| Wednesday | 334 (15.4) | 1142 (15.2) | |
| Thursday | 362 (16.7) | 1297 (17.3) | 0.16 |
| Friday | 485 (22.3) | 1523 (20.3) | |
| Saturday | 330 (15.2) | 1165 (15.5) | |
| Sunday | 185 (8.5) | 581 (7.7) | |
| Admit to non‐medicine wards, n (%) | 1332 (61.4) | 2624 (34.9) | <0.001 |
| Transfer to ICU (at least once), n (%) | 299 (13.8) | 504 (6.7) | <0.001 |
| Admit from ER No (%) | 1663 (76.6) | 6063 (80.7) | <0.001 |
| 10 most frequent diagnosis (%) | Pneumonia (4.9) | Pneumonia (5.5) | |
| Congestive heart failure; nonhypertensive (4.2) | Congestive heart failure; nonhypertensive (3.9) | ||
| Sickle cell anemia (3.9) | Nonspecific chest pain (3.7) | ||
| Chronic obstructive pulmonary disease and Bronchiectasis (3.3) | Urinary tract infections(3.6) | ||
| Diabetes mellitus with complications (3.2) | Skin and subcutaneous tissue infections (3.3) | ||
| Urinary tract infections (3.2) | Sickle cell anemia (3.3) | ||
| Asthma (3.0) | Pancreatic disorders (not diabetes) (2.8) | ||
| Nonspecific chest pain (3.0) | Asthma (2.8) | ||
| Pancreatic disorders (not diabetes) (2.9) | Chronic obstructive pulmonary disease and Bronchiectasis (2.6) | ||
| Septicemia (2.2) | Diabetes mellitus with complications (2.6) | ||
| Average number of comorbidities mean (95% CI) | 0.39 (0.37‐0.42) | 0.38 (0.36‐0.39) | 0.23 |
In unadjusted comparisons of outcomes (Table 3), hospitalizations on H‐PA teams had higher lengths of stay and charges than hospitalizations on RES teams, possibly higher inpatient mortality rates but similar unadjusted readmission rates at 7, 14, and 30 days
| H‐PA (n = 2171) | RES (n = 7150) | % Difference* (CI) | P Value | |
|---|---|---|---|---|
| ||||
| LOS | Median (IQR) | Median (IQR) | ||
| Days | 3.17 (2.03‐5.30) | 2.99 (1.80‐5.08) | +8.9% (4.71‐13.29%) | <0.001 |
| Charges | ||||
| US Dollars | 9390 (6196‐16,239) | 9044 (6106‐14,805) | +5.56% (1.96‐9.28%) | 0.002 |
| Readmissions | n (%) | n (%) | Odds Ratio (CI) | |
| Within 7 days | 147 (6.96) | 571 (7.78) | 0.88 (0.73‐1.06) | 0.19 |
| Within14 days | 236 (11.34) | 924 (12.76) | 0.87 (0.75‐1.01) | 0.07 |
| Within 30 days | 383 (18.91) | 1436 (20.31) | 0.91 (0.80‐1.03) | 0.14 |
| Inpatient deaths | 39 (1.8) | 95 (1.3) | 1.36 (0.90‐2.00) | 0.06 |
Multivariable Analysis
LOS
Hospitalizations to H‐PA teams were associated with a 6.73% longer LOS (P = 0.005) (Table 4). This difference persisted when we used the winsorized data (6.45% increase, P = 0.006), excluded inpatient deaths (6.81% increase, P = 0.005), or excluded hospitalizations that involved an ICU stay (6.40%increase, P = 0.011) (Table 5).
| Overall | Subgroup: Restricted to Physicians Attending on Both H‐PA and RES Teams* | Subgroup: Restricted to Hospitalizations Between 11.00 AM and 4.00 PM | ||||
|---|---|---|---|---|---|---|
| % Difference (CI) | P Value | % Difference (CI) | P Value | % Difference (CI) | P Value | |
| ||||||
| LOS | 6.73% (1.99% to 11.70%) | 0.005 | 5.44% (0.65% to 11.91%) | 0.08 | 2.97% (4.47% to 10.98%) | 0.44 |
| Charges | 2.75% (1.30% to 6.97%) | 0.19 | 1.55% (3.76% to 7.16%) | 0.57 | 6.45% (0.62% to 14.03%) | 0.07 |
| Risk of Readmission | Adjusted OR (95%CI) | P Value | Adjusted OR (95% CI) | P Value | Adjusted OR (95% CI) | P Value |
| Within 7 days | 0.88 (0.64‐1.20) | 0.42 | 0.74 (0.40‐1.35) | 0.32 | 0.90 (0.40‐2.00) | 0.78 |
| Within14 days | 0.90 (0.69‐1.19) | 0.46 | 0.71 (0.51‐0.99) | 0.05 | 0.87 (0.36‐2.13) | 0.77 |
| Within 30 days | 0.89 (0.75‐1.06) | 0.20 | 0.75 (0.51‐1.08) | 0.12 | 0.92 (0.55‐1.54) | 0.75 |
| Inpatient mortality | 1.27 (0.82‐1.97) | 0.28 | 1.46 (0.67‐3.17) | 0.33 | 1.14 (0.47‐2.74) | 0.77 |
| Analysis With Winsorized Data | Analysis After Excluding Inpatient Deaths | Analysis After Excluding Patients With ICU Stays | ||||
|---|---|---|---|---|---|---|
| % Difference (CI) | P Value | % Difference (CI) | P Value | % Difference (CI) | P Value | |
| ||||||
| LOS | 6.45% (4.04 to 8.91%) | 0.006 | 6.81% (2.03 to 11.80%) | 0.005 | 6.40% (1.46 to 11.58%) | 0.011 |
| Charges | 2.67 (1.27 to 6.76%) | 0.187 | 2.89% (1.16 to 7.11%) | 0.164 | 0.74% (3.11 to 4.76%) | 0.710 |
Charges
Hospitalizations to H‐PA and RES teams were associated with similar charges (Table 4). The results were similar when we used winsorized data, excluded inpatient deaths or excluded hospitalizations involving an ICU stay (Table 5).
Readmissions
The risk of readmission at 7, 14, and 30 days was similar between hospitalizations to H‐PA and RES teams (Table 4).
Mortality
The risk of inpatient death was similar between all hospitalizations to H‐PA and RES teams or only hospitalizations without an ICU stay (Table 4). The results also remained the same in analyses restricted to first admissions, last admissions, or 1 randomly selected admission per patient.
Sub‐Group Analysis
On restricting the multivariable analyses to the subset of hospitalists who staffed both types of teams (Table 4), the increase in LOS associated with H‐PA care was no longer significant (5.44% higher, P = 0.081). The charges, risk of readmission at 7 and 30 days, and risk of inpatient mortality remained similar. The risk of readmission at 14 days was slightly lower following hospitalizations to H‐PA teams (odds ratio 0.71, 95% confidence interval [CI] 0.51‐0.99).
The increase in LOS associated with H‐PA care was further attenuated in analyses of the subset of admissions between 11.00 AM and 4.00 PM (2.97% higher, P = 0.444). The difference in charges approached significance (6.45% higher, P = 0.07), but risk of readmission at 7, 14, and 30 days and risk of inpatient mortality were no different (Table 4).
Interactions
On adding interaction terms between the team assignment and the fixed effect variables in each model we detected that the effect of H‐PA care on LOS (P < 0.001) and charges (P < 0.001) varied by time of admission (Figure 2a and b). Hospitalizations to H‐PA teams from 6.00 PM to 6.00 AM had greater relative increases in LOS as compared to hospitalizations to RES teams during those times. Similarly, hospitalizations during the period 3.00 PM to 3.00 AM had relatively higher charges associated with H‐PA care compared to RES care.
Discussion
We found that hospitalizations to our H‐PA teams had longer LOS but similar charges, readmission rates, and mortality as compared to traditional resident‐based teams. These findings were robust to multiple sensitivity and subgroup analyses but when we examined times when both types of teams could receive admissions, the difference in LOS was markedly attenuated and nonsignificant.
We note that most prior reports comparing PA‐based models of inpatient care predate the ACGME work hour regulations. In a randomized control trial (1987‐1988) Simmer et al.5 showed lower lengths of stay and charges but possibly higher risk of readmission for PA based teams as compared to resident based teams. Van Rhee et al.7 conducted a nonrandomized retrospective cohort study (1994‐1995) using administrative data which showed lower resource utilization for PA‐based inpatient care. Our results from 2005 to 2006 reflect the important changes in the organization and delivery of inpatient care since these previous investigations.
Roy et al.8 report the only previously published comparison of PA and resident based GM inpatient care after the ACGME mandated work hour regulations. They found PA‐based care was associated with lower costs, whereas we found similar charges for admissions to RES and H‐PA teams. They also found that LOS was similar for PA and resident‐based care, while we found a higher LOS for admissions to our H‐PA team. We note that although the design of Roy's study was similar to our own, patients cared for by PA‐based teams were geographically localized in their model. This may contribute to the differences in results noted between our studies.
Despite no designed differences in patients assigned to either type of team other than time of admission we noted some differences between the H‐PA and RES teams in the descriptive analysis. These differences, such as a higher proportion of hospitalizations to H‐PA teams being admitted from the ER, residing on nonmedicine wards or having an ICU stay are likely a result of our system of assigning admissions to H‐PA teams early during the workday. For example patients on H‐PA teams were more often located on nonmedicine wards as a result of later discharges and bed availability on medicine wards. The difference that deserves special comment is the much higher proportion (13.8% vs. 6.7%) of hospitalizations with an ICU stay on the H‐PA teams. Hospitalizations directly to the ICU were excluded from our study which means that the hospitalizations with an ICU stay in our study were initially admitted to either H‐PA or RES teams and then transferred to the ICU. Transfers out of the ICU usually occur early in the workday when H‐PA teams accepted patients per our admission schedule. These patients may have been preferentially assigned to H‐PA teams, if on returning from the ICU the original team's resident had changed (and the bounce back rule was not in effect). Importantly, the conclusions of our research are not altered on controlling for this difference in the teams by excluding hospitalizations with an ICU stay.
Hospitalizations to H‐PA teams were associated with higher resource utilization if they occurred later in the day or overnight (Figure 2a and b). During these times a transition of care occurred shortly after admission. For a late day admission the H‐PA teams would transfer care for overnight cross cover soon after the admission and for patients admitted overnight as overflow they would assume care of a patient from the nighttime covering physician performing the admission. On the other hand, on RES teams, interns admitting patients overnight continued to care for their patients for part of the following day (30‐hour call). Similar findings of higher resource utilization associated with transfer of care after admission in the daytime11 and nighttime12 have been previously reported. An alternative hypothesis for our findings is that the hospital maybe busier and thus less efficient during times when H‐PA teams had to admit later in the day or accept patients admitted overnight as overflow. Future research to determine the cause of this significant interaction between team assignment and time of admission on resource utilization is important as the large increases in LOS (up to 30%) and charges (up to 50%) noted, could have a potentially large impact if a higher proportion of hospitalizations were affected by this phenomenon.
Our H‐PA teams were assigned equally complex patients as our RES teams, in contrast to previous reports.8, 13 This was accomplished while improving the resident's educational experience and we have previously reported increases in our resident's board pass rates and in‐service training exam scores with that introduction of our H‐PA teams.14 We thus believe that selection of less complex patients to H‐PA teams such as ours is unnecessary and may give them a second tier status in academic settings.
Our report has limitations. It is a retrospective, nonrandomized investigation using a single institution's administrative database and has the limitations of not being able to account for unmeasured confounders, severity of illness, errors in the database, selection bias and has limited generalizability. We measured charges not actual costs,15 but we feel charges are a true reflection of relative resource use when compared between similar patients within a single institution. We also did not account for the readmissions that occur to other hospitals16 and our results do not reflect resource utilization for the healthcare system in total. For example, we could not tell if higher LOS on H‐PA teams resulted in lower readmissions for their patients in all hospitals in the region, which may reveal an overall resource savings. Additionally, we measured in‐hospital mortality and could not capture deaths related to hospital care that may occur shortly after discharge.
ACGME has proposed revised standards that may further restrict resident duty hours when they take effect in July 2011.3 This may lead to further decreases in resident‐based inpatient care. Teaching hospitals will need to continue to develop alternate models for inpatient care that do not depend on house staff. Our findings provide important evidence to inform the development of such models. Our study shows that one such model: PAs paired with hospitalists, accepting admissions early in the workday, with hospitalist coverage over the weekend and nights can care for GM inpatients as complex as those cared for by resident‐based teams without increasing readmission rates, inpatient mortality, or charges but at the cost of slightly higher LOS.
- ACGME‐Common Program Requirements for Resident Duty Hours. Available at: http://www.acgme.org/acWebsite/dutyHours/dh_ComProgrRequirmentsDutyHours0707.pdf. Accessed July 2010.
- ,,,,.Non‐housestaff medicine services in academic centers: models and challenges.J Hosp Med.2008;3(3):247–255.
- ACGME. Duty Hours: Proposed Standards for Review and comment. Available at: http://acgme‐2010standards.org/pdf/Proposed_Standards. pdf. Accessed July 22,2010.
- Agency for Health Care Policy and Research. HCUPnet: A tool for identifying, tracking, and analyzing national hospital statistics. Available at: http://hcup.ahrq.gov/HCUPnet.asp. Accessed July2010.
- ,,,,.A randomized, controlled trial of an attending staff service in general internal medicine.Med Care.1991;29(7 suppl):JS31–JS40.
- ,.Replacing an academic internal medicine residency program with a physician assistant‐‐hospitalist model: a Comparative Analysis Study.Am J Med Qual.2009;24(2):132–139.
- ,,.Resource use by physician assistant services versus teaching services.JAAPA.2002;15(1):33–42.
- ,,, et al.Implementation of a physician assistant/hospitalist service in an academic medical center: impact on efficiency and patient outcomes.J Hosp Med.2008;3(5):361–368.
- AHRQ. Clinical Classifications Software (CCS) for ICD‐9‐CM. Available at: http://www.hcup‐us.ahrq.gov/toolssoftware/ccs/ccs.jsp#overview. Accessed July2010.
- AHRQ. HCUP: Comorbidity Software, Version 3.4.;Available at: http://www.hcup‐us.ahrq.gov/toolssoftware/comorbidity/comorbidity.jsp. Accessed July2010.
- ,,, et al.Effect of short call admission on length of stay and quality of care for acute decompensated heart failure.Circulation.2008;117(20):2637–2644.
- ,,,.Post‐call transfer of resident responsibility: its effect on patient care.J Gen Intern Med.1990;5(6):501–505.
- ,,,,,.The effect of nonteaching services on the distribution of inpatient cases for internal medicine residents.Acad Med.2009:84(2):220–225.
- ,,, et al.Allowing for better resident education and improving patient care: hospitalist‐physician assistant teams fill in the gaps.J Hosp Med.2007;2[S2]:1–39.
- .The distinction between cost and charges.Ann Intern Med.1982;96(1):102–109.
- ,,.Rehospitalizations among patients in the Medicare Fee‐for‐Service Program.N Engl J Med.2009;360(14):1418–1428.
Copyright © 2011 Society of Hospital Medicine