User login
Readmissions of Medicare beneficiaries within 30 days of discharge are frequent and costly.[1] Concern about readmissions has prompted the Centers for Medicare & Medicaid Services (CMS) to reduce payments to hospitals with excess readmissions.[2] Research has identified a number of patient clinical and socio‐demographic factors associated with readmissions.[3] However, interventions designed to reduce readmissions have met with limited success. In a systematic review, no single intervention was regularly effective in reducing readmissions, despite the fact that interventions have targeted both predischarge, transition of care, and postdischarge processes of care.[4]
The different trajectories of care experienced by patients after hospital discharge, and their effect on risk of readmission, have been incompletely studied. Although early outpatient follow‐up after discharge is associated with lower readmission rates,[5, 6] a factor that has been minimally studied is the role of the emergency department (ED) and the ED provider in readmissions. The ED and ED providers feature prominently in the care received by patients shortly after discharge from a hospital. About a quarter of all hospitalized Medicare patients are evaluated in an ED within 30 days of discharge,[7, 8] and a majority of readmissions within 30 days of discharge are precipitated by an ED visit.[9] Hence, we asked whether when a recently discharged patient is seen in an ED, does the rate of readmission vary by ED provider and by ED facility?
We used Texas Medicare claims data to examine patients visiting the ED within 30 days of discharge from an initial hospitalization to determine if their risk of readmission varies by the ED provider caring for them and by the ED facility they visit.
METHODS
Sources of Data
We used claims from the years 2007 to 2011 for 100% of Texas Medicare beneficiaries, including Medicare beneficiary summary files, Medicare Provider Analysis and Review (MedPAR) files, Outpatient Standard Analytical Files (OutSAF), and Medicare Carrier files. We obtained diagnosis‐related group associated information, including weights, and Major Diagnostic Category from CMS, and used Provider of Services files to determine facility characteristics.
Establishment of the Study Cohort
From 2008 through 2011 MedPAR files, we initially selected all hospital discharges from acute‐care hospitals in Texas. From these 3,191,160 admissions, we excluded those discharged dead or transferred to other acute‐care hospitals (N=230,343), those who were younger than 66 years at admission (N=736,685) and those without complete Parts A and B enrollment or with any health maintenance organization enrollment in the 12 months prior to and 2 months after the admission of interest (N=596,427). From the remaining 1,627,705 discharges, we identified 302,949 discharges that were followed by at least 1 ED visit within 30 days.
We applied the algorithm developed by Kaskie et al. to identify ED visits.[10] We identified claims for ED services with Current Procedural Terminology (CPT) codes 99281‐99285 from Carrier files and bundled claims with overlapping dates or those that were within 1 day of each other. Then we identified claims for ED services using the same CPT codes from OutSAF and bundled those with overlapping dates or those that were within 3 days of each other. Finally, we bundled Carrier and OutSAF claims with overlapping dates and defined them as the same ED visit. From these, we retained only the first ED visit. We excluded those receiving care from multiple ED providers during the ED visit (N=38,565), and those who had a readmission before the first ED visit (N=1436), leaving 262,948 ED visits. For patients who had more than 1 hospitalization followed by an ED visit in a given year, we selected the first hospitalization, resulting in 199,143 ED visits. We then selected ED providers associated with at least 30 ED visits in this cohort, resulting in 1922 ED providers and 174,209 ED visits. For analyses where we examined both ED provider and facility variation in admission rates, we eliminated ED providers that generated charges from more than 1 ED facility, resulting in 525 providers and 48,883 ED visits at 143 ED facilities.
Measures
Patient Characteristics
We categorized beneficiaries by age, gender, and ethnicity using Medicare beneficiary summary files. We used the Medicaid indicator as a proxy of low socioeconomic status. We obtained information on weekend admission, emergent admission, discharge destination, and diagnosis‐related groupt (DRG) from MedPAR files. We identified comorbidities using the claims from MedPAR, Carrier, and OutSAF files in the year prior to the admission.[11] We identified total hospitalizations and outpatient visits in the prior year from MedPAR files and Carrier files, respectively. We obtained education status at the level of zip code of residence from the 2011 American Community Survey estimates from the United States Census Bureau. We determined urban or rural residence using the 2013 Rural‐Urban Continuum Codes developed by the United States Department of Agriculture.
ED Facility Characteristics
We used the provider number of the ED facility to link to the Provider of Services files and obtained information on medical school affiliation, facility size, and for profit status.
Study Outcomes
The outcome of this study was readmission after an ED visit within 30 days of discharge from an initial hospitalization. We defined readmission after an ED visit as a hospitalization starting the day of or the day following the ED visit
Statistical Analyses
We performed 2‐level analyses where patients were clustered with ED providers to examine variation among ED providers. The effect of ED providers was modeled as a random effect to account for the correlation among the patients cared for by the same ED provider. We derived ED provider‐specific estimates from models adjusted for patient age, gender, race/ethnicity, rural or urban residence, Medicaid eligibility, education at the zip code level of residence, and characteristics of the initial admission (emergency admission, weekend admission, discharge destination, its major diagnostic category and DRG weight). We also adjusted for comorbidities, number of hospitalizations, and number of physician visits in the year before the initial admission.
We also conducted 2‐level analyses where patients were nested in ED facilities and 3‐level analyses where patients were nested in ED providers and ED providers were nested in ED facilities. We adjusted for all factors described above. We computed the change in the variance between 2‐level and 2‐level analyses to determine the variation in readmission rates that was explained by the ED provider and the ED facility. All analyses were performed with SAS version 9.2 (SAS Institute Inc., Cary, NC).
RESULTS
We identified 174,209 patients who visited an ED within 30 days of discharge from an initial hospitalization. Table 1 describes the characteristics of these patients as well as the readmission rates associated with these characteristics. The rate of readmission of our cohort of 1,627,705 discharges with or without a following ED visit was 16.2%, whereas the rate of readmission following an ED visit in our final cohort of 174,209 patients was 52.67%. This readmission rate increased with age, from 49.31% for patients between 66 and 70 years of age to 55.33% for patients older than 85 years. There were minor variations by gender and ethnicity. Patients residing in metropolitan areas or in zip codes with low education levels had higher readmission rates, as did those whose original admission was classified as emergency or those who were not discharged home.
| Patient Characteristic | No. of ED Visits (%) | % Readmitted | Odds Ratio (95% CI)a |
|---|---|---|---|
| MeanSD, Median (Q1Q3) | Odds Ratio (95% CI)a | ||
| |||
| Overall | 174,209 (100) | 52.67 | |
| Age, y | |||
| 6670 | 32,962 (18.92) | 49.31 | 1.00 |
| 7175 | 34,979 (20.08) | 51.48 | 1.10 (1.06‐1.13)b |
| 7680 | 36,728 (21.08) | 53.01 | 1.15 (1.12‐1.19)b |
| 8185 | 34,784 (19.97) | 54.05 | 1.19 (1.15‐1.23)b |
| >85 | 34,756 (19.95) | 55.33 | 1.25 (1.21‐1.29)b |
| Gender | |||
| Male | 71,049 (40.78) | 52.95 | 1.02 (1.00‐1.04) |
| Female | 103,160 (59.22) | 52.48 | 1.00 |
| Race | |||
| Non‐Hispanic white | 124,312 (71.36) | 52.77 | 1.00 |
| Black | 16,809 (9.65) | 51.45 | 0.84 (0.81‐0.87)b |
| Hispanic | 30,618 (17.58) | 52.70 | 0.88 (0.85‐0.91)b |
| Other | 2,470 (1.42) | 55.71 | 1.06 (0.97‐1.15) |
| Rural/urban residence | |||
| Metropolitan | 136,739 (78.49) | 53.88 | 1.00 |
| Nonmetropolitan | 35,000 (20.09) | 48.16 | 0.96 (0.93‐0.99)b |
| Rural | 2,448 (1.41) | 50.04 | 1.04 (0.95‐1.13) |
| Medicaid eligible | |||
| No | 128,909 (74.00) | 52.65 | 1.00 |
| Yes | 45,300 (26.00) | 52.72 | 0.97 (0.94‐0.99)b |
| Education levelc | |||
| 1st quartile (lowest) | 43,863 (25.18) | 54.61 | 1.00 |
| 2nd quartile | 43,316 (24.86) | 53.92 | 1.00 (0.97‐1.03) |
| 3rd quartile | 43,571 (25.01) | 50.72 | 0.99 (0.96‐1.02) |
| 4th quartile (highest) | 43,318 (24.87) | 51.98 | 1.01 (0.97‐1.04) |
| Emergency admission | |||
| No | 99,101 (56.89) | 51.15 | 1.00 |
| Yes | 75,108 (43.11) | 54.68 | 1.07 (1.05‐1.09)b |
| Weekend admission | |||
| No | 131,266 (75.35) | 52.45 | 1.00 |
| Yes | 42,943 (24.65) | 53.35 | 1.01 (0.99‐1.04) |
| Discharge destination | |||
| Home | 122,542 (70.34) | 50.90 | 1.00 |
| Inpatient rehabilitation facility | 9,512 (5.46) | 55.48 | 1.31 (1.25‐1.37)b |
| Skilled nursing facility | 37,248 (21.38) | 57.25 | 1.29 (1.26‐1.33)b |
| Other | 4,907 (2.82) | 56.88 | 1.14 (1.07‐1.21)b |
| DRG weight (per unit) | 1.561.27, 0.82 (1.16‐1.83) | 1.06 (1.05‐1.07)b | |
| Hospitalization in the prior year (per hospitalization) | 1.031.49, 0.00 (1.00‐2.00) | 1.04 (1.03‐1.04)b | |
| Physician visits in the prior year (per 10 visits) | 11.759.80, 5.00 (10.00‐17.00) | 0.97 (0.96‐0.98)b | |
Table 1 also presents the odds of readmission adjusted for all other factors in the table and also adjusted for clustering within ED providers in a 2‐level model. Increasing age, white race, metropolitan residence, nonhome discharge, higher severity of illness, more hospitalizations in the prior year, fewer physician visits in the prior year, and an emergency initial admission were each associated with a higher readmission rate.
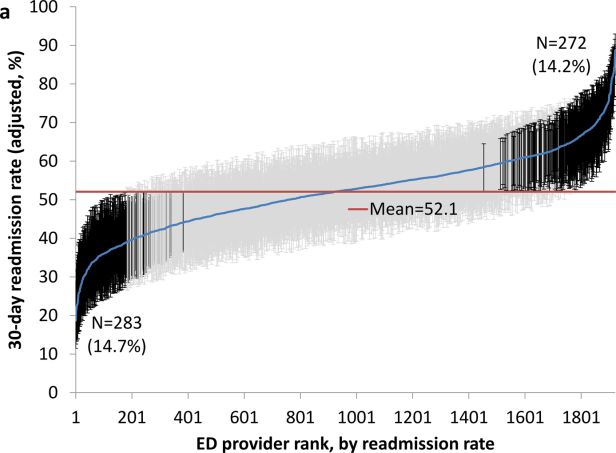
We next generated estimates of readmission rates for each ED provider from the adjusted 2‐level models. Figure 1 shows the adjusted cumulative readmission rates for the 1922 ED providers. This figure shows the mean value and 95% confidence intervals of the readmission rates for each provider. Dark vertical lines indicate providers whose readmission rate differed significantly from the mean adjusted readmission rate of 52.1% for all providers. Of the ED providers, 14.2% had significantly higher readmission rates. The mean readmission rate for these 272 providers was 67.2%. Of the ED providers, 14.7% had significantly lower readmission rates. The mean readmission rate for these 283 providers was 36.8%.

To determine the contribution of the ED facility to the variation in readmission rates, we restricted our analysis to 48,883 patients (28.06% of our cohort) seen by 525 ED providers who were associated with only 1 facility (total of 143 facilities). Table 2 describes the unadjusted readmission rates stratified by specific characteristics of those facilities. The unadjusted readmission rate increased with the size of the associated hospital, from 47.61% for hospitals with less than 100 beds to 57.06% for hospitals with more than 400 beds. The readmission rate for nonprofit facilities was 53.81% and for for‐profit facilities was 57.39%. Facilities with no medical school affiliation had a readmission rate of 54.51%, whereas those with a major affiliation had a readmission rate of 58.72%.
| ED Facility Characteristic | No. of ED Visits (%) | % Readmitted | Odds Ratio (95% CI)a |
|---|---|---|---|
| |||
| Overall | 48,883 | ||
| Total beds | |||
| 100 | 3,936 (8.05) | 47.61 | 1.00 |
| 101200 | 6,251 (12.79) | 52.07 | 1.38 (1.06‐1.81)b |
| 201400 | 13,000 (26.59) | 56.26 | 1.69 (1.32‐2.17)b |
| >400 | 25,696 (52.57) | 57.06 | 1.77 (1.35‐2.33)b |
| Type of control | |||
| Nonprofit | 24,999 (51.14) | 53.81 | 1.00 |
| Proprietary | 17,108 (35.00) | 57.39 | 1.32 (1.09‐1.61)b |
| Government | 6,776 (13.86) | 56.60 | 1.11 (0.88‐1.41) |
| Medical school affiliation | |||
| Major | 6,487 (13.27) | 58.72 | 1.00 |
| Limited | 7,066 (14.45) | 56.37 | 0.85 (0.58‐1.25) |
| Graduate | 3,164 (6.47) | 56.19 | 0.71 (0.44‐1.15) |
| No affiliation | 32,166 (65.80) | 54.51 | 0.78 (0.57‐1.05) |
| If the same hospital patient was discharged from | |||
| Yes | 38,532 (78.82) | 55.64 | 0.96 (0.91‐1.00) |
| No | 10,351 (21.18) | 54.73 | 1.00 |
With this smaller cohort, we performed 2 types of 2‐level models, where patients clustered within ED facilities and ER providers, respectively, and a 3‐level model accounting for clustering of patients within providers and of providers within facilities. From the facility‐patient 2‐level model, the variance of the ED facility was 0.2718 (95% confidence interval [CI]: 0.2083‐0.3696). From the provider‐patient 2‐level model, the variance of ED provider was 0.2532 (95% CI: 0.2166‐0.3002). However, when the 3‐level model was performed, the variance of ED provider decreased to 0.0893 (95% CI: 0.0723‐0.1132) and the variance of ED facility dropped to 0.2316 (95% CI: 0.1704‐0.3331) . This indicates 65% of the variation among ED providers was explained by the ED facility, and in contrast, 15% of the variation among ED facilities was explained by ED providers.
Table 2 also shows the adjusted odds of readmission generated from the 3‐level model. Patients receiving care in ED facilities in hospitals with more beds and in for‐profit hospitals were at higher risk for readmission. It is possible that patients seen at the ED associated with the discharging hospital had a lower risk of readmission. This finding was close to being statistically significant (P=0.051).
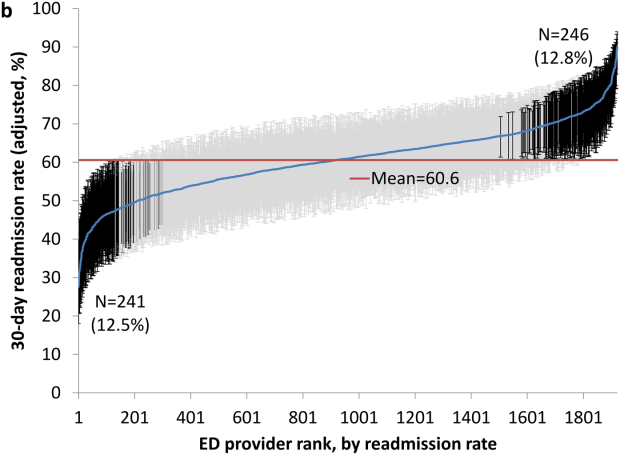
We repeated all the above analyses using an outcome of readmission anytime between the ED visit and 30 days after discharge from the initial hospitalization (rather than readmission on the day of or after the ED visit). All analyses produced results similar to the results presented above. For example, Figure 2 shows the adjusted cumulative readmission rates for the 1922 ED providers using this outcome. Of the ED providers, 12.8% had higher and 12.5% had lower readmission rates as compared to the mean readmission rate for all ED providers. The Spearman correlation coefficient between the rank of ED providers in immediate readmission rate (Figure 1) and readmission rate within 30 days of hospital discharge (Figure 2) was 0.94 (P<0.001).
DISCUSSION
This study found substantial variation in readmission rates by ED provider, despite controlling for patient clinical and sociodemographic factors. In 3‐level models, the ED facility explained a substantial part of the variation by ED provider, with patients seen at larger facilities and for‐profit facilities having higher readmission rates.
Variation among ED facilities and ED providers in readmission rates has not previously been studied. There is literature on the variation in ED facility and ED provider admission rates. As readmissions are a subset of all admissions, this literature provides context to our findings. Abualenain et al. examined admission rates for 89 ED physicians for adult patients presenting with an acute medical or surgical complaint at 3 EDs in a health system.[12] After adjusting for patient and clinical characteristics, admission rates varied from 21% to 49% among physicians and from 27% to 41% among 3 facilities. Two other studies from single hospitals have found similar variation among providers.[13, 14] The reasons for the variation among ED providers presumably relate to subjective aspects of clinical assessment and the reluctance of providers to rely solely on objective scales, even when they are available.[14, 15] Variation in admission rates among different facilities may relate to clustering of providers with similar practice styles within facilities, lack of clinical guidelines for certain conditions, as well as differences among facilities in the socioeconomic status and access to primary care of their clientele.[12, 16, 17] For example, Pines et al. have shown that ED facility admission rates are higher in communities with fewer primary care physicians per capita and are influenced by the prevailing county level admission rates.[16] Capp et al. showed persistent variation in admission rates across hospitals, despite adjusting for clinical criteria such as vital signs, chief complaints, and severity of illness.[18]
Structural differences in ED facilities may also influence the decision to admit. We found that patients visiting ED facilities in hospitals with more beds had a higher readmission rate. ED facility systems of care such as observation units or protocols are associated with lower admission rates.[19, 20] Finally, certain hospitals may actively influence the admission practice patterns of their ED providers. We noted that patients seen at for‐profit ED facilities had a greater risk of readmission. A similar finding has been described by Pines et al., who noted higher admission rates at for‐profit facilities.[16] In an extreme example, a recent Justice Department lawsuit alleged that a for‐profit hospital chain used software systems and financial incentives to ED providers to increase admissions.[21]
It is possible that the providers with low readmission rates may have inappropriately released patients who truly should have been admitted. A signal that this occurred would be if these patients were readmitted in the days after the ED visits. We examined this possibility by additionally examining readmissions occurring anytime between the ED visit until 30 days after discharge from the initial hospitalization. The results were similar to when we only included readmissions that occurred immediately following the ED visit, with a very high correlation (r=0.94) between the ranking of the ED providers by readmission rates in both circumstances. This suggests that the decisions of the ED providers with low readmission rates to admit or release from the ED were likely appropriate.
Our research has limitations. We studied patients with fee‐for‐service Medicare in a single large state in the United States over a 4‐year period. Our findings may not be generalizable to younger patient populations, other regions with different sociodemographic patterns and healthcare systems, or other time periods. We could not control for many factors that may impact the risk of readmission but are not measured in Medicare databases (eg, clinical data such as vital signs, measures of quality of transition from discharging hospital, ED provider workload). To attribute care to a single ED provider, we excluded patients who were taken care of by multiple ED providers. These patients may have different needs from our study population (eg, more complex issues and longer stays in the ED) and may bias our results.
This study provides a new direction for research and quality improvement targeting readmissions. Research should extend beyond the discharge transition and examine the entire trajectory of posthospitalization care to better understand readmissions. Based directly on this study, research could investigate the practice patterns of ED providers and systems of care at ED facilities that affect readmissions rates. Such investigation could inform quality improvement efforts to standardize care for patients in the ED.
CMS policies hold hospitals accountable for readmissions of the patients they discharge, but do not address the admission process in the ED that leads to readmissions of recently discharged patients. Given the present study, and the fact that the proportion of all hospital admissions that occur through the ED has grown to 44%,[22] consideration of the role of the ED in public policy efforts to discourage unnecessary inpatient care may be appropriate.
In summary, this study shows that a recently discharged patient's chances of being readmitted depends partly on the ED provider who evaluates them and on the ED facility at which they seek care. ED provider practice patterns and ED facility systems of care may be a target for interventions aimed at decreasing readmission rates.
Disclosures
This research was supported by grants from the National Institutes of Health (AG033134 and K05CA134923) and from the Agency for Healthcare Research and Quality (R24H5022134). The authors report no conflicts of interest.
- , , Rehospitalizations among patients in the Medicare Fee‐for‐Service Program. N Engl J Med. 2009;360:1418–1428.
- Centers for Medicare 306:1688–1698.
- , , , , Interventions to reduce 30‐day rehospitalization: a systematic review. Ann Intern Med. 2011;155:520–528.
- , , , , Outpatient follow‐up visit and 30‐day emergency department visit and readmission in patients hospitalized for chronic obstructive pulmonary disease. Arch Intern Med. 2010;170:1664–1670.
- , , , et al. Relationship between early physician follow‐up and 30‐day readmission among Medicare beneficiaries hospitalized for heart failure. JAMA. 2010;303:1716–1722.
- , , After hospitalization: a Dartmouth Atlas report on post‐acute care for Medicare beneficiaries. Dartmouth Atlas website. Available at: www.dartmouthatlas.org/downloads/reports/Post_discharge_events_092811.pdf. Accessed August 8, 2013.
- , , , Emergency department visits after hospital discharge: a missing part of the equation. Ann Emerg Med. 2013;62:145–150.
- , , , Emergency department visits after surgery are common for Medicare patients, suggesting opportunities to improve care. Health Aff (Millwood). 2013;32:1600–1607.
- , , , et al. Defining emergency department episodes by severity and intensity: a 15‐year study of Medicare beneficiaries. BMC Health Serv Res. 2010;10:1–13.
- , , , Comorbidity measures for use with administrative data. Med Care. 1998;36:8–27.
- , , , , , Emergency department physician‐level and hospital‐level variation in admission rates. Ann Emerg Med. 2013;61:638–643.
- , , , et al. Hospital admission decision for patients with community‐acquired pneumonia: variability among physicians in an emergency department. Ann Emerg Med. 2012;59:35–41.
- , , Individual emergency physician admission rates: predictably unpredictable. CJEM. 2009;11(2):149–155.
- , , , , , Reasons why emergency department providers do not rely on the pneumonia severity index to determine the initial site of treatment for patients with pneumonia. Clin Infect Dis. 2009;49:e100–e108.
- , , Variation in emergency department admission rates across the United States. Med Care Res Rev. 2013;70:218–231.
- , , , , , Variation in US hospital emergency department admission rates by clinical condition. Med Care. 2015;53:237–244.
- , , , et al. Hospital variation in risk‐standardized hospital admission rates from US EDs among adults. Am J Emerg Med. 2014;32:837–843.
- , , The effect of an observation unit on the rate of ED admission and discharge for pyelonephritis. Am J Emerg Med. 2010;28:682–688.
- , , , , , Protocol‐driven emergency department observation units offer savings, shorter stays, and reduced admissions. Health Aff (Millwood). 2013;32:2149–2156.
- , Hospital chain said to scheme to inflate bills. New York Times. January 23, 2014. Available at: http://www.nytimes.com/2014/01/24/business/hospital‐chain‐said‐to‐scheme‐to‐inflate‐bills.html?emc=eta1367:391–393.
Readmissions of Medicare beneficiaries within 30 days of discharge are frequent and costly.[1] Concern about readmissions has prompted the Centers for Medicare & Medicaid Services (CMS) to reduce payments to hospitals with excess readmissions.[2] Research has identified a number of patient clinical and socio‐demographic factors associated with readmissions.[3] However, interventions designed to reduce readmissions have met with limited success. In a systematic review, no single intervention was regularly effective in reducing readmissions, despite the fact that interventions have targeted both predischarge, transition of care, and postdischarge processes of care.[4]
The different trajectories of care experienced by patients after hospital discharge, and their effect on risk of readmission, have been incompletely studied. Although early outpatient follow‐up after discharge is associated with lower readmission rates,[5, 6] a factor that has been minimally studied is the role of the emergency department (ED) and the ED provider in readmissions. The ED and ED providers feature prominently in the care received by patients shortly after discharge from a hospital. About a quarter of all hospitalized Medicare patients are evaluated in an ED within 30 days of discharge,[7, 8] and a majority of readmissions within 30 days of discharge are precipitated by an ED visit.[9] Hence, we asked whether when a recently discharged patient is seen in an ED, does the rate of readmission vary by ED provider and by ED facility?
We used Texas Medicare claims data to examine patients visiting the ED within 30 days of discharge from an initial hospitalization to determine if their risk of readmission varies by the ED provider caring for them and by the ED facility they visit.
METHODS
Sources of Data
We used claims from the years 2007 to 2011 for 100% of Texas Medicare beneficiaries, including Medicare beneficiary summary files, Medicare Provider Analysis and Review (MedPAR) files, Outpatient Standard Analytical Files (OutSAF), and Medicare Carrier files. We obtained diagnosis‐related group associated information, including weights, and Major Diagnostic Category from CMS, and used Provider of Services files to determine facility characteristics.
Establishment of the Study Cohort
From 2008 through 2011 MedPAR files, we initially selected all hospital discharges from acute‐care hospitals in Texas. From these 3,191,160 admissions, we excluded those discharged dead or transferred to other acute‐care hospitals (N=230,343), those who were younger than 66 years at admission (N=736,685) and those without complete Parts A and B enrollment or with any health maintenance organization enrollment in the 12 months prior to and 2 months after the admission of interest (N=596,427). From the remaining 1,627,705 discharges, we identified 302,949 discharges that were followed by at least 1 ED visit within 30 days.
We applied the algorithm developed by Kaskie et al. to identify ED visits.[10] We identified claims for ED services with Current Procedural Terminology (CPT) codes 99281‐99285 from Carrier files and bundled claims with overlapping dates or those that were within 1 day of each other. Then we identified claims for ED services using the same CPT codes from OutSAF and bundled those with overlapping dates or those that were within 3 days of each other. Finally, we bundled Carrier and OutSAF claims with overlapping dates and defined them as the same ED visit. From these, we retained only the first ED visit. We excluded those receiving care from multiple ED providers during the ED visit (N=38,565), and those who had a readmission before the first ED visit (N=1436), leaving 262,948 ED visits. For patients who had more than 1 hospitalization followed by an ED visit in a given year, we selected the first hospitalization, resulting in 199,143 ED visits. We then selected ED providers associated with at least 30 ED visits in this cohort, resulting in 1922 ED providers and 174,209 ED visits. For analyses where we examined both ED provider and facility variation in admission rates, we eliminated ED providers that generated charges from more than 1 ED facility, resulting in 525 providers and 48,883 ED visits at 143 ED facilities.
Measures
Patient Characteristics
We categorized beneficiaries by age, gender, and ethnicity using Medicare beneficiary summary files. We used the Medicaid indicator as a proxy of low socioeconomic status. We obtained information on weekend admission, emergent admission, discharge destination, and diagnosis‐related groupt (DRG) from MedPAR files. We identified comorbidities using the claims from MedPAR, Carrier, and OutSAF files in the year prior to the admission.[11] We identified total hospitalizations and outpatient visits in the prior year from MedPAR files and Carrier files, respectively. We obtained education status at the level of zip code of residence from the 2011 American Community Survey estimates from the United States Census Bureau. We determined urban or rural residence using the 2013 Rural‐Urban Continuum Codes developed by the United States Department of Agriculture.
ED Facility Characteristics
We used the provider number of the ED facility to link to the Provider of Services files and obtained information on medical school affiliation, facility size, and for profit status.
Study Outcomes
The outcome of this study was readmission after an ED visit within 30 days of discharge from an initial hospitalization. We defined readmission after an ED visit as a hospitalization starting the day of or the day following the ED visit
Statistical Analyses
We performed 2‐level analyses where patients were clustered with ED providers to examine variation among ED providers. The effect of ED providers was modeled as a random effect to account for the correlation among the patients cared for by the same ED provider. We derived ED provider‐specific estimates from models adjusted for patient age, gender, race/ethnicity, rural or urban residence, Medicaid eligibility, education at the zip code level of residence, and characteristics of the initial admission (emergency admission, weekend admission, discharge destination, its major diagnostic category and DRG weight). We also adjusted for comorbidities, number of hospitalizations, and number of physician visits in the year before the initial admission.
We also conducted 2‐level analyses where patients were nested in ED facilities and 3‐level analyses where patients were nested in ED providers and ED providers were nested in ED facilities. We adjusted for all factors described above. We computed the change in the variance between 2‐level and 2‐level analyses to determine the variation in readmission rates that was explained by the ED provider and the ED facility. All analyses were performed with SAS version 9.2 (SAS Institute Inc., Cary, NC).
RESULTS
We identified 174,209 patients who visited an ED within 30 days of discharge from an initial hospitalization. Table 1 describes the characteristics of these patients as well as the readmission rates associated with these characteristics. The rate of readmission of our cohort of 1,627,705 discharges with or without a following ED visit was 16.2%, whereas the rate of readmission following an ED visit in our final cohort of 174,209 patients was 52.67%. This readmission rate increased with age, from 49.31% for patients between 66 and 70 years of age to 55.33% for patients older than 85 years. There were minor variations by gender and ethnicity. Patients residing in metropolitan areas or in zip codes with low education levels had higher readmission rates, as did those whose original admission was classified as emergency or those who were not discharged home.
| Patient Characteristic | No. of ED Visits (%) | % Readmitted | Odds Ratio (95% CI)a |
|---|---|---|---|
| MeanSD, Median (Q1Q3) | Odds Ratio (95% CI)a | ||
| |||
| Overall | 174,209 (100) | 52.67 | |
| Age, y | |||
| 6670 | 32,962 (18.92) | 49.31 | 1.00 |
| 7175 | 34,979 (20.08) | 51.48 | 1.10 (1.06‐1.13)b |
| 7680 | 36,728 (21.08) | 53.01 | 1.15 (1.12‐1.19)b |
| 8185 | 34,784 (19.97) | 54.05 | 1.19 (1.15‐1.23)b |
| >85 | 34,756 (19.95) | 55.33 | 1.25 (1.21‐1.29)b |
| Gender | |||
| Male | 71,049 (40.78) | 52.95 | 1.02 (1.00‐1.04) |
| Female | 103,160 (59.22) | 52.48 | 1.00 |
| Race | |||
| Non‐Hispanic white | 124,312 (71.36) | 52.77 | 1.00 |
| Black | 16,809 (9.65) | 51.45 | 0.84 (0.81‐0.87)b |
| Hispanic | 30,618 (17.58) | 52.70 | 0.88 (0.85‐0.91)b |
| Other | 2,470 (1.42) | 55.71 | 1.06 (0.97‐1.15) |
| Rural/urban residence | |||
| Metropolitan | 136,739 (78.49) | 53.88 | 1.00 |
| Nonmetropolitan | 35,000 (20.09) | 48.16 | 0.96 (0.93‐0.99)b |
| Rural | 2,448 (1.41) | 50.04 | 1.04 (0.95‐1.13) |
| Medicaid eligible | |||
| No | 128,909 (74.00) | 52.65 | 1.00 |
| Yes | 45,300 (26.00) | 52.72 | 0.97 (0.94‐0.99)b |
| Education levelc | |||
| 1st quartile (lowest) | 43,863 (25.18) | 54.61 | 1.00 |
| 2nd quartile | 43,316 (24.86) | 53.92 | 1.00 (0.97‐1.03) |
| 3rd quartile | 43,571 (25.01) | 50.72 | 0.99 (0.96‐1.02) |
| 4th quartile (highest) | 43,318 (24.87) | 51.98 | 1.01 (0.97‐1.04) |
| Emergency admission | |||
| No | 99,101 (56.89) | 51.15 | 1.00 |
| Yes | 75,108 (43.11) | 54.68 | 1.07 (1.05‐1.09)b |
| Weekend admission | |||
| No | 131,266 (75.35) | 52.45 | 1.00 |
| Yes | 42,943 (24.65) | 53.35 | 1.01 (0.99‐1.04) |
| Discharge destination | |||
| Home | 122,542 (70.34) | 50.90 | 1.00 |
| Inpatient rehabilitation facility | 9,512 (5.46) | 55.48 | 1.31 (1.25‐1.37)b |
| Skilled nursing facility | 37,248 (21.38) | 57.25 | 1.29 (1.26‐1.33)b |
| Other | 4,907 (2.82) | 56.88 | 1.14 (1.07‐1.21)b |
| DRG weight (per unit) | 1.561.27, 0.82 (1.16‐1.83) | 1.06 (1.05‐1.07)b | |
| Hospitalization in the prior year (per hospitalization) | 1.031.49, 0.00 (1.00‐2.00) | 1.04 (1.03‐1.04)b | |
| Physician visits in the prior year (per 10 visits) | 11.759.80, 5.00 (10.00‐17.00) | 0.97 (0.96‐0.98)b | |
Table 1 also presents the odds of readmission adjusted for all other factors in the table and also adjusted for clustering within ED providers in a 2‐level model. Increasing age, white race, metropolitan residence, nonhome discharge, higher severity of illness, more hospitalizations in the prior year, fewer physician visits in the prior year, and an emergency initial admission were each associated with a higher readmission rate.
We next generated estimates of readmission rates for each ED provider from the adjusted 2‐level models. Figure 1 shows the adjusted cumulative readmission rates for the 1922 ED providers. This figure shows the mean value and 95% confidence intervals of the readmission rates for each provider. Dark vertical lines indicate providers whose readmission rate differed significantly from the mean adjusted readmission rate of 52.1% for all providers. Of the ED providers, 14.2% had significantly higher readmission rates. The mean readmission rate for these 272 providers was 67.2%. Of the ED providers, 14.7% had significantly lower readmission rates. The mean readmission rate for these 283 providers was 36.8%.
To determine the contribution of the ED facility to the variation in readmission rates, we restricted our analysis to 48,883 patients (28.06% of our cohort) seen by 525 ED providers who were associated with only 1 facility (total of 143 facilities). Table 2 describes the unadjusted readmission rates stratified by specific characteristics of those facilities. The unadjusted readmission rate increased with the size of the associated hospital, from 47.61% for hospitals with less than 100 beds to 57.06% for hospitals with more than 400 beds. The readmission rate for nonprofit facilities was 53.81% and for for‐profit facilities was 57.39%. Facilities with no medical school affiliation had a readmission rate of 54.51%, whereas those with a major affiliation had a readmission rate of 58.72%.
| ED Facility Characteristic | No. of ED Visits (%) | % Readmitted | Odds Ratio (95% CI)a |
|---|---|---|---|
| |||
| Overall | 48,883 | ||
| Total beds | |||
| 100 | 3,936 (8.05) | 47.61 | 1.00 |
| 101200 | 6,251 (12.79) | 52.07 | 1.38 (1.06‐1.81)b |
| 201400 | 13,000 (26.59) | 56.26 | 1.69 (1.32‐2.17)b |
| >400 | 25,696 (52.57) | 57.06 | 1.77 (1.35‐2.33)b |
| Type of control | |||
| Nonprofit | 24,999 (51.14) | 53.81 | 1.00 |
| Proprietary | 17,108 (35.00) | 57.39 | 1.32 (1.09‐1.61)b |
| Government | 6,776 (13.86) | 56.60 | 1.11 (0.88‐1.41) |
| Medical school affiliation | |||
| Major | 6,487 (13.27) | 58.72 | 1.00 |
| Limited | 7,066 (14.45) | 56.37 | 0.85 (0.58‐1.25) |
| Graduate | 3,164 (6.47) | 56.19 | 0.71 (0.44‐1.15) |
| No affiliation | 32,166 (65.80) | 54.51 | 0.78 (0.57‐1.05) |
| If the same hospital patient was discharged from | |||
| Yes | 38,532 (78.82) | 55.64 | 0.96 (0.91‐1.00) |
| No | 10,351 (21.18) | 54.73 | 1.00 |
With this smaller cohort, we performed 2 types of 2‐level models, where patients clustered within ED facilities and ER providers, respectively, and a 3‐level model accounting for clustering of patients within providers and of providers within facilities. From the facility‐patient 2‐level model, the variance of the ED facility was 0.2718 (95% confidence interval [CI]: 0.2083‐0.3696). From the provider‐patient 2‐level model, the variance of ED provider was 0.2532 (95% CI: 0.2166‐0.3002). However, when the 3‐level model was performed, the variance of ED provider decreased to 0.0893 (95% CI: 0.0723‐0.1132) and the variance of ED facility dropped to 0.2316 (95% CI: 0.1704‐0.3331) . This indicates 65% of the variation among ED providers was explained by the ED facility, and in contrast, 15% of the variation among ED facilities was explained by ED providers.
Table 2 also shows the adjusted odds of readmission generated from the 3‐level model. Patients receiving care in ED facilities in hospitals with more beds and in for‐profit hospitals were at higher risk for readmission. It is possible that patients seen at the ED associated with the discharging hospital had a lower risk of readmission. This finding was close to being statistically significant (P=0.051).
We repeated all the above analyses using an outcome of readmission anytime between the ED visit and 30 days after discharge from the initial hospitalization (rather than readmission on the day of or after the ED visit). All analyses produced results similar to the results presented above. For example, Figure 2 shows the adjusted cumulative readmission rates for the 1922 ED providers using this outcome. Of the ED providers, 12.8% had higher and 12.5% had lower readmission rates as compared to the mean readmission rate for all ED providers. The Spearman correlation coefficient between the rank of ED providers in immediate readmission rate (Figure 1) and readmission rate within 30 days of hospital discharge (Figure 2) was 0.94 (P<0.001).
DISCUSSION
This study found substantial variation in readmission rates by ED provider, despite controlling for patient clinical and sociodemographic factors. In 3‐level models, the ED facility explained a substantial part of the variation by ED provider, with patients seen at larger facilities and for‐profit facilities having higher readmission rates.
Variation among ED facilities and ED providers in readmission rates has not previously been studied. There is literature on the variation in ED facility and ED provider admission rates. As readmissions are a subset of all admissions, this literature provides context to our findings. Abualenain et al. examined admission rates for 89 ED physicians for adult patients presenting with an acute medical or surgical complaint at 3 EDs in a health system.[12] After adjusting for patient and clinical characteristics, admission rates varied from 21% to 49% among physicians and from 27% to 41% among 3 facilities. Two other studies from single hospitals have found similar variation among providers.[13, 14] The reasons for the variation among ED providers presumably relate to subjective aspects of clinical assessment and the reluctance of providers to rely solely on objective scales, even when they are available.[14, 15] Variation in admission rates among different facilities may relate to clustering of providers with similar practice styles within facilities, lack of clinical guidelines for certain conditions, as well as differences among facilities in the socioeconomic status and access to primary care of their clientele.[12, 16, 17] For example, Pines et al. have shown that ED facility admission rates are higher in communities with fewer primary care physicians per capita and are influenced by the prevailing county level admission rates.[16] Capp et al. showed persistent variation in admission rates across hospitals, despite adjusting for clinical criteria such as vital signs, chief complaints, and severity of illness.[18]
Structural differences in ED facilities may also influence the decision to admit. We found that patients visiting ED facilities in hospitals with more beds had a higher readmission rate. ED facility systems of care such as observation units or protocols are associated with lower admission rates.[19, 20] Finally, certain hospitals may actively influence the admission practice patterns of their ED providers. We noted that patients seen at for‐profit ED facilities had a greater risk of readmission. A similar finding has been described by Pines et al., who noted higher admission rates at for‐profit facilities.[16] In an extreme example, a recent Justice Department lawsuit alleged that a for‐profit hospital chain used software systems and financial incentives to ED providers to increase admissions.[21]
It is possible that the providers with low readmission rates may have inappropriately released patients who truly should have been admitted. A signal that this occurred would be if these patients were readmitted in the days after the ED visits. We examined this possibility by additionally examining readmissions occurring anytime between the ED visit until 30 days after discharge from the initial hospitalization. The results were similar to when we only included readmissions that occurred immediately following the ED visit, with a very high correlation (r=0.94) between the ranking of the ED providers by readmission rates in both circumstances. This suggests that the decisions of the ED providers with low readmission rates to admit or release from the ED were likely appropriate.
Our research has limitations. We studied patients with fee‐for‐service Medicare in a single large state in the United States over a 4‐year period. Our findings may not be generalizable to younger patient populations, other regions with different sociodemographic patterns and healthcare systems, or other time periods. We could not control for many factors that may impact the risk of readmission but are not measured in Medicare databases (eg, clinical data such as vital signs, measures of quality of transition from discharging hospital, ED provider workload). To attribute care to a single ED provider, we excluded patients who were taken care of by multiple ED providers. These patients may have different needs from our study population (eg, more complex issues and longer stays in the ED) and may bias our results.
This study provides a new direction for research and quality improvement targeting readmissions. Research should extend beyond the discharge transition and examine the entire trajectory of posthospitalization care to better understand readmissions. Based directly on this study, research could investigate the practice patterns of ED providers and systems of care at ED facilities that affect readmissions rates. Such investigation could inform quality improvement efforts to standardize care for patients in the ED.
CMS policies hold hospitals accountable for readmissions of the patients they discharge, but do not address the admission process in the ED that leads to readmissions of recently discharged patients. Given the present study, and the fact that the proportion of all hospital admissions that occur through the ED has grown to 44%,[22] consideration of the role of the ED in public policy efforts to discourage unnecessary inpatient care may be appropriate.
In summary, this study shows that a recently discharged patient's chances of being readmitted depends partly on the ED provider who evaluates them and on the ED facility at which they seek care. ED provider practice patterns and ED facility systems of care may be a target for interventions aimed at decreasing readmission rates.
Disclosures
This research was supported by grants from the National Institutes of Health (AG033134 and K05CA134923) and from the Agency for Healthcare Research and Quality (R24H5022134). The authors report no conflicts of interest.
- , , Rehospitalizations among patients in the Medicare Fee‐for‐Service Program. N Engl J Med. 2009;360:1418–1428.
- Centers for Medicare 306:1688–1698.
- , , , , Interventions to reduce 30‐day rehospitalization: a systematic review. Ann Intern Med. 2011;155:520–528.
- , , , , Outpatient follow‐up visit and 30‐day emergency department visit and readmission in patients hospitalized for chronic obstructive pulmonary disease. Arch Intern Med. 2010;170:1664–1670.
- , , , et al. Relationship between early physician follow‐up and 30‐day readmission among Medicare beneficiaries hospitalized for heart failure. JAMA. 2010;303:1716–1722.
- , , After hospitalization: a Dartmouth Atlas report on post‐acute care for Medicare beneficiaries. Dartmouth Atlas website. Available at: www.dartmouthatlas.org/downloads/reports/Post_discharge_events_092811.pdf. Accessed August 8, 2013.
- , , , Emergency department visits after hospital discharge: a missing part of the equation. Ann Emerg Med. 2013;62:145–150.
- , , , Emergency department visits after surgery are common for Medicare patients, suggesting opportunities to improve care. Health Aff (Millwood). 2013;32:1600–1607.
- , , , et al. Defining emergency department episodes by severity and intensity: a 15‐year study of Medicare beneficiaries. BMC Health Serv Res. 2010;10:1–13.
- , , , Comorbidity measures for use with administrative data. Med Care. 1998;36:8–27.
- , , , , , Emergency department physician‐level and hospital‐level variation in admission rates. Ann Emerg Med. 2013;61:638–643.
- , , , et al. Hospital admission decision for patients with community‐acquired pneumonia: variability among physicians in an emergency department. Ann Emerg Med. 2012;59:35–41.
- , , Individual emergency physician admission rates: predictably unpredictable. CJEM. 2009;11(2):149–155.
- , , , , , Reasons why emergency department providers do not rely on the pneumonia severity index to determine the initial site of treatment for patients with pneumonia. Clin Infect Dis. 2009;49:e100–e108.
- , , Variation in emergency department admission rates across the United States. Med Care Res Rev. 2013;70:218–231.
- , , , , , Variation in US hospital emergency department admission rates by clinical condition. Med Care. 2015;53:237–244.
- , , , et al. Hospital variation in risk‐standardized hospital admission rates from US EDs among adults. Am J Emerg Med. 2014;32:837–843.
- , , The effect of an observation unit on the rate of ED admission and discharge for pyelonephritis. Am J Emerg Med. 2010;28:682–688.
- , , , , , Protocol‐driven emergency department observation units offer savings, shorter stays, and reduced admissions. Health Aff (Millwood). 2013;32:2149–2156.
- , Hospital chain said to scheme to inflate bills. New York Times. January 23, 2014. Available at: http://www.nytimes.com/2014/01/24/business/hospital‐chain‐said‐to‐scheme‐to‐inflate‐bills.html?emc=eta1367:391–393.
© 2015 Society of Hospital Medicine