User login
Effect of Hospital Readmission Reduction Program on Hospital Readmissions and Mortality Rates
Chronic obstructive pulmonary disease (COPD) is recognized as the third leading cause of death nationally. Globally, it has been estimated that 10% of the population has COPD; in the United States, approximately 15 million people are affected.1,2 The annual estimated cost of COPD management in the United States is approximately $50 billion, one-third of which is directly related to inpatient hospitalization for COPD exacerbation.3,4,5 The 30-day readmission rate after hospitalization for acute exacerbation of COPD (AECOPD) is approximately 21% with an approximate cost of $13 billion per year.6,7 To reduce the cost and to improve patient outcomes, the Centers for Medicare and Medicaid Services (CMS) has designed several interventions with little effect.8
In October 2012, the Affordable Care Act added section 1886(q) to the Social Security Act and established the Hospital Readmission Reduction Program (HRRP), an initiative to decrease hospitalization costs by penalizing hospitals with high 30-day readmission rates. Under this program, hospitals received up to 3% penalty for excess readmissions after the index hospitalization with acute myocardial infarction (AMI), heart failure (HF), and pneumonia.9-11 Hospitals are penalized if their annual readmission rates are significantly above the average national readmission rate. In 2014, the HRRP was extended to include AECOPD for the FY 2015.
Since the implementation of readmission penalties, data have shown a significant decrease in the 30-day readmission rates for all conditions.12,13 On the other hand, studies have suggested that, at least for some conditions, the decrease in the 30-day readmission rate is associated with higher adverse patients outcomes, including higher mortality.14,15 However, whether a decrease in readmission rates after an AECOPD hospitalization is associated with a concomitant increase in mortality has not been examined. Therefore, our objective was to examine the association of the 30-day risk-adjusted hospital readmission rate with the 30-day risk-adjusted hospital mortality rate for patients discharged with a diagnosis of AECOPD.
METHOD
Data Sources
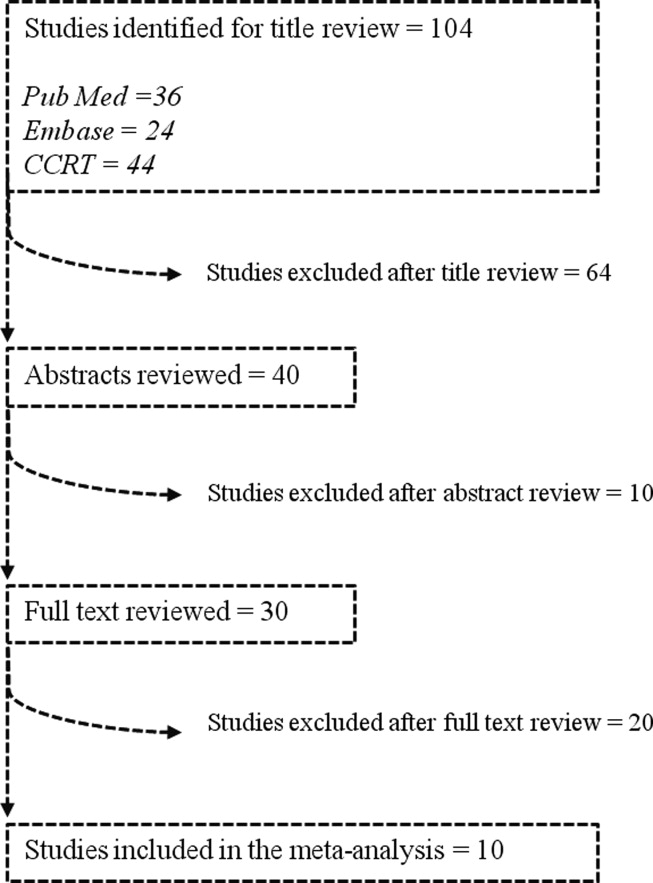
Publicly available data from three sources were used. The all-cause 30-day risk-standardized readmission rate (RSRR) and the 30-day risk-standardized mortality rate (RSMR) of each hospital for patients with AECOPD were obtained from the Hospital Compare database; a database maintained by the CMS.16,17 In 2014, the CMS started reporting three-year running average of 30-day mortality and readmission rate data on hospitals for AECOPD hospitalizations; the data start date was July 2010.18-22 We examined data from the FY 2010-2013 to 2014-2017 cycles on readmission and mortality reported by the CMS; this included data before and after the implementation of penalties.
Hospital characteristics were also obtained from the CMS website. Hospital ownership was defined as government (owned by Federal or state), for-profit (owned by physicians or another proprietary), or nonprofit (owned by a nonprofit organization such as a church). A hospital was considered as a teaching hospital if it obtained graduate medical education funding from the CMS.
Data on local population characteristics according to ZIP codes were obtained from the 2010 decennial census and the American Community Survey five-year (2009-2013) data files available at the United States Census Bureau website.23 For each ZIP code, we obtained data on the total population, percentage of African Americans in the population, median income, poverty level, and insurance status.
We used Hospital service area (HSA) information obtained from the Dartmouth Atlas of Health Care crosswalk files to link local population characteristics to hospitals. The Dartmouth Atlas defined 3,436 HSAs by assigning the ZIP codes to the hospital area where the greatest proportion of their Medicare residents was hospitalized.24,25
Hospital Compare data and Census Bureau population data were matched to the HSAs from the Dartmouth Atlas of Healthcare data at the ZIP code level. First, the ZIP code-level data from the Census Bureau were pooled by the HSAs obtained from the Dartmouth Atlas of Healthcare, followed by matching these data by the HSAs to the Hospital Compare data. Merging data from these three sources generated a dataset that contained information about readmission and mortality rates from a particular hospital and the population characteristics of the local healthcare market or neighborhood. Our final dataset included hospitals that had readmission and mortality information available at the Hospital Compare website and were included in the crosswalk files of the Dartmouth Atlas of Healthcare.
Statistical Analysis
Data are summarized as mean and standard deviation (SD), median with interquartile range, or frequencies as appropriate. To model the dependence of observations from the same hospital over time, we used mixed linear models with random intercept and slope. A strength of this modeling approach is that it incorporates information from all hospitals even when some hospitals are missing data for some time periods. We reached our final model through stages with increasing model complexity at each stage. In the first stage, we developed an empty model without any covariates to determine the unconditional variance components so that we can partition mortality variance into between- and within-hospital components. In the second stage, we developed an unconditional growth curve model to determine the shape of time trend in mortality over time using linear and quadratic (by including squared time in the model) growth curves. In the third stage, we added baseline readmission rates (from 2010 to 2013) to the model to determine the effect of baseline readmission rate on mortality trends and also examined its interaction with time and squared time. We generated a change in the readmission rate variable by subtracting the last readmission rate from the baseline readmission rate (readmission rate in 2010-2013 − readmission rate in 2014-2017). In the fourth stage, we included this change in readmission rate into the third-stage model to examine how changes in the readmission rate affected the time trends of mortality and also examined its interaction with time and squared time. In the final model, we included the following potential confounding variables to the fourth stage model: African American percentage in the HSA, HSA median income, percentage of people living in poverty in the HSA, median age, ownership of hospital (government, for profit), teaching status (teaching vs nonteaching), and acute care hospital beds in the HSA. Within each stage, the models were compared using the Akaike information criterion (AIC) and the Bayesian information criterion (BIC), and the model with the lowest value of each was moved to the next stage of model development. All analyses were performed in Stata 14.1 for Windows (College Station, Texas).
RESULTS
Of the 3,685 acute care hospitals analyzed in the 2010-2013 data cycle for COPD, the 30-day RSRR was 20.7% (1.28), which decreased to 19.6% (1.11) in 2014-2017 (Table 1). During the same period, the 30-day all-cause RSMR increased from 7.8% (1.03) in 2010-2013 to 8.4% (1.11) in 2014-2017. The partitioning of variance showed that 57% of variation in the mortality rate over the study period was due to between-hospital differences.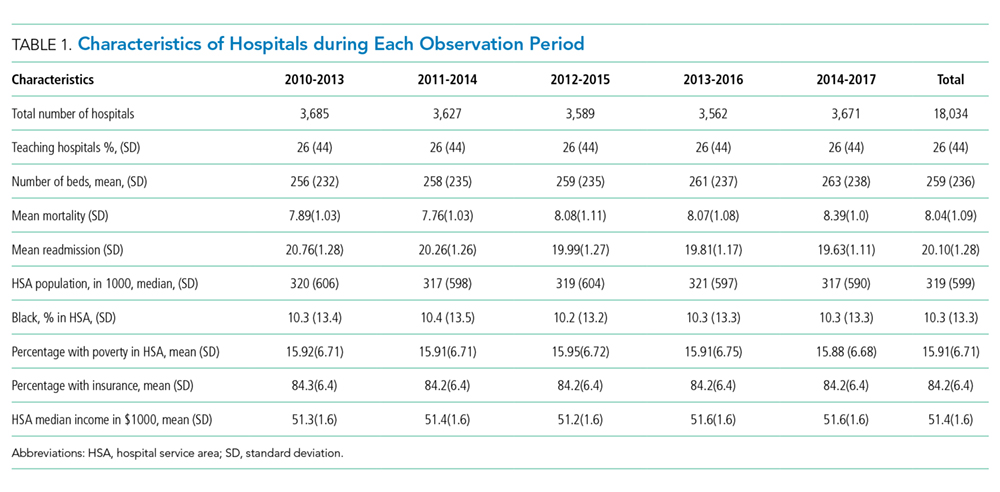
The unconditional growth model examining the linear time trend revealed a 0.13% per year (95% CI = 0.12 to 0.14; P < .0001) increase in mortality rate over the five data cycles. When the squared time variable was added to the model to examine a quadratic trend, both time and squared trend were statistically significant (Table 2) and the AIC and BIC were lower for the quadratic model. Thus, the unconditional growth curve model suggested that the mortality trend was nonlinear and the coefficients demonstrated that not only the mortality rate increased, but the rate of change in the mortality rate was also increasing during the study period.
When we added the baseline readmission rate to the abovementioned quadratic growth model, we found an inverse association; each 1% increase in baseline readmission rate was associated with 0.03% (95% CI = −0.05 to −0.005; P = .02) decrease in mortality rate. These findings suggest that hospitals with higher baseline readmission rates also had lower mortality rates. To examine whether the effect of baseline readmission rate on mortality varied over time, we included the interaction term with time in the model and then added the interaction term with squared time. As the AIC and BIC were the lowest for the model with interaction between time and baseline readmission (and not when interaction between squared time and baseline readmission were included), we accepted this model. In this model, although there was no difference in mortality according to readmissions at baseline, each 1% increase in baseline readmission rate was associated with a smaller increase in mortality rate by 0.015% (95% CI = −0.02 to −0.01; P < .0001; Table 2 and Figure 1). These findings suggest that hospitals with higher readmission rates at baseline had a smaller increase in mortality rate during the study period than those with lower readmission rates.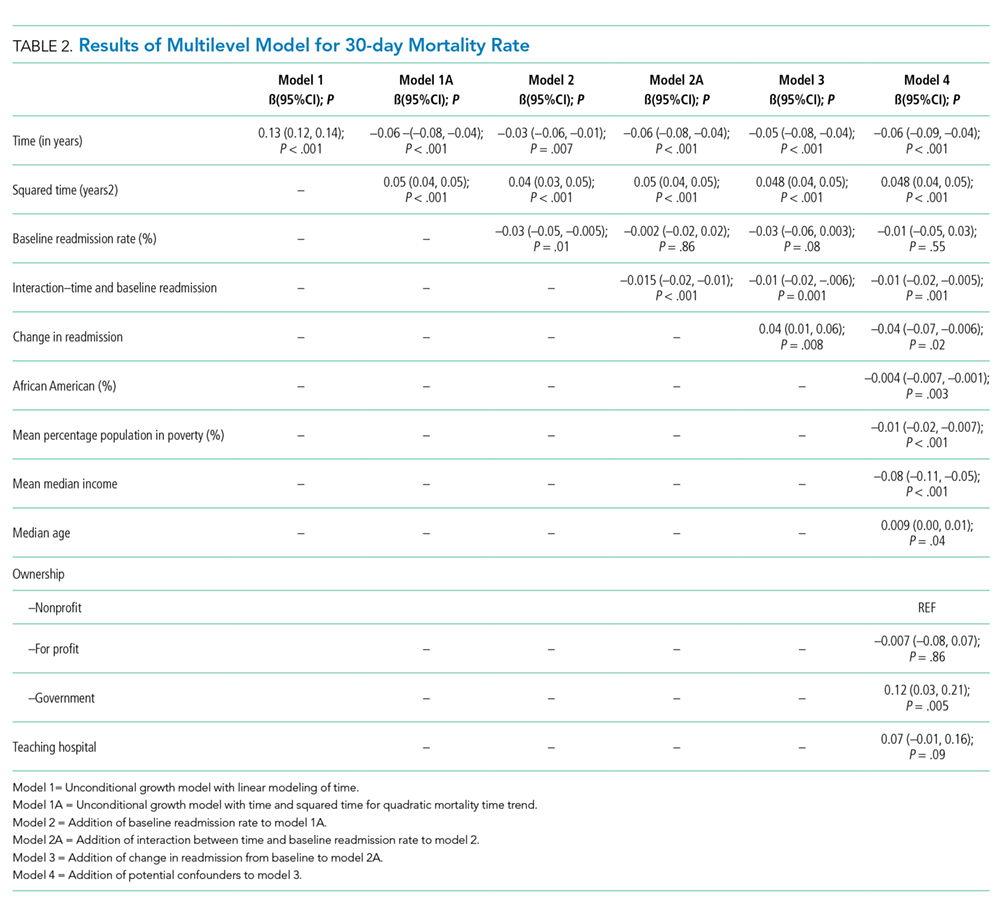
Inclusion of change in the readmissions variable in the model showed that each 1% decrease in readmission rate during the study period was associated with 0.04% (95% CI = 0.01 to 0.06; P = .008) increase in mortality. However, the interaction between change in readmission and time was not significant and the AIC and BIC of the model were higher than the model without interaction. Therefore, we retained the model without the interaction term and included other potential confounding variables to build our final model. Thus, although hospitals with different baseline readmission rates had different rates of change in mortality rate, the change in readmission rate had a consistent effect on the mortality rate. Including potential confounders in the model did not change the results; the mortality rate and the change in the mortality rate increased during the study period, a high baseline readmission rate was associated with a lower yearly increase in mortality, and a larger decrease in readmission rate was associated with a higher mortality rate (Table 2).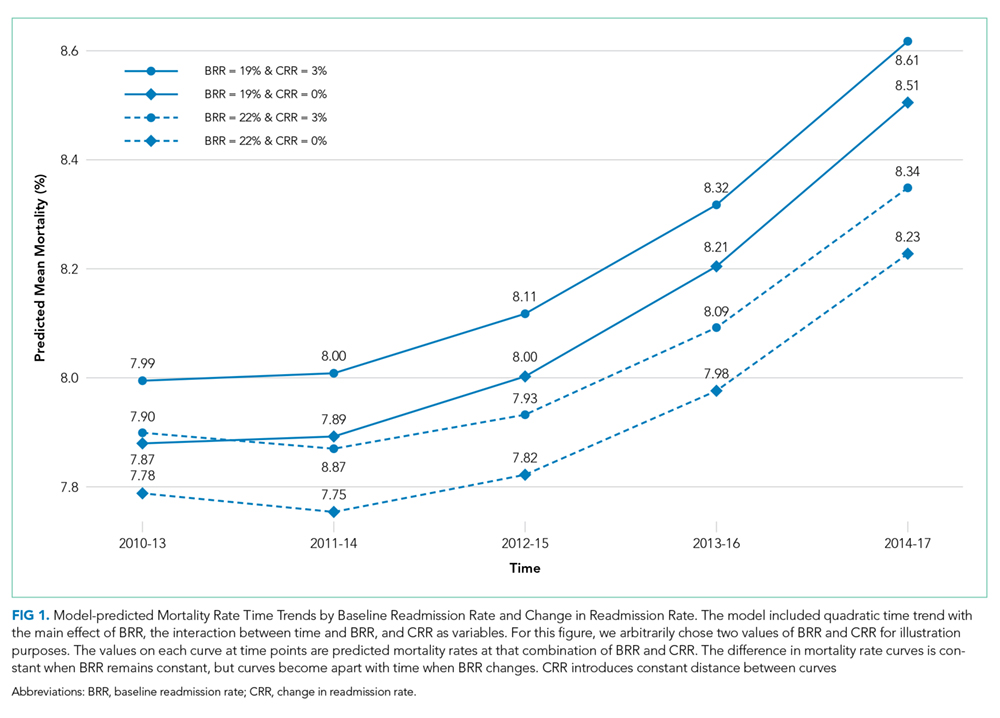
DISCUSSION
As efforts to decrease readmission rates continue as a part of the HRRP implementation by the CMS, our study shows that among hospitals that discharged patients with AECOPD during 2010-2017, the all-cause 30-day RSRR was decreased, whereas the all-cause 30-day RSMR was increased. Of particular concern is that the rate of increase in mortality also increased. We also found that hospitals with higher readmission rates in 2010-2013 had a lower rate of increase in mortality than hospitals with lower readmission rates. In addition, hospitals that had a larger decrease in readmission rates during the study period had a larger rate of increase in mortality than hospitals with a smaller decrease in readmission rates. Our findings were robust to potential confounders such as hospital characteristics and local population characteristics in which hospitals operate.
Our study findings raise the question whether the implementation of the HRRP resulted in unintentional patient harm by forcing hospitals to make changes that may affect overall patient care. This question is particularly important as other studies on hospitalized patients with HF have found similar results.13,14 On the other hand, a similar association between readmission and mortality rates has not been observed in patients with pneumonia or AMI.14 Several possible explanations can be given for the observed discrepancy between the diseases and their effect on the relationship between readmission rate and mortality rate. Both COPD and HF are chronic diseases and characterized by exacerbations, whereas AMI and pneumonia are episodic diseases that are treatable. As the number of patients hospitalized with AECOPD and HF is much larger, hospitals may have a greater focus on reducing the 30-day readmission rates and may attempt to game the process, such as by delaying admissions through the emergency department within the 30-day period or by admitting patients for observation. In fact, a study found a 3% reduction in the within-hospital readmission rate with a concurrent 0.8% increase in observation unit use since the implementation of the HRRP.26 Such approaches to patient care may lead to adverse outcomes.
It is possible that readmissions and mortality act as competing risks and hence hospitals with higher mortality rates are left with fewer patients and thus have fewer readmissions, whereas those with lower mortality rates have more patients and a higher readmission rate.27 Such studies are not possible with hospital-level data, and patient-level studies will be required to examine this competing risk hypothesis. Our study results provide some support to the competing risk hypothesis (hospitals with lower baseline readmission rates had a steeper increase in mortality); however, it is not possible to draw any conclusions due to the high risk of ecological fallacy bias.
This study has important potential implications for healthcare policy, public health, and research. We found that an important national intervention aimed at decreasing readmission rates and improving the quality of care for patients with AECOPD may be associated with higher mortality rates in these patients. There may be a need to redefine measures for determining the performance of an institution. Our study supports research into the underlying mechanisms resulting in an inverse association between readmissions and mortality. In particular, health policy researchers may need to examine how incentives and penalties affect the allocation of resources within hospitals.
This study has several strengths and some potential weaknesses. We used a national dataset to examine readmission and mortality rates that include the majority of hospitals in the United States. We also included data from the local population for each hospital, thus allowing us to examine hospital performance within the context of its target population. One potential limitation is that we used hospital-level data and not patient-level data; however, the readmission penalties are designed for hospitals, which justifies our use of hospital-level data. Furthermore, data were not available for shorter time intervals; data from shorter time intervals may be associated with greater variability. Being an observational study, it is difficult to establish a causal relationship; the longitudinal nature of the study does establish temporality, an important factor in establishing causality.
In conclusion, we found that although the readmission rates decreased, there was an increase in the mortality rate within the 30 days of discharge from the hospital in patients with AECOPD. The rate of increase in mortality was higher in hospitals with lower readmission rates than in hospitals with higher readmission rates. Further research for determining the mechanism responsible for this association is needed. Future health policy interventions may need to consider the potential for adverse outcomes.
1. Murphy SL, Xu J, Kochanek KD. Deaths: final data for 2010. Natl Vital Stat Rep. 2013;61(4):1-117.
2. Halbert RJ, Natoli JL, Gano A, et al. Global burden of copd: systematic review and meta-analysis. Eur Respir J. 2006;28(3):523-532. https://doi.org/10.1183/09031936.06.00124605.
3. Toy EL, Gallagher KF, Stanley EL, Swensen AR, Duh MS. The economic impact of exacerbations of chronic obstructive pulmonary disease and exacerbation definition: a review. COPD. 2010;7(3):214-228. https://doi.org/10.3109/15412555.2010.481697.
4. Shah T, Churpek MM, Coca Perraillon M, Konetzka RT. Understanding why patients with COPD get readmitted: a large national study to delineate the Medicare population for the readmissions penalty expansion. Chest. 2015;147(5):1219-1226. https://doi.org/10.1378/chest.14-2181.
5. Jencks SF, Williams MV, Coleman EA. Rehospitalizations among patients in the Medicare fee-for-service program. N Engl J Med. 2009;360(14):1418-1428. https://doi.org/10.1056/NEJMsa0803563.
6. Stein BD, Charbeneau JT, Lee TA, et al. Hospitalizations for acute exacerbations of chronic obstructive pulmonary disease: how you count matters. COPD. 2010;7(3):164-171. https://doi.org/10.3109/15412555.2010.481696.
7. Stein, B. D., Charbeneau, J. T., Lee, T. A., Schumock, G. T., Lindenauer, P. K., Bautista, A., . . . Krishnan, J. A. (2010). Hospitalizations for acute exacerbations of chronic obstructive pulmonary disease: how you count matters. COPD, 7(3), 164-171. doi:10.3109/15412555.2010.481696
8. McIlvennan CK, Eapen ZJ, Allen LA. Hospital readmissions reduction program. Circulation. 2015;131(20):1796-1803. https://doi.org/10.1161/CIRCULATIONAHA.114.010270.
9. McIlvennan CK, Eapen ZJ, Allen LA. Hospital readmissions reduction program. Circulation. 2015;131(20):179-1803. https://doi.org/10.1161/CIRCULATIONAHA.114.010270.
10. Centers for Medicare and Medicaid Services (CMS), HHS. Medicare Program; hospital inpatient prospective payment systems for acute care hospitals and the long-term care hospital prospective payment system and FY 2012 rates; Hospitals’ FTE Resident Caps for Graduate Medical Education Payment. Final Rules. Fed Regist. 2011;76(160):51476-51846.
11. Centers for Medicare and Medicaid Services (CMS). Medicare program; hospital inpatient prospective payment systems for acute care hospitals and the long-term care hospital prospective payment system and fiscal year 2014 rates; quality reporting requirements for specific providers; hospital conditions of participation; payment policies related to patient status. Final rules. Fed Regist. 2013;78(160):50495-51040.
12. Casillas G. Published: Mar 10 and 2017, “aiming for fewer hospital U-turns: the Medicare Hospital readmission reduction program,” [blog]. https://www.kff.org/medicare/issue-brief/aiming-for-fewer-hospital-u-turns-the-medicare-hospital-readmission-reduction-program/; Accessed March 10, 2017. The Henry J. Kaiser Family Foundation.
13. Desai NR, Ross JS, Kwon JY, et al. Association Between hospital penalty status Under the hospital readmission reduction program and readmission rates for target and nontarget conditions. JAMA. 2016;316(24): 2647-2656. https://doi.org/10.1001/jama.2016.18533.
14. Gupta A, Allen LA, Bhatt DL, et al. Association of the hospital readmissions reduction program implementation with readmission and mortality outcomes in heart failure. JAMA Cardiol. 2018;3(1):44-53. https://doi.org/10.1001/jamacardio.2017.4265.
15. Krumholz HM, Lin Z, Keenan PS, et al. Relationship between hospital readmission and mortality rates for patients hospitalized with acute myocardial infarction, heart failure, or pneumonia. JAMA. 2013;309(6):587-593. https://doi.org/10.1001/jama.2013.333.
16. Medicare Hospital compare overview,” https://www.medicare.gov/hospitalcompare/About/What-Is-HOS.html; Accessed April 17, 2019.
17. Archived datasets. Data.Medicare.Gov. Data.Medicare.Gov. Accessed April 17, 2019. https://data.medicare.gov/data/archives/hospital-compare.
18. Krumholz HM, Lin Z, Drye EE, et al. An administrative claims measure suitable for profiling hospital performance based on 30-day all-cause readmission rates among patients with acute myocardial infarction. Circ Cardiovasc Qual Outcomes. 2011;4(2):243-252. https://doi.org/10.1161/CIRCOUTCOMES.110.957498.
19. Bratzler DW, Normand SL, Wang Y, et al. An administrative claims model for profiling hospital 30-day mortality rates for pneumonia patients. PLOS ONE. 2011;6(4):e17401. https://doi.org/10.1371/journal.pone.0017401.
20. Centers for Medicare, Medicaid Services. Security Boulevard Baltimore, and Md21244 USA, “OutcomeMeasures,”. https://www.cms.gov/Medicare/Quality-Initiatives-Patient-Assessment-Instruments/HospitalQualityInits/OutcomeMeasures.html 7500; Accessed October 13, 2017.
21. Centers for Medicare and Medicaid Services (CMS), HHS. Medicare Program; Hospital Inpatient Prospective Payment Systems for Acute Care Hospitals and the Long-Term Care Hospital Prospective Payment System and Fiscal Year 2014 Rates; Quality Reporting Requirements for Specific Providers; Hospital Conditions of Participation; Payment Policies Related to Patient Status. Final Rules.”
22. Feemster LC, Au DH. Penalizing hospitals for chronic obstructive pulmonary disease readmissions. Am J Respir Crit Care Med. 2014;189(6):634-639. https://doi.org/10.1164/rccm.201308-1541PP.
23. United States Census Bureau. Census.Gov. Accessed April 17, 2019. https://www.census.gov/en.html.
24. Dartmouth atlas data,”. https://atlasdata.dartmouth.edu/. Aaccessed April 17, 2019.
25. Home. Dartmouth Atlas Healthc. https://www.dartmouthatlas.org/. Accessed April 17, 2019.
26. Zuckerman RB, Sheingold SH, Orav EJ, Ruhter J, Epstein AM. Readmissions, observation, and the hospital readmissions reduction program. N Engl J Med. 2016;374(16):1543-1551. https://doi.org/10.1056/NEJMsa1513024.
27. Gorodeski EZ, Starling RC, Blackstone EH. Are All Readmissions Bad Readmissions?, letter. World. 2010. https://doi.org/10.1056/NEJMc1001882.
Chronic obstructive pulmonary disease (COPD) is recognized as the third leading cause of death nationally. Globally, it has been estimated that 10% of the population has COPD; in the United States, approximately 15 million people are affected.1,2 The annual estimated cost of COPD management in the United States is approximately $50 billion, one-third of which is directly related to inpatient hospitalization for COPD exacerbation.3,4,5 The 30-day readmission rate after hospitalization for acute exacerbation of COPD (AECOPD) is approximately 21% with an approximate cost of $13 billion per year.6,7 To reduce the cost and to improve patient outcomes, the Centers for Medicare and Medicaid Services (CMS) has designed several interventions with little effect.8
In October 2012, the Affordable Care Act added section 1886(q) to the Social Security Act and established the Hospital Readmission Reduction Program (HRRP), an initiative to decrease hospitalization costs by penalizing hospitals with high 30-day readmission rates. Under this program, hospitals received up to 3% penalty for excess readmissions after the index hospitalization with acute myocardial infarction (AMI), heart failure (HF), and pneumonia.9-11 Hospitals are penalized if their annual readmission rates are significantly above the average national readmission rate. In 2014, the HRRP was extended to include AECOPD for the FY 2015.
Since the implementation of readmission penalties, data have shown a significant decrease in the 30-day readmission rates for all conditions.12,13 On the other hand, studies have suggested that, at least for some conditions, the decrease in the 30-day readmission rate is associated with higher adverse patients outcomes, including higher mortality.14,15 However, whether a decrease in readmission rates after an AECOPD hospitalization is associated with a concomitant increase in mortality has not been examined. Therefore, our objective was to examine the association of the 30-day risk-adjusted hospital readmission rate with the 30-day risk-adjusted hospital mortality rate for patients discharged with a diagnosis of AECOPD.
METHOD
Data Sources
Publicly available data from three sources were used. The all-cause 30-day risk-standardized readmission rate (RSRR) and the 30-day risk-standardized mortality rate (RSMR) of each hospital for patients with AECOPD were obtained from the Hospital Compare database; a database maintained by the CMS.16,17 In 2014, the CMS started reporting three-year running average of 30-day mortality and readmission rate data on hospitals for AECOPD hospitalizations; the data start date was July 2010.18-22 We examined data from the FY 2010-2013 to 2014-2017 cycles on readmission and mortality reported by the CMS; this included data before and after the implementation of penalties.
Hospital characteristics were also obtained from the CMS website. Hospital ownership was defined as government (owned by Federal or state), for-profit (owned by physicians or another proprietary), or nonprofit (owned by a nonprofit organization such as a church). A hospital was considered as a teaching hospital if it obtained graduate medical education funding from the CMS.
Data on local population characteristics according to ZIP codes were obtained from the 2010 decennial census and the American Community Survey five-year (2009-2013) data files available at the United States Census Bureau website.23 For each ZIP code, we obtained data on the total population, percentage of African Americans in the population, median income, poverty level, and insurance status.
We used Hospital service area (HSA) information obtained from the Dartmouth Atlas of Health Care crosswalk files to link local population characteristics to hospitals. The Dartmouth Atlas defined 3,436 HSAs by assigning the ZIP codes to the hospital area where the greatest proportion of their Medicare residents was hospitalized.24,25
Hospital Compare data and Census Bureau population data were matched to the HSAs from the Dartmouth Atlas of Healthcare data at the ZIP code level. First, the ZIP code-level data from the Census Bureau were pooled by the HSAs obtained from the Dartmouth Atlas of Healthcare, followed by matching these data by the HSAs to the Hospital Compare data. Merging data from these three sources generated a dataset that contained information about readmission and mortality rates from a particular hospital and the population characteristics of the local healthcare market or neighborhood. Our final dataset included hospitals that had readmission and mortality information available at the Hospital Compare website and were included in the crosswalk files of the Dartmouth Atlas of Healthcare.
Statistical Analysis
Data are summarized as mean and standard deviation (SD), median with interquartile range, or frequencies as appropriate. To model the dependence of observations from the same hospital over time, we used mixed linear models with random intercept and slope. A strength of this modeling approach is that it incorporates information from all hospitals even when some hospitals are missing data for some time periods. We reached our final model through stages with increasing model complexity at each stage. In the first stage, we developed an empty model without any covariates to determine the unconditional variance components so that we can partition mortality variance into between- and within-hospital components. In the second stage, we developed an unconditional growth curve model to determine the shape of time trend in mortality over time using linear and quadratic (by including squared time in the model) growth curves. In the third stage, we added baseline readmission rates (from 2010 to 2013) to the model to determine the effect of baseline readmission rate on mortality trends and also examined its interaction with time and squared time. We generated a change in the readmission rate variable by subtracting the last readmission rate from the baseline readmission rate (readmission rate in 2010-2013 − readmission rate in 2014-2017). In the fourth stage, we included this change in readmission rate into the third-stage model to examine how changes in the readmission rate affected the time trends of mortality and also examined its interaction with time and squared time. In the final model, we included the following potential confounding variables to the fourth stage model: African American percentage in the HSA, HSA median income, percentage of people living in poverty in the HSA, median age, ownership of hospital (government, for profit), teaching status (teaching vs nonteaching), and acute care hospital beds in the HSA. Within each stage, the models were compared using the Akaike information criterion (AIC) and the Bayesian information criterion (BIC), and the model with the lowest value of each was moved to the next stage of model development. All analyses were performed in Stata 14.1 for Windows (College Station, Texas).
RESULTS
Of the 3,685 acute care hospitals analyzed in the 2010-2013 data cycle for COPD, the 30-day RSRR was 20.7% (1.28), which decreased to 19.6% (1.11) in 2014-2017 (Table 1). During the same period, the 30-day all-cause RSMR increased from 7.8% (1.03) in 2010-2013 to 8.4% (1.11) in 2014-2017. The partitioning of variance showed that 57% of variation in the mortality rate over the study period was due to between-hospital differences.
The unconditional growth model examining the linear time trend revealed a 0.13% per year (95% CI = 0.12 to 0.14; P < .0001) increase in mortality rate over the five data cycles. When the squared time variable was added to the model to examine a quadratic trend, both time and squared trend were statistically significant (Table 2) and the AIC and BIC were lower for the quadratic model. Thus, the unconditional growth curve model suggested that the mortality trend was nonlinear and the coefficients demonstrated that not only the mortality rate increased, but the rate of change in the mortality rate was also increasing during the study period.
When we added the baseline readmission rate to the abovementioned quadratic growth model, we found an inverse association; each 1% increase in baseline readmission rate was associated with 0.03% (95% CI = −0.05 to −0.005; P = .02) decrease in mortality rate. These findings suggest that hospitals with higher baseline readmission rates also had lower mortality rates. To examine whether the effect of baseline readmission rate on mortality varied over time, we included the interaction term with time in the model and then added the interaction term with squared time. As the AIC and BIC were the lowest for the model with interaction between time and baseline readmission (and not when interaction between squared time and baseline readmission were included), we accepted this model. In this model, although there was no difference in mortality according to readmissions at baseline, each 1% increase in baseline readmission rate was associated with a smaller increase in mortality rate by 0.015% (95% CI = −0.02 to −0.01; P < .0001; Table 2 and Figure 1). These findings suggest that hospitals with higher readmission rates at baseline had a smaller increase in mortality rate during the study period than those with lower readmission rates.
Inclusion of change in the readmissions variable in the model showed that each 1% decrease in readmission rate during the study period was associated with 0.04% (95% CI = 0.01 to 0.06; P = .008) increase in mortality. However, the interaction between change in readmission and time was not significant and the AIC and BIC of the model were higher than the model without interaction. Therefore, we retained the model without the interaction term and included other potential confounding variables to build our final model. Thus, although hospitals with different baseline readmission rates had different rates of change in mortality rate, the change in readmission rate had a consistent effect on the mortality rate. Including potential confounders in the model did not change the results; the mortality rate and the change in the mortality rate increased during the study period, a high baseline readmission rate was associated with a lower yearly increase in mortality, and a larger decrease in readmission rate was associated with a higher mortality rate (Table 2).
DISCUSSION
As efforts to decrease readmission rates continue as a part of the HRRP implementation by the CMS, our study shows that among hospitals that discharged patients with AECOPD during 2010-2017, the all-cause 30-day RSRR was decreased, whereas the all-cause 30-day RSMR was increased. Of particular concern is that the rate of increase in mortality also increased. We also found that hospitals with higher readmission rates in 2010-2013 had a lower rate of increase in mortality than hospitals with lower readmission rates. In addition, hospitals that had a larger decrease in readmission rates during the study period had a larger rate of increase in mortality than hospitals with a smaller decrease in readmission rates. Our findings were robust to potential confounders such as hospital characteristics and local population characteristics in which hospitals operate.
Our study findings raise the question whether the implementation of the HRRP resulted in unintentional patient harm by forcing hospitals to make changes that may affect overall patient care. This question is particularly important as other studies on hospitalized patients with HF have found similar results.13,14 On the other hand, a similar association between readmission and mortality rates has not been observed in patients with pneumonia or AMI.14 Several possible explanations can be given for the observed discrepancy between the diseases and their effect on the relationship between readmission rate and mortality rate. Both COPD and HF are chronic diseases and characterized by exacerbations, whereas AMI and pneumonia are episodic diseases that are treatable. As the number of patients hospitalized with AECOPD and HF is much larger, hospitals may have a greater focus on reducing the 30-day readmission rates and may attempt to game the process, such as by delaying admissions through the emergency department within the 30-day period or by admitting patients for observation. In fact, a study found a 3% reduction in the within-hospital readmission rate with a concurrent 0.8% increase in observation unit use since the implementation of the HRRP.26 Such approaches to patient care may lead to adverse outcomes.
It is possible that readmissions and mortality act as competing risks and hence hospitals with higher mortality rates are left with fewer patients and thus have fewer readmissions, whereas those with lower mortality rates have more patients and a higher readmission rate.27 Such studies are not possible with hospital-level data, and patient-level studies will be required to examine this competing risk hypothesis. Our study results provide some support to the competing risk hypothesis (hospitals with lower baseline readmission rates had a steeper increase in mortality); however, it is not possible to draw any conclusions due to the high risk of ecological fallacy bias.
This study has important potential implications for healthcare policy, public health, and research. We found that an important national intervention aimed at decreasing readmission rates and improving the quality of care for patients with AECOPD may be associated with higher mortality rates in these patients. There may be a need to redefine measures for determining the performance of an institution. Our study supports research into the underlying mechanisms resulting in an inverse association between readmissions and mortality. In particular, health policy researchers may need to examine how incentives and penalties affect the allocation of resources within hospitals.
This study has several strengths and some potential weaknesses. We used a national dataset to examine readmission and mortality rates that include the majority of hospitals in the United States. We also included data from the local population for each hospital, thus allowing us to examine hospital performance within the context of its target population. One potential limitation is that we used hospital-level data and not patient-level data; however, the readmission penalties are designed for hospitals, which justifies our use of hospital-level data. Furthermore, data were not available for shorter time intervals; data from shorter time intervals may be associated with greater variability. Being an observational study, it is difficult to establish a causal relationship; the longitudinal nature of the study does establish temporality, an important factor in establishing causality.
In conclusion, we found that although the readmission rates decreased, there was an increase in the mortality rate within the 30 days of discharge from the hospital in patients with AECOPD. The rate of increase in mortality was higher in hospitals with lower readmission rates than in hospitals with higher readmission rates. Further research for determining the mechanism responsible for this association is needed. Future health policy interventions may need to consider the potential for adverse outcomes.
1. Murphy SL, Xu J, Kochanek KD. Deaths: final data for 2010. Natl Vital Stat Rep. 2013;61(4):1-117.
2. Halbert RJ, Natoli JL, Gano A, et al. Global burden of copd: systematic review and meta-analysis. Eur Respir J. 2006;28(3):523-532. https://doi.org/10.1183/09031936.06.00124605.
3. Toy EL, Gallagher KF, Stanley EL, Swensen AR, Duh MS. The economic impact of exacerbations of chronic obstructive pulmonary disease and exacerbation definition: a review. COPD. 2010;7(3):214-228. https://doi.org/10.3109/15412555.2010.481697.
4. Shah T, Churpek MM, Coca Perraillon M, Konetzka RT. Understanding why patients with COPD get readmitted: a large national study to delineate the Medicare population for the readmissions penalty expansion. Chest. 2015;147(5):1219-1226. https://doi.org/10.1378/chest.14-2181.
5. Jencks SF, Williams MV, Coleman EA. Rehospitalizations among patients in the Medicare fee-for-service program. N Engl J Med. 2009;360(14):1418-1428. https://doi.org/10.1056/NEJMsa0803563.
6. Stein BD, Charbeneau JT, Lee TA, et al. Hospitalizations for acute exacerbations of chronic obstructive pulmonary disease: how you count matters. COPD. 2010;7(3):164-171. https://doi.org/10.3109/15412555.2010.481696.
7. Stein, B. D., Charbeneau, J. T., Lee, T. A., Schumock, G. T., Lindenauer, P. K., Bautista, A., . . . Krishnan, J. A. (2010). Hospitalizations for acute exacerbations of chronic obstructive pulmonary disease: how you count matters. COPD, 7(3), 164-171. doi:10.3109/15412555.2010.481696
8. McIlvennan CK, Eapen ZJ, Allen LA. Hospital readmissions reduction program. Circulation. 2015;131(20):1796-1803. https://doi.org/10.1161/CIRCULATIONAHA.114.010270.
9. McIlvennan CK, Eapen ZJ, Allen LA. Hospital readmissions reduction program. Circulation. 2015;131(20):179-1803. https://doi.org/10.1161/CIRCULATIONAHA.114.010270.
10. Centers for Medicare and Medicaid Services (CMS), HHS. Medicare Program; hospital inpatient prospective payment systems for acute care hospitals and the long-term care hospital prospective payment system and FY 2012 rates; Hospitals’ FTE Resident Caps for Graduate Medical Education Payment. Final Rules. Fed Regist. 2011;76(160):51476-51846.
11. Centers for Medicare and Medicaid Services (CMS). Medicare program; hospital inpatient prospective payment systems for acute care hospitals and the long-term care hospital prospective payment system and fiscal year 2014 rates; quality reporting requirements for specific providers; hospital conditions of participation; payment policies related to patient status. Final rules. Fed Regist. 2013;78(160):50495-51040.
12. Casillas G. Published: Mar 10 and 2017, “aiming for fewer hospital U-turns: the Medicare Hospital readmission reduction program,” [blog]. https://www.kff.org/medicare/issue-brief/aiming-for-fewer-hospital-u-turns-the-medicare-hospital-readmission-reduction-program/; Accessed March 10, 2017. The Henry J. Kaiser Family Foundation.
13. Desai NR, Ross JS, Kwon JY, et al. Association Between hospital penalty status Under the hospital readmission reduction program and readmission rates for target and nontarget conditions. JAMA. 2016;316(24): 2647-2656. https://doi.org/10.1001/jama.2016.18533.
14. Gupta A, Allen LA, Bhatt DL, et al. Association of the hospital readmissions reduction program implementation with readmission and mortality outcomes in heart failure. JAMA Cardiol. 2018;3(1):44-53. https://doi.org/10.1001/jamacardio.2017.4265.
15. Krumholz HM, Lin Z, Keenan PS, et al. Relationship between hospital readmission and mortality rates for patients hospitalized with acute myocardial infarction, heart failure, or pneumonia. JAMA. 2013;309(6):587-593. https://doi.org/10.1001/jama.2013.333.
16. Medicare Hospital compare overview,” https://www.medicare.gov/hospitalcompare/About/What-Is-HOS.html; Accessed April 17, 2019.
17. Archived datasets. Data.Medicare.Gov. Data.Medicare.Gov. Accessed April 17, 2019. https://data.medicare.gov/data/archives/hospital-compare.
18. Krumholz HM, Lin Z, Drye EE, et al. An administrative claims measure suitable for profiling hospital performance based on 30-day all-cause readmission rates among patients with acute myocardial infarction. Circ Cardiovasc Qual Outcomes. 2011;4(2):243-252. https://doi.org/10.1161/CIRCOUTCOMES.110.957498.
19. Bratzler DW, Normand SL, Wang Y, et al. An administrative claims model for profiling hospital 30-day mortality rates for pneumonia patients. PLOS ONE. 2011;6(4):e17401. https://doi.org/10.1371/journal.pone.0017401.
20. Centers for Medicare, Medicaid Services. Security Boulevard Baltimore, and Md21244 USA, “OutcomeMeasures,”. https://www.cms.gov/Medicare/Quality-Initiatives-Patient-Assessment-Instruments/HospitalQualityInits/OutcomeMeasures.html 7500; Accessed October 13, 2017.
21. Centers for Medicare and Medicaid Services (CMS), HHS. Medicare Program; Hospital Inpatient Prospective Payment Systems for Acute Care Hospitals and the Long-Term Care Hospital Prospective Payment System and Fiscal Year 2014 Rates; Quality Reporting Requirements for Specific Providers; Hospital Conditions of Participation; Payment Policies Related to Patient Status. Final Rules.”
22. Feemster LC, Au DH. Penalizing hospitals for chronic obstructive pulmonary disease readmissions. Am J Respir Crit Care Med. 2014;189(6):634-639. https://doi.org/10.1164/rccm.201308-1541PP.
23. United States Census Bureau. Census.Gov. Accessed April 17, 2019. https://www.census.gov/en.html.
24. Dartmouth atlas data,”. https://atlasdata.dartmouth.edu/. Aaccessed April 17, 2019.
25. Home. Dartmouth Atlas Healthc. https://www.dartmouthatlas.org/. Accessed April 17, 2019.
26. Zuckerman RB, Sheingold SH, Orav EJ, Ruhter J, Epstein AM. Readmissions, observation, and the hospital readmissions reduction program. N Engl J Med. 2016;374(16):1543-1551. https://doi.org/10.1056/NEJMsa1513024.
27. Gorodeski EZ, Starling RC, Blackstone EH. Are All Readmissions Bad Readmissions?, letter. World. 2010. https://doi.org/10.1056/NEJMc1001882.
© 2019 Society of Hospital Medicine
Adherence to Recommended Inpatient Hepatic Encephalopathy Workup
Clinical guidelines are periodically released by medical societies with the overarching goal of improving deliverable medical care by standardizing disease management according to best available published literature and by reducing healthcare expenditure associated with unnecessary and superfluous testing.1 Unfortunately, nonadherence to guidelines is common in clinical practice2 and contributes to the rising cost of healthcare.3 Health resource utilization is particularly relevant in management of cirrhosis, a condition with an annual healthcare expenditure of $13 billion.4 Hepatic encephalopathy (HE), the most common complication of cirrhosis, is characterized by altered sensorium and is the leading indication for hospitalization among cirrhotics. The joint guidelines of the European Association for the Study of the Liver (EASL) and the American Association for the Study of Liver Diseases (AASLD) for diagnostic workup for HE recommend identification and treatment of potential precipitants.5 The guidelines also recommend against checking serum ammonia levels, which have not been shown to correlate with diagnosis or severity of HE.6-8 Currently, limited data are available on practice patterns regarding guideline adherence and unnecessary serum ammonia testing for initial evaluation of HE in hospitals. To overcome this gap in knowledge, we conducted the present study to provide granular details regarding the diagnostic workup for hospitalized patients with HE.
METHODS
This study adopted a retrospective design and recruited patients admitted to the Virginia Commonwealth University Medical Center between July 1, 2016 and July 1, 2017. The institutional review board approved the study, and the manuscript was reviewed and approved by all authors prior to submission. All chart reviews were performed by hepatologists with access to patients’ electronic medical record (EMR).
Patient Population
Patients were identified from the EMR system by using ICD-9 and ICD-10 codes for cirrhosis, hepatic encephalopathy, and altered mental status. All consecutive admissions with these diagnosis codes were considered for inclusion. Adult patients with cirrhosis resulting from any etiology of chronic liver diseases with primary reason for admission of HE were included. If patients were readmitted for HE during the study period, then only the data from index HE admission was included in the analysis and data from subsequent admissions were excluded. The other exclusion criteria included non-HE causes of confusion, acute liver failure, and those admitted with a preformulated plan (eg, direct hepatology clinic admission or outside hospital transfer). Patients who developed HE during their hospitalization where HE was not the indication for admission were also excluded. Finally, all patients admitted under the direct care of hepatology were excluded.
Diagnostic Workup
The recommendations of the AASLD and the EASL for workup for HE include obtaining detailed history and physical examination supplemented by diagnostic evaluation for potential HE precipitants including infections, electrolyte disturbances, dehydration, renal failure, glycemic disturbances, and toxin ingestion (eg, alcohol, illicit drugs).5 Based on the guideline recommendation, this study defined a “complete workup” as including all of the following elements: infection evaluation (blood culture, urinalysis/urine culture, chest radiograph, diagnostic paracentesis in the presence of ascites), electrolyte/renal evaluation (serum sodium, potassium, creatinine, and glucose), and toxin evaluation (urine drug screening). Any HE admission that was missing elements from the aforementioned battery of tests was defined as “incomplete workup.” In patients admitted with decompensated cirrhosis, serum ammonia testing was considered inappropriate unless there was a nuanced explanation supporting its use documented within the EMR. The frequency and specialty of the physician ordering serum ammonia level tests were determined. The financial burden of unnecessary ammonia testing was estimated by assigning a laboratory charge ($258) for each patient.
Statistical Analysis
Continuous and categorical variables are reported as means (± standard deviation), median (interquartile range or IQR), or proportion (%) as appropriate. Across-group differences were compared using Student t-test for normally distributed continuous variables and Mann-Whitney U test for skewed data. Fisher’s exact test was used to compare proportion. HE evaluations were quantified by the number of patients with complete workup and by the number of patients with missing components of the workup. A nominal P value of less than .05 was considered statistically significant. All statistical analyses were performed using SPSS Statistics version 24.0 (IBM Corporation, Armonk, New York).
RESULTS
Cohort Characteristics
The baseline cohort demographics are listed in the Table. Of the 145 patients identified using diagnostic codes for cirrhosis, 78 subjects met the study criteria. The most common exclusion criteria included non-HE etiology of altered mental status (n = 37) and patients with readmissions for HE during the study period (n = 30). The mean age of the study cohort was 59.3 years, and the most common etiology of cirrhosis was hepatitis C (n = 41), alcohol induced (n = 14), and nonalcoholic steatohepatitis (n = 13).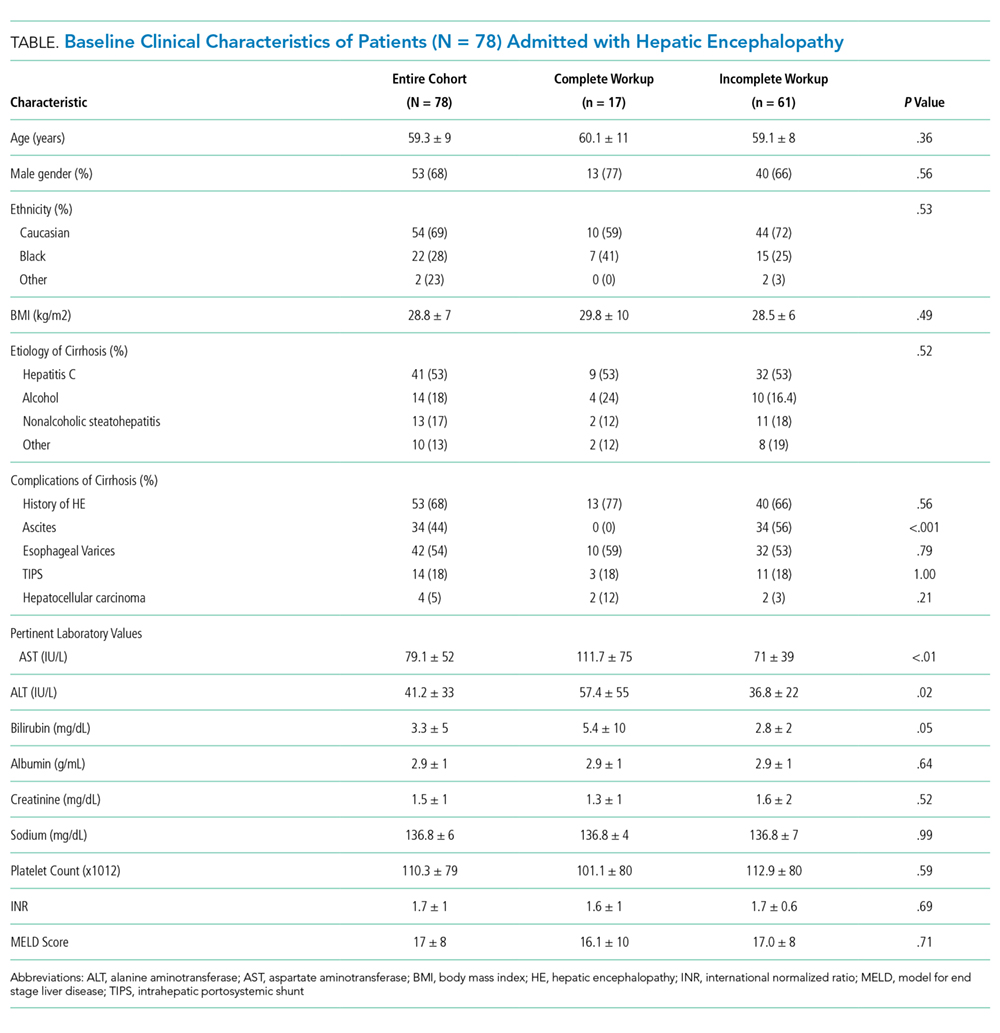
Initial Diagnostic Evaluation
The major precipitants of HE in the study cohort were ineffective lactulose dosing (n = 43), infections (n = 25), and electrolyte disturbances/renal injury (n = 6). At the time of admission, 53 patients were on therapy for HE. Only 17 (22%) patients had complete diagnostic workup within 24 hours of hospital admission. The individual components of the complete workup are shown in the Figure. Notably, 23 (30%) patients were missing blood cultures, 16 (21%) were missing urinalysis, 15 (20%) were missing chest radiograph, and 34 (44%) were missing urine drug screening. Of the 34 patients with ascites on admission, only eight (23%) had diagnostic paracentesis performed on admission to rule out spontaneous bacterial peritonitis.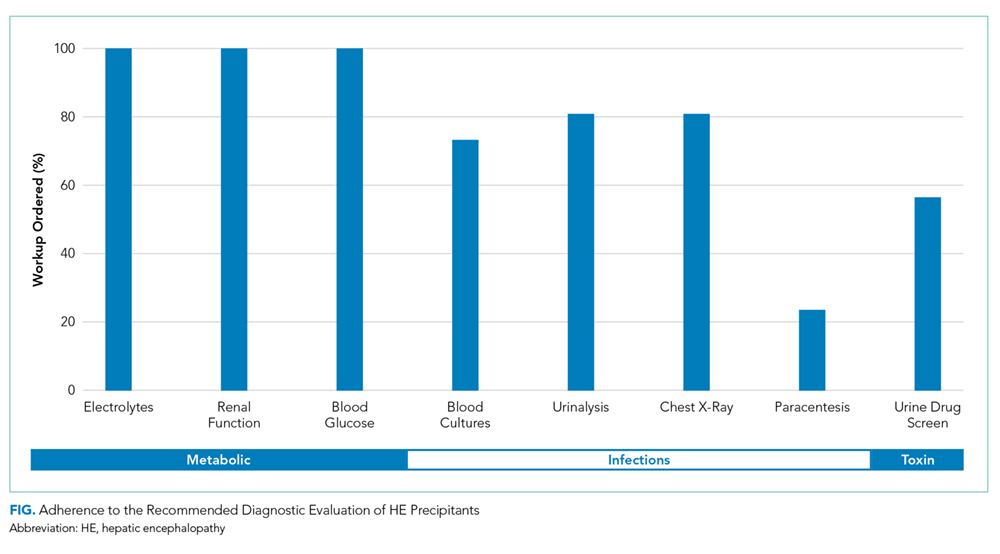
Serum Ammonia Testing
Serum ammonia testing was performed on 74 patients (94.9%), and no patient met the criteria for appropriate testing. Forty patients already had a known diagnosis of HE prior to index admission. Furthermore, 10 (14%) patients had serum ammonia testing repeated after admission without documentation in the EMR to justify repeat testing. Emergency Department (ED) physicians ordered ammonia testing in 57 cases (77%), internists ordered the testing in 11 cases (15%), and intensivists ordered the testing in two cases (3%). The patient’s charges for serum ammonia testing at the time of admission and for repeat testing were $19,092 and $2,580, respectively.
DISCUSSION
This study utilized HE in patients with decompensated cirrhosis as a framework to analyze adherence to societal guidelines. The adherence rate to AALSD/EASL recommended inpatient evaluation of HE is surprisingly low, and most patients are missing key essential elements of the diagnostic work up. While the diagnostic tests that are ordered as part of a panel are completed universally (renal function, electrolytes, and glucose testing), individual testing is less inclined to be ordered (blood cultures, urine culture/urinalysis, CXR, UDS) and procedural testing, such as diagnostic paracentesis, is often missed. This last finding is in line with published literature showing that 40% of patients admitted with ascites or HE did not have diagnostic paracentesis during hospital admission despite 24% reduction of inhospital mortality among patients undergoing the procedure.9
Although serum ammonia testing is not endorsed by the AASLD/EASL guidelines for HE,5 it is ordered nearly universally. The cost of an individual test is relatively low, but the cumulative cost of serum ammonia testing can be substantial because HE is the most common indication for hospitalization among patients with cirrhosis.4 Initiatives, such as the Choosing Wisely® campaign, encourage high-value and evidence-based care by limiting excessive and unnecessary diagnostic testing.10 The Canadian Choosing Wisely campaign specifically includes avoidance of serum ammonia testing for diagnosis of HE to provide high-value care in hepatology.11
Although the exact reasons for nonadherence to recommended HE evaluations are unclear, a potential method to mitigate excessive testing is to utilize the EMR and ordering system.3 EMR-based strategies can curb unnecessary testing in inpatient settings.12 The use of HE order sets, the inclusion of clinical decision support systems, and the restriction of access to specialized testing can be readily incorporated into the EMR to encourage adherence to guideline-based care while limiting unnecessary testing.
This study should be interpreted in the context of study limitations. Given the retrospective design of the study, salient factors in decisions behind diagnostic testing cannot be assessed. Future studies should utilize mixed-model methodology to elucidate reasons behind these decisions. The present study used a strict definition of complete workup including all the mentioned elements of the diagnostic workup for HE; however, in clinical practice, providers could be justified in not ordering certain tests if the specific clinical scenario does not lead to its use (eg, chest X-ray deferred in a patient with clear lung exam, no symptoms, or hypoxia). Similarly, UDS was included as a required element for a complete workup. While it may be ordered in a case-by-case basis to screen for illicit drug abuse, UDS is also a critical element of the workup to screen for opioid use as a precipitant of HE. Finally, considering the strict study entry criteria, we excluded repeated admissions for HE during the study period and therefore likely underestimate the cost burden of serum ammonia testing.
In conclusion, valuable guideline-based diagnostic testing is often missing in patients admitted for HE while serum ammonia testing is nearly universally ordered. These findings underscore the importance of implementing educational strategies, such as the Choosing Wisely® campaign, and EMR-based clinical decision support systems to improve health resource utilization in patients with cirrhosis and HE.
Disclosures
The authors have nothing to disclose.
1. Andrews EJ, Redmond HP. A review of clinical guidelines. Br J Surg. 2004;91:956-964. doi: 10.1002/bjs.4630 PubMed
2. Arts DL, Voncken AG, Medlock S, Abu-Hanna A, van Weert HC. Reasons for intentional guideline non-adherence: a systematic review. Int J Med Inform. 2016;89:55-62. doi: 10.1016/j.ijmedinf.2016.02.009. PubMed
3. Eaton KP, Levy K, Soong C, et al. Evidence-based guidelines to eliminate repetitive laboratory testing. JAMA Intern Med. 2017;177(12):1833-1839. doi: 10.1001/jamainternmed.2017.5152. PubMed
4. Everhart J. The burden of digestive diseases in the United States. Washington D.C.: US Department of Health and Human Services, Public Health Service, National Institutes of Health. U.S. Government Printing Office; 2008:111-114.
5. Vilstrup H, Amodio P, Bajaj J, et al. Hepatic encephalopathy in chronic liver disease: 2014 Practice guideline by the American Association for the Study of Liver Diseases and the European Association for the Study of Liver Diseases. Hepatology . 2014;60:715-735. doi: 10.1002/hep.27210 PubMed
6. Stahl J. Studies of the blood ammonia in liver disease: Its diagnostic, prognostic, and therapeutic significance. Ann Intern Med . 1963;58:1-24. PubMed
7. Ong JP, Aggarwal A, Kreiger D, et al. Correlation between ammonia levels and the severity of hepatic encephalopathy. Am J Med . 2003;114:188-193. doi: 10.1016/S0002-9343(02)01477-8 PubMed
8. Nicalao F, Efrati C, Masini A, Merli M, Attili AF, Riggio O. Role of determination of partial pressure of ammonia in cirrhotic patients with and without hepatic encephalopathy. J Hepatol. 2003;38:441-446. doi: 10.1016/S0168-8278(02)00436-1 PubMed
9. Orman ES, Hayashi PH, Bataller R, Barritt AS 4th. Paracentesis is associated with reduced mortality in patients hospitalized with cirrhosis and ascites. Clin Gastroenterol Hepatol. 2014;12:496-503. doi: 10.1016/j.cgh.2013.08.025. PubMed
10. Cassek CK, Guest JA. Choosing wisely: helping physicians and patients make smart decisions about their care. JAMA. 2012;307:1801-1802. doi: 10.1001/jama.2012.476. PubMed
11. Choosing Wisely Canada. 2018. Five things patients and physicians should question. Available at: https://choosingwiselycanada.org/hepatology/ . Accessed November 18, 2018.
12. Iturrate E, Jubelt L, Volpicelli F, Hochman K. Optimize your electronic medical record to increase value: reducing laboratory overutilization. Am J Med . 2016;129:215-220. doi: 10.1016/j.amjmed.2015.09.009. PubMed
Clinical guidelines are periodically released by medical societies with the overarching goal of improving deliverable medical care by standardizing disease management according to best available published literature and by reducing healthcare expenditure associated with unnecessary and superfluous testing.1 Unfortunately, nonadherence to guidelines is common in clinical practice2 and contributes to the rising cost of healthcare.3 Health resource utilization is particularly relevant in management of cirrhosis, a condition with an annual healthcare expenditure of $13 billion.4 Hepatic encephalopathy (HE), the most common complication of cirrhosis, is characterized by altered sensorium and is the leading indication for hospitalization among cirrhotics. The joint guidelines of the European Association for the Study of the Liver (EASL) and the American Association for the Study of Liver Diseases (AASLD) for diagnostic workup for HE recommend identification and treatment of potential precipitants.5 The guidelines also recommend against checking serum ammonia levels, which have not been shown to correlate with diagnosis or severity of HE.6-8 Currently, limited data are available on practice patterns regarding guideline adherence and unnecessary serum ammonia testing for initial evaluation of HE in hospitals. To overcome this gap in knowledge, we conducted the present study to provide granular details regarding the diagnostic workup for hospitalized patients with HE.
METHODS
This study adopted a retrospective design and recruited patients admitted to the Virginia Commonwealth University Medical Center between July 1, 2016 and July 1, 2017. The institutional review board approved the study, and the manuscript was reviewed and approved by all authors prior to submission. All chart reviews were performed by hepatologists with access to patients’ electronic medical record (EMR).
Patient Population
Patients were identified from the EMR system by using ICD-9 and ICD-10 codes for cirrhosis, hepatic encephalopathy, and altered mental status. All consecutive admissions with these diagnosis codes were considered for inclusion. Adult patients with cirrhosis resulting from any etiology of chronic liver diseases with primary reason for admission of HE were included. If patients were readmitted for HE during the study period, then only the data from index HE admission was included in the analysis and data from subsequent admissions were excluded. The other exclusion criteria included non-HE causes of confusion, acute liver failure, and those admitted with a preformulated plan (eg, direct hepatology clinic admission or outside hospital transfer). Patients who developed HE during their hospitalization where HE was not the indication for admission were also excluded. Finally, all patients admitted under the direct care of hepatology were excluded.
Diagnostic Workup
The recommendations of the AASLD and the EASL for workup for HE include obtaining detailed history and physical examination supplemented by diagnostic evaluation for potential HE precipitants including infections, electrolyte disturbances, dehydration, renal failure, glycemic disturbances, and toxin ingestion (eg, alcohol, illicit drugs).5 Based on the guideline recommendation, this study defined a “complete workup” as including all of the following elements: infection evaluation (blood culture, urinalysis/urine culture, chest radiograph, diagnostic paracentesis in the presence of ascites), electrolyte/renal evaluation (serum sodium, potassium, creatinine, and glucose), and toxin evaluation (urine drug screening). Any HE admission that was missing elements from the aforementioned battery of tests was defined as “incomplete workup.” In patients admitted with decompensated cirrhosis, serum ammonia testing was considered inappropriate unless there was a nuanced explanation supporting its use documented within the EMR. The frequency and specialty of the physician ordering serum ammonia level tests were determined. The financial burden of unnecessary ammonia testing was estimated by assigning a laboratory charge ($258) for each patient.
Statistical Analysis
Continuous and categorical variables are reported as means (± standard deviation), median (interquartile range or IQR), or proportion (%) as appropriate. Across-group differences were compared using Student t-test for normally distributed continuous variables and Mann-Whitney U test for skewed data. Fisher’s exact test was used to compare proportion. HE evaluations were quantified by the number of patients with complete workup and by the number of patients with missing components of the workup. A nominal P value of less than .05 was considered statistically significant. All statistical analyses were performed using SPSS Statistics version 24.0 (IBM Corporation, Armonk, New York).
RESULTS
Cohort Characteristics
The baseline cohort demographics are listed in the Table. Of the 145 patients identified using diagnostic codes for cirrhosis, 78 subjects met the study criteria. The most common exclusion criteria included non-HE etiology of altered mental status (n = 37) and patients with readmissions for HE during the study period (n = 30). The mean age of the study cohort was 59.3 years, and the most common etiology of cirrhosis was hepatitis C (n = 41), alcohol induced (n = 14), and nonalcoholic steatohepatitis (n = 13).
Initial Diagnostic Evaluation
The major precipitants of HE in the study cohort were ineffective lactulose dosing (n = 43), infections (n = 25), and electrolyte disturbances/renal injury (n = 6). At the time of admission, 53 patients were on therapy for HE. Only 17 (22%) patients had complete diagnostic workup within 24 hours of hospital admission. The individual components of the complete workup are shown in the Figure. Notably, 23 (30%) patients were missing blood cultures, 16 (21%) were missing urinalysis, 15 (20%) were missing chest radiograph, and 34 (44%) were missing urine drug screening. Of the 34 patients with ascites on admission, only eight (23%) had diagnostic paracentesis performed on admission to rule out spontaneous bacterial peritonitis.
Serum Ammonia Testing
Serum ammonia testing was performed on 74 patients (94.9%), and no patient met the criteria for appropriate testing. Forty patients already had a known diagnosis of HE prior to index admission. Furthermore, 10 (14%) patients had serum ammonia testing repeated after admission without documentation in the EMR to justify repeat testing. Emergency Department (ED) physicians ordered ammonia testing in 57 cases (77%), internists ordered the testing in 11 cases (15%), and intensivists ordered the testing in two cases (3%). The patient’s charges for serum ammonia testing at the time of admission and for repeat testing were $19,092 and $2,580, respectively.
DISCUSSION
This study utilized HE in patients with decompensated cirrhosis as a framework to analyze adherence to societal guidelines. The adherence rate to AALSD/EASL recommended inpatient evaluation of HE is surprisingly low, and most patients are missing key essential elements of the diagnostic work up. While the diagnostic tests that are ordered as part of a panel are completed universally (renal function, electrolytes, and glucose testing), individual testing is less inclined to be ordered (blood cultures, urine culture/urinalysis, CXR, UDS) and procedural testing, such as diagnostic paracentesis, is often missed. This last finding is in line with published literature showing that 40% of patients admitted with ascites or HE did not have diagnostic paracentesis during hospital admission despite 24% reduction of inhospital mortality among patients undergoing the procedure.9
Although serum ammonia testing is not endorsed by the AASLD/EASL guidelines for HE,5 it is ordered nearly universally. The cost of an individual test is relatively low, but the cumulative cost of serum ammonia testing can be substantial because HE is the most common indication for hospitalization among patients with cirrhosis.4 Initiatives, such as the Choosing Wisely® campaign, encourage high-value and evidence-based care by limiting excessive and unnecessary diagnostic testing.10 The Canadian Choosing Wisely campaign specifically includes avoidance of serum ammonia testing for diagnosis of HE to provide high-value care in hepatology.11
Although the exact reasons for nonadherence to recommended HE evaluations are unclear, a potential method to mitigate excessive testing is to utilize the EMR and ordering system.3 EMR-based strategies can curb unnecessary testing in inpatient settings.12 The use of HE order sets, the inclusion of clinical decision support systems, and the restriction of access to specialized testing can be readily incorporated into the EMR to encourage adherence to guideline-based care while limiting unnecessary testing.
This study should be interpreted in the context of study limitations. Given the retrospective design of the study, salient factors in decisions behind diagnostic testing cannot be assessed. Future studies should utilize mixed-model methodology to elucidate reasons behind these decisions. The present study used a strict definition of complete workup including all the mentioned elements of the diagnostic workup for HE; however, in clinical practice, providers could be justified in not ordering certain tests if the specific clinical scenario does not lead to its use (eg, chest X-ray deferred in a patient with clear lung exam, no symptoms, or hypoxia). Similarly, UDS was included as a required element for a complete workup. While it may be ordered in a case-by-case basis to screen for illicit drug abuse, UDS is also a critical element of the workup to screen for opioid use as a precipitant of HE. Finally, considering the strict study entry criteria, we excluded repeated admissions for HE during the study period and therefore likely underestimate the cost burden of serum ammonia testing.
In conclusion, valuable guideline-based diagnostic testing is often missing in patients admitted for HE while serum ammonia testing is nearly universally ordered. These findings underscore the importance of implementing educational strategies, such as the Choosing Wisely® campaign, and EMR-based clinical decision support systems to improve health resource utilization in patients with cirrhosis and HE.
Disclosures
The authors have nothing to disclose.
1. Andrews EJ, Redmond HP. A review of clinical guidelines. Br J Surg. 2004;91:956-964. doi: 10.1002/bjs.4630 PubMed
2. Arts DL, Voncken AG, Medlock S, Abu-Hanna A, van Weert HC. Reasons for intentional guideline non-adherence: a systematic review. Int J Med Inform. 2016;89:55-62. doi: 10.1016/j.ijmedinf.2016.02.009. PubMed
3. Eaton KP, Levy K, Soong C, et al. Evidence-based guidelines to eliminate repetitive laboratory testing. JAMA Intern Med. 2017;177(12):1833-1839. doi: 10.1001/jamainternmed.2017.5152. PubMed
4. Everhart J. The burden of digestive diseases in the United States. Washington D.C.: US Department of Health and Human Services, Public Health Service, National Institutes of Health. U.S. Government Printing Office; 2008:111-114.
5. Vilstrup H, Amodio P, Bajaj J, et al. Hepatic encephalopathy in chronic liver disease: 2014 Practice guideline by the American Association for the Study of Liver Diseases and the European Association for the Study of Liver Diseases. Hepatology . 2014;60:715-735. doi: 10.1002/hep.27210 PubMed
6. Stahl J. Studies of the blood ammonia in liver disease: Its diagnostic, prognostic, and therapeutic significance. Ann Intern Med . 1963;58:1-24. PubMed
7. Ong JP, Aggarwal A, Kreiger D, et al. Correlation between ammonia levels and the severity of hepatic encephalopathy. Am J Med . 2003;114:188-193. doi: 10.1016/S0002-9343(02)01477-8 PubMed
8. Nicalao F, Efrati C, Masini A, Merli M, Attili AF, Riggio O. Role of determination of partial pressure of ammonia in cirrhotic patients with and without hepatic encephalopathy. J Hepatol. 2003;38:441-446. doi: 10.1016/S0168-8278(02)00436-1 PubMed
9. Orman ES, Hayashi PH, Bataller R, Barritt AS 4th. Paracentesis is associated with reduced mortality in patients hospitalized with cirrhosis and ascites. Clin Gastroenterol Hepatol. 2014;12:496-503. doi: 10.1016/j.cgh.2013.08.025. PubMed
10. Cassek CK, Guest JA. Choosing wisely: helping physicians and patients make smart decisions about their care. JAMA. 2012;307:1801-1802. doi: 10.1001/jama.2012.476. PubMed
11. Choosing Wisely Canada. 2018. Five things patients and physicians should question. Available at: https://choosingwiselycanada.org/hepatology/ . Accessed November 18, 2018.
12. Iturrate E, Jubelt L, Volpicelli F, Hochman K. Optimize your electronic medical record to increase value: reducing laboratory overutilization. Am J Med . 2016;129:215-220. doi: 10.1016/j.amjmed.2015.09.009. PubMed
© 2019 Society of Hospital Medicine
HCAHPS Patient Satisfaction Scores
Patient satisfaction surveys are widely used to empower patients to voice their concerns and point out areas of deficiency or excellence in the patient‐physician partnership and in the delivery of healthcare services.[1] In 2002, the Centers for Medicare and Medicaid Service (CMS) led an initiative to develop the Hospital Consumer Assessment of Healthcare Providers and Systems (HCAHPS) survey questionnaire.[2] This survey is sent to a randomly selected subset of patients after hospital discharge. The HCAHPS instrument assesses patient ratings of physician communication, nursing communication, pain control, responsiveness, room cleanliness and quietness, discharge process, and overall satisfaction. Over 4500 acute‐care facilities routinely use this survey.[3] HCAHPS scores are publicly reported, and patients can utilize these scores to compare hospitals and make informed choices about where to get care. At an institutional level, scores are used as a tool to identify and improve deficiencies in care delivery. Additionally, HCAHPS survey data results have been analyzed in numerous research studies.[4, 5, 6]
Specialty hospitals are a subset of acute‐care hospitals that provide a narrower set of services than general medical hospitals (GMHs), predominantly in a few specialty areas such as cardiac disease and surgical fields. Many specialty hospitals advertise high rates of patient satisfaction.[7, 8, 9, 10, 11] However, specialty hospitals differ from GMHs in significant ways. Patients at specialty hospitals may be less severely ill[10, 12] and may have more generous insurance coverage.[13] Many specialty hospitals do not have an emergency department (ED), and their outcomes may reflect care of relatively stable patients.[14] A significant number of the specialty hospitals are physician‐owned, which may provide an opportunity for physicians to deliver more patient‐focused healthcare.[14] It is also thought that specialty hospitals can provide high‐quality care by designing their facilities and service structure entirely to meet the needs of a narrow set of medical conditions.
HCAHPS survey results provide an opportunity to compare satisfaction scores among various types of hospitals. We analyzed national HCAHPS data to compare satisfaction scores of specialty hospitals and GMHs and identify factors that may be responsible for this difference.
METHODS
This was a cross‐sectional analysis of national HCAHPS survey data. The methods for administration and reporting of the HCAHPS survey have been described.[15] HCAHPS patient satisfaction data and hospital characteristics, such as location, presence of an ED, and for‐profit status, were obtained from Hospital Compare database. Teaching hospital status was identified using the CMS 2013 Open Payment teaching hospital listing.[16]
For this study, we defined specialty hospitals as acute‐care hospitals that predominantly provide care in a medical or surgical specialty and do not provide care to general medical patients. Based on this definition, specialty hospitals include cardiac hospitals, orthopedic and spine hospitals, oncology hospitals, and hospitals providing multispecialty surgical and procedure‐based services. Children's hospitals, long‐term acute‐care hospitals, and psychiatry hospitals were excluded.
Specialty hospitals were identified using hospital name searches in the HCAHPS database, the American Hospital Association 2013 Annual Survey, the Physician Hospital Association hospitals directory, and through contact with experts. The specialty hospital status of hospitals was further confirmed by checking hospital websites or by directly contacting the hospital.
We analyzed 3‐year HCAHPS patient satisfaction data that included the reporting period from July 2007 to June 2010. HCAHPS data are reported for 12‐month periods at a time. Hospital information, such as address, presence of an ED, and for‐profit status were obtained from the CMS Hospital Compare 2010 dataset. Teaching hospital status was identified using the CMS 2013 Open Payment teaching hospital listing.[16] For the purpose of this study, scores on the HCAHPS survey item definitely recommend the hospital was considered to represent overall satisfaction for the hospital. This is consistent with use of this measure in other sectors in the service industry.[17, 18] Other survey items were considered subdomains of satisfaction. For each hospital, the simple mean of satisfaction scores for overall satisfaction and each of the subdomains for the three 12‐month periods was calculated. Data were summarized using frequencies and meanstandard deviation. The primary dependent variable was overall satisfaction. The main independent variables were specialty hospital status (yes or no), teaching hospital status (yes or no), for‐profit status (yes or no), and the presence of an ED (yes or no). Multiple linear regression analysis was used to adjust for the above‐noted independent variables. A P value<0.05 was considered significant. All analyses were performed on Stata 10.1 IC (StataCorp, College Station, TX).
RESULTS
We identified 188 specialty hospitals and 4638 GMHs within the HCAHPS dataset. Fewer specialty hospitals had emergency care services when compared with GMHs (53.2% for specialty hospitals vs 93.6% for GMHs, P<0.0001), and 47.9% of all specialty hospitals were in states that do not require a Certificate of Need, whereas only 25% of all GMHs were present in these states. For example, Texas, which has 7.2% of all GMHs across the nation, has 24.7% of all specialty hospitals. As compared to GMHs, a majority of specialty hospitals were for profit (14.5% vs 66.9%).
In unadjusted analyses, specialty hospitals had significantly higher patient satisfaction scores compared with GMHs. Overall satisfaction, as measured by the proportion of patients that will definitely recommend that hospital, was 18.8% higher for specialty hospitals than GMHs (86.6% vs 67.8%, P<0.0001). This was also true for subdomains of satisfaction including physician communication, nursing communication, and cleanliness (Table 1).
| Satisfaction Domains | GMH, Mean, n=4,638* | Specialty Hospital, Mean, n=188* | Unadjusted Mean Difference in Satisfaction (95% CI) | Mean Difference in Satisfaction Adjusted for Survey Response Rate (95% CI) | Mean Difference in Satisfaction for Full Adjusted Model (95% CI) |
|---|---|---|---|---|---|
| |||||
| Nurses always communicated well | 75.0% | 84.4% | 9.4% (8.310.5) | 4.0% (2.9‐5.0) | 5.0% (3.8‐6.2) |
| Doctors always communicated well | 80.0% | 86.5% | 6.5% (5.67.6) | 3.8% (2.8‐4.8) | 4.1% (3.05.2) |
| Pain always well controlled | 68.7% | 77.1% | 8.6% (7.79.6) | 4.5% (3.5‐4.5) | 4.6% (3.5‐5.6) |
| Always received help as soon as they wanted | 62.9% | 78.6% | 15.7% (14.117.4) | 7.8% (6.19.4) | 8.0% (6.39.7) |
| Room and bathroom always clean | 70.1% | 81.1% | 11.0% (9.612.4) | 5.5% (4.06.9) | 6.2% (4.7‐7.8) |
| Staff always explained about the medicines | 59.4% | 69.8% | 10.4 (9.211.5) | 5.8% (4.7‐6.9) | 6.5% (5.37.8) |
| Yes, were given information about what to do during recovery at home | 80.9% | 87.1% | 6.2% (5.57.0) | 1.4% (0.7‐2.1) | 2.0% (1.13.0) |
| Overall satisfaction (yes, patients would definitely recommend the hospital) | 67.8% | 86.6% | 18.8%(17.020.6) | 8.5% (6.910.2) | 8.6% (6.710.5) |
| Survey response rate | 32.2% | 49.6% | 17.4% (16.018.9) | ||
We next examined the effect of survey response rate. The survey response rate for specialty hospitals was on average 17.4 percentage points higher than that of GMHs (49.6% vs 32.2%, P<0.0001). When adjusted for survey response rate, the difference in overall satisfaction for specialty hospitals was reduced to 8.6% (6.7%10.5%, P<0.0001). Similarly, the differences in score for subdomains of satisfaction were more modest when adjusted for higher survey response rate. In the multiple regression models, specialty hospital status, survey response rate, for‐profit status, and the presence of an ED were independently associated with higher overall satisfaction, whereas teaching hospital status was not associated with overall satisfaction. Addition of for‐profit status and presence of an ED in the regression model did not change our results. Further, the satisfaction subdomain scores for specialty hospitals remained significantly higher than for GMHs in the regression models (Table 1).
DISCUSSION
In this national study, we found that specialty hospitals had significantly higher overall satisfaction scores on the HCAHPS satisfaction survey. Similarly, significantly higher satisfaction was noted across all the satisfaction subdomains. We found that a large proportion of the difference between specialty hospitals and GMHs in overall satisfaction and subdomains of satisfaction could be explained by a higher survey response rate in specialty hospitals. After adjusting for survey response rate, the differences were comparatively modest, although remained statistically significant. Adjustment for additional confounding variables did not change our results.
Studies have shown that specialty hospitals, when compared to GMHs, may treat more patients in their area of specialization, care for fewer sick and Medicaid patients, have greater physician ownership, and are less likely to have ED services.[11, 12, 13, 14] Two small studies comparing specialty hospitals to GMHs suggest that higher satisfaction with specialty hospitals was attributable to the presence of private rooms, quiet environment, accommodation for family members, and accessible, attentive, and well‐trained nursing staff.[10, 11] Although our analysis did not account for various other hospital and patient characteristics, we expect that these factors likely play a significant role in the observed differences in patient satisfaction.
Survey response rate can be an important determinant of the validity of survey results, and a response rate >70% is often considered desirable.[19, 20] However, the mean survey response rate for the HCAHPS survey was only 32.8% for all hospitals during the survey period. In the outpatient setting, a higher survey response rate has been shown to be associated with higher satisfaction rates.[21] In the hospital setting, a randomized study of a HCAHPS survey for 45 hospitals found that patient mix explained the nonresponse bias. However, this study did not examine the roles of severity of illness or insurance status, which may account for the differences in satisfaction seen between specialty hospitals and GMHs.[22] In contrast, we found that in the hospital setting, higher survey response rate was associated with higher patient satisfaction scores.
Our study has some limitations. First, it was not possible to determine from the dataset whether higher response rate is a result of differences in the patient population characteristics between specialty hospitals and GMHs or it represents the association between higher satisfaction and higher response rate noted by other investigators. Although we used various resources to identify all specialty hospitals, we may have missed some or misclassified others due to lack of a standardized definition.[10, 12, 13] However, the total number of specialty hospitals and their distribution across various states in the current study are consistent with previous studies, supporting our belief that few, if any, hospitals were misclassified.[13]
In summary, we found significant difference in satisfaction rates reported on HCAHPS in a national study of patients attending specialty hospitals versus GMHs. However, the observed differences in satisfaction scores were sensitive to differences in survey response rates among hospitals. Teaching hospital status, for‐profit status, and the presence of an ED did not appear to further explain the differences. Additional studies incorporating other hospital and patient characteristics are needed to fully understand factors associated with differences in the observed patient satisfaction between specialty hospitals and GMHs. Additionally, strategies to increase survey HCAHPS response rates should be a priority.
- About Picker Institute. Available at: http://pickerinstitute.org/about. Accessed September 24, 2012.
- HCAHPS Hospital Survey. Centers for Medicare 45(4):1024–1040.
- , . Consumers' use of HCAHPS ratings and word‐of‐mouth in hospital choice. Health Serv Res. 2010;45(6 pt 1):1602–1613.
- , , . Improving patient satisfaction in hospital care settings. Health Serv Manage Res. 2011;24(4):163–169.
- Live the life you want. Arkansas Surgical Hospital website. Available at: http://www.arksurgicalhospital.com/ash. Accessed September 24, 2012.
- Patient satisfaction—top 60 hospitals. Hoag Orthopedic Institute website. Available at: http://orthopedichospital.com/2012/06/patient‐satisfaction‐top‐60‐hospital. Accessed September 24, 2012.
- Northwest Specialty Hospital website. Available at: http://www.northwestspecialtyhospital.com/our‐services. Accessed September 24, 2012.
- , , , et al. Specialty versus community hospitals: referrals, quality, and community benefits. Health Affairs. 2006;25(1):106–118.
- Study of Physician‐Owned Specialty Hospitals Required in Section 507(c)(2) of the Medicare Prescription Drug, Improvement, and Modernization Act of 2003, May 2005. Available at: http://www.cms.gov/Medicare/Fraud‐and‐Abuse/PhysicianSelfReferral/Downloads/RTC‐StudyofPhysOwnedSpecHosp.pdf. Accessed June 16, 2014.
- Specialty Hospitals: Information on National Market Share, Physician Ownership and Patients Served. GAO: 03–683R. Washington, DC: General Accounting Office; 2003:1–20. Available at: http://www.gao.gov/new.items/d03683r.pdf. Accessed September 24, 2012.
- , , , . Insurance status of patients admitted to specialty cardiac and competing general hospitals: are accusations of cherry picking justified? Med Care. 2008;46:467–475.
- Specialty Hospitals: Geographic Location, Services Provided and Financial Performance: GAO‐04–167. Washington, DC: General Accounting Office; 2003:1–41. Available at: http://www.gao.gov/new.items/d04167.pdf. Accessed September 24, 2012.
- Centers for Medicare 9(4):5–17.
- , , . The relationship between customer satisfaction and loyalty: cross‐industry differences. Total Qual Manage. 2000;11(4‐6):509–514.
- , . Survey response rate levels and trends in organizational research. Hum Relat. 2008;61:1139–1160.
- , . Survey, cohort and case‐control studies. In: Design of Studies for Medical Research. Hoboken, NJ: John Wiley 2005:118–120.
- , , , , . A demonstration of the impact of response bias on the results of patient satisfaction surveys. Health Serv Res. 2002;37(5):1403–1417.
- , , , et al. Effects of survey mode, patient mix and nonresponse on CAHPS hospital survey scores. Health Serv Res. 2009;44:501–518.
Patient satisfaction surveys are widely used to empower patients to voice their concerns and point out areas of deficiency or excellence in the patient‐physician partnership and in the delivery of healthcare services.[1] In 2002, the Centers for Medicare and Medicaid Service (CMS) led an initiative to develop the Hospital Consumer Assessment of Healthcare Providers and Systems (HCAHPS) survey questionnaire.[2] This survey is sent to a randomly selected subset of patients after hospital discharge. The HCAHPS instrument assesses patient ratings of physician communication, nursing communication, pain control, responsiveness, room cleanliness and quietness, discharge process, and overall satisfaction. Over 4500 acute‐care facilities routinely use this survey.[3] HCAHPS scores are publicly reported, and patients can utilize these scores to compare hospitals and make informed choices about where to get care. At an institutional level, scores are used as a tool to identify and improve deficiencies in care delivery. Additionally, HCAHPS survey data results have been analyzed in numerous research studies.[4, 5, 6]
Specialty hospitals are a subset of acute‐care hospitals that provide a narrower set of services than general medical hospitals (GMHs), predominantly in a few specialty areas such as cardiac disease and surgical fields. Many specialty hospitals advertise high rates of patient satisfaction.[7, 8, 9, 10, 11] However, specialty hospitals differ from GMHs in significant ways. Patients at specialty hospitals may be less severely ill[10, 12] and may have more generous insurance coverage.[13] Many specialty hospitals do not have an emergency department (ED), and their outcomes may reflect care of relatively stable patients.[14] A significant number of the specialty hospitals are physician‐owned, which may provide an opportunity for physicians to deliver more patient‐focused healthcare.[14] It is also thought that specialty hospitals can provide high‐quality care by designing their facilities and service structure entirely to meet the needs of a narrow set of medical conditions.
HCAHPS survey results provide an opportunity to compare satisfaction scores among various types of hospitals. We analyzed national HCAHPS data to compare satisfaction scores of specialty hospitals and GMHs and identify factors that may be responsible for this difference.
METHODS
This was a cross‐sectional analysis of national HCAHPS survey data. The methods for administration and reporting of the HCAHPS survey have been described.[15] HCAHPS patient satisfaction data and hospital characteristics, such as location, presence of an ED, and for‐profit status, were obtained from Hospital Compare database. Teaching hospital status was identified using the CMS 2013 Open Payment teaching hospital listing.[16]
For this study, we defined specialty hospitals as acute‐care hospitals that predominantly provide care in a medical or surgical specialty and do not provide care to general medical patients. Based on this definition, specialty hospitals include cardiac hospitals, orthopedic and spine hospitals, oncology hospitals, and hospitals providing multispecialty surgical and procedure‐based services. Children's hospitals, long‐term acute‐care hospitals, and psychiatry hospitals were excluded.
Specialty hospitals were identified using hospital name searches in the HCAHPS database, the American Hospital Association 2013 Annual Survey, the Physician Hospital Association hospitals directory, and through contact with experts. The specialty hospital status of hospitals was further confirmed by checking hospital websites or by directly contacting the hospital.
We analyzed 3‐year HCAHPS patient satisfaction data that included the reporting period from July 2007 to June 2010. HCAHPS data are reported for 12‐month periods at a time. Hospital information, such as address, presence of an ED, and for‐profit status were obtained from the CMS Hospital Compare 2010 dataset. Teaching hospital status was identified using the CMS 2013 Open Payment teaching hospital listing.[16] For the purpose of this study, scores on the HCAHPS survey item definitely recommend the hospital was considered to represent overall satisfaction for the hospital. This is consistent with use of this measure in other sectors in the service industry.[17, 18] Other survey items were considered subdomains of satisfaction. For each hospital, the simple mean of satisfaction scores for overall satisfaction and each of the subdomains for the three 12‐month periods was calculated. Data were summarized using frequencies and meanstandard deviation. The primary dependent variable was overall satisfaction. The main independent variables were specialty hospital status (yes or no), teaching hospital status (yes or no), for‐profit status (yes or no), and the presence of an ED (yes or no). Multiple linear regression analysis was used to adjust for the above‐noted independent variables. A P value<0.05 was considered significant. All analyses were performed on Stata 10.1 IC (StataCorp, College Station, TX).
RESULTS
We identified 188 specialty hospitals and 4638 GMHs within the HCAHPS dataset. Fewer specialty hospitals had emergency care services when compared with GMHs (53.2% for specialty hospitals vs 93.6% for GMHs, P<0.0001), and 47.9% of all specialty hospitals were in states that do not require a Certificate of Need, whereas only 25% of all GMHs were present in these states. For example, Texas, which has 7.2% of all GMHs across the nation, has 24.7% of all specialty hospitals. As compared to GMHs, a majority of specialty hospitals were for profit (14.5% vs 66.9%).
In unadjusted analyses, specialty hospitals had significantly higher patient satisfaction scores compared with GMHs. Overall satisfaction, as measured by the proportion of patients that will definitely recommend that hospital, was 18.8% higher for specialty hospitals than GMHs (86.6% vs 67.8%, P<0.0001). This was also true for subdomains of satisfaction including physician communication, nursing communication, and cleanliness (Table 1).
| Satisfaction Domains | GMH, Mean, n=4,638* | Specialty Hospital, Mean, n=188* | Unadjusted Mean Difference in Satisfaction (95% CI) | Mean Difference in Satisfaction Adjusted for Survey Response Rate (95% CI) | Mean Difference in Satisfaction for Full Adjusted Model (95% CI) |
|---|---|---|---|---|---|
| |||||
| Nurses always communicated well | 75.0% | 84.4% | 9.4% (8.310.5) | 4.0% (2.9‐5.0) | 5.0% (3.8‐6.2) |
| Doctors always communicated well | 80.0% | 86.5% | 6.5% (5.67.6) | 3.8% (2.8‐4.8) | 4.1% (3.05.2) |
| Pain always well controlled | 68.7% | 77.1% | 8.6% (7.79.6) | 4.5% (3.5‐4.5) | 4.6% (3.5‐5.6) |
| Always received help as soon as they wanted | 62.9% | 78.6% | 15.7% (14.117.4) | 7.8% (6.19.4) | 8.0% (6.39.7) |
| Room and bathroom always clean | 70.1% | 81.1% | 11.0% (9.612.4) | 5.5% (4.06.9) | 6.2% (4.7‐7.8) |
| Staff always explained about the medicines | 59.4% | 69.8% | 10.4 (9.211.5) | 5.8% (4.7‐6.9) | 6.5% (5.37.8) |
| Yes, were given information about what to do during recovery at home | 80.9% | 87.1% | 6.2% (5.57.0) | 1.4% (0.7‐2.1) | 2.0% (1.13.0) |
| Overall satisfaction (yes, patients would definitely recommend the hospital) | 67.8% | 86.6% | 18.8%(17.020.6) | 8.5% (6.910.2) | 8.6% (6.710.5) |
| Survey response rate | 32.2% | 49.6% | 17.4% (16.018.9) | ||
We next examined the effect of survey response rate. The survey response rate for specialty hospitals was on average 17.4 percentage points higher than that of GMHs (49.6% vs 32.2%, P<0.0001). When adjusted for survey response rate, the difference in overall satisfaction for specialty hospitals was reduced to 8.6% (6.7%10.5%, P<0.0001). Similarly, the differences in score for subdomains of satisfaction were more modest when adjusted for higher survey response rate. In the multiple regression models, specialty hospital status, survey response rate, for‐profit status, and the presence of an ED were independently associated with higher overall satisfaction, whereas teaching hospital status was not associated with overall satisfaction. Addition of for‐profit status and presence of an ED in the regression model did not change our results. Further, the satisfaction subdomain scores for specialty hospitals remained significantly higher than for GMHs in the regression models (Table 1).
DISCUSSION
In this national study, we found that specialty hospitals had significantly higher overall satisfaction scores on the HCAHPS satisfaction survey. Similarly, significantly higher satisfaction was noted across all the satisfaction subdomains. We found that a large proportion of the difference between specialty hospitals and GMHs in overall satisfaction and subdomains of satisfaction could be explained by a higher survey response rate in specialty hospitals. After adjusting for survey response rate, the differences were comparatively modest, although remained statistically significant. Adjustment for additional confounding variables did not change our results.
Studies have shown that specialty hospitals, when compared to GMHs, may treat more patients in their area of specialization, care for fewer sick and Medicaid patients, have greater physician ownership, and are less likely to have ED services.[11, 12, 13, 14] Two small studies comparing specialty hospitals to GMHs suggest that higher satisfaction with specialty hospitals was attributable to the presence of private rooms, quiet environment, accommodation for family members, and accessible, attentive, and well‐trained nursing staff.[10, 11] Although our analysis did not account for various other hospital and patient characteristics, we expect that these factors likely play a significant role in the observed differences in patient satisfaction.
Survey response rate can be an important determinant of the validity of survey results, and a response rate >70% is often considered desirable.[19, 20] However, the mean survey response rate for the HCAHPS survey was only 32.8% for all hospitals during the survey period. In the outpatient setting, a higher survey response rate has been shown to be associated with higher satisfaction rates.[21] In the hospital setting, a randomized study of a HCAHPS survey for 45 hospitals found that patient mix explained the nonresponse bias. However, this study did not examine the roles of severity of illness or insurance status, which may account for the differences in satisfaction seen between specialty hospitals and GMHs.[22] In contrast, we found that in the hospital setting, higher survey response rate was associated with higher patient satisfaction scores.
Our study has some limitations. First, it was not possible to determine from the dataset whether higher response rate is a result of differences in the patient population characteristics between specialty hospitals and GMHs or it represents the association between higher satisfaction and higher response rate noted by other investigators. Although we used various resources to identify all specialty hospitals, we may have missed some or misclassified others due to lack of a standardized definition.[10, 12, 13] However, the total number of specialty hospitals and their distribution across various states in the current study are consistent with previous studies, supporting our belief that few, if any, hospitals were misclassified.[13]
In summary, we found significant difference in satisfaction rates reported on HCAHPS in a national study of patients attending specialty hospitals versus GMHs. However, the observed differences in satisfaction scores were sensitive to differences in survey response rates among hospitals. Teaching hospital status, for‐profit status, and the presence of an ED did not appear to further explain the differences. Additional studies incorporating other hospital and patient characteristics are needed to fully understand factors associated with differences in the observed patient satisfaction between specialty hospitals and GMHs. Additionally, strategies to increase survey HCAHPS response rates should be a priority.
- About Picker Institute. Available at: http://pickerinstitute.org/about. Accessed September 24, 2012.
- HCAHPS Hospital Survey. Centers for Medicare 45(4):1024–1040.
- , . Consumers' use of HCAHPS ratings and word‐of‐mouth in hospital choice. Health Serv Res. 2010;45(6 pt 1):1602–1613.
- , , . Improving patient satisfaction in hospital care settings. Health Serv Manage Res. 2011;24(4):163–169.
- Live the life you want. Arkansas Surgical Hospital website. Available at: http://www.arksurgicalhospital.com/ash. Accessed September 24, 2012.
- Patient satisfaction—top 60 hospitals. Hoag Orthopedic Institute website. Available at: http://orthopedichospital.com/2012/06/patient‐satisfaction‐top‐60‐hospital. Accessed September 24, 2012.
- Northwest Specialty Hospital website. Available at: http://www.northwestspecialtyhospital.com/our‐services. Accessed September 24, 2012.
- , , , et al. Specialty versus community hospitals: referrals, quality, and community benefits. Health Affairs. 2006;25(1):106–118.
- Study of Physician‐Owned Specialty Hospitals Required in Section 507(c)(2) of the Medicare Prescription Drug, Improvement, and Modernization Act of 2003, May 2005. Available at: http://www.cms.gov/Medicare/Fraud‐and‐Abuse/PhysicianSelfReferral/Downloads/RTC‐StudyofPhysOwnedSpecHosp.pdf. Accessed June 16, 2014.
- Specialty Hospitals: Information on National Market Share, Physician Ownership and Patients Served. GAO: 03–683R. Washington, DC: General Accounting Office; 2003:1–20. Available at: http://www.gao.gov/new.items/d03683r.pdf. Accessed September 24, 2012.
- , , , . Insurance status of patients admitted to specialty cardiac and competing general hospitals: are accusations of cherry picking justified? Med Care. 2008;46:467–475.
- Specialty Hospitals: Geographic Location, Services Provided and Financial Performance: GAO‐04–167. Washington, DC: General Accounting Office; 2003:1–41. Available at: http://www.gao.gov/new.items/d04167.pdf. Accessed September 24, 2012.
- Centers for Medicare 9(4):5–17.
- , , . The relationship between customer satisfaction and loyalty: cross‐industry differences. Total Qual Manage. 2000;11(4‐6):509–514.
- , . Survey response rate levels and trends in organizational research. Hum Relat. 2008;61:1139–1160.
- , . Survey, cohort and case‐control studies. In: Design of Studies for Medical Research. Hoboken, NJ: John Wiley 2005:118–120.
- , , , , . A demonstration of the impact of response bias on the results of patient satisfaction surveys. Health Serv Res. 2002;37(5):1403–1417.
- , , , et al. Effects of survey mode, patient mix and nonresponse on CAHPS hospital survey scores. Health Serv Res. 2009;44:501–518.
Continuous Versus Intermittent Furosemide in ADHF
Acute decompensated heart failure (ADHF) is the most common cause of hospitalization among adults in the United States and is associated with high morbidity and mortality.1 The estimated direct and indirect cost of ADHF management in the United States was $40 billion in 2010.1 There are approximately 5.7 million patients with heart failure in the United States with an annual mortality rate of 300,000 deaths per year.2 The Healthcare Cost and Utilization Project reported 1.1 million hospital admissions, an average hospital stay of 5.5 days, and 4% in‐hospital mortality for patients with heart failure in 2004.3
Intravenous administration of loop diuretics is the mainstay of treatment of volume overload in patients hospitalized with ADHF.4 However, when administered as intermittent bolus injections, loop diuretics usually lead to rapid intravascular volume changes,5 significant electrolyte abnormalities,6, 7 renal dysfunction,8, 9 and undesired neurohormonal activity.10, 11 Compared with intermittent bolus injections, continuous infusion of loop diuretics may induce a more sustained and greater diuresis and fewer electrolyte abnormalities.1216 Several studies of limited duration have compared the effectiveness of the 2 routes of intravenous administration of loop diuretics; however, the results of these studies are contradictory.13, 14, 17, 18 In a meta‐analysis, Salvador et al19 compared the effectiveness of continuous infusion and intermittent bolus injections of loop diuretics. The authors reported greater diuresis (measured as 24‐hour urinary output) in patients receiving continuous infusion of loop diuretics. However, the meta‐analysis included studies that examined loop diuretics other than furosemide,20 allowed concomitant use of hypertonic saline infusions,21 and included patients with pulmonary edema from noncardiogenic causes.22
Furosemide is one of the most commonly used loop diuretics.23 The current literature lacks a systematic review and meta‐analysis comparing the effectiveness of continuous infusion and intermittent bolus furosemide therapy among nonsurgical, hemodynamically stable, hospitalized patients with ADHF. In addition, several important randomized trials published in recent years comparing the effectiveness of the 2 routes of intravenous furosemide delivery warrant17, 2427 systematic review, because the last published meta‐analysis (by Salvador et al19) was in 2005.
We therefore conducted a systematic review and meta‐analysis of randomized controlled trials that compared the effects of continuous infusion and intermittent bolus of furosemide in patients hospitalized with ADHF.
METHODS
Study Selection
We searched the PubMed, EMBASE, and The Cochrane Central Register of Controlled Trials electronic databases systematically from their inception through March 2011 using the search terms lasix, furosemide, diuretic, congestive heart failure, infusion, and bolus. The electronic database search was supplemented by hand‐searching bibliographies of the retrieved articles. Two investigators independently reviewed all retrieved articles for their eligibility based on predefined criteria. Disagreement on study selection was resolved by mutual consensus and by the involvement of a third investigator. All selected studies were assessed for content validity.
We included both crossover and parallel‐arm randomized control trials. Studies were included if patients were randomized to intermittent bolus or continuous infusion of furosemide, and data were reported on 24‐hour urinary volume, total body weight loss, 24‐hour urinary sodium excretion, and duration of hospital stay. Randomized control trials that included patients with cardiogenic shock requiring concomitant vasopressor therapy, renal failure with or without hemodialysis, and loop diuretics other than furosemide were excluded. The primary authors of the included studies were contacted if the results of the selected outcomes either were not reported or required further clarification. A flow diagram was produced following guidelines from The Quality of Reporting of Meta‐analyses (QUOROM) group28 to provide information on randomized clinical trial identification for the final inclusion in the meta‐analysis.
Data Extraction
Data on study design, participant characteristics, methods, intervention, and selected outcomes were independently extracted by 2 investigators. Interobserver agreement for full study selection was calculated using an unweighted kappa statistic. A chi‐square test (2) and I2 statistic were used to report the percentage of variability in the effect estimates across studies.
Quality Assessment
The quality of included trials was assessed using a validated scale developed by Jadad et al29 that assigns a score from 0 to 5, with a higher score indicating higher quality. Two investigators independently evaluated studies on 3 parameters: randomization, blinding, and dropouts. The third investigator helped resolve discordant assessments. We assessed publication bias visually by examining the symmetry of funnel plots and statistically using Begg30 and Egger31 tests.
Data Synthesis and Analysis
For the reported outcomes, we recorded the mean difference between the groups and measures of dispersion. If a mean difference was not reported, we calculated point estimates by using the mean difference from baseline for each group. If a mean difference from baseline was not reported, we calculated point estimates using the baseline and final value for each group. If a measure of dispersion was not reported for the between‐group difference, we calculated it by using the sum of the variance for the mean difference from baseline in each group. If no measure of dispersion was reported for the mean difference from baseline for each group, we calculated variance by using the standard deviation of the baseline and final values, and assumed a correlation between the baseline and final values of 0.5.
Urinary volume was measured in milliliters per 24 hours per 100 mg furosemide to compare the diuretic effect between the 2 routes of intravenous administration. Total body weight loss was measured in kilograms. Urinary sodium was measured in millimoles per 24 hours, and duration of hospital stay was measured in days.
Weighted mean differences (WMDs) with 95% confidence intervals (CIs) were calculated for all prespecified outcomes using Review Manager (RevMan) Version 5.0. Copenhagen: The Nordic Cochrane Centre, The Cochrane Collaboration, 2008. We pooled results from individual studies using a random‐effects model. Statistical significance was set at P 0.05 using a 2‐tailed Z‐test. Sensitivity analyses were conducted by omitting one study at a time for all outcomes.
RESULTS
Study Selection
We identified 104 studies using the previously stated search terms. Following QUOROM guidelines, ten randomized clinical trials, enrolling a total of 564 patients, fulfilled the inclusion criteria (Figure 1). The interobserver agreement (unweighted kappa statistic) between investigators for study selection was 0.75.

Study Characteristics
The majority of patients were male (60%) with a mean age of 62.8 years (range 54 ‐ 74.1 years). The duration of follow‐up while on furosemide in both arms ranged from twelve hours24 to six days13 (Table 1). We found significant variability in dose, frequency, and duration of treatment across studies for both routes of intravenous furosemide administration (Table 2). Four of 10 studies were crossover trials13, 14, 18, 32 and the rest were parallel‐arm trials. Randomization to 1 of the 2 treatment groups was reported in all 4 crossover trials.
| Study | Study Design* | Total (N) | Mean Age (years) | Male (n) | Duration on Furosemide (days) | Country of Study | NYHA Class | Jadad Quality Score |
|---|---|---|---|---|---|---|---|---|
| ||||||||
| Aaser et al18 | CO | 8 | 54 | 6 | 2 | Norway | III‐IV | 1 |
| Allen et al17 | PA | 41 | 61 | 26 | 2 | USA | NR | 3 |
| Dormans et al13 | CO | 20 | 71 | 13 | 6 | Netherlands | III‐IV | 1 |
| Felker et al27 | PA | 308 | 66 | 226 | 3 | USA | NR | 4 |
| Lahav et al14 | CO | 9 | 74.1 | 5 | 4 | Israel | III‐IV | 1 |
| Mojtahedzadeh et al33 | PA | 22 | NR | NR | 1.5 | Iran | NR | 2 |
| Mojtahedzadeh et al24 | PA | 21 | 56.5 | 11 | 0.5 | Iran | NR | 2 |
| Ostermann et al26 | PA | 59 | 64 | 31 | 2 | UK/Canada | NR | 3 |
| Pivac et al32 | CO | 20 | 62.2 | 9 | 3 | Croatia | III | 1 |
| Thomson et al25 | PA | 56 | 56.4 | 32 | 3.54.6 | USA | III‐IV | 3 |
| Study | Furosemide Dose (Mean SD) | Additional Comments | |
|---|---|---|---|
| Intermittent Bolus | Continuous Infusion | ||
| |||
| Aaser et al18 | 145 80 mg bid | 145 80 mg/24 hr | Furosemide dose was same as usual daily oral dose |
| Allen et al17 | 162 48 mg bid | 162 52 mg/24 hr | Dose was determined by attending physician after enrollement |
| Dormans et al13 | Single bolus of continous dose | 690 mg/8 hr (2502000 mg) | Patients received additional single oral doses of furosemide on first and second day |
| Felker et al27 | 134 53 mg/day | 127 50 mg/day | Treatment was continued for up to 72 hours; at 48 hours, the treating physician had the option of adjusting the diurtetic dose on the basis of clinical response |
| Lahav et al14 | 3040 mg/8 hr | 6080 mg/24 hr | Continuous group received 3040 mg bolus furosemide as loading dose |
| Mojtahedzadeh et al33 | 320 mg/dose | 0.75 mg/kg/hr | All patients received 20 mg of furosemide as initial bolus in both arms |
| Mojtahedzadeh et al24 | 20 mg initial, then doubled every 3 hr* | 0.1 mg/kg/hr (total 250 mg) | Both regimens were titrated for a goal net fluid balance of at least 1 mL/kg/hr |
| Ostermann et al26 | 0.65.14/kg/dose | 0.40.6 mg/kg/hr | Predefined alogrithms aiming for minimum hourly urine output was used in both arms |
| Pivac et al32 | 40 mg bid | 40 mg bid | Goal was to increase urine output to at least 50% from baseline or a minimum of 1 mL/kg/hr |
| Thomson et al25 | 172 97 mg | 197 148 mg/day | The mean duration of study drug administration was shorter by approximately 1 day in the continous group |
Outcomes
Data on 24‐hour urinary volume were reported in all 10 studies. We found that the continuous infusion of furosemide was associated with a statistically significant increase in 24‐hour urinary output compared with intermittent bolus injections (WMD, 240.54 mL/24 hours/100 mg furosemide; 95% CI, 462.42 to 18.66; P = 0.03). There was evidence of statistically significant heterogeneity between the studies for the outcome of 24‐hour urinary volume (I2 = 89%; 2 = 93.11; P < 0.001) (Figure 2). The magnitude of statistical heterogeneity decreased (I2 = 53%; 2 = 19.11; P = 0.02) but remained significant after removing a study by Ostermann et al.26
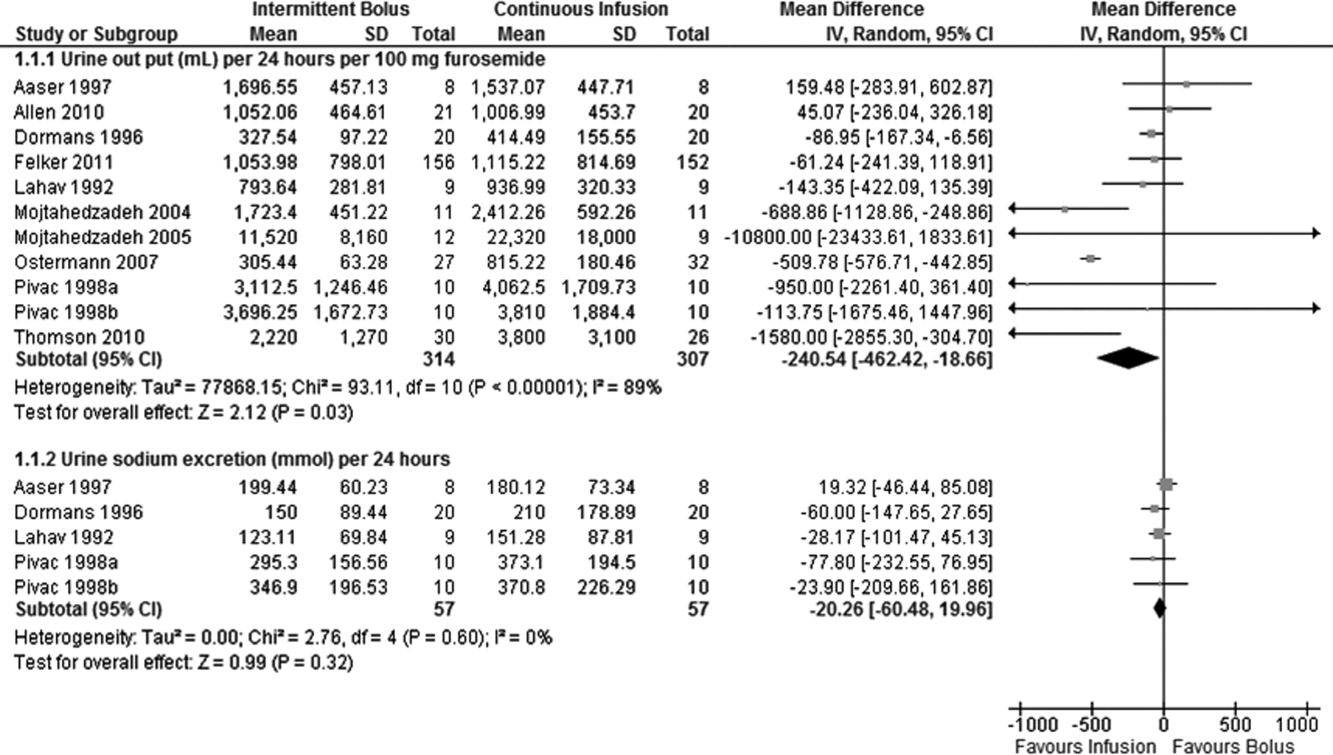
Data on total body weight loss was reported in 3 parallel trials. Patients treated with a continuous infusion of furosemide had statistically greater changes in total body weight (WMD, 0.78 kg; 95% CI, 1.54 to 0.03; P = 0.04) when compared with patients receiving bolus injections of furosemide. Data for total body weight loss were collected at 72 hours of treatment in 2 trials17, 27 and was reported for the duration of the entire study by Thomson et al.25 There was no statistical evidence of heterogeneity between the studies for total body weight loss (I2 = 0 %; 2 = 0.66; P = 0.72) (Figure 3).
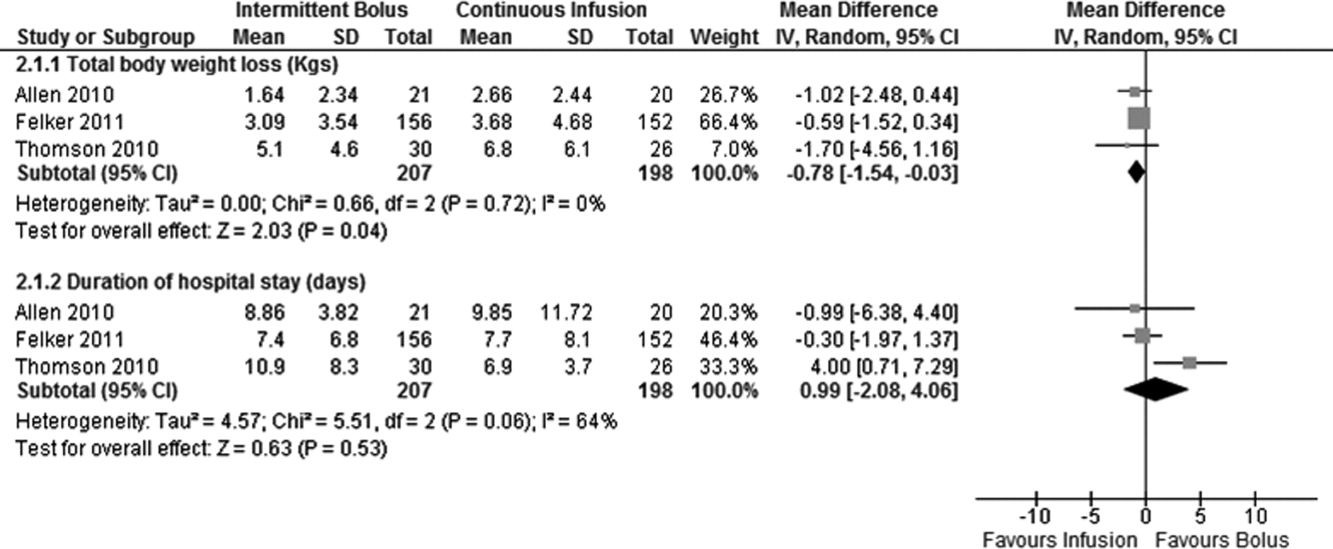
Data on 24‐hour urinary sodium excretion was reported for 57 patients in the 4 crossover studies. A continuous infusion of furosemide was associated with a statistically insignificant increase in 24‐hour urinary sodium (WMD, 20.26 mmol/24 hours; 95% CI, 60.48 to 19.96; P = 0.32). There was no statistical evidence of heterogeneity between studies for 24‐hour urinary sodium excretion (I2 = 0%; 2 = 2.76; P = 0.60) (Figure 2).
Duration of hospital stay was reported in 3 parallel trials. Patients receiving intermittent injections of bolus furosemide had longer hospital stays (WMD, 0.99 days; 95% CI, 2.08 to 4.06; P = 0.53), but this difference was not statistically significant. There was no evidence of heterogeneity between the studies for the duration of hospital stay (I2 = 64%; 2 = 5.51; P = 0.06) (Figure 3).
Risk of Bias and Sensitivity Analysis
Individual quality assessment scores based on a scoring system developed by Jadad et al29 for included trials are reported (Table 1). Randomization was reported by all studies, but the explicit methodology of randomization was defined in only 4 studies.17, 2527 Allocation concealment was defined in 1 study.26 Dropouts were reported in 4 studies.2426, 33 Adherence to intervention per study protocol was not reported in any of the selected studies. Three studies mentioned intention to treat.25, 26 Sensitivity analyses demonstrated that the direction of the mean estimates did not change for any of the 4 outcomes when individual studies were excluded.
DISCUSSION
Our meta‐analysis of 10 randomized, controlled clinical trials found that continuous infusion of furosemide results in significantly greater diuresis and reduction in total body weight than intermittent boluses in patients hospitalized with ADHF. No statistical differences were observed in urinary sodium excretion or the duration of hospital stay between the 2 routes of intravenous furosemide administration. The data on greater diuresis from the available clinical trials was widely heterogeneous that may limit the merits of assessment of greater diuresis between the 2 methods of intravenous furosemide administration. In addition, data on clinical outcomes such as rates of rehospitalization, cardiovascular, and all‐cause mortality were not reported in the studies selected for this meta‐analysis.
The mean effective dose of loop diuretics administered as intermittent boluses varies widely5 and quickly dissipates to a level that fails to block Na+ reabsorption in renal tubules.34 Additionally, the effectiveness of loop diuretics is limited by the rebound in sodium reabsorption during periods of subtherapeutic renal tubular concentration because of their short half‐life.4, 6, 35 It is possible that the ineffectiveness of subtherapeutic tubular filtrate levels of loop diuretics toward the end of a dosing interval when administered as a bolus is responsible for their unsustained diuretic effects. Bolus injections of furosemide have been associated with diuretic tolerance, reduced short‐term natriuresis, and a probable rise in plasma aldosterone levels in the settings of salt restriction.36 Data from physiological studies suggest that greater diuresis, which also results in weight loss with continuous infusion of loop diuretics, is due to the minimal variation in the mean effective dose of drug in the renal tubules.1216 By preventing subtherapeutic tubular dose concentrations, continuous infusion may limit rebound resorption helping to improve symptoms of ADHF.4
Our study has several limitations. First, we examined only surrogate endpoints. Second, we included crossover trials13, 14, 18, 32 in the analysis, and the variation in the washout periods of these trials may have affected the reported outcomes. The study by Aaser et al18 lacked a washout period because the authors were concerned for the hemodynamic stability of diuretic‐dependent ADHF patients. Lahav et al14 reported a washout period of 3 hours, while Dormans et al13 and Pivac et al32 did not report the duration of washout periods. Finally, we excluded studies that enrolled postsurgical patients and patients with pulmonary edema from noncardiac causes. As a result, the generalizability of our findings is limited to relatively stable ADHF patients hospitalized because of medical, dietary, or pharmacological noncompliance. We restricted our analysis to studies using furosemide therapy only. By excluding trials using loop diuretics other than furosemide and trials reporting concomitant use of vasopressors or hypertonic saline in the study population, we are confident in the assessment of the isolated effects of furosemide for either route of its intravenous administration in patients hospitalized with ADHF.
The continuous infusion of furosemide has been well tolerated in most instances.13, 2527, 32 Thomson et al25 found no difference on the incidence of significant hemodynamic changes or need for renal replacement therapy between the 2 groups. Similarly, Ostermann et al26 reported no significant differences in heart rate and mean arterial pressures changes from two treatment groups. In addition, Felker et al27 and Pivac et al32 found no differences in the proportion of serious adverse effects between the 2 routes of intravenous furosemide administration.
In the absence of information on clinical endpoints such as rehospitalization, all‐cause mortality, and cardiovascular mortality, this meta‐analysis could not settle the issue to provide definitive recommendations for treatment guidelines to use either route of intravenous furosemide in ADHF patients. However, it is important to note that despite different study populations, our finding of greater diuresis with continuous infusion of furosemide is consistent with results reported by Salvador et al.19 Given the higher prevalence, mortality, and significant cost related with ADHF management in the United States, we support the use of furosemide as a continuous infusion to ensure limited but established benefits, such as greater diuresis and reduction in total body weight,. This approach seems reasonable, especially when the safety profiles between the 2 treatment groups are not different.2527, 32 However, the benefits on surrogate outcomes cannot be overstressed due to lack of information on the cost‐effectiveness of furosemide or other loop diuretics administered as a continuous infusion.
CONCLUSIONS
We report a systematic review and meta‐analysis comparing the effectiveness of 2 routes of intravenous furosemide administration in patients with ADHF. We found that continuous infusion of furosemide results in greater diuresis and greater reduction in total body weight. With the exception of greater diuresis, available data are homogenous for the reported outcomes in this meta‐analysis. Due to lack of information on clinical endpoints and cost‐effectiveness from currently available data, robust recommendations for clinical practice guidelines cannot be made at this time. Randomized controlled trials measuring hard clinical endpoints in larger patient populations may add stronger evidence to settle this issue in future. Further studies comparing cost‐effectiveness related with continuous infusion of furosemide may provide critical information to establish it as the preferred route over intermittent bolus injection in clinical practice.
- ,,, et al.Heart disease and stroke statistics 2009 update: a report from the American Heart Association Statistics Committee and Stroke Statistics Subcommittee.Circulation.2009;119:e21–e181.
- National Heart, Lung, and Blood Institute. What Is Heart Failure? Available at: http://www.nhlbi.nih.gov/health/health‐topics/topics/hf/. Accessed March 6,2011.
- ,,. Hospital Stays for Circulatory Diseases, 2004. Healthcare Cost and Utilization Project Statistical Brief No. 26. Rockville, MD: Agency for Healthcare Research and Quality; February 2007. Available at: http://www.hcup‐us.ahrq.gov/reports/statbriefs/sb26.jsp. Accessed February 22,2010.
- ,,, et al.2009 focused update: ACCF/AHA Guidelines for the Diagnosis and Management of Heart Failure in Adults: a report of the American College of Cardiology Foundation/American Heart Association Task Force on Practice Guidelines: developed in collaboration with the International Society for Heart and Lung Transplantation.Circulation.2009;119:1977–2016.
- ,,,.Determinants of response to furosemide in normal subjects.Br J Clin Pharmacol.1977;4:121–127.
- .Diuretic therapy.N Engl J Med.1998;339:387–395.
- ,,,,.Diuretics and risk of arrhythmic death in patients with left ventricular dysfunction.Circulation.1999;100:1311–1315.
- ,,, et al.Increased toxicity of high dose furosemide versus low‐dose dopamine in the treatment of refractory congestive heart failure.Clin Pharmacol Ther.1997;62:187–193.
- ,,, et al.Relationship between heart failure treatment and development of worsening renal function among hospitalized patients.Am Heart J.2004;147:331–338.
- ,,,.Haemodynamic and hormone responses to acute and chronic furosemide therapy in congestive heart failure.Clin Sci.1980;59:443–449.
- ,,,,.Untreated heart failure: clinical and neuroendocrine effects of introducing diuretics.Br Heart J.1987;57:17–22.
- ,,.The time course of delivery of furosemide into urine: an independent determinant of overall response.Kidney Int.1982;22:69–74.
- ,,,,,.Diuretic efficacy of high dose furosemide in severe heart failure: bolus injection versus continuous infusion.J Am Coll Cardiol.1996;28:376–382.
- ,,,.Intermittent administration of furosemide vs continuous infusion preceded by a loading dose for congestive heart failure.Chest.1992;102:725–731.
- ,,,,.Diuresis with continuous infusion of furosemide after cardiac surgery.Am J Surg.1983;146:796.
- ,,,.Continuous infusion of furosemide in refractory edema.BMJ.1978;2:476.
- ,,,,,.Continuous versus bolus dosing of furosemide for patients hospitalized for heart failure.Am J Cardiol.2010;105:1794–1797.
- ,,, et al.Effect of bolus injection versus continuous infusion of furosemide on diuresis and neurohormonal activation in patients with severe congestive heart failure.Scand J Clin Lab Invest.1997;57:361–367.
- ,,,.Continuous infusion versus bolus injection of loop diuretics in congestive heart failure.Cochrane Database Syst Rev.2005;(3):CD003178.
- ,,, et al.Pharmacodynamics of torsemide administered as an intravenous injection and as a continuous infusion to patients with congestive heart failure.J Clin Pharmacol.1996;36:265–270.
- ,,, et al.Effects of high‐dose furosemide and small‐volume hypertonic saline solution infusion in comparison with a high dose of furosemide as bolus in refractory congestive heart failure: long‐term effects.Am Heart J.2003;145:459–466.
- ,,.Protocol‐ guided diuretic management: comparison of furosemide by continuous infusion and intermittent bolus.Crit Care Med.1997;25:1969–1975.
- Cardiovascular Pharmacology Concepts. Diuretics. Available at: http://www.cvpharmacology.com/diuretic/diuretics.htm. Accessed July 22,2010.
- ,,, et al.The relationship between pharmacokinetics variables and pharmacodynamics profiles of bolus versus continuous infusion of furosemide in critically ill patients.J Infus Nurs.2005;13:127–132.
- ,,,,,.Continuous versus intermittent infusion of furosemide in acute decompensated heart failure.J Card Fail.2010;16:188–193.
- ,,,.Frusemide administration in critically ill patients by continuous compared to bolus therapy.Nephron Clin Pract.2007;107:c70–c76.
- ,,, et al;NHLBI Heart Failure Clinical Research Network. Diuretic strategies in patients with acute decompensated heart failure.N Engl J Med.2011;364:797–805.
- ,,,,,.Improving the quality of reports of meta‐analyses of randomised controlled trials: the QUOROM statement. Quality of Reporting of Meta‐analyses.Lancet.1999;354:1896–1900.
- ,,, et al.Assessing the quality of reports of randomized clinical trials: is blinding necessary?Control Clin Trials.1996;17:1–12.
- ,.Operating characteristics of a rank correlation test for publication bias.Biometrics.1994;50:1088–1101.
- ,,,.Bias in meta‐analysis detected by a simple, graphical test.BMJ.1997;315:629–634.
- ,,, et al.Diuretic effects of furosemide infusion versus bolus injection in congestive heart failure.Int J Clin Pharmacol Res.1998;18:121–128.
- ,,, et al.Comparison of hemodynamic and biochemical effects of furosemide by continuous infusion and intermittent bolus in critically ill patients.Infus Nurs.2004;27:255–261.
- .Diuretic resistance: mechanisms and therapeutic strategies.Cardiology.1994;84(suppl 2):57–67.
- ,.Loop diuretics: from the Na‐K‐2Cl transporter to clinical use.Am J Physiol Renal Physiol.2003;284:F11–F21.
- ,,, et al.Response to furosemide. I. Effects of salt intake and renal compensation.J Lab Clin Med.1983;102:450–458.
Acute decompensated heart failure (ADHF) is the most common cause of hospitalization among adults in the United States and is associated with high morbidity and mortality.1 The estimated direct and indirect cost of ADHF management in the United States was $40 billion in 2010.1 There are approximately 5.7 million patients with heart failure in the United States with an annual mortality rate of 300,000 deaths per year.2 The Healthcare Cost and Utilization Project reported 1.1 million hospital admissions, an average hospital stay of 5.5 days, and 4% in‐hospital mortality for patients with heart failure in 2004.3
Intravenous administration of loop diuretics is the mainstay of treatment of volume overload in patients hospitalized with ADHF.4 However, when administered as intermittent bolus injections, loop diuretics usually lead to rapid intravascular volume changes,5 significant electrolyte abnormalities,6, 7 renal dysfunction,8, 9 and undesired neurohormonal activity.10, 11 Compared with intermittent bolus injections, continuous infusion of loop diuretics may induce a more sustained and greater diuresis and fewer electrolyte abnormalities.1216 Several studies of limited duration have compared the effectiveness of the 2 routes of intravenous administration of loop diuretics; however, the results of these studies are contradictory.13, 14, 17, 18 In a meta‐analysis, Salvador et al19 compared the effectiveness of continuous infusion and intermittent bolus injections of loop diuretics. The authors reported greater diuresis (measured as 24‐hour urinary output) in patients receiving continuous infusion of loop diuretics. However, the meta‐analysis included studies that examined loop diuretics other than furosemide,20 allowed concomitant use of hypertonic saline infusions,21 and included patients with pulmonary edema from noncardiogenic causes.22
Furosemide is one of the most commonly used loop diuretics.23 The current literature lacks a systematic review and meta‐analysis comparing the effectiveness of continuous infusion and intermittent bolus furosemide therapy among nonsurgical, hemodynamically stable, hospitalized patients with ADHF. In addition, several important randomized trials published in recent years comparing the effectiveness of the 2 routes of intravenous furosemide delivery warrant17, 2427 systematic review, because the last published meta‐analysis (by Salvador et al19) was in 2005.
We therefore conducted a systematic review and meta‐analysis of randomized controlled trials that compared the effects of continuous infusion and intermittent bolus of furosemide in patients hospitalized with ADHF.
METHODS
Study Selection
We searched the PubMed, EMBASE, and The Cochrane Central Register of Controlled Trials electronic databases systematically from their inception through March 2011 using the search terms lasix, furosemide, diuretic, congestive heart failure, infusion, and bolus. The electronic database search was supplemented by hand‐searching bibliographies of the retrieved articles. Two investigators independently reviewed all retrieved articles for their eligibility based on predefined criteria. Disagreement on study selection was resolved by mutual consensus and by the involvement of a third investigator. All selected studies were assessed for content validity.
We included both crossover and parallel‐arm randomized control trials. Studies were included if patients were randomized to intermittent bolus or continuous infusion of furosemide, and data were reported on 24‐hour urinary volume, total body weight loss, 24‐hour urinary sodium excretion, and duration of hospital stay. Randomized control trials that included patients with cardiogenic shock requiring concomitant vasopressor therapy, renal failure with or without hemodialysis, and loop diuretics other than furosemide were excluded. The primary authors of the included studies were contacted if the results of the selected outcomes either were not reported or required further clarification. A flow diagram was produced following guidelines from The Quality of Reporting of Meta‐analyses (QUOROM) group28 to provide information on randomized clinical trial identification for the final inclusion in the meta‐analysis.
Data Extraction
Data on study design, participant characteristics, methods, intervention, and selected outcomes were independently extracted by 2 investigators. Interobserver agreement for full study selection was calculated using an unweighted kappa statistic. A chi‐square test (2) and I2 statistic were used to report the percentage of variability in the effect estimates across studies.
Quality Assessment
The quality of included trials was assessed using a validated scale developed by Jadad et al29 that assigns a score from 0 to 5, with a higher score indicating higher quality. Two investigators independently evaluated studies on 3 parameters: randomization, blinding, and dropouts. The third investigator helped resolve discordant assessments. We assessed publication bias visually by examining the symmetry of funnel plots and statistically using Begg30 and Egger31 tests.
Data Synthesis and Analysis
For the reported outcomes, we recorded the mean difference between the groups and measures of dispersion. If a mean difference was not reported, we calculated point estimates by using the mean difference from baseline for each group. If a mean difference from baseline was not reported, we calculated point estimates using the baseline and final value for each group. If a measure of dispersion was not reported for the between‐group difference, we calculated it by using the sum of the variance for the mean difference from baseline in each group. If no measure of dispersion was reported for the mean difference from baseline for each group, we calculated variance by using the standard deviation of the baseline and final values, and assumed a correlation between the baseline and final values of 0.5.
Urinary volume was measured in milliliters per 24 hours per 100 mg furosemide to compare the diuretic effect between the 2 routes of intravenous administration. Total body weight loss was measured in kilograms. Urinary sodium was measured in millimoles per 24 hours, and duration of hospital stay was measured in days.
Weighted mean differences (WMDs) with 95% confidence intervals (CIs) were calculated for all prespecified outcomes using Review Manager (RevMan) Version 5.0. Copenhagen: The Nordic Cochrane Centre, The Cochrane Collaboration, 2008. We pooled results from individual studies using a random‐effects model. Statistical significance was set at P 0.05 using a 2‐tailed Z‐test. Sensitivity analyses were conducted by omitting one study at a time for all outcomes.
RESULTS
Study Selection
We identified 104 studies using the previously stated search terms. Following QUOROM guidelines, ten randomized clinical trials, enrolling a total of 564 patients, fulfilled the inclusion criteria (Figure 1). The interobserver agreement (unweighted kappa statistic) between investigators for study selection was 0.75.
Study Characteristics
The majority of patients were male (60%) with a mean age of 62.8 years (range 54 ‐ 74.1 years). The duration of follow‐up while on furosemide in both arms ranged from twelve hours24 to six days13 (Table 1). We found significant variability in dose, frequency, and duration of treatment across studies for both routes of intravenous furosemide administration (Table 2). Four of 10 studies were crossover trials13, 14, 18, 32 and the rest were parallel‐arm trials. Randomization to 1 of the 2 treatment groups was reported in all 4 crossover trials.
| Study | Study Design* | Total (N) | Mean Age (years) | Male (n) | Duration on Furosemide (days) | Country of Study | NYHA Class | Jadad Quality Score |
|---|---|---|---|---|---|---|---|---|
| ||||||||
| Aaser et al18 | CO | 8 | 54 | 6 | 2 | Norway | III‐IV | 1 |
| Allen et al17 | PA | 41 | 61 | 26 | 2 | USA | NR | 3 |
| Dormans et al13 | CO | 20 | 71 | 13 | 6 | Netherlands | III‐IV | 1 |
| Felker et al27 | PA | 308 | 66 | 226 | 3 | USA | NR | 4 |
| Lahav et al14 | CO | 9 | 74.1 | 5 | 4 | Israel | III‐IV | 1 |
| Mojtahedzadeh et al33 | PA | 22 | NR | NR | 1.5 | Iran | NR | 2 |
| Mojtahedzadeh et al24 | PA | 21 | 56.5 | 11 | 0.5 | Iran | NR | 2 |
| Ostermann et al26 | PA | 59 | 64 | 31 | 2 | UK/Canada | NR | 3 |
| Pivac et al32 | CO | 20 | 62.2 | 9 | 3 | Croatia | III | 1 |
| Thomson et al25 | PA | 56 | 56.4 | 32 | 3.54.6 | USA | III‐IV | 3 |
| Study | Furosemide Dose (Mean SD) | Additional Comments | |
|---|---|---|---|
| Intermittent Bolus | Continuous Infusion | ||
| |||
| Aaser et al18 | 145 80 mg bid | 145 80 mg/24 hr | Furosemide dose was same as usual daily oral dose |
| Allen et al17 | 162 48 mg bid | 162 52 mg/24 hr | Dose was determined by attending physician after enrollement |
| Dormans et al13 | Single bolus of continous dose | 690 mg/8 hr (2502000 mg) | Patients received additional single oral doses of furosemide on first and second day |
| Felker et al27 | 134 53 mg/day | 127 50 mg/day | Treatment was continued for up to 72 hours; at 48 hours, the treating physician had the option of adjusting the diurtetic dose on the basis of clinical response |
| Lahav et al14 | 3040 mg/8 hr | 6080 mg/24 hr | Continuous group received 3040 mg bolus furosemide as loading dose |
| Mojtahedzadeh et al33 | 320 mg/dose | 0.75 mg/kg/hr | All patients received 20 mg of furosemide as initial bolus in both arms |
| Mojtahedzadeh et al24 | 20 mg initial, then doubled every 3 hr* | 0.1 mg/kg/hr (total 250 mg) | Both regimens were titrated for a goal net fluid balance of at least 1 mL/kg/hr |
| Ostermann et al26 | 0.65.14/kg/dose | 0.40.6 mg/kg/hr | Predefined alogrithms aiming for minimum hourly urine output was used in both arms |
| Pivac et al32 | 40 mg bid | 40 mg bid | Goal was to increase urine output to at least 50% from baseline or a minimum of 1 mL/kg/hr |
| Thomson et al25 | 172 97 mg | 197 148 mg/day | The mean duration of study drug administration was shorter by approximately 1 day in the continous group |
Outcomes
Data on 24‐hour urinary volume were reported in all 10 studies. We found that the continuous infusion of furosemide was associated with a statistically significant increase in 24‐hour urinary output compared with intermittent bolus injections (WMD, 240.54 mL/24 hours/100 mg furosemide; 95% CI, 462.42 to 18.66; P = 0.03). There was evidence of statistically significant heterogeneity between the studies for the outcome of 24‐hour urinary volume (I2 = 89%; 2 = 93.11; P < 0.001) (Figure 2). The magnitude of statistical heterogeneity decreased (I2 = 53%; 2 = 19.11; P = 0.02) but remained significant after removing a study by Ostermann et al.26
Data on total body weight loss was reported in 3 parallel trials. Patients treated with a continuous infusion of furosemide had statistically greater changes in total body weight (WMD, 0.78 kg; 95% CI, 1.54 to 0.03; P = 0.04) when compared with patients receiving bolus injections of furosemide. Data for total body weight loss were collected at 72 hours of treatment in 2 trials17, 27 and was reported for the duration of the entire study by Thomson et al.25 There was no statistical evidence of heterogeneity between the studies for total body weight loss (I2 = 0 %; 2 = 0.66; P = 0.72) (Figure 3).
Data on 24‐hour urinary sodium excretion was reported for 57 patients in the 4 crossover studies. A continuous infusion of furosemide was associated with a statistically insignificant increase in 24‐hour urinary sodium (WMD, 20.26 mmol/24 hours; 95% CI, 60.48 to 19.96; P = 0.32). There was no statistical evidence of heterogeneity between studies for 24‐hour urinary sodium excretion (I2 = 0%; 2 = 2.76; P = 0.60) (Figure 2).
Duration of hospital stay was reported in 3 parallel trials. Patients receiving intermittent injections of bolus furosemide had longer hospital stays (WMD, 0.99 days; 95% CI, 2.08 to 4.06; P = 0.53), but this difference was not statistically significant. There was no evidence of heterogeneity between the studies for the duration of hospital stay (I2 = 64%; 2 = 5.51; P = 0.06) (Figure 3).
Risk of Bias and Sensitivity Analysis
Individual quality assessment scores based on a scoring system developed by Jadad et al29 for included trials are reported (Table 1). Randomization was reported by all studies, but the explicit methodology of randomization was defined in only 4 studies.17, 2527 Allocation concealment was defined in 1 study.26 Dropouts were reported in 4 studies.2426, 33 Adherence to intervention per study protocol was not reported in any of the selected studies. Three studies mentioned intention to treat.25, 26 Sensitivity analyses demonstrated that the direction of the mean estimates did not change for any of the 4 outcomes when individual studies were excluded.
DISCUSSION
Our meta‐analysis of 10 randomized, controlled clinical trials found that continuous infusion of furosemide results in significantly greater diuresis and reduction in total body weight than intermittent boluses in patients hospitalized with ADHF. No statistical differences were observed in urinary sodium excretion or the duration of hospital stay between the 2 routes of intravenous furosemide administration. The data on greater diuresis from the available clinical trials was widely heterogeneous that may limit the merits of assessment of greater diuresis between the 2 methods of intravenous furosemide administration. In addition, data on clinical outcomes such as rates of rehospitalization, cardiovascular, and all‐cause mortality were not reported in the studies selected for this meta‐analysis.
The mean effective dose of loop diuretics administered as intermittent boluses varies widely5 and quickly dissipates to a level that fails to block Na+ reabsorption in renal tubules.34 Additionally, the effectiveness of loop diuretics is limited by the rebound in sodium reabsorption during periods of subtherapeutic renal tubular concentration because of their short half‐life.4, 6, 35 It is possible that the ineffectiveness of subtherapeutic tubular filtrate levels of loop diuretics toward the end of a dosing interval when administered as a bolus is responsible for their unsustained diuretic effects. Bolus injections of furosemide have been associated with diuretic tolerance, reduced short‐term natriuresis, and a probable rise in plasma aldosterone levels in the settings of salt restriction.36 Data from physiological studies suggest that greater diuresis, which also results in weight loss with continuous infusion of loop diuretics, is due to the minimal variation in the mean effective dose of drug in the renal tubules.1216 By preventing subtherapeutic tubular dose concentrations, continuous infusion may limit rebound resorption helping to improve symptoms of ADHF.4
Our study has several limitations. First, we examined only surrogate endpoints. Second, we included crossover trials13, 14, 18, 32 in the analysis, and the variation in the washout periods of these trials may have affected the reported outcomes. The study by Aaser et al18 lacked a washout period because the authors were concerned for the hemodynamic stability of diuretic‐dependent ADHF patients. Lahav et al14 reported a washout period of 3 hours, while Dormans et al13 and Pivac et al32 did not report the duration of washout periods. Finally, we excluded studies that enrolled postsurgical patients and patients with pulmonary edema from noncardiac causes. As a result, the generalizability of our findings is limited to relatively stable ADHF patients hospitalized because of medical, dietary, or pharmacological noncompliance. We restricted our analysis to studies using furosemide therapy only. By excluding trials using loop diuretics other than furosemide and trials reporting concomitant use of vasopressors or hypertonic saline in the study population, we are confident in the assessment of the isolated effects of furosemide for either route of its intravenous administration in patients hospitalized with ADHF.
The continuous infusion of furosemide has been well tolerated in most instances.13, 2527, 32 Thomson et al25 found no difference on the incidence of significant hemodynamic changes or need for renal replacement therapy between the 2 groups. Similarly, Ostermann et al26 reported no significant differences in heart rate and mean arterial pressures changes from two treatment groups. In addition, Felker et al27 and Pivac et al32 found no differences in the proportion of serious adverse effects between the 2 routes of intravenous furosemide administration.
In the absence of information on clinical endpoints such as rehospitalization, all‐cause mortality, and cardiovascular mortality, this meta‐analysis could not settle the issue to provide definitive recommendations for treatment guidelines to use either route of intravenous furosemide in ADHF patients. However, it is important to note that despite different study populations, our finding of greater diuresis with continuous infusion of furosemide is consistent with results reported by Salvador et al.19 Given the higher prevalence, mortality, and significant cost related with ADHF management in the United States, we support the use of furosemide as a continuous infusion to ensure limited but established benefits, such as greater diuresis and reduction in total body weight,. This approach seems reasonable, especially when the safety profiles between the 2 treatment groups are not different.2527, 32 However, the benefits on surrogate outcomes cannot be overstressed due to lack of information on the cost‐effectiveness of furosemide or other loop diuretics administered as a continuous infusion.
CONCLUSIONS
We report a systematic review and meta‐analysis comparing the effectiveness of 2 routes of intravenous furosemide administration in patients with ADHF. We found that continuous infusion of furosemide results in greater diuresis and greater reduction in total body weight. With the exception of greater diuresis, available data are homogenous for the reported outcomes in this meta‐analysis. Due to lack of information on clinical endpoints and cost‐effectiveness from currently available data, robust recommendations for clinical practice guidelines cannot be made at this time. Randomized controlled trials measuring hard clinical endpoints in larger patient populations may add stronger evidence to settle this issue in future. Further studies comparing cost‐effectiveness related with continuous infusion of furosemide may provide critical information to establish it as the preferred route over intermittent bolus injection in clinical practice.
- ,,, et al.Heart disease and stroke statistics 2009 update: a report from the American Heart Association Statistics Committee and Stroke Statistics Subcommittee.Circulation.2009;119:e21–e181.
- National Heart, Lung, and Blood Institute. What Is Heart Failure? Available at: http://www.nhlbi.nih.gov/health/health‐topics/topics/hf/. Accessed March 6,2011.
- ,,. Hospital Stays for Circulatory Diseases, 2004. Healthcare Cost and Utilization Project Statistical Brief No. 26. Rockville, MD: Agency for Healthcare Research and Quality; February 2007. Available at: http://www.hcup‐us.ahrq.gov/reports/statbriefs/sb26.jsp. Accessed February 22,2010.
- ,,, et al.2009 focused update: ACCF/AHA Guidelines for the Diagnosis and Management of Heart Failure in Adults: a report of the American College of Cardiology Foundation/American Heart Association Task Force on Practice Guidelines: developed in collaboration with the International Society for Heart and Lung Transplantation.Circulation.2009;119:1977–2016.
- ,,,.Determinants of response to furosemide in normal subjects.Br J Clin Pharmacol.1977;4:121–127.
- .Diuretic therapy.N Engl J Med.1998;339:387–395.
- ,,,,.Diuretics and risk of arrhythmic death in patients with left ventricular dysfunction.Circulation.1999;100:1311–1315.
- ,,, et al.Increased toxicity of high dose furosemide versus low‐dose dopamine in the treatment of refractory congestive heart failure.Clin Pharmacol Ther.1997;62:187–193.
- ,,, et al.Relationship between heart failure treatment and development of worsening renal function among hospitalized patients.Am Heart J.2004;147:331–338.
- ,,,.Haemodynamic and hormone responses to acute and chronic furosemide therapy in congestive heart failure.Clin Sci.1980;59:443–449.
- ,,,,.Untreated heart failure: clinical and neuroendocrine effects of introducing diuretics.Br Heart J.1987;57:17–22.
- ,,.The time course of delivery of furosemide into urine: an independent determinant of overall response.Kidney Int.1982;22:69–74.
- ,,,,,.Diuretic efficacy of high dose furosemide in severe heart failure: bolus injection versus continuous infusion.J Am Coll Cardiol.1996;28:376–382.
- ,,,.Intermittent administration of furosemide vs continuous infusion preceded by a loading dose for congestive heart failure.Chest.1992;102:725–731.
- ,,,,.Diuresis with continuous infusion of furosemide after cardiac surgery.Am J Surg.1983;146:796.
- ,,,.Continuous infusion of furosemide in refractory edema.BMJ.1978;2:476.
- ,,,,,.Continuous versus bolus dosing of furosemide for patients hospitalized for heart failure.Am J Cardiol.2010;105:1794–1797.
- ,,, et al.Effect of bolus injection versus continuous infusion of furosemide on diuresis and neurohormonal activation in patients with severe congestive heart failure.Scand J Clin Lab Invest.1997;57:361–367.
- ,,,.Continuous infusion versus bolus injection of loop diuretics in congestive heart failure.Cochrane Database Syst Rev.2005;(3):CD003178.
- ,,, et al.Pharmacodynamics of torsemide administered as an intravenous injection and as a continuous infusion to patients with congestive heart failure.J Clin Pharmacol.1996;36:265–270.
- ,,, et al.Effects of high‐dose furosemide and small‐volume hypertonic saline solution infusion in comparison with a high dose of furosemide as bolus in refractory congestive heart failure: long‐term effects.Am Heart J.2003;145:459–466.
- ,,.Protocol‐ guided diuretic management: comparison of furosemide by continuous infusion and intermittent bolus.Crit Care Med.1997;25:1969–1975.
- Cardiovascular Pharmacology Concepts. Diuretics. Available at: http://www.cvpharmacology.com/diuretic/diuretics.htm. Accessed July 22,2010.
- ,,, et al.The relationship between pharmacokinetics variables and pharmacodynamics profiles of bolus versus continuous infusion of furosemide in critically ill patients.J Infus Nurs.2005;13:127–132.
- ,,,,,.Continuous versus intermittent infusion of furosemide in acute decompensated heart failure.J Card Fail.2010;16:188–193.
- ,,,.Frusemide administration in critically ill patients by continuous compared to bolus therapy.Nephron Clin Pract.2007;107:c70–c76.
- ,,, et al;NHLBI Heart Failure Clinical Research Network. Diuretic strategies in patients with acute decompensated heart failure.N Engl J Med.2011;364:797–805.
- ,,,,,.Improving the quality of reports of meta‐analyses of randomised controlled trials: the QUOROM statement. Quality of Reporting of Meta‐analyses.Lancet.1999;354:1896–1900.
- ,,, et al.Assessing the quality of reports of randomized clinical trials: is blinding necessary?Control Clin Trials.1996;17:1–12.
- ,.Operating characteristics of a rank correlation test for publication bias.Biometrics.1994;50:1088–1101.
- ,,,.Bias in meta‐analysis detected by a simple, graphical test.BMJ.1997;315:629–634.
- ,,, et al.Diuretic effects of furosemide infusion versus bolus injection in congestive heart failure.Int J Clin Pharmacol Res.1998;18:121–128.
- ,,, et al.Comparison of hemodynamic and biochemical effects of furosemide by continuous infusion and intermittent bolus in critically ill patients.Infus Nurs.2004;27:255–261.
- .Diuretic resistance: mechanisms and therapeutic strategies.Cardiology.1994;84(suppl 2):57–67.
- ,.Loop diuretics: from the Na‐K‐2Cl transporter to clinical use.Am J Physiol Renal Physiol.2003;284:F11–F21.
- ,,, et al.Response to furosemide. I. Effects of salt intake and renal compensation.J Lab Clin Med.1983;102:450–458.