User login
Effect of Hospital Readmission Reduction Program on Hospital Readmissions and Mortality Rates
Chronic obstructive pulmonary disease (COPD) is recognized as the third leading cause of death nationally. Globally, it has been estimated that 10% of the population has COPD; in the United States, approximately 15 million people are affected.1,2 The annual estimated cost of COPD management in the United States is approximately $50 billion, one-third of which is directly related to inpatient hospitalization for COPD exacerbation.3,4,5 The 30-day readmission rate after hospitalization for acute exacerbation of COPD (AECOPD) is approximately 21% with an approximate cost of $13 billion per year.6,7 To reduce the cost and to improve patient outcomes, the Centers for Medicare and Medicaid Services (CMS) has designed several interventions with little effect.8
In October 2012, the Affordable Care Act added section 1886(q) to the Social Security Act and established the Hospital Readmission Reduction Program (HRRP), an initiative to decrease hospitalization costs by penalizing hospitals with high 30-day readmission rates. Under this program, hospitals received up to 3% penalty for excess readmissions after the index hospitalization with acute myocardial infarction (AMI), heart failure (HF), and pneumonia.9-11 Hospitals are penalized if their annual readmission rates are significantly above the average national readmission rate. In 2014, the HRRP was extended to include AECOPD for the FY 2015.
Since the implementation of readmission penalties, data have shown a significant decrease in the 30-day readmission rates for all conditions.12,13 On the other hand, studies have suggested that, at least for some conditions, the decrease in the 30-day readmission rate is associated with higher adverse patients outcomes, including higher mortality.14,15 However, whether a decrease in readmission rates after an AECOPD hospitalization is associated with a concomitant increase in mortality has not been examined. Therefore, our objective was to examine the association of the 30-day risk-adjusted hospital readmission rate with the 30-day risk-adjusted hospital mortality rate for patients discharged with a diagnosis of AECOPD.
METHOD
Data Sources
Publicly available data from three sources were used. The all-cause 30-day risk-standardized readmission rate (RSRR) and the 30-day risk-standardized mortality rate (RSMR) of each hospital for patients with AECOPD were obtained from the Hospital Compare database; a database maintained by the CMS.16,17 In 2014, the CMS started reporting three-year running average of 30-day mortality and readmission rate data on hospitals for AECOPD hospitalizations; the data start date was July 2010.18-22 We examined data from the FY 2010-2013 to 2014-2017 cycles on readmission and mortality reported by the CMS; this included data before and after the implementation of penalties.
Hospital characteristics were also obtained from the CMS website. Hospital ownership was defined as government (owned by Federal or state), for-profit (owned by physicians or another proprietary), or nonprofit (owned by a nonprofit organization such as a church). A hospital was considered as a teaching hospital if it obtained graduate medical education funding from the CMS.
Data on local population characteristics according to ZIP codes were obtained from the 2010 decennial census and the American Community Survey five-year (2009-2013) data files available at the United States Census Bureau website.23 For each ZIP code, we obtained data on the total population, percentage of African Americans in the population, median income, poverty level, and insurance status.
We used Hospital service area (HSA) information obtained from the Dartmouth Atlas of Health Care crosswalk files to link local population characteristics to hospitals. The Dartmouth Atlas defined 3,436 HSAs by assigning the ZIP codes to the hospital area where the greatest proportion of their Medicare residents was hospitalized.24,25
Hospital Compare data and Census Bureau population data were matched to the HSAs from the Dartmouth Atlas of Healthcare data at the ZIP code level. First, the ZIP code-level data from the Census Bureau were pooled by the HSAs obtained from the Dartmouth Atlas of Healthcare, followed by matching these data by the HSAs to the Hospital Compare data. Merging data from these three sources generated a dataset that contained information about readmission and mortality rates from a particular hospital and the population characteristics of the local healthcare market or neighborhood. Our final dataset included hospitals that had readmission and mortality information available at the Hospital Compare website and were included in the crosswalk files of the Dartmouth Atlas of Healthcare.
Statistical Analysis
Data are summarized as mean and standard deviation (SD), median with interquartile range, or frequencies as appropriate. To model the dependence of observations from the same hospital over time, we used mixed linear models with random intercept and slope. A strength of this modeling approach is that it incorporates information from all hospitals even when some hospitals are missing data for some time periods. We reached our final model through stages with increasing model complexity at each stage. In the first stage, we developed an empty model without any covariates to determine the unconditional variance components so that we can partition mortality variance into between- and within-hospital components. In the second stage, we developed an unconditional growth curve model to determine the shape of time trend in mortality over time using linear and quadratic (by including squared time in the model) growth curves. In the third stage, we added baseline readmission rates (from 2010 to 2013) to the model to determine the effect of baseline readmission rate on mortality trends and also examined its interaction with time and squared time. We generated a change in the readmission rate variable by subtracting the last readmission rate from the baseline readmission rate (readmission rate in 2010-2013 − readmission rate in 2014-2017). In the fourth stage, we included this change in readmission rate into the third-stage model to examine how changes in the readmission rate affected the time trends of mortality and also examined its interaction with time and squared time. In the final model, we included the following potential confounding variables to the fourth stage model: African American percentage in the HSA, HSA median income, percentage of people living in poverty in the HSA, median age, ownership of hospital (government, for profit), teaching status (teaching vs nonteaching), and acute care hospital beds in the HSA. Within each stage, the models were compared using the Akaike information criterion (AIC) and the Bayesian information criterion (BIC), and the model with the lowest value of each was moved to the next stage of model development. All analyses were performed in Stata 14.1 for Windows (College Station, Texas).
RESULTS
Of the 3,685 acute care hospitals analyzed in the 2010-2013 data cycle for COPD, the 30-day RSRR was 20.7% (1.28), which decreased to 19.6% (1.11) in 2014-2017 (Table 1). During the same period, the 30-day all-cause RSMR increased from 7.8% (1.03) in 2010-2013 to 8.4% (1.11) in 2014-2017. The partitioning of variance showed that 57% of variation in the mortality rate over the study period was due to between-hospital differences.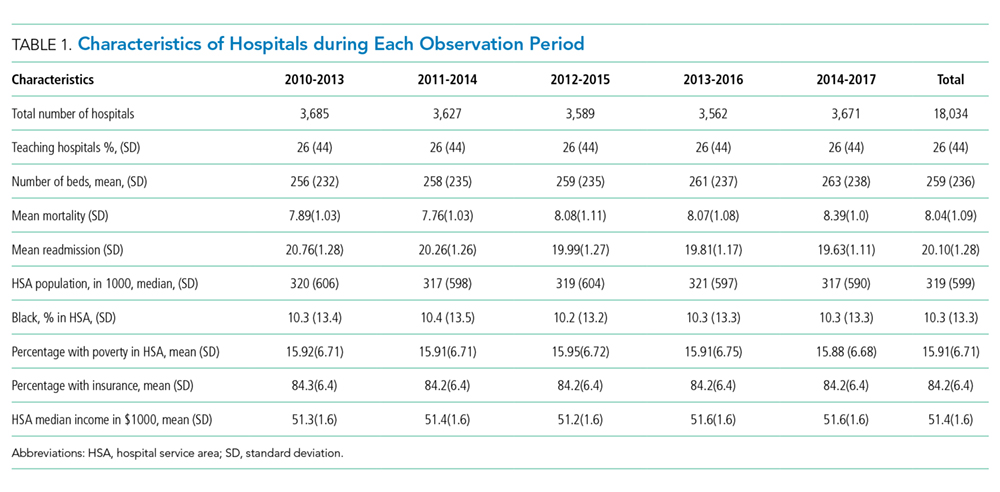
The unconditional growth model examining the linear time trend revealed a 0.13% per year (95% CI = 0.12 to 0.14; P < .0001) increase in mortality rate over the five data cycles. When the squared time variable was added to the model to examine a quadratic trend, both time and squared trend were statistically significant (Table 2) and the AIC and BIC were lower for the quadratic model. Thus, the unconditional growth curve model suggested that the mortality trend was nonlinear and the coefficients demonstrated that not only the mortality rate increased, but the rate of change in the mortality rate was also increasing during the study period.
When we added the baseline readmission rate to the abovementioned quadratic growth model, we found an inverse association; each 1% increase in baseline readmission rate was associated with 0.03% (95% CI = −0.05 to −0.005; P = .02) decrease in mortality rate. These findings suggest that hospitals with higher baseline readmission rates also had lower mortality rates. To examine whether the effect of baseline readmission rate on mortality varied over time, we included the interaction term with time in the model and then added the interaction term with squared time. As the AIC and BIC were the lowest for the model with interaction between time and baseline readmission (and not when interaction between squared time and baseline readmission were included), we accepted this model. In this model, although there was no difference in mortality according to readmissions at baseline, each 1% increase in baseline readmission rate was associated with a smaller increase in mortality rate by 0.015% (95% CI = −0.02 to −0.01; P < .0001; Table 2 and Figure 1). These findings suggest that hospitals with higher readmission rates at baseline had a smaller increase in mortality rate during the study period than those with lower readmission rates.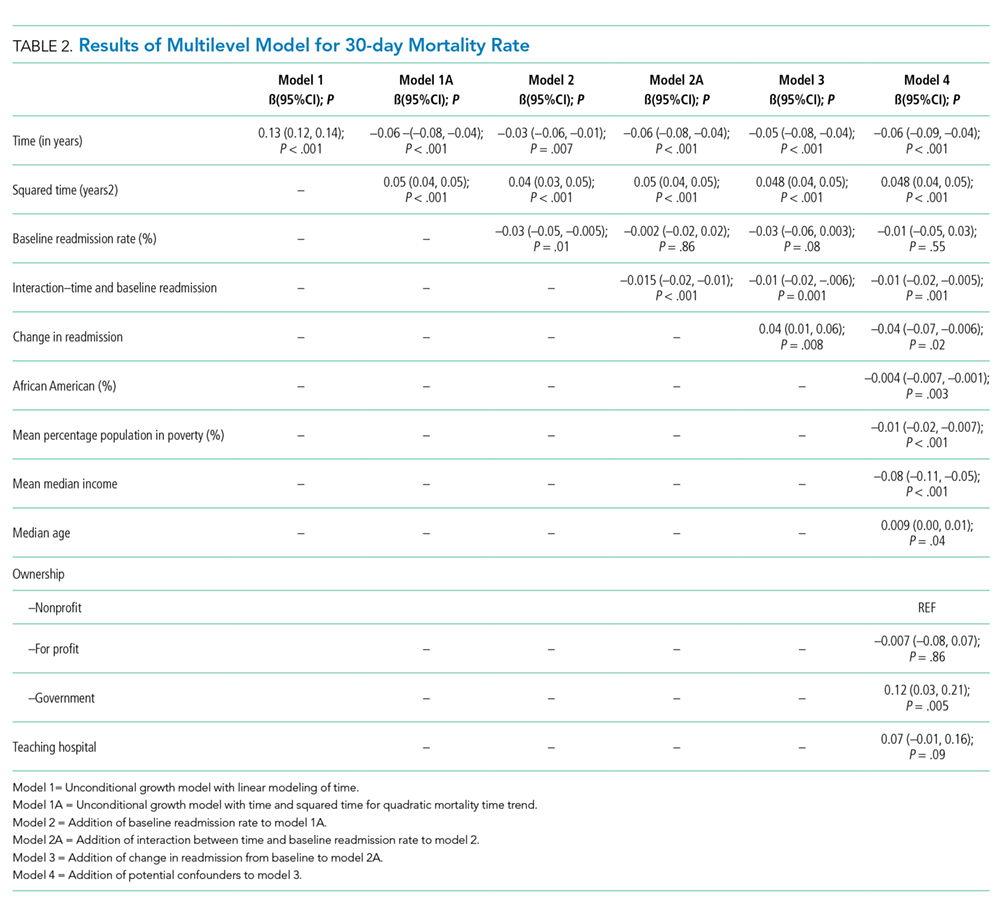
Inclusion of change in the readmissions variable in the model showed that each 1% decrease in readmission rate during the study period was associated with 0.04% (95% CI = 0.01 to 0.06; P = .008) increase in mortality. However, the interaction between change in readmission and time was not significant and the AIC and BIC of the model were higher than the model without interaction. Therefore, we retained the model without the interaction term and included other potential confounding variables to build our final model. Thus, although hospitals with different baseline readmission rates had different rates of change in mortality rate, the change in readmission rate had a consistent effect on the mortality rate. Including potential confounders in the model did not change the results; the mortality rate and the change in the mortality rate increased during the study period, a high baseline readmission rate was associated with a lower yearly increase in mortality, and a larger decrease in readmission rate was associated with a higher mortality rate (Table 2).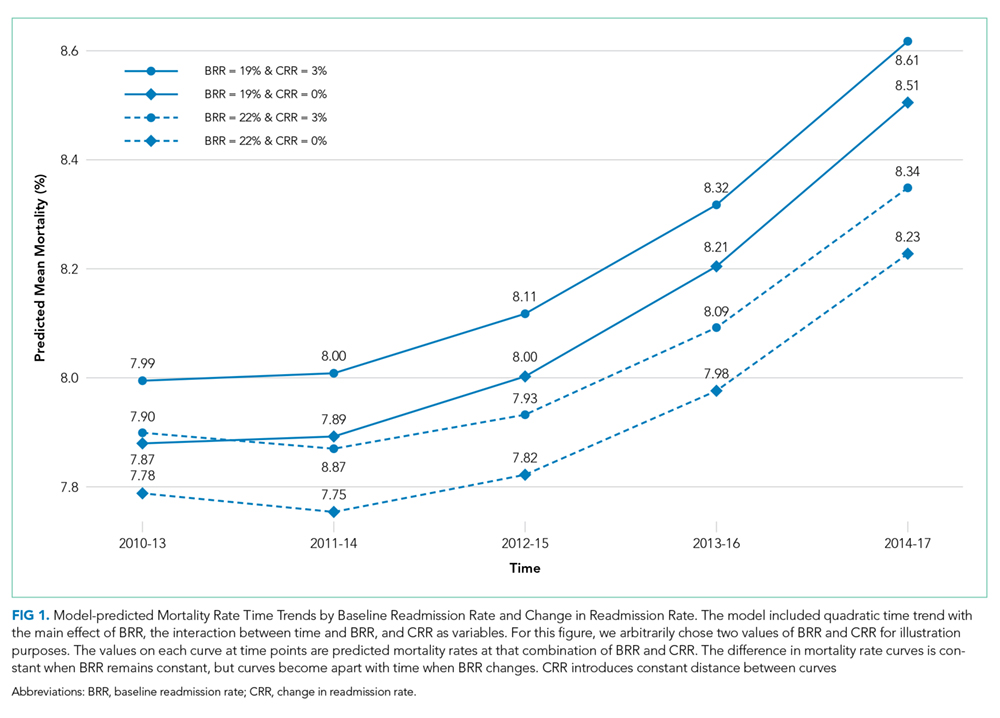
DISCUSSION
As efforts to decrease readmission rates continue as a part of the HRRP implementation by the CMS, our study shows that among hospitals that discharged patients with AECOPD during 2010-2017, the all-cause 30-day RSRR was decreased, whereas the all-cause 30-day RSMR was increased. Of particular concern is that the rate of increase in mortality also increased. We also found that hospitals with higher readmission rates in 2010-2013 had a lower rate of increase in mortality than hospitals with lower readmission rates. In addition, hospitals that had a larger decrease in readmission rates during the study period had a larger rate of increase in mortality than hospitals with a smaller decrease in readmission rates. Our findings were robust to potential confounders such as hospital characteristics and local population characteristics in which hospitals operate.
Our study findings raise the question whether the implementation of the HRRP resulted in unintentional patient harm by forcing hospitals to make changes that may affect overall patient care. This question is particularly important as other studies on hospitalized patients with HF have found similar results.13,14 On the other hand, a similar association between readmission and mortality rates has not been observed in patients with pneumonia or AMI.14 Several possible explanations can be given for the observed discrepancy between the diseases and their effect on the relationship between readmission rate and mortality rate. Both COPD and HF are chronic diseases and characterized by exacerbations, whereas AMI and pneumonia are episodic diseases that are treatable. As the number of patients hospitalized with AECOPD and HF is much larger, hospitals may have a greater focus on reducing the 30-day readmission rates and may attempt to game the process, such as by delaying admissions through the emergency department within the 30-day period or by admitting patients for observation. In fact, a study found a 3% reduction in the within-hospital readmission rate with a concurrent 0.8% increase in observation unit use since the implementation of the HRRP.26 Such approaches to patient care may lead to adverse outcomes.
It is possible that readmissions and mortality act as competing risks and hence hospitals with higher mortality rates are left with fewer patients and thus have fewer readmissions, whereas those with lower mortality rates have more patients and a higher readmission rate.27 Such studies are not possible with hospital-level data, and patient-level studies will be required to examine this competing risk hypothesis. Our study results provide some support to the competing risk hypothesis (hospitals with lower baseline readmission rates had a steeper increase in mortality); however, it is not possible to draw any conclusions due to the high risk of ecological fallacy bias.
This study has important potential implications for healthcare policy, public health, and research. We found that an important national intervention aimed at decreasing readmission rates and improving the quality of care for patients with AECOPD may be associated with higher mortality rates in these patients. There may be a need to redefine measures for determining the performance of an institution. Our study supports research into the underlying mechanisms resulting in an inverse association between readmissions and mortality. In particular, health policy researchers may need to examine how incentives and penalties affect the allocation of resources within hospitals.
This study has several strengths and some potential weaknesses. We used a national dataset to examine readmission and mortality rates that include the majority of hospitals in the United States. We also included data from the local population for each hospital, thus allowing us to examine hospital performance within the context of its target population. One potential limitation is that we used hospital-level data and not patient-level data; however, the readmission penalties are designed for hospitals, which justifies our use of hospital-level data. Furthermore, data were not available for shorter time intervals; data from shorter time intervals may be associated with greater variability. Being an observational study, it is difficult to establish a causal relationship; the longitudinal nature of the study does establish temporality, an important factor in establishing causality.
In conclusion, we found that although the readmission rates decreased, there was an increase in the mortality rate within the 30 days of discharge from the hospital in patients with AECOPD. The rate of increase in mortality was higher in hospitals with lower readmission rates than in hospitals with higher readmission rates. Further research for determining the mechanism responsible for this association is needed. Future health policy interventions may need to consider the potential for adverse outcomes.
1. Murphy SL, Xu J, Kochanek KD. Deaths: final data for 2010. Natl Vital Stat Rep. 2013;61(4):1-117.
2. Halbert RJ, Natoli JL, Gano A, et al. Global burden of copd: systematic review and meta-analysis. Eur Respir J. 2006;28(3):523-532. https://doi.org/10.1183/09031936.06.00124605.
3. Toy EL, Gallagher KF, Stanley EL, Swensen AR, Duh MS. The economic impact of exacerbations of chronic obstructive pulmonary disease and exacerbation definition: a review. COPD. 2010;7(3):214-228. https://doi.org/10.3109/15412555.2010.481697.
4. Shah T, Churpek MM, Coca Perraillon M, Konetzka RT. Understanding why patients with COPD get readmitted: a large national study to delineate the Medicare population for the readmissions penalty expansion. Chest. 2015;147(5):1219-1226. https://doi.org/10.1378/chest.14-2181.
5. Jencks SF, Williams MV, Coleman EA. Rehospitalizations among patients in the Medicare fee-for-service program. N Engl J Med. 2009;360(14):1418-1428. https://doi.org/10.1056/NEJMsa0803563.
6. Stein BD, Charbeneau JT, Lee TA, et al. Hospitalizations for acute exacerbations of chronic obstructive pulmonary disease: how you count matters. COPD. 2010;7(3):164-171. https://doi.org/10.3109/15412555.2010.481696.
7. Stein, B. D., Charbeneau, J. T., Lee, T. A., Schumock, G. T., Lindenauer, P. K., Bautista, A., . . . Krishnan, J. A. (2010). Hospitalizations for acute exacerbations of chronic obstructive pulmonary disease: how you count matters. COPD, 7(3), 164-171. doi:10.3109/15412555.2010.481696
8. McIlvennan CK, Eapen ZJ, Allen LA. Hospital readmissions reduction program. Circulation. 2015;131(20):1796-1803. https://doi.org/10.1161/CIRCULATIONAHA.114.010270.
9. McIlvennan CK, Eapen ZJ, Allen LA. Hospital readmissions reduction program. Circulation. 2015;131(20):179-1803. https://doi.org/10.1161/CIRCULATIONAHA.114.010270.
10. Centers for Medicare and Medicaid Services (CMS), HHS. Medicare Program; hospital inpatient prospective payment systems for acute care hospitals and the long-term care hospital prospective payment system and FY 2012 rates; Hospitals’ FTE Resident Caps for Graduate Medical Education Payment. Final Rules. Fed Regist. 2011;76(160):51476-51846.
11. Centers for Medicare and Medicaid Services (CMS). Medicare program; hospital inpatient prospective payment systems for acute care hospitals and the long-term care hospital prospective payment system and fiscal year 2014 rates; quality reporting requirements for specific providers; hospital conditions of participation; payment policies related to patient status. Final rules. Fed Regist. 2013;78(160):50495-51040.
12. Casillas G. Published: Mar 10 and 2017, “aiming for fewer hospital U-turns: the Medicare Hospital readmission reduction program,” [blog]. https://www.kff.org/medicare/issue-brief/aiming-for-fewer-hospital-u-turns-the-medicare-hospital-readmission-reduction-program/; Accessed March 10, 2017. The Henry J. Kaiser Family Foundation.
13. Desai NR, Ross JS, Kwon JY, et al. Association Between hospital penalty status Under the hospital readmission reduction program and readmission rates for target and nontarget conditions. JAMA. 2016;316(24): 2647-2656. https://doi.org/10.1001/jama.2016.18533.
14. Gupta A, Allen LA, Bhatt DL, et al. Association of the hospital readmissions reduction program implementation with readmission and mortality outcomes in heart failure. JAMA Cardiol. 2018;3(1):44-53. https://doi.org/10.1001/jamacardio.2017.4265.
15. Krumholz HM, Lin Z, Keenan PS, et al. Relationship between hospital readmission and mortality rates for patients hospitalized with acute myocardial infarction, heart failure, or pneumonia. JAMA. 2013;309(6):587-593. https://doi.org/10.1001/jama.2013.333.
16. Medicare Hospital compare overview,” https://www.medicare.gov/hospitalcompare/About/What-Is-HOS.html; Accessed April 17, 2019.
17. Archived datasets. Data.Medicare.Gov. Data.Medicare.Gov. Accessed April 17, 2019. https://data.medicare.gov/data/archives/hospital-compare.
18. Krumholz HM, Lin Z, Drye EE, et al. An administrative claims measure suitable for profiling hospital performance based on 30-day all-cause readmission rates among patients with acute myocardial infarction. Circ Cardiovasc Qual Outcomes. 2011;4(2):243-252. https://doi.org/10.1161/CIRCOUTCOMES.110.957498.
19. Bratzler DW, Normand SL, Wang Y, et al. An administrative claims model for profiling hospital 30-day mortality rates for pneumonia patients. PLOS ONE. 2011;6(4):e17401. https://doi.org/10.1371/journal.pone.0017401.
20. Centers for Medicare, Medicaid Services. Security Boulevard Baltimore, and Md21244 USA, “OutcomeMeasures,”. https://www.cms.gov/Medicare/Quality-Initiatives-Patient-Assessment-Instruments/HospitalQualityInits/OutcomeMeasures.html 7500; Accessed October 13, 2017.
21. Centers for Medicare and Medicaid Services (CMS), HHS. Medicare Program; Hospital Inpatient Prospective Payment Systems for Acute Care Hospitals and the Long-Term Care Hospital Prospective Payment System and Fiscal Year 2014 Rates; Quality Reporting Requirements for Specific Providers; Hospital Conditions of Participation; Payment Policies Related to Patient Status. Final Rules.”
22. Feemster LC, Au DH. Penalizing hospitals for chronic obstructive pulmonary disease readmissions. Am J Respir Crit Care Med. 2014;189(6):634-639. https://doi.org/10.1164/rccm.201308-1541PP.
23. United States Census Bureau. Census.Gov. Accessed April 17, 2019. https://www.census.gov/en.html.
24. Dartmouth atlas data,”. https://atlasdata.dartmouth.edu/. Aaccessed April 17, 2019.
25. Home. Dartmouth Atlas Healthc. https://www.dartmouthatlas.org/. Accessed April 17, 2019.
26. Zuckerman RB, Sheingold SH, Orav EJ, Ruhter J, Epstein AM. Readmissions, observation, and the hospital readmissions reduction program. N Engl J Med. 2016;374(16):1543-1551. https://doi.org/10.1056/NEJMsa1513024.
27. Gorodeski EZ, Starling RC, Blackstone EH. Are All Readmissions Bad Readmissions?, letter. World. 2010. https://doi.org/10.1056/NEJMc1001882.
Chronic obstructive pulmonary disease (COPD) is recognized as the third leading cause of death nationally. Globally, it has been estimated that 10% of the population has COPD; in the United States, approximately 15 million people are affected.1,2 The annual estimated cost of COPD management in the United States is approximately $50 billion, one-third of which is directly related to inpatient hospitalization for COPD exacerbation.3,4,5 The 30-day readmission rate after hospitalization for acute exacerbation of COPD (AECOPD) is approximately 21% with an approximate cost of $13 billion per year.6,7 To reduce the cost and to improve patient outcomes, the Centers for Medicare and Medicaid Services (CMS) has designed several interventions with little effect.8
In October 2012, the Affordable Care Act added section 1886(q) to the Social Security Act and established the Hospital Readmission Reduction Program (HRRP), an initiative to decrease hospitalization costs by penalizing hospitals with high 30-day readmission rates. Under this program, hospitals received up to 3% penalty for excess readmissions after the index hospitalization with acute myocardial infarction (AMI), heart failure (HF), and pneumonia.9-11 Hospitals are penalized if their annual readmission rates are significantly above the average national readmission rate. In 2014, the HRRP was extended to include AECOPD for the FY 2015.
Since the implementation of readmission penalties, data have shown a significant decrease in the 30-day readmission rates for all conditions.12,13 On the other hand, studies have suggested that, at least for some conditions, the decrease in the 30-day readmission rate is associated with higher adverse patients outcomes, including higher mortality.14,15 However, whether a decrease in readmission rates after an AECOPD hospitalization is associated with a concomitant increase in mortality has not been examined. Therefore, our objective was to examine the association of the 30-day risk-adjusted hospital readmission rate with the 30-day risk-adjusted hospital mortality rate for patients discharged with a diagnosis of AECOPD.
METHOD
Data Sources
Publicly available data from three sources were used. The all-cause 30-day risk-standardized readmission rate (RSRR) and the 30-day risk-standardized mortality rate (RSMR) of each hospital for patients with AECOPD were obtained from the Hospital Compare database; a database maintained by the CMS.16,17 In 2014, the CMS started reporting three-year running average of 30-day mortality and readmission rate data on hospitals for AECOPD hospitalizations; the data start date was July 2010.18-22 We examined data from the FY 2010-2013 to 2014-2017 cycles on readmission and mortality reported by the CMS; this included data before and after the implementation of penalties.
Hospital characteristics were also obtained from the CMS website. Hospital ownership was defined as government (owned by Federal or state), for-profit (owned by physicians or another proprietary), or nonprofit (owned by a nonprofit organization such as a church). A hospital was considered as a teaching hospital if it obtained graduate medical education funding from the CMS.
Data on local population characteristics according to ZIP codes were obtained from the 2010 decennial census and the American Community Survey five-year (2009-2013) data files available at the United States Census Bureau website.23 For each ZIP code, we obtained data on the total population, percentage of African Americans in the population, median income, poverty level, and insurance status.
We used Hospital service area (HSA) information obtained from the Dartmouth Atlas of Health Care crosswalk files to link local population characteristics to hospitals. The Dartmouth Atlas defined 3,436 HSAs by assigning the ZIP codes to the hospital area where the greatest proportion of their Medicare residents was hospitalized.24,25
Hospital Compare data and Census Bureau population data were matched to the HSAs from the Dartmouth Atlas of Healthcare data at the ZIP code level. First, the ZIP code-level data from the Census Bureau were pooled by the HSAs obtained from the Dartmouth Atlas of Healthcare, followed by matching these data by the HSAs to the Hospital Compare data. Merging data from these three sources generated a dataset that contained information about readmission and mortality rates from a particular hospital and the population characteristics of the local healthcare market or neighborhood. Our final dataset included hospitals that had readmission and mortality information available at the Hospital Compare website and were included in the crosswalk files of the Dartmouth Atlas of Healthcare.
Statistical Analysis
Data are summarized as mean and standard deviation (SD), median with interquartile range, or frequencies as appropriate. To model the dependence of observations from the same hospital over time, we used mixed linear models with random intercept and slope. A strength of this modeling approach is that it incorporates information from all hospitals even when some hospitals are missing data for some time periods. We reached our final model through stages with increasing model complexity at each stage. In the first stage, we developed an empty model without any covariates to determine the unconditional variance components so that we can partition mortality variance into between- and within-hospital components. In the second stage, we developed an unconditional growth curve model to determine the shape of time trend in mortality over time using linear and quadratic (by including squared time in the model) growth curves. In the third stage, we added baseline readmission rates (from 2010 to 2013) to the model to determine the effect of baseline readmission rate on mortality trends and also examined its interaction with time and squared time. We generated a change in the readmission rate variable by subtracting the last readmission rate from the baseline readmission rate (readmission rate in 2010-2013 − readmission rate in 2014-2017). In the fourth stage, we included this change in readmission rate into the third-stage model to examine how changes in the readmission rate affected the time trends of mortality and also examined its interaction with time and squared time. In the final model, we included the following potential confounding variables to the fourth stage model: African American percentage in the HSA, HSA median income, percentage of people living in poverty in the HSA, median age, ownership of hospital (government, for profit), teaching status (teaching vs nonteaching), and acute care hospital beds in the HSA. Within each stage, the models were compared using the Akaike information criterion (AIC) and the Bayesian information criterion (BIC), and the model with the lowest value of each was moved to the next stage of model development. All analyses were performed in Stata 14.1 for Windows (College Station, Texas).
RESULTS
Of the 3,685 acute care hospitals analyzed in the 2010-2013 data cycle for COPD, the 30-day RSRR was 20.7% (1.28), which decreased to 19.6% (1.11) in 2014-2017 (Table 1). During the same period, the 30-day all-cause RSMR increased from 7.8% (1.03) in 2010-2013 to 8.4% (1.11) in 2014-2017. The partitioning of variance showed that 57% of variation in the mortality rate over the study period was due to between-hospital differences.
The unconditional growth model examining the linear time trend revealed a 0.13% per year (95% CI = 0.12 to 0.14; P < .0001) increase in mortality rate over the five data cycles. When the squared time variable was added to the model to examine a quadratic trend, both time and squared trend were statistically significant (Table 2) and the AIC and BIC were lower for the quadratic model. Thus, the unconditional growth curve model suggested that the mortality trend was nonlinear and the coefficients demonstrated that not only the mortality rate increased, but the rate of change in the mortality rate was also increasing during the study period.
When we added the baseline readmission rate to the abovementioned quadratic growth model, we found an inverse association; each 1% increase in baseline readmission rate was associated with 0.03% (95% CI = −0.05 to −0.005; P = .02) decrease in mortality rate. These findings suggest that hospitals with higher baseline readmission rates also had lower mortality rates. To examine whether the effect of baseline readmission rate on mortality varied over time, we included the interaction term with time in the model and then added the interaction term with squared time. As the AIC and BIC were the lowest for the model with interaction between time and baseline readmission (and not when interaction between squared time and baseline readmission were included), we accepted this model. In this model, although there was no difference in mortality according to readmissions at baseline, each 1% increase in baseline readmission rate was associated with a smaller increase in mortality rate by 0.015% (95% CI = −0.02 to −0.01; P < .0001; Table 2 and Figure 1). These findings suggest that hospitals with higher readmission rates at baseline had a smaller increase in mortality rate during the study period than those with lower readmission rates.
Inclusion of change in the readmissions variable in the model showed that each 1% decrease in readmission rate during the study period was associated with 0.04% (95% CI = 0.01 to 0.06; P = .008) increase in mortality. However, the interaction between change in readmission and time was not significant and the AIC and BIC of the model were higher than the model without interaction. Therefore, we retained the model without the interaction term and included other potential confounding variables to build our final model. Thus, although hospitals with different baseline readmission rates had different rates of change in mortality rate, the change in readmission rate had a consistent effect on the mortality rate. Including potential confounders in the model did not change the results; the mortality rate and the change in the mortality rate increased during the study period, a high baseline readmission rate was associated with a lower yearly increase in mortality, and a larger decrease in readmission rate was associated with a higher mortality rate (Table 2).
DISCUSSION
As efforts to decrease readmission rates continue as a part of the HRRP implementation by the CMS, our study shows that among hospitals that discharged patients with AECOPD during 2010-2017, the all-cause 30-day RSRR was decreased, whereas the all-cause 30-day RSMR was increased. Of particular concern is that the rate of increase in mortality also increased. We also found that hospitals with higher readmission rates in 2010-2013 had a lower rate of increase in mortality than hospitals with lower readmission rates. In addition, hospitals that had a larger decrease in readmission rates during the study period had a larger rate of increase in mortality than hospitals with a smaller decrease in readmission rates. Our findings were robust to potential confounders such as hospital characteristics and local population characteristics in which hospitals operate.
Our study findings raise the question whether the implementation of the HRRP resulted in unintentional patient harm by forcing hospitals to make changes that may affect overall patient care. This question is particularly important as other studies on hospitalized patients with HF have found similar results.13,14 On the other hand, a similar association between readmission and mortality rates has not been observed in patients with pneumonia or AMI.14 Several possible explanations can be given for the observed discrepancy between the diseases and their effect on the relationship between readmission rate and mortality rate. Both COPD and HF are chronic diseases and characterized by exacerbations, whereas AMI and pneumonia are episodic diseases that are treatable. As the number of patients hospitalized with AECOPD and HF is much larger, hospitals may have a greater focus on reducing the 30-day readmission rates and may attempt to game the process, such as by delaying admissions through the emergency department within the 30-day period or by admitting patients for observation. In fact, a study found a 3% reduction in the within-hospital readmission rate with a concurrent 0.8% increase in observation unit use since the implementation of the HRRP.26 Such approaches to patient care may lead to adverse outcomes.
It is possible that readmissions and mortality act as competing risks and hence hospitals with higher mortality rates are left with fewer patients and thus have fewer readmissions, whereas those with lower mortality rates have more patients and a higher readmission rate.27 Such studies are not possible with hospital-level data, and patient-level studies will be required to examine this competing risk hypothesis. Our study results provide some support to the competing risk hypothesis (hospitals with lower baseline readmission rates had a steeper increase in mortality); however, it is not possible to draw any conclusions due to the high risk of ecological fallacy bias.
This study has important potential implications for healthcare policy, public health, and research. We found that an important national intervention aimed at decreasing readmission rates and improving the quality of care for patients with AECOPD may be associated with higher mortality rates in these patients. There may be a need to redefine measures for determining the performance of an institution. Our study supports research into the underlying mechanisms resulting in an inverse association between readmissions and mortality. In particular, health policy researchers may need to examine how incentives and penalties affect the allocation of resources within hospitals.
This study has several strengths and some potential weaknesses. We used a national dataset to examine readmission and mortality rates that include the majority of hospitals in the United States. We also included data from the local population for each hospital, thus allowing us to examine hospital performance within the context of its target population. One potential limitation is that we used hospital-level data and not patient-level data; however, the readmission penalties are designed for hospitals, which justifies our use of hospital-level data. Furthermore, data were not available for shorter time intervals; data from shorter time intervals may be associated with greater variability. Being an observational study, it is difficult to establish a causal relationship; the longitudinal nature of the study does establish temporality, an important factor in establishing causality.
In conclusion, we found that although the readmission rates decreased, there was an increase in the mortality rate within the 30 days of discharge from the hospital in patients with AECOPD. The rate of increase in mortality was higher in hospitals with lower readmission rates than in hospitals with higher readmission rates. Further research for determining the mechanism responsible for this association is needed. Future health policy interventions may need to consider the potential for adverse outcomes.
1. Murphy SL, Xu J, Kochanek KD. Deaths: final data for 2010. Natl Vital Stat Rep. 2013;61(4):1-117.
2. Halbert RJ, Natoli JL, Gano A, et al. Global burden of copd: systematic review and meta-analysis. Eur Respir J. 2006;28(3):523-532. https://doi.org/10.1183/09031936.06.00124605.
3. Toy EL, Gallagher KF, Stanley EL, Swensen AR, Duh MS. The economic impact of exacerbations of chronic obstructive pulmonary disease and exacerbation definition: a review. COPD. 2010;7(3):214-228. https://doi.org/10.3109/15412555.2010.481697.
4. Shah T, Churpek MM, Coca Perraillon M, Konetzka RT. Understanding why patients with COPD get readmitted: a large national study to delineate the Medicare population for the readmissions penalty expansion. Chest. 2015;147(5):1219-1226. https://doi.org/10.1378/chest.14-2181.
5. Jencks SF, Williams MV, Coleman EA. Rehospitalizations among patients in the Medicare fee-for-service program. N Engl J Med. 2009;360(14):1418-1428. https://doi.org/10.1056/NEJMsa0803563.
6. Stein BD, Charbeneau JT, Lee TA, et al. Hospitalizations for acute exacerbations of chronic obstructive pulmonary disease: how you count matters. COPD. 2010;7(3):164-171. https://doi.org/10.3109/15412555.2010.481696.
7. Stein, B. D., Charbeneau, J. T., Lee, T. A., Schumock, G. T., Lindenauer, P. K., Bautista, A., . . . Krishnan, J. A. (2010). Hospitalizations for acute exacerbations of chronic obstructive pulmonary disease: how you count matters. COPD, 7(3), 164-171. doi:10.3109/15412555.2010.481696
8. McIlvennan CK, Eapen ZJ, Allen LA. Hospital readmissions reduction program. Circulation. 2015;131(20):1796-1803. https://doi.org/10.1161/CIRCULATIONAHA.114.010270.
9. McIlvennan CK, Eapen ZJ, Allen LA. Hospital readmissions reduction program. Circulation. 2015;131(20):179-1803. https://doi.org/10.1161/CIRCULATIONAHA.114.010270.
10. Centers for Medicare and Medicaid Services (CMS), HHS. Medicare Program; hospital inpatient prospective payment systems for acute care hospitals and the long-term care hospital prospective payment system and FY 2012 rates; Hospitals’ FTE Resident Caps for Graduate Medical Education Payment. Final Rules. Fed Regist. 2011;76(160):51476-51846.
11. Centers for Medicare and Medicaid Services (CMS). Medicare program; hospital inpatient prospective payment systems for acute care hospitals and the long-term care hospital prospective payment system and fiscal year 2014 rates; quality reporting requirements for specific providers; hospital conditions of participation; payment policies related to patient status. Final rules. Fed Regist. 2013;78(160):50495-51040.
12. Casillas G. Published: Mar 10 and 2017, “aiming for fewer hospital U-turns: the Medicare Hospital readmission reduction program,” [blog]. https://www.kff.org/medicare/issue-brief/aiming-for-fewer-hospital-u-turns-the-medicare-hospital-readmission-reduction-program/; Accessed March 10, 2017. The Henry J. Kaiser Family Foundation.
13. Desai NR, Ross JS, Kwon JY, et al. Association Between hospital penalty status Under the hospital readmission reduction program and readmission rates for target and nontarget conditions. JAMA. 2016;316(24): 2647-2656. https://doi.org/10.1001/jama.2016.18533.
14. Gupta A, Allen LA, Bhatt DL, et al. Association of the hospital readmissions reduction program implementation with readmission and mortality outcomes in heart failure. JAMA Cardiol. 2018;3(1):44-53. https://doi.org/10.1001/jamacardio.2017.4265.
15. Krumholz HM, Lin Z, Keenan PS, et al. Relationship between hospital readmission and mortality rates for patients hospitalized with acute myocardial infarction, heart failure, or pneumonia. JAMA. 2013;309(6):587-593. https://doi.org/10.1001/jama.2013.333.
16. Medicare Hospital compare overview,” https://www.medicare.gov/hospitalcompare/About/What-Is-HOS.html; Accessed April 17, 2019.
17. Archived datasets. Data.Medicare.Gov. Data.Medicare.Gov. Accessed April 17, 2019. https://data.medicare.gov/data/archives/hospital-compare.
18. Krumholz HM, Lin Z, Drye EE, et al. An administrative claims measure suitable for profiling hospital performance based on 30-day all-cause readmission rates among patients with acute myocardial infarction. Circ Cardiovasc Qual Outcomes. 2011;4(2):243-252. https://doi.org/10.1161/CIRCOUTCOMES.110.957498.
19. Bratzler DW, Normand SL, Wang Y, et al. An administrative claims model for profiling hospital 30-day mortality rates for pneumonia patients. PLOS ONE. 2011;6(4):e17401. https://doi.org/10.1371/journal.pone.0017401.
20. Centers for Medicare, Medicaid Services. Security Boulevard Baltimore, and Md21244 USA, “OutcomeMeasures,”. https://www.cms.gov/Medicare/Quality-Initiatives-Patient-Assessment-Instruments/HospitalQualityInits/OutcomeMeasures.html 7500; Accessed October 13, 2017.
21. Centers for Medicare and Medicaid Services (CMS), HHS. Medicare Program; Hospital Inpatient Prospective Payment Systems for Acute Care Hospitals and the Long-Term Care Hospital Prospective Payment System and Fiscal Year 2014 Rates; Quality Reporting Requirements for Specific Providers; Hospital Conditions of Participation; Payment Policies Related to Patient Status. Final Rules.”
22. Feemster LC, Au DH. Penalizing hospitals for chronic obstructive pulmonary disease readmissions. Am J Respir Crit Care Med. 2014;189(6):634-639. https://doi.org/10.1164/rccm.201308-1541PP.
23. United States Census Bureau. Census.Gov. Accessed April 17, 2019. https://www.census.gov/en.html.
24. Dartmouth atlas data,”. https://atlasdata.dartmouth.edu/. Aaccessed April 17, 2019.
25. Home. Dartmouth Atlas Healthc. https://www.dartmouthatlas.org/. Accessed April 17, 2019.
26. Zuckerman RB, Sheingold SH, Orav EJ, Ruhter J, Epstein AM. Readmissions, observation, and the hospital readmissions reduction program. N Engl J Med. 2016;374(16):1543-1551. https://doi.org/10.1056/NEJMsa1513024.
27. Gorodeski EZ, Starling RC, Blackstone EH. Are All Readmissions Bad Readmissions?, letter. World. 2010. https://doi.org/10.1056/NEJMc1001882.
© 2019 Society of Hospital Medicine