Inpatient antimicrobial utilization measures are associated with antimicrobial stewardship activities and facility characteristics of Veterans Affairs medical centers
BACKGROUND: Antimicrobial stewardship programs (ASPs) have been advocated to improve antimicrobial utilization, but program implementation is variable.
OBJECTIVE: To determine associations of ASPs with facility characteristics and inpatient antimicrobial utilization measures in the Veterans Affairs (VA) system in 2012.
DESIGN: In 2012, the VA administered a survey on antimicrobial stewardship practices to designated ASP contacts at VA acute-care hospitals. From the survey, we identified 34 variables across three domains (evidence, organizational context, and facilitation) that were assessed, using multivariable LASSO (least absolute shrinkage and selection operator) regression, against four antimicrobial utilization measures: aggregate acute care antimicrobial use, antimicrobial use in patients with noninfectious primary discharge diagnoses, missed opportunities to convert from parenteral to oral antimicrobial therapy, and double anaerobic coverage.
SETTING: All 130 VA facilities with acute care services.
RESULTS: Variables associated with at least three favorable changes in antimicrobial utilization included presence of postgraduate physician/pharmacy training programs, number of antimicrobial-specific order sets, frequency of systematic de-escalation review, presence of pharmacists and/or infectious diseases (ID) attendings on acute care ward teams, and formal ID training of the lead ASP pharmacist. Variables associated with two unfavorable measures included bed size, the level of engagement with VA Antimicrobial Stewardship Task Force online resources, and utilization of antimicrobial stop orders.
CONCLUSIONS: Formalization of ASP processes and presence of pharmacy and ID expertise are associated with favorable utilization. Systematic de-escalation review and order set establishment may be high-yield interventions.
Also in JHM
High prevalence of inappropriate benzodiazepine and sedative hypnotic prescriptions among hospitalized older adults
AUTHORS: Elisabeth Anna Pek, MD, Andrew Remfry, MD, Ciara Pendrith, MSc, Chris Fan-Lun, BScPhm, R. Sacha Bhatia, MD, and Christine Soong, MD, MSc, SFHM
Incidence, predictors, and outcomes of hospital-acquired anemia
AUTHORS: Anil N. Makam, MD, MAS, Oanh K. Nguyen, MD, MAS, Christopher Clark, MPA, and Ethan A. Halm, MD, MPH
Association between radiologic incidental findings and resource utilization in patients admitted with chest pain in an urban medical center
AUTHORS: Venkat P. Gundareddy, MD, MPH, SFHM, Nisa M. Maruthur, MD, MHS, Abednego Chibungu, MD, Preetam Bollampally, MD, Regina Landis, MS, abd Shaker M. Eid, MD, MBA
Clinical utility of routine CBC testing in patients with community-acquired pneumonia
AUTHORS: Neelaysh Vukkadala, BS, and Andrew Auerbach, MD, MPH, SFHM
Overuse of troponin? A comprehensive evaluation of testing in a large hospital system
Inpatient antimicrobial utilization measures are associated with antimicrobial stewardship activities and facility characteristics of Veterans Affairs medical centers
Inpatient antimicrobial utilization measures are associated with antimicrobial stewardship activities and facility characteristics of Veterans Affairs medical centers
BACKGROUND: Antimicrobial stewardship programs (ASPs) have been advocated to improve antimicrobial utilization, but program implementation is variable.
OBJECTIVE: To determine associations of ASPs with facility characteristics and inpatient antimicrobial utilization measures in the Veterans Affairs (VA) system in 2012.
DESIGN: In 2012, the VA administered a survey on antimicrobial stewardship practices to designated ASP contacts at VA acute-care hospitals. From the survey, we identified 34 variables across three domains (evidence, organizational context, and facilitation) that were assessed, using multivariable LASSO (least absolute shrinkage and selection operator) regression, against four antimicrobial utilization measures: aggregate acute care antimicrobial use, antimicrobial use in patients with noninfectious primary discharge diagnoses, missed opportunities to convert from parenteral to oral antimicrobial therapy, and double anaerobic coverage.
SETTING: All 130 VA facilities with acute care services.
RESULTS: Variables associated with at least three favorable changes in antimicrobial utilization included presence of postgraduate physician/pharmacy training programs, number of antimicrobial-specific order sets, frequency of systematic de-escalation review, presence of pharmacists and/or infectious diseases (ID) attendings on acute care ward teams, and formal ID training of the lead ASP pharmacist. Variables associated with two unfavorable measures included bed size, the level of engagement with VA Antimicrobial Stewardship Task Force online resources, and utilization of antimicrobial stop orders.
CONCLUSIONS: Formalization of ASP processes and presence of pharmacy and ID expertise are associated with favorable utilization. Systematic de-escalation review and order set establishment may be high-yield interventions.
Also in JHM
High prevalence of inappropriate benzodiazepine and sedative hypnotic prescriptions among hospitalized older adults
AUTHORS: Elisabeth Anna Pek, MD, Andrew Remfry, MD, Ciara Pendrith, MSc, Chris Fan-Lun, BScPhm, R. Sacha Bhatia, MD, and Christine Soong, MD, MSc, SFHM
Incidence, predictors, and outcomes of hospital-acquired anemia
AUTHORS: Anil N. Makam, MD, MAS, Oanh K. Nguyen, MD, MAS, Christopher Clark, MPA, and Ethan A. Halm, MD, MPH
Association between radiologic incidental findings and resource utilization in patients admitted with chest pain in an urban medical center
AUTHORS: Venkat P. Gundareddy, MD, MPH, SFHM, Nisa M. Maruthur, MD, MHS, Abednego Chibungu, MD, Preetam Bollampally, MD, Regina Landis, MS, abd Shaker M. Eid, MD, MBA
Clinical utility of routine CBC testing in patients with community-acquired pneumonia
AUTHORS: Neelaysh Vukkadala, BS, and Andrew Auerbach, MD, MPH, SFHM
Overuse of troponin? A comprehensive evaluation of testing in a large hospital system
Association of inpatient antimicrobial utilization measures with antimicrobial stewardship activities and facility characteristics of Veterans Affairs medical centers
The deleterious impact of inappropriate and/or excessive antimicrobial usage is well recognized. In the United States, the Centers for Disease Control and Prevention (CDC) estimates that at least 2 million people become infected with antimicrobial-resistant bacteria with 23,000 subsequent deaths and at least $1 billion in excess medical costs per year.1
In response, many healthcare organizations have developed antimicrobial stewardship programs (ASPs). Guidelines co-sponsored by the Infectious Diseases Society of America and the Society for Healthcare Epidemiology of America, as well as recent statements from the CDC and the Transatlantic Taskforce on Antimicrobial Resistance,all recommend core ASP elements.2-5 The guidelines provide general recommendations on ASP structure, strategies, and activities. The recommended ASP structure is a team of physicians and pharmacists that collaborates with facility governing committees and other stakeholders to optimize antimicrobial use. While personnel with expertise in infectious diseases (ID) often lead ASPs, hospitalists are also recognized as key contributors, especially in quality improvement.6,7 Recommended strategies include prospective audit of antimicrobial use with intervention and feedback and formulary restriction with preauthorization. Recommended activities include education, creation of guidelines, clinical pathways, and order forms, and programs to promote de-escalation and conversion from parenteral (IV) to oral (PO) antimicrobial therapy. However, limited evidence exists regarding the effectiveness of these ASP core elements.8,9 While Cochrane reviews found clear evidence that particular stewardship strategies (eg, audit and feedback, formulary restriction, guidelines implemented with or without feedback, protocols, computerized decision support) can be effective in reducing antimicrobial usage and improving clinical outcomes over the long term, little evidence exists favoring 1 strategy over another.8 Furthermore, most individual studies of ASPs are single-center, making their conclusions less generalizable.
In 2012, the VA National Antimicrobial Stewardship Task Force (ASTF), in conjunction with the VA Healthcare Analysis and Information Group (HAIG) administered a survey on the characteristics of ASPs at all 130 acute care VA facilities (Appendix A). We used these survey results to build an implementation model and then assess associations between facility-level variables and 4 antimicrobial utilization measures.
METHODS
Survey and Data
In 2011, the ASTF was chartered to develop, deploy, and monitor a strategic plan for optimizing antimicrobial therapy management. Monthly educational webinars and sample policies were offered to all facilities, including a sample business plan for stewardship and policies to encourage de-escalation from broad-spectrum antimicrobials, promote conversion from parenteral to oral antimicrobial therapy, avoid unnecessary double anaerobic coverage, and mitigate unnecessary antimicrobial usage in the context of Clostridium difficile infection.10
At the time that ASTF was chartered, the understanding of how ASP structures across VA facilities operated was limited. Hence, to capture baseline institutional characteristics and stewardship activities, ASTF and HAIG developed an inventory assessment of ASPs that was distributed online in November 2012. All 130 VA facilities providing inpatient acute care services responded.
We derived 57 facility characteristics relevant to antimicrobial utilization and conducted a series of factor analyses to simplify the complex dataset, and identify underlying latent constructs. We categorized resulting factors into domains of evidence, context, or facilitation as guided by the Promoting Action on Research Implementation in Health Services framework.11 Briefly, the evidence domain describes how the facility uses codified and noncodified sources of knowledge (eg, research evidence, clinical experience). Organizational context comprises a facility’s characteristics that ensure a more conducive environment to put evidence into practice (eg, supportive leadership, organizational structure, evaluative systems). Facilitation emphasizes a facility personnel’s “state of preparedness” and receptivity to implementation.
Using factor analysis to identify facility factors as correlates of the outcomes, we first examined polychoric correlations among facility characteristics to assess multicollinearity. We performed independent component analysis to create latent constructs of variables that were defined by factor loadings (that indicated the proportion of variance accounted for by the construct) and uniqueness factors (that determined how well the variables were interpreted by the construct). Factors retained included variables that had uniqueness values of less than 0.7 and factor loadings greater than 0.3. Those associated with uniqueness values greater than 0.7 were left as single items, as were characteristics deemed a priori to be particularly important to antimicrobial stewardship. Factor scales that had only 2 items were converted into indices, while factor scores were generated for those factors that contained 3 or more items.12-15
Data for facility-level antimicrobial utilization measures were obtained from the VA Corporate Data Warehouse from calendar year 2012. The analysis was conducted within the VA Informatics and Computing Infrastructure. All study procedures were approved by the VA Central Institutional Review Board.
Measures
Four utilization measures were defined as dependent measures: overall antimicrobial use; antimicrobial use in patients with non-infectious discharge diagnoses; missed opportunities to convert from parenteral to oral antimicrobial therapy; and missed opportunities to avoid double anaerobic coverage with metronidazole.
Overall antimicrobial use was defined as total acute care (ie, medical/surgical/intensive care) antibacterial use for each facility aggregated as per CDC National Healthcare Safety Network Antimicrobial Use Option guidelines (antimicrobial days per 1000 patient days present). A subanalysis of overall antimicrobial use was restricted to antimicrobial use among patients without an infection-related discharge diagnosis, as we surmised that this measure may capture a greater proportion of potentially unnecessary antimicrobial use. International Classification of Diseases, Ninth Revision, Clinical Modification (ICD-9-CM)16 codes for infectious processes were identified by a combination of those classified previously in the literature,17 and those identified by finding the descendants of all infections named in the Systematized Nomenclature of Medicine--Clinical Terms.18 Next, all remaining codes for principal discharge diagnoses for which antimicrobials were administered were reviewed for potential indications for systemic antibacterial use. Discharges were considered noninfectious if no codes were identified when systemic antimicrobials were or could be indicated. For this measure, antimicrobial days were not counted if administered on or 1 day after the calendar day of surgery warranting antimicrobial prophylaxis.
Missed opportunities for conversion from parenteral to oral (IV to PO) formulations of highly bioavailable oral antimicrobials (ciprofloxacin, levofloxacin, moxifloxacin, azithromycin, clindamycin, linezolid, metronidazole, and fluconazole) were defined as the percentage of days of unnecessary IV therapy that were given when PO therapy could have been used among patients who were not in intensive care units at the time of antimicrobial administration who were receiving other oral medications, using previously described methodology.19Missed opportunities for avoiding redundant anaerobic coverage with metronidazole were defined as the percentage of days in which patients receiving metronidazole also receivedantibiotics with activity against anaerobic bacteria, specifically beta-lactam/beta-lactamase inhibitors, carbapenems, cefotetan/cefoxitin, clindamycin, moxifloxacin, or tigecycline), using previously described methodology.20 Patients for whom C. difficile testing was either ordered or positive within the prior 28 days (indicating potential clinical concern for C. difficile infection) were excluded from this endpoint.
Analysis
The variables derived above were entered into a multivariable model for each of the 4 antimicrobial utilization measures. The least absolute shrinkage and selection operator (LASSO) regression was used to determine significant associations between variables and individual utilization measures.21 LASSO was chosen because it offers advantages over traditional subset selection approaches in large multivariable analyses by assessing covariates simultaneously rather than sequentially, supporting prediction rather than estimation of effect.22P values were not reported as they are not useful in determining statistical significance in this methodology. A tuning parameter of 0.025 was determined for the model based on a cross-validation approach. Significant variables remaining in the model were reported with the percent change in each utilization measure per unit change in the variable of interest. For binary factors, percent change was reported according to whether the variable was present or not. For ordinal variables, percent change was reported according to incremental increase in ordinal score. For continuous variables or variables represented by factor or index scores, percent change was reported per each 25% increase in the range of the score.
RESULTS
Inpatient Facility Antimicrobial Stewardship Characteristics and Antimicrobial Utilization
Frequencies of key facility characteristics that contributed to variable development are included in Table 1. Full survey results across all facilities are included in Appendix B. Factor analysis reduced the total number of variables to 32; however, we also included hospital size and VA complexity score. Thus, 34 variables were evaluated for association with antimicrobial utilization measures: 4 in the evidence domain, 23 in the context domain, and 7 in the facilitation domain (Table 2).
Table 1
Table 1 (continued)
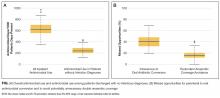
Median facility antimicrobial use was 619 antimicrobial days per 1000 days present (interquartile range [IQR], 554-700; overall range, 346-974). Median facility noninfectious antimicrobial use was 236 per 1000 days present (IQR, 200-286). Missed opportunities for conversion from IV to PO antimicrobial therapy were common, with a median facility value of 40.4% (391/969) of potentially eligible days of therapy (IQR, 32.2-47.8%). Missed opportunities to avoid double anaerobic coverage were less common (median 15.3% (186/1214) of potentially eligible days of therapy (IQR, 11.8%-20.2%; Figure).
Overall Antimicrobial Use
Four variables were associated with decreased overall antimicrobial use, although with small magnitude of change: presence of postgraduate physician/pharmacy training programs (0.03% decrease per quarter increase in factor score; on the order of 0.2 antimicrobial days per 1000 patient days present), presence of pharmacists and/or ID attendings on general medicine ward teams (0.02% decrease per quarter increase in index score), frequency of systematic de-escalation review (0.01% decrease per ordinal increase in score), and degree of involvement of ID physicians and/or fellows in antimicrobial approvals (0.007% decrease per quarter increase in index score). No variables were associated with increased overall antimicrobial use.
Table 2
Table 2 (continued)
Antimicrobial Use among Discharges without Infectious Diagnoses
Six variables were associated with decreased antimicrobial use in patients without infectious discharge diagnoses, while 4 variables were associated with increased use. Variables associated with the greatest magnitude of decreased use included facility educational programs for prudent antimicrobial use (1.8% on the order of 4 antimicrobial days per 1000 patient days present), frequency of systematic de-escalation review (1.5% per incremental increase in score), and whether a facility’s lead antimicrobial stewardship pharmacist had ID training (1.3%). Also significantly associated with decreased use was a factor summarizing the presence of 4 condition-specific stewardship processes (de-escalation policies, policies for addressing antimicrobial use in the context of C. difficile infection, blood culture review, and automatic ID consults for certain conditions) (0.6% per quarter increase in factor score range), the extent to which postgraduate physician/pharmacy training programs were present (0.6% per quarter increase in factor score range), and the number of electronic antimicrobial-specific order sets present (0.4% per order set). The variables associated with increased use of antimicrobials included the presence of antimicrobial stop orders (4.6%), the degree to which non-ID physicians were involved in antimicrobial approvals (0.7% per increase in ordinal score), the level engagement with ASTF online resources (0.6% per quarter increase in factor score range), and hospital size (0.6% per 50-bed increase).
Figure
Missed Opportunities for Parenteral to Oral Antimicrobial Conversion
Missed opportunities for IV to PO antimicrobial conversion had the largest number of significant associations with organizational variables: 14 variables were associated with fewer missed opportunities, while 5 were associated with greater missed opportunities. Variables associated with the largest reductions in missed opportunities for IV to PO conversion included having guidelines for antimicrobial duration (12.8%), participating in regional stewardship collaboratives (8.1%), number of antimicrobial-specific order sets (6.0% per order set), ID training of the ASP pharmacist (4.9%), and VA facility complexity designation (4.2% per quarter increase in score indicating greater complexity).23 Variables associated with more missed opportunities included stop orders (11.7%), overall perceived receptiveness to antimicrobial stewardship among clinical services (9.4%), the degree of engagement with ASTF online resources (6.9% per quarter increase in factor score range), educational programs for prudent antimicrobial use (4.1%), and hospital size (1.0% per 50-bed increase).
Missed Opportunities for Avoidance of Double Anaerobic Coverage
Four variables were associated with more avoidance of double anaerobic coverage: ID training of the lead ASP pharmacist (8.8%), presence of pharmacists and/or ID attendings on acute care ward teams (6.2% per quarter increase in index score), degree of ID pharmacist involvement in antimicrobial approvals, ranging from not at all (score=0) to both weekdays and nights/weekends (score=2; 4.3% per ordinal increase), and the number of antimicrobial-specific order sets (1.5% per order set). No variables were associated with less avoidance of double anaerobic coverage.
Variables Associated with Multiple Favorable or Unfavorable Antimicrobial Utilization Measures
To better assess the consistency of the relationship between organizational variables and measures of antimicrobial use, we tabulated variables that were associated with at least 3 potentially favorable (ie, reduced overall or noninfectious antimicrobial use or fewer missed opportunities) measures. Altogether, 5 variables satisfied this criterion: the presence of postgraduate physician/pharmacy training programs, the number of antimicrobial-specific order sets, frequency of systematic de-escalation review, the presence of pharmacists and/or ID attendings on acute care ward teams, and formal ID training of the lead ASP pharmacist (Table 3). Three other variables were associated with at least 2 unfavorable measures: hospital size, the degree to which the facility engaged with ASTF online resources, and presence of antimicrobial stop orders.
Table 3
DISCUSSION
Variability in ASP implementation across VA allowed us to assess the relationship between ASP and facility elements and baseline patterns of antimicrobial utilization. Hospitalists and hospital policy-makers are becoming more and more engaged in inpatient antimicrobial stewardship. While our results suggest that having pharmacists and/or physicians with formal ID training participate in everyday inpatient activities can favorably improve antimicrobial utilization, considerable input into stewardship can be made by hospitalists and policy makers. In particular, based on this work, the highest yield from an organizational standpoint may be in working to develop order sets within the electronic medical record and systematic efforts to promote de-escalation of broad-spectrum therapy, as well as encouraging hospital administration to devote specific physician and pharmacy salary support to stewardship efforts.
While we noted that finding the ASTF online resources helpful was associated with potentially unfavorable antimicrobial utilization, we speculate that this may represent reverse causality due to facilities recognizing that their antimicrobial usage is suboptimal and thus seeking out sample ASTF policies to implement. The association between the presence of automatic stop orders and potentially unfavorable antimicrobial utilization is less clear since the timeframe was not specified in the survey; it may be that setting stop orders too far in advance may promote an environment in which critical thinking about antimicrobial de-escalation is not encouraged or timely. The larger magnitude of association between ASP characteristics and antimicrobial usage among patients without infectious discharge diagnoses versus overall antimicrobial usage also suggests that clinical situations where infection was of low enough suspicion to not even have the providers eventually list an infectious diagnosis on their discharge summaries may be particularly malleable to ASP interventions, though further exploration is needed in determining how useful this utilization measure may be as a marker for inappropriate antimicrobial use.
Our results complement those of Pakyz et al.24 who surveyed 44 academic medical facilities in March 2013 to develop an ASP intensity score and correlate this score and its specific components to overall and targeted antimicrobial use. This study found that the overall ASP intensity score was not significantly associated with total or targeted antimicrobial use. However, ASP strategies were more associated with decreased total and targeted antimicrobial use than were specific ASP resources. In particular, the presence of a preauthorization strategy was associated with decreased targeted antimicrobial use. Our particular findings that order set establishment and de-escalation efforts are associated with multiple antibiotic outcomes also line up with the findings of Schuts et al,who performed a meta-analysis of the effects of meeting antimicrobial stewardship objectives and found that achieving guideline concordance (such as through establishment of order sets) and successfully de-escalating antimicrobial therapy was associated with reduced mortality.25,26 This meta-analysis, however, was limited by low rigor of its studies and potential for reverse causality. While our study has the advantages of capturing an entire national network of 130 acute care facilities with a 100% response rate, it, too, is limited by a number of issues, most notably by the fact that the survey was not specifically designed for the analysis of antimicrobial utilization measures, patient-level risk stratification was not available, the VA population does not reflect the U.S. population at-large, recall bias, and that antimicrobial prescribing and stewardship practices have evolved in VA since 2012. Furthermore, all of the antimicrobial utilization measures studied are imperfect at capturing inappropriate antibiotic use; in particular, our reliance on principal ICD-9 codes for noninfectious outcomes requires prospective validation. Many survey questions were subjective and subject to misinterpretation; other unmeasured confounders may also be present. Causality cannot be inferred from association. Nevertheless, our findings support many core indicators for hospital ASP recommended by the CDC and the Transatlantic Taskforce on Antimicrobial Resistance,3,4 most notably, having personnel with ID training involved in stewardship and establishing a formal procedure for ASP review for the appropriateness of an antimicrobial at or after 48 hours from the initial order.
In summary, the VA has made efforts to advance the practice of antimicrobial stewardship system-wide, including a 2014 directive that all VA facilities have an ASP,27 since the 2012 HAIG assessment reported considerable variability in antimicrobial utilization and antimicrobial stewardship activities. Our study identifies areas of stewardship that may correlate with, positively or negatively, antimicrobial utilization measures that will require further investigation. A repeat and more detailed antimicrobial stewardship survey was recently completed and will help VA gauge ongoing effects of ASTF activities. We hope to re-evaluate our model with newer data when available.
Acknowledgments
The authors wish to thank Michael Fletcher, Jaime Lopez, and Catherine Loc-Carrillo for their administrative and organizational support of the project and Allison Kelly, MD, for her pivotal role in survey development and distribution. This work was supported by the VA Health Services Research and Development Service Collaborative Research to Enhance and Advance Transformation and Excellence (CREATE) Initiative; Cognitive Support Informatics for Antimicrobial Stewardshipproject (CRE 12-313).
Disclosure
The authors report no financial conflicts of interest.
1. Antibiotic resistance threats in the United States, 2013. Atlanta, GA: Centers for Disease Control and Prevention. http://www.cdc.gov/drugresistance/threat-report-2013/. Published 2013. Accessed January 7, 2016. 2. Dellit TH, Owens RC, McGowan JE Jr, et al. Infectious Diseases Society of America and the Society for Healthcare Epidemiology of America guidelines for developing an institutional program to enhance antimicrobial stewardship. Clin Infect Dis. 2007;44(2):159-177. PubMed 3. Centers for Disease Control and Prevention. Core elements of hospital antibiotic stewardship programs. Atlanta, GA: Centers for Disease Control and Prevention. http://www.cdc.gov/getsmart/healthcare/implementation/core-elements.html. Published 2015. Accessed January 7, 2016. 4. Pollack LA, Plachouras D, Gruhler H, Sinkowitz-Cochran R. Transatlantic taskforce on antimicrobial resistance (TATFAR) summary of the modified Delphi process for common structure and process indicators for hospital antimicrobial stewardship programs. http://www.cdc.gov/drugresistance/pdf/summary_of_tatfar_recommendation_1.pdf. Published 2015. Accessed January 7, 2016. 5. Barlam TF, Cosgrove SE, Abbo LM, MacDougal C, Schuetz AN, Septimus EJ, et al. Implementing an Antibiotic Stewardship Program: Guidelines by the Infectious Diseases Society of America and the Society for Healthcare Epidemiology of America. Clin Infect Dis. 2016;62(10):e51-e77. PubMed 6. Rohde JM, Jacobsen D, Rosenberg DJ. Role of the hospitalist in antimicrobial stewardship: a review of work completed and description of a multisite collaborative. Clin Ther. 2013;35(6):751-757. PubMed 7. Mack MR, Rohde JM, Jacobsen D, Barron JR, Ko C, Goonewardene M, et al. Engaging hospitalists in antimicrobial stewardship: lessons from a multihosopital collaborative. J Hosp Med. 2016;11(8):576-580. PubMed 8. Davey P, Brown E, Charani E, Fenelon L, Gould IM, Holmes A, et al. Interventions to improve antibiotic prescribing practices for hospital inpatients. Cochrane Database Syst Rev. 2013;4:CD003543. PubMed 9. Filice G, Drekonja D, Wilt TJ, Greer N, Butler M, Wagner B. Antimicrobial stewardship programs in inpatient settings: a systematic review. Washington, DC: Department of Veterans Affairs Health Services Research and Development. http://www.hsrd.research.va.gov/publications/esp/antimicrobial.pdf. Published 2013. Accessed January 7, 2016. 10. Graber CJ, Madaras-Kelly K, Jones MM, Neuhauser MM, Goetz MB. Unnecessary antimicrobial use in the context of Clostridium difficile infection: a call to arms for the Veterans Affairs Antimicrobial Stewardship Task Force. Infect Control Hosp Epidemiol. 2013(6);34:651-653. PubMed 11. Rycroft-Malone J. The PARIHS framework--a framework for guiding the implementation of evidence-based practice. J Nurs Care Qual. 2004;19(4):297-304. PubMed 12. Chou AF, Graber CJ, Jones MM, Zhang Y, Goetz MB, Madaras-Kelly K, et al. Specifying an implementation framework for VA antimicrobial stewardship programs. Oral presentation at the VA HSR&D/QUERI National Conference, July 8-9, 2015. Washington, DC: U.S. Department of Veterans Affairs. http://www.hsrd.research.va.gov/meetings/2015/abstract-display.cfm?RecordID=862. Accessed July 5, 2016. 13. Bartholomew DJ. Factor analysis for categorical data. J R Stat Soc. 1980;42:293-321. 14. Flanagan M, Ramanujam R, Sutherland J, Vaughn T, Diekema D, Doebbeling BN. Development and validation of measures to assess prevention and control of AMR in hospitals. Med Care. 2007;45(6): 537-544. PubMed 15. Kline P. An easy guide to factor analysis. New York: Routledge, 1994. 16. Centers for Disease Control and Prevention, National Center for Health Statistics. International Classification of Diseases, Ninth Revision, Clinical Modification (ICD-9-CM). Atlanta GA: Centers for Disease Control and Prevention. http://www.cdc.gov/nchs/icd/icd9cm.htm. Published 2013. Accessed January 7, 2016. 17. Huttner B, Jones M, Huttner A, Rubin M, Samore MH. Antibiotic prescription practices for pneumonia, skin and soft tissue infections and urinary tract infections throughout the US Veterans Affairs system. J Antimicrob Chemother. 2013;68(10):2393-2399. PubMed 18. National Institutes of Health. SNOMED Clinical Terms (SNOMED CT). Bethesda, MD: U.S. National Library of Medicine. https://www.nlm.nih.gov/research/umls/Snomed/snomed_main.html. NIH website. Published 2009. Accessed January 7. 2016. 19. Jones M, Huttner B, Madaras-Kelly K, Nechodom K, Nielson C, Bidwell Goetz M, et al. Parenteral to oral conversion of fluoroquinolones: low-hanging fruit for antimicrobial stewardship programs? Infect Control Hosp Epidemiol 2012;33(4): 362-367. PubMed 20. Huttner B, Jones M, Rubin MA, Madaras-Kelly K, Nielson C, Goetz MB, et al. Double trouble: how big a problem is redundant anaerobic antibiotic coverage in Veterans Affairs medical centres? J Antimicrob Chemother. 2012;67(6):1537-1539. PubMed 21. Tibshirani R. Regression shrinkage and selection via the lasso. J R Stat Soc B. 1996;58:267-288. 22. Taylor J, Tibshirani RJ. Statistical learning and selective inference. Proc Natl Acad Sci U S A. 2015;112(25):7629-7634. PubMed 23. VHA Office of Productivity, Efficiency, and Staffing. Facility Complexity Levels. Department of Veterans Affairs website. http://opes.vssc.med.va.gov/FacilityComplexityLevels/Pages/default.aspx. Published 2008. Accessed January 7, 2016. 24. Pakyz AL, Moczygemba LR, Wang H, Stevens MP, Edmond MB. An evaluation of the association between an antimicrobial stewardship score and antimicrobial usage. J Antimicrob Chemother. 2015;70(5):1588-1591. PubMed 25. Schuts EC, Hulscher ME, Mouton JW, Verduin CM, Stuart JW, Overdiek HW, et al. Current evidence on hospital antimicrobial stewardship objectives: a systematic review and meta-analysis. Lancet Infect Dis. 2016;16(7):847-856. PubMed 26. Graber CJ, Goetz MB. Next steps for antimicrobial stewardship. Lancet Infect Dis. 2016;16(7):764-765. PubMed 27. Petzel RA. VHA Directive 1031: Antimicrobial stewardship programs (ASP). Washington, DC: Department of Veterans Affairs.http://www.va.gov/vhapublications/ViewPublication.asp?pub_ID=2964. Published January 22, 2014. Accessed July 5, 2016.
The deleterious impact of inappropriate and/or excessive antimicrobial usage is well recognized. In the United States, the Centers for Disease Control and Prevention (CDC) estimates that at least 2 million people become infected with antimicrobial-resistant bacteria with 23,000 subsequent deaths and at least $1 billion in excess medical costs per year.1
In response, many healthcare organizations have developed antimicrobial stewardship programs (ASPs). Guidelines co-sponsored by the Infectious Diseases Society of America and the Society for Healthcare Epidemiology of America, as well as recent statements from the CDC and the Transatlantic Taskforce on Antimicrobial Resistance,all recommend core ASP elements.2-5 The guidelines provide general recommendations on ASP structure, strategies, and activities. The recommended ASP structure is a team of physicians and pharmacists that collaborates with facility governing committees and other stakeholders to optimize antimicrobial use. While personnel with expertise in infectious diseases (ID) often lead ASPs, hospitalists are also recognized as key contributors, especially in quality improvement.6,7 Recommended strategies include prospective audit of antimicrobial use with intervention and feedback and formulary restriction with preauthorization. Recommended activities include education, creation of guidelines, clinical pathways, and order forms, and programs to promote de-escalation and conversion from parenteral (IV) to oral (PO) antimicrobial therapy. However, limited evidence exists regarding the effectiveness of these ASP core elements.8,9 While Cochrane reviews found clear evidence that particular stewardship strategies (eg, audit and feedback, formulary restriction, guidelines implemented with or without feedback, protocols, computerized decision support) can be effective in reducing antimicrobial usage and improving clinical outcomes over the long term, little evidence exists favoring 1 strategy over another.8 Furthermore, most individual studies of ASPs are single-center, making their conclusions less generalizable.
In 2012, the VA National Antimicrobial Stewardship Task Force (ASTF), in conjunction with the VA Healthcare Analysis and Information Group (HAIG) administered a survey on the characteristics of ASPs at all 130 acute care VA facilities (Appendix A). We used these survey results to build an implementation model and then assess associations between facility-level variables and 4 antimicrobial utilization measures.
METHODS
Survey and Data
In 2011, the ASTF was chartered to develop, deploy, and monitor a strategic plan for optimizing antimicrobial therapy management. Monthly educational webinars and sample policies were offered to all facilities, including a sample business plan for stewardship and policies to encourage de-escalation from broad-spectrum antimicrobials, promote conversion from parenteral to oral antimicrobial therapy, avoid unnecessary double anaerobic coverage, and mitigate unnecessary antimicrobial usage in the context of Clostridium difficile infection.10
At the time that ASTF was chartered, the understanding of how ASP structures across VA facilities operated was limited. Hence, to capture baseline institutional characteristics and stewardship activities, ASTF and HAIG developed an inventory assessment of ASPs that was distributed online in November 2012. All 130 VA facilities providing inpatient acute care services responded.
We derived 57 facility characteristics relevant to antimicrobial utilization and conducted a series of factor analyses to simplify the complex dataset, and identify underlying latent constructs. We categorized resulting factors into domains of evidence, context, or facilitation as guided by the Promoting Action on Research Implementation in Health Services framework.11 Briefly, the evidence domain describes how the facility uses codified and noncodified sources of knowledge (eg, research evidence, clinical experience). Organizational context comprises a facility’s characteristics that ensure a more conducive environment to put evidence into practice (eg, supportive leadership, organizational structure, evaluative systems). Facilitation emphasizes a facility personnel’s “state of preparedness” and receptivity to implementation.
Using factor analysis to identify facility factors as correlates of the outcomes, we first examined polychoric correlations among facility characteristics to assess multicollinearity. We performed independent component analysis to create latent constructs of variables that were defined by factor loadings (that indicated the proportion of variance accounted for by the construct) and uniqueness factors (that determined how well the variables were interpreted by the construct). Factors retained included variables that had uniqueness values of less than 0.7 and factor loadings greater than 0.3. Those associated with uniqueness values greater than 0.7 were left as single items, as were characteristics deemed a priori to be particularly important to antimicrobial stewardship. Factor scales that had only 2 items were converted into indices, while factor scores were generated for those factors that contained 3 or more items.12-15
Data for facility-level antimicrobial utilization measures were obtained from the VA Corporate Data Warehouse from calendar year 2012. The analysis was conducted within the VA Informatics and Computing Infrastructure. All study procedures were approved by the VA Central Institutional Review Board.
Measures
Four utilization measures were defined as dependent measures: overall antimicrobial use; antimicrobial use in patients with non-infectious discharge diagnoses; missed opportunities to convert from parenteral to oral antimicrobial therapy; and missed opportunities to avoid double anaerobic coverage with metronidazole.
Overall antimicrobial use was defined as total acute care (ie, medical/surgical/intensive care) antibacterial use for each facility aggregated as per CDC National Healthcare Safety Network Antimicrobial Use Option guidelines (antimicrobial days per 1000 patient days present). A subanalysis of overall antimicrobial use was restricted to antimicrobial use among patients without an infection-related discharge diagnosis, as we surmised that this measure may capture a greater proportion of potentially unnecessary antimicrobial use. International Classification of Diseases, Ninth Revision, Clinical Modification (ICD-9-CM)16 codes for infectious processes were identified by a combination of those classified previously in the literature,17 and those identified by finding the descendants of all infections named in the Systematized Nomenclature of Medicine--Clinical Terms.18 Next, all remaining codes for principal discharge diagnoses for which antimicrobials were administered were reviewed for potential indications for systemic antibacterial use. Discharges were considered noninfectious if no codes were identified when systemic antimicrobials were or could be indicated. For this measure, antimicrobial days were not counted if administered on or 1 day after the calendar day of surgery warranting antimicrobial prophylaxis.
Missed opportunities for conversion from parenteral to oral (IV to PO) formulations of highly bioavailable oral antimicrobials (ciprofloxacin, levofloxacin, moxifloxacin, azithromycin, clindamycin, linezolid, metronidazole, and fluconazole) were defined as the percentage of days of unnecessary IV therapy that were given when PO therapy could have been used among patients who were not in intensive care units at the time of antimicrobial administration who were receiving other oral medications, using previously described methodology.19Missed opportunities for avoiding redundant anaerobic coverage with metronidazole were defined as the percentage of days in which patients receiving metronidazole also receivedantibiotics with activity against anaerobic bacteria, specifically beta-lactam/beta-lactamase inhibitors, carbapenems, cefotetan/cefoxitin, clindamycin, moxifloxacin, or tigecycline), using previously described methodology.20 Patients for whom C. difficile testing was either ordered or positive within the prior 28 days (indicating potential clinical concern for C. difficile infection) were excluded from this endpoint.
Analysis
The variables derived above were entered into a multivariable model for each of the 4 antimicrobial utilization measures. The least absolute shrinkage and selection operator (LASSO) regression was used to determine significant associations between variables and individual utilization measures.21 LASSO was chosen because it offers advantages over traditional subset selection approaches in large multivariable analyses by assessing covariates simultaneously rather than sequentially, supporting prediction rather than estimation of effect.22P values were not reported as they are not useful in determining statistical significance in this methodology. A tuning parameter of 0.025 was determined for the model based on a cross-validation approach. Significant variables remaining in the model were reported with the percent change in each utilization measure per unit change in the variable of interest. For binary factors, percent change was reported according to whether the variable was present or not. For ordinal variables, percent change was reported according to incremental increase in ordinal score. For continuous variables or variables represented by factor or index scores, percent change was reported per each 25% increase in the range of the score.
RESULTS
Inpatient Facility Antimicrobial Stewardship Characteristics and Antimicrobial Utilization
Frequencies of key facility characteristics that contributed to variable development are included in Table 1. Full survey results across all facilities are included in Appendix B. Factor analysis reduced the total number of variables to 32; however, we also included hospital size and VA complexity score. Thus, 34 variables were evaluated for association with antimicrobial utilization measures: 4 in the evidence domain, 23 in the context domain, and 7 in the facilitation domain (Table 2).
Table 1
Table 1 (continued)
Median facility antimicrobial use was 619 antimicrobial days per 1000 days present (interquartile range [IQR], 554-700; overall range, 346-974). Median facility noninfectious antimicrobial use was 236 per 1000 days present (IQR, 200-286). Missed opportunities for conversion from IV to PO antimicrobial therapy were common, with a median facility value of 40.4% (391/969) of potentially eligible days of therapy (IQR, 32.2-47.8%). Missed opportunities to avoid double anaerobic coverage were less common (median 15.3% (186/1214) of potentially eligible days of therapy (IQR, 11.8%-20.2%; Figure).
Overall Antimicrobial Use
Four variables were associated with decreased overall antimicrobial use, although with small magnitude of change: presence of postgraduate physician/pharmacy training programs (0.03% decrease per quarter increase in factor score; on the order of 0.2 antimicrobial days per 1000 patient days present), presence of pharmacists and/or ID attendings on general medicine ward teams (0.02% decrease per quarter increase in index score), frequency of systematic de-escalation review (0.01% decrease per ordinal increase in score), and degree of involvement of ID physicians and/or fellows in antimicrobial approvals (0.007% decrease per quarter increase in index score). No variables were associated with increased overall antimicrobial use.
Table 2
Table 2 (continued)
Antimicrobial Use among Discharges without Infectious Diagnoses
Six variables were associated with decreased antimicrobial use in patients without infectious discharge diagnoses, while 4 variables were associated with increased use. Variables associated with the greatest magnitude of decreased use included facility educational programs for prudent antimicrobial use (1.8% on the order of 4 antimicrobial days per 1000 patient days present), frequency of systematic de-escalation review (1.5% per incremental increase in score), and whether a facility’s lead antimicrobial stewardship pharmacist had ID training (1.3%). Also significantly associated with decreased use was a factor summarizing the presence of 4 condition-specific stewardship processes (de-escalation policies, policies for addressing antimicrobial use in the context of C. difficile infection, blood culture review, and automatic ID consults for certain conditions) (0.6% per quarter increase in factor score range), the extent to which postgraduate physician/pharmacy training programs were present (0.6% per quarter increase in factor score range), and the number of electronic antimicrobial-specific order sets present (0.4% per order set). The variables associated with increased use of antimicrobials included the presence of antimicrobial stop orders (4.6%), the degree to which non-ID physicians were involved in antimicrobial approvals (0.7% per increase in ordinal score), the level engagement with ASTF online resources (0.6% per quarter increase in factor score range), and hospital size (0.6% per 50-bed increase).
Figure
Missed Opportunities for Parenteral to Oral Antimicrobial Conversion
Missed opportunities for IV to PO antimicrobial conversion had the largest number of significant associations with organizational variables: 14 variables were associated with fewer missed opportunities, while 5 were associated with greater missed opportunities. Variables associated with the largest reductions in missed opportunities for IV to PO conversion included having guidelines for antimicrobial duration (12.8%), participating in regional stewardship collaboratives (8.1%), number of antimicrobial-specific order sets (6.0% per order set), ID training of the ASP pharmacist (4.9%), and VA facility complexity designation (4.2% per quarter increase in score indicating greater complexity).23 Variables associated with more missed opportunities included stop orders (11.7%), overall perceived receptiveness to antimicrobial stewardship among clinical services (9.4%), the degree of engagement with ASTF online resources (6.9% per quarter increase in factor score range), educational programs for prudent antimicrobial use (4.1%), and hospital size (1.0% per 50-bed increase).
Missed Opportunities for Avoidance of Double Anaerobic Coverage
Four variables were associated with more avoidance of double anaerobic coverage: ID training of the lead ASP pharmacist (8.8%), presence of pharmacists and/or ID attendings on acute care ward teams (6.2% per quarter increase in index score), degree of ID pharmacist involvement in antimicrobial approvals, ranging from not at all (score=0) to both weekdays and nights/weekends (score=2; 4.3% per ordinal increase), and the number of antimicrobial-specific order sets (1.5% per order set). No variables were associated with less avoidance of double anaerobic coverage.
Variables Associated with Multiple Favorable or Unfavorable Antimicrobial Utilization Measures
To better assess the consistency of the relationship between organizational variables and measures of antimicrobial use, we tabulated variables that were associated with at least 3 potentially favorable (ie, reduced overall or noninfectious antimicrobial use or fewer missed opportunities) measures. Altogether, 5 variables satisfied this criterion: the presence of postgraduate physician/pharmacy training programs, the number of antimicrobial-specific order sets, frequency of systematic de-escalation review, the presence of pharmacists and/or ID attendings on acute care ward teams, and formal ID training of the lead ASP pharmacist (Table 3). Three other variables were associated with at least 2 unfavorable measures: hospital size, the degree to which the facility engaged with ASTF online resources, and presence of antimicrobial stop orders.
Table 3
DISCUSSION
Variability in ASP implementation across VA allowed us to assess the relationship between ASP and facility elements and baseline patterns of antimicrobial utilization. Hospitalists and hospital policy-makers are becoming more and more engaged in inpatient antimicrobial stewardship. While our results suggest that having pharmacists and/or physicians with formal ID training participate in everyday inpatient activities can favorably improve antimicrobial utilization, considerable input into stewardship can be made by hospitalists and policy makers. In particular, based on this work, the highest yield from an organizational standpoint may be in working to develop order sets within the electronic medical record and systematic efforts to promote de-escalation of broad-spectrum therapy, as well as encouraging hospital administration to devote specific physician and pharmacy salary support to stewardship efforts.
While we noted that finding the ASTF online resources helpful was associated with potentially unfavorable antimicrobial utilization, we speculate that this may represent reverse causality due to facilities recognizing that their antimicrobial usage is suboptimal and thus seeking out sample ASTF policies to implement. The association between the presence of automatic stop orders and potentially unfavorable antimicrobial utilization is less clear since the timeframe was not specified in the survey; it may be that setting stop orders too far in advance may promote an environment in which critical thinking about antimicrobial de-escalation is not encouraged or timely. The larger magnitude of association between ASP characteristics and antimicrobial usage among patients without infectious discharge diagnoses versus overall antimicrobial usage also suggests that clinical situations where infection was of low enough suspicion to not even have the providers eventually list an infectious diagnosis on their discharge summaries may be particularly malleable to ASP interventions, though further exploration is needed in determining how useful this utilization measure may be as a marker for inappropriate antimicrobial use.
Our results complement those of Pakyz et al.24 who surveyed 44 academic medical facilities in March 2013 to develop an ASP intensity score and correlate this score and its specific components to overall and targeted antimicrobial use. This study found that the overall ASP intensity score was not significantly associated with total or targeted antimicrobial use. However, ASP strategies were more associated with decreased total and targeted antimicrobial use than were specific ASP resources. In particular, the presence of a preauthorization strategy was associated with decreased targeted antimicrobial use. Our particular findings that order set establishment and de-escalation efforts are associated with multiple antibiotic outcomes also line up with the findings of Schuts et al,who performed a meta-analysis of the effects of meeting antimicrobial stewardship objectives and found that achieving guideline concordance (such as through establishment of order sets) and successfully de-escalating antimicrobial therapy was associated with reduced mortality.25,26 This meta-analysis, however, was limited by low rigor of its studies and potential for reverse causality. While our study has the advantages of capturing an entire national network of 130 acute care facilities with a 100% response rate, it, too, is limited by a number of issues, most notably by the fact that the survey was not specifically designed for the analysis of antimicrobial utilization measures, patient-level risk stratification was not available, the VA population does not reflect the U.S. population at-large, recall bias, and that antimicrobial prescribing and stewardship practices have evolved in VA since 2012. Furthermore, all of the antimicrobial utilization measures studied are imperfect at capturing inappropriate antibiotic use; in particular, our reliance on principal ICD-9 codes for noninfectious outcomes requires prospective validation. Many survey questions were subjective and subject to misinterpretation; other unmeasured confounders may also be present. Causality cannot be inferred from association. Nevertheless, our findings support many core indicators for hospital ASP recommended by the CDC and the Transatlantic Taskforce on Antimicrobial Resistance,3,4 most notably, having personnel with ID training involved in stewardship and establishing a formal procedure for ASP review for the appropriateness of an antimicrobial at or after 48 hours from the initial order.
In summary, the VA has made efforts to advance the practice of antimicrobial stewardship system-wide, including a 2014 directive that all VA facilities have an ASP,27 since the 2012 HAIG assessment reported considerable variability in antimicrobial utilization and antimicrobial stewardship activities. Our study identifies areas of stewardship that may correlate with, positively or negatively, antimicrobial utilization measures that will require further investigation. A repeat and more detailed antimicrobial stewardship survey was recently completed and will help VA gauge ongoing effects of ASTF activities. We hope to re-evaluate our model with newer data when available.
Acknowledgments
The authors wish to thank Michael Fletcher, Jaime Lopez, and Catherine Loc-Carrillo for their administrative and organizational support of the project and Allison Kelly, MD, for her pivotal role in survey development and distribution. This work was supported by the VA Health Services Research and Development Service Collaborative Research to Enhance and Advance Transformation and Excellence (CREATE) Initiative; Cognitive Support Informatics for Antimicrobial Stewardshipproject (CRE 12-313).
Disclosure
The authors report no financial conflicts of interest.
References
1. Antibiotic resistance threats in the United States, 2013. Atlanta, GA: Centers for Disease Control and Prevention. http://www.cdc.gov/drugresistance/threat-report-2013/. Published 2013. Accessed January 7, 2016. 2. Dellit TH, Owens RC, McGowan JE Jr, et al. Infectious Diseases Society of America and the Society for Healthcare Epidemiology of America guidelines for developing an institutional program to enhance antimicrobial stewardship. Clin Infect Dis. 2007;44(2):159-177. PubMed 3. Centers for Disease Control and Prevention. Core elements of hospital antibiotic stewardship programs. Atlanta, GA: Centers for Disease Control and Prevention. http://www.cdc.gov/getsmart/healthcare/implementation/core-elements.html. Published 2015. Accessed January 7, 2016. 4. Pollack LA, Plachouras D, Gruhler H, Sinkowitz-Cochran R. Transatlantic taskforce on antimicrobial resistance (TATFAR) summary of the modified Delphi process for common structure and process indicators for hospital antimicrobial stewardship programs. http://www.cdc.gov/drugresistance/pdf/summary_of_tatfar_recommendation_1.pdf. Published 2015. Accessed January 7, 2016. 5. Barlam TF, Cosgrove SE, Abbo LM, MacDougal C, Schuetz AN, Septimus EJ, et al. Implementing an Antibiotic Stewardship Program: Guidelines by the Infectious Diseases Society of America and the Society for Healthcare Epidemiology of America. Clin Infect Dis. 2016;62(10):e51-e77. PubMed 6. Rohde JM, Jacobsen D, Rosenberg DJ. Role of the hospitalist in antimicrobial stewardship: a review of work completed and description of a multisite collaborative. Clin Ther. 2013;35(6):751-757. PubMed 7. Mack MR, Rohde JM, Jacobsen D, Barron JR, Ko C, Goonewardene M, et al. Engaging hospitalists in antimicrobial stewardship: lessons from a multihosopital collaborative. J Hosp Med. 2016;11(8):576-580. PubMed 8. Davey P, Brown E, Charani E, Fenelon L, Gould IM, Holmes A, et al. Interventions to improve antibiotic prescribing practices for hospital inpatients. Cochrane Database Syst Rev. 2013;4:CD003543. PubMed 9. Filice G, Drekonja D, Wilt TJ, Greer N, Butler M, Wagner B. Antimicrobial stewardship programs in inpatient settings: a systematic review. Washington, DC: Department of Veterans Affairs Health Services Research and Development. http://www.hsrd.research.va.gov/publications/esp/antimicrobial.pdf. Published 2013. Accessed January 7, 2016. 10. Graber CJ, Madaras-Kelly K, Jones MM, Neuhauser MM, Goetz MB. Unnecessary antimicrobial use in the context of Clostridium difficile infection: a call to arms for the Veterans Affairs Antimicrobial Stewardship Task Force. Infect Control Hosp Epidemiol. 2013(6);34:651-653. PubMed 11. Rycroft-Malone J. The PARIHS framework--a framework for guiding the implementation of evidence-based practice. J Nurs Care Qual. 2004;19(4):297-304. PubMed 12. Chou AF, Graber CJ, Jones MM, Zhang Y, Goetz MB, Madaras-Kelly K, et al. Specifying an implementation framework for VA antimicrobial stewardship programs. Oral presentation at the VA HSR&D/QUERI National Conference, July 8-9, 2015. Washington, DC: U.S. Department of Veterans Affairs. http://www.hsrd.research.va.gov/meetings/2015/abstract-display.cfm?RecordID=862. Accessed July 5, 2016. 13. Bartholomew DJ. Factor analysis for categorical data. J R Stat Soc. 1980;42:293-321. 14. Flanagan M, Ramanujam R, Sutherland J, Vaughn T, Diekema D, Doebbeling BN. Development and validation of measures to assess prevention and control of AMR in hospitals. Med Care. 2007;45(6): 537-544. PubMed 15. Kline P. An easy guide to factor analysis. New York: Routledge, 1994. 16. Centers for Disease Control and Prevention, National Center for Health Statistics. International Classification of Diseases, Ninth Revision, Clinical Modification (ICD-9-CM). Atlanta GA: Centers for Disease Control and Prevention. http://www.cdc.gov/nchs/icd/icd9cm.htm. Published 2013. Accessed January 7, 2016. 17. Huttner B, Jones M, Huttner A, Rubin M, Samore MH. Antibiotic prescription practices for pneumonia, skin and soft tissue infections and urinary tract infections throughout the US Veterans Affairs system. J Antimicrob Chemother. 2013;68(10):2393-2399. PubMed 18. National Institutes of Health. SNOMED Clinical Terms (SNOMED CT). Bethesda, MD: U.S. National Library of Medicine. https://www.nlm.nih.gov/research/umls/Snomed/snomed_main.html. NIH website. Published 2009. Accessed January 7. 2016. 19. Jones M, Huttner B, Madaras-Kelly K, Nechodom K, Nielson C, Bidwell Goetz M, et al. Parenteral to oral conversion of fluoroquinolones: low-hanging fruit for antimicrobial stewardship programs? Infect Control Hosp Epidemiol 2012;33(4): 362-367. PubMed 20. Huttner B, Jones M, Rubin MA, Madaras-Kelly K, Nielson C, Goetz MB, et al. Double trouble: how big a problem is redundant anaerobic antibiotic coverage in Veterans Affairs medical centres? J Antimicrob Chemother. 2012;67(6):1537-1539. PubMed 21. Tibshirani R. Regression shrinkage and selection via the lasso. J R Stat Soc B. 1996;58:267-288. 22. Taylor J, Tibshirani RJ. Statistical learning and selective inference. Proc Natl Acad Sci U S A. 2015;112(25):7629-7634. PubMed 23. VHA Office of Productivity, Efficiency, and Staffing. Facility Complexity Levels. Department of Veterans Affairs website. http://opes.vssc.med.va.gov/FacilityComplexityLevels/Pages/default.aspx. Published 2008. Accessed January 7, 2016. 24. Pakyz AL, Moczygemba LR, Wang H, Stevens MP, Edmond MB. An evaluation of the association between an antimicrobial stewardship score and antimicrobial usage. J Antimicrob Chemother. 2015;70(5):1588-1591. PubMed 25. Schuts EC, Hulscher ME, Mouton JW, Verduin CM, Stuart JW, Overdiek HW, et al. Current evidence on hospital antimicrobial stewardship objectives: a systematic review and meta-analysis. Lancet Infect Dis. 2016;16(7):847-856. PubMed 26. Graber CJ, Goetz MB. Next steps for antimicrobial stewardship. Lancet Infect Dis. 2016;16(7):764-765. PubMed 27. Petzel RA. VHA Directive 1031: Antimicrobial stewardship programs (ASP). Washington, DC: Department of Veterans Affairs.http://www.va.gov/vhapublications/ViewPublication.asp?pub_ID=2964. Published January 22, 2014. Accessed July 5, 2016.
Association of inpatient antimicrobial utilization measures with antimicrobial stewardship activities and facility characteristics of Veterans Affairs medical centers
Display Headline
Association of inpatient antimicrobial utilization measures with antimicrobial stewardship activities and facility characteristics of Veterans Affairs medical centers
Address for correspondence and reprint requests: Christopher J. Graber, MD, MPH, Infectious Diseases Section, VA Greater Los Angeles Healthcare System, 11301 Wilshire Blvd, 111-F, Los Angeles, CA 90073; Telephone: 310-268-3763; Fax: 310 268-4928; E-mail: christopher.graber@va.gov
Content Gating
Open Access (article Unlocked/Open Access)
Alternative CME
Consolidated Pubs: Do Not Show Source Publication Logo
Pneumonia is the leading inpatient infectious diagnosis for which antimicrobials are prescribed in the United States.[1] Supported by moderate‐ to high‐quality evidence, guidelines produced jointly by the Infectious Diseases Society of America (IDSA) and American Thoracic Society (ATS) recommend treating pneumonia with the shortest appropriate duration of antimicrobial therapy to minimize risk for antimicrobial‐related adverse events.[2, 3, 4]
Evidence supports short duration of therapy for treatment of uncomplicated pneumonia.[3, 4, 5, 6, 7, 8, 9, 10, 11, 12] IDSA/ATS guidelines state, patients with CAP [community‐acquired pneumonia] should be treated for a minimum of 5 days (level 1 evidence), should be afebrile for 4872 hours, and should have no more than 1 CAP‐associated sign of clinical instabilitybefore discontinuation of therapy (level II evidence). (Moderate recommendation.) A longer duration of therapy may be warranted if initial therapy was not active against the identified pathogen or if it was complicated by [abscess, empyema, severe immunosuppression, or] extra‐pulmonary infection such as meningitis or endocarditis. (Weak recommendation; level III evidence).[3] Recommended therapy duration for patients with uncomplicated healthcare‐associated pneumonia (HCAP) who respond to initial therapy is 7 to 8 days unless gram‐negative nonfermenting rods or complications are identified (level I evidence).[4]
Within the Veterans Health Administration (VHA), the Antimicrobial Stewardship Taskforce (ASTF) was created to optimize care by developing, deploying, and monitoring a national‐level strategic plan for antimicrobial therapy management improvements.[13, 14] Although single‐center studies have found antimicrobial therapy for CAP being frequently prescribed for longer than recommended, the reproducibility of this finding across different facilities has not been assessed.[15, 16] The ASTF collaborated with the VHA Center for Medication Safety to assess total duration of antimicrobial therapy prescribed for veterans hospitalized with uncomplicated pneumonia.[17]
METHODS
This retrospective multicenter evaluation was conducted in 30 VHA facilities that volunteered to participate in this project. Inpatients discharged with a primary International Classification of Diseases, Ninth Revision, Clinical Modification (ICD‐9‐CM) diagnosis code for pneumonia (or pneumonia diagnosis secondary to primary sepsis diagnosis) during 2013 were evaluated.[18] Diagnoses, admissions, and patient demographics were identified using Veterans Affairs (VA) integrated databases through the Austin Integrated Technology Center. Up to 200 admissions per facility were randomly selected for review. Clinical pharmacists at each facility performed manual record reviews utilizing a standardized protocol and collection form. Completed cases were uploaded to a central database for analysis. Standardized chart abstraction was facilitated by detailed instructions, a data dictionary, and monthly conference calls.
Inclusion criteria required patient admission to any medical ward including intensive care unit (ICU) wards for 48 hours, receipt of >24 hours inpatient antimicrobial therapy (eg, at least 2 doses of a once‐daily antibiotic), documentation of pneumonia discharge diagnosis, and survival until discharge. Exclusion criteria were: complicated pneumonia (lung abscess, necrotizing pneumonia, thoracentesis performed), significant immunosuppression (cancer chemotherapy or absolute neutrophil count <1500 cell/mm3 within 28 days, organ transplantation, human immunodeficiency virus infection); or extrapulmonary infection (eg, meningitis, endocarditis).[3] Patients were also excluded if directly transferred from another inpatient facility, pneumonia occurred >48 hours after admission, index hospitalization was >14 days, previously hospitalized within 28 days prior to index admission, or discharged without documentation of completing a full course of therapy. In addition, patients who received initial therapy discordant with culture and susceptibility findings, were not clinically stable by discharge, or had gram‐negative nonfermentative bacilli cultured were excluded from analysis because according to the guidelines, either data are lacking to support a short duration of therapy such as initial discordant therapy, or a longer duration of therapy may be warranted such as gram‐negative nonfermentative bacilli and clinical instability at discharge.[4] Our intent for these exclusions was to minimize bias against clinician decision making for cases where a longer duration of therapy may have been appropriate.
Patients meeting all criteria had the following abstracted: demographics; prior healthcare exposures, admitting location (ICU or non‐ICU ward), parameters for calculation of Pneumonia Severity Index (PSI), culture results obtained 48 hours of admission, duration of antimicrobials administered during hospitalization and prescribed upon discharge (or recommendations for outpatient duration in the discharge summary for patients receiving medications from non‐VA sources), daily clinical stability assessment, Clostridium difficile infection (CDI) test results, and readmission or death within 28 days of discharge.[19]
Guideline‐similar CAP therapy duration was defined as a minimum of 5 days of antimicrobials, up to a maximum of 3 additional days beginning the first day the patient was afebrile and exhibited 1 sign of clinical instability (heart rate > 100 beats/minute, respiratory rate >24 breaths/minute, systolic blood pressure <90, oxygen saturation <90% or partial pressure of oxygen <60 mm Hg on room air or baseline O2 requirements, or not returned to baseline mental status).[3] This definition was made by consensus decision of the investigators and was necessary to operationalize the relationship between clinical stability and appropriate duration of therapy. Guideline‐similar HCAP therapy duration was defined as 8 days.[4] CDI was defined in accordance with VA criteria for hospital onset and community‐onset healthcare‐facilityassociated CDI.[20] All‐cause hospital readmission and all‐cause death were defined as inpatient readmission or any death, respectively, within 28 days after discharge for the pneumonia admission.
Demographics, comorbidities, microbiology results, antimicrobial utilization, CDI, readmission, and death rates between guideline‐similar and guideline‐excessive duration of antimicrobial therapy groups were characterized with descriptive statistics, Mann‐Whitney U test, or 2 test as indicated (significance defined as P < 0.05). Multivariable logistic regression (SAS version 9.3 [SAS Institute, Cary, NC]) was used to assess association between duration of therapy exceeding recommended guidelines with all‐cause readmission and all‐cause death after adjustment for pertinent covariates. Odds ratios (OR) with 95% confidence intervals ( 95% CI) were reported. This medication utilization evaluation (MUE) was reviewed by the Hines VHA Institutional Review Board for Human Subjects Protection. Based on VHA Policy Handbook 1058.05, which defines operations activities that may constitute research, the board determined that the evaluation constituted quality improvement rather than research, and thus was exempt from VHA Human Subjects Research requirements.
RESULTS
There were 3881 admissions eligible for chart review. After manual chart review of inclusion and exclusion criteria, 1739 (44.8%) patients were available for duration of therapy analysis. (Figure 1). Only 1 admission for each patient was analyzed.
Figure 1
Application of inclusion and exclusion criteria for the pneumonia duration of therapy evaluation. Abbreviations: CAP, community‐acquired pneumonia; HCAP, healthcare‐associated pneumonia; ICD‐9, International Classification of Diseases, Ninth Revision; VA, Veterans Affairs.
The cohort was comprised primarily of elderly male patients (96.6%) of whom more than two‐thirds were hospitalized for CAP (Table 1). Most patients had significant disease severity as indicated by PSI score; however, only 12% were directly admitted to the ICU. Blood cultures were collected in >95% of cases; lower respiratory cultures were obtained in 39.9% of cases.
Demographic and Other Characteristics of the Pneumonia Cohort (n = 1,739)
Characteristic
Value
NOTE: Abbreviations: SD, standard deviation; VA, Veterans Affairs.
Age, y, mean SD
71.8 (12.7)
Gender, male, n (%)
1,680 (96.6)
Living environment at time of index admission, n (%)
Home
1,416 (81.4)
VA community‐based living center
88 (5.1)
Non‐VA long‐term skilled care facility
95 (5.5)
Assisted living facility
52 (2.9)
Not documented
46 (2.7)
Other
29 (1.7)
Prior healthcare exposures, n (%)
Prior hospitalization within last 90 days
310 (17.8)
Residence in a long‐term skilled care facility in last 90 days
209 (12.0)
Chronic dialysis within last 28 days
52 (3.0)
Intravenous antimicrobials within last 28 days
76 (4.4)
Wound, tracheostomy, or ventilator care in last 28 days
37 (2.1)
Community‐acquired pneumonia, n (%)
1,195 (68.7)
Healthcare‐associated pneumonia, n (%)
544 (31.3)
Comorbidities, n (%)
Renal disease
438 (25.2)
Liver disease
39 (2.2)
Congestive heart failure
436 (25.1)
Cerebrovascular disease
356 (20.4)
Neoplastic disease (excluding skin)
384 (22.1)
Severity of illness, n (%)
Pneumonia Severity Index
Class I
30 (1.8)
Class II
198 (11.4)
Class III
349 (20.1)
Class IV
759 (43.6)
Class V
403 (23.2)
Intensive care upon admission
212 (12.2)
Culture collection 48 hours of admission, n (%)
1,687 (97.0)
Blood
1,631 (96.7)
Lower respiratory tract (sputum)
673 (39.9)
Bronchoalveolar lavage
20 (1.2)
Urine
632 (37.5)
Skin/wound
3 (0.2)
Other
158 (9.4)
Facility complexity, n (%)
Level 1a‐c
1,286 (74.0)
Level 2
437 (25.1)
Level 3
16 (0.9)
Commonly administered antimicrobials during hospitalization and at discharge are summarized in Table 2. Anti‐pseudomonal ‐lactams and antimethicillin‐resistant Staphylococcus aureus antimicrobials were more frequently administered to patients with HCAP, whereas third‐generation cephalosporins and macrolides were more likely to be administered to patients with CAP. Fluoroquinolones were prescribed to 55.3% of patients upon discharge.
Antimicrobials Administered During Hospitalization and Dispensed Upon Discharge
Inpatient Antimicrobials Administered*
Portion of Cohort Receiving Antimicrobial, n (%), n = 1,739
Therapy Duration Similar With Guidelines, n (%), n = 241
Therapy Duration Exceeding Guidelines, n (%), n = 1,498
Significance
Antimicrobials Dispensed or Recommended at Discharge
Portion of Cohort Receiving Antimicrobial, n (%), n = 1,471
Therapy Duration Similar With Guidelines, n (%), n = 151
Therapy Duration Exceeding Guidelines, n (%), n = 1,320
Significance
NOTE: Third‐generation cephalosporins: ceftriaxone, cefotaxime, cefpodoxime, cefprozil, cefdinir, cefuroxime. Fluoroquinolones: moxifloxacin, levofloxacin, ciprofloxacin. Macrolides: azithromycin, clarithromycin. Pseudomonal lactams: piperacillin/tazobactam, cefepime, ceftazidime, aztreonam, meropenem, imipenem. Anti‐MRSA antimicrobials: vancomycin, linezolid, ceftaroline. Other ‐lactams: ampicillin/sulbactam, amoxicillin/clavulanic acid, ampicillin, amoxicillin, penicillin, nafcillin, dicloxacillin, cefazolin, cephalexin, ertapenem. Tetracyclines: doxycycline, minocycline, tigecycline. Other: clindamycin, metronidazole, trimethoprim/sulfamethoxazole, gentamicin, tobramycin, amikacin, polymyxin B. Abbreviations: CAP, community‐acquired pneumonia; HCAP, healthcare‐associated pneumonia; MRSA, methicillin‐resistant Staphylococcus aureus; VA, Veterans Affairs. *Includes all patients (n = 1,739) administered at least 1 dose of antimicrobial. The majority of patients in this group were CAP patients for whom the guideline‐similar duration of therapy was less than that allowed for HCAP patients. Note: The majority of patients in this group were HCAP patients for whom the guideline‐similar duration of therapy was shorter than that allowed for CAP patients. Includes all patients who had a VA prescription dispensed within 24 hours of hospital discharge or had an antimicrobial and duration recommended in the discharge summary.
Third‐generation cephalosporins
809 (46.5)
75 (31.1)
734 (49.0)
<0.001
Fluoroquinolones
836 (48.1)
114 (47.3)
722 (48.2)
0.80
Macrolides
788 (45.3)
90 (37.3)
698 (46.6)
<0.01
Pseudomonal ‐lactams
692 (39.8)
138 (57.3)
554 (37.0)
0.01
Anti‐MRSA antimicrobials
663 (38.1)
135 (56.0)
528 (35.3)
<0.01
Other ‐lactams
139 (8.0)
10 (4.2)
129 (8.6)
0.02
Tetracyclines
119 (6.8)
14 (5.8)
105 (7.0)
0.49
Other
97 (5.6)
15 (6.2)
82 (5.5)
0.64
Third‐generation cephalosporins
285 (19.4)
27 (17.9)
258 (19.6)
0.62
Fluoroquinolones
813 (55.3)
95 (62.9)
718 (54.4)
0.05
Macrolides
203 (13.8)
20 (13.3)
183 (13.9)
0.83
Pseudomonal ‐lactams
31 (2.1)
4 (2.7)
27 (2.1)
0.62
Anti‐MRSA antimicrobials
45 (3.1)
6 (4.0)
39 (3.0)
0.49
Other ‐lactams
239 (16.3)
13 (8.6)
226 (17.1)
0.01
Tetracyclines
95 (6.5)
10 (6.6)
85 (6.4)
0.93
Other
44 (3.0)
5 (3.3)
39 (3.0)
0.81
Overall, 13.9% of patients with uncomplicated pneumonia received guideline‐similar duration of therapy (Table 3). A greater proportion of HCAP patients (29.0%) received guideline‐similar therapy duration as compared to CAP patients (6.9%) (P < 0.01 (Table 3). Median duration of therapy was 7 days (interquartile range [IQR] = 78 days) for guideline‐similar therapy compared to 10 days (913 days) for therapy duration in excess of guideline recommendations. Overall, 97.1 % of patients met clinical stability criteria before day 4 of therapy, yet 50% received 4 days of intravenous (IV) therapy (median was 4 days, IQR = 36 days). Antimicrobial therapy was generally completed after discharge, as only 17.3% received their entire treatment course during hospitalization. Median duration of outpatient oral (PO) antimicrobial therapy was twice as long for guideline‐excessive therapy compared to guideline‐similar therapy (6 vs 3 days), whereas duration of inpatient IV and PO antimicrobial therapy was similar. Patients discharged on a fluoroquinolone were more likely to receive guideline‐similar duration of therapy. The VHA classifies facilities into 3 levels of complexity, with lower scores indicating more complex facilities.[21] Guideline‐similar therapy duration occurred in 10.4% of cases in lower complexity facilities (levels 2 and 3),and 15.1% in more complex facilities (level 1) (P = 0.01). The median duration of therapy was similar for more and less complex facilities, respectively (10 days, IQR = 812 days vs 10 days, IQR = 813 days).
Duration of Antimicrobial Therapy Administered for Uncomplicated Pneumonia and Clinical Outcomes of Interest
Outcome
Therapy Duration
Similar With IDSA/ATS Guidelines
Therapy Duration in Excess of IDSA/ATS Guideline Recommendations
Significance
NOTE: Abbreviations: CAP, community acquired pneumonia; HCAP, healthcare‐associated pneumonia; NR, not relevant. *Denominators for each row are stratified by all included and nonexcluded patients who had CAP and HCAP, respectively. CAP versus HCAP, P < 0.01. n = 1,403. n = 76. ∥Denominators for each row are stratified by guideline concordance and discordance and patients who had CAP and HCAP, respectively. Twenty‐eightday hospital readmission, guideline concordant therapy, CAP versus HCAP, P < 0.01. # Twenty‐eightday hospital readmission, guideline discordant therapy, CAP versus HCAP, P < 0.01. **HCAP versus CAP P values not significant.
Antimicrobial duration consistent with guideline recommendations, n (%)
241 (13.9)
1,498 (86.1)
NR
CAP*
83 (6.9)
1,112 (93.1)
NR
HCAP*
158 (29.0)
386 (71.0)
NR
Total days of therapy for pneumonia, median (IQR)
7 (78)
10 (913)
NR
CAP
6 (59)
10 (812)
<0.01
HCAP
7 (78)
11 (1014)
<0.01
Days of IV therapy administered for pneumonia, median (IQR)
4 (37)
4 (36)
0.50
Days of PO inpatient therapy administered, median (IQR)
1 (03)
1 (03)
0.78
Days of PO outpatient therapy dispensed at discharge, median (IQR)
3 (25)
6 (47)
<0.01
Days of PO outpatient therapy recommended in Discharge Summary for patients without a VA prescription, median (IQR)
3 (24)
5 (47)
<0.01
Aggregate 28‐day hospital readmission, n (%)
42 (17.4)
183 (12.2)
0.03
CAP∥#
7 (8.4)
112 (10.1)
0.58
HCAP∥#
35 (22.2)
71 (18.4)
0.28
Aggregate 28‐day CDI rate, n (%)
6 (2.5)
9 (0.6)
0.03
CAP∥**
1 (1.2)
6 (0.5)
0.44
HCAP∥**
5 (3.2)
3 (0.8)
0.04
Aggregate 28‐day death after discharge, n (%)
6 (2.5)
52 (3.5)
0.43
CAP∥**
1 (1.2)
33 (3.0)
0.35
HCAP∥**
5 (3.2)
19 (4.9)
0.37
The 28‐day postdischarge all‐cause readmission rate for patients who received guideline‐similar therapy duration was higher (17.4%) than for patients who received therapy duration in excess of guideline recommendations (12.2%) (P = 0.03). After adjustment for covariates associated with readmission (HCAP, age, prior skilled nursing facility residence, PSI score comorbidity elements), we found no evidence that patients who received guideline‐similar therapy duration were more likely to be readmitted than were patients who received guideline‐excessive duration (OR: 1.1 [95% CI: 0.8, 1.7]) (Table 3). Likewise, no difference in 28‐day all‐cause postdischarge mortality was identified between guideline‐similar and guideline‐excessive duration after adjustment for the same covariates (adjusted OR: 0.5 [95% CI: 0.2, 1.2]) (Table 4).
Multivariable Models for 28‐Day Readmission and Mortality
CDI cases (n = 15) were too sparse to adequately perform multivariable logistic regression analysis; however, a higher percentage of patients who received guideline‐similar duration of therapy developed CDI compared to patients who received guideline‐excessive duration of therapy (40.0% vs 13.6%, P < 0.01). The median duration of therapy for patients who did and did not develop CDI was similar (8 days, IQR = 714 days vs 10 days, IQR = 812 days, P = 0.85, respectively). Patients who developed CDI had a higher rate of HCAP diagnosis (1.5% vs 0.6%; P = 0.06), were more likely to have concomitant non‐pneumonia infection (40.0% vs 9.5%, P < 0.01), have chronic comorbidity (86.7% vs 59.1%, P = 0.03), and to have been admitted to the ICU (26.7% vs 12.1%, P = 0.09).
DISCUSSION
IDSA/ATS guidelines for pneumonia duration of therapy generally agree with other professional society guidelines including the British Thoracic Society and National Institute for Health and Care Excellence.[22, 23] In contrast to existing evidence and guideline recommendations, this multi‐centered evaluation identified prolonged durations of antimicrobial therapy prescribed in 93% and 71% of patients with uncomplicated CAP and HCAP (Table 3), respectively.[3, 4, 5, 6, 7, 8, 9, 10, 11, 12] Almost all (97.1%) uncomplicated CAP and HCAP patients met clinical stability criteria before day 4 of hospitalization, yet the median duration of IV therapy was 4 days. Because criteria for IV to PO conversion and the clinical stability definition utilized in this analysis were similar, many patients may have been eligible for PO therapy earlier, favorably impacting length of stay, cost, and adverse effects.[3, 12, 24, 25, 26] Although median days of inpatient PO therapy administered was 1 day (IQR = 03 days), inpatient observation after PO conversion may not be necessary. The duration of PO therapy was based on calendar days, where if a patient received 1 dose of a once daily antibiotic (ie, levofloxacin), they were considered to have received 1 day of inpatient PO antibiotics even if discharged the same day.
Approximately half of all days of therapy occurred after discharge. Although the median therapy duration for inpatients was similar, the median duration of antimicrobials administered upon hospital discharge was twice as long for patients receiving guideline‐excessive compared to guideline‐similar duration of therapy. The median excess in antibiotic duration is almost entirely accounted for by excess outpatient days of therapy. This is an important consideration for antimicrobial stewardship programs that tend to focus on inpatient antimicrobial use.
Noteworthy observations include the low rate of respiratory tract culture collection (41%) and frequent use of fluoroquinolones upon discharge. Collection of respiratory tract cultures is recommended for all patients with HCAP and patients with CAP who have risk factors for resistant pathogens, characteristics that were common in this cohort.[3, 4] Recently, we identified that respiratory culture collection is associated with increased de‐escalation rates in HCAP, and that culture‐negative patients frequently receive fluoroquinolones.[27] IDSA/ATS CAP guidelines discourage empirically switching to PO fluoroquinolone therapy based on bioavailability considerations alone.[3] Further, fluoroquinolones are considered to be associated with high risk of CDI.[28, 29] Prescription of fluoroquinolone upon discharge was associated with guideline‐similar duration of therapy and was not shown to be associated with CDI; however, power to detect differences between exposures to specific antimicrobials and CDI was low.
CDI was more common in patients with CAP (1.2% vs 0.5%) and HCAP (3.2% vs 0.8%) who received duration of therapy similar with guideline recommendations. This observation is confounded, as patients with CDI had significantly greater comorbidity as well as secondary infections and tended to more frequently receive ICU care. There were no differences in adjusted rates of readmission or death between patients receiving guideline‐similar and guideline‐excessive duration of therapy.
Evaluation strengths included exclusion of patients with complicating conditions possibly requiring prolonged antimicrobial treatment courses, which allowed the evaluation to focus on patients most likely to benefit from shorter course therapy. The definition of appropriate therapy duration was based upon daily assessment of clinical stability criteria that paralleled the CAP guidelines. The definition utilized objective parameters while accounting for patient variability in achieving clinical stability criteria. Finally, the analyses of clinical end points suggest that shorter duration of therapy may be as safe and effective as longer duration of therapy in uncomplicated pneumonia.
Limitations include those common to other analyses conducted within the VHA, including a predominantly elderly male cohort.[30] Only ICD‐9‐CM codes consistent with a discharge diagnosis of pneumonia were used to identify the cohort, and clinical impressions not documented in the medical record may have impacted the clinician's treatment duration decisions. The upper limit of appropriate duration of therapy for CAP was arbitrarily set at up to 3 days beyond meeting clinical stability criteria to provide a reasonable duration of appropriate therapy beyond clinical stability to operationalize the duration of therapy recommendations within the context of the IDSA/ATS guidelines. Additionally, CIs for the ORs of readmission and mortality were broad, and thus too imprecise to determine whether guideline‐similar durations increased or decreased readmission or mortality in comparison with therapy that exceeded guideline recommendations. We could not fully assess the potential for association between guideline‐excessive therapy duration and risk for CDI due to sparse cases. Finally, non‐VA prescription data were not available for all patients, and we relied on intended duration of therapy as recommended by the discharging provider in 4.1% of cases.
Most quality assessments of pneumonia treatment have focused on antimicrobial selection and timely administration or conversion from IV to PO therapy.[31, 32] This evaluation identified potential opportunities for expansion of antimicrobial stewardship activities during the transition of care setting. The efficacy of short‐course ‐lactam, macrolide, or fluoroquinolone therapy for CAP appears equivalent to longer treatment regimens with no difference in adverse event rates, suggesting that optimal duration of therapy may be a rational target for quality improvement.[5, 6, 7, 8, 9, 10, 11, 12, 15, 31] Recommendations for HCAP duration of therapy are extrapolated from a prospective multicentered study, which randomized patients with hospital‐acquired pneumonia to receive 8 versus 15 days of therapy, that identified similar outcomes to ours.[4, 12]
Single‐center studies have identified that antimicrobial therapy for pneumonia is frequently prescribed for longer than recommended by guidelines, which found a similar median duration of therapy as our evaluation.[15, 16] Similar to Jenkins et al., we observed a high rate of fluoroquinolone prescriptions upon discharge.[16]
There are few published examples of interventions designed to limit excessive duration of therapy, particularly for antimicrobials prescribed upon hospital discharge.[15, 33, 34] Serial procalcitonin measurements have been used to guide duration of therapy for pneumonia; however, the costbenefit ratio of procalcitonin measurement is unclear.[35, 36] Procalcitonin use was uncommon, and none of the participating facilities in our evaluation utilized a specific algorithm to guide therapy duration. Limited data suggest that patient‐level prospective audit with feedback may be effective. Advic et al. evaluated management of presumed CAP before and after education and prospective feedback to medical teams concerning antimicrobial selection and duration of therapy.[15] The intervention led to a decrease in median duration of therapy from 10 days (IQR = 813 days) to 7 days (IQR = 78 days) without increasing clinical failure or readmission rates. We recently reported a single‐center evaluation in which pharmacists utilizing a decision support tool while performing discharge medication reconciliation were able to reduce excessive mean duration of therapy from 9.5 days ( 2.4 days) to 8.3 days ( 2.9 days) in patients without complicated pneumonia, with a 19.2% reduction in duration of therapy prescribed at discharge.[37] A similar approach utilizing pharmacists performing discharge review has recently been reported in a community hospital.[38]
Future work should recognize that few patients complete their entire course of therapy as inpatients, and the majority of treatment is prescribed upon discharge. Pivotal time points for antimicrobial stewardship intervention include day 2 to 3 of hospitalization when conveying suggestions for antimicrobial de‐escalation and/or IV to PO conversion, and toward the end of hospitalization during discharge planning. Although it may not be feasible for antimicrobial stewards to review all uncomplicated cases of pneumonia during hospitalization, most facilities have a systematic process for reviewing medications during transitions of care. We believe that interventions intended to assess and recommend shortened courses of therapy are appropriate. These interventions should include a mechanism for support by stewardship personnel or other infectious diseases specialists. Based on our evaluation, the ASTF produced and disseminated clinical guidance documents and tools to triage pneumonia case severity and assess response to therapy. Qualified personnel are encouraged to use this information to make recommendations to providers regarding excessive duration of therapy for uncomplicated cases where appropriate. Other work should include an in‐depth assessment of clinical outcomes related to treatment duration, investigation of provider rationale for prolonged treatment, and duration of antimicrobial therapy prescribed upon discharge for other common disease states. Finally, manual chart review to classify uncomplicated cases and related outcomes was laborious, and automated case identification is technologically plausible and should be explored.[39]
In conclusion, this national VHA MUE found that patients with uncomplicated pneumonia were commonly prescribed antimicrobials for the duration of therapy in excess of guideline recommendations. Patients with uncomplicated pneumonia who received therapy duration consistent with guideline recommendations did not have significantly different all‐cause readmission and death rates compared to patients receiving prolonged treatment. Approximately half of all therapy was prescribed upon hospital discharge, and clinicians as well as antimicrobial stewardship programs should consider these findings to address excessive duration of antimicrobial therapy upon hospital discharge.
Acknowledgements
The authors acknowledge Dr. Michael Fine for his assistance with utilization of the Pneumonia Severity Index, Kenneth Bukowski for assisting with development of data collection tools and data management, and members of the Antimicrobial Stewardship Taskforce Implementation Sub‐Committee. Collaborators in the Pneumonia Duration of Therapy Medication Utilization Evaluation Group include: Biloxi VA (VA Gulf Coast): Cheryl Hankins, PharmD, BCPS; Central Alabama VAMC: Lauren Rass, PharmD, BCPS, Kelly Mooney, PharmD, BCPS; Central Arkansas: Nicholas Tinsley, MS, PharmD; Chillicothe VA: Stephen Hanson, PharmD, BCPS, Beth Gallaugher, BSN, RN, Elizabeth Baltenberger, PharmD; Cincinnati VA: Jason Hiett, PharmD, BCPS, Victoria Tate, PharmD, BCPS, Brian Salzman, PharmD; Dorn Medical Center: MaryAnne Maurer, PharmD, BCPS, BCACP, Rebekah Sipes, PharmD, BCACP, Ginger Ervin, PharmD; Dwight D. Eisenhower VAMC: Emily Potter, PharmD; Hudson Valley: Rita Lee Bodine, PharmD, Clement Chen, PharmD, Cristina Fantino, PharmD; James H. Quillen VAMC: Marty Vannoy, PharmD, BCPS, Erin Harshbarger, PharmD, Kristen Nelsen, PharmD; Jesse Brown VAMC: Lisa Young, PharmD, BCPS, AQ‐ID, Andrea Bidlencik, PharmD, BCPS; Kansas City VA: Jamie Guyear, PharmD, AQ‐ID, Ann Ungerman, PharmD, BCPS, Lauri Witt, PharmD, BCACP; Louis Stokes Cleveland VAMC: Amy Hirsch, PharmD, BCPS, Steven Adoryan, PharmD, BCP‐CC, Amanda Miller, PharmD, BCPS; Maine VAMC: Joel Coon, PharmD, Rachel Naida, PharmD, Kelly Grossman, PharmD; Martinsburg VAMC: Kelly Li, PharmD, Sarah Mickanis, PharmD, BCPS; Miami VA Medical Center: Mara Carrasquillo, BS, PharmD, Maribel Toro, PharmD; North Florida/South Georgia Veterans Health System: Nora Morgan, PharmD, Hugh Frank, PharmD, BCPS, BCPP, Sarah Onofrio, PharmD, BCPS; North Texas HCS: Susan Duquaine, PharmD, BCPS, AQ‐ID, Ruben Villaneuva, PharmD, BCPS, Jaela Dahl, PharmD, BCPS; Ozarks: Andrew Siler, PharmD, BCPS, Michele Walker, PharmD, CGP, Jennifer Cole, PharmD, BCPS, BCCCP; Providence VAMC: Kerry LaPlante, PharmD, FCCP, Lindsey Williamson, PharmD; Richmond VA: Daniel Tassone, PharmD, BCPS; Salisbury VAMC: Brett Norem, PharmD, Marrisa Ragonesi, PharmD; San Juan VA: Monica Sanabria‐Seda, PharmD, BCPS, Jaime Velez‐Fores, PharmD, BCPS, AQ‐ID, Norma Ayala‐Burgos, PharmD; Sioux Falls VA: Andrea Aylward, PharmD, BCPS; South Texas HCS: Kelly Echevarria, PharmD, BCPS, AQ‐ID, Manuel Escobar, PharmD; Tennessee Valley HCS: Casey Ryals, PharmD, BCACP, Molly Hurst, PharmD, Jonathan Hale, PharmD; VA Central Iowa Health Care System: Jenny Phabmixay, PharmD, BCPS, Mackenzie Brown, PharmD, BCPS, Cynthia Muthusi, PharmD, BCPS; VA Loma Linda: Tony Chau, PharmD; VA Sierra Nevada: Scott Mambourg, PharmD, BCPS, AAHIVP, Matthew Han, PharmD, Nathan Mihoch, PharmD; VA WNY Healthcare System: Kari Mergenhagen, PharmD, BCPS, AQ‐ID, Christine Ruh, PharmD, BCPS; Veterans Affairs Salt Lake City Health System: Emily Spivak, MD, MHS, Patricia Orlando, PharmD
Disclosures: Karl Madaras‐Kelly is employed full time by Idaho State University and has a without compensation appointment as a clinical pharmacist at the Boise VA Medical Center. He receives grant support unrelated to this work through the Department of Veterans Affairs subcontracted to Idaho State University. Muriel Burk is employed full time through the Department of Veterans Affairs as clinical pharmacy specialist in outcomes and medication safety evaluation. Christina Caplinger was employed by the Department of Veterans Affairs as an infectious diseases fellow at the time this work was completed. She is currently employed by Micromedex. Jefferson Bohan is employed full time by the Department of Veterans Affairs as an infectious diseases fellow. Melinda Neuhauser is employed full time through the Department of Veterans Affairs as a clinical pharmacy specialistinfectious diseases. Matthew Goetz is employed full time through the Department of Veterans Affairs as an infectious diseases physician. Rhongping Zhang is employed full time through the Department of Veterans Affairs as a data analyst. Francesca Cunningham is employed full time through the Department of Veterans Affairs as the director of the VA Center for Medication Safety. This work was supported with resources and use of the Department of Veterans Affairs healthcare system. The views expressed in this article are solely those of the authors and do not necessarily reflect the position or policy of the Department of Veterans Affairs. The authors report no conflicts of interest.
Centers for Disease Control and Prevention. National hospital discharge survey 2010. Available at: http://www.cdc.gov/nchs/fastats/pneumonia.htm. Accessed December 1, 2014.
Barlam TF, Cosgrove SE, Abbo LM, et al. Implementing an antibiotic stewardship program: guidelines by the Infectious Diseases Society of America and the Society for Healthcare Epidemiology of America. Clin Infect Dis.2016;62(10):e51–e77.
Mandell LA, Wunderink RG, Anzueto A, et al. Infectious Diseases Society of America/American Thoracic Society consensus guidelines on the management of community‐acquired pneumonia in adults. Clin Infect Dis.2007;44(suppl 2):S27–S72.
American Thoracic Society; Infectious Diseases Society of America. Guidelines for the management of adults with hospital‐acquired, ventilator‐associated, and healthcare‐associated pneumonia. Am J Respir Crit Care Med.2005;171(4):388–416.
Dimopoulos G, Matthaiou DK, Karageorgopoulos DE, et al. Short‐ versus long‐course antibacterial therapy for community‐acquired pneumonia: a meta‐analysis. Drugs.2008;68(13):1841–1854.
Li JZ, Winston LG, Moore DH, et al. Efficacy of short‐course antibiotic regimens for community‐acquired pneumonia: a meta‐analysis. Am J Med.2007;120:783–790.
Dunbar LM, Wunderink RG, Habib MP, et al. High‐dose, short‐course levofloxacin for community‐acquired pneumonia: a new treatment paradigm. Clin Infect Dis.2003;37:752–760.
Siegel RE, Alicea M, Lee A, et al. Comparison of 7 versus 10 days of antibiotic therapy for hospitalized patients with uncomplicated community‐acquired pneumonia: a prospective. Am J Ther.1999;6(4):217–222.
el Moussaoui R, Borgie CA, Broek P, et al. Effectiveness of discontinuing antibiotic treatment after three days versus eight days in mild to moderate‐severe community acquired pneumonia: randomised, double blind trial. BMJ.2006;332(7554):1355.
Rizzato G, Montemurro L, Fraioli P, et al. Efficacy of a three day course of azithromycin in moderately severe community‐acquired pneumonia. Eur Respir J.1995;8(3):398–402.
Chastre J, Wolff M, Fagon J, et al. Comparison of 8 vs 15 days of antibiotic therapy for ventilator‐associated pneumonia in adults: a randomized trial. JAMA.2003;290(19):2588–2598.
Oosterheert JJ, Bonten MJ, Schneider MM, et al. Effectiveness of early switch from intravenous to oral antibiotics in severe community acquired pneumonia: multicentre randomized trial. BMJ.2006;333(7580):1193.
Graber CJ, Madaras‐Kelly K, Jones MM, Neuhauser MM, Goetz MB. Unnecessary antimicrobial use in the context of Clostridium difficile infection: a call to arms for the Veterans Affairs Antimicrobial Stewardship Task Force. Infect Control Hosp Epidemiol.2013;34(6):651–653.
VHA Directive 1031. Antimicrobial stewardship programs. Available at: https://www1.va.gov/vhapublications/ViewPublication.asp?pub_ID=2964. Accessed December 1, 2014.
Advic E, Cushinotto LA, Hughes AH, et al. Impact of an antimicrobial stewardship intervention on shortening the duration of therapy for community‐acquired pneumonia. Clin Infect Dis.2012;54:1581–1587.
Jenkins TC, Stella SA, Cervantes L, et al. Targets for antibiotic and healthcare resource stewardship in inpatient community‐acquired pneumonia: a comparison of management practices with National Guideline Recommendations. Infection.2013;41(1):135–144.
Sales MM, Cunningham FE, Glassman PA, Valentino MA, Good CB. Pharmacy benefits management in the Veterans Health Administration: 1995 to 2003. Am J Manag Care.2005;11(2):104–112.
Aronsky D, Haug PJ, Lagor C, Dean NC. Accuracy of administrative data for identifying patients with pneumonia. Am J Med Qual.2005;20(6):319–328.
Fine MJ, Auble TE, Yealy DM, et al. A prediction rule to identify low‐risk patients with community‐acquired pneumonia. N Engl J Med.1997;336:243–250.
Evans ME, Simbartl LA, Kralovic SM, Jain R, Roselle GA. Clostridium difficile infections in Veterans Health Administration acute care facilities. Infect Control Hosp Epidemiol.2014;35(8):1037–1042.
Korom‐Djakovic D, Canamucio A, Lempa M, Yano EM, Long JA. Organization complexity and primary care providers' perceptions of quality improvement culture within the Veterans Health Administration. Am J Med Qual.2016;31(2):139–146.
Lim WS, Baudouin SV, George RC, et al. BTS guidelines for the management of community acquired pneumonia in adults: update 2009. Thorax.2009;64(suppl 3):iii1–iii55.
National Institute for Health and Care Excellence. Pneumonia in adults: diagnosis and management. Available at: http://www.nice.org.uk/guidance/cg191. Published December 2014. Accessed May 9, 2016.
Siegel RE, Halpern NA, Almenoff PL, Lee A, Cashin R, Greene JG. A prospective randomized study of inpatient IV antibiotics for community‐acquired pneumonia: the optimal duration of therapy. Chest.1996;110(4):965–971.
Ramirez JA, Vargas S, Ritter GW, et al. Early switch from intravenous to oral antibiotics and early hospital discharge: a prospective observational study of 200 consecutive patients with community‐acquired pneumonia. Arch Intern Med.1999;159(20):2449–2454.
Sallach‐Ruma R, Nieman J, Sankaranarayanan J, Reardon T. Correlates and economic and clinical outcomes of an adult IV to PO antimicrobial conversion program at an academic medical center in Midwest United States. J Pharm Pract.2015;28(3):238–248.
Madaras‐Kelly K, Jones M, Remington R, et al. Antimicrobial De‐escalation of treatment for healthcare‐associated pneumonia within the Veterans Healthcare Administration. J Antimicrob Chemother.2016;71(2):539–546.
Deshpande A, Pasupuleti V, Thota P, et al. Community‐associated Clostridium difficile infection and antibiotics: a meta‐analysis. J Antimicrob Chemother.2013;68(9):1951.
Brown KA, Khanafer N, Daneman N, Fisman DN. Meta‐analysis of antibiotics and the risk of community‐associated Clostridium difficle infection. Antimicrob Agents Chemother.2013;57(5):2326–2332.
Rosen AK, Loveland S, Anderson JJ, et al. Evaluating diagnosis‐based case‐mix measures: how well do they apply to the VA population?Med Care.2001;39:692–704.
Nussenblatt V, Avdic E, Cosgrove S. What is the role of antimicrobial stewardship in improving outcomes of patients with CAP?Infect Dis Clin North Am.2013;27(1):211–228.
Lee JS, Nsa W, Hausmann LR, et al. Quality of care for elderly patients hospitalized for pneumonia in the United States, 2006 to 2010. JAMA Intern Med.2014;174(11):1806–1814.
Aldeyab MA, Kearney MP, Scott MG, et al. An evaluation of the impact of antibiotic stewardship on reducing the use of high‐risk antibiotics and its effect on the incidence of Clostridium difficile infection in hospital settings. J Antimicrob Chemother.2012;67(12):2988–2996.
Fridkin S, Baggs J, Fagan R, et al.; Centers for Disease Control and Prevention. Vital signs: improving antibiotic use among hospitalized patients. MMWR Morb Mortal Wkly Rep.2014;63(9):194–200.
Schuetz P, Christ‐Crain M, Thomann R et al. Effect of procalcitonin‐based guidelines vs standard guidelines on antibiotic use in lower respiratory tract infections: the ProHOSP randomized controlled trial. JAMA.2009;302(10):1059–1066.
Smith KJ, Wateska A, Nowalk MP, et al. Cost‐effectiveness of procalcitonin‐guided antibiotic use in community acquired pneumonia. J Gen Intern Med.2013;28(9):1157–1164.
Caplinger C, Crane K, Wilkin M, Bohan J, Remington R, Madaras‐Kelly KJ. Interim evaluation of a Protocol to Optimize the Duration of Pneumonia Therapy at Hospital Discharge. Open Forum Infect Dis.2015;2(suppl 1):S379.
Yogo N, Young H, Shihadeh K, et al. Intervention to improve antibiotic selection and shorten treatment durations at the time of hospital discharge. Open Forum Infect Dis.2015;2(suppl 1):S1.
DeLisle S, Kim B, Deepak J, et al. Using the electronic medical record to identify community‐acquired pneumonia: toward a replicable automated strategy. PLoS One.2013;8(8):e70944.
Pneumonia is the leading inpatient infectious diagnosis for which antimicrobials are prescribed in the United States.[1] Supported by moderate‐ to high‐quality evidence, guidelines produced jointly by the Infectious Diseases Society of America (IDSA) and American Thoracic Society (ATS) recommend treating pneumonia with the shortest appropriate duration of antimicrobial therapy to minimize risk for antimicrobial‐related adverse events.[2, 3, 4]
Evidence supports short duration of therapy for treatment of uncomplicated pneumonia.[3, 4, 5, 6, 7, 8, 9, 10, 11, 12] IDSA/ATS guidelines state, patients with CAP [community‐acquired pneumonia] should be treated for a minimum of 5 days (level 1 evidence), should be afebrile for 4872 hours, and should have no more than 1 CAP‐associated sign of clinical instabilitybefore discontinuation of therapy (level II evidence). (Moderate recommendation.) A longer duration of therapy may be warranted if initial therapy was not active against the identified pathogen or if it was complicated by [abscess, empyema, severe immunosuppression, or] extra‐pulmonary infection such as meningitis or endocarditis. (Weak recommendation; level III evidence).[3] Recommended therapy duration for patients with uncomplicated healthcare‐associated pneumonia (HCAP) who respond to initial therapy is 7 to 8 days unless gram‐negative nonfermenting rods or complications are identified (level I evidence).[4]
Within the Veterans Health Administration (VHA), the Antimicrobial Stewardship Taskforce (ASTF) was created to optimize care by developing, deploying, and monitoring a national‐level strategic plan for antimicrobial therapy management improvements.[13, 14] Although single‐center studies have found antimicrobial therapy for CAP being frequently prescribed for longer than recommended, the reproducibility of this finding across different facilities has not been assessed.[15, 16] The ASTF collaborated with the VHA Center for Medication Safety to assess total duration of antimicrobial therapy prescribed for veterans hospitalized with uncomplicated pneumonia.[17]
METHODS
This retrospective multicenter evaluation was conducted in 30 VHA facilities that volunteered to participate in this project. Inpatients discharged with a primary International Classification of Diseases, Ninth Revision, Clinical Modification (ICD‐9‐CM) diagnosis code for pneumonia (or pneumonia diagnosis secondary to primary sepsis diagnosis) during 2013 were evaluated.[18] Diagnoses, admissions, and patient demographics were identified using Veterans Affairs (VA) integrated databases through the Austin Integrated Technology Center. Up to 200 admissions per facility were randomly selected for review. Clinical pharmacists at each facility performed manual record reviews utilizing a standardized protocol and collection form. Completed cases were uploaded to a central database for analysis. Standardized chart abstraction was facilitated by detailed instructions, a data dictionary, and monthly conference calls.
Inclusion criteria required patient admission to any medical ward including intensive care unit (ICU) wards for 48 hours, receipt of >24 hours inpatient antimicrobial therapy (eg, at least 2 doses of a once‐daily antibiotic), documentation of pneumonia discharge diagnosis, and survival until discharge. Exclusion criteria were: complicated pneumonia (lung abscess, necrotizing pneumonia, thoracentesis performed), significant immunosuppression (cancer chemotherapy or absolute neutrophil count <1500 cell/mm3 within 28 days, organ transplantation, human immunodeficiency virus infection); or extrapulmonary infection (eg, meningitis, endocarditis).[3] Patients were also excluded if directly transferred from another inpatient facility, pneumonia occurred >48 hours after admission, index hospitalization was >14 days, previously hospitalized within 28 days prior to index admission, or discharged without documentation of completing a full course of therapy. In addition, patients who received initial therapy discordant with culture and susceptibility findings, were not clinically stable by discharge, or had gram‐negative nonfermentative bacilli cultured were excluded from analysis because according to the guidelines, either data are lacking to support a short duration of therapy such as initial discordant therapy, or a longer duration of therapy may be warranted such as gram‐negative nonfermentative bacilli and clinical instability at discharge.[4] Our intent for these exclusions was to minimize bias against clinician decision making for cases where a longer duration of therapy may have been appropriate.
Patients meeting all criteria had the following abstracted: demographics; prior healthcare exposures, admitting location (ICU or non‐ICU ward), parameters for calculation of Pneumonia Severity Index (PSI), culture results obtained 48 hours of admission, duration of antimicrobials administered during hospitalization and prescribed upon discharge (or recommendations for outpatient duration in the discharge summary for patients receiving medications from non‐VA sources), daily clinical stability assessment, Clostridium difficile infection (CDI) test results, and readmission or death within 28 days of discharge.[19]
Guideline‐similar CAP therapy duration was defined as a minimum of 5 days of antimicrobials, up to a maximum of 3 additional days beginning the first day the patient was afebrile and exhibited 1 sign of clinical instability (heart rate > 100 beats/minute, respiratory rate >24 breaths/minute, systolic blood pressure <90, oxygen saturation <90% or partial pressure of oxygen <60 mm Hg on room air or baseline O2 requirements, or not returned to baseline mental status).[3] This definition was made by consensus decision of the investigators and was necessary to operationalize the relationship between clinical stability and appropriate duration of therapy. Guideline‐similar HCAP therapy duration was defined as 8 days.[4] CDI was defined in accordance with VA criteria for hospital onset and community‐onset healthcare‐facilityassociated CDI.[20] All‐cause hospital readmission and all‐cause death were defined as inpatient readmission or any death, respectively, within 28 days after discharge for the pneumonia admission.
Demographics, comorbidities, microbiology results, antimicrobial utilization, CDI, readmission, and death rates between guideline‐similar and guideline‐excessive duration of antimicrobial therapy groups were characterized with descriptive statistics, Mann‐Whitney U test, or 2 test as indicated (significance defined as P < 0.05). Multivariable logistic regression (SAS version 9.3 [SAS Institute, Cary, NC]) was used to assess association between duration of therapy exceeding recommended guidelines with all‐cause readmission and all‐cause death after adjustment for pertinent covariates. Odds ratios (OR) with 95% confidence intervals ( 95% CI) were reported. This medication utilization evaluation (MUE) was reviewed by the Hines VHA Institutional Review Board for Human Subjects Protection. Based on VHA Policy Handbook 1058.05, which defines operations activities that may constitute research, the board determined that the evaluation constituted quality improvement rather than research, and thus was exempt from VHA Human Subjects Research requirements.
RESULTS
There were 3881 admissions eligible for chart review. After manual chart review of inclusion and exclusion criteria, 1739 (44.8%) patients were available for duration of therapy analysis. (Figure 1). Only 1 admission for each patient was analyzed.
Figure 1
Application of inclusion and exclusion criteria for the pneumonia duration of therapy evaluation. Abbreviations: CAP, community‐acquired pneumonia; HCAP, healthcare‐associated pneumonia; ICD‐9, International Classification of Diseases, Ninth Revision; VA, Veterans Affairs.
The cohort was comprised primarily of elderly male patients (96.6%) of whom more than two‐thirds were hospitalized for CAP (Table 1). Most patients had significant disease severity as indicated by PSI score; however, only 12% were directly admitted to the ICU. Blood cultures were collected in >95% of cases; lower respiratory cultures were obtained in 39.9% of cases.
Demographic and Other Characteristics of the Pneumonia Cohort (n = 1,739)
Characteristic
Value
NOTE: Abbreviations: SD, standard deviation; VA, Veterans Affairs.
Age, y, mean SD
71.8 (12.7)
Gender, male, n (%)
1,680 (96.6)
Living environment at time of index admission, n (%)
Home
1,416 (81.4)
VA community‐based living center
88 (5.1)
Non‐VA long‐term skilled care facility
95 (5.5)
Assisted living facility
52 (2.9)
Not documented
46 (2.7)
Other
29 (1.7)
Prior healthcare exposures, n (%)
Prior hospitalization within last 90 days
310 (17.8)
Residence in a long‐term skilled care facility in last 90 days
209 (12.0)
Chronic dialysis within last 28 days
52 (3.0)
Intravenous antimicrobials within last 28 days
76 (4.4)
Wound, tracheostomy, or ventilator care in last 28 days
37 (2.1)
Community‐acquired pneumonia, n (%)
1,195 (68.7)
Healthcare‐associated pneumonia, n (%)
544 (31.3)
Comorbidities, n (%)
Renal disease
438 (25.2)
Liver disease
39 (2.2)
Congestive heart failure
436 (25.1)
Cerebrovascular disease
356 (20.4)
Neoplastic disease (excluding skin)
384 (22.1)
Severity of illness, n (%)
Pneumonia Severity Index
Class I
30 (1.8)
Class II
198 (11.4)
Class III
349 (20.1)
Class IV
759 (43.6)
Class V
403 (23.2)
Intensive care upon admission
212 (12.2)
Culture collection 48 hours of admission, n (%)
1,687 (97.0)
Blood
1,631 (96.7)
Lower respiratory tract (sputum)
673 (39.9)
Bronchoalveolar lavage
20 (1.2)
Urine
632 (37.5)
Skin/wound
3 (0.2)
Other
158 (9.4)
Facility complexity, n (%)
Level 1a‐c
1,286 (74.0)
Level 2
437 (25.1)
Level 3
16 (0.9)
Commonly administered antimicrobials during hospitalization and at discharge are summarized in Table 2. Anti‐pseudomonal ‐lactams and antimethicillin‐resistant Staphylococcus aureus antimicrobials were more frequently administered to patients with HCAP, whereas third‐generation cephalosporins and macrolides were more likely to be administered to patients with CAP. Fluoroquinolones were prescribed to 55.3% of patients upon discharge.
Antimicrobials Administered During Hospitalization and Dispensed Upon Discharge
Inpatient Antimicrobials Administered*
Portion of Cohort Receiving Antimicrobial, n (%), n = 1,739
Therapy Duration Similar With Guidelines, n (%), n = 241
Therapy Duration Exceeding Guidelines, n (%), n = 1,498
Significance
Antimicrobials Dispensed or Recommended at Discharge
Portion of Cohort Receiving Antimicrobial, n (%), n = 1,471
Therapy Duration Similar With Guidelines, n (%), n = 151
Therapy Duration Exceeding Guidelines, n (%), n = 1,320
Significance
NOTE: Third‐generation cephalosporins: ceftriaxone, cefotaxime, cefpodoxime, cefprozil, cefdinir, cefuroxime. Fluoroquinolones: moxifloxacin, levofloxacin, ciprofloxacin. Macrolides: azithromycin, clarithromycin. Pseudomonal lactams: piperacillin/tazobactam, cefepime, ceftazidime, aztreonam, meropenem, imipenem. Anti‐MRSA antimicrobials: vancomycin, linezolid, ceftaroline. Other ‐lactams: ampicillin/sulbactam, amoxicillin/clavulanic acid, ampicillin, amoxicillin, penicillin, nafcillin, dicloxacillin, cefazolin, cephalexin, ertapenem. Tetracyclines: doxycycline, minocycline, tigecycline. Other: clindamycin, metronidazole, trimethoprim/sulfamethoxazole, gentamicin, tobramycin, amikacin, polymyxin B. Abbreviations: CAP, community‐acquired pneumonia; HCAP, healthcare‐associated pneumonia; MRSA, methicillin‐resistant Staphylococcus aureus; VA, Veterans Affairs. *Includes all patients (n = 1,739) administered at least 1 dose of antimicrobial. The majority of patients in this group were CAP patients for whom the guideline‐similar duration of therapy was less than that allowed for HCAP patients. Note: The majority of patients in this group were HCAP patients for whom the guideline‐similar duration of therapy was shorter than that allowed for CAP patients. Includes all patients who had a VA prescription dispensed within 24 hours of hospital discharge or had an antimicrobial and duration recommended in the discharge summary.
Third‐generation cephalosporins
809 (46.5)
75 (31.1)
734 (49.0)
<0.001
Fluoroquinolones
836 (48.1)
114 (47.3)
722 (48.2)
0.80
Macrolides
788 (45.3)
90 (37.3)
698 (46.6)
<0.01
Pseudomonal ‐lactams
692 (39.8)
138 (57.3)
554 (37.0)
0.01
Anti‐MRSA antimicrobials
663 (38.1)
135 (56.0)
528 (35.3)
<0.01
Other ‐lactams
139 (8.0)
10 (4.2)
129 (8.6)
0.02
Tetracyclines
119 (6.8)
14 (5.8)
105 (7.0)
0.49
Other
97 (5.6)
15 (6.2)
82 (5.5)
0.64
Third‐generation cephalosporins
285 (19.4)
27 (17.9)
258 (19.6)
0.62
Fluoroquinolones
813 (55.3)
95 (62.9)
718 (54.4)
0.05
Macrolides
203 (13.8)
20 (13.3)
183 (13.9)
0.83
Pseudomonal ‐lactams
31 (2.1)
4 (2.7)
27 (2.1)
0.62
Anti‐MRSA antimicrobials
45 (3.1)
6 (4.0)
39 (3.0)
0.49
Other ‐lactams
239 (16.3)
13 (8.6)
226 (17.1)
0.01
Tetracyclines
95 (6.5)
10 (6.6)
85 (6.4)
0.93
Other
44 (3.0)
5 (3.3)
39 (3.0)
0.81
Overall, 13.9% of patients with uncomplicated pneumonia received guideline‐similar duration of therapy (Table 3). A greater proportion of HCAP patients (29.0%) received guideline‐similar therapy duration as compared to CAP patients (6.9%) (P < 0.01 (Table 3). Median duration of therapy was 7 days (interquartile range [IQR] = 78 days) for guideline‐similar therapy compared to 10 days (913 days) for therapy duration in excess of guideline recommendations. Overall, 97.1 % of patients met clinical stability criteria before day 4 of therapy, yet 50% received 4 days of intravenous (IV) therapy (median was 4 days, IQR = 36 days). Antimicrobial therapy was generally completed after discharge, as only 17.3% received their entire treatment course during hospitalization. Median duration of outpatient oral (PO) antimicrobial therapy was twice as long for guideline‐excessive therapy compared to guideline‐similar therapy (6 vs 3 days), whereas duration of inpatient IV and PO antimicrobial therapy was similar. Patients discharged on a fluoroquinolone were more likely to receive guideline‐similar duration of therapy. The VHA classifies facilities into 3 levels of complexity, with lower scores indicating more complex facilities.[21] Guideline‐similar therapy duration occurred in 10.4% of cases in lower complexity facilities (levels 2 and 3),and 15.1% in more complex facilities (level 1) (P = 0.01). The median duration of therapy was similar for more and less complex facilities, respectively (10 days, IQR = 812 days vs 10 days, IQR = 813 days).
Duration of Antimicrobial Therapy Administered for Uncomplicated Pneumonia and Clinical Outcomes of Interest
Outcome
Therapy Duration
Similar With IDSA/ATS Guidelines
Therapy Duration in Excess of IDSA/ATS Guideline Recommendations
Significance
NOTE: Abbreviations: CAP, community acquired pneumonia; HCAP, healthcare‐associated pneumonia; NR, not relevant. *Denominators for each row are stratified by all included and nonexcluded patients who had CAP and HCAP, respectively. CAP versus HCAP, P < 0.01. n = 1,403. n = 76. ∥Denominators for each row are stratified by guideline concordance and discordance and patients who had CAP and HCAP, respectively. Twenty‐eightday hospital readmission, guideline concordant therapy, CAP versus HCAP, P < 0.01. # Twenty‐eightday hospital readmission, guideline discordant therapy, CAP versus HCAP, P < 0.01. **HCAP versus CAP P values not significant.
Antimicrobial duration consistent with guideline recommendations, n (%)
241 (13.9)
1,498 (86.1)
NR
CAP*
83 (6.9)
1,112 (93.1)
NR
HCAP*
158 (29.0)
386 (71.0)
NR
Total days of therapy for pneumonia, median (IQR)
7 (78)
10 (913)
NR
CAP
6 (59)
10 (812)
<0.01
HCAP
7 (78)
11 (1014)
<0.01
Days of IV therapy administered for pneumonia, median (IQR)
4 (37)
4 (36)
0.50
Days of PO inpatient therapy administered, median (IQR)
1 (03)
1 (03)
0.78
Days of PO outpatient therapy dispensed at discharge, median (IQR)
3 (25)
6 (47)
<0.01
Days of PO outpatient therapy recommended in Discharge Summary for patients without a VA prescription, median (IQR)
3 (24)
5 (47)
<0.01
Aggregate 28‐day hospital readmission, n (%)
42 (17.4)
183 (12.2)
0.03
CAP∥#
7 (8.4)
112 (10.1)
0.58
HCAP∥#
35 (22.2)
71 (18.4)
0.28
Aggregate 28‐day CDI rate, n (%)
6 (2.5)
9 (0.6)
0.03
CAP∥**
1 (1.2)
6 (0.5)
0.44
HCAP∥**
5 (3.2)
3 (0.8)
0.04
Aggregate 28‐day death after discharge, n (%)
6 (2.5)
52 (3.5)
0.43
CAP∥**
1 (1.2)
33 (3.0)
0.35
HCAP∥**
5 (3.2)
19 (4.9)
0.37
The 28‐day postdischarge all‐cause readmission rate for patients who received guideline‐similar therapy duration was higher (17.4%) than for patients who received therapy duration in excess of guideline recommendations (12.2%) (P = 0.03). After adjustment for covariates associated with readmission (HCAP, age, prior skilled nursing facility residence, PSI score comorbidity elements), we found no evidence that patients who received guideline‐similar therapy duration were more likely to be readmitted than were patients who received guideline‐excessive duration (OR: 1.1 [95% CI: 0.8, 1.7]) (Table 3). Likewise, no difference in 28‐day all‐cause postdischarge mortality was identified between guideline‐similar and guideline‐excessive duration after adjustment for the same covariates (adjusted OR: 0.5 [95% CI: 0.2, 1.2]) (Table 4).
Multivariable Models for 28‐Day Readmission and Mortality
CDI cases (n = 15) were too sparse to adequately perform multivariable logistic regression analysis; however, a higher percentage of patients who received guideline‐similar duration of therapy developed CDI compared to patients who received guideline‐excessive duration of therapy (40.0% vs 13.6%, P < 0.01). The median duration of therapy for patients who did and did not develop CDI was similar (8 days, IQR = 714 days vs 10 days, IQR = 812 days, P = 0.85, respectively). Patients who developed CDI had a higher rate of HCAP diagnosis (1.5% vs 0.6%; P = 0.06), were more likely to have concomitant non‐pneumonia infection (40.0% vs 9.5%, P < 0.01), have chronic comorbidity (86.7% vs 59.1%, P = 0.03), and to have been admitted to the ICU (26.7% vs 12.1%, P = 0.09).
DISCUSSION
IDSA/ATS guidelines for pneumonia duration of therapy generally agree with other professional society guidelines including the British Thoracic Society and National Institute for Health and Care Excellence.[22, 23] In contrast to existing evidence and guideline recommendations, this multi‐centered evaluation identified prolonged durations of antimicrobial therapy prescribed in 93% and 71% of patients with uncomplicated CAP and HCAP (Table 3), respectively.[3, 4, 5, 6, 7, 8, 9, 10, 11, 12] Almost all (97.1%) uncomplicated CAP and HCAP patients met clinical stability criteria before day 4 of hospitalization, yet the median duration of IV therapy was 4 days. Because criteria for IV to PO conversion and the clinical stability definition utilized in this analysis were similar, many patients may have been eligible for PO therapy earlier, favorably impacting length of stay, cost, and adverse effects.[3, 12, 24, 25, 26] Although median days of inpatient PO therapy administered was 1 day (IQR = 03 days), inpatient observation after PO conversion may not be necessary. The duration of PO therapy was based on calendar days, where if a patient received 1 dose of a once daily antibiotic (ie, levofloxacin), they were considered to have received 1 day of inpatient PO antibiotics even if discharged the same day.
Approximately half of all days of therapy occurred after discharge. Although the median therapy duration for inpatients was similar, the median duration of antimicrobials administered upon hospital discharge was twice as long for patients receiving guideline‐excessive compared to guideline‐similar duration of therapy. The median excess in antibiotic duration is almost entirely accounted for by excess outpatient days of therapy. This is an important consideration for antimicrobial stewardship programs that tend to focus on inpatient antimicrobial use.
Noteworthy observations include the low rate of respiratory tract culture collection (41%) and frequent use of fluoroquinolones upon discharge. Collection of respiratory tract cultures is recommended for all patients with HCAP and patients with CAP who have risk factors for resistant pathogens, characteristics that were common in this cohort.[3, 4] Recently, we identified that respiratory culture collection is associated with increased de‐escalation rates in HCAP, and that culture‐negative patients frequently receive fluoroquinolones.[27] IDSA/ATS CAP guidelines discourage empirically switching to PO fluoroquinolone therapy based on bioavailability considerations alone.[3] Further, fluoroquinolones are considered to be associated with high risk of CDI.[28, 29] Prescription of fluoroquinolone upon discharge was associated with guideline‐similar duration of therapy and was not shown to be associated with CDI; however, power to detect differences between exposures to specific antimicrobials and CDI was low.
CDI was more common in patients with CAP (1.2% vs 0.5%) and HCAP (3.2% vs 0.8%) who received duration of therapy similar with guideline recommendations. This observation is confounded, as patients with CDI had significantly greater comorbidity as well as secondary infections and tended to more frequently receive ICU care. There were no differences in adjusted rates of readmission or death between patients receiving guideline‐similar and guideline‐excessive duration of therapy.
Evaluation strengths included exclusion of patients with complicating conditions possibly requiring prolonged antimicrobial treatment courses, which allowed the evaluation to focus on patients most likely to benefit from shorter course therapy. The definition of appropriate therapy duration was based upon daily assessment of clinical stability criteria that paralleled the CAP guidelines. The definition utilized objective parameters while accounting for patient variability in achieving clinical stability criteria. Finally, the analyses of clinical end points suggest that shorter duration of therapy may be as safe and effective as longer duration of therapy in uncomplicated pneumonia.
Limitations include those common to other analyses conducted within the VHA, including a predominantly elderly male cohort.[30] Only ICD‐9‐CM codes consistent with a discharge diagnosis of pneumonia were used to identify the cohort, and clinical impressions not documented in the medical record may have impacted the clinician's treatment duration decisions. The upper limit of appropriate duration of therapy for CAP was arbitrarily set at up to 3 days beyond meeting clinical stability criteria to provide a reasonable duration of appropriate therapy beyond clinical stability to operationalize the duration of therapy recommendations within the context of the IDSA/ATS guidelines. Additionally, CIs for the ORs of readmission and mortality were broad, and thus too imprecise to determine whether guideline‐similar durations increased or decreased readmission or mortality in comparison with therapy that exceeded guideline recommendations. We could not fully assess the potential for association between guideline‐excessive therapy duration and risk for CDI due to sparse cases. Finally, non‐VA prescription data were not available for all patients, and we relied on intended duration of therapy as recommended by the discharging provider in 4.1% of cases.
Most quality assessments of pneumonia treatment have focused on antimicrobial selection and timely administration or conversion from IV to PO therapy.[31, 32] This evaluation identified potential opportunities for expansion of antimicrobial stewardship activities during the transition of care setting. The efficacy of short‐course ‐lactam, macrolide, or fluoroquinolone therapy for CAP appears equivalent to longer treatment regimens with no difference in adverse event rates, suggesting that optimal duration of therapy may be a rational target for quality improvement.[5, 6, 7, 8, 9, 10, 11, 12, 15, 31] Recommendations for HCAP duration of therapy are extrapolated from a prospective multicentered study, which randomized patients with hospital‐acquired pneumonia to receive 8 versus 15 days of therapy, that identified similar outcomes to ours.[4, 12]
Single‐center studies have identified that antimicrobial therapy for pneumonia is frequently prescribed for longer than recommended by guidelines, which found a similar median duration of therapy as our evaluation.[15, 16] Similar to Jenkins et al., we observed a high rate of fluoroquinolone prescriptions upon discharge.[16]
There are few published examples of interventions designed to limit excessive duration of therapy, particularly for antimicrobials prescribed upon hospital discharge.[15, 33, 34] Serial procalcitonin measurements have been used to guide duration of therapy for pneumonia; however, the costbenefit ratio of procalcitonin measurement is unclear.[35, 36] Procalcitonin use was uncommon, and none of the participating facilities in our evaluation utilized a specific algorithm to guide therapy duration. Limited data suggest that patient‐level prospective audit with feedback may be effective. Advic et al. evaluated management of presumed CAP before and after education and prospective feedback to medical teams concerning antimicrobial selection and duration of therapy.[15] The intervention led to a decrease in median duration of therapy from 10 days (IQR = 813 days) to 7 days (IQR = 78 days) without increasing clinical failure or readmission rates. We recently reported a single‐center evaluation in which pharmacists utilizing a decision support tool while performing discharge medication reconciliation were able to reduce excessive mean duration of therapy from 9.5 days ( 2.4 days) to 8.3 days ( 2.9 days) in patients without complicated pneumonia, with a 19.2% reduction in duration of therapy prescribed at discharge.[37] A similar approach utilizing pharmacists performing discharge review has recently been reported in a community hospital.[38]
Future work should recognize that few patients complete their entire course of therapy as inpatients, and the majority of treatment is prescribed upon discharge. Pivotal time points for antimicrobial stewardship intervention include day 2 to 3 of hospitalization when conveying suggestions for antimicrobial de‐escalation and/or IV to PO conversion, and toward the end of hospitalization during discharge planning. Although it may not be feasible for antimicrobial stewards to review all uncomplicated cases of pneumonia during hospitalization, most facilities have a systematic process for reviewing medications during transitions of care. We believe that interventions intended to assess and recommend shortened courses of therapy are appropriate. These interventions should include a mechanism for support by stewardship personnel or other infectious diseases specialists. Based on our evaluation, the ASTF produced and disseminated clinical guidance documents and tools to triage pneumonia case severity and assess response to therapy. Qualified personnel are encouraged to use this information to make recommendations to providers regarding excessive duration of therapy for uncomplicated cases where appropriate. Other work should include an in‐depth assessment of clinical outcomes related to treatment duration, investigation of provider rationale for prolonged treatment, and duration of antimicrobial therapy prescribed upon discharge for other common disease states. Finally, manual chart review to classify uncomplicated cases and related outcomes was laborious, and automated case identification is technologically plausible and should be explored.[39]
In conclusion, this national VHA MUE found that patients with uncomplicated pneumonia were commonly prescribed antimicrobials for the duration of therapy in excess of guideline recommendations. Patients with uncomplicated pneumonia who received therapy duration consistent with guideline recommendations did not have significantly different all‐cause readmission and death rates compared to patients receiving prolonged treatment. Approximately half of all therapy was prescribed upon hospital discharge, and clinicians as well as antimicrobial stewardship programs should consider these findings to address excessive duration of antimicrobial therapy upon hospital discharge.
Acknowledgements
The authors acknowledge Dr. Michael Fine for his assistance with utilization of the Pneumonia Severity Index, Kenneth Bukowski for assisting with development of data collection tools and data management, and members of the Antimicrobial Stewardship Taskforce Implementation Sub‐Committee. Collaborators in the Pneumonia Duration of Therapy Medication Utilization Evaluation Group include: Biloxi VA (VA Gulf Coast): Cheryl Hankins, PharmD, BCPS; Central Alabama VAMC: Lauren Rass, PharmD, BCPS, Kelly Mooney, PharmD, BCPS; Central Arkansas: Nicholas Tinsley, MS, PharmD; Chillicothe VA: Stephen Hanson, PharmD, BCPS, Beth Gallaugher, BSN, RN, Elizabeth Baltenberger, PharmD; Cincinnati VA: Jason Hiett, PharmD, BCPS, Victoria Tate, PharmD, BCPS, Brian Salzman, PharmD; Dorn Medical Center: MaryAnne Maurer, PharmD, BCPS, BCACP, Rebekah Sipes, PharmD, BCACP, Ginger Ervin, PharmD; Dwight D. Eisenhower VAMC: Emily Potter, PharmD; Hudson Valley: Rita Lee Bodine, PharmD, Clement Chen, PharmD, Cristina Fantino, PharmD; James H. Quillen VAMC: Marty Vannoy, PharmD, BCPS, Erin Harshbarger, PharmD, Kristen Nelsen, PharmD; Jesse Brown VAMC: Lisa Young, PharmD, BCPS, AQ‐ID, Andrea Bidlencik, PharmD, BCPS; Kansas City VA: Jamie Guyear, PharmD, AQ‐ID, Ann Ungerman, PharmD, BCPS, Lauri Witt, PharmD, BCACP; Louis Stokes Cleveland VAMC: Amy Hirsch, PharmD, BCPS, Steven Adoryan, PharmD, BCP‐CC, Amanda Miller, PharmD, BCPS; Maine VAMC: Joel Coon, PharmD, Rachel Naida, PharmD, Kelly Grossman, PharmD; Martinsburg VAMC: Kelly Li, PharmD, Sarah Mickanis, PharmD, BCPS; Miami VA Medical Center: Mara Carrasquillo, BS, PharmD, Maribel Toro, PharmD; North Florida/South Georgia Veterans Health System: Nora Morgan, PharmD, Hugh Frank, PharmD, BCPS, BCPP, Sarah Onofrio, PharmD, BCPS; North Texas HCS: Susan Duquaine, PharmD, BCPS, AQ‐ID, Ruben Villaneuva, PharmD, BCPS, Jaela Dahl, PharmD, BCPS; Ozarks: Andrew Siler, PharmD, BCPS, Michele Walker, PharmD, CGP, Jennifer Cole, PharmD, BCPS, BCCCP; Providence VAMC: Kerry LaPlante, PharmD, FCCP, Lindsey Williamson, PharmD; Richmond VA: Daniel Tassone, PharmD, BCPS; Salisbury VAMC: Brett Norem, PharmD, Marrisa Ragonesi, PharmD; San Juan VA: Monica Sanabria‐Seda, PharmD, BCPS, Jaime Velez‐Fores, PharmD, BCPS, AQ‐ID, Norma Ayala‐Burgos, PharmD; Sioux Falls VA: Andrea Aylward, PharmD, BCPS; South Texas HCS: Kelly Echevarria, PharmD, BCPS, AQ‐ID, Manuel Escobar, PharmD; Tennessee Valley HCS: Casey Ryals, PharmD, BCACP, Molly Hurst, PharmD, Jonathan Hale, PharmD; VA Central Iowa Health Care System: Jenny Phabmixay, PharmD, BCPS, Mackenzie Brown, PharmD, BCPS, Cynthia Muthusi, PharmD, BCPS; VA Loma Linda: Tony Chau, PharmD; VA Sierra Nevada: Scott Mambourg, PharmD, BCPS, AAHIVP, Matthew Han, PharmD, Nathan Mihoch, PharmD; VA WNY Healthcare System: Kari Mergenhagen, PharmD, BCPS, AQ‐ID, Christine Ruh, PharmD, BCPS; Veterans Affairs Salt Lake City Health System: Emily Spivak, MD, MHS, Patricia Orlando, PharmD
Disclosures: Karl Madaras‐Kelly is employed full time by Idaho State University and has a without compensation appointment as a clinical pharmacist at the Boise VA Medical Center. He receives grant support unrelated to this work through the Department of Veterans Affairs subcontracted to Idaho State University. Muriel Burk is employed full time through the Department of Veterans Affairs as clinical pharmacy specialist in outcomes and medication safety evaluation. Christina Caplinger was employed by the Department of Veterans Affairs as an infectious diseases fellow at the time this work was completed. She is currently employed by Micromedex. Jefferson Bohan is employed full time by the Department of Veterans Affairs as an infectious diseases fellow. Melinda Neuhauser is employed full time through the Department of Veterans Affairs as a clinical pharmacy specialistinfectious diseases. Matthew Goetz is employed full time through the Department of Veterans Affairs as an infectious diseases physician. Rhongping Zhang is employed full time through the Department of Veterans Affairs as a data analyst. Francesca Cunningham is employed full time through the Department of Veterans Affairs as the director of the VA Center for Medication Safety. This work was supported with resources and use of the Department of Veterans Affairs healthcare system. The views expressed in this article are solely those of the authors and do not necessarily reflect the position or policy of the Department of Veterans Affairs. The authors report no conflicts of interest.
References
Centers for Disease Control and Prevention. National hospital discharge survey 2010. Available at: http://www.cdc.gov/nchs/fastats/pneumonia.htm. Accessed December 1, 2014.
Barlam TF, Cosgrove SE, Abbo LM, et al. Implementing an antibiotic stewardship program: guidelines by the Infectious Diseases Society of America and the Society for Healthcare Epidemiology of America. Clin Infect Dis.2016;62(10):e51–e77.
Mandell LA, Wunderink RG, Anzueto A, et al. Infectious Diseases Society of America/American Thoracic Society consensus guidelines on the management of community‐acquired pneumonia in adults. Clin Infect Dis.2007;44(suppl 2):S27–S72.
American Thoracic Society; Infectious Diseases Society of America. Guidelines for the management of adults with hospital‐acquired, ventilator‐associated, and healthcare‐associated pneumonia. Am J Respir Crit Care Med.2005;171(4):388–416.
Dimopoulos G, Matthaiou DK, Karageorgopoulos DE, et al. Short‐ versus long‐course antibacterial therapy for community‐acquired pneumonia: a meta‐analysis. Drugs.2008;68(13):1841–1854.
Li JZ, Winston LG, Moore DH, et al. Efficacy of short‐course antibiotic regimens for community‐acquired pneumonia: a meta‐analysis. Am J Med.2007;120:783–790.
Dunbar LM, Wunderink RG, Habib MP, et al. High‐dose, short‐course levofloxacin for community‐acquired pneumonia: a new treatment paradigm. Clin Infect Dis.2003;37:752–760.
Siegel RE, Alicea M, Lee A, et al. Comparison of 7 versus 10 days of antibiotic therapy for hospitalized patients with uncomplicated community‐acquired pneumonia: a prospective. Am J Ther.1999;6(4):217–222.
el Moussaoui R, Borgie CA, Broek P, et al. Effectiveness of discontinuing antibiotic treatment after three days versus eight days in mild to moderate‐severe community acquired pneumonia: randomised, double blind trial. BMJ.2006;332(7554):1355.
Rizzato G, Montemurro L, Fraioli P, et al. Efficacy of a three day course of azithromycin in moderately severe community‐acquired pneumonia. Eur Respir J.1995;8(3):398–402.
Chastre J, Wolff M, Fagon J, et al. Comparison of 8 vs 15 days of antibiotic therapy for ventilator‐associated pneumonia in adults: a randomized trial. JAMA.2003;290(19):2588–2598.
Oosterheert JJ, Bonten MJ, Schneider MM, et al. Effectiveness of early switch from intravenous to oral antibiotics in severe community acquired pneumonia: multicentre randomized trial. BMJ.2006;333(7580):1193.
Graber CJ, Madaras‐Kelly K, Jones MM, Neuhauser MM, Goetz MB. Unnecessary antimicrobial use in the context of Clostridium difficile infection: a call to arms for the Veterans Affairs Antimicrobial Stewardship Task Force. Infect Control Hosp Epidemiol.2013;34(6):651–653.
VHA Directive 1031. Antimicrobial stewardship programs. Available at: https://www1.va.gov/vhapublications/ViewPublication.asp?pub_ID=2964. Accessed December 1, 2014.
Advic E, Cushinotto LA, Hughes AH, et al. Impact of an antimicrobial stewardship intervention on shortening the duration of therapy for community‐acquired pneumonia. Clin Infect Dis.2012;54:1581–1587.
Jenkins TC, Stella SA, Cervantes L, et al. Targets for antibiotic and healthcare resource stewardship in inpatient community‐acquired pneumonia: a comparison of management practices with National Guideline Recommendations. Infection.2013;41(1):135–144.
Sales MM, Cunningham FE, Glassman PA, Valentino MA, Good CB. Pharmacy benefits management in the Veterans Health Administration: 1995 to 2003. Am J Manag Care.2005;11(2):104–112.
Aronsky D, Haug PJ, Lagor C, Dean NC. Accuracy of administrative data for identifying patients with pneumonia. Am J Med Qual.2005;20(6):319–328.
Fine MJ, Auble TE, Yealy DM, et al. A prediction rule to identify low‐risk patients with community‐acquired pneumonia. N Engl J Med.1997;336:243–250.
Evans ME, Simbartl LA, Kralovic SM, Jain R, Roselle GA. Clostridium difficile infections in Veterans Health Administration acute care facilities. Infect Control Hosp Epidemiol.2014;35(8):1037–1042.
Korom‐Djakovic D, Canamucio A, Lempa M, Yano EM, Long JA. Organization complexity and primary care providers' perceptions of quality improvement culture within the Veterans Health Administration. Am J Med Qual.2016;31(2):139–146.
Lim WS, Baudouin SV, George RC, et al. BTS guidelines for the management of community acquired pneumonia in adults: update 2009. Thorax.2009;64(suppl 3):iii1–iii55.
National Institute for Health and Care Excellence. Pneumonia in adults: diagnosis and management. Available at: http://www.nice.org.uk/guidance/cg191. Published December 2014. Accessed May 9, 2016.
Siegel RE, Halpern NA, Almenoff PL, Lee A, Cashin R, Greene JG. A prospective randomized study of inpatient IV antibiotics for community‐acquired pneumonia: the optimal duration of therapy. Chest.1996;110(4):965–971.
Ramirez JA, Vargas S, Ritter GW, et al. Early switch from intravenous to oral antibiotics and early hospital discharge: a prospective observational study of 200 consecutive patients with community‐acquired pneumonia. Arch Intern Med.1999;159(20):2449–2454.
Sallach‐Ruma R, Nieman J, Sankaranarayanan J, Reardon T. Correlates and economic and clinical outcomes of an adult IV to PO antimicrobial conversion program at an academic medical center in Midwest United States. J Pharm Pract.2015;28(3):238–248.
Madaras‐Kelly K, Jones M, Remington R, et al. Antimicrobial De‐escalation of treatment for healthcare‐associated pneumonia within the Veterans Healthcare Administration. J Antimicrob Chemother.2016;71(2):539–546.
Deshpande A, Pasupuleti V, Thota P, et al. Community‐associated Clostridium difficile infection and antibiotics: a meta‐analysis. J Antimicrob Chemother.2013;68(9):1951.
Brown KA, Khanafer N, Daneman N, Fisman DN. Meta‐analysis of antibiotics and the risk of community‐associated Clostridium difficle infection. Antimicrob Agents Chemother.2013;57(5):2326–2332.
Rosen AK, Loveland S, Anderson JJ, et al. Evaluating diagnosis‐based case‐mix measures: how well do they apply to the VA population?Med Care.2001;39:692–704.
Nussenblatt V, Avdic E, Cosgrove S. What is the role of antimicrobial stewardship in improving outcomes of patients with CAP?Infect Dis Clin North Am.2013;27(1):211–228.
Lee JS, Nsa W, Hausmann LR, et al. Quality of care for elderly patients hospitalized for pneumonia in the United States, 2006 to 2010. JAMA Intern Med.2014;174(11):1806–1814.
Aldeyab MA, Kearney MP, Scott MG, et al. An evaluation of the impact of antibiotic stewardship on reducing the use of high‐risk antibiotics and its effect on the incidence of Clostridium difficile infection in hospital settings. J Antimicrob Chemother.2012;67(12):2988–2996.
Fridkin S, Baggs J, Fagan R, et al.; Centers for Disease Control and Prevention. Vital signs: improving antibiotic use among hospitalized patients. MMWR Morb Mortal Wkly Rep.2014;63(9):194–200.
Schuetz P, Christ‐Crain M, Thomann R et al. Effect of procalcitonin‐based guidelines vs standard guidelines on antibiotic use in lower respiratory tract infections: the ProHOSP randomized controlled trial. JAMA.2009;302(10):1059–1066.
Smith KJ, Wateska A, Nowalk MP, et al. Cost‐effectiveness of procalcitonin‐guided antibiotic use in community acquired pneumonia. J Gen Intern Med.2013;28(9):1157–1164.
Caplinger C, Crane K, Wilkin M, Bohan J, Remington R, Madaras‐Kelly KJ. Interim evaluation of a Protocol to Optimize the Duration of Pneumonia Therapy at Hospital Discharge. Open Forum Infect Dis.2015;2(suppl 1):S379.
Yogo N, Young H, Shihadeh K, et al. Intervention to improve antibiotic selection and shorten treatment durations at the time of hospital discharge. Open Forum Infect Dis.2015;2(suppl 1):S1.
DeLisle S, Kim B, Deepak J, et al. Using the electronic medical record to identify community‐acquired pneumonia: toward a replicable automated strategy. PLoS One.2013;8(8):e70944.
Address for correspondence and reprint requests: Karl J. Madaras‐Kelly, Veterans Affairs Medical Center, T111, 500 West Fort Street, Boise, ID 83713; Telephone: 208‐422‐1000; Fax: 208‐422‐1155; E‐mail: karl.madaras-kelly2@va.gov
Content Gating
Gated (full article locked unless allowed per User)
Correspondence Group
for the Pneumonia Duration of Therapy Medication Utilization Evaluation Group
Methicillin‐resistant Staphylococcus aureus (MRSA) is responsible for an increasing number of invasive infections and, in the United States, may now be responsible for more deaths than disease associated with human immunodeficiency virus (HIV).1, 2 Vancomycin remains the drug of choice for invasive MRSA disease; from 1984 to 1996, its use in the United States escalated 6‐fold.3 With increased use of vancomycin, MRSA strains with partial and full resistance to vancomycin have emerged. Since 1997, S. aureus with intermediate susceptibility to vancomycin (VISA) as well as heteroresistance to vancomycin (hVISA) have been described.46 Several centers have also noted a slow rise in minimum inhibitory concentration (MIC) among clinical MRSA isolates (MIC creep).7 Low vancomycin trough levels have been implicated in the emergence of hVISA, and several studies have demonstrated a higher rate of vancomycin treatment failure, longer duration of fever, and prolonged hospitalization with hVISA and strains with elevated MIC compared to vancomycin‐susceptible MRSA.812 Until recently, vancomycin was frequently dosed to target trough levels <10 mg/L. The above concerns, combined with pharmacodynamic data suggesting that maintaining a ratio of vancomycin area under the curve to minimum inhibitory concentration (AUC/MIC) 400 may be associated with improved clinical outcome,13 have prompted an expert consensus to recommend targeting higher vancomycin trough levels (typically 15‐20 mg/L) for invasive MRSA infections and general avoidance of trough levels <10 mg/L.14
The effect of higher trough levels on kidney function remains poorly understood, as does the mechanism of vancomycin‐induced renal injury itself, though animal studies demonstrate oxidative damage to renal tubules with high doses of vancomycin.15, 16 In previous studies, the incidence of vancomycin nephrotoxicity with lower troughs has been reported to range from 0% to 19% with vancomycin alone, increasing up to 35% with concomitant aminoglycoside therapy.1724 Limited studies have been done to assess the risk of nephrotoxicity at higher trough levels. Lodise and colleagues identified high‐dose vancomycin (>4 gm per day) as an independent risk factor for nephrotoxicity, when compared to administration of <4 gm of vancomycin per day or use of linezolid, and showed greater risk of nephrotoxicity with increasing vancomycin trough levels within the first 96 hours of vancomycin administration.25, 26 Hidayat et al. demonstrated, in a prospective cohort analysis, that patients with mean trough levels 15 mg/L had a significantly increased incidence of nephrotoxicity. In that study, patients who developed nephrotoxicity were more likely to receive other nephrotoxic agents, and troughs collected before or after nephrotoxicity onset were not distinguished.9 This is an important distinction, as vancomycin is frequently continued with dose adjustment even after nephrotoxicity occurs, with the nephrotoxicity resulting in subsequent higher troughs. Jeffres et al. demonstrated that maximum vancomycin trough 15 mg/L was associated with nephrotoxicity in patients with healthcare‐associated MRSA pneumonia; this study was retrospective and focused on a particularly ill patient population.27 Pritchard et al. also retrospectively reviewed 2493 courses of vancomycin at their institution, from 2003 to 2007, and found a significant relationship between vancomycin trough 14 mg/L and nephrotoxicity. The presence of comorbid disease states and concomitant nephrotoxins was determined in a subset of 130 courses in 2007; increasing vancomycin trough was associated with nephrotoxicity in multivariable analysis.28 However, it is not clear whether troughs collected before or after nephrotoxicity onset were distinguished in this study. At least 6 other retrospective studies involving small sample size or published in abstract form have widely different results in relating high vancomycin trough or aggressive vancomycin dosing strategies to nephrotoxicity.2934
The purpose of our study was to evaluate the association between development of nephrotoxicity and trough levels obtained during vancomycin therapy at a large veterans' hospital, while accounting for other potential nephrotoxins, and to evaluate the temporal association between elevated vancomycin troughs and nephrotoxicity. We chose to focus on nephrotoxicity that occurred on, or after, 5 days of vancomycin therapy in order to reduce other confounding factors of nephrotoxicity, since short durations of vancomycin frequently represent use in surgical prophylaxis or empirical therapy for hemodynamically unstable patients at high risk for renal injury.
Patients and Methods
Inclusion and Exclusion Criteria
We performed a retrospective cohort study of patients at the Veterans Affairs (VA) Greater Los Angeles Healthcare System during 2 time periods (May 1, 2005‐April 30, 2006 and Jan 1, 2007‐Dec 31, 2007) when hospital guidelines recommended different vancomycin dosing regimens based on indication. During the first time period, the recommended target trough level was 10 mg/L, regardless of indication. In May 2006, target troughs were changed according to the following institutional guidelines: 8‐12 mg/L for cellulitis, urinary tract infection (UTI), and uncomplicated bacteremia; 10‐15 mg/L for endocarditis, osteomyelitis, and visceral abscesses; and 15‐20 mg/L for bacterial meningitis and pneumonia. The vancomycin manufacturers (American Pharmaceutical Partners (Schaumburg, IL) and Baxter (Deerfield, IL)) were the same during both time periods. Patient data was collected from the VA Computerized Patient Records System (CPRS) by 2 trained reviewers (K.K.P. and T.P.). All inpatients who received 5 days of intravenous vancomycin therapy during these time periods were identified via electronic pharmacy records. We then excluded all patients with serum creatinine >2.0 mg/L prior to starting vancomycin, no serum creatinine collected before or during receipt of vancomycin, no trough levels drawn while on vancomycin (or for patients experiencing nephrotoxicity, no trough levels drawn prior to nephrotoxicity onset), nephrotoxicity occurring before day 5 of vancomycin therapy, and receipt of concomitant amphotericin B.
Data Collection and Study Definitions
In patients who received multiple courses of vancomycin during the specified time period, only the first course starting on, or after, May 1, 2005 and lasting 5 days was analyzed. Data collected for each patient included age, sex, race, and comorbidities (diabetes mellitus, liver dysfunction, and active malignancy). Diabetes mellitus was defined as 2 fasting blood glucose levels >125, or receipt of insulin or other hypoglycemic medications during vancomycin treatment. Patients were considered to have liver disease if they had a prior diagnosis of cirrhosis, hepatic encephalopathy, or hepatic insufficiency, or if 2 of the following criteria were met: total bilirubin >2 mg/L, aspartate aminotransferase (AST) or alanine aminotransferase (ALT) >2 the upper limit of normal, or serum albumin <3 g/dL. Receipt of 1 dose of potentially nephrotoxic agents, including aminoglycosides, intravenous furosemide, intravenous trimethoprim‐sulfamethoxazole, intravenous contrast dye, potentially nephrotoxic chemotherapy, and vasopressors, were recorded beginning 72 hours prior to vancomycin therapy until onset of nephrotoxicity, or, if nephrotoxicity did not occur, the final vancomycin dose. Angiotensin‐converting enzyme inhibitors (ACE‐I) and non‐steroidal anti‐inflammatory drugs (NSAIDs) or aspirin were considered potentially nephrotoxic if they were newly started within 72 hours of vancomycin.
For each patient, the serum creatinine was recorded upon admission, within 24 hours of starting vancomycin, during vancomycin treatment, and at 24 hours and 72 hours following the final vancomycin dose. Serum creatinine was typically measured daily. Per institutional protocol, vancomycin trough levels were drawn 30‐60 minutes prior to the fourth dose, and again in 5‐7 days or with any large change in renal function. Extrapolated troughs were calculated by a pharmacist if levels were drawn outside of the 60‐minute time period. The highest trough and duration of therapy was documented for each patient. The mean trough was equal to the arithmetic mean of all troughs obtained during vancomycin administration until 72 hours following the final dose.
Outcome Analysis
The primary end point was the development of nephrotoxicity, which was defined as an increase in serum creatinine by either 0.5 mg/dL or 50% for at least 2 consecutive days after receipt of vancomycin, up to 72 hours after the final dose, compared to the last creatinine measured prior to vancomycin initiation. Patients who had a documented isolated increase in serum creatinine that resolved upon recheck within 24 hours were not classified as experiencing nephrotoxicity. In patients who developed nephrotoxicity, mean troughs, maximum troughs, duration of vancomycin treatment, and receipt of concomitant nephrotoxins were ascertained using data collected only before nephrotoxicity onset. Bivariate and multivariate models were subsequently constructed in order to determine risk factors for nephrotoxicity, using either mean or maximum trough achieved prior to nephrotoxicity for each patient.
Statistical Methods
Comparisons between the 2005‐2006 and 2007 groups were made using Student t test for continuous variables, Wilcoxon rank‐sum test for ordinal variables, and Fisher's exact test for nominal variables. Association of clinical variables with nephrotoxicity was assessed using bivariate logistic regression with subsequent multivariable logistic regression. We initially decided to use maximum vancomycin trough 15 mg/L as the vancomycin exposure variable of interest to include in multivariable models, as we felt that (1) trough 15 mg/L is clinically relevant given current guidelines that recommend aiming for trough 15 mg/L for treatment of most invasive staphylococcal disease,31 and (2) prior studies identified a single trough 15 mg/L as a possible risk factor for nephrotoxicity.9, 27, 29, 31 However, we also generated other multivariable models that included either maximum vancomycin trough 20 mg/L, mean vancomycin trough 15 mg/L, or mean vancomycin trough 20 mg/L, and models in which maximum and mean vancomycin troughs were treated as continuous variables. All variables were initially included in multivariable models; nonsignificant variables were removed from the models in a backwards stepwise fashion until likelihood ratio testing determined that removal of any variable was associated with likelihood ratio test P value <0.20 in comparing the full to reduced model. All calculated P values are two‐sided. All calculations were performed with STATA, version 10 (StataCorp, College Station, TX). This study was approved via expedited review by the Institutional Review Board of the VA Greater Los Angeles Healthcare System.
Results
Comparison of 2005‐2006 Versus 2007 Cohorts
Of the 705 patients who were identified by pharmacy records to have received intravenous vancomycin, 348 patients remained after exclusion criteria were applied; the vast majority of patients were excluded because they received <5 days of vancomycin therapy. Of the 348 patients included in the study, 201 received vancomycin in 2005‐2006, and 147 received vancomycin in 2007 (Table 1). Mean vancomycin trough was significantly higher in 2007 than 2005‐2006 (average mean trough 13.2 mg/L 4.3 vs 9.7 mg/L 3.6; P < 0.0001), although median (8 vs 9 days) and mean (11.2 vs 12.2 days) duration of therapy was 1 day shorter in 2007 versus 2005‐2006. Age, sex, race, comorbidities, and indication for vancomycin use were similar between the 2 groups. The receipt of concomitant nephrotoxins was largely similar between the 2 time periods, with the primary exception being that a higher proportion of patients received intravenous contrast dye in 2007 (19%) than in 2005‐2006 (8.0%) (P = 0.003), and a lower proportion of patients received amikacin in 2007 (7.5%) than in 2005‐2006 (15%) (P = 0.043), though overall receipt of aminoglycosides was similar. Overall, nephrotoxicity was noted in 31 patients (8.9%), with similar incidence in 2005‐2006 (8.0%) and 2007 (10.2%) (P = 0.57). The median time to onset of nephrotoxicity was 7 days, with a median peak serum creatinine of 1.8 mg/dL.
Characteristics of Patients Treated With Vancomycin From May 2005 Through April 2006 and From January to December 2007
Determination of Clinical Factors for Nephrotoxicity
Results of bivariate and multivariate analysis of clinical factors potentially associated with nephrotoxicity are displayed in Table 2. Among the 31 patients experiencing nephrotoxicity, the mean maximum vancomycin trough prior to nephrotoxicity onset was 14.9 mg/L, compared to 13.3 mg/L among those not experiencing nephrotoxicity (OR 1.03 for each 1 mg/L increment in mean trough, 95% confidence interval [CI] 0.98‐1.09; P = 0.21). While there was a trend toward patients with nephrotoxicity having a maximum trough 15 mg/L, it was not significant in either bivariate (OR 2.18, 95% CI 0.85‐5.63; P = 0.11) or multivariate (OR 2.05, 95% CI 0.91‐4.61; P = 0.082) analysis. The duration of vancomycin therapy was also not significantly associated with nephrotoxicity, both when evaluated as a continuous variable and when prolonged courses (14 days) were compared to short courses (between 5 and 14 days) of therapy. Other multivariable models were constructed that included maximum trough 20 mg/L, mean trough 15 mg/L, mean trough 20 mg/L, and maximum and mean trough as continuous variables; in all of these models, the vancomycin exposure variable of interest was not significant enough to remain in the final model after backwards elimination. The only factor significantly associated with nephrotoxicity in either bivariate or multivariate analysis was receipt of intravenous contrast dye (OR 3.64, 95% CI 1.52‐8.68; P = 0.004 in multivariate analysis).
Association of Clinical Factors With Nephrotoxicity
Of the 31 patients with nephrotoxicity, 20 (64.5%) patients still met criteria for nephrotoxicity at the time of vancomycin discontinuation. Nephrotoxicity subsequently resolved in 10 of the 16 patients that were still nephrotoxic at the time of vancomycin discontinuation (4 patients did not have follow‐up creatinine checked within 72 hours of vancomycin discontinuation). Thus, overall reversibility of nephrotoxicity either prior to, or within, 72 hours of vancomycin discontinuation was 77.8% (21/27 patients). Of the 6 patients who remained persistently nephrotoxic at 72 hours, all had received concomitant nephrotoxins prior to the onset of nephrotoxicity, as compared to 15/21 (71.4%) patients whose nephrotoxicity resolved (P = 0.28 by Fisher's exact test). Only 1 persistently nephrotoxic patient required dialysis: a critically ill patient with multiorgan failure for whom care was withdrawn within 4 days of vancomycin discontinuation.
DISCUSSION
Over the past 5 years, many institutions have adopted higher dosing guidelines for vancomycin, based on pharmacokinetic concerns related to its performance in the treatment of invasive staphylococcal disease. The data on nephrotoxicity at these higher troughs are limited. Previous studies that address the relationship between higher vancomycin troughs and nephrotoxicity suffer from small sample size29, 33; do not address reversibility of nephrotoxicity9, 26, 2931, 33; may not account for the temporal relationship between the development of nephrotoxicity and high trough levels,9, 2831 or examine patient populations at relatively high27 or low30 risk for renal injury apart from receipt of vancomycin. A recent expert consensus statement identified these factors as limiting the strength of evidence for a direct causal relationship between elevated vancomycin troughs and nephrotoxicity.14 A recent review by Hazlewood et al. concluded that the incidence of nephrotoxicity remains low in patients without preexisting renal disease and those not receiving concomitant nephrotoxins.35 The aim of our study was to identify whether or not there was a correlation between high‐dose vancomycin and nephrotoxicity, while accounting for their temporal relationship, concomitant nephrotoxin use, and reversibility. In particular, we chose to focus on nephrotoxicity occurring after at least 5 days of vancomycin therapy in order to reduce confounding by other possible sources of renal injury that may have affected the decision to initially prescribe vancomycin, an approach advocated by a recent review.36 While we noted that mean and maximum vancomycin troughs were significantly higher in 2007 than 2005‐2006, incidence of nephrotoxicity was stable between the 2 time periods, with the higher rate of intravenous contrast dye in 2007 balanced in part by less aminoglycoside use. Overall, higher trough levels were not necessarily accompanied by a significant increase in nephrotoxicity, though there was a nonsignificant trend toward more nephrotoxic patients having maximum trough 15 mg/L.
The only clinical factor that was significantly associated with nephrotoxicity in multivariate analysis was receipt of intravenous contrast dye. Of the 44 patients who received intravenous contrast dye, 10 (22.7%) experienced nephrotoxicity. Interestingly, in animal studies, both intravenous contrast dye37, 38 and high‐dose vancomycin15, 16 have been demonstrated to promote free radical formation within renal tissue, which is hypothesized to cause tubular damage primarily through vascular endothelial dysfunction, vasoconstriction, and subsequent reperfusion injury. N‐acetylcysteine is frequently administered to patients about to receive intravenous contrast dye (although its benefit remains controversial37, 39); N‐acetylcysteine has also been shown in an animal model to attenuate vancomycin‐induced renal injury.40
Receipt of concomitant aminoglycosides was not significantly associated with nephrotoxicity, in contrast with previous studies. One meta‐analysis of 8 studies revealed found that the incidence of nephrotoxicity associated with combination vancomycin and aminoglycosides was 13.3% greater than with vancomycin alone (P < 0.01) and 4.3% greater than therapy with an aminoglycoside alone (P < 0.05)20; another analysis of safety data of the clinical trial comparing daptomycin to comparator therapy including initial low‐dose gentamicin therapy in the treatment of S. aureus bacteremia found renal adverse events in 10 of 53 (19%) patients receiving vancomycin and gentamicin, compared to 8 of 120 (7%) patients receiving daptomycin.41 While our findings that show no clear relationship between concomitant vancomycin and aminoglycoside use and nephrotoxicity may have been due to the relatively small number of patients in our study who received aminoglycosides, it is worth noting that more patients in our study received aminoglycosides than intravenous contrast dye (66 vs 44 patients). The 77.8% overall resolution of nephrotoxicity observed in our study is similar to that reported by Farber and Moellering in 198319 and to that reported more recently with high‐dose vancomycin by Jeffres et al. and Teng et al.27, 34
Although we attempted to account for as many confounders as possible, the retrospective nature of our study prevents us from making definitive statements regarding the role of vancomycin trough levels and nephrotoxicity. In particular, we are unable to comment on any potential role vancomycin may have on nephrotoxicity within 5 days of its start or on patients with a baseline serum creatinine >2. Other significant limitations include our small proportion of female patients, and that we were not able to calculate severity of illness or determine the presence of congestive heart failure. Also, we may be dosing vancomycin less aggressively than other centers, and thus may have reduced power in determining whether higher troughs, particularly those 20 mg/L, are associated with nephrotoxicity; identification of more patients with higher troughs and a larger overall sample size may have yielded different results. Even in the 2007 group, a significant number of patients with cellulitis, UTI, and uncomplicated bacteremia had target troughs of 8‐12 mg/L. However, taken together, our findings do not support a definite relationship between vancomycin troughs and development of nephrotoxicity, and that when it does occur, it is largely reversible. Further prospective research is needed to evaluate the effects of aggressive vancomycin dosing regimens on nephrotoxicity, particularly those regimens that include large loading doses. Trials of antioxidative agents in patients receiving aggressive dosing regimens of vancomycin who require radiology studies involving intravenous contrast dye may be indicated as well.
Bancroft EA.Antimicrobial resistance: it's not just for hospitals.JAMA.2007;298:1803–1804.
Klevens RM,Morrison MA,Nadle J, et al.Invasive methicillin‐resistant Staphylococcus aureus infections in the United States.JAMA.2007;298:1763–1771.
Kirst HA,Thompson DG,Nicas TI.Historical yearly usage of vancomycin.Antimicrob Agents Chemother.1998;42:1303–1304.
Hiramatsu K,Aritaka N,Hanaki H, et al.Dissemination in Japanese hospitals of strains of Staphylococcus aureus heterogeneously resistant to vancomycin.Lancet.1997;350:1670–1673.
Liu C,Chambers HF.Staphylococcus aureus with heterogeneous resistance to vancomycin: epidemiology, clinical significance, and critical assessment of diagnostic methods.Antimicrob Agents Chemother.2003;47:3040–3045.
Steinkraus G,White R,Friedrich L.Vancomycin MIC creep in non‐vancomycin‐intermediate Staphylococcus aureus (VISA), vancomycin‐susceptible clinical methicillin‐resistant S. aureus (MRSA) blood isolates from 2001–05.J Antimicrob Chemother.2007;60:788–794.
Charles PG,Ward PB,Johnson PD,Howden BP,Grayson ML.Clinical features associated with bacteremia due to heterogeneous vancomycin‐ intermediate Staphylococcus aureus.Clin Infect Dis.2004;38:448–451.
Hidayat LK,Hsu DI,Quist R,Shriner KA,Wong‐Beringer A.High‐dose vancomycin therapy for methicillin‐resistant Staphylococcus aureus infections: efficacy and toxicity.Arch Intern Med.2006;166:2138–2144.
Moise‐Broder PA,Sakoulas G,Eliopoulos GM,Schentag JJ,Forrest A,Moellering RC.Accessory gene regulator group II polymorphism in methicillin‐resistant Staphylococcus aureus is predictive of failure of vancomycin therapy.Clin Infect Dis.2004;38:1700–1705.
Sakoulas G,Moise‐Broder PA,Schentag J,Forrest A,Moellering RC,Eliopoulos GM.Relationship of MIC and bactericidal activity to efficacy of vancomycin for treatment of methicillin‐resistant Staphylococcus aureus bacteremia.J Clin Microbiol.2004;42:2398–2402.
Tenover FC,Moellering RC.The rationale for revising the Clinical and Laboratory Standards Institute vancomycin minimal inhibitory concentration interpretive criteria for Staphylococcus aureus.Clin Infect Dis.2007;44:1208–1215.
Moise‐Broder PA,Forrest A,Birmingham MC,Schentag JJ.Pharmacodynamics of vancomycin and other antimicrobials in patients with Staphylococcus aureus lower respiratory tract infections.Clin Pharmacokinet.2004;43:925–942.
Rybak M,Lomaestro B,Rotschafer JC, et al.Therapeutic monitoring of vancomycin in adult patients: a consensus review of the American Society of Health‐System Pharmacists, the Infectious Diseases Society of America, and the Society of Infectious Diseases Pharmacists.Am J Health Syst Pharm.2009;66:82–98.
Dieterich C,Puey A,Lin S, et al.Gene expression analysis reveals new possible mechanisms of vancomycin‐induced nephrotoxicity and identifies gene markers candidates.Toxicol Sci.2009;107:258–269.
Oktem F,Arslan MK,Ozguner F, et al.In vivo evidences suggesting the role of oxidative stress in pathogenesis of vancomycin‐induced nephrotoxicity: protection by erdosteine.Toxicology.2005;215:227–233.
Cimino MA,Rotstein C,Slaughter RL,Emrich LJ.Relationship of serum antibiotic concentrations to nephrotoxicity in cancer patients receiving concurrent aminoglycoside and vancomycin therapy.Am J Med.1987;83:1091–1097.
Farber BF,Moellering RC.Retrospective study of the toxicity of preparations of vancomycin from 1974 to 1981.Antimicrob Agents Chemother.1983;23:138–141.
Goetz MB,Sayers J.Nephrotoxicity of vancomycin and aminoglycoside therapy separately and in combination.J Antimicrob Chemother.1993;32:325–334.
Mellor JA,Kingdom J,Cafferkey M,Keane CT.Vancomycin toxicity: a prospective study.J Antimicrob Chemother.1985;15:773–780.
Pauly DJ,Musa DM,Lestico MR,Lindstrom MJ,Hetsko CM.Risk of nephrotoxicity with combination vancomycin‐aminoglycoside antibiotic therapy.Pharmacotherapy.1990;10:378–382.
Rybak MJ,Albrecht LM,Boike SC,Chandrasekar PH.Nephrotoxicity of vancomycin, alone and with an aminoglycoside.J Antimicrob Chemother.1990;25:679–687.
Sorrell TC,Collignon PJ.A prospective study of adverse reactions associated with vancomycin therapy.J Antimicrob Chemother.1985;16:235–241.
Lodise TP,Lomaestro B,Graves J,Drusano GL.Larger vancomycin doses (at least four grams per day) are associated with an increased incidence of nephrotoxicity.Antimicrob Agents Chemother.2008;52:1330–1336.
Lodise TP,Patel N,Lomaestro BM,Rodvold KA,Drusano GL.Relationship between initial vancomycin concentration‐time profile and nephrotoxicity among hospitalized patients.Clin Infect Dis.2009;49:507–514.
Jeffres MN,Isakow W,Doherty JA,Micek ST,Kollef MH.A retrospective analysis of possible renal toxicity associated with vancomycin in patients with health care‐associated methicillin‐resistant Staphylococcus aureus pneumonia.Clin Ther.2007;29:1107–1115.
Pritchard L,Baker C,Leggett J,Sehdev P,Brown A,Bayley KB.Increasing vancomycin serum trough concentrations and incidence of nephrotoxicity.Am J Med.2010;123:1143–1149.
Lee‐Such SC,Overholser BR,Munoz‐Price LS. Nephrotoxicity associated with aggressive vancomycin therapy [abstract L‐1298]. In:Program and Abstracts of the 46th Interscience Conference on Antimicrobial Agents and Chemotherapy, San Francisco, CA, 2006. Washington, DC: American Society for Microbiology.
Mora A,Dzintars D,Lat A,Frei CR,Echevarria K. Incidence of vancomycin nephrotoxicity in the absence of concomitant nephrotoxins or confounders [abstract A1–1294b]. In:Program and Abstracts of the 49th Interscience Conference on Antimicrobial Agents and Chemotherapy, San Francisco, CA, 2009. Washington, DC: American Society for Microbiology.
Nguyen M,Wong J,Lee C, et al. Nephrotoxicity associated with high‐dose versus standard‐dose vancomycin therapy [abstract K‐1096]. In:Program and Abstracts of the 47th Interscience Conference on Antimicrobial Agents and Chemotherapy, Chicago, IL, 2007. Washington, DC: American Society for Microbiology.
Rios E,Pounders CL,Allison T. Evaluation of vancomycin nephrotoxicity in patients with methicillin‐resistant Staphylococcus aureus bacteremia [abstract A1–1294a]. In:Program and Abstracts of the 49th Interscience Conference on Antimicrobial Agents and Chemotherapy, San Francisco, CA, 2009. Washington, DC: American Society for Microbiology.
Zimmerman AE,Katona BG,Plaisance KI.Association of vancomycin serum concentrations with outcomes in patients with gram‐positive bacteremia.Pharmacotherapy.1995;15:85–91.
Teng CG,Rezai K,Itokazu GS, et al. Continuation of high dose vancomycin despite nephrotoxicity [abstract K‐3486]. In:Abstracts of the 48th Interscience Conference on Antimicrobial Agents and Chemotherapy/46th Infectious Diseases Society of America Annual Meeting, Washington, DC, 2008. Washington, DC: American Society for Microbiology.
Hazlewood KA,Brouse SD,Pitcher WD,Hall RG.Vancomycin‐associated nephrotoxicity: grave concern or death by character assassination?Am J Med.2010;123:182–187.
Wong‐Beringer A,Joo J,Tse E,Beringer P.Vancomycin‐associated nephrotoxicity: a critical appraisal of risk with high‐dose therapy.Int J Antimicrob Agents.2011;37:95–101.
Detrenis S,Meschi M,Musini S,Savazzi G.Lights and shadows on the pathogenesis of contrast‐induced nephropathy: state of the art.Nephrol Dial Transplant.2005;20:1542–1550.
Persson PB,Hansell P,Liss P.Pathophysiology of contrast medium‐induced nephropathy.Kidney Int.2005;68:14–22.
Kshirsagar AV,Poole C,Mottl A, et al.N‐acetylcysteine for the prevention of radiocontrast induced nephropathy: a meta‐analysis of prospective controlled trials.J Am Soc Nephrol.2004;15:761–769.
Ocak S,Gorur S,Hakverdi S,Celik S,Erdogan S.Protective effects of caffeic acid phenethyl ester, vitamin C, vitamin E and N‐acetylcysteine on vancomycin‐induced nephrotoxicity in rats.Basic Clin Pharmacol Toxicol.2007;100:328–333.
Cosgrove SE,Vigliani GA,Fowler VG, et al.Initial low‐dose gentamicin for Staphylococcus aureus bacteremia and endocarditis is nephrotoxic.Clin Infect Dis.2009;48:713–721.
Methicillin‐resistant Staphylococcus aureus (MRSA) is responsible for an increasing number of invasive infections and, in the United States, may now be responsible for more deaths than disease associated with human immunodeficiency virus (HIV).1, 2 Vancomycin remains the drug of choice for invasive MRSA disease; from 1984 to 1996, its use in the United States escalated 6‐fold.3 With increased use of vancomycin, MRSA strains with partial and full resistance to vancomycin have emerged. Since 1997, S. aureus with intermediate susceptibility to vancomycin (VISA) as well as heteroresistance to vancomycin (hVISA) have been described.46 Several centers have also noted a slow rise in minimum inhibitory concentration (MIC) among clinical MRSA isolates (MIC creep).7 Low vancomycin trough levels have been implicated in the emergence of hVISA, and several studies have demonstrated a higher rate of vancomycin treatment failure, longer duration of fever, and prolonged hospitalization with hVISA and strains with elevated MIC compared to vancomycin‐susceptible MRSA.812 Until recently, vancomycin was frequently dosed to target trough levels <10 mg/L. The above concerns, combined with pharmacodynamic data suggesting that maintaining a ratio of vancomycin area under the curve to minimum inhibitory concentration (AUC/MIC) 400 may be associated with improved clinical outcome,13 have prompted an expert consensus to recommend targeting higher vancomycin trough levels (typically 15‐20 mg/L) for invasive MRSA infections and general avoidance of trough levels <10 mg/L.14
The effect of higher trough levels on kidney function remains poorly understood, as does the mechanism of vancomycin‐induced renal injury itself, though animal studies demonstrate oxidative damage to renal tubules with high doses of vancomycin.15, 16 In previous studies, the incidence of vancomycin nephrotoxicity with lower troughs has been reported to range from 0% to 19% with vancomycin alone, increasing up to 35% with concomitant aminoglycoside therapy.1724 Limited studies have been done to assess the risk of nephrotoxicity at higher trough levels. Lodise and colleagues identified high‐dose vancomycin (>4 gm per day) as an independent risk factor for nephrotoxicity, when compared to administration of <4 gm of vancomycin per day or use of linezolid, and showed greater risk of nephrotoxicity with increasing vancomycin trough levels within the first 96 hours of vancomycin administration.25, 26 Hidayat et al. demonstrated, in a prospective cohort analysis, that patients with mean trough levels 15 mg/L had a significantly increased incidence of nephrotoxicity. In that study, patients who developed nephrotoxicity were more likely to receive other nephrotoxic agents, and troughs collected before or after nephrotoxicity onset were not distinguished.9 This is an important distinction, as vancomycin is frequently continued with dose adjustment even after nephrotoxicity occurs, with the nephrotoxicity resulting in subsequent higher troughs. Jeffres et al. demonstrated that maximum vancomycin trough 15 mg/L was associated with nephrotoxicity in patients with healthcare‐associated MRSA pneumonia; this study was retrospective and focused on a particularly ill patient population.27 Pritchard et al. also retrospectively reviewed 2493 courses of vancomycin at their institution, from 2003 to 2007, and found a significant relationship between vancomycin trough 14 mg/L and nephrotoxicity. The presence of comorbid disease states and concomitant nephrotoxins was determined in a subset of 130 courses in 2007; increasing vancomycin trough was associated with nephrotoxicity in multivariable analysis.28 However, it is not clear whether troughs collected before or after nephrotoxicity onset were distinguished in this study. At least 6 other retrospective studies involving small sample size or published in abstract form have widely different results in relating high vancomycin trough or aggressive vancomycin dosing strategies to nephrotoxicity.2934
The purpose of our study was to evaluate the association between development of nephrotoxicity and trough levels obtained during vancomycin therapy at a large veterans' hospital, while accounting for other potential nephrotoxins, and to evaluate the temporal association between elevated vancomycin troughs and nephrotoxicity. We chose to focus on nephrotoxicity that occurred on, or after, 5 days of vancomycin therapy in order to reduce other confounding factors of nephrotoxicity, since short durations of vancomycin frequently represent use in surgical prophylaxis or empirical therapy for hemodynamically unstable patients at high risk for renal injury.
Patients and Methods
Inclusion and Exclusion Criteria
We performed a retrospective cohort study of patients at the Veterans Affairs (VA) Greater Los Angeles Healthcare System during 2 time periods (May 1, 2005‐April 30, 2006 and Jan 1, 2007‐Dec 31, 2007) when hospital guidelines recommended different vancomycin dosing regimens based on indication. During the first time period, the recommended target trough level was 10 mg/L, regardless of indication. In May 2006, target troughs were changed according to the following institutional guidelines: 8‐12 mg/L for cellulitis, urinary tract infection (UTI), and uncomplicated bacteremia; 10‐15 mg/L for endocarditis, osteomyelitis, and visceral abscesses; and 15‐20 mg/L for bacterial meningitis and pneumonia. The vancomycin manufacturers (American Pharmaceutical Partners (Schaumburg, IL) and Baxter (Deerfield, IL)) were the same during both time periods. Patient data was collected from the VA Computerized Patient Records System (CPRS) by 2 trained reviewers (K.K.P. and T.P.). All inpatients who received 5 days of intravenous vancomycin therapy during these time periods were identified via electronic pharmacy records. We then excluded all patients with serum creatinine >2.0 mg/L prior to starting vancomycin, no serum creatinine collected before or during receipt of vancomycin, no trough levels drawn while on vancomycin (or for patients experiencing nephrotoxicity, no trough levels drawn prior to nephrotoxicity onset), nephrotoxicity occurring before day 5 of vancomycin therapy, and receipt of concomitant amphotericin B.
Data Collection and Study Definitions
In patients who received multiple courses of vancomycin during the specified time period, only the first course starting on, or after, May 1, 2005 and lasting 5 days was analyzed. Data collected for each patient included age, sex, race, and comorbidities (diabetes mellitus, liver dysfunction, and active malignancy). Diabetes mellitus was defined as 2 fasting blood glucose levels >125, or receipt of insulin or other hypoglycemic medications during vancomycin treatment. Patients were considered to have liver disease if they had a prior diagnosis of cirrhosis, hepatic encephalopathy, or hepatic insufficiency, or if 2 of the following criteria were met: total bilirubin >2 mg/L, aspartate aminotransferase (AST) or alanine aminotransferase (ALT) >2 the upper limit of normal, or serum albumin <3 g/dL. Receipt of 1 dose of potentially nephrotoxic agents, including aminoglycosides, intravenous furosemide, intravenous trimethoprim‐sulfamethoxazole, intravenous contrast dye, potentially nephrotoxic chemotherapy, and vasopressors, were recorded beginning 72 hours prior to vancomycin therapy until onset of nephrotoxicity, or, if nephrotoxicity did not occur, the final vancomycin dose. Angiotensin‐converting enzyme inhibitors (ACE‐I) and non‐steroidal anti‐inflammatory drugs (NSAIDs) or aspirin were considered potentially nephrotoxic if they were newly started within 72 hours of vancomycin.
For each patient, the serum creatinine was recorded upon admission, within 24 hours of starting vancomycin, during vancomycin treatment, and at 24 hours and 72 hours following the final vancomycin dose. Serum creatinine was typically measured daily. Per institutional protocol, vancomycin trough levels were drawn 30‐60 minutes prior to the fourth dose, and again in 5‐7 days or with any large change in renal function. Extrapolated troughs were calculated by a pharmacist if levels were drawn outside of the 60‐minute time period. The highest trough and duration of therapy was documented for each patient. The mean trough was equal to the arithmetic mean of all troughs obtained during vancomycin administration until 72 hours following the final dose.
Outcome Analysis
The primary end point was the development of nephrotoxicity, which was defined as an increase in serum creatinine by either 0.5 mg/dL or 50% for at least 2 consecutive days after receipt of vancomycin, up to 72 hours after the final dose, compared to the last creatinine measured prior to vancomycin initiation. Patients who had a documented isolated increase in serum creatinine that resolved upon recheck within 24 hours were not classified as experiencing nephrotoxicity. In patients who developed nephrotoxicity, mean troughs, maximum troughs, duration of vancomycin treatment, and receipt of concomitant nephrotoxins were ascertained using data collected only before nephrotoxicity onset. Bivariate and multivariate models were subsequently constructed in order to determine risk factors for nephrotoxicity, using either mean or maximum trough achieved prior to nephrotoxicity for each patient.
Statistical Methods
Comparisons between the 2005‐2006 and 2007 groups were made using Student t test for continuous variables, Wilcoxon rank‐sum test for ordinal variables, and Fisher's exact test for nominal variables. Association of clinical variables with nephrotoxicity was assessed using bivariate logistic regression with subsequent multivariable logistic regression. We initially decided to use maximum vancomycin trough 15 mg/L as the vancomycin exposure variable of interest to include in multivariable models, as we felt that (1) trough 15 mg/L is clinically relevant given current guidelines that recommend aiming for trough 15 mg/L for treatment of most invasive staphylococcal disease,31 and (2) prior studies identified a single trough 15 mg/L as a possible risk factor for nephrotoxicity.9, 27, 29, 31 However, we also generated other multivariable models that included either maximum vancomycin trough 20 mg/L, mean vancomycin trough 15 mg/L, or mean vancomycin trough 20 mg/L, and models in which maximum and mean vancomycin troughs were treated as continuous variables. All variables were initially included in multivariable models; nonsignificant variables were removed from the models in a backwards stepwise fashion until likelihood ratio testing determined that removal of any variable was associated with likelihood ratio test P value <0.20 in comparing the full to reduced model. All calculated P values are two‐sided. All calculations were performed with STATA, version 10 (StataCorp, College Station, TX). This study was approved via expedited review by the Institutional Review Board of the VA Greater Los Angeles Healthcare System.
Results
Comparison of 2005‐2006 Versus 2007 Cohorts
Of the 705 patients who were identified by pharmacy records to have received intravenous vancomycin, 348 patients remained after exclusion criteria were applied; the vast majority of patients were excluded because they received <5 days of vancomycin therapy. Of the 348 patients included in the study, 201 received vancomycin in 2005‐2006, and 147 received vancomycin in 2007 (Table 1). Mean vancomycin trough was significantly higher in 2007 than 2005‐2006 (average mean trough 13.2 mg/L 4.3 vs 9.7 mg/L 3.6; P < 0.0001), although median (8 vs 9 days) and mean (11.2 vs 12.2 days) duration of therapy was 1 day shorter in 2007 versus 2005‐2006. Age, sex, race, comorbidities, and indication for vancomycin use were similar between the 2 groups. The receipt of concomitant nephrotoxins was largely similar between the 2 time periods, with the primary exception being that a higher proportion of patients received intravenous contrast dye in 2007 (19%) than in 2005‐2006 (8.0%) (P = 0.003), and a lower proportion of patients received amikacin in 2007 (7.5%) than in 2005‐2006 (15%) (P = 0.043), though overall receipt of aminoglycosides was similar. Overall, nephrotoxicity was noted in 31 patients (8.9%), with similar incidence in 2005‐2006 (8.0%) and 2007 (10.2%) (P = 0.57). The median time to onset of nephrotoxicity was 7 days, with a median peak serum creatinine of 1.8 mg/dL.
Characteristics of Patients Treated With Vancomycin From May 2005 Through April 2006 and From January to December 2007
Determination of Clinical Factors for Nephrotoxicity
Results of bivariate and multivariate analysis of clinical factors potentially associated with nephrotoxicity are displayed in Table 2. Among the 31 patients experiencing nephrotoxicity, the mean maximum vancomycin trough prior to nephrotoxicity onset was 14.9 mg/L, compared to 13.3 mg/L among those not experiencing nephrotoxicity (OR 1.03 for each 1 mg/L increment in mean trough, 95% confidence interval [CI] 0.98‐1.09; P = 0.21). While there was a trend toward patients with nephrotoxicity having a maximum trough 15 mg/L, it was not significant in either bivariate (OR 2.18, 95% CI 0.85‐5.63; P = 0.11) or multivariate (OR 2.05, 95% CI 0.91‐4.61; P = 0.082) analysis. The duration of vancomycin therapy was also not significantly associated with nephrotoxicity, both when evaluated as a continuous variable and when prolonged courses (14 days) were compared to short courses (between 5 and 14 days) of therapy. Other multivariable models were constructed that included maximum trough 20 mg/L, mean trough 15 mg/L, mean trough 20 mg/L, and maximum and mean trough as continuous variables; in all of these models, the vancomycin exposure variable of interest was not significant enough to remain in the final model after backwards elimination. The only factor significantly associated with nephrotoxicity in either bivariate or multivariate analysis was receipt of intravenous contrast dye (OR 3.64, 95% CI 1.52‐8.68; P = 0.004 in multivariate analysis).
Association of Clinical Factors With Nephrotoxicity
Of the 31 patients with nephrotoxicity, 20 (64.5%) patients still met criteria for nephrotoxicity at the time of vancomycin discontinuation. Nephrotoxicity subsequently resolved in 10 of the 16 patients that were still nephrotoxic at the time of vancomycin discontinuation (4 patients did not have follow‐up creatinine checked within 72 hours of vancomycin discontinuation). Thus, overall reversibility of nephrotoxicity either prior to, or within, 72 hours of vancomycin discontinuation was 77.8% (21/27 patients). Of the 6 patients who remained persistently nephrotoxic at 72 hours, all had received concomitant nephrotoxins prior to the onset of nephrotoxicity, as compared to 15/21 (71.4%) patients whose nephrotoxicity resolved (P = 0.28 by Fisher's exact test). Only 1 persistently nephrotoxic patient required dialysis: a critically ill patient with multiorgan failure for whom care was withdrawn within 4 days of vancomycin discontinuation.
DISCUSSION
Over the past 5 years, many institutions have adopted higher dosing guidelines for vancomycin, based on pharmacokinetic concerns related to its performance in the treatment of invasive staphylococcal disease. The data on nephrotoxicity at these higher troughs are limited. Previous studies that address the relationship between higher vancomycin troughs and nephrotoxicity suffer from small sample size29, 33; do not address reversibility of nephrotoxicity9, 26, 2931, 33; may not account for the temporal relationship between the development of nephrotoxicity and high trough levels,9, 2831 or examine patient populations at relatively high27 or low30 risk for renal injury apart from receipt of vancomycin. A recent expert consensus statement identified these factors as limiting the strength of evidence for a direct causal relationship between elevated vancomycin troughs and nephrotoxicity.14 A recent review by Hazlewood et al. concluded that the incidence of nephrotoxicity remains low in patients without preexisting renal disease and those not receiving concomitant nephrotoxins.35 The aim of our study was to identify whether or not there was a correlation between high‐dose vancomycin and nephrotoxicity, while accounting for their temporal relationship, concomitant nephrotoxin use, and reversibility. In particular, we chose to focus on nephrotoxicity occurring after at least 5 days of vancomycin therapy in order to reduce confounding by other possible sources of renal injury that may have affected the decision to initially prescribe vancomycin, an approach advocated by a recent review.36 While we noted that mean and maximum vancomycin troughs were significantly higher in 2007 than 2005‐2006, incidence of nephrotoxicity was stable between the 2 time periods, with the higher rate of intravenous contrast dye in 2007 balanced in part by less aminoglycoside use. Overall, higher trough levels were not necessarily accompanied by a significant increase in nephrotoxicity, though there was a nonsignificant trend toward more nephrotoxic patients having maximum trough 15 mg/L.
The only clinical factor that was significantly associated with nephrotoxicity in multivariate analysis was receipt of intravenous contrast dye. Of the 44 patients who received intravenous contrast dye, 10 (22.7%) experienced nephrotoxicity. Interestingly, in animal studies, both intravenous contrast dye37, 38 and high‐dose vancomycin15, 16 have been demonstrated to promote free radical formation within renal tissue, which is hypothesized to cause tubular damage primarily through vascular endothelial dysfunction, vasoconstriction, and subsequent reperfusion injury. N‐acetylcysteine is frequently administered to patients about to receive intravenous contrast dye (although its benefit remains controversial37, 39); N‐acetylcysteine has also been shown in an animal model to attenuate vancomycin‐induced renal injury.40
Receipt of concomitant aminoglycosides was not significantly associated with nephrotoxicity, in contrast with previous studies. One meta‐analysis of 8 studies revealed found that the incidence of nephrotoxicity associated with combination vancomycin and aminoglycosides was 13.3% greater than with vancomycin alone (P < 0.01) and 4.3% greater than therapy with an aminoglycoside alone (P < 0.05)20; another analysis of safety data of the clinical trial comparing daptomycin to comparator therapy including initial low‐dose gentamicin therapy in the treatment of S. aureus bacteremia found renal adverse events in 10 of 53 (19%) patients receiving vancomycin and gentamicin, compared to 8 of 120 (7%) patients receiving daptomycin.41 While our findings that show no clear relationship between concomitant vancomycin and aminoglycoside use and nephrotoxicity may have been due to the relatively small number of patients in our study who received aminoglycosides, it is worth noting that more patients in our study received aminoglycosides than intravenous contrast dye (66 vs 44 patients). The 77.8% overall resolution of nephrotoxicity observed in our study is similar to that reported by Farber and Moellering in 198319 and to that reported more recently with high‐dose vancomycin by Jeffres et al. and Teng et al.27, 34
Although we attempted to account for as many confounders as possible, the retrospective nature of our study prevents us from making definitive statements regarding the role of vancomycin trough levels and nephrotoxicity. In particular, we are unable to comment on any potential role vancomycin may have on nephrotoxicity within 5 days of its start or on patients with a baseline serum creatinine >2. Other significant limitations include our small proportion of female patients, and that we were not able to calculate severity of illness or determine the presence of congestive heart failure. Also, we may be dosing vancomycin less aggressively than other centers, and thus may have reduced power in determining whether higher troughs, particularly those 20 mg/L, are associated with nephrotoxicity; identification of more patients with higher troughs and a larger overall sample size may have yielded different results. Even in the 2007 group, a significant number of patients with cellulitis, UTI, and uncomplicated bacteremia had target troughs of 8‐12 mg/L. However, taken together, our findings do not support a definite relationship between vancomycin troughs and development of nephrotoxicity, and that when it does occur, it is largely reversible. Further prospective research is needed to evaluate the effects of aggressive vancomycin dosing regimens on nephrotoxicity, particularly those regimens that include large loading doses. Trials of antioxidative agents in patients receiving aggressive dosing regimens of vancomycin who require radiology studies involving intravenous contrast dye may be indicated as well.
References
Bancroft EA.Antimicrobial resistance: it's not just for hospitals.JAMA.2007;298:1803–1804.
Klevens RM,Morrison MA,Nadle J, et al.Invasive methicillin‐resistant Staphylococcus aureus infections in the United States.JAMA.2007;298:1763–1771.
Kirst HA,Thompson DG,Nicas TI.Historical yearly usage of vancomycin.Antimicrob Agents Chemother.1998;42:1303–1304.
Hiramatsu K,Aritaka N,Hanaki H, et al.Dissemination in Japanese hospitals of strains of Staphylococcus aureus heterogeneously resistant to vancomycin.Lancet.1997;350:1670–1673.
Liu C,Chambers HF.Staphylococcus aureus with heterogeneous resistance to vancomycin: epidemiology, clinical significance, and critical assessment of diagnostic methods.Antimicrob Agents Chemother.2003;47:3040–3045.
Steinkraus G,White R,Friedrich L.Vancomycin MIC creep in non‐vancomycin‐intermediate Staphylococcus aureus (VISA), vancomycin‐susceptible clinical methicillin‐resistant S. aureus (MRSA) blood isolates from 2001–05.J Antimicrob Chemother.2007;60:788–794.
Charles PG,Ward PB,Johnson PD,Howden BP,Grayson ML.Clinical features associated with bacteremia due to heterogeneous vancomycin‐ intermediate Staphylococcus aureus.Clin Infect Dis.2004;38:448–451.
Hidayat LK,Hsu DI,Quist R,Shriner KA,Wong‐Beringer A.High‐dose vancomycin therapy for methicillin‐resistant Staphylococcus aureus infections: efficacy and toxicity.Arch Intern Med.2006;166:2138–2144.
Moise‐Broder PA,Sakoulas G,Eliopoulos GM,Schentag JJ,Forrest A,Moellering RC.Accessory gene regulator group II polymorphism in methicillin‐resistant Staphylococcus aureus is predictive of failure of vancomycin therapy.Clin Infect Dis.2004;38:1700–1705.
Sakoulas G,Moise‐Broder PA,Schentag J,Forrest A,Moellering RC,Eliopoulos GM.Relationship of MIC and bactericidal activity to efficacy of vancomycin for treatment of methicillin‐resistant Staphylococcus aureus bacteremia.J Clin Microbiol.2004;42:2398–2402.
Tenover FC,Moellering RC.The rationale for revising the Clinical and Laboratory Standards Institute vancomycin minimal inhibitory concentration interpretive criteria for Staphylococcus aureus.Clin Infect Dis.2007;44:1208–1215.
Moise‐Broder PA,Forrest A,Birmingham MC,Schentag JJ.Pharmacodynamics of vancomycin and other antimicrobials in patients with Staphylococcus aureus lower respiratory tract infections.Clin Pharmacokinet.2004;43:925–942.
Rybak M,Lomaestro B,Rotschafer JC, et al.Therapeutic monitoring of vancomycin in adult patients: a consensus review of the American Society of Health‐System Pharmacists, the Infectious Diseases Society of America, and the Society of Infectious Diseases Pharmacists.Am J Health Syst Pharm.2009;66:82–98.
Dieterich C,Puey A,Lin S, et al.Gene expression analysis reveals new possible mechanisms of vancomycin‐induced nephrotoxicity and identifies gene markers candidates.Toxicol Sci.2009;107:258–269.
Oktem F,Arslan MK,Ozguner F, et al.In vivo evidences suggesting the role of oxidative stress in pathogenesis of vancomycin‐induced nephrotoxicity: protection by erdosteine.Toxicology.2005;215:227–233.
Cimino MA,Rotstein C,Slaughter RL,Emrich LJ.Relationship of serum antibiotic concentrations to nephrotoxicity in cancer patients receiving concurrent aminoglycoside and vancomycin therapy.Am J Med.1987;83:1091–1097.
Farber BF,Moellering RC.Retrospective study of the toxicity of preparations of vancomycin from 1974 to 1981.Antimicrob Agents Chemother.1983;23:138–141.
Goetz MB,Sayers J.Nephrotoxicity of vancomycin and aminoglycoside therapy separately and in combination.J Antimicrob Chemother.1993;32:325–334.
Mellor JA,Kingdom J,Cafferkey M,Keane CT.Vancomycin toxicity: a prospective study.J Antimicrob Chemother.1985;15:773–780.
Pauly DJ,Musa DM,Lestico MR,Lindstrom MJ,Hetsko CM.Risk of nephrotoxicity with combination vancomycin‐aminoglycoside antibiotic therapy.Pharmacotherapy.1990;10:378–382.
Rybak MJ,Albrecht LM,Boike SC,Chandrasekar PH.Nephrotoxicity of vancomycin, alone and with an aminoglycoside.J Antimicrob Chemother.1990;25:679–687.
Sorrell TC,Collignon PJ.A prospective study of adverse reactions associated with vancomycin therapy.J Antimicrob Chemother.1985;16:235–241.
Lodise TP,Lomaestro B,Graves J,Drusano GL.Larger vancomycin doses (at least four grams per day) are associated with an increased incidence of nephrotoxicity.Antimicrob Agents Chemother.2008;52:1330–1336.
Lodise TP,Patel N,Lomaestro BM,Rodvold KA,Drusano GL.Relationship between initial vancomycin concentration‐time profile and nephrotoxicity among hospitalized patients.Clin Infect Dis.2009;49:507–514.
Jeffres MN,Isakow W,Doherty JA,Micek ST,Kollef MH.A retrospective analysis of possible renal toxicity associated with vancomycin in patients with health care‐associated methicillin‐resistant Staphylococcus aureus pneumonia.Clin Ther.2007;29:1107–1115.
Pritchard L,Baker C,Leggett J,Sehdev P,Brown A,Bayley KB.Increasing vancomycin serum trough concentrations and incidence of nephrotoxicity.Am J Med.2010;123:1143–1149.
Lee‐Such SC,Overholser BR,Munoz‐Price LS. Nephrotoxicity associated with aggressive vancomycin therapy [abstract L‐1298]. In:Program and Abstracts of the 46th Interscience Conference on Antimicrobial Agents and Chemotherapy, San Francisco, CA, 2006. Washington, DC: American Society for Microbiology.
Mora A,Dzintars D,Lat A,Frei CR,Echevarria K. Incidence of vancomycin nephrotoxicity in the absence of concomitant nephrotoxins or confounders [abstract A1–1294b]. In:Program and Abstracts of the 49th Interscience Conference on Antimicrobial Agents and Chemotherapy, San Francisco, CA, 2009. Washington, DC: American Society for Microbiology.
Nguyen M,Wong J,Lee C, et al. Nephrotoxicity associated with high‐dose versus standard‐dose vancomycin therapy [abstract K‐1096]. In:Program and Abstracts of the 47th Interscience Conference on Antimicrobial Agents and Chemotherapy, Chicago, IL, 2007. Washington, DC: American Society for Microbiology.
Rios E,Pounders CL,Allison T. Evaluation of vancomycin nephrotoxicity in patients with methicillin‐resistant Staphylococcus aureus bacteremia [abstract A1–1294a]. In:Program and Abstracts of the 49th Interscience Conference on Antimicrobial Agents and Chemotherapy, San Francisco, CA, 2009. Washington, DC: American Society for Microbiology.
Zimmerman AE,Katona BG,Plaisance KI.Association of vancomycin serum concentrations with outcomes in patients with gram‐positive bacteremia.Pharmacotherapy.1995;15:85–91.
Teng CG,Rezai K,Itokazu GS, et al. Continuation of high dose vancomycin despite nephrotoxicity [abstract K‐3486]. In:Abstracts of the 48th Interscience Conference on Antimicrobial Agents and Chemotherapy/46th Infectious Diseases Society of America Annual Meeting, Washington, DC, 2008. Washington, DC: American Society for Microbiology.
Hazlewood KA,Brouse SD,Pitcher WD,Hall RG.Vancomycin‐associated nephrotoxicity: grave concern or death by character assassination?Am J Med.2010;123:182–187.
Wong‐Beringer A,Joo J,Tse E,Beringer P.Vancomycin‐associated nephrotoxicity: a critical appraisal of risk with high‐dose therapy.Int J Antimicrob Agents.2011;37:95–101.
Detrenis S,Meschi M,Musini S,Savazzi G.Lights and shadows on the pathogenesis of contrast‐induced nephropathy: state of the art.Nephrol Dial Transplant.2005;20:1542–1550.
Persson PB,Hansell P,Liss P.Pathophysiology of contrast medium‐induced nephropathy.Kidney Int.2005;68:14–22.
Kshirsagar AV,Poole C,Mottl A, et al.N‐acetylcysteine for the prevention of radiocontrast induced nephropathy: a meta‐analysis of prospective controlled trials.J Am Soc Nephrol.2004;15:761–769.
Ocak S,Gorur S,Hakverdi S,Celik S,Erdogan S.Protective effects of caffeic acid phenethyl ester, vitamin C, vitamin E and N‐acetylcysteine on vancomycin‐induced nephrotoxicity in rats.Basic Clin Pharmacol Toxicol.2007;100:328–333.
Cosgrove SE,Vigliani GA,Fowler VG, et al.Initial low‐dose gentamicin for Staphylococcus aureus bacteremia and endocarditis is nephrotoxic.Clin Infect Dis.2009;48:713–721.


")

")