User login
Obstructive sleep apnea: A better Dx model for primary care
ABSTRACT
Purpose To derive a predictive model for obstructive sleep apnea (OSA) in primary care practice, using home-based overnight oximetry results to refine posttest probability (PTP) of disease after initial risk stratification with the Sleep Apnea Clinical Score (SACS).
Methods We performed secondary analyses on data from a SACS validation cohort, to compare the diagnostic accuracy of 3 overnight oximetry measurements (oxygen desaturation index [ODI], mean saturation, and minimum saturation) in predicting OSA. Receiver operator characteristics (ROC) were computed for each measurement independently and sequentially after risk stratifying with SACS. We examined the implications of oximetry results for OSA PTP for participants categorized as intermediate risk (SACS 6-14; 66/191 participants [35%]; OSA probability 41%). We calculated positive likelihood ratios (LR) for multiple ODI results and determined which ones allowed recalibration to high- or low-risk PTP.
Results Among the 3 oximetry findings, ODI best predicted OSA (area under the curve [AUC], 0.88; 95% confidence interval [CI], 0.83-0.93). An ODI ≥8.4 (likelihood ratio [LR], 4.19; 95% CI, 2.87-6.10) created a PTP of 77%, while an ODI of 0 to <8.4 (LR, 0.19, 95% CI, 0.12-0.33) created a 14% PTP. Sequential application of SACS and ODI results yielded an AUC result of 0.90 (95% CI, 0.85-0.95).
Conclusions SACS risk stratification provides an advantage over clinical gestalt. In those at intermediate risk, ODI results provide a simple and clinically useful way to further refine diagnostic prediction. Sequential use of SACS and selectively employed overnight oximetry may limit unnecessary polysomnography. Oximetry testing should be avoided in patients deemed low or high risk by SACS, as positive results do not substantially recalibrate risk.
Obstructive sleep apnea (OSA) is a prevalent and underdiagnosed condition. The National Sleep Foundation estimates that 18 million Americans have OSA.1 Primary care practice may be the best setting in which to identify OSA, as many of our patients have conditions frequently associated with apnea (eg, hypertension, obesity, diabetes, arrhythmia, and neurologic illness). Up to a third of patients in primary care practice may be at increased risk.2,3
Clinical guidelines of the American Academy of Sleep Medicine (AASM) recommend obtaining a sleep history to evaluate for possible OSA in 3 instances: as part of a routine health maintenance examination, during evaluation of specific complaints associated with OSA (eg, snoring, apnea, daytime sleepiness), and during comprehensive evaluations for individuals with high-risk conditions (ie, obesity, congestive heart failure, refractory hypertension, diabetes, stroke history).4
The American College of Physicians (ACP) Clinical Practice Guideline suggests assessing individuals who have unexplained daytime sleepiness.5 The ACP considers this assessment “High-Value Care,” as “evidence shows that before diagnosis, patients with OSA have higher rates of health care use, more frequent and longer hospital stays, and higher health care costs than after diagnosis.”5
Continue to: We recently validated the diagnostic accuracy...
We recently validated the diagnostic accuracy of the Sleep Apnea Clinical Score (SACS) for use in a primary care patient population suspected of having OSA.6 SACS uses historical and clinical data to derive a score that identifies a patient’s risk level.7 However, as an alternative to the 2 levels described in Flemons’ SACS,7 we propose creating 3 risk strata (FIGURE 17,8). We believe that patients at high risk (SACS ≥15) should be encouraged to undergo sleep evaluations as their posttest probability (PTP) of OSA is 75% to 80%. Individuals at low risk (SACS ≤5; PTP <20%) could receive lifestyle advice and simple clinical interventions that decrease symptoms (eg, weight loss, increased physical activity, sleeping on one’s side). For low-risk patients, clinical observation and reevaluation could take place over time with their primary care provider, without additional testing or referral to specialists.

What about patients at intermediate risk? Many patients suspected of having OSA will be assigned to intermediate risk (SACS 6-14), and their PTP of OSA remains at 40% to 45%, the pre-test level most commonly encountered in suspected OSA. As polysomnography is a limited and expensive clinical resource, intermediate-risk patients would benefit from recalibration of their SACS-based risk assessment using an additional surrogate test such as home-based overnight oximetry. Our internal OSA practice guidelines recommend referral for sleep medicine consultation when oximetry results are abnormal—specifically, an oxygen desaturation index (ODI) of ≥5, a mean saturation less than 89%, and a minimum saturation of 75% or less.
Our objectives in this study were to compare the diagnostic implications of these 3 measurements from home-based overnight oximetry reports and use the most relevant result to derive a predictive model further refining PTP of OSA in a primary care patient population first stratified to intermediate risk by SACS.
METHODS
Subjects
We performed secondary analyses on data obtained from our SACS validation cohort.6 In brief, these were patients suspected of having OSA based on the presence of signs, symptoms, or associated risk factors. One hundred ninety-one patients completed all assessments. Sixty-six of 191 patients (35%) were categorized as intermediate risk (SACS 6-14; OSA probability 41% [27/66]).
Data collection and analyses
Participants completed home-based overnight oximetry using Nonin Model 2500 oximeters (Nonin Medical Inc., Plymouth, Minn). We transferred oximetry results from the sleep lab database to a statistical program for analyses of ODI, mean saturation, and minimal saturation. ODI was defined as the number of 4% drops in saturation from baseline divided by the number of hours of recording time. Although the AASM states that a diagnosis of OSA is confirmed if the number of obstructive events is more than 15 per hour or more than 5 per hour in a patient who reports related symptoms,4 we defined OSA as an apnea-hypopnea index (AHI) of >10 based on polysomnography (as this was the threshold used in the derivation cohort for SACS).7 We demonstrated the predictive ability of SACS at various AHI definitions of OSA in our validation cohort.6 The use of SACS in our validation cohort showed a statistically similar ability to predict OSA at both an AHI of 10 and 20, compared with the derivation cohort.
Continue to: We entered additional information...
We entered additional information reported directly by patients and obtained from their sleep studies into a REDCap database and transferred that to our statistical program. We used descriptive statistics to determine ranges and central tendencies of oximetry results. Receiver operator characteristic (ROC) analyses described the predictive abilities for each oximetry result individually and in serial application with prior SACS determinations. For comparison, we used the area under the ROC curve (AUC) from logistic regression to model the probability of OSA.
We calculated positive likelihood ratios (LR) and 95% confidence intervals (CI) to determine the degree of oximetry abnormality that would recalibrate risk either to a high PTP of OSA (>75%) or a low PTP (<25%). We sorted intermediate-risk SACS scores into quintiles based on ODI results to compare the resulting PTPs of OSA. We applied the PTP of OSA from our previous work (using the SACS score to compute the LR) as the new PTP, estimated the LR based on ODI, and computed an updated PTP of OSA. We also used ROC analysis to determine the optimal cutoff value of the ODI.
Finally, in accordance with our internal clinical practice recommendations, we examined the predictive ability of a “positive” ODI result of ≥5 to recalibrate risk prediction for OSA for patients in the low-risk group. We performed analyses using SAS 9.4 (SAS Institute, Cary, NC).
RESULTS

One hundred ninety-one subjects completed assessments. The median and quartile results for ODI, mean saturation, and minimum saturation are found in TABLE 1. TABLE 2 shows the distribution of patients with positive oximetry results. An ODI of 5 or greater was the most frequent abnormal result (135/191; 70.7%).

We used the AUC to measure the comparative abilities of SACS and the 3 overnight oximetry results in predicting OSA (TABLE 3). ODI results demonstrated the best ability to predict OSA, compared with polysomnography as the relative gold standard (AUC, 0.88; 95% confidence interval [CI], 0.83-0.93). Serial application of SACS and ODI yielded even better diagnostic results (AUC, 0.90; 95% CI, 0.85-0.95).

Continue to: As ODI was found to be the strongest predictor of OSA...
As ODI was found to be the strongest predictor of OSA, we grouped these results in quintiles and calculated positive LRs. TABLE 4 shows their effect on PTP of disease among patients with intermediate risk. An ODI result >10 effected an upward recalibration of disease probability (LR, 2.33; 95% CI, 1.27-4.26). The optimal cutoff of ODI to discriminate between those with and without OSA was determined by ROC analysis. An ODI greater than 8.4 created a PTP of disease of approximately 73% to 77%.

Our internal clinical guidelines recommend referring patients with an ODI of 5 or greater for sleep medicine consultation. We examined the ability of this ODI result to recalibrate disease suspicion for a patient at low risk (SACS ≤5). The LR for ODI of 5 or greater is 2.1, but this only results in a recalibration of risk from 24% pretest probability in our validation cohort to 41% PTP (95% CI, 33-49). This low cutoff for a positive test creates false-positive results more than 40% of the time due to low specificity (0.58). This is insufficient to change the suspicion of disease, resulting only in a shift to intermediate OSA risk.
DISCUSSION
Among 3 different oximetry measurements, an ODI ≥10 best predicts OSA, both independently and when used sequentially after the SACS. ODI was by far the most frequent abnormality on oximetry in our cohort, thereby increasing its utility in clinical decision making. For those subjects at intermediate risk, a cutoff of 10 for the ODI result may be a simple and clinically effective way to recalibrate risk and aid in making referral decisions. (This may also be simpler and more easily remembered by clinicians than the 8.4 ODI results from the ROC analyses.)
Assessment is inadequate without a clinical prediction rule. Unfortunately, providers cannot simply rely on clinical gestalt in diagnosing OSA. In their derivation cohort, Flemens et al examined the LRs created by SACS and by clinician prediction based on history and physical exam.7 The SACS LRs ranged from 5.17 to 0.25, a 20-fold range. This reflected superior diagnostic information compared with subjective physician impression, where LRs ranged from 3.7 to 0.52, a seven-fold range. Myers et al prepared a meta-analysis of 4 different trials that examined physicians’ ability to predict OSA.9 Despite the researchers’ use of experienced sleep medicine doctors, the overall diagnostic accuracy of clinical impression was modest (summary positive LR, 1.7; 95% CI, 1.5-2; I2 = 0%; summary negative LR, 0.67; 95% CI, 0.60-0.74; I2 = 10%; sensitivity, 58%; specificity, 67%). This is similar to reliance on a single clinical sign or symptom to predict OSA.
Wise use of oximetry augments SACS calculation. To limit unnecessary oximetry testing in low- and high-risk groups and to avoid polysomnography in cases of a low PTP of disease, we advocate limiting oximetry testing to individuals in the SACS intermediate-risk group (FIGURE 2) wherein ODI results can potentially recalibrate risk assessment up or down. (Those in the high- risk group should be referred to a sleep medicine specialist.) Our institutional recommendation of using an ODI result of ≥5 as a threshold to increase suspicion of disease requires a caveat for the low-risk group. “Positive” results at that low diagnostic threshold are frequently false.

Continue to: Multiple benefits of SACS
Multiple benefits of SACS. We believe using the SACS calculation during clinical encounters with patients potentially at risk for OSA would increase diagnostic accuracy. Performing risk stratification with SACS should not be an undue burden on providers, and the increased time spent with patients has its own benefits, including helping them better understand their risk. Using this standardized process—augmented, as needed, with overnight ODI assessment—might also encourage more patients to follow through on subsequent recommendations, as their risk is further quantified objectively. Lastly, unnecessary testing with polysomnography could be avoided.
Limitations of our study. This study’s findings were derived from a patient population in a single institution. Replication of the findings from other settings would be helpful.
Looking forward. It is yet unclear if clinicians will embrace these strategies in real-world primary care practice. We have designed an implementation-and-dissemination trial to assess whether family physicians will use the SACS clinical predication rule in everyday practice and whether our evidence-based recommendations about overnight oximetry will be followed. Underlying our suggested clinical evaluation pathway (FIGURE 2) is the belief that there is value gained from sharing the decision-making process with patients. Although we provide new evidence that informs these conversations, the patient’s values and preferences are important when determining the best direction to proceed in the evaluation for suspected OSA. These recommendations are intended to aid, not replace, good clinical judgment.
Home-based sleep testing has become more widely available, is convenient for patients, and is less expensive than lab-based polysomnography. Our study did not directly address the appropriate circumstances for home studies in clinical evaluation. We rely on the expertise of our sleep medicine colleagues to determine which patients are appropriate candidates for home-based studies.
The AASM states that “portable monitors (PM) for the diagnosis of OSA should be [used] only in conjunction with a comprehensive sleep evaluation. Clinical sleep evaluations using PM must be supervised by a practitioner with board certification in sleep medicine or an individual who fulfills the eligibility criteria for the sleep medicine certification examination.”4 Additionally, the group recommends that PM “may be used in the unattended setting as an alternative to polysomnography for the diagnosis of OSA in patients with a high pretest probability of moderate to severe OSA and no comorbid sleep disorder or major comorbid medical disorders.”4
Continue to: GRANT SUPPORT
GRANT SUPPORT
The use of the REDCap database is supported by grant UL1 TR000135. This work was supported by a Mayo Foundation CR-20 grant awarded to Dr. Mookadam as Principal investigator and Dr. Grover as Coinvestigator.
Statistical analyses were supported, in part, by the Department of Family Medicine, Mayo Clinic, Scottsdale, Ariz.
CORRESPONDENCE
Michael Grover, DO, Mayo Clinic Thunderbird Primary Care Center-Family Medicine, 13737 N 92nd Street, Scottsdale, AZ 85260; grover.michael@mayo.edu
1. National Sleep Foundation. Sleep apnea. https://sleepfoundation.org/sleep-disorders-problems/sleep-apnea. Accessed September 14, 2018.
2. Grover M, Mookadam M, Armas D, et al. Identifying patients at risk for obstructive sleep apnea in a primary care practice. J Am Board Fam Med. 2011;24:152-160.
3. Mold JW, Quattlebaum C, Schinnerer E, et al. Identification by primary care clinicians of patients with obstructive sleep apnea: a practice-based research network (PBRN) study. J Am Board Fam Med. 2011;24:138-145.
4. Epstein LJ, Kristo D, Strollo PJ, Jr., et al; Adult Obstructive Sleep Apnea Task Force of the American Academy of Sleep Medicine. Clinical guideline for the evaluation, management and long-term care of obstructive sleep apnea in adults. J Clin Sleep Med. 2009;5:263-276.
5. Qaseem A, Dallas P, Owens DK, et al. Diagnosis of obstructive sleep apnea in adults: a clinical practice guideline from the American College of Physicians. Ann Intern Med. 2014;161:210-220.
6. Grover M, Mookadam M, Chang Y-H, et al. Validating the Sleep Apnea Clinical Score for use in primary care populations. Mayo Clin Proc. 2016;91:469-476.
7. Flemons WW, Whitelaw WA, Brant R, et al. Likelihood ratios for a sleep apnea clinical prediction rule. Am J Respir Crit Care Med. 1994;150:1279-1285.
8. Gali B, Whalen FX, Gay PC, et al. Management plan to reduce risks in perioperative care of patients with presumed obstructive sleep apnea syndrome. J Clin Sleep Med. 2007;3:582-588.
9. Myers KA, Mrkobrada M, Simel DL. Does this patient have obstructive sleep apnea?: The rational clinical examination systematic review. JAMA. 2013;310(7):731-741.
ABSTRACT
Purpose To derive a predictive model for obstructive sleep apnea (OSA) in primary care practice, using home-based overnight oximetry results to refine posttest probability (PTP) of disease after initial risk stratification with the Sleep Apnea Clinical Score (SACS).
Methods We performed secondary analyses on data from a SACS validation cohort, to compare the diagnostic accuracy of 3 overnight oximetry measurements (oxygen desaturation index [ODI], mean saturation, and minimum saturation) in predicting OSA. Receiver operator characteristics (ROC) were computed for each measurement independently and sequentially after risk stratifying with SACS. We examined the implications of oximetry results for OSA PTP for participants categorized as intermediate risk (SACS 6-14; 66/191 participants [35%]; OSA probability 41%). We calculated positive likelihood ratios (LR) for multiple ODI results and determined which ones allowed recalibration to high- or low-risk PTP.
Results Among the 3 oximetry findings, ODI best predicted OSA (area under the curve [AUC], 0.88; 95% confidence interval [CI], 0.83-0.93). An ODI ≥8.4 (likelihood ratio [LR], 4.19; 95% CI, 2.87-6.10) created a PTP of 77%, while an ODI of 0 to <8.4 (LR, 0.19, 95% CI, 0.12-0.33) created a 14% PTP. Sequential application of SACS and ODI results yielded an AUC result of 0.90 (95% CI, 0.85-0.95).
Conclusions SACS risk stratification provides an advantage over clinical gestalt. In those at intermediate risk, ODI results provide a simple and clinically useful way to further refine diagnostic prediction. Sequential use of SACS and selectively employed overnight oximetry may limit unnecessary polysomnography. Oximetry testing should be avoided in patients deemed low or high risk by SACS, as positive results do not substantially recalibrate risk.
Obstructive sleep apnea (OSA) is a prevalent and underdiagnosed condition. The National Sleep Foundation estimates that 18 million Americans have OSA.1 Primary care practice may be the best setting in which to identify OSA, as many of our patients have conditions frequently associated with apnea (eg, hypertension, obesity, diabetes, arrhythmia, and neurologic illness). Up to a third of patients in primary care practice may be at increased risk.2,3
Clinical guidelines of the American Academy of Sleep Medicine (AASM) recommend obtaining a sleep history to evaluate for possible OSA in 3 instances: as part of a routine health maintenance examination, during evaluation of specific complaints associated with OSA (eg, snoring, apnea, daytime sleepiness), and during comprehensive evaluations for individuals with high-risk conditions (ie, obesity, congestive heart failure, refractory hypertension, diabetes, stroke history).4
The American College of Physicians (ACP) Clinical Practice Guideline suggests assessing individuals who have unexplained daytime sleepiness.5 The ACP considers this assessment “High-Value Care,” as “evidence shows that before diagnosis, patients with OSA have higher rates of health care use, more frequent and longer hospital stays, and higher health care costs than after diagnosis.”5
Continue to: We recently validated the diagnostic accuracy...
We recently validated the diagnostic accuracy of the Sleep Apnea Clinical Score (SACS) for use in a primary care patient population suspected of having OSA.6 SACS uses historical and clinical data to derive a score that identifies a patient’s risk level.7 However, as an alternative to the 2 levels described in Flemons’ SACS,7 we propose creating 3 risk strata (FIGURE 17,8). We believe that patients at high risk (SACS ≥15) should be encouraged to undergo sleep evaluations as their posttest probability (PTP) of OSA is 75% to 80%. Individuals at low risk (SACS ≤5; PTP <20%) could receive lifestyle advice and simple clinical interventions that decrease symptoms (eg, weight loss, increased physical activity, sleeping on one’s side). For low-risk patients, clinical observation and reevaluation could take place over time with their primary care provider, without additional testing or referral to specialists.
What about patients at intermediate risk? Many patients suspected of having OSA will be assigned to intermediate risk (SACS 6-14), and their PTP of OSA remains at 40% to 45%, the pre-test level most commonly encountered in suspected OSA. As polysomnography is a limited and expensive clinical resource, intermediate-risk patients would benefit from recalibration of their SACS-based risk assessment using an additional surrogate test such as home-based overnight oximetry. Our internal OSA practice guidelines recommend referral for sleep medicine consultation when oximetry results are abnormal—specifically, an oxygen desaturation index (ODI) of ≥5, a mean saturation less than 89%, and a minimum saturation of 75% or less.
Our objectives in this study were to compare the diagnostic implications of these 3 measurements from home-based overnight oximetry reports and use the most relevant result to derive a predictive model further refining PTP of OSA in a primary care patient population first stratified to intermediate risk by SACS.
METHODS
Subjects
We performed secondary analyses on data obtained from our SACS validation cohort.6 In brief, these were patients suspected of having OSA based on the presence of signs, symptoms, or associated risk factors. One hundred ninety-one patients completed all assessments. Sixty-six of 191 patients (35%) were categorized as intermediate risk (SACS 6-14; OSA probability 41% [27/66]).
Data collection and analyses
Participants completed home-based overnight oximetry using Nonin Model 2500 oximeters (Nonin Medical Inc., Plymouth, Minn). We transferred oximetry results from the sleep lab database to a statistical program for analyses of ODI, mean saturation, and minimal saturation. ODI was defined as the number of 4% drops in saturation from baseline divided by the number of hours of recording time. Although the AASM states that a diagnosis of OSA is confirmed if the number of obstructive events is more than 15 per hour or more than 5 per hour in a patient who reports related symptoms,4 we defined OSA as an apnea-hypopnea index (AHI) of >10 based on polysomnography (as this was the threshold used in the derivation cohort for SACS).7 We demonstrated the predictive ability of SACS at various AHI definitions of OSA in our validation cohort.6 The use of SACS in our validation cohort showed a statistically similar ability to predict OSA at both an AHI of 10 and 20, compared with the derivation cohort.
Continue to: We entered additional information...
We entered additional information reported directly by patients and obtained from their sleep studies into a REDCap database and transferred that to our statistical program. We used descriptive statistics to determine ranges and central tendencies of oximetry results. Receiver operator characteristic (ROC) analyses described the predictive abilities for each oximetry result individually and in serial application with prior SACS determinations. For comparison, we used the area under the ROC curve (AUC) from logistic regression to model the probability of OSA.
We calculated positive likelihood ratios (LR) and 95% confidence intervals (CI) to determine the degree of oximetry abnormality that would recalibrate risk either to a high PTP of OSA (>75%) or a low PTP (<25%). We sorted intermediate-risk SACS scores into quintiles based on ODI results to compare the resulting PTPs of OSA. We applied the PTP of OSA from our previous work (using the SACS score to compute the LR) as the new PTP, estimated the LR based on ODI, and computed an updated PTP of OSA. We also used ROC analysis to determine the optimal cutoff value of the ODI.
Finally, in accordance with our internal clinical practice recommendations, we examined the predictive ability of a “positive” ODI result of ≥5 to recalibrate risk prediction for OSA for patients in the low-risk group. We performed analyses using SAS 9.4 (SAS Institute, Cary, NC).
RESULTS
One hundred ninety-one subjects completed assessments. The median and quartile results for ODI, mean saturation, and minimum saturation are found in TABLE 1. TABLE 2 shows the distribution of patients with positive oximetry results. An ODI of 5 or greater was the most frequent abnormal result (135/191; 70.7%).
We used the AUC to measure the comparative abilities of SACS and the 3 overnight oximetry results in predicting OSA (TABLE 3). ODI results demonstrated the best ability to predict OSA, compared with polysomnography as the relative gold standard (AUC, 0.88; 95% confidence interval [CI], 0.83-0.93). Serial application of SACS and ODI yielded even better diagnostic results (AUC, 0.90; 95% CI, 0.85-0.95).
Continue to: As ODI was found to be the strongest predictor of OSA...
As ODI was found to be the strongest predictor of OSA, we grouped these results in quintiles and calculated positive LRs. TABLE 4 shows their effect on PTP of disease among patients with intermediate risk. An ODI result >10 effected an upward recalibration of disease probability (LR, 2.33; 95% CI, 1.27-4.26). The optimal cutoff of ODI to discriminate between those with and without OSA was determined by ROC analysis. An ODI greater than 8.4 created a PTP of disease of approximately 73% to 77%.
Our internal clinical guidelines recommend referring patients with an ODI of 5 or greater for sleep medicine consultation. We examined the ability of this ODI result to recalibrate disease suspicion for a patient at low risk (SACS ≤5). The LR for ODI of 5 or greater is 2.1, but this only results in a recalibration of risk from 24% pretest probability in our validation cohort to 41% PTP (95% CI, 33-49). This low cutoff for a positive test creates false-positive results more than 40% of the time due to low specificity (0.58). This is insufficient to change the suspicion of disease, resulting only in a shift to intermediate OSA risk.
DISCUSSION
Among 3 different oximetry measurements, an ODI ≥10 best predicts OSA, both independently and when used sequentially after the SACS. ODI was by far the most frequent abnormality on oximetry in our cohort, thereby increasing its utility in clinical decision making. For those subjects at intermediate risk, a cutoff of 10 for the ODI result may be a simple and clinically effective way to recalibrate risk and aid in making referral decisions. (This may also be simpler and more easily remembered by clinicians than the 8.4 ODI results from the ROC analyses.)
Assessment is inadequate without a clinical prediction rule. Unfortunately, providers cannot simply rely on clinical gestalt in diagnosing OSA. In their derivation cohort, Flemens et al examined the LRs created by SACS and by clinician prediction based on history and physical exam.7 The SACS LRs ranged from 5.17 to 0.25, a 20-fold range. This reflected superior diagnostic information compared with subjective physician impression, where LRs ranged from 3.7 to 0.52, a seven-fold range. Myers et al prepared a meta-analysis of 4 different trials that examined physicians’ ability to predict OSA.9 Despite the researchers’ use of experienced sleep medicine doctors, the overall diagnostic accuracy of clinical impression was modest (summary positive LR, 1.7; 95% CI, 1.5-2; I2 = 0%; summary negative LR, 0.67; 95% CI, 0.60-0.74; I2 = 10%; sensitivity, 58%; specificity, 67%). This is similar to reliance on a single clinical sign or symptom to predict OSA.
Wise use of oximetry augments SACS calculation. To limit unnecessary oximetry testing in low- and high-risk groups and to avoid polysomnography in cases of a low PTP of disease, we advocate limiting oximetry testing to individuals in the SACS intermediate-risk group (FIGURE 2) wherein ODI results can potentially recalibrate risk assessment up or down. (Those in the high- risk group should be referred to a sleep medicine specialist.) Our institutional recommendation of using an ODI result of ≥5 as a threshold to increase suspicion of disease requires a caveat for the low-risk group. “Positive” results at that low diagnostic threshold are frequently false.
Continue to: Multiple benefits of SACS
Multiple benefits of SACS. We believe using the SACS calculation during clinical encounters with patients potentially at risk for OSA would increase diagnostic accuracy. Performing risk stratification with SACS should not be an undue burden on providers, and the increased time spent with patients has its own benefits, including helping them better understand their risk. Using this standardized process—augmented, as needed, with overnight ODI assessment—might also encourage more patients to follow through on subsequent recommendations, as their risk is further quantified objectively. Lastly, unnecessary testing with polysomnography could be avoided.
Limitations of our study. This study’s findings were derived from a patient population in a single institution. Replication of the findings from other settings would be helpful.
Looking forward. It is yet unclear if clinicians will embrace these strategies in real-world primary care practice. We have designed an implementation-and-dissemination trial to assess whether family physicians will use the SACS clinical predication rule in everyday practice and whether our evidence-based recommendations about overnight oximetry will be followed. Underlying our suggested clinical evaluation pathway (FIGURE 2) is the belief that there is value gained from sharing the decision-making process with patients. Although we provide new evidence that informs these conversations, the patient’s values and preferences are important when determining the best direction to proceed in the evaluation for suspected OSA. These recommendations are intended to aid, not replace, good clinical judgment.
Home-based sleep testing has become more widely available, is convenient for patients, and is less expensive than lab-based polysomnography. Our study did not directly address the appropriate circumstances for home studies in clinical evaluation. We rely on the expertise of our sleep medicine colleagues to determine which patients are appropriate candidates for home-based studies.
The AASM states that “portable monitors (PM) for the diagnosis of OSA should be [used] only in conjunction with a comprehensive sleep evaluation. Clinical sleep evaluations using PM must be supervised by a practitioner with board certification in sleep medicine or an individual who fulfills the eligibility criteria for the sleep medicine certification examination.”4 Additionally, the group recommends that PM “may be used in the unattended setting as an alternative to polysomnography for the diagnosis of OSA in patients with a high pretest probability of moderate to severe OSA and no comorbid sleep disorder or major comorbid medical disorders.”4
Continue to: GRANT SUPPORT
GRANT SUPPORT
The use of the REDCap database is supported by grant UL1 TR000135. This work was supported by a Mayo Foundation CR-20 grant awarded to Dr. Mookadam as Principal investigator and Dr. Grover as Coinvestigator.
Statistical analyses were supported, in part, by the Department of Family Medicine, Mayo Clinic, Scottsdale, Ariz.
CORRESPONDENCE
Michael Grover, DO, Mayo Clinic Thunderbird Primary Care Center-Family Medicine, 13737 N 92nd Street, Scottsdale, AZ 85260; grover.michael@mayo.edu
1. National Sleep Foundation. Sleep apnea. https://sleepfoundation.org/sleep-disorders-problems/sleep-apnea. Accessed September 14, 2018.
2. Grover M, Mookadam M, Armas D, et al. Identifying patients at risk for obstructive sleep apnea in a primary care practice. J Am Board Fam Med. 2011;24:152-160.
3. Mold JW, Quattlebaum C, Schinnerer E, et al. Identification by primary care clinicians of patients with obstructive sleep apnea: a practice-based research network (PBRN) study. J Am Board Fam Med. 2011;24:138-145.
4. Epstein LJ, Kristo D, Strollo PJ, Jr., et al; Adult Obstructive Sleep Apnea Task Force of the American Academy of Sleep Medicine. Clinical guideline for the evaluation, management and long-term care of obstructive sleep apnea in adults. J Clin Sleep Med. 2009;5:263-276.
5. Qaseem A, Dallas P, Owens DK, et al. Diagnosis of obstructive sleep apnea in adults: a clinical practice guideline from the American College of Physicians. Ann Intern Med. 2014;161:210-220.
6. Grover M, Mookadam M, Chang Y-H, et al. Validating the Sleep Apnea Clinical Score for use in primary care populations. Mayo Clin Proc. 2016;91:469-476.
7. Flemons WW, Whitelaw WA, Brant R, et al. Likelihood ratios for a sleep apnea clinical prediction rule. Am J Respir Crit Care Med. 1994;150:1279-1285.
8. Gali B, Whalen FX, Gay PC, et al. Management plan to reduce risks in perioperative care of patients with presumed obstructive sleep apnea syndrome. J Clin Sleep Med. 2007;3:582-588.
9. Myers KA, Mrkobrada M, Simel DL. Does this patient have obstructive sleep apnea?: The rational clinical examination systematic review. JAMA. 2013;310(7):731-741.

Evaluating the Clinical and Demographic Features of Extrafacial Granuloma Faciale
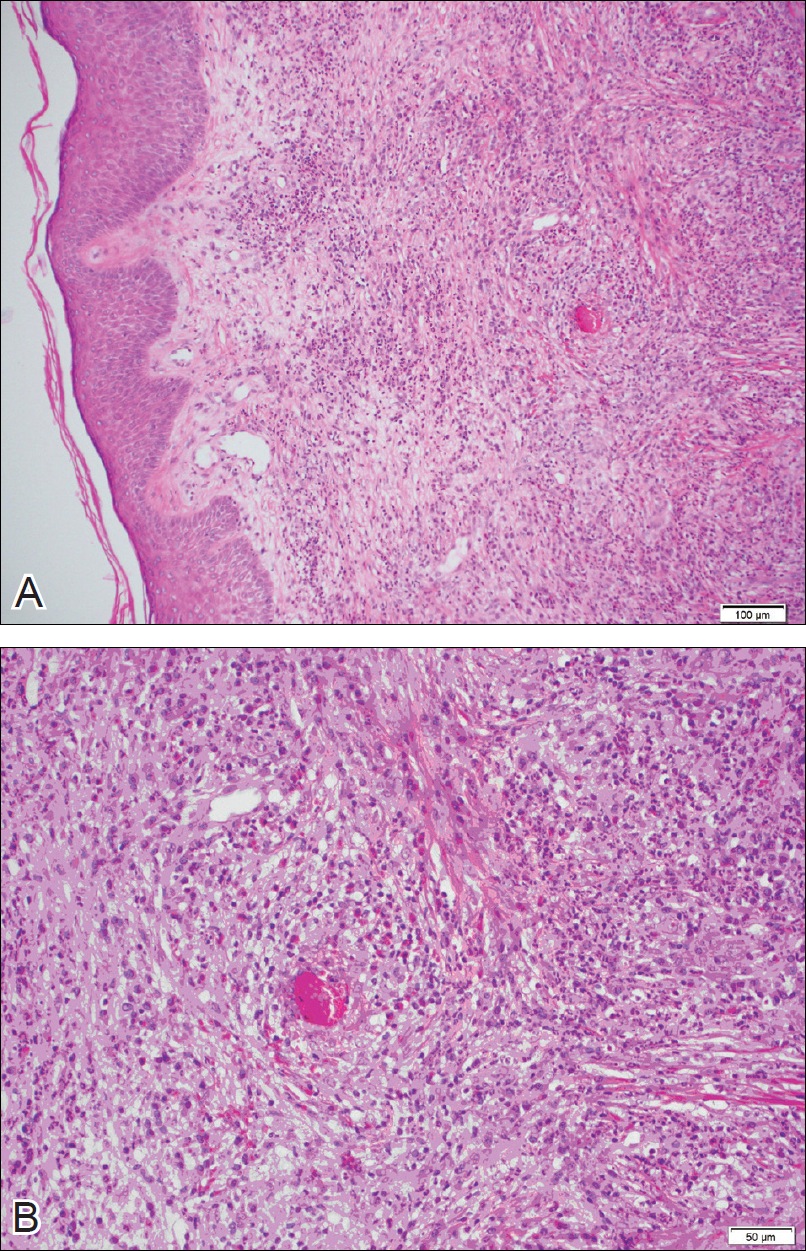
Granuloma faciale (GF) is a chronic benign leukocytoclastic vasculitis that can be difficult to treat. It is characterized by single or multiple, soft, well-circumscribed papules, plaques, or nodules ranging in color from red, violet, or yellow to brown that may darken with sun exposure.1 Lesions usually are smooth with follicular orifices that are accentuated, thus producing a peau d’orange appearance. Lesions generally are slow to develop and asymptomatic, though some patients report pruritus or burning.2,3 Diagnosis of GF is based on the presence of distinct histologic features. The epidermis usually is spared, with a prominent grenz zone of normal collagen separating the epidermis from a dense infiltrate of neutrophils, lymphocytes, and eosinophils. This mixed inflammatory infiltrate is seen mainly in the superficial dermis but occasionally spreads to the lower dermis and subcutaneous tissues.4
As the name implies, GF usually is confined to the face but occasionally involves extrafacial sites.5-15 The clinical characteristics of these rare extrafacial lesions are not well understood. The purpose of this study was to identify the clinical and demographic features of extrafacial GF in patients treated at Mayo Clinic (Rochester, Minnesota) during a 54-year period.
Methods
This study was approved by the Mayo institutional review board. We searched the Mayo Clinic Rochester dermatology database for all patients with a diagnosis of GF from 1959 through 2013. All histopathology slides were reviewed by a board-certified dermatologist (A.G.B.) and dermatopathologist (A.G.B.) before inclusion in this study. Histologic criteria for diagnosis of GF included the presence of a mixed inflammatory infiltrate of neutrophils, eosinophils, lymphocytes, and histiocytes in the superficial or deep dermis; a prominent grenz zone separating the uninvolved epidermis; and the presence of vascular damage, as seen by fibrin deposition in dermal blood vessels.
Medical records were reviewed for patient demographics and for history pertinent to the diagnosis of GF, including sites involved, appearance, histopathology reports, symptoms, treatments, and outcomes.
Literature Search Strategy
A computerized Ovid MEDLINE database search was undertaken to identify English-language articles concerning GF in humans using the search terms granuloma faciale with extrafacial or disseminated. To ensure that no articles were overlooked, we conducted another search for English-language articles in the Embase database (1946-2013) using the terms granuloma faciale and extrafacial or disseminated.
Statistical Analysis
Descriptive clinical and histopathologic data were summarized using means, medians, and ranges or proportions as appropriate; statistical analysis was performed using SAS software (JMP package).
Results
Ninety-six patients with a diagnosis of GF were identified, and 12 (13%) had a diagnosis of extrafacial GF. Of them, 2 patients had a diagnosis of extrafacial GF supported only by histopathology slides without accompanying clinical records and therefore were excluded from the study. Thus, 10 cases of extrafacial GF were identified from our search and were included in the study group. Clinical data for these patients are summarized in Table 1. The mean age was 58.7 years (range, 26–87 years). Six (60%) patients were male, and all patients were white. Seven patients (70%) had facial GF in addition to extrafacial GF. Six patients reported no symptoms (60%), and 4 (40%) reported pruritus, discomfort, or both associated with their GF lesions.

Extrafacial GF was diagnosed in the following anatomic locations: scalp (n=3 [30%]), posterior auricular area (n=3 [30%]), mid upper back (n=1 [10%]), right shoulder (n=1 [10%]), both ears (n=1 [10%]), right elbow (n=1 [10%]), and left infra-auricular area (n=1 [10%]). Only 1 (10%) patient had multiple extrafacial sites identified.
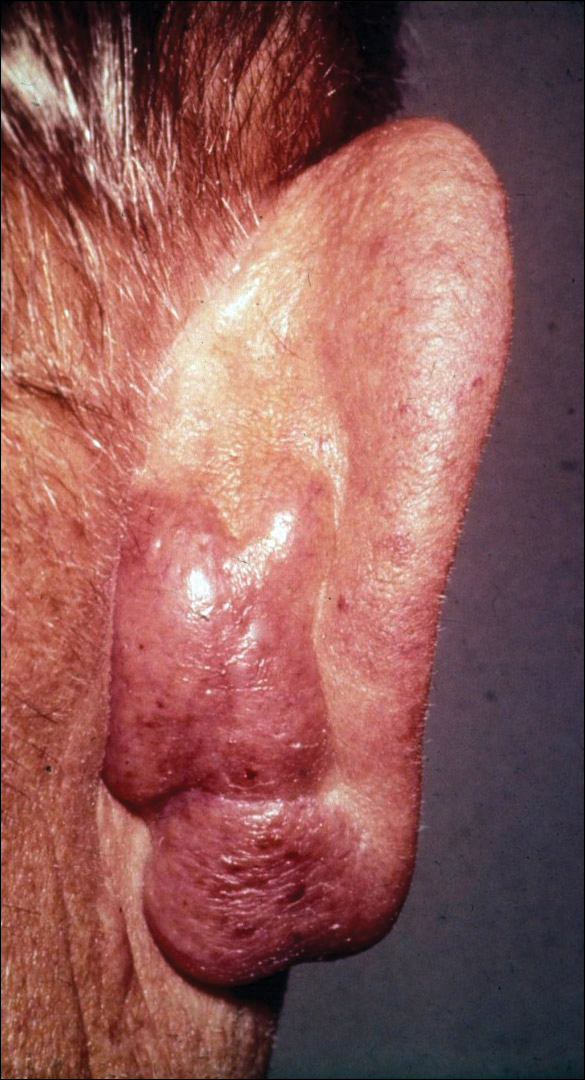
The lesions were characterized clinically as violet, red, and yellow to brown smooth papules, plaques, and nodules (Figure 1). Biopsies from these lesions showed a subepidermal and adnexal grenz zone; a polymorphous perivascular and periadnexal dermal infiltrate composed of neutrophils, eosinophils, lymphocytes, histiocytes, and plasma cells; and a mild subtle leukocytoclastic vasculitis with subtle mild vascular necrosis (Figure 2).
For the 9 patients who elected to undergo GF treatment, the average number of treatments attempted was 2.8 (range, 1–5). The most common method of treatment was a combination of intralesional and topical corticosteroids (n=5 [50%]). Other methods included surgery (n=3 [30%]), dapsone (n=2 [20%]), radiation therapy (n=2 [20%]), cryosurgery (n=1 [10%]), nitrogen mustard (n=1 [10%]), liquid nitrogen (n=1 [10%]), and tar shampoo and fluocinolone acetonide solution 0.01% (n=1 [10%]).
Treatment outcomes were available for 8 of 9 treated patients. Three patients (patients 7, 8, and 10) had long-term successful resolution of their lesions. Patient 7 had an extrafacial lesion that was successfully treated with intralesional and topical corticosteroids, but the facial lesions recurred. The extrafacial GF lesion in patient 8 was found adjacent to a squamous cell carcinoma and was removed with a wide surgical excision that included both lesions. Patient 10 was successfully treated with a combination of liquid nitrogen and topical corticosteroid. Patients 2 and 4 were well controlled while on dapsone; however, once the treatment was discontinued, primarily due to adverse effects, the lesions returned.
Literature Search
Our search of the English-language literature identified 20 patients with extrafacial GF (Table 2). Fifteen (75%) patients were male, which was similar to our study (6/10 [60%]). Our patient population was slightly older with a mean age of 58.7 years compared to a median age of 54 years among those identified in the literature. Additionally, 3 (30%) patients in our study had no facial lesions, as seen in classic GF, which is comparable to 8 (40%) patients identified in the literature.
Comment
Extrafacial GF primarily affects white individuals and is more prevalent in men, as demonstrated in our study. Extrafacial GF was most often found in association with facial lesions, with only 3 patients having exclusively extrafacial sites.
Data from the current study indicate that diverse modalities were used to treat extrafacial GF with variable outcomes (chronic recurrence to complete resolution). The most common first-line treatment, intralesional corticosteroid injection, was used in 5 (50%) patients but resulted in only 1 (10%) successful resolution. Other methods frequently used in our study and prior studies were surgical excision, cryotherapy, electrosurgery, and dermabrasion.1,20 These treatments do not appear to be uniformly definitive, and the ablative methods may result in scarring.1 Different laser treatments are emerging for the management of GF lesions. Prior reports of treating facial GF with argon and CO2 lasers have indicated minimized residual scarring and pigmentation.21-23 The use of pulsed dye lasers has resulted in complete clearance of facial GF lesions, without recurrence on long-term follow-up.20,24-26
The latest investigations of immunomodulatory drugs indicate these agents are promising for the management of facial GF. Eetam et al27 reported the successful use of topical tacrolimus to treat facial GF. The relatively low cost and ease of use make these topical medications a competitive alternative to currently available surgical and laser methods. The appearance of all of these novel therapeutic modalities creates the necessity for a randomized trial to establish their efficacy on extrafacial GF lesions.
The wide array of treatments reflects the recalcitrant nature of extrafacial GF lesions. Further insight into the etiology of these lesions is needed to understand their tendency to recur. The important contribution of our study is the observed
Conclusion
The findings from this study and the cases reviewed in the literature provide a unique contribution to the understanding of the clinical and demographic characteristics of extrafacial GF. The rarity of this condition is the single most important constraint of our study, reflected in the emblematic limitations of a retrospective analysis in a select group of patients. The results of analysis of data from our patients were similar to the findings reported in the English-language medical literature. Serious consideration should be given to the development of a national registry for patients with GF. A database containing the clinicopathologic features, treatments, and outcomes for patients with both facial and extrafacial manifestations of GF may be invaluable in evaluating various treatment options and increasing understanding of the etiology and epidemiology of the disease.
- Radin DA, Mehregan DR. Granuloma faciale: distribution of the lesions and review of the literature. Cutis. 2003;72:213-219.
- Dowlati B, Firooz A, Dowlati Y. Granuloma faciale: successful treatment of nine cases with a combination of cryotherapy and intralesional corticosteroid injection. Int J Dermatol. 1997;36:548-551.
- Guill MA, Aton JK. Facial granuloma responsive to dapsone therapy. Arch Dermatol. 1982;118:332-335.
- Ryan TJ. Cutaneous vasculitis. In: Champion RH, Burton JL, Burns DA, et al, eds. Rook/Wilkins/Ebling Textbook of Dermatology. 7th ed. Malden, MA: Blackwell Science; 2004.
- Castano E, Segurado A, Iglesias L, et al. Granuloma faciale entirely in an extrafacial location. Br J Dermatol. 1997;136:978-979.
- Castellano-Howard L, Fairbee SI, Hogan DJ, et al. Extrafacial granuloma faciale: report of a case and response to treatment. Cutis. 2001;67:413-415.
- Cecchi R, Paoli S, Giomi A. Granuloma faciale with extrafacial lesions. Eur J Dermatol. 2002;12:438.
- Inanir I, Alvur Y. Granuloma faciale with extrafacial lesions. Br J Dermatol. 2001;14:360-362.
- Kavanagh GM, McLaren KM, Hunter JA. Extensive extrafacial granuloma faciale of the scalp. Br J Dermatol. 1996;134:595-596.
- Marcoval J, Moreno A, Peyr J. Granuloma faciale: a clinicopathological study of 11 cases. J Am Acad Dermatol. 2004;51:269-273.
- Okun MR, Bauman L, Minor D. Granuloma faciale with lesions on the face and hand. Arch Dermatol. 1965;92:78-80.
- Roustan G, Sanchez Yus E, Salas C, et al. Granuloma faciale with extrafacial lesions. Dermatology. 1999;198:79-82.
- Rusin LJ, Dubin HV, Taylor WB. Disseminated granuloma faciale. Arch Dermatol. 1976;112:1575-1577.
- Sears JK, Gitter DG, Stone MS. Extrafacial granuloma faciale. Arch Dermatol. 1991;127:742-743.
- Zargari O. Disseminated granuloma faciale. Int J Dermatol. 2004;43:210-212.
- Lever WF, Lane CG, Downing JG, et al. Eosinophilic granuloma of the skin: report of three cases. Arch Derm Syphilol. 1948;58:430-438.
- Pedace FJ, Perry HO. Granuloma faciale: a clinical and histopathologic review. Arch Dermatol. 1966;94:387-395.
- Frost FA, Heenan PJ. Facial granuloma. Australas J Dermatol. 1984;25:121-124.
Konohana A. Extrafacial granuloma faciale. J Dermatol. 1994;21:680-682.- Ludwig E, Allam JP, Bieber T, et al. New treatment modalities for granuloma faciale. Br J Dermatol. 2003;149:634-637.
- Apfelberg DB, Druker D, Maser MR, et al. Granuloma faciale: treatment with the argon laser. Arch Dermatol. 1983;119:573-576.
- Apfelberg DB, Maser MR, Lash H, et al. Expanded role of the argon laser in plastic surgery. J Dermatol Surg Oncol. 1983;9:145-151.
- Wheeland RG, Ashley JR, Smith DA, et al. Carbon dioxide laser treatment of granuloma faciale. J Dermatol Surg Oncol. 1984;10:730-733.
- Cheung ST, Lanigan SW. Granuloma faciale treated with the pulsed-dye laser: a case series. Clin Exp Dermatol. 2005;30:373-375.
- Chatrath V, Rohrer TE. Granuloma faciale successfully treated with long-pulsed tunable dye laser. Dermatol Surg. 2002;28:527-529.
- Elston DM. Treatment of granuloma faciale with the pulsed dye laser. Cutis. 2000;65:97-98.
- Eetam I, Ertekin B, Unal I, et al. Granuloma faciale: is it a new indication for pimecrolimus? a case report. J Dermatolog Treat. 2006;17:238-240.
- Johnson WC, Higdon RS, Helwig EB. Granuloma faciale. AMA Arch Derm. 1959;79:42-52.
Granuloma faciale (GF) is a chronic benign leukocytoclastic vasculitis that can be difficult to treat. It is characterized by single or multiple, soft, well-circumscribed papules, plaques, or nodules ranging in color from red, violet, or yellow to brown that may darken with sun exposure.1 Lesions usually are smooth with follicular orifices that are accentuated, thus producing a peau d’orange appearance. Lesions generally are slow to develop and asymptomatic, though some patients report pruritus or burning.2,3 Diagnosis of GF is based on the presence of distinct histologic features. The epidermis usually is spared, with a prominent grenz zone of normal collagen separating the epidermis from a dense infiltrate of neutrophils, lymphocytes, and eosinophils. This mixed inflammatory infiltrate is seen mainly in the superficial dermis but occasionally spreads to the lower dermis and subcutaneous tissues.4
As the name implies, GF usually is confined to the face but occasionally involves extrafacial sites.5-15 The clinical characteristics of these rare extrafacial lesions are not well understood. The purpose of this study was to identify the clinical and demographic features of extrafacial GF in patients treated at Mayo Clinic (Rochester, Minnesota) during a 54-year period.
Methods
This study was approved by the Mayo institutional review board. We searched the Mayo Clinic Rochester dermatology database for all patients with a diagnosis of GF from 1959 through 2013. All histopathology slides were reviewed by a board-certified dermatologist (A.G.B.) and dermatopathologist (A.G.B.) before inclusion in this study. Histologic criteria for diagnosis of GF included the presence of a mixed inflammatory infiltrate of neutrophils, eosinophils, lymphocytes, and histiocytes in the superficial or deep dermis; a prominent grenz zone separating the uninvolved epidermis; and the presence of vascular damage, as seen by fibrin deposition in dermal blood vessels.
Medical records were reviewed for patient demographics and for history pertinent to the diagnosis of GF, including sites involved, appearance, histopathology reports, symptoms, treatments, and outcomes.
Literature Search Strategy
A computerized Ovid MEDLINE database search was undertaken to identify English-language articles concerning GF in humans using the search terms granuloma faciale with extrafacial or disseminated. To ensure that no articles were overlooked, we conducted another search for English-language articles in the Embase database (1946-2013) using the terms granuloma faciale and extrafacial or disseminated.
Statistical Analysis
Descriptive clinical and histopathologic data were summarized using means, medians, and ranges or proportions as appropriate; statistical analysis was performed using SAS software (JMP package).
Results
Ninety-six patients with a diagnosis of GF were identified, and 12 (13%) had a diagnosis of extrafacial GF. Of them, 2 patients had a diagnosis of extrafacial GF supported only by histopathology slides without accompanying clinical records and therefore were excluded from the study. Thus, 10 cases of extrafacial GF were identified from our search and were included in the study group. Clinical data for these patients are summarized in Table 1. The mean age was 58.7 years (range, 26–87 years). Six (60%) patients were male, and all patients were white. Seven patients (70%) had facial GF in addition to extrafacial GF. Six patients reported no symptoms (60%), and 4 (40%) reported pruritus, discomfort, or both associated with their GF lesions.
Extrafacial GF was diagnosed in the following anatomic locations: scalp (n=3 [30%]), posterior auricular area (n=3 [30%]), mid upper back (n=1 [10%]), right shoulder (n=1 [10%]), both ears (n=1 [10%]), right elbow (n=1 [10%]), and left infra-auricular area (n=1 [10%]). Only 1 (10%) patient had multiple extrafacial sites identified.
The lesions were characterized clinically as violet, red, and yellow to brown smooth papules, plaques, and nodules (Figure 1). Biopsies from these lesions showed a subepidermal and adnexal grenz zone; a polymorphous perivascular and periadnexal dermal infiltrate composed of neutrophils, eosinophils, lymphocytes, histiocytes, and plasma cells; and a mild subtle leukocytoclastic vasculitis with subtle mild vascular necrosis (Figure 2).
For the 9 patients who elected to undergo GF treatment, the average number of treatments attempted was 2.8 (range, 1–5). The most common method of treatment was a combination of intralesional and topical corticosteroids (n=5 [50%]). Other methods included surgery (n=3 [30%]), dapsone (n=2 [20%]), radiation therapy (n=2 [20%]), cryosurgery (n=1 [10%]), nitrogen mustard (n=1 [10%]), liquid nitrogen (n=1 [10%]), and tar shampoo and fluocinolone acetonide solution 0.01% (n=1 [10%]).
Treatment outcomes were available for 8 of 9 treated patients. Three patients (patients 7, 8, and 10) had long-term successful resolution of their lesions. Patient 7 had an extrafacial lesion that was successfully treated with intralesional and topical corticosteroids, but the facial lesions recurred. The extrafacial GF lesion in patient 8 was found adjacent to a squamous cell carcinoma and was removed with a wide surgical excision that included both lesions. Patient 10 was successfully treated with a combination of liquid nitrogen and topical corticosteroid. Patients 2 and 4 were well controlled while on dapsone; however, once the treatment was discontinued, primarily due to adverse effects, the lesions returned.
Literature Search
Our search of the English-language literature identified 20 patients with extrafacial GF (Table 2). Fifteen (75%) patients were male, which was similar to our study (6/10 [60%]). Our patient population was slightly older with a mean age of 58.7 years compared to a median age of 54 years among those identified in the literature. Additionally, 3 (30%) patients in our study had no facial lesions, as seen in classic GF, which is comparable to 8 (40%) patients identified in the literature.
Comment
Extrafacial GF primarily affects white individuals and is more prevalent in men, as demonstrated in our study. Extrafacial GF was most often found in association with facial lesions, with only 3 patients having exclusively extrafacial sites.
Data from the current study indicate that diverse modalities were used to treat extrafacial GF with variable outcomes (chronic recurrence to complete resolution). The most common first-line treatment, intralesional corticosteroid injection, was used in 5 (50%) patients but resulted in only 1 (10%) successful resolution. Other methods frequently used in our study and prior studies were surgical excision, cryotherapy, electrosurgery, and dermabrasion.1,20 These treatments do not appear to be uniformly definitive, and the ablative methods may result in scarring.1 Different laser treatments are emerging for the management of GF lesions. Prior reports of treating facial GF with argon and CO2 lasers have indicated minimized residual scarring and pigmentation.21-23 The use of pulsed dye lasers has resulted in complete clearance of facial GF lesions, without recurrence on long-term follow-up.20,24-26
The latest investigations of immunomodulatory drugs indicate these agents are promising for the management of facial GF. Eetam et al27 reported the successful use of topical tacrolimus to treat facial GF. The relatively low cost and ease of use make these topical medications a competitive alternative to currently available surgical and laser methods. The appearance of all of these novel therapeutic modalities creates the necessity for a randomized trial to establish their efficacy on extrafacial GF lesions.
The wide array of treatments reflects the recalcitrant nature of extrafacial GF lesions. Further insight into the etiology of these lesions is needed to understand their tendency to recur. The important contribution of our study is the observed
Conclusion
The findings from this study and the cases reviewed in the literature provide a unique contribution to the understanding of the clinical and demographic characteristics of extrafacial GF. The rarity of this condition is the single most important constraint of our study, reflected in the emblematic limitations of a retrospective analysis in a select group of patients. The results of analysis of data from our patients were similar to the findings reported in the English-language medical literature. Serious consideration should be given to the development of a national registry for patients with GF. A database containing the clinicopathologic features, treatments, and outcomes for patients with both facial and extrafacial manifestations of GF may be invaluable in evaluating various treatment options and increasing understanding of the etiology and epidemiology of the disease.
- Radin DA, Mehregan DR. Granuloma faciale: distribution of the lesions and review of the literature. Cutis. 2003;72:213-219.
- Dowlati B, Firooz A, Dowlati Y. Granuloma faciale: successful treatment of nine cases with a combination of cryotherapy and intralesional corticosteroid injection. Int J Dermatol. 1997;36:548-551.
- Guill MA, Aton JK. Facial granuloma responsive to dapsone therapy. Arch Dermatol. 1982;118:332-335.
- Ryan TJ. Cutaneous vasculitis. In: Champion RH, Burton JL, Burns DA, et al, eds. Rook/Wilkins/Ebling Textbook of Dermatology. 7th ed. Malden, MA: Blackwell Science; 2004.
- Castano E, Segurado A, Iglesias L, et al. Granuloma faciale entirely in an extrafacial location. Br J Dermatol. 1997;136:978-979.
- Castellano-Howard L, Fairbee SI, Hogan DJ, et al. Extrafacial granuloma faciale: report of a case and response to treatment. Cutis. 2001;67:413-415.
- Cecchi R, Paoli S, Giomi A. Granuloma faciale with extrafacial lesions. Eur J Dermatol. 2002;12:438.
- Inanir I, Alvur Y. Granuloma faciale with extrafacial lesions. Br J Dermatol. 2001;14:360-362.
- Kavanagh GM, McLaren KM, Hunter JA. Extensive extrafacial granuloma faciale of the scalp. Br J Dermatol. 1996;134:595-596.
- Marcoval J, Moreno A, Peyr J. Granuloma faciale: a clinicopathological study of 11 cases. J Am Acad Dermatol. 2004;51:269-273.
- Okun MR, Bauman L, Minor D. Granuloma faciale with lesions on the face and hand. Arch Dermatol. 1965;92:78-80.
- Roustan G, Sanchez Yus E, Salas C, et al. Granuloma faciale with extrafacial lesions. Dermatology. 1999;198:79-82.
- Rusin LJ, Dubin HV, Taylor WB. Disseminated granuloma faciale. Arch Dermatol. 1976;112:1575-1577.
- Sears JK, Gitter DG, Stone MS. Extrafacial granuloma faciale. Arch Dermatol. 1991;127:742-743.
- Zargari O. Disseminated granuloma faciale. Int J Dermatol. 2004;43:210-212.
- Lever WF, Lane CG, Downing JG, et al. Eosinophilic granuloma of the skin: report of three cases. Arch Derm Syphilol. 1948;58:430-438.
- Pedace FJ, Perry HO. Granuloma faciale: a clinical and histopathologic review. Arch Dermatol. 1966;94:387-395.
- Frost FA, Heenan PJ. Facial granuloma. Australas J Dermatol. 1984;25:121-124.
Konohana A. Extrafacial granuloma faciale. J Dermatol. 1994;21:680-682.- Ludwig E, Allam JP, Bieber T, et al. New treatment modalities for granuloma faciale. Br J Dermatol. 2003;149:634-637.
- Apfelberg DB, Druker D, Maser MR, et al. Granuloma faciale: treatment with the argon laser. Arch Dermatol. 1983;119:573-576.
- Apfelberg DB, Maser MR, Lash H, et al. Expanded role of the argon laser in plastic surgery. J Dermatol Surg Oncol. 1983;9:145-151.
- Wheeland RG, Ashley JR, Smith DA, et al. Carbon dioxide laser treatment of granuloma faciale. J Dermatol Surg Oncol. 1984;10:730-733.
- Cheung ST, Lanigan SW. Granuloma faciale treated with the pulsed-dye laser: a case series. Clin Exp Dermatol. 2005;30:373-375.
- Chatrath V, Rohrer TE. Granuloma faciale successfully treated with long-pulsed tunable dye laser. Dermatol Surg. 2002;28:527-529.
- Elston DM. Treatment of granuloma faciale with the pulsed dye laser. Cutis. 2000;65:97-98.
- Eetam I, Ertekin B, Unal I, et al. Granuloma faciale: is it a new indication for pimecrolimus? a case report. J Dermatolog Treat. 2006;17:238-240.
- Johnson WC, Higdon RS, Helwig EB. Granuloma faciale. AMA Arch Derm. 1959;79:42-52.
Practice Points
- Extrafacial lesions are rare in granuloma faciale (GF).
- Extrafacial GF should be included in the differential diagnosis of well-demarcated plaques and nodules found on the trunk or extremities.
- Diagnosis of extrafacial GF is based on the presence of distinct histologic features identical to GF.
- Granuloma faciale is a chronic benign leukocytoclastic vasculitis that can be difficult to treat.
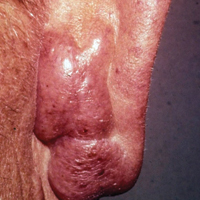
Acute respiratory tract infection: A practice examines its antibiotic prescribing habits
Purpose We wanted to better understand our practice behaviors by measuring antibiotic prescribing patterns for acute respiratory tract infections (ARTIs), which would perhaps help us delineate goals for quality improvement interventions. We determined (1) the distribution of ARTI final diagnoses in our practice, (2) the frequency and types of antibiotics prescribed, and (3) the factors associated with antibiotic prescribing for patients with ARTI.
Methods We looked at office visits for adults with ARTI symptoms that occurred between December 14, 2009, and March 4, 2010. We compiled a convenience sample of 438 patient visits, collecting historical information, physical examination findings, diagnostic impressions, and treatment decisions.
Results Among the 438 patients, cough was the most common presenting complaint (58%). Acute sinusitis was the most frequently assigned final diagnosis (32%), followed by viral upper respiratory tract infection (29%), and acute bronchitis (24%). Sixty-nine percent of all ARTI patients (304/438) received antibiotic prescriptions, with macrolides being most commonly prescribed (167/304 [55%]). Prescribing antibiotics was associated with a complaint of sinus pain or shortness of breath, duration of illness ≥8 days, and specific abnormal physical exam findings. Prescribing rates did not vary based on patient age or presence of risk factors associated with complication. Variations in prescribing rates were noted between individual providers and groups of providers.
Conclusions We found that we prescribed antibiotics at high rates. Diagnoses of acute sinusitis and bronchitis may have been overused as false justification for antibiotic therapy. We used broad-spectrum antibiotics frequently. We have identified several gaps between current and desired performance to address in practice-based quality improvement interventions.
Most acute respiratory tract infections (ARTIs) are caused by viruses, do not require antibiotics, and resolve spontaneously.1,2 And yet, unnecessary prescribing of antibiotics for ARTIs continues—accounting for approximately half of all such prescriptions2—despite its well-known contribution to antimicrobial resistance, a public health threat as declared by the Institute of Medicine, the Centers for Disease Control and Prevention (CDC), and the World Health Organization (WHO).3-5
Even though the CDC has widely disseminated clinical guidelines for ARTI6-10 and annually publicizes recommendations for ARTI management during “Get Smart About Antibiotics Week,”11 it appears that providers have difficulty implementing the guidelines.12-14 Granted, antibiotic prescription rates in general have declined somewhat, but the use of broad-spectrum antibiotics (macrolides and fluoroquinolones) and antibiotics for older Americans has increased.12
There are several plausible reasons for overprescribing. Patients have expectations for treatment based on prior experience or on a false assumption that their illness is bacterial in origin.14 Providers may be concerned that certain individuals are at risk of complications if not treated. Patient race, health maintenance organization membership, and insurance status have all been implicated as factors related to antimicrobial overutilization.12-16 It can be perceived as time consuming to educate patients about the likely viral nature of their illness and the lack of utility and increased risks in taking unneeded antibiotics.17 Furthermore, attempts at patient and physician education (eg, physician performance feedback) do not always reduce antibiotic overuse.18-20
We wanted to know the state of ARTI antibiotic use in our practice and whether we could identify goals for improvement through quality interventions. We sought to determine the distribution of ARTI final diagnoses in our practice, the frequency and types of antibiotics prescribed, and factors associated with antibiotic prescribing.
Methods
Setting and subjects
Subjects were adult patients seen at Mayo Clinic Family Medicine offices in Arizona between December 14, 2009, and March 4, 2010. We created a convenience sample from visits scheduled for patients with ARTI symptoms. We encouraged, but did not require, clinic staff to use a standardized data collection form to document symptoms, physical examination findings, diagnostic impressions, and prescription decisions that were then entered into an Excel spreadsheet. At one of our 2 sites, clinicians (attending physicians, nurse practitioners, and resident physicians) used the form at the point of care to enroll a portion of the sample population. A retrospective chart audit (with or without use of the form) was the means of selecting the remainder of the sample at this site and the entire sample at our second site. We obtained informed consent from all patients enrolled with the data collection form. The Mayo Foundation Institutional Review Board approved the project.
We defined an ARTI as a new illness occurring within the previous 3 weeks, associated with cough, sinus pain, nasal congestion or rhinorrhea, sore throat, or fever. We excluded patients who had a longer duration of symptoms, a previous evaluation, or a noninfectious diagnosis. We included ARTI patients with concomitant asthma or chronic obstructive pulmonary disease (COPD).
We enrolled 438 patients. Two hundred thirty-one (53%) consented prospectively to data collection with our standardized form; 207 (47%) were reviewed by retrospective chart audit. The mean age of subjects was 54 years (range 18-94, intraquartile range 45-69). Cough was the most frequent chief complaint (58%).
Statistical analysis
We calculated the frequency of each ARTI final diagnosis and its associated antibiotic prescription rate. We also tested for associations between clinical features and the provision of antibiotics. We hypothesized that our providers would be more likely to prescribe antibiotics for patients of advanced age and in the presence of other risk factors for complications.
Results
We determined patient risks for ARTI complication in the prospective data collection group only. Of the 231 patients, 147 (64%) had at least one risk for complication, the most common being age ≥65 (37%). Other risks were employment as a health care worker (12%), asthma (11%), atherosclerotic heart disease (8%), COPD (7%), and tobacco use (5%).
Final diagnoses for all patients appear in TABLE 1. We allowed clinicians to report more than one diagnosis, resulting in 501 final diagnoses reported for 438 patients (63 received 2 final diagnoses). Sinusitis was diagnosed most frequently (32%). Other common diagnoses were viral upper respiratory infection (URI) and acute bronchitis (29% and 24%, respectively).
Antibiotics most often prescribed. Three hundred four ARTI patients (69%) received antibiotic prescriptions. Macrolides were most commonly prescribed (167/304 [55%]). Two hundred eight ARTI patients (68%) received broad-spectrum antibiotics (macrolides or fluoroquinolones); 96 (32%) received narrow-spectrum agents (penicillin, cephalosporin, sulfa, or tetracycline derivatives). TABLE 2 lists the frequency of antibiotic prescription and the antibiotic class most frequently prescribed for each ARTI diagnosis.
Factors associated with increased prescribing included specific history and physical exam findings (TABLE 3). A major determinant of treatment was duration of illness. Those who received antibiotics had a mean duration of illness of 8.3 days, compared with 7.0 days for those not receiving antibiotic therapy (P = .03).
The rate of antibiotic prescribing varied by provider type (TABLE 4). Four resident physicians (all of whom were investigators) prescribed least often, followed by attending physicians, then nurse practitioners. Investigators were significantly less likely to prescribe antimicrobials than noninvestigators (P<.001). We assessed whether use of our standardized data collection form affected prescribing rates. When we excluded patients whose data were entered with this form, no difference in rates was seen.
We also noted wide ranges of prescribing rates between individual providers. While all providers enrolled patients, numbers ranged from one to 51, with a mean of 18. For those who enrolled ≥10 subjects, prescribing rates ranged from a low of 29% (8/28) for a resident physician investigator to 93% (63/68) for 4 noninvestigator attending physicians.
Factors not associated with increased prescribing. We had hypothesized that specific patient characteristics (age and medical complication) would be associated with provision of antimicrobials. However, there was no correlation between patient age and rate of prescribing. The 304 patients who received an antibiotic had a mean age of 54 years (standard deviation [SD]=18), as did the 134 who did not receive one (mean age, 54; SD=20; P=.95). There was a nonsignificant trend for a reduced rate of prescribing for patients younger than age 30. For patients 18 to 29 years old, the rate was 60% (31/52); for those ≥30 years, it was 71% (273/386; odds ratio [OR]=1.64; 95% confidence interval, 0.90-2.97).
Similarly, presence of medical complication did not significantly affect antibiotic prescribing rates. Patients with any risk factor for complication (age >65, diabetes, atherosclerotic heart disease, heart failure, COPD, asthma, tobacco smoking, or active cancer treatment) had a 62% prescription rate (91/147), which was the same as that of patients without such risks (52/84 [62%]; P=1.0).
TABLE 1
Final diagnoses for 438 patients with ARTI
| Diagnosis | n (%)* |
|---|---|
| Acute sinusitis | 141 (32) |
| Viral URI | 125 (29) |
| Acute bronchitis | 104 (24) |
| Asthma | 31 (7) |
| Acute nonstrep pharyngitis | 28 (6) |
| Pneumonia | 17 (4) |
| COPD | 14 (3) |
| Influenza-like illness | 14 (3) |
| Acute otitis media | 14 (3) |
| Strep pharyngitis | 13 (3) |
| ARTI, acute respiratory tract infection; COPD, chronic obstructive pulmonary disease; URI, upper respiratory infection. *Percent total >100% due to 63 patients receiving 2 diagnoses and rounding | |
TABLE 2
Antibiotic use and type prescribed for ARTI varied by diagnosis
| Diagnosis (total) | Antibiotics prescribed* | No antibiotics prescribed | Antibiotic class most frequently prescribed |
|---|---|---|---|
| Acute sinusitis (141) | 139 (99%) | 2 (1%) | Macrolide (53%) |
| Viral URI (125) | 45 (36%) | 80 (64%) | Macrolide (24%) |
| Acute bronchitis (104) | 95 (91%) | 9 (9%) | Macrolide (56%) |
| Acute nonstrep pharyngitis (28) | 16 (57%) | 12 (43%) | Macrolide (36%) |
| Pneumonia (17) | 17 (100%) | 0 | Fluoroquinolone (53%) |
| ARTI, acute respiratory tract infection; URI, upper respiratory infection. *Although 304 patients received prescriptions, some patients received more than one antibiotic. | |||
TABLE 3
Historical features, exam findings associated with antibiotic prescribing
| Historical feature | P value |
|---|---|
| Sinus pain | .0002 |
| Duration of illness >8 days | .0110 |
| Shortness of breath | .0427 |
| Physical exam finding | |
| Abnormal sinus exam | <.0001 |
| Abnormal lung exam | .0005 |
| Abnormal tympanic membrane | .0017 |
| Abnormal pharynx | .0026 |
| Cervical lymphadenopathy | .0141 |
| Abnormal nasal exam | .0363 |
TABLE 4
Antibiotic prescription rates for ARTI varied by provider type, investigator status
| Antibiotic prescription rate | |||
|---|---|---|---|
| Attending physicians | Nurse practitioners | Residents | P value |
| 153/225 (68%) | 97/115 (84%) | 54/98 (55%) | <.001* |
| Investigator | Noninvestigator | P value | |
| 110/192 (57%) | 194/246 (79%) | <.001 | |
| ARTI, acute respiratory tract infection. *The rate for residents is significantly lower than that for attending physicians and nurse practitioners. The rate for attending physicians is significantly lower than that for nurse practitioners. The P value applies to both rate comparisons among provider types. | |||
Discussion
Providers in our practice had surprisingly high rates of antibiotic prescribing for ARTIs (69% overall). By comparison, the overall antibiotic use rate for ARTIs in the most recent National Ambulatory Medical Care Survey (NAMCS) analysis (1995-2006) was 58%.12 The prescribing rate for office settings alone was just 52%. Steinman’s analysis of NAMCS data from 1997-1999 revealed an overall rate of 63%.13
Data analyzed from >4200 Medicare enrollees seen for ARTI visits revealed great variation in prescribing rates by office site: 21% to 88%, with a median rate of 54%.20 The rate varied by final diagnoses: sinusitis, 69%; bronchitis, 59%; pharyngitis, 50%; and URI, 26%. A rate of 77% was recently reported in a Veterans Administration office setting.21 Those with sinusitis and bronchitis similarly received more prescriptions than those with acute pharyngitis and URI.
In addition to our high overall rate, we also diagnosed patients with sinusitis and bronchitis frequently (32% and 24% of all patients, respectively), perhaps as false justification for prescribing antibiotics (provided for 99% and 91%, respectively). Also noteworthy is that more than one-third of URI patients in our practice received antibiotics.
We had expected, but did not see, differences in prescribing rates between older and younger patients, as well as those with and without risk factors for complications. Our expectations were based on NAMCS data, which have demonstrated increasing use of antibiotics in older patients.2
Treatment for those with bronchitis was surprisingly frequent; 91% received antibiotics. A Cochrane systematic review attributes slight symptom benefit to antibiotic use (improvement in cough by about one day).22 This benefit, however, is rarely seen in patients who have been ill for <1 week. The magnitude of this benefit must be weighed against the cost and adverse effects of antibiotics and the potential for promoting antimicrobial resistance. Most patients’ symptoms are mild and self-limited, and risks may exceed benefits.
Guidelines state, “The widespread use of antibiotics for the treatment of acute bronchitis is not justified and vigorous efforts to curtail their use should be encouraged.”23 The CDC agrees, noting that “routine antibiotic treatment of uncomplicated acute bronchitis is not recommended, regardless of duration of cough.”10
As observed in another study,14 a clinical factor associated with prescribing decisions at our practice was the duration of illness. Patients in our practice had been ill, on average, 8 days before presenting to the office. Over time, our encounters with regular patients may have taught them to wait until their symptoms are prolonged or progressive before seeking evaluation.
We saw large differences in prescribing rates between providers, and hope this means there is room for improvement by addressing reasons for variability. Education about individual prescribing behaviors may motivate those with the highest rates of use to improve.
We noted high rates of broad-spectrum antibiotic use. This is consistent with other research findings of a shift away from narrow-spectrum agents.12 We did not determine the frequency of allergies to narrow-spectrum agents. Anecdotally, the opinion of some patients was that narrow-spectrum medicines “just don’t work,” given their experience of persistent cold symptoms when using such agents.
Quality-improvement processes such as DMAIC (Define, Measure, Analyze, Improve, Control) or PDSA (Plan, Do, Study, Act) require collection of baseline data so that interventions can be tailored to meet the root causes identified.24 This project determined preintervention practice behaviors and allowed us to create quality metrics that could define our future success.
Study limitations. One obvious reason for the prescribing variability noted above is that those who helped plan and implement the project knew their practice behaviors were being reviewed and had studied the relevant practice guidelines. Whether non-investigator providers were up to date with recommendations and could carefully select appropriate treatment candidates is unclear.
This study was of our practice alone, and findings may not be generalizable to other practices. We encourage physicians to similarly examine their own prescribing habits in order to set practice-improvement goals.
CORRESPONDENCE Michael L. Grover, DO, Department of Family Medicine, Mayo Clinic, 13737 N 92nd Street, Scottsdale, AZ 85260; grover.michael@mayo.edu
1. Fendrick AM, Monto AS, Nightengale B, et al. The economic burden of non-influenza related viral respiratory tract infection in the United States. Arch Intern Med. 2003;163:487-494.
2. Werner K, Deasy J. Acute respiratory tract infections: when are antibiotics indicated? JAAPA. 2009;22:22–26.
3. US Department of Health and Human Services. Preventing emerging infectious diseases: a strategy for the 21st century. MMWR Morb Mortal Wkly Rep. 1998;47(RR-15). Available at: http://www.cdc.gov/MMWR/pdf/rr/rr4715.pdf. Accessed July 16, 2011.
4. Drug resistance threatens to reverse medical progress [press release]. Geneva, Switzerland: World Health Organization (WHO); June 12, 2000. Available at: http://www.who.int/inf-pr-2000/en/pr2000-41.html. Accessed July 16, 2011.
5. Smolinski MS, Hamburg MA, Lederberg J. eds. Institute of Medicine, Committee on Emerging Microbial Threats to Health in the 21st Century. Microbial Threats to Health: Emergence, Detection, and Response. Washington, DC: National Academies Press; 2003. Available at: http://www.iom.edu/CMS/3783/3919/5381/6146.aspx. Accessed July 16, 2011.
6. Gonzales R, Bartlett JG, Besser RE, et al. Principles of appropriate antibiotic use for treatment of acute respiratory tract infections in adults: background, specific aims, and methods. Ann Intern Med. 2001;134:479-486.
7. Gonzales R, Bartlett JG, Besser RE, et al. Principles of appropriate antibiotic use for treatment of nonspecific upper respiratory tract infections in adults: background. Ann Intern Med. 2001;134:490-494.
8. Hickner JM, Bartlett JG, Besser RE, et al. Principles of appropriate antibiotic use for acute rhinosinusitis in adults: background. Ann Intern Med. 2001;134:498-505.
9. Cooper RJ, Hoffman JR, Bartlett JG, et al. Principles of appropriate antibiotic use for acute pharyngitis in adults: background. Ann Intern Med. 2001;134:509-517.
10. Gonzales R, Bartlett JG, Bessnar RE, et al. Principles of appropriate antibiotic use for treatment of uncomplicated acute bronchitis: background. Ann Intern Med. 2001;134:521-529.
11. CDC. Get smart: know when antibiotics work. Adult appropriate antibiotic use summary: physician information sheets (adult). Available at: http://www.cdc.gov/getsmart/campaign-materials/adult-treatment.html. Accessed July 16, 2011.
12. Grijalva CG, Nuorti JP, Griffin M. Antibiotic prescription rates for acute respiratory tract infections in US ambulatory settings. JAMA. 2009;302:758-766.
13. Steinman MA, Landefeld CS, Gonzales R. Predictors of broad spectrum antibiotic prescribing for acute respiratory tract infections in adult primary care. JAMA. 2003;289:719-725.
14. Wigton RS, Darr CA, Corbett KK, et al. How do community practitioners decide whether to prescribe antibiotics for acute respiratory tract infections? J Gen Intern Med. 2008;23:1615-1620.
15. Macfarlane J, Holmes W, Macfarlane R, et al. Influence of patients’ expectations on antibiotic management of acute lower respiratory tract illness in general practice: questionnaire study. BMJ. 1997;315:1211-1214.
16. Colgan R, Powers JH. Appropriate antimicrobial prescribing: approaches that limit antibiotic resistance. Am Fam Physician. 2001;64:999-1004.
17. Coco A, Mainous AG. Relation of time spent in an encounter with the use of antibiotics in pediatric office visits for viral respiratory infections. Arch Pediatr Adolesc Med. 2005;159:1145-1149.
18. Arnold SR, Straus SE. Interventions to improve antibiotic prescribing practices in ambulatory care. Cochrane Database Syst Rev 2005;(4):CD003539-
19. Mainous AG, Hueston WJ, Love MM, et al. An evaluation of statewide strategies to reduce antibiotic overuse. Fam Med. 2000;32:22-29.
20. Gonzales R, Sauaia A, Corbett KK, et al. Antibiotic treatment of acute respiratory tract infections in the elderly: effect of a multidimensional educational intervention. J Am Geriatr Soc. 2004;52:39-45.
21. Franck A, Smith R. Antibiotic use for acute respiratory tract infections in a veteran population. J Am Pharm Assoc. 2010;50:726-729.
22. Smucny J, Fahey T, Becker L, et al. Antibiotics for acute bronchitis. Cochrane Database Syst Rev. 2004;(4):CD000245-
23. Bramen SS. Chronic cough due to acute bronchitis: ACCP evidence-based clinical practice guidelines. Chest. 2006;129 (1 suppl):95S-103S.
24. Snee RD. Use DMAIC to make improvement part of “the way we work.” Quality Progress Web site. September 2007. Available at: http://asq.org/quality-progress/2007/09/process-managementment/use-dmaic-to-make-improvement-part-of-the-way-we-work.html. Accessed July 16, 2011.
Purpose We wanted to better understand our practice behaviors by measuring antibiotic prescribing patterns for acute respiratory tract infections (ARTIs), which would perhaps help us delineate goals for quality improvement interventions. We determined (1) the distribution of ARTI final diagnoses in our practice, (2) the frequency and types of antibiotics prescribed, and (3) the factors associated with antibiotic prescribing for patients with ARTI.
Methods We looked at office visits for adults with ARTI symptoms that occurred between December 14, 2009, and March 4, 2010. We compiled a convenience sample of 438 patient visits, collecting historical information, physical examination findings, diagnostic impressions, and treatment decisions.
Results Among the 438 patients, cough was the most common presenting complaint (58%). Acute sinusitis was the most frequently assigned final diagnosis (32%), followed by viral upper respiratory tract infection (29%), and acute bronchitis (24%). Sixty-nine percent of all ARTI patients (304/438) received antibiotic prescriptions, with macrolides being most commonly prescribed (167/304 [55%]). Prescribing antibiotics was associated with a complaint of sinus pain or shortness of breath, duration of illness ≥8 days, and specific abnormal physical exam findings. Prescribing rates did not vary based on patient age or presence of risk factors associated with complication. Variations in prescribing rates were noted between individual providers and groups of providers.
Conclusions We found that we prescribed antibiotics at high rates. Diagnoses of acute sinusitis and bronchitis may have been overused as false justification for antibiotic therapy. We used broad-spectrum antibiotics frequently. We have identified several gaps between current and desired performance to address in practice-based quality improvement interventions.
Most acute respiratory tract infections (ARTIs) are caused by viruses, do not require antibiotics, and resolve spontaneously.1,2 And yet, unnecessary prescribing of antibiotics for ARTIs continues—accounting for approximately half of all such prescriptions2—despite its well-known contribution to antimicrobial resistance, a public health threat as declared by the Institute of Medicine, the Centers for Disease Control and Prevention (CDC), and the World Health Organization (WHO).3-5
Even though the CDC has widely disseminated clinical guidelines for ARTI6-10 and annually publicizes recommendations for ARTI management during “Get Smart About Antibiotics Week,”11 it appears that providers have difficulty implementing the guidelines.12-14 Granted, antibiotic prescription rates in general have declined somewhat, but the use of broad-spectrum antibiotics (macrolides and fluoroquinolones) and antibiotics for older Americans has increased.12
There are several plausible reasons for overprescribing. Patients have expectations for treatment based on prior experience or on a false assumption that their illness is bacterial in origin.14 Providers may be concerned that certain individuals are at risk of complications if not treated. Patient race, health maintenance organization membership, and insurance status have all been implicated as factors related to antimicrobial overutilization.12-16 It can be perceived as time consuming to educate patients about the likely viral nature of their illness and the lack of utility and increased risks in taking unneeded antibiotics.17 Furthermore, attempts at patient and physician education (eg, physician performance feedback) do not always reduce antibiotic overuse.18-20
We wanted to know the state of ARTI antibiotic use in our practice and whether we could identify goals for improvement through quality interventions. We sought to determine the distribution of ARTI final diagnoses in our practice, the frequency and types of antibiotics prescribed, and factors associated with antibiotic prescribing.
Methods
Setting and subjects
Subjects were adult patients seen at Mayo Clinic Family Medicine offices in Arizona between December 14, 2009, and March 4, 2010. We created a convenience sample from visits scheduled for patients with ARTI symptoms. We encouraged, but did not require, clinic staff to use a standardized data collection form to document symptoms, physical examination findings, diagnostic impressions, and prescription decisions that were then entered into an Excel spreadsheet. At one of our 2 sites, clinicians (attending physicians, nurse practitioners, and resident physicians) used the form at the point of care to enroll a portion of the sample population. A retrospective chart audit (with or without use of the form) was the means of selecting the remainder of the sample at this site and the entire sample at our second site. We obtained informed consent from all patients enrolled with the data collection form. The Mayo Foundation Institutional Review Board approved the project.
We defined an ARTI as a new illness occurring within the previous 3 weeks, associated with cough, sinus pain, nasal congestion or rhinorrhea, sore throat, or fever. We excluded patients who had a longer duration of symptoms, a previous evaluation, or a noninfectious diagnosis. We included ARTI patients with concomitant asthma or chronic obstructive pulmonary disease (COPD).
We enrolled 438 patients. Two hundred thirty-one (53%) consented prospectively to data collection with our standardized form; 207 (47%) were reviewed by retrospective chart audit. The mean age of subjects was 54 years (range 18-94, intraquartile range 45-69). Cough was the most frequent chief complaint (58%).
Statistical analysis
We calculated the frequency of each ARTI final diagnosis and its associated antibiotic prescription rate. We also tested for associations between clinical features and the provision of antibiotics. We hypothesized that our providers would be more likely to prescribe antibiotics for patients of advanced age and in the presence of other risk factors for complications.
Results
We determined patient risks for ARTI complication in the prospective data collection group only. Of the 231 patients, 147 (64%) had at least one risk for complication, the most common being age ≥65 (37%). Other risks were employment as a health care worker (12%), asthma (11%), atherosclerotic heart disease (8%), COPD (7%), and tobacco use (5%).
Final diagnoses for all patients appear in TABLE 1. We allowed clinicians to report more than one diagnosis, resulting in 501 final diagnoses reported for 438 patients (63 received 2 final diagnoses). Sinusitis was diagnosed most frequently (32%). Other common diagnoses were viral upper respiratory infection (URI) and acute bronchitis (29% and 24%, respectively).
Antibiotics most often prescribed. Three hundred four ARTI patients (69%) received antibiotic prescriptions. Macrolides were most commonly prescribed (167/304 [55%]). Two hundred eight ARTI patients (68%) received broad-spectrum antibiotics (macrolides or fluoroquinolones); 96 (32%) received narrow-spectrum agents (penicillin, cephalosporin, sulfa, or tetracycline derivatives). TABLE 2 lists the frequency of antibiotic prescription and the antibiotic class most frequently prescribed for each ARTI diagnosis.
Factors associated with increased prescribing included specific history and physical exam findings (TABLE 3). A major determinant of treatment was duration of illness. Those who received antibiotics had a mean duration of illness of 8.3 days, compared with 7.0 days for those not receiving antibiotic therapy (P = .03).
The rate of antibiotic prescribing varied by provider type (TABLE 4). Four resident physicians (all of whom were investigators) prescribed least often, followed by attending physicians, then nurse practitioners. Investigators were significantly less likely to prescribe antimicrobials than noninvestigators (P<.001). We assessed whether use of our standardized data collection form affected prescribing rates. When we excluded patients whose data were entered with this form, no difference in rates was seen.
We also noted wide ranges of prescribing rates between individual providers. While all providers enrolled patients, numbers ranged from one to 51, with a mean of 18. For those who enrolled ≥10 subjects, prescribing rates ranged from a low of 29% (8/28) for a resident physician investigator to 93% (63/68) for 4 noninvestigator attending physicians.
Factors not associated with increased prescribing. We had hypothesized that specific patient characteristics (age and medical complication) would be associated with provision of antimicrobials. However, there was no correlation between patient age and rate of prescribing. The 304 patients who received an antibiotic had a mean age of 54 years (standard deviation [SD]=18), as did the 134 who did not receive one (mean age, 54; SD=20; P=.95). There was a nonsignificant trend for a reduced rate of prescribing for patients younger than age 30. For patients 18 to 29 years old, the rate was 60% (31/52); for those ≥30 years, it was 71% (273/386; odds ratio [OR]=1.64; 95% confidence interval, 0.90-2.97).
Similarly, presence of medical complication did not significantly affect antibiotic prescribing rates. Patients with any risk factor for complication (age >65, diabetes, atherosclerotic heart disease, heart failure, COPD, asthma, tobacco smoking, or active cancer treatment) had a 62% prescription rate (91/147), which was the same as that of patients without such risks (52/84 [62%]; P=1.0).
TABLE 1
Final diagnoses for 438 patients with ARTI
| Diagnosis | n (%)* |
|---|---|
| Acute sinusitis | 141 (32) |
| Viral URI | 125 (29) |
| Acute bronchitis | 104 (24) |
| Asthma | 31 (7) |
| Acute nonstrep pharyngitis | 28 (6) |
| Pneumonia | 17 (4) |
| COPD | 14 (3) |
| Influenza-like illness | 14 (3) |
| Acute otitis media | 14 (3) |
| Strep pharyngitis | 13 (3) |
| ARTI, acute respiratory tract infection; COPD, chronic obstructive pulmonary disease; URI, upper respiratory infection. *Percent total >100% due to 63 patients receiving 2 diagnoses and rounding | |
TABLE 2
Antibiotic use and type prescribed for ARTI varied by diagnosis
| Diagnosis (total) | Antibiotics prescribed* | No antibiotics prescribed | Antibiotic class most frequently prescribed |
|---|---|---|---|
| Acute sinusitis (141) | 139 (99%) | 2 (1%) | Macrolide (53%) |
| Viral URI (125) | 45 (36%) | 80 (64%) | Macrolide (24%) |
| Acute bronchitis (104) | 95 (91%) | 9 (9%) | Macrolide (56%) |
| Acute nonstrep pharyngitis (28) | 16 (57%) | 12 (43%) | Macrolide (36%) |
| Pneumonia (17) | 17 (100%) | 0 | Fluoroquinolone (53%) |
| ARTI, acute respiratory tract infection; URI, upper respiratory infection. *Although 304 patients received prescriptions, some patients received more than one antibiotic. | |||
TABLE 3
Historical features, exam findings associated with antibiotic prescribing
| Historical feature | P value |
|---|---|
| Sinus pain | .0002 |
| Duration of illness >8 days | .0110 |
| Shortness of breath | .0427 |
| Physical exam finding | |
| Abnormal sinus exam | <.0001 |
| Abnormal lung exam | .0005 |
| Abnormal tympanic membrane | .0017 |
| Abnormal pharynx | .0026 |
| Cervical lymphadenopathy | .0141 |
| Abnormal nasal exam | .0363 |
TABLE 4
Antibiotic prescription rates for ARTI varied by provider type, investigator status
| Antibiotic prescription rate | |||
|---|---|---|---|
| Attending physicians | Nurse practitioners | Residents | P value |
| 153/225 (68%) | 97/115 (84%) | 54/98 (55%) | <.001* |
| Investigator | Noninvestigator | P value | |
| 110/192 (57%) | 194/246 (79%) | <.001 | |
| ARTI, acute respiratory tract infection. *The rate for residents is significantly lower than that for attending physicians and nurse practitioners. The rate for attending physicians is significantly lower than that for nurse practitioners. The P value applies to both rate comparisons among provider types. | |||
Discussion
Providers in our practice had surprisingly high rates of antibiotic prescribing for ARTIs (69% overall). By comparison, the overall antibiotic use rate for ARTIs in the most recent National Ambulatory Medical Care Survey (NAMCS) analysis (1995-2006) was 58%.12 The prescribing rate for office settings alone was just 52%. Steinman’s analysis of NAMCS data from 1997-1999 revealed an overall rate of 63%.13
Data analyzed from >4200 Medicare enrollees seen for ARTI visits revealed great variation in prescribing rates by office site: 21% to 88%, with a median rate of 54%.20 The rate varied by final diagnoses: sinusitis, 69%; bronchitis, 59%; pharyngitis, 50%; and URI, 26%. A rate of 77% was recently reported in a Veterans Administration office setting.21 Those with sinusitis and bronchitis similarly received more prescriptions than those with acute pharyngitis and URI.
In addition to our high overall rate, we also diagnosed patients with sinusitis and bronchitis frequently (32% and 24% of all patients, respectively), perhaps as false justification for prescribing antibiotics (provided for 99% and 91%, respectively). Also noteworthy is that more than one-third of URI patients in our practice received antibiotics.
We had expected, but did not see, differences in prescribing rates between older and younger patients, as well as those with and without risk factors for complications. Our expectations were based on NAMCS data, which have demonstrated increasing use of antibiotics in older patients.2
Treatment for those with bronchitis was surprisingly frequent; 91% received antibiotics. A Cochrane systematic review attributes slight symptom benefit to antibiotic use (improvement in cough by about one day).22 This benefit, however, is rarely seen in patients who have been ill for <1 week. The magnitude of this benefit must be weighed against the cost and adverse effects of antibiotics and the potential for promoting antimicrobial resistance. Most patients’ symptoms are mild and self-limited, and risks may exceed benefits.
Guidelines state, “The widespread use of antibiotics for the treatment of acute bronchitis is not justified and vigorous efforts to curtail their use should be encouraged.”23 The CDC agrees, noting that “routine antibiotic treatment of uncomplicated acute bronchitis is not recommended, regardless of duration of cough.”10
As observed in another study,14 a clinical factor associated with prescribing decisions at our practice was the duration of illness. Patients in our practice had been ill, on average, 8 days before presenting to the office. Over time, our encounters with regular patients may have taught them to wait until their symptoms are prolonged or progressive before seeking evaluation.
We saw large differences in prescribing rates between providers, and hope this means there is room for improvement by addressing reasons for variability. Education about individual prescribing behaviors may motivate those with the highest rates of use to improve.
We noted high rates of broad-spectrum antibiotic use. This is consistent with other research findings of a shift away from narrow-spectrum agents.12 We did not determine the frequency of allergies to narrow-spectrum agents. Anecdotally, the opinion of some patients was that narrow-spectrum medicines “just don’t work,” given their experience of persistent cold symptoms when using such agents.
Quality-improvement processes such as DMAIC (Define, Measure, Analyze, Improve, Control) or PDSA (Plan, Do, Study, Act) require collection of baseline data so that interventions can be tailored to meet the root causes identified.24 This project determined preintervention practice behaviors and allowed us to create quality metrics that could define our future success.
Study limitations. One obvious reason for the prescribing variability noted above is that those who helped plan and implement the project knew their practice behaviors were being reviewed and had studied the relevant practice guidelines. Whether non-investigator providers were up to date with recommendations and could carefully select appropriate treatment candidates is unclear.
This study was of our practice alone, and findings may not be generalizable to other practices. We encourage physicians to similarly examine their own prescribing habits in order to set practice-improvement goals.
CORRESPONDENCE Michael L. Grover, DO, Department of Family Medicine, Mayo Clinic, 13737 N 92nd Street, Scottsdale, AZ 85260; grover.michael@mayo.edu
1. Fendrick AM, Monto AS, Nightengale B, et al. The economic burden of non-influenza related viral respiratory tract infection in the United States. Arch Intern Med. 2003;163:487-494.
2. Werner K, Deasy J. Acute respiratory tract infections: when are antibiotics indicated? JAAPA. 2009;22:22–26.
3. US Department of Health and Human Services. Preventing emerging infectious diseases: a strategy for the 21st century. MMWR Morb Mortal Wkly Rep. 1998;47(RR-15). Available at: http://www.cdc.gov/MMWR/pdf/rr/rr4715.pdf. Accessed July 16, 2011.
4. Drug resistance threatens to reverse medical progress [press release]. Geneva, Switzerland: World Health Organization (WHO); June 12, 2000. Available at: http://www.who.int/inf-pr-2000/en/pr2000-41.html. Accessed July 16, 2011.
5. Smolinski MS, Hamburg MA, Lederberg J. eds. Institute of Medicine, Committee on Emerging Microbial Threats to Health in the 21st Century. Microbial Threats to Health: Emergence, Detection, and Response. Washington, DC: National Academies Press; 2003. Available at: http://www.iom.edu/CMS/3783/3919/5381/6146.aspx. Accessed July 16, 2011.
6. Gonzales R, Bartlett JG, Besser RE, et al. Principles of appropriate antibiotic use for treatment of acute respiratory tract infections in adults: background, specific aims, and methods. Ann Intern Med. 2001;134:479-486.
7. Gonzales R, Bartlett JG, Besser RE, et al. Principles of appropriate antibiotic use for treatment of nonspecific upper respiratory tract infections in adults: background. Ann Intern Med. 2001;134:490-494.
8. Hickner JM, Bartlett JG, Besser RE, et al. Principles of appropriate antibiotic use for acute rhinosinusitis in adults: background. Ann Intern Med. 2001;134:498-505.
9. Cooper RJ, Hoffman JR, Bartlett JG, et al. Principles of appropriate antibiotic use for acute pharyngitis in adults: background. Ann Intern Med. 2001;134:509-517.
10. Gonzales R, Bartlett JG, Bessnar RE, et al. Principles of appropriate antibiotic use for treatment of uncomplicated acute bronchitis: background. Ann Intern Med. 2001;134:521-529.
11. CDC. Get smart: know when antibiotics work. Adult appropriate antibiotic use summary: physician information sheets (adult). Available at: http://www.cdc.gov/getsmart/campaign-materials/adult-treatment.html. Accessed July 16, 2011.
12. Grijalva CG, Nuorti JP, Griffin M. Antibiotic prescription rates for acute respiratory tract infections in US ambulatory settings. JAMA. 2009;302:758-766.
13. Steinman MA, Landefeld CS, Gonzales R. Predictors of broad spectrum antibiotic prescribing for acute respiratory tract infections in adult primary care. JAMA. 2003;289:719-725.
14. Wigton RS, Darr CA, Corbett KK, et al. How do community practitioners decide whether to prescribe antibiotics for acute respiratory tract infections? J Gen Intern Med. 2008;23:1615-1620.
15. Macfarlane J, Holmes W, Macfarlane R, et al. Influence of patients’ expectations on antibiotic management of acute lower respiratory tract illness in general practice: questionnaire study. BMJ. 1997;315:1211-1214.
16. Colgan R, Powers JH. Appropriate antimicrobial prescribing: approaches that limit antibiotic resistance. Am Fam Physician. 2001;64:999-1004.
17. Coco A, Mainous AG. Relation of time spent in an encounter with the use of antibiotics in pediatric office visits for viral respiratory infections. Arch Pediatr Adolesc Med. 2005;159:1145-1149.
18. Arnold SR, Straus SE. Interventions to improve antibiotic prescribing practices in ambulatory care. Cochrane Database Syst Rev 2005;(4):CD003539-
19. Mainous AG, Hueston WJ, Love MM, et al. An evaluation of statewide strategies to reduce antibiotic overuse. Fam Med. 2000;32:22-29.
20. Gonzales R, Sauaia A, Corbett KK, et al. Antibiotic treatment of acute respiratory tract infections in the elderly: effect of a multidimensional educational intervention. J Am Geriatr Soc. 2004;52:39-45.
21. Franck A, Smith R. Antibiotic use for acute respiratory tract infections in a veteran population. J Am Pharm Assoc. 2010;50:726-729.
22. Smucny J, Fahey T, Becker L, et al. Antibiotics for acute bronchitis. Cochrane Database Syst Rev. 2004;(4):CD000245-
23. Bramen SS. Chronic cough due to acute bronchitis: ACCP evidence-based clinical practice guidelines. Chest. 2006;129 (1 suppl):95S-103S.
24. Snee RD. Use DMAIC to make improvement part of “the way we work.” Quality Progress Web site. September 2007. Available at: http://asq.org/quality-progress/2007/09/process-managementment/use-dmaic-to-make-improvement-part-of-the-way-we-work.html. Accessed July 16, 2011.