User login
Promoting Mobility and Reducing LOS
Annually, more than 35 million patients are hospitalized in the United States, with many experiencing hospital‐acquired impairments in physical functioning during their in‐patient stay.[1, 2, 3, 4] Such impairments include difficulties performing basic activities of daily living, such as rising from a chair, toileting, or ambulating. This functional decline may result in increased length of stay (LOS), nursing home placement, and decreased mobility and participation in community activities even years after hospitalization.[1, 2, 3, 5, 6, 7] Ameliorating this hospital‐acquired functional impairment is important to improving patient outcomes and reducing healthcare utilization. Even the sickest hospitalized patients (eg, those in the intensive care unit [ICU]), can safely and feasibly benefit from early mobilization.[6, 8, 9, 10, 11] In the non‐ICU setting there is also evidence that patient mobilization reduces LOS and hospital costs, while improving patient satisfaction and physical and psychological outcomes.[12, 13, 14, 15, 16] These studies are, however, difficult to replicate as part of routine clinical care, because they often do not present the details of how early mobility was incorporated into daily practice, require additional hospital resources (eg, specially trained providers or additional staff), or are focused only on a select patient population.
The Johns Hopkins medical ICU started early rehabilitation quality‐improvement (QI) work in 2007, which has demonstrated ongoing reductions in LOS and been transformative in terms of helping to foster a culture of mobility at our institution. Previous research suggests that ICU‐based rehabilitation interventions are often not carried over to the ward setting, even in post‐ICU patients.[17] Moreover, trends for sicker patients being admitted in our general medicine units,[18] growing reports of patients spending most of their time in bed,[2, 19, 20] and healthcare policies emphasizing the importance of improving inpatient outcomes motivated the need for QI to improve patient mobility in this setting. Experience from the medical ICU‐based early rehabilitation program helped drive multidisciplinary collaboration of stakeholders to develop this nurse‐driven, mobility promotion QI project on 2 general medicine hospital units. The main goals of the project were to see whether a QI framework can be used in a general medicine setting to increase patient mobility and reduce LOS.[21, 22]
METHODS
Overview of Project
Mobility, for this project, was defined as a patient getting out of bed (eg, sitting out of bed, toileting at bedside commode or bathroom, standing, and ambulating). We aimed to increase patient mobility using preexisting unit staffing ratios of clinicians and support staff. This project was reported in accordance with the SQUIRE (Standards for QUality Improvement Reporting Excellence) guidelines and used a structured QI model that had been used to successfully promote early mobility in the intensive care unit.[21, 23, 24, 25] The planning phase of the QI project began in spring 2012, with initiation of the 12‐month project on March 1, 2013. During the 12‐month QI period, prospective collection of mobility status occurred for all patients, with no exclusions based on patient characteristics.
Setting
The QI project setting was 2, 24‐bed, general medicine units at the Johns Hopkins Hospital, a large academic medical center located in Baltimore, Maryland.
QI Process
The primary goals of the QI project were to mobilize patients 3 times daily, quantify and document the mobility of the patients, set daily goals to increase mobility (eg, move up 1 step on the scale today), and standardize the description of patient mobility across all hospital staff. We used a structured QI model that that has been used to implement an early mobility program in a medical ICU at our institution[21, 22, 24] (see Supporting Information, Appendix, in the online version of this article). At a programmatic level, we involved key stakeholders (nurses, physicians, rehabilitation therapists, administrators) in the QI project team, we identified local barriers to implementation through team meetings as well as a survey tool to identify perceived barriers,[26] and we developed a scale (the Johns Hopkins Highest Level of Mobility [JH‐HLM]) to document mobility. The JH‐HLM is an 8‐point ordinal scale that captures mobility milestones, where 1 = only lying, 2 = bed activities, 3 = sit at edge of bed, 4 = transfer to chair/commode, 5 = standing for 1 minute, 6 = walking 10+ steps, 7 = walking 25+ feet, and 8 = walking 250+ feet (see Supporting Information, Appendix and Supporting Figure 1, in the online version of this article for additional information on the JH‐HLM scale).
The 12‐month QI project was characterized by several phases and milestones and involved a number of intervention components. During the first 4 months (ramp‐up phase), nurses received education in the form of unit‐based presentations, hands‐on‐training, and online education modules. On a 5‐times weekly basis, nurses met with rehabilitation therapists for unit‐based huddles to discuss baseline patient mobility, current patient mobility levels, barriers to mobilizing patients, and daily goals to progress mobility. Mobility levels were included on daily nursing report sheets to facilitate communication with subsequent shifts. Discussion of JH‐HLM scores also occurred during daily unit‐based care‐coordination meetings of the nurses, physicians, and social‐workers to address barriers to mobilizing patients, such as optimizing pain control, facilitating discharge location planning, and expediting physician consultation with physical and occupational therapy for appropriate patients. Audit and feedback from huddles and care‐coordination rounds resulted in improved nurse attendance and engagement during these meetings. Nurses were expected to document patient mobility scores using the JH‐HLM 3 times daily in the patient medical record. On the fourth month, reports on JH‐HLM scores and documentation compliance were available to nurse managers, champions, and unit staff. Via twice‐monthly meetings with the units and quarterly meetings with hospital leadership and administration, problems arising during the QI intervention were evaluated and resolved on a timely basis. Seven months after project execution started, educational sessions were repeated to all staff, and feedback was provided based on the data collected, such as documentation compliance rates and patient mobility levels, and nurse champions presented the project during an American Nurses Credentialing Center magnet recognition program visit. Lastly, mobility scores and documentation compliance were continually assessed for 4 months after the project completion to determine sustainability of the intervention. Additional details of the QI project implementation are provided in the Supporting Information, Appendix, in the online version of this article.
Data Sources and Covariates for Project Evaluation
The Sunrise Clinical Manager system (Allscripts Healthcare Solutions Inc., Chicago, IL) was used to document and extract nursing‐documented JH‐HLM scores. The Johns Hopkins Hospital Datamart financial database, used for mandatory reporting to the State of Maryland, provided data on LOS, age, sex, race (white, black, other), payer (Medicare, Medicaid, other), primary admission diagnosis, and comorbidity index using Agency for Healthcare Research and Quality (AHRQ) methodology.[27] Expected LOS was calculated using the risk adjustment method developed by the University Health System Consortium (UHC).[28] This calculation uses a combination of the Diagnostic‐Related Group grouper and the Sachs Complication Profiler[29] in conjunction with data on specific patient characteristics (age, sex, urgency of admission, payer category) to construct risk‐adjustment regression models that assign expected values for LOS, and is not based on actual LOS.[28] The databases were linked at the patient level using the patient's medical record and unique admission record number.
Outcome Measures
Two functional outcome measures were based on daily JH‐HLM scores, which frequently occurred several times on each patient‐day: (1) the maximum daily JH‐HLM scores for each patient‐day during hospitalization, and (2) the intrapatient change in JH‐HLM scores between the maximum JH‐HLM score within 24 hours of hospital admission and 24 hours before discharge for all patients who were on the unit >48 hours. We also compared the mean LOS during the 12‐month QI project versus the 12‐months prior so we could more accurately address seasonal differences.[30, 31, 32, 33, 34, 35] Lastly, because the perception of increased falls was an important barrier to address in the QI process, we compared the rate of injurious falls between the QI period and 12‐months prior.
Statistical Analysis
To evaluate changes in the percent of ambulatory patients (JH‐HLM 6), we compared the initial 4 months of the QI project (ramp‐up phase) with the same 4‐month period occurring immediately after project completion (post‐QI phase) using generalized estimating equations to account for clustering at the patient‐level. This test was also used to evaluate changes in documentation compliance rates between the 2 phases, with compliance defined as at least 1 instance of JH‐HLM documentation per day, excluding the day of admission and discharge. To evaluate if improved JH‐HLM results were driven by improved documentation compliance rates over time, we performed a sensitivity analysis by imputing a JH‐HLM score of 6 (ambulate 10+ steps) for any missing daily maximum JH‐HLM scores.
To assess unadjusted changes in LOS during the 12‐month QI project versus the same period 1 year earlier, we compared mean and median LOS using a t test and Wilcoxon rank sum test, respectively. We used a multivariable linear regression model to estimate the change (expressed in days) in adjusted median LOS comparing the project months (March 2013March 2014) with 12 months prior (March 2012March 2013). The model adjusted for age, gender, race, payer, admission diagnostic category, UHC expected LOS, and AHRQ comorbidity index. We confirmed a lack of multicollinearity in the multivariable regression model using variance inflation factors. We evaluated residual versus predicted value plots and residual versus fitted value plots with a locally weighted scatterplot smoothing line to confirm model fit. P values are reported from the test of the null hypothesis that the change in adjusted median LOS is the same comparing the QI project months versus 12 months prior. Separate models estimated and tested the change in adjusted median LOS by tertiles of expected LOS (<4, 47, and >7 days). Lastly, we compared the rate of injurious falls (the number of injurious falls by total patient‐days) between the QI period and 12 months prior using an exact Poisson method.[36] Statistical significance was defined as a 2‐sided P < 0.05. Statistical analyses were conducted using R (version 3.1.0; The R Foundation for Statistical Computing, Vienna, Austria;
RESULTS
During the QI project period, 3352 patients were admitted to the 2 general medicine units. Twelve (0.4%) patients expired on the units, but their data were retained in the analysis. Mean (standard deviation [SD]) age of the patients was 54.4 (18.3) years, with 47% male, and 54% African American. A total of 1896 of 6654 (28%) patients on the QI units were 65 years old. Patient characteristics were similar during the QI period versus 12 months prior (Table 1).
| Characteristics | Comparison Period, March 2012March 2013, N = 3,302 | QI Period, March 2013March 2014, N = 3,352 |
|---|---|---|
| ||
| Age, y | 53.3 (17.8) | 54.4 (18.3) |
| Male | 1467 (44%) | 1569 (47%) |
| Race | ||
| African American | 1883 (57%) | 1809 (54%) |
| Caucasian | 1269 (38%) | 1348 (40%) |
| Other | 150 (5%) | 195 (6%) |
| Payer | ||
| Medicare | 1310 (40%) | 1470 (44%) |
| Medicaid | 1015 (31%) | 925 (28%) |
| Other | 977 (30%) | 957 (29%) |
| Admission diagnostic category | ||
| Infectious disease | 579 (18%) | 629 (19%) |
| Pulmonary | 519 (16%) | 559 (17%) |
| Gastrointestinal | 535 (16%) | 494 (15%) |
| Cardiovascular | 410 (12%) | 405 (12%) |
| Hematologic | 199 (6%) | 195 (6%) |
| Renal | 220 (7%) | 205 (6%) |
| Other | 840 (25%) | 865 (26%) |
| UHC expected length of stay, d | 5.5 (3.3) | 5.3 (3.2) |
| AHRQ comorbidity index | 3.3 (1.7) | 3.5 (1.8) |
During the 12‐month QI project, there were a total of 13,815 patient‐days of documented mobility data and the median (interquartile range [IQR]) number of days of documentation for each hospital admission was 3 (25) days. Compliance with daily documentation of JH‐HLM was 85.0% over the entire 12‐month QI project. Documentation compliance started at 83% during the ramp‐up phase and increased to 89% during the last 4 months of the project (late‐QI phase, P < 0.001).
Comparing the ramp‐up phase versus post‐QI phase, the percentage of patient‐days in which patients ambulated (JH‐HLM 6) increased from 43% to 70% (P < 0.001), and the percentage of patients who experienced an improvement in their mobility scores between admission and discharge increased from 32% to 45% (P < 0.001), as shown in Table 2. In the sensitivity analysis imputing missing daily JH‐HLM scores and comparing the ramp‐up versus post‐QI phases, the results were similar to the primary analysis; the percent of patient‐days where patients ambulated increased from 60% to 78% (P < 0.001), and the percent of patients who experienced an improvement in their mobility scores increased from 26% to 48% (P < 0.001).
| JH‐HLM Category | Ramp‐up Phase, March 1, 2013 June 30, 2013, n = 4,649 | Late‐QI Phase, November 1, 2013February 28, 2013, n = 4,515 | Post‐QI Phase, March 1, 2014 June 30, 2014, n = 4,298 |
|---|---|---|---|
| Change in Mobility (Admission Versus Discharge) | Ramp‐up Phase, March 1, 2013June 30, 2013, n = 968 | Late‐QI Phase, November 1, 2013February 28, 2013, n = 893 | Post‐QI Phase, March 1, 2014 June 30, 2014, n = 834 |
| |||
| Walk (JH‐HLM = 6, 7, or 8) | 1,994 (43) | 3,430 (76) | 2,986 (70) |
| Stand/chair (JH‐HLM = 4 or 5) | 1,772 (38) | 488 (10) | 511 (12) |
| Bed (JH‐HLM = 1, 2, or 3) | 883 (19) | 597 (13) | 801 (19) |
| Improved | 305 (32) | 392 (44) | 379 (45) |
| No change | 512 (53) | 428 (48) | 386 (46) |
| Declined | 151 (16) | 73 (8) | 69 (8) |
LOS during the 12‐month QI project versus the 12‐months immediately prior was shorter (Table 3), with an unadjusted median (IQR) LOS of 3 (26) versus 4 (27) days (P < 0.001) and an unadjusted mean (SD) LOS of 5.1 (5.6) versus 6.0 (7.6) (P < 0.001).
Adjusted Median LOS, d | Absolute Change in Adjusted Median LOS (95% CI), d | P Value | ||
|---|---|---|---|---|
| 12 Months Prior | QI Project Months | |||
| ||||
| All patients | 6.01 | 5.61 | 0.40 (0.57 to 0.21), N = 4,411 | <0.001 |
| Subgroups by ELOS | ||||
| ELOS <4 days | 4.68 | 4.77 | 0.09 (0.13 to 0.32), N = 1,357 | 0.42 |
| ELOS 47 days | 5.68 | 5.38 | 0.30 (0.57 to 0.01), N = 1,509 | 0.04 |
| ELOS >7 days | 8.07 | 6.96 | 1.11 (1.53 to 0.65), N = 1,545 | <0.001 |
Table 3 displays the change in adjusted median LOS for the project months versus the 12 months prior among the QI units. We found that for all patients, there was an overall reduction in adjusted median LOS of 0.40 (95% confidence interval [CI]: 0.57 to 0.21, P<0.001) days. When we divided patients into tertiles based on their UHC expected LOS (ELOS), we observed that patients with longer ELOS had greater reductions in adjusted median LOS. Patients on the QI units with ELOS <4 days (lowest tertile) did not show a significant reduction in adjusted median LOS (0.09 days, 95% CI: 0.13 to 0.32, P = 0.42); however, patients with UHC ELOS 4 to 7 days (middle tertile) and ELOS >7 days (highest tertile) had a significant reduction in adjusted median LOS by 0.30 (95% CI: 0.57 to 0.01, P = 0.04) and 1.11 (95% CI: 1.53 to 0.65, P < 0.001) days during the QI project versus 12 months prior, respectively.
Lastly, we found that there was no difference in the rate of injurious falls on the QI units during QI period compared to 12 months prior (QI: 0.34 per 1000 patient‐days versus 12 months prior: 0.48 per 1000 patient‐days, P = 0.73).
DISCUSSION
We conducted a nurse‐driven, multidisciplinary mobility promotion QI project on 2 general medicine units at a large teaching hospital. The 12‐month QI project, conducted between March 1, 2013 and February 28, 2014, was associated with patients ambulating more frequently, with improved mobility status between hospital admission and discharge. These improvements in mobility were not associated with increased rates of injurious falls, and were sustained for at least 4 months after project completion. The QI project was associated with overall significant reduction in LOS for more complex patients with longer expected LOS (4 days or longer). Hence, such QI efforts may be important for maintaining or improving patients' functional status during hospitalization in a safe and cost‐effective manner.
Our findings are consistent with previous studies showing that mobility promotion in the acute hospital setting is feasible, can reduce length of stay, and can be applied to a diverse population including vulnerable medical patients with multiple comorbidities and the elderly.[12, 16, 37, 38, 39, 40, 41, 42] These studies provide valuable evidence of the benefits of mobility promotion; however, it is difficult to translate these prior results into routine clinical practice because they used specially trained staff to mobilize patients, focused on a select patient population, or did not specify how the mobility intervention was delivered within daily clinical workflows. Research in the medical ICU at our institution has previously described the use of a structured QI model to successfully implement an early rehabilitation program.[22, 24] Here, we successfully adapted the same QI framework to a general medicine setting. Hence, our study contributes to the literature with respect to (1) use of a structured QI framework to develop a successful patient mobility program in a general medicine patient population, and (2) sharing best practices from 1 clinical setting, such as the ICU, as a source of learning and knowledge translation for other care settings, with the addition of novel tools, such as the JH‐HLM scale.
There may have been several factors that contributed to shorter stays in the hospital we observed during the QI project. First, we increased the number of ambulatory patient‐days, which may have helped prevent physiological complications of bed rest, such as muscle weakness, atelectasis, insulin resistance, vascular dysfunction, contractures, and pressure ulcers.[43] As such, mobility promotion has been associated with reduced rates of other hospital‐acquired complications, such as deep venous thrombosis, pneumonia, and delirium.[44, 45, 46] In our study, we saw the greatest LOS reduction in more complex patients who were expected to spend a longer time in the hospital and are at greater risk of developing complications from bed rest. Second, our early mobility project may have had a direct impact on care‐coordination processes as reported in prior studies.[47, 48, 49] An important component of our intervention was incorporating functional status into multidisciplinary discussions, either through nurse‐to‐therapist huddles or care‐coordination rounds between nurses, therapists, physicians, social workers, and case managers. During care‐coordination rounds, JH‐HLM scores were reported to expedite appropriate physical and occupational therapy consultations and assist in determining appropriate discharge location. During the QI project, we transitioned from a unit‐based daily huddle between nursing and rehabilitation therapists to a system where mobility status was discussed primarily during care coordination rounds 5 times per week. We saw that mobility scores were maintained after QI project completion, suggesting that reporting on patient function in a multidisciplinary setting is a potentially sustainable mechanism to improve care‐coordination processes that are affected by functional status.
Our study has several potential limitations. First, this is a single‐site study in 2 general medicine units of a large academic hospital. Further research is needed to determine if this structured QI intervention and its benefits can be generalized to different settings and different patient populations. Second, because the documentation was initially an optional element in the electronic medical record system, we observed higher rates of missing documentation during the first 4 months of the project versus the comparison period at 4 months after project completion. However, a sensitivity analysis conducted of these missing data demonstrated similar results to our primary analysis. Third, our nonrandomized pre‐post study design does not allow us to conclude a direct cause‐and‐effect relationship between our intervention and increased mobility and reduced LOS. Although patient characteristics were similar between the 2 periods and adjusted for in our multivariable regression analysis, we cannot rule out the possibility of secular trends in LOS on the project units and that broader QI efforts at our institution also contributed to reduction in LOS. Fourth, we do not have data on 30‐day readmissions and discharge location. Future studies should explore the impact of hospital‐based mobility interventions on these outcomes.[50] Fifth, although nurses consistently documented the highest level of mobility on a daily basis, these data did not capture other potentially important information about patient mobility such as the daily frequency that patients were mobilized, the length of time a patient was engaged in a mobility event (ie, number of hours sitting in a chair), or the mobility that occurred during physical therapy or occupational therapy sessions. Hence, although we used JH‐HLM as a marker of improved mobility during our QI project it is likely that our data cannot fully describe the total mobility and activity that patients experienced during hospitalization. Lastly, although the front‐line staff and QI team found the JH‐HLM scale to be a useful tool to measure and advance patient mobility, further studies are needed to evaluate the reliability and validity of this scale.
CONCLUSION
A structured QI process can improve patient mobility and may contribute to reduction in LOS, particularly for more complex patients in this setting. Active prevention of decline in physical function that commonly occurs during hospitalization may prove valuable for improving patient outcomes and reducing healthcare resource utilization.
Disclosures
The authors certify that no party having a direct interest in the results of the research supporting this article has or will confer a benefit on us or on any organization with which we are associated. The authors report no conflicts of interest.
- , , , et al. Loss of independence in activities of daily living in older adults hospitalized with medical illnesses: increased vulnerability with age. J Am Geriatr Soc. 2003;51(4):451–458.
- , , . Prevalence and outcomes of low mobility in hospitalized older patients. J Am Geriatr Soc. 2004;52(8):1263–1270.
- , , , , , . Trajectories of life‐space mobility after hospitalization. Ann Intern Med. 2009;150(6):372–378.
- , , . Hospitalization‐associated disability: “She was probably able to ambulate, but I'm not sure”. JAMA. 2011;306(16):1782–1793.
- , , , , , . Physical fitness and all‐cause mortality. A prospective study of healthy men and women. JAMA. 1989;262(17):2395–2401.
- . Mobilizing patients in the intensive care unit: improving neuromuscular weakness and physical function. JAMA. 2008;300(14):1685–1690.
- , . Mobility limitation in the older patient: a clinical review. JAMA. 2013;310(11):1168–1177.
- , , , et al. Early physical and occupational therapy in mechanically ventilated, critically ill patients: a randomised controlled trial. Lancet. 2009;373(9678):1874–1882.
- , , . Technology to enhance physical rehabilitation of critically ill patients. Crit Care Med. 2009;37(10 suppl):S436–S441.
- , , , et al. Receiving early mobility during an intensive care unit admission is a predictor of improved outcomes in acute respiratory failure. Am J Med Sci. 2011;341(5):373–377.
- . Physiotherapy in intensive care: an updated systematic review. Chest. 2013;144(3):825–847.
- , , . Exercise for acutely hospitalised older medical patients. Cochrane Database Syst Rev. 2007;(1):CD005955.
- , , . Extra physical therapy reduces patient length of stay and improves functional outcomes and quality of life in people with acute or subacute conditions: a systematic review. Arch Phys Med Rehabil. 2011;92(9):1490–1500.
- , . Impact of early mobilization protocol on the medical‐surgical inpatient population: an integrated review of literature. Clin Nurse Spec. 2012;26(2):87–94.
- , , . Outcomes of inpatient mobilization: a literature review. J Clin Nurs. 2014;23(11–12):1486–1501.
- , , , et al. The early mobility bundle: a simple enhancement of therapy which may reduce incidence of hospital‐acquired pneumonia and length of hospital stay. J Hosp Infect. 2014;88(1):34–39.
- , , , , . Physical therapy on the wards after early physical activity and mobility in the intensive care unit. Phys Ther. 2012;92(12):1518–1523.
- , , , . Impact of hospital variables on case mix index as a marker of disease severity. Popul Health Manag. 2014;17(1):28–34.
- , , , , . Frequency of hallway ambulation by hospitalized older adults on medical units of an academic hospital. Geriatr Nurs. 2004;25(4):212–217.
- , , . Activity level of hospital medical inpatients: an observational study. Arch Gerontol Geriatr. 2012;55(2):417–421.
- , , . Translating evidence into practice: a model for large scale knowledge translation. BMJ. 2008;337:a1714.
- , , , et al. Early physical medicine and rehabilitation for patients with acute respiratory failure: a quality improvement project. Arch Phys Med Rehabil. 2010;91(4):536–542.
- , , , , ; SQUIRE development group. Publication guidelines for quality improvement studies in health care: evolution of the SQUIRE project. BMJ. 2009;338:a3152.
- , . Rehabilitation quality improvement in an intensive care unit setting: implementation of a quality improvement model. Top Stroke Rehabil. 2010;17(4):271–281.
- , , , . ICU early mobilization: from recommendation to implementation at three medical centers. Crit Care Med. 2013;41(9 suppl 1):S69–S80.
- , , , . Barriers to early mobility of hospitalized general medicine patients: survey development and results. Am J Phys Med Rehabil. 2015;94(4):304–312.
- , , , . Comorbidity measures for use with administrative data. Med Care. 1998;36(1):8–27.
- UHC Clinical Information Management Risk Adjustment of the UHC Clinical Data Base. Chicago, IL: University HealthSystem Consortium; 1998.
- Sachs Complications Profiler, Version 1.0, User's Guide. Evanston, IL: Sachs Group; 1995.
- , , . Assessing hospital‐associated deaths from discharge data. The role of length of stay and comorbidities. JAMA. 1988;260(15):2240–2246.
- , , , et al. Annual rates of admission and seasonal variations in hospitalizations for heart failure. Eur J Heart Fail. 2002;4(6):779–786.
- , , , . Regional and seasonal variation in the length of hospital stay for chronic obstructive pulmonary disease in Finland. Int J Circumpolar Health. 2002;61(2):131–135.
- , , , , , ; Canadian CABG Surgery Quality Indicator Consensus Panel. The identification and development of canadian coronary artery bypass graft surgery quality indicators. J Thorac Cardiovasc Surg. 2005;130(5):1257.
- , , , . Quality of care and length of hospital stay among patients with stroke. Med Care. 2009;47(5):575–582.
- . A systematic review of outcomes and quality measures in adult patients cared for by hospitalists vs nonhospitalists. Mayo Clin Proc. 2009;84(3):248–254.
- . Confidence intervals that match Fisher's exact or Blaker's exact tests. Biostatistics. 2010;11(2):373–374.
- , , , et al. A multicomponent intervention to prevent delirium in hospitalized older patients. N Engl J Med. 1999;340(9):669–676.
- , , , , . Early mobilization of patients hospitalized with community‐acquired pneumonia. Chest. 2003;124(3):883–889.
- , , , et al. Effects of a walking intervention on fatigue‐related experiences of hospitalized acute myelogenous leukemia patients undergoing chemotherapy: a randomized controlled trial. J Pain Symptom Manage. 2008;35(5):524–534.
- , , , , . Early ambulation and length of stay in older adults hospitalized for acute illness. Arch Intern Med. 2010;170(21):1942–1943.
- , , . Impact of a nurse‐driven mobility protocol on functional decline in hospitalized older adults. J Nurs Care Qual. 2009;24(4):325–331.
- , , . Exercising body and mind: an integrated approach to functional independence in hospitalized older people. J Am Geriatr Soc. 2008;56(4):630–635.
- . Consequences of bed rest. Crit Care Med. 2009;37(10 suppl):S422–S428.
- , , , , . Time to ambulation after hip fracture surgery: relation to hospitalization outcomes. J Gerontol A Biol Sci Med Sci. 2003;58(11):M1042–M1045.
- , , , . Early mobilization after total knee replacement reduces the incidence of deep venous thrombosis. ANZ J Surg. 2009;79(7–8):526–529.
- , , , . Efficacy and safety of postoperative early mobilization for chronic subdural hematoma in elderly patients. Acta Neurochir (Wien). 2010;152(7):1171–1174.
- , , , et al. Impact of relational coordination on quality of care, postoperative pain and functioning, and length of stay: a nine‐hospital study of surgical patients. Med Care. 2000;38(8):807–819.
- Care coordination cuts admissions, ED visits, LOS. Hosp Case Manag. 2013;21(5):67–68.
- , . A heart failure initiative to reduce the length of stay and readmission rates. Prof Case Manag. 2014;19(6):276–284.
- , , , , , . Association of impaired functional status at hospital discharge and subsequent rehospitalization. J Hosp Med. 2014;9(5):277–282.
Annually, more than 35 million patients are hospitalized in the United States, with many experiencing hospital‐acquired impairments in physical functioning during their in‐patient stay.[1, 2, 3, 4] Such impairments include difficulties performing basic activities of daily living, such as rising from a chair, toileting, or ambulating. This functional decline may result in increased length of stay (LOS), nursing home placement, and decreased mobility and participation in community activities even years after hospitalization.[1, 2, 3, 5, 6, 7] Ameliorating this hospital‐acquired functional impairment is important to improving patient outcomes and reducing healthcare utilization. Even the sickest hospitalized patients (eg, those in the intensive care unit [ICU]), can safely and feasibly benefit from early mobilization.[6, 8, 9, 10, 11] In the non‐ICU setting there is also evidence that patient mobilization reduces LOS and hospital costs, while improving patient satisfaction and physical and psychological outcomes.[12, 13, 14, 15, 16] These studies are, however, difficult to replicate as part of routine clinical care, because they often do not present the details of how early mobility was incorporated into daily practice, require additional hospital resources (eg, specially trained providers or additional staff), or are focused only on a select patient population.
The Johns Hopkins medical ICU started early rehabilitation quality‐improvement (QI) work in 2007, which has demonstrated ongoing reductions in LOS and been transformative in terms of helping to foster a culture of mobility at our institution. Previous research suggests that ICU‐based rehabilitation interventions are often not carried over to the ward setting, even in post‐ICU patients.[17] Moreover, trends for sicker patients being admitted in our general medicine units,[18] growing reports of patients spending most of their time in bed,[2, 19, 20] and healthcare policies emphasizing the importance of improving inpatient outcomes motivated the need for QI to improve patient mobility in this setting. Experience from the medical ICU‐based early rehabilitation program helped drive multidisciplinary collaboration of stakeholders to develop this nurse‐driven, mobility promotion QI project on 2 general medicine hospital units. The main goals of the project were to see whether a QI framework can be used in a general medicine setting to increase patient mobility and reduce LOS.[21, 22]
METHODS
Overview of Project
Mobility, for this project, was defined as a patient getting out of bed (eg, sitting out of bed, toileting at bedside commode or bathroom, standing, and ambulating). We aimed to increase patient mobility using preexisting unit staffing ratios of clinicians and support staff. This project was reported in accordance with the SQUIRE (Standards for QUality Improvement Reporting Excellence) guidelines and used a structured QI model that had been used to successfully promote early mobility in the intensive care unit.[21, 23, 24, 25] The planning phase of the QI project began in spring 2012, with initiation of the 12‐month project on March 1, 2013. During the 12‐month QI period, prospective collection of mobility status occurred for all patients, with no exclusions based on patient characteristics.
Setting
The QI project setting was 2, 24‐bed, general medicine units at the Johns Hopkins Hospital, a large academic medical center located in Baltimore, Maryland.
QI Process
The primary goals of the QI project were to mobilize patients 3 times daily, quantify and document the mobility of the patients, set daily goals to increase mobility (eg, move up 1 step on the scale today), and standardize the description of patient mobility across all hospital staff. We used a structured QI model that that has been used to implement an early mobility program in a medical ICU at our institution[21, 22, 24] (see Supporting Information, Appendix, in the online version of this article). At a programmatic level, we involved key stakeholders (nurses, physicians, rehabilitation therapists, administrators) in the QI project team, we identified local barriers to implementation through team meetings as well as a survey tool to identify perceived barriers,[26] and we developed a scale (the Johns Hopkins Highest Level of Mobility [JH‐HLM]) to document mobility. The JH‐HLM is an 8‐point ordinal scale that captures mobility milestones, where 1 = only lying, 2 = bed activities, 3 = sit at edge of bed, 4 = transfer to chair/commode, 5 = standing for 1 minute, 6 = walking 10+ steps, 7 = walking 25+ feet, and 8 = walking 250+ feet (see Supporting Information, Appendix and Supporting Figure 1, in the online version of this article for additional information on the JH‐HLM scale).
The 12‐month QI project was characterized by several phases and milestones and involved a number of intervention components. During the first 4 months (ramp‐up phase), nurses received education in the form of unit‐based presentations, hands‐on‐training, and online education modules. On a 5‐times weekly basis, nurses met with rehabilitation therapists for unit‐based huddles to discuss baseline patient mobility, current patient mobility levels, barriers to mobilizing patients, and daily goals to progress mobility. Mobility levels were included on daily nursing report sheets to facilitate communication with subsequent shifts. Discussion of JH‐HLM scores also occurred during daily unit‐based care‐coordination meetings of the nurses, physicians, and social‐workers to address barriers to mobilizing patients, such as optimizing pain control, facilitating discharge location planning, and expediting physician consultation with physical and occupational therapy for appropriate patients. Audit and feedback from huddles and care‐coordination rounds resulted in improved nurse attendance and engagement during these meetings. Nurses were expected to document patient mobility scores using the JH‐HLM 3 times daily in the patient medical record. On the fourth month, reports on JH‐HLM scores and documentation compliance were available to nurse managers, champions, and unit staff. Via twice‐monthly meetings with the units and quarterly meetings with hospital leadership and administration, problems arising during the QI intervention were evaluated and resolved on a timely basis. Seven months after project execution started, educational sessions were repeated to all staff, and feedback was provided based on the data collected, such as documentation compliance rates and patient mobility levels, and nurse champions presented the project during an American Nurses Credentialing Center magnet recognition program visit. Lastly, mobility scores and documentation compliance were continually assessed for 4 months after the project completion to determine sustainability of the intervention. Additional details of the QI project implementation are provided in the Supporting Information, Appendix, in the online version of this article.
Data Sources and Covariates for Project Evaluation
The Sunrise Clinical Manager system (Allscripts Healthcare Solutions Inc., Chicago, IL) was used to document and extract nursing‐documented JH‐HLM scores. The Johns Hopkins Hospital Datamart financial database, used for mandatory reporting to the State of Maryland, provided data on LOS, age, sex, race (white, black, other), payer (Medicare, Medicaid, other), primary admission diagnosis, and comorbidity index using Agency for Healthcare Research and Quality (AHRQ) methodology.[27] Expected LOS was calculated using the risk adjustment method developed by the University Health System Consortium (UHC).[28] This calculation uses a combination of the Diagnostic‐Related Group grouper and the Sachs Complication Profiler[29] in conjunction with data on specific patient characteristics (age, sex, urgency of admission, payer category) to construct risk‐adjustment regression models that assign expected values for LOS, and is not based on actual LOS.[28] The databases were linked at the patient level using the patient's medical record and unique admission record number.
Outcome Measures
Two functional outcome measures were based on daily JH‐HLM scores, which frequently occurred several times on each patient‐day: (1) the maximum daily JH‐HLM scores for each patient‐day during hospitalization, and (2) the intrapatient change in JH‐HLM scores between the maximum JH‐HLM score within 24 hours of hospital admission and 24 hours before discharge for all patients who were on the unit >48 hours. We also compared the mean LOS during the 12‐month QI project versus the 12‐months prior so we could more accurately address seasonal differences.[30, 31, 32, 33, 34, 35] Lastly, because the perception of increased falls was an important barrier to address in the QI process, we compared the rate of injurious falls between the QI period and 12‐months prior.
Statistical Analysis
To evaluate changes in the percent of ambulatory patients (JH‐HLM 6), we compared the initial 4 months of the QI project (ramp‐up phase) with the same 4‐month period occurring immediately after project completion (post‐QI phase) using generalized estimating equations to account for clustering at the patient‐level. This test was also used to evaluate changes in documentation compliance rates between the 2 phases, with compliance defined as at least 1 instance of JH‐HLM documentation per day, excluding the day of admission and discharge. To evaluate if improved JH‐HLM results were driven by improved documentation compliance rates over time, we performed a sensitivity analysis by imputing a JH‐HLM score of 6 (ambulate 10+ steps) for any missing daily maximum JH‐HLM scores.
To assess unadjusted changes in LOS during the 12‐month QI project versus the same period 1 year earlier, we compared mean and median LOS using a t test and Wilcoxon rank sum test, respectively. We used a multivariable linear regression model to estimate the change (expressed in days) in adjusted median LOS comparing the project months (March 2013March 2014) with 12 months prior (March 2012March 2013). The model adjusted for age, gender, race, payer, admission diagnostic category, UHC expected LOS, and AHRQ comorbidity index. We confirmed a lack of multicollinearity in the multivariable regression model using variance inflation factors. We evaluated residual versus predicted value plots and residual versus fitted value plots with a locally weighted scatterplot smoothing line to confirm model fit. P values are reported from the test of the null hypothesis that the change in adjusted median LOS is the same comparing the QI project months versus 12 months prior. Separate models estimated and tested the change in adjusted median LOS by tertiles of expected LOS (<4, 47, and >7 days). Lastly, we compared the rate of injurious falls (the number of injurious falls by total patient‐days) between the QI period and 12 months prior using an exact Poisson method.[36] Statistical significance was defined as a 2‐sided P < 0.05. Statistical analyses were conducted using R (version 3.1.0; The R Foundation for Statistical Computing, Vienna, Austria;
RESULTS
During the QI project period, 3352 patients were admitted to the 2 general medicine units. Twelve (0.4%) patients expired on the units, but their data were retained in the analysis. Mean (standard deviation [SD]) age of the patients was 54.4 (18.3) years, with 47% male, and 54% African American. A total of 1896 of 6654 (28%) patients on the QI units were 65 years old. Patient characteristics were similar during the QI period versus 12 months prior (Table 1).
| Characteristics | Comparison Period, March 2012March 2013, N = 3,302 | QI Period, March 2013March 2014, N = 3,352 |
|---|---|---|
| ||
| Age, y | 53.3 (17.8) | 54.4 (18.3) |
| Male | 1467 (44%) | 1569 (47%) |
| Race | ||
| African American | 1883 (57%) | 1809 (54%) |
| Caucasian | 1269 (38%) | 1348 (40%) |
| Other | 150 (5%) | 195 (6%) |
| Payer | ||
| Medicare | 1310 (40%) | 1470 (44%) |
| Medicaid | 1015 (31%) | 925 (28%) |
| Other | 977 (30%) | 957 (29%) |
| Admission diagnostic category | ||
| Infectious disease | 579 (18%) | 629 (19%) |
| Pulmonary | 519 (16%) | 559 (17%) |
| Gastrointestinal | 535 (16%) | 494 (15%) |
| Cardiovascular | 410 (12%) | 405 (12%) |
| Hematologic | 199 (6%) | 195 (6%) |
| Renal | 220 (7%) | 205 (6%) |
| Other | 840 (25%) | 865 (26%) |
| UHC expected length of stay, d | 5.5 (3.3) | 5.3 (3.2) |
| AHRQ comorbidity index | 3.3 (1.7) | 3.5 (1.8) |
During the 12‐month QI project, there were a total of 13,815 patient‐days of documented mobility data and the median (interquartile range [IQR]) number of days of documentation for each hospital admission was 3 (25) days. Compliance with daily documentation of JH‐HLM was 85.0% over the entire 12‐month QI project. Documentation compliance started at 83% during the ramp‐up phase and increased to 89% during the last 4 months of the project (late‐QI phase, P < 0.001).
Comparing the ramp‐up phase versus post‐QI phase, the percentage of patient‐days in which patients ambulated (JH‐HLM 6) increased from 43% to 70% (P < 0.001), and the percentage of patients who experienced an improvement in their mobility scores between admission and discharge increased from 32% to 45% (P < 0.001), as shown in Table 2. In the sensitivity analysis imputing missing daily JH‐HLM scores and comparing the ramp‐up versus post‐QI phases, the results were similar to the primary analysis; the percent of patient‐days where patients ambulated increased from 60% to 78% (P < 0.001), and the percent of patients who experienced an improvement in their mobility scores increased from 26% to 48% (P < 0.001).
| JH‐HLM Category | Ramp‐up Phase, March 1, 2013 June 30, 2013, n = 4,649 | Late‐QI Phase, November 1, 2013February 28, 2013, n = 4,515 | Post‐QI Phase, March 1, 2014 June 30, 2014, n = 4,298 |
|---|---|---|---|
| Change in Mobility (Admission Versus Discharge) | Ramp‐up Phase, March 1, 2013June 30, 2013, n = 968 | Late‐QI Phase, November 1, 2013February 28, 2013, n = 893 | Post‐QI Phase, March 1, 2014 June 30, 2014, n = 834 |
| |||
| Walk (JH‐HLM = 6, 7, or 8) | 1,994 (43) | 3,430 (76) | 2,986 (70) |
| Stand/chair (JH‐HLM = 4 or 5) | 1,772 (38) | 488 (10) | 511 (12) |
| Bed (JH‐HLM = 1, 2, or 3) | 883 (19) | 597 (13) | 801 (19) |
| Improved | 305 (32) | 392 (44) | 379 (45) |
| No change | 512 (53) | 428 (48) | 386 (46) |
| Declined | 151 (16) | 73 (8) | 69 (8) |
LOS during the 12‐month QI project versus the 12‐months immediately prior was shorter (Table 3), with an unadjusted median (IQR) LOS of 3 (26) versus 4 (27) days (P < 0.001) and an unadjusted mean (SD) LOS of 5.1 (5.6) versus 6.0 (7.6) (P < 0.001).
Adjusted Median LOS, d | Absolute Change in Adjusted Median LOS (95% CI), d | P Value | ||
|---|---|---|---|---|
| 12 Months Prior | QI Project Months | |||
| ||||
| All patients | 6.01 | 5.61 | 0.40 (0.57 to 0.21), N = 4,411 | <0.001 |
| Subgroups by ELOS | ||||
| ELOS <4 days | 4.68 | 4.77 | 0.09 (0.13 to 0.32), N = 1,357 | 0.42 |
| ELOS 47 days | 5.68 | 5.38 | 0.30 (0.57 to 0.01), N = 1,509 | 0.04 |
| ELOS >7 days | 8.07 | 6.96 | 1.11 (1.53 to 0.65), N = 1,545 | <0.001 |
Table 3 displays the change in adjusted median LOS for the project months versus the 12 months prior among the QI units. We found that for all patients, there was an overall reduction in adjusted median LOS of 0.40 (95% confidence interval [CI]: 0.57 to 0.21, P<0.001) days. When we divided patients into tertiles based on their UHC expected LOS (ELOS), we observed that patients with longer ELOS had greater reductions in adjusted median LOS. Patients on the QI units with ELOS <4 days (lowest tertile) did not show a significant reduction in adjusted median LOS (0.09 days, 95% CI: 0.13 to 0.32, P = 0.42); however, patients with UHC ELOS 4 to 7 days (middle tertile) and ELOS >7 days (highest tertile) had a significant reduction in adjusted median LOS by 0.30 (95% CI: 0.57 to 0.01, P = 0.04) and 1.11 (95% CI: 1.53 to 0.65, P < 0.001) days during the QI project versus 12 months prior, respectively.
Lastly, we found that there was no difference in the rate of injurious falls on the QI units during QI period compared to 12 months prior (QI: 0.34 per 1000 patient‐days versus 12 months prior: 0.48 per 1000 patient‐days, P = 0.73).
DISCUSSION
We conducted a nurse‐driven, multidisciplinary mobility promotion QI project on 2 general medicine units at a large teaching hospital. The 12‐month QI project, conducted between March 1, 2013 and February 28, 2014, was associated with patients ambulating more frequently, with improved mobility status between hospital admission and discharge. These improvements in mobility were not associated with increased rates of injurious falls, and were sustained for at least 4 months after project completion. The QI project was associated with overall significant reduction in LOS for more complex patients with longer expected LOS (4 days or longer). Hence, such QI efforts may be important for maintaining or improving patients' functional status during hospitalization in a safe and cost‐effective manner.
Our findings are consistent with previous studies showing that mobility promotion in the acute hospital setting is feasible, can reduce length of stay, and can be applied to a diverse population including vulnerable medical patients with multiple comorbidities and the elderly.[12, 16, 37, 38, 39, 40, 41, 42] These studies provide valuable evidence of the benefits of mobility promotion; however, it is difficult to translate these prior results into routine clinical practice because they used specially trained staff to mobilize patients, focused on a select patient population, or did not specify how the mobility intervention was delivered within daily clinical workflows. Research in the medical ICU at our institution has previously described the use of a structured QI model to successfully implement an early rehabilitation program.[22, 24] Here, we successfully adapted the same QI framework to a general medicine setting. Hence, our study contributes to the literature with respect to (1) use of a structured QI framework to develop a successful patient mobility program in a general medicine patient population, and (2) sharing best practices from 1 clinical setting, such as the ICU, as a source of learning and knowledge translation for other care settings, with the addition of novel tools, such as the JH‐HLM scale.
There may have been several factors that contributed to shorter stays in the hospital we observed during the QI project. First, we increased the number of ambulatory patient‐days, which may have helped prevent physiological complications of bed rest, such as muscle weakness, atelectasis, insulin resistance, vascular dysfunction, contractures, and pressure ulcers.[43] As such, mobility promotion has been associated with reduced rates of other hospital‐acquired complications, such as deep venous thrombosis, pneumonia, and delirium.[44, 45, 46] In our study, we saw the greatest LOS reduction in more complex patients who were expected to spend a longer time in the hospital and are at greater risk of developing complications from bed rest. Second, our early mobility project may have had a direct impact on care‐coordination processes as reported in prior studies.[47, 48, 49] An important component of our intervention was incorporating functional status into multidisciplinary discussions, either through nurse‐to‐therapist huddles or care‐coordination rounds between nurses, therapists, physicians, social workers, and case managers. During care‐coordination rounds, JH‐HLM scores were reported to expedite appropriate physical and occupational therapy consultations and assist in determining appropriate discharge location. During the QI project, we transitioned from a unit‐based daily huddle between nursing and rehabilitation therapists to a system where mobility status was discussed primarily during care coordination rounds 5 times per week. We saw that mobility scores were maintained after QI project completion, suggesting that reporting on patient function in a multidisciplinary setting is a potentially sustainable mechanism to improve care‐coordination processes that are affected by functional status.
Our study has several potential limitations. First, this is a single‐site study in 2 general medicine units of a large academic hospital. Further research is needed to determine if this structured QI intervention and its benefits can be generalized to different settings and different patient populations. Second, because the documentation was initially an optional element in the electronic medical record system, we observed higher rates of missing documentation during the first 4 months of the project versus the comparison period at 4 months after project completion. However, a sensitivity analysis conducted of these missing data demonstrated similar results to our primary analysis. Third, our nonrandomized pre‐post study design does not allow us to conclude a direct cause‐and‐effect relationship between our intervention and increased mobility and reduced LOS. Although patient characteristics were similar between the 2 periods and adjusted for in our multivariable regression analysis, we cannot rule out the possibility of secular trends in LOS on the project units and that broader QI efforts at our institution also contributed to reduction in LOS. Fourth, we do not have data on 30‐day readmissions and discharge location. Future studies should explore the impact of hospital‐based mobility interventions on these outcomes.[50] Fifth, although nurses consistently documented the highest level of mobility on a daily basis, these data did not capture other potentially important information about patient mobility such as the daily frequency that patients were mobilized, the length of time a patient was engaged in a mobility event (ie, number of hours sitting in a chair), or the mobility that occurred during physical therapy or occupational therapy sessions. Hence, although we used JH‐HLM as a marker of improved mobility during our QI project it is likely that our data cannot fully describe the total mobility and activity that patients experienced during hospitalization. Lastly, although the front‐line staff and QI team found the JH‐HLM scale to be a useful tool to measure and advance patient mobility, further studies are needed to evaluate the reliability and validity of this scale.
CONCLUSION
A structured QI process can improve patient mobility and may contribute to reduction in LOS, particularly for more complex patients in this setting. Active prevention of decline in physical function that commonly occurs during hospitalization may prove valuable for improving patient outcomes and reducing healthcare resource utilization.
Disclosures
The authors certify that no party having a direct interest in the results of the research supporting this article has or will confer a benefit on us or on any organization with which we are associated. The authors report no conflicts of interest.
- , , , et al. Loss of independence in activities of daily living in older adults hospitalized with medical illnesses: increased vulnerability with age. J Am Geriatr Soc. 2003;51(4):451–458.
- , , . Prevalence and outcomes of low mobility in hospitalized older patients. J Am Geriatr Soc. 2004;52(8):1263–1270.
- , , , , , . Trajectories of life‐space mobility after hospitalization. Ann Intern Med. 2009;150(6):372–378.
- , , . Hospitalization‐associated disability: “She was probably able to ambulate, but I'm not sure”. JAMA. 2011;306(16):1782–1793.
- , , , , , . Physical fitness and all‐cause mortality. A prospective study of healthy men and women. JAMA. 1989;262(17):2395–2401.
- . Mobilizing patients in the intensive care unit: improving neuromuscular weakness and physical function. JAMA. 2008;300(14):1685–1690.
- , . Mobility limitation in the older patient: a clinical review. JAMA. 2013;310(11):1168–1177.
- , , , et al. Early physical and occupational therapy in mechanically ventilated, critically ill patients: a randomised controlled trial. Lancet. 2009;373(9678):1874–1882.
- , , . Technology to enhance physical rehabilitation of critically ill patients. Crit Care Med. 2009;37(10 suppl):S436–S441.
- , , , et al. Receiving early mobility during an intensive care unit admission is a predictor of improved outcomes in acute respiratory failure. Am J Med Sci. 2011;341(5):373–377.
- . Physiotherapy in intensive care: an updated systematic review. Chest. 2013;144(3):825–847.
- , , . Exercise for acutely hospitalised older medical patients. Cochrane Database Syst Rev. 2007;(1):CD005955.
- , , . Extra physical therapy reduces patient length of stay and improves functional outcomes and quality of life in people with acute or subacute conditions: a systematic review. Arch Phys Med Rehabil. 2011;92(9):1490–1500.
- , . Impact of early mobilization protocol on the medical‐surgical inpatient population: an integrated review of literature. Clin Nurse Spec. 2012;26(2):87–94.
- , , . Outcomes of inpatient mobilization: a literature review. J Clin Nurs. 2014;23(11–12):1486–1501.
- , , , et al. The early mobility bundle: a simple enhancement of therapy which may reduce incidence of hospital‐acquired pneumonia and length of hospital stay. J Hosp Infect. 2014;88(1):34–39.
- , , , , . Physical therapy on the wards after early physical activity and mobility in the intensive care unit. Phys Ther. 2012;92(12):1518–1523.
- , , , . Impact of hospital variables on case mix index as a marker of disease severity. Popul Health Manag. 2014;17(1):28–34.
- , , , , . Frequency of hallway ambulation by hospitalized older adults on medical units of an academic hospital. Geriatr Nurs. 2004;25(4):212–217.
- , , . Activity level of hospital medical inpatients: an observational study. Arch Gerontol Geriatr. 2012;55(2):417–421.
- , , . Translating evidence into practice: a model for large scale knowledge translation. BMJ. 2008;337:a1714.
- , , , et al. Early physical medicine and rehabilitation for patients with acute respiratory failure: a quality improvement project. Arch Phys Med Rehabil. 2010;91(4):536–542.
- , , , , ; SQUIRE development group. Publication guidelines for quality improvement studies in health care: evolution of the SQUIRE project. BMJ. 2009;338:a3152.
- , . Rehabilitation quality improvement in an intensive care unit setting: implementation of a quality improvement model. Top Stroke Rehabil. 2010;17(4):271–281.
- , , , . ICU early mobilization: from recommendation to implementation at three medical centers. Crit Care Med. 2013;41(9 suppl 1):S69–S80.
- , , , . Barriers to early mobility of hospitalized general medicine patients: survey development and results. Am J Phys Med Rehabil. 2015;94(4):304–312.
- , , , . Comorbidity measures for use with administrative data. Med Care. 1998;36(1):8–27.
- UHC Clinical Information Management Risk Adjustment of the UHC Clinical Data Base. Chicago, IL: University HealthSystem Consortium; 1998.
- Sachs Complications Profiler, Version 1.0, User's Guide. Evanston, IL: Sachs Group; 1995.
- , , . Assessing hospital‐associated deaths from discharge data. The role of length of stay and comorbidities. JAMA. 1988;260(15):2240–2246.
- , , , et al. Annual rates of admission and seasonal variations in hospitalizations for heart failure. Eur J Heart Fail. 2002;4(6):779–786.
- , , , . Regional and seasonal variation in the length of hospital stay for chronic obstructive pulmonary disease in Finland. Int J Circumpolar Health. 2002;61(2):131–135.
- , , , , , ; Canadian CABG Surgery Quality Indicator Consensus Panel. The identification and development of canadian coronary artery bypass graft surgery quality indicators. J Thorac Cardiovasc Surg. 2005;130(5):1257.
- , , , . Quality of care and length of hospital stay among patients with stroke. Med Care. 2009;47(5):575–582.
- . A systematic review of outcomes and quality measures in adult patients cared for by hospitalists vs nonhospitalists. Mayo Clin Proc. 2009;84(3):248–254.
- . Confidence intervals that match Fisher's exact or Blaker's exact tests. Biostatistics. 2010;11(2):373–374.
- , , , et al. A multicomponent intervention to prevent delirium in hospitalized older patients. N Engl J Med. 1999;340(9):669–676.
- , , , , . Early mobilization of patients hospitalized with community‐acquired pneumonia. Chest. 2003;124(3):883–889.
- , , , et al. Effects of a walking intervention on fatigue‐related experiences of hospitalized acute myelogenous leukemia patients undergoing chemotherapy: a randomized controlled trial. J Pain Symptom Manage. 2008;35(5):524–534.
- , , , , . Early ambulation and length of stay in older adults hospitalized for acute illness. Arch Intern Med. 2010;170(21):1942–1943.
- , , . Impact of a nurse‐driven mobility protocol on functional decline in hospitalized older adults. J Nurs Care Qual. 2009;24(4):325–331.
- , , . Exercising body and mind: an integrated approach to functional independence in hospitalized older people. J Am Geriatr Soc. 2008;56(4):630–635.
- . Consequences of bed rest. Crit Care Med. 2009;37(10 suppl):S422–S428.
- , , , , . Time to ambulation after hip fracture surgery: relation to hospitalization outcomes. J Gerontol A Biol Sci Med Sci. 2003;58(11):M1042–M1045.
- , , , . Early mobilization after total knee replacement reduces the incidence of deep venous thrombosis. ANZ J Surg. 2009;79(7–8):526–529.
- , , , . Efficacy and safety of postoperative early mobilization for chronic subdural hematoma in elderly patients. Acta Neurochir (Wien). 2010;152(7):1171–1174.
- , , , et al. Impact of relational coordination on quality of care, postoperative pain and functioning, and length of stay: a nine‐hospital study of surgical patients. Med Care. 2000;38(8):807–819.
- Care coordination cuts admissions, ED visits, LOS. Hosp Case Manag. 2013;21(5):67–68.
- , . A heart failure initiative to reduce the length of stay and readmission rates. Prof Case Manag. 2014;19(6):276–284.
- , , , , , . Association of impaired functional status at hospital discharge and subsequent rehospitalization. J Hosp Med. 2014;9(5):277–282.
© 2016 Society of Hospital Medicine
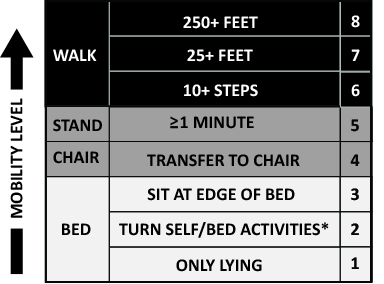
FIM at Discharge and Rehospitalization
Federally mandated pay‐for‐performance initiatives promote minimizing 30‐day hospital readmissions to improve healthcare quality and reduce costs. Although the reasons for readmissions are multifactorial, many patients are readmitted for a condition other than their initial hospital admitting diagnosis.[1] Impairments in functional status experienced during acute care hospitalization contribute to patients being discharged in a debilitated state and being vulnerable to postdischarge complications and potentially hospital readmission.[2] As such, decreased functional status may be an important and potentially modifiable risk factor for acute care hospital readmission.[3]
Previous studies have suggested that impaired functional status may be an important predictor of rehospitalization.[4, 5, 6, 7] However, inferences from existing studies are limited because they did not consider functional status as their primary focus, they only considered specific patient populations (eg, stroke) or readmissions occurring well beyond the 30‐day period defined by federal pay‐for‐performance standards.[4, 5, 6, 8, 9, 10] Our objective was to evaluate the association between functional status near the time of discharge from acute care hospital and 30‐day readmission for patients admitted to an acute inpatient rehabilitation facility. As a secondary objective, we sought to investigate the relationship between functional status and readmission by diagnostic category (medical, neurologic, or orthopedic).
METHODS
Study Population and Setting
We conducted a single‐center, retrospective study of patients admitted to an inpatient rehabilitation facility at a community hospital between July 1, 2006 and December 31, 2012. This facility provides intensive rehabilitation consisting of 3 hours of therapy per day, skilled nursing care on a 24‐hour basis, and medical care by a physiatrist. We excluded patients who died during inpatient rehabilitation (n=15, 0.2%) and patients not admitted directly from an acute care setting (n=178, 2.0%).
Data Source and Covariates
Data were derived from the Uniform Data System for Medical Rehabilitation (UDSMR), which is an administrative database providing the following data upon admission to an inpatient rehabilitation facility[11, 12, 13]: age, gender, race/ethnicity, marital status, the discharge setting, the admission Functional Independence Measure (FIM) score (details further below), and admission diagnostic category as defined by the primary discharge diagnosis from the acute care hospital and grouped by functional related groups (a case‐mix system for medical rehabilitation).[12, 14] The 3M ClinTrac management software (3M, St. Paul, MN), used for mandatory reporting to the State of Maryland, provided all‐payerrefined diagnosis related group (APRDRG) and severity of illness (SOI) combinations (a tool to group patients into clinically comparable disease and severity‐of‐illness categories expected to use similar resources and experience similar outcomes). The University HealthSystem Consortium (UHC) database provided national readmission rates for all APRDRG‐SOI combinations using a methodology that has been previously described.[15, 16] Expected readmission rates for APRDRG‐SOI combinations served as a patient risk stratification tool based on clinical logic that evaluates age, comorbidities, principal diagnosis during hospitalization, and procedures conducted during hospitalization.[17]
Primary Outcome: Acute Care Readmission
The primary outcome was all‐cause acute care readmission, defined as patient transfer to an acute care hospital during inpatient rehabilitation within 30 days from admission to inpatient rehabilitation. The care model for our inpatient rehabilitation unit is such that when patients become sick or develop a complication, they are admitted directly to a clinical unit (eg, intensive care unit) at the community hospital through a rapid‐response intervention, or the physiatrist arranges with an admitting inpatient attending to accept the patient directly to his or her service.
Primary Exposure: Functional Independence Measure
Functional status was measured using the FIM score.[18] The FIM score is an 18‐item measure of functional status, with each item scored on a scale from 1 to 7 (dependent to independent). Various aspects of motor function and cognitive function are assessed. The FIM has been validated and shown to be reliable and reproducible.[13, 19, 20] By definition for the FIM instrument, admission FIM scores are assessed by trained multidisciplinary personnel first over the 72 hours of the rehabilitation stay, and for this study served as a proxy for patient functional status upon discharge from the acute care setting in our analysis. This 72‐hour time window allows for full assessment by therapists and nurses; however, in clinical practice at the inpatient rehabilitation unit involved in this study, much of the FIM assessment occurs within the first 24 hours of the rehabilitation stay. For our analysis, we divided FIM scores into low, medium, and high functional groups. The thresholds for these groups were based on total FIM score tertiles from a prior study<60, 60 to 76, and >76.[16] As a secondary analysis we created 6 subscales of the overall FIM score based on previous research. These subscales included: transfers (transfer to chair/wheelchair, toilet, and tub/shower), locomotion (walking and stairs), self‐care (eating, grooming, bathing, dressing, and toileting), sphincter control (bladder and bowel management), communication (comprehension and expression), and social cognition (social interaction, problem solving, and memory).[21]
Statistical Analysis
To evaluate differences in patient characteristics by diagnostic category, analysis of variance and 2 tests were used for continuous and dichotomous variables, respectively. Logistic regression was used to evaluate the association between FIM score category and readmission status, adjusting for potentially confounding variables available from the UDSMR and UHC databases. We used interaction terms to test whether the association between the FIM score and readmissions varied significantly across diagnostic categories and by age. As a secondary analysis, we modeled FIM score as a continuous variable. We expressed the odds ratio in this analysis per 10‐point change in FIM, because this represents a clinically relevant change in function.[22] Logistic regression was also used to evaluate the association between FIM subscale scores (transfers, locomotion, self‐care, sphincter control, communication, and social cognition) and readmission status. Statistical significance was defined as a 2‐sided P<0.05. Data were analyzed with R (version 2.15.0;
RESULTS
Readmitted Patients and Diagnostic Categories
A total of 9405 consecutive eligible patients were admitted to the acute inpatient rehabilitation facility between July 1, 2006 and December 31, 2012. A total of 1182 (13%) patients were readmitted back to an acute care hospital from inpatient rehabilitation. Median (interquartile range) time to readmission from acute care hospital discharge was 6 days (310 days), and median length of stay for patients who were discharged to the community from inpatient rehabilitation was 8 days (612 days).
Table 1 shows characteristics of all inpatient rehabilitation patients by diagnostic category. For the neurologic category, the most common primary diagnoses were stroke and spinal cord injury; for the medical category, infection, renal failure, congestive heart failure, and chronic obstructive pulmonary disease; and for the orthopedic category, spinal arthrodesis, knee and hip replacements. Mean FIM scores were lowest and highest for patients admitted with a primarily neurologic and orthopedic diagnosis, respectively.
| Characteristic | All Patients, N=9405 | Diagnostic Category | |||
|---|---|---|---|---|---|
| Neurologic, n=3706 | Medical, n=2135 | Orthopedic, n=3564 | P Valueb | ||
| |||||
| Age, y | 67.8 (14.2) | 66.7 (15.3) | 67.0 (14.9) | 69.3 (12.4) | <0.001 |
| Male | 4,068 (43%) | 1,816 (49%) | 1,119 (52%) | 1,133 (32%) | <0.001 |
| Race | <0.001 | ||||
| Caucasian | 6,106 (65%) | 2344 (63%) | 1,320 (62%) | 2,442 (69%) | |
| African American | 2,501 (27%) | 984 (27%) | 658 (31%) | 859 (24%) | |
| Other | 798 (8%) | 378 (10%) | 157 (7%) | 263 (7%) | |
| Married | 4,330 (46%) | 1,683 (45%) | 931 (44%) | 1,716 (48%) | 0.002 |
| APRDRG‐SOI expected readmission rate | 18.0 (7.4) | 20.5 (6.8) | 21.3 (7.5) | 13.5 (5.6) | <0.001 |
| Total admission FIM score | 68.7 (17.2) | 60.4 (18.6) | 69.1 (15.5) | 77.2 (11.7) | <0.001 |
FIM Score Category and Risk of Readmission
Figure 1 shows that patients in the low admission FIM score category had the highest unadjusted rate of readmission for each diagnostic category. In unadjusted analysis, Table 2 shows that younger age, male sex, APDRG‐SOI expected readmission rate, and orthopedic and medical diagnostic categories were associated with readmission. As a continuous variable, FIM scores were linearly associated with readmission (Figure 2), with an unadjusted odds ratio (OR) and 95% confidence interval (CI) of 1.4 (1.4‐1.4, P<0.001) for a 10‐point decrease in FIM. Compared to patients with high admission FIM scores, patients with low and middle FIM scores had higher unadjusted odds of readmission (OR: 4.0; 95% CI: 3.4‐4.7; P<0.001 and OR: 1.8; 95% CI: 1.5‐2.1; P<0.001, respectively). Mean FIM subscale scores for patients readmitted versus not readmitted were transfers (5.3 vs 7.0, P<0.001), locomotion (1.6 vs 2.3, P<0.001), self‐care (17.0 vs 20.8, P<0.001), communication (10.6 vs 11.5, P<0.001), and social cognition (15.1 vs 16.6, P<0.001).
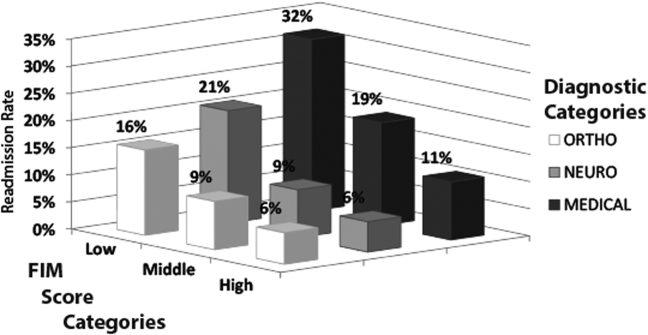
| Bivariable Analysisb | Multivariable Analysisb | |||||
|---|---|---|---|---|---|---|
| Characteristic | All Patients, N=9405 | Readmitted, n=1,182 | OR (95% CI) | P Value | OR (95% CI) | P Value |
| ||||||
| Age, y | 68.0 (14.2) | 66.4 (14.5) | 0.9 (0.91.0) | <0.001 | 0.9 (0.91.0) | <0.001 |
| Male | 3,431 (42%) | 637 (54%) | 1.6 (1.41.8) | <0.001 | 1.3 (1.11.5) | < 0.001 |
| Race | ||||||
| Caucasian | 5,340 (65%) | 766 (65%) | 1.0 | 1.0 | ||
| African American | 2,177 (26%) | 324 (27%) | 1.0 (0.91.2) | 0.60 | 1.0 (0.81.1) | 0.75 |
| Other | 706 (9%) | 92 (8%) | 0.9 (0.71.1) | 0.41 | 0.8 (0.61.0) | 0.12 |
| Married | 3,775 (46%) | 555 (47%) | 1.0 (0.91.2) | 0.50 | 1.0 (0.91.2) | 0.67 |
| Admission diagnosis category | ||||||
| Neurologic | 3,205 (39%) | 501 (42%) | 1.0 | 1.0 | ||
| Medical | 1,726 (21%) | 409 (35%) | 1.5 (1.31.7) | <0.001 | 1.8 (1.62.1) | < 0.001 |
| Orthopedic | 3,292 (40%) | 272 (23%) | 0.5 (0.50.6) | <0.001 | 1.3 (1.11.6) | 0.005 |
| APDRG‐SOI expected readmission rate | 17.4 (7.1%) | 22.2 (8.0%) | 1.1 (1.11.1) | <0.001 | 1.1 (1.01.1) | < 0.001 |
| Total FIM score category | ||||||
| High FIM, >76 points | 3,517 (43%) | 257 (22%) | 1.0 | 1.0 | ||
| Middle FIM, 60points | 2,742 (33%) | 353 (30%) | 1.8 (1.52.1) | <0.001 | 1.5 (1.31.8) | < 0.001 |
| Low FIM, <60 points | 1,964 (24%) | 572 (48%) | 4.0 (3.44.7) | <0.001 | 3.0 (2.53.6) | < 0.001 |
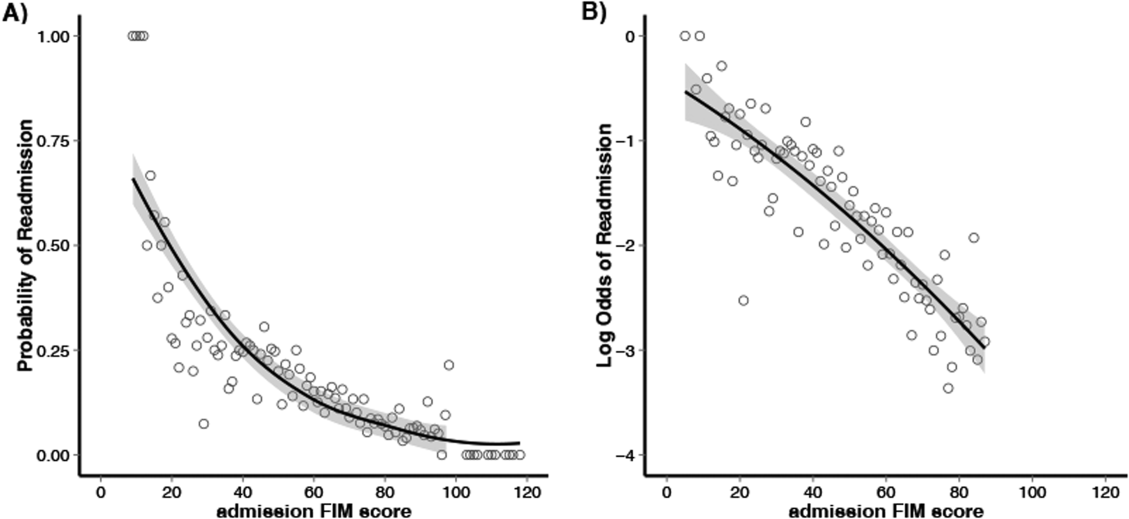
Multivariable and Subset Analyses
Patients with a primary medical diagnosis had higher odds of readmission to the hospital, (OR: 1.8; 95% CI: 1.6‐2.1, P<0.001), relative to patients with a neurologic or orthopedic diagnosis (Table 2). Across all diagnoses, the adjusted odds ratios (95% CIs) for the low and middle versus high FIM score category were 3.0 (2.5‐3.6; P<0.001) and 1.5 (1.3‐1.8; P<0.001) respectively (Table 2). When modeled as a continuous variable, a 10‐point decrease in FIM score was associated with a significantly increased adjusted readmission rate (OR: 1.4; 95% CI: 1.3‐1.4; P<0.001). In adjusted analysis including all subscales of the FIM, only the physical subscales, transfers (P<0.001), locomotion (P=0.002), and self‐care (P<0.001), were significantly associated with readmission. For each diagnostic category, there were similar significant associations between admission FIM score group and readmission status (Table 3). The odds of readmission by FIM score did not differ significantly across the 3 major diagnostic categories (P=0.20 for interaction term), suggesting that the effect of functional status was similar across various types of patients. We also did not observe a statistical interaction between age and FIM score group in predicting readmission (P=0.58). Patients in the lowest FIM group with a medical diagnosis had the highest adjusted readmission rate of 28.7% (Table 3).
| Multivariable Analysisa | Adjusted Readmission Ratesb | |||
|---|---|---|---|---|
| No. | OR (95% CI) | P Value | % (95% CI) | |
| ||||
| Neurologic | ||||
| High FIM (>76 points) | 755 | 1.0 | 7.3 (4.710.0) | |
| Middle FIM (6076 points) | 1,283 | 1.4 (1.02.1) | 0.06 | 9.1 (7.011.1) |
| Low FIM (<60 points) | 1,668 | 3.3 (2.34.7) | <0.001 | 18.7 (16.820.6) |
| Medical | ||||
| High FIM (>76 points) | 807 | 1.0 | 11.2 (8.114.3) | |
| Middle FIM (6076 points) | 766 | 1.8 (1.32.4) | <0.001 | 17.7 (14.520.9) |
| Low FIM (<60 points) | 562 | 3.2 (2.44.3) | <0.001 | 28.7 (25.132.4) |
| Orthopedic | ||||
| High FIM (>76 points) | 2,212 | 1.0 | 6.1 (4.77.6) | |
| Middle FIM (6076 points) | 1,046 | 1.4 (1.11.9) | 0.02 | 8.3 (6.410.1) |
| Low FIM (<60 points) | 306 | 2.2 (1.53.3) | <0.001 | 13.5 (10.416.7) |
DISCUSSION
In this study of 9405 consecutive patients admitted from acute care hospitals to a single inpatient rehabilitation facility, we investigated the association between functional status and readmission to an acute care hospital. We found that low functional status near the time of acute care hospital discharge was strongly associated with higher readmission rates. This relationship was consistently observed across major patient diagnostic categories, with low functioning medical patients having the highest rate of readmission (28.7%). Efforts to maintain or improve functional status during acute care hospitalization may be an important modifiable risk factor for acute care hospital readmission.
Previous studies have suggested that functional status may serve as an indicator of physiological reserve, and therefore vulnerability to medical complications and readmission.[6, 16, 23, 24, 25] Physiologic reserve refers to a person's ability to endure acute illness and is influenced by a number of factors, such as the adequacy of oxygen delivery to tissues, cardiovascular health, immune state, and nutritional status.[26] We found that motor subscales of the FIM score (transfers, locomotion, and self‐care), but not the other subscales, were independently associated with readmissions, which may suggest that lower motor scores are a stronger marker of physiologic reserve.[10, 16, 27] Although not our primary focus, we did note in our multivariable models that after adjusting for functional status, patients in a medical diagnostic category had higher readmission rates compared to patients with a primary neurologic or orthopedic diagnosis, but the impact of FIM score was consistent across all these diagnostic categories. We speculate that medical conditions that result in hospitalization, such as sepsis or acute kidney failure, may be more likely to result in multiorgan dysfunction that may impair physiological reserve and increase susceptibility to medical complications.[28, 29, 30, 31] In comparison, acute neurologic and orthopedic diagnoses, such as stroke or hip arthroplasty, directly impair gross motor function,[32, 33, 34, 35] with relative sparing of overall physiologic reserve.
The association between low functional status and readmissions is supported by previous studies across multiple hospital settings.[4, 5, 7, 8, 9, 27, 36] Despite this finding, routine inpatient medical practice may not fully address functional impairments. For instance, systematic measurement and documentation of functional status on admission and during hospitalization are not routine and may be a barrier to identifying medical patients at high risk for readmission.[37, 38, 39] Moreover, without recognition of functional impairment and its implications, current clinical practice may suboptimally prevent and treat physical impairments during inpatient care. However, such barriers can be surmounted. For example, in the medical intensive care unit setting, there is growing recognition that proactive and aggressive management of hospital‐acquired functional impairments through early rehabilitation is safe and feasible, improving patient outcomes while reducing hospital costs and readmissions.[3, 40, 41, 42, 43, 44, 45, 46, 47, 48, 49, 50, 51] Moreover, 2 recent meta‐analyses have shown that physical therapy hospital‐based exercise programs can improve length of stay, overall hospital costs, and rates of discharge to home.[52, 53] Finally, a randomized trial has demonstrated that an individualized exercise regimen started in the acute hospital setting with long‐term telephone follow‐up can significantly reduce emergency hospital readmissions and improve quality of life in older adults.[54] Therefore, decreased functional status likely represents a modifiable risk factor for hospital readmission, and further research is necessary to more systematically identify low‐functioning patients and implement early mobility and activity programs to reduce hospital‐acquired functional impairment.[2, 49, 55]
Our analysis has potential limitations. First, this was an observational study and we are unable to demonstrate a direct cause‐and‐effect relationship between functional status and readmission. However, our results are consistent with prior literature in this field. Second, our cohort only included patients who were discharged from an acute hospital to a rehabilitation facility, which may limit its generalizability. However, we included a large patient sample size with a broad range of admission FIM scores, and our findings are consistent with other studies conducted in different clinical settings. Third, although 1 of our goals was to evaluate how readmission rates differed by diagnostic category, it is possible that individual diagnoses within each category may have different risks for readmission, and future larger studies could evaluate more detailed diagnostic grouping approaches. Fourth, we also recognize that although FIM score assessment has been validated, admission assessment occurs over a 72‐hour time period, during which patients' function could potentially change a clinically meaningful degree. Fifth, there may be residual confounding because of limitations in available data within our administrative dataset; however, we did account for severity of illness using a standardized measure, and prior research has demonstrated that the relationship between functional status and readmissions may be minimally confounded by demographic and clinical variables.[8, 16, 27, 56] Finally, we lacked readmission data following discharge from rehabilitation; it is possible that the association between FIM score at the time of rehabilitation initiation may have had limited predictive value among patients who successfully completed rehabilitation and were sent home.
CONCLUSION
In conclusion, in this study of patients admitted from acute care hospitals to a single inpatient rehabilitation facility, we observed a strong association between decreased functional status and increased hospital readmission. In particular, medical patients with lower physical functioning exhibited an especially high rate of readmission. Incorporating functional status assessment into routine medical care may help identify patients at higher risk of readmission. Moreover, preventing and treating impaired functional status during inpatient admission, through early activity and mobility, should be evaluated as a way of improving patient outcomes and reducing hospital readmissions.
Disclosures: Erik Hoyer, MD, is supported by the Rehabilitation Medicine Scientist Training Program (RMSTP; 5K12HD001097). The authors report no conflicts of interest.
- , , . Rehospitalizations among patients in the Medicare fee‐for‐service program. N Engl J Med. 2009;360(14):1418–1428.
- . Post‐hospital syndrome—an acquired, transient condition of generalized risk. N Engl J Med. 2013;368(2):100–102.
- , , , et al. Receiving early mobility during an intensive care unit admission is a predictor of improved outcomes in acute respiratory failure. Am J Med Sci. 2011;341(5):373–377.
- , . Association of physical functioning with same‐hospital readmission after stroke. Am J Phys Med Rehabil. 2004;83(6):434–438.
- , , , . Posthospital care transitions: patterns, complications, and risk identification. Health Serv Res. 2004;39(5):1449–1465.
- , , , , , . Risk factors for nonelective hospital readmissions. J Gen Intern Med. 1996;11(12):762–764.
- , , , et al. Risk prediction models for hospital readmission: a systematic review. JAMA. 2011;306(15):1688–1698.
- , , , et al. Hospital readmission in persons with stroke following postacute inpatient rehabilitation. J Gerontol A Biol Sci Med Sci. 2012;67(8):875–881.
- , , , , , . Hospital readmission of persons with hip fracture following medical rehabilitation. Arch Gerontol Geriatr. 2003;36(1):15–22.
- , , , , , . Characteristics of persons rehospitalized after stroke rehabilitation. Arch Phys Med Rehabil. 2001;82(10):1367–1374.
- , , , et al. A classification system for inpatient rehabilitation patients: a review and proposed revisions to the functional independence measure‐function related groups. PB98–105992, September. Washington, DC: US Department of Commerce, National Technical Information Services; 1997.
- , , , , , . A case‐mix classification system for medical rehabilitation. Med Care. 1994;32(4):366–379.
- , , , . The reliability of the functional independence measure: a quantitative review. Arch Phys Med Rehabil. 1996;77(12):1226–1232.
- , , , , , . Four methods for characterizing disability in the formation of function related groups. Arch Phys Med Rehabil. 1994;75(12):1277–1283.
- , , , et al. Association of self‐reported hospital discharge handoffs with 30‐day readmissions. JAMA Intern Med. 2013;173(8):624–629.
- , , , , , . Functional status impairment is associated with unplanned readmissions. Arch Phys Med Rehabil. 2013;94(10):1951–1958.
- , , , et al. All patient refined diagnosis related groups (APR‐DRGs). Version 15.0. Report No.: 98‐054 Rev. 00. Wallingford, CT: 3M Health Information Systems; 1998.
- The inpatient rehabilitation facility–patient assessment instrument (IRF‐PAI) training manual. 2012. http://www.cms.gov/.
- , , , et al. Relationships between disability measures and nursing effort during medical rehabilitation for patients with traumatic brain and spinal cord injury. Arch Phys Med Rehabil. 1997;78(2):143–149.
- , , , . Interrater reliability of the 7‐level functional independence measure (FIM). Scand J Rehabil Med. 1994;26(3):115–119.
- , , , , , . Comparison of logistic regression and neural networks to predict rehospitalization in patients with stroke. J Clin Epidemiol. 2001;54(11):1159–1165.
- , , . Comparison of the responsiveness of the Barthel Index and the motor component of the Functional Independence Measure in stroke: the impact of using different methods for measuring responsiveness. J Clin Epidemiol. 2002;55(9):922–928.
- , . Prediction of hospital readmission for heart failure: development of a simple risk score based on administrative data. J Am Coll Cardiol. 1999;33(6):1560–1566.
- , , . Are all readmissions bad readmissions? N Engl J Med. 2010;363(3):297–298.
- , . Hospital readmission as an accountability measure. JAMA. 2011;305(5):504–505.
- . Susceptibility to critical illness: reserve, response and therapy. Intensive Care Med. 2000;26(suppl 1):S57–S63.
- , , , , . Predictors of discharge to acute care after inpatient rehabilitation in severely affected stroke patients. Am J Phys Med Rehabil. 2012;91(5):387–392.
- , , , et al. Clinical characteristics and outcomes of sepsis‐related vs non‐sepsis‐related ARDS. Chest. 2010;138(3):559–567.
- , . Long‐term outcomes from sepsis. Curr Infect Dis Rep. 2007;9(5):382–386.
- , . Heart failure performance measures and outcomes: real or illusory gains. JAMA. 2009;302(7):792–794.
- , , , , . Patients' self‐assessed functional status in heart failure by new york heart association class: a prognostic predictor of hospitalizations, quality of life and death. J Card Fail. 2010;16(2):150–156.
- , , , et al. Knee arthroplasty: disabilities in comparison to the general population and to hip arthroplasty using a French national longitudinal survey. PLoS One. 2008;3(7):e2561.
- , , , et al. Gait asymmetry in community‐ambulating stroke survivors. Arch Phys Med Rehabil. 2008;89(2):304–310.
- , , , . Recovery of upper extremity function in stroke patients: The Copenhagen Stroke Study. Arch Phys Med Rehabil. 1994;75(4):394–398.
- , , , , , . The effect of admission physiological variables on 30 day outcome after stroke. J Clin Neurosci. 2005;12(8):905–910.
- , , , et al. Unplanned readmissions after hospital discharge among patients identified as being at high risk for readmission using a validated predictive algorithm. Open Med. 2011;5(2):e104–e111.
- . Can hospitalization‐associated disability be prevented? JAMA. 2011;306(16):1800–1801.
- , , . Hospitalization‐associated disability: “she was probably able to ambulate, but I'm not sure.” JAMA. 2011;306(16):1782–1793.
- , , , , , . Importance of functional measures in predicting mortality among older hospitalized patients. JAMA. 1998;279(15):1187–1193.
- . Mobilizing patients in the intensive care unit: improving neuromuscular weakness and physical function. JAMA. 2008;300(14):1685–1690.
- , , . Technology to enhance physical rehabilitation of critically ill patients. Crit Care Med. 2009;37(10 suppl):S436–S441.
- , , , et al. Early physical medicine and rehabilitation for patients with acute respiratory failure: a quality improvement project. Arch Phys Med Rehabil. 2010;91(4):536–542.
- , , , et al. ICU early physical rehabilitation programs: financial modeling of cost savings. Crit Care Med. 2013;41(3):717–724.
- , , , et al. Early physical and occupational therapy in mechanically ventilated, critically ill patients: a randomised controlled trial. Lancet. 2009;373(9678):1874–1882.
- , , , et al. Early intensive care unit mobility therapy in the treatment of acute respiratory failure. Crit Care Med. 2008;36(8):2238–2243.
- , , , et al. Early activity is feasible and safe in respiratory failure patients. Crit Care Med. 2007;35(1):139–145.
- , . Rehabilitation quality improvement in an intensive care unit setting: implementation of a quality improvement model. Top Stroke Rehabil. 2010;17(4):271–281.
- , , , , . Sustainability and scalability of the hospital elder life program at a community hospital. J Am Geriatr Soc. 2011;59(2):359–365.
- , , , et al. A multicomponent intervention to prevent delirium in hospitalized older patients. N Engl J Med. 1999;340(9):669–676.
- , , , et al. Functional disability 5 years after acute respiratory distress syndrome. N Engl J Med. 2011;364(14):1293–1304.
- , , , et al. Rehabilitation therapy and outcomes in acute respiratory failure: an observational pilot project. J Crit Care. 2010;25(2):254–262.
- , , . Exercise for acutely hospitalised older medical patients. Cochrane Database Syst Rev. 2007;(1):CD005955.
- , , . Extra physical therapy reduces patient length of stay and improves functional outcomes and quality of life in people with acute or subacute conditions: a systematic review. Arch Phys Med Rehabil. 2011;92(9):1490–1500.
- , , , , , . Fewer emergency readmissions and better quality of life for older adults at risk of hospital readmission: a randomized controlled trial to determine the effectiveness of a 24‐week exercise and telephone follow‐up program. J Am Geriatr Soc. 2009;57(3):395–402.
- , , , , , . Effects of an acute care for elders unit on costs and 30‐day readmissions. JAMA Intern Med. 2013:1–7.
- , , , , . Risks of acute hospital transfer and mortality during stroke rehabilitation. Arch Phys Med Rehabil. 2003;84(5):712–718.
Federally mandated pay‐for‐performance initiatives promote minimizing 30‐day hospital readmissions to improve healthcare quality and reduce costs. Although the reasons for readmissions are multifactorial, many patients are readmitted for a condition other than their initial hospital admitting diagnosis.[1] Impairments in functional status experienced during acute care hospitalization contribute to patients being discharged in a debilitated state and being vulnerable to postdischarge complications and potentially hospital readmission.[2] As such, decreased functional status may be an important and potentially modifiable risk factor for acute care hospital readmission.[3]
Previous studies have suggested that impaired functional status may be an important predictor of rehospitalization.[4, 5, 6, 7] However, inferences from existing studies are limited because they did not consider functional status as their primary focus, they only considered specific patient populations (eg, stroke) or readmissions occurring well beyond the 30‐day period defined by federal pay‐for‐performance standards.[4, 5, 6, 8, 9, 10] Our objective was to evaluate the association between functional status near the time of discharge from acute care hospital and 30‐day readmission for patients admitted to an acute inpatient rehabilitation facility. As a secondary objective, we sought to investigate the relationship between functional status and readmission by diagnostic category (medical, neurologic, or orthopedic).
METHODS
Study Population and Setting
We conducted a single‐center, retrospective study of patients admitted to an inpatient rehabilitation facility at a community hospital between July 1, 2006 and December 31, 2012. This facility provides intensive rehabilitation consisting of 3 hours of therapy per day, skilled nursing care on a 24‐hour basis, and medical care by a physiatrist. We excluded patients who died during inpatient rehabilitation (n=15, 0.2%) and patients not admitted directly from an acute care setting (n=178, 2.0%).
Data Source and Covariates
Data were derived from the Uniform Data System for Medical Rehabilitation (UDSMR), which is an administrative database providing the following data upon admission to an inpatient rehabilitation facility[11, 12, 13]: age, gender, race/ethnicity, marital status, the discharge setting, the admission Functional Independence Measure (FIM) score (details further below), and admission diagnostic category as defined by the primary discharge diagnosis from the acute care hospital and grouped by functional related groups (a case‐mix system for medical rehabilitation).[12, 14] The 3M ClinTrac management software (3M, St. Paul, MN), used for mandatory reporting to the State of Maryland, provided all‐payerrefined diagnosis related group (APRDRG) and severity of illness (SOI) combinations (a tool to group patients into clinically comparable disease and severity‐of‐illness categories expected to use similar resources and experience similar outcomes). The University HealthSystem Consortium (UHC) database provided national readmission rates for all APRDRG‐SOI combinations using a methodology that has been previously described.[15, 16] Expected readmission rates for APRDRG‐SOI combinations served as a patient risk stratification tool based on clinical logic that evaluates age, comorbidities, principal diagnosis during hospitalization, and procedures conducted during hospitalization.[17]
Primary Outcome: Acute Care Readmission
The primary outcome was all‐cause acute care readmission, defined as patient transfer to an acute care hospital during inpatient rehabilitation within 30 days from admission to inpatient rehabilitation. The care model for our inpatient rehabilitation unit is such that when patients become sick or develop a complication, they are admitted directly to a clinical unit (eg, intensive care unit) at the community hospital through a rapid‐response intervention, or the physiatrist arranges with an admitting inpatient attending to accept the patient directly to his or her service.
Primary Exposure: Functional Independence Measure
Functional status was measured using the FIM score.[18] The FIM score is an 18‐item measure of functional status, with each item scored on a scale from 1 to 7 (dependent to independent). Various aspects of motor function and cognitive function are assessed. The FIM has been validated and shown to be reliable and reproducible.[13, 19, 20] By definition for the FIM instrument, admission FIM scores are assessed by trained multidisciplinary personnel first over the 72 hours of the rehabilitation stay, and for this study served as a proxy for patient functional status upon discharge from the acute care setting in our analysis. This 72‐hour time window allows for full assessment by therapists and nurses; however, in clinical practice at the inpatient rehabilitation unit involved in this study, much of the FIM assessment occurs within the first 24 hours of the rehabilitation stay. For our analysis, we divided FIM scores into low, medium, and high functional groups. The thresholds for these groups were based on total FIM score tertiles from a prior study<60, 60 to 76, and >76.[16] As a secondary analysis we created 6 subscales of the overall FIM score based on previous research. These subscales included: transfers (transfer to chair/wheelchair, toilet, and tub/shower), locomotion (walking and stairs), self‐care (eating, grooming, bathing, dressing, and toileting), sphincter control (bladder and bowel management), communication (comprehension and expression), and social cognition (social interaction, problem solving, and memory).[21]
Statistical Analysis
To evaluate differences in patient characteristics by diagnostic category, analysis of variance and 2 tests were used for continuous and dichotomous variables, respectively. Logistic regression was used to evaluate the association between FIM score category and readmission status, adjusting for potentially confounding variables available from the UDSMR and UHC databases. We used interaction terms to test whether the association between the FIM score and readmissions varied significantly across diagnostic categories and by age. As a secondary analysis, we modeled FIM score as a continuous variable. We expressed the odds ratio in this analysis per 10‐point change in FIM, because this represents a clinically relevant change in function.[22] Logistic regression was also used to evaluate the association between FIM subscale scores (transfers, locomotion, self‐care, sphincter control, communication, and social cognition) and readmission status. Statistical significance was defined as a 2‐sided P<0.05. Data were analyzed with R (version 2.15.0;
RESULTS
Readmitted Patients and Diagnostic Categories
A total of 9405 consecutive eligible patients were admitted to the acute inpatient rehabilitation facility between July 1, 2006 and December 31, 2012. A total of 1182 (13%) patients were readmitted back to an acute care hospital from inpatient rehabilitation. Median (interquartile range) time to readmission from acute care hospital discharge was 6 days (310 days), and median length of stay for patients who were discharged to the community from inpatient rehabilitation was 8 days (612 days).
Table 1 shows characteristics of all inpatient rehabilitation patients by diagnostic category. For the neurologic category, the most common primary diagnoses were stroke and spinal cord injury; for the medical category, infection, renal failure, congestive heart failure, and chronic obstructive pulmonary disease; and for the orthopedic category, spinal arthrodesis, knee and hip replacements. Mean FIM scores were lowest and highest for patients admitted with a primarily neurologic and orthopedic diagnosis, respectively.
| Characteristic | All Patients, N=9405 | Diagnostic Category | |||
|---|---|---|---|---|---|
| Neurologic, n=3706 | Medical, n=2135 | Orthopedic, n=3564 | P Valueb | ||
| |||||
| Age, y | 67.8 (14.2) | 66.7 (15.3) | 67.0 (14.9) | 69.3 (12.4) | <0.001 |
| Male | 4,068 (43%) | 1,816 (49%) | 1,119 (52%) | 1,133 (32%) | <0.001 |
| Race | <0.001 | ||||
| Caucasian | 6,106 (65%) | 2344 (63%) | 1,320 (62%) | 2,442 (69%) | |
| African American | 2,501 (27%) | 984 (27%) | 658 (31%) | 859 (24%) | |
| Other | 798 (8%) | 378 (10%) | 157 (7%) | 263 (7%) | |
| Married | 4,330 (46%) | 1,683 (45%) | 931 (44%) | 1,716 (48%) | 0.002 |
| APRDRG‐SOI expected readmission rate | 18.0 (7.4) | 20.5 (6.8) | 21.3 (7.5) | 13.5 (5.6) | <0.001 |
| Total admission FIM score | 68.7 (17.2) | 60.4 (18.6) | 69.1 (15.5) | 77.2 (11.7) | <0.001 |
FIM Score Category and Risk of Readmission
Figure 1 shows that patients in the low admission FIM score category had the highest unadjusted rate of readmission for each diagnostic category. In unadjusted analysis, Table 2 shows that younger age, male sex, APDRG‐SOI expected readmission rate, and orthopedic and medical diagnostic categories were associated with readmission. As a continuous variable, FIM scores were linearly associated with readmission (Figure 2), with an unadjusted odds ratio (OR) and 95% confidence interval (CI) of 1.4 (1.4‐1.4, P<0.001) for a 10‐point decrease in FIM. Compared to patients with high admission FIM scores, patients with low and middle FIM scores had higher unadjusted odds of readmission (OR: 4.0; 95% CI: 3.4‐4.7; P<0.001 and OR: 1.8; 95% CI: 1.5‐2.1; P<0.001, respectively). Mean FIM subscale scores for patients readmitted versus not readmitted were transfers (5.3 vs 7.0, P<0.001), locomotion (1.6 vs 2.3, P<0.001), self‐care (17.0 vs 20.8, P<0.001), communication (10.6 vs 11.5, P<0.001), and social cognition (15.1 vs 16.6, P<0.001).
| Bivariable Analysisb | Multivariable Analysisb | |||||
|---|---|---|---|---|---|---|
| Characteristic | All Patients, N=9405 | Readmitted, n=1,182 | OR (95% CI) | P Value | OR (95% CI) | P Value |
| ||||||
| Age, y | 68.0 (14.2) | 66.4 (14.5) | 0.9 (0.91.0) | <0.001 | 0.9 (0.91.0) | <0.001 |
| Male | 3,431 (42%) | 637 (54%) | 1.6 (1.41.8) | <0.001 | 1.3 (1.11.5) | < 0.001 |
| Race | ||||||
| Caucasian | 5,340 (65%) | 766 (65%) | 1.0 | 1.0 | ||
| African American | 2,177 (26%) | 324 (27%) | 1.0 (0.91.2) | 0.60 | 1.0 (0.81.1) | 0.75 |
| Other | 706 (9%) | 92 (8%) | 0.9 (0.71.1) | 0.41 | 0.8 (0.61.0) | 0.12 |
| Married | 3,775 (46%) | 555 (47%) | 1.0 (0.91.2) | 0.50 | 1.0 (0.91.2) | 0.67 |
| Admission diagnosis category | ||||||
| Neurologic | 3,205 (39%) | 501 (42%) | 1.0 | 1.0 | ||
| Medical | 1,726 (21%) | 409 (35%) | 1.5 (1.31.7) | <0.001 | 1.8 (1.62.1) | < 0.001 |
| Orthopedic | 3,292 (40%) | 272 (23%) | 0.5 (0.50.6) | <0.001 | 1.3 (1.11.6) | 0.005 |
| APDRG‐SOI expected readmission rate | 17.4 (7.1%) | 22.2 (8.0%) | 1.1 (1.11.1) | <0.001 | 1.1 (1.01.1) | < 0.001 |
| Total FIM score category | ||||||
| High FIM, >76 points | 3,517 (43%) | 257 (22%) | 1.0 | 1.0 | ||
| Middle FIM, 60points | 2,742 (33%) | 353 (30%) | 1.8 (1.52.1) | <0.001 | 1.5 (1.31.8) | < 0.001 |
| Low FIM, <60 points | 1,964 (24%) | 572 (48%) | 4.0 (3.44.7) | <0.001 | 3.0 (2.53.6) | < 0.001 |
Multivariable and Subset Analyses
Patients with a primary medical diagnosis had higher odds of readmission to the hospital, (OR: 1.8; 95% CI: 1.6‐2.1, P<0.001), relative to patients with a neurologic or orthopedic diagnosis (Table 2). Across all diagnoses, the adjusted odds ratios (95% CIs) for the low and middle versus high FIM score category were 3.0 (2.5‐3.6; P<0.001) and 1.5 (1.3‐1.8; P<0.001) respectively (Table 2). When modeled as a continuous variable, a 10‐point decrease in FIM score was associated with a significantly increased adjusted readmission rate (OR: 1.4; 95% CI: 1.3‐1.4; P<0.001). In adjusted analysis including all subscales of the FIM, only the physical subscales, transfers (P<0.001), locomotion (P=0.002), and self‐care (P<0.001), were significantly associated with readmission. For each diagnostic category, there were similar significant associations between admission FIM score group and readmission status (Table 3). The odds of readmission by FIM score did not differ significantly across the 3 major diagnostic categories (P=0.20 for interaction term), suggesting that the effect of functional status was similar across various types of patients. We also did not observe a statistical interaction between age and FIM score group in predicting readmission (P=0.58). Patients in the lowest FIM group with a medical diagnosis had the highest adjusted readmission rate of 28.7% (Table 3).
| Multivariable Analysisa | Adjusted Readmission Ratesb | |||
|---|---|---|---|---|
| No. | OR (95% CI) | P Value | % (95% CI) | |
| ||||
| Neurologic | ||||
| High FIM (>76 points) | 755 | 1.0 | 7.3 (4.710.0) | |
| Middle FIM (6076 points) | 1,283 | 1.4 (1.02.1) | 0.06 | 9.1 (7.011.1) |
| Low FIM (<60 points) | 1,668 | 3.3 (2.34.7) | <0.001 | 18.7 (16.820.6) |
| Medical | ||||
| High FIM (>76 points) | 807 | 1.0 | 11.2 (8.114.3) | |
| Middle FIM (6076 points) | 766 | 1.8 (1.32.4) | <0.001 | 17.7 (14.520.9) |
| Low FIM (<60 points) | 562 | 3.2 (2.44.3) | <0.001 | 28.7 (25.132.4) |
| Orthopedic | ||||
| High FIM (>76 points) | 2,212 | 1.0 | 6.1 (4.77.6) | |
| Middle FIM (6076 points) | 1,046 | 1.4 (1.11.9) | 0.02 | 8.3 (6.410.1) |
| Low FIM (<60 points) | 306 | 2.2 (1.53.3) | <0.001 | 13.5 (10.416.7) |
DISCUSSION
In this study of 9405 consecutive patients admitted from acute care hospitals to a single inpatient rehabilitation facility, we investigated the association between functional status and readmission to an acute care hospital. We found that low functional status near the time of acute care hospital discharge was strongly associated with higher readmission rates. This relationship was consistently observed across major patient diagnostic categories, with low functioning medical patients having the highest rate of readmission (28.7%). Efforts to maintain or improve functional status during acute care hospitalization may be an important modifiable risk factor for acute care hospital readmission.
Previous studies have suggested that functional status may serve as an indicator of physiological reserve, and therefore vulnerability to medical complications and readmission.[6, 16, 23, 24, 25] Physiologic reserve refers to a person's ability to endure acute illness and is influenced by a number of factors, such as the adequacy of oxygen delivery to tissues, cardiovascular health, immune state, and nutritional status.[26] We found that motor subscales of the FIM score (transfers, locomotion, and self‐care), but not the other subscales, were independently associated with readmissions, which may suggest that lower motor scores are a stronger marker of physiologic reserve.[10, 16, 27] Although not our primary focus, we did note in our multivariable models that after adjusting for functional status, patients in a medical diagnostic category had higher readmission rates compared to patients with a primary neurologic or orthopedic diagnosis, but the impact of FIM score was consistent across all these diagnostic categories. We speculate that medical conditions that result in hospitalization, such as sepsis or acute kidney failure, may be more likely to result in multiorgan dysfunction that may impair physiological reserve and increase susceptibility to medical complications.[28, 29, 30, 31] In comparison, acute neurologic and orthopedic diagnoses, such as stroke or hip arthroplasty, directly impair gross motor function,[32, 33, 34, 35] with relative sparing of overall physiologic reserve.
The association between low functional status and readmissions is supported by previous studies across multiple hospital settings.[4, 5, 7, 8, 9, 27, 36] Despite this finding, routine inpatient medical practice may not fully address functional impairments. For instance, systematic measurement and documentation of functional status on admission and during hospitalization are not routine and may be a barrier to identifying medical patients at high risk for readmission.[37, 38, 39] Moreover, without recognition of functional impairment and its implications, current clinical practice may suboptimally prevent and treat physical impairments during inpatient care. However, such barriers can be surmounted. For example, in the medical intensive care unit setting, there is growing recognition that proactive and aggressive management of hospital‐acquired functional impairments through early rehabilitation is safe and feasible, improving patient outcomes while reducing hospital costs and readmissions.[3, 40, 41, 42, 43, 44, 45, 46, 47, 48, 49, 50, 51] Moreover, 2 recent meta‐analyses have shown that physical therapy hospital‐based exercise programs can improve length of stay, overall hospital costs, and rates of discharge to home.[52, 53] Finally, a randomized trial has demonstrated that an individualized exercise regimen started in the acute hospital setting with long‐term telephone follow‐up can significantly reduce emergency hospital readmissions and improve quality of life in older adults.[54] Therefore, decreased functional status likely represents a modifiable risk factor for hospital readmission, and further research is necessary to more systematically identify low‐functioning patients and implement early mobility and activity programs to reduce hospital‐acquired functional impairment.[2, 49, 55]
Our analysis has potential limitations. First, this was an observational study and we are unable to demonstrate a direct cause‐and‐effect relationship between functional status and readmission. However, our results are consistent with prior literature in this field. Second, our cohort only included patients who were discharged from an acute hospital to a rehabilitation facility, which may limit its generalizability. However, we included a large patient sample size with a broad range of admission FIM scores, and our findings are consistent with other studies conducted in different clinical settings. Third, although 1 of our goals was to evaluate how readmission rates differed by diagnostic category, it is possible that individual diagnoses within each category may have different risks for readmission, and future larger studies could evaluate more detailed diagnostic grouping approaches. Fourth, we also recognize that although FIM score assessment has been validated, admission assessment occurs over a 72‐hour time period, during which patients' function could potentially change a clinically meaningful degree. Fifth, there may be residual confounding because of limitations in available data within our administrative dataset; however, we did account for severity of illness using a standardized measure, and prior research has demonstrated that the relationship between functional status and readmissions may be minimally confounded by demographic and clinical variables.[8, 16, 27, 56] Finally, we lacked readmission data following discharge from rehabilitation; it is possible that the association between FIM score at the time of rehabilitation initiation may have had limited predictive value among patients who successfully completed rehabilitation and were sent home.
CONCLUSION
In conclusion, in this study of patients admitted from acute care hospitals to a single inpatient rehabilitation facility, we observed a strong association between decreased functional status and increased hospital readmission. In particular, medical patients with lower physical functioning exhibited an especially high rate of readmission. Incorporating functional status assessment into routine medical care may help identify patients at higher risk of readmission. Moreover, preventing and treating impaired functional status during inpatient admission, through early activity and mobility, should be evaluated as a way of improving patient outcomes and reducing hospital readmissions.
Disclosures: Erik Hoyer, MD, is supported by the Rehabilitation Medicine Scientist Training Program (RMSTP; 5K12HD001097). The authors report no conflicts of interest.
- , , . Rehospitalizations among patients in the Medicare fee‐for‐service program. N Engl J Med. 2009;360(14):1418–1428.
- . Post‐hospital syndrome—an acquired, transient condition of generalized risk. N Engl J Med. 2013;368(2):100–102.
- , , , et al. Receiving early mobility during an intensive care unit admission is a predictor of improved outcomes in acute respiratory failure. Am J Med Sci. 2011;341(5):373–377.
- , . Association of physical functioning with same‐hospital readmission after stroke. Am J Phys Med Rehabil. 2004;83(6):434–438.
- , , , . Posthospital care transitions: patterns, complications, and risk identification. Health Serv Res. 2004;39(5):1449–1465.
- , , , , , . Risk factors for nonelective hospital readmissions. J Gen Intern Med. 1996;11(12):762–764.
- , , , et al. Risk prediction models for hospital readmission: a systematic review. JAMA. 2011;306(15):1688–1698.
- , , , et al. Hospital readmission in persons with stroke following postacute inpatient rehabilitation. J Gerontol A Biol Sci Med Sci. 2012;67(8):875–881.
- , , , , , . Hospital readmission of persons with hip fracture following medical rehabilitation. Arch Gerontol Geriatr. 2003;36(1):15–22.
- , , , , , . Characteristics of persons rehospitalized after stroke rehabilitation. Arch Phys Med Rehabil. 2001;82(10):1367–1374.
- , , , et al. A classification system for inpatient rehabilitation patients: a review and proposed revisions to the functional independence measure‐function related groups. PB98–105992, September. Washington, DC: US Department of Commerce, National Technical Information Services; 1997.
- , , , , , . A case‐mix classification system for medical rehabilitation. Med Care. 1994;32(4):366–379.
- , , , . The reliability of the functional independence measure: a quantitative review. Arch Phys Med Rehabil. 1996;77(12):1226–1232.
- , , , , , . Four methods for characterizing disability in the formation of function related groups. Arch Phys Med Rehabil. 1994;75(12):1277–1283.
- , , , et al. Association of self‐reported hospital discharge handoffs with 30‐day readmissions. JAMA Intern Med. 2013;173(8):624–629.
- , , , , , . Functional status impairment is associated with unplanned readmissions. Arch Phys Med Rehabil. 2013;94(10):1951–1958.
- , , , et al. All patient refined diagnosis related groups (APR‐DRGs). Version 15.0. Report No.: 98‐054 Rev. 00. Wallingford, CT: 3M Health Information Systems; 1998.
- The inpatient rehabilitation facility–patient assessment instrument (IRF‐PAI) training manual. 2012. http://www.cms.gov/.
- , , , et al. Relationships between disability measures and nursing effort during medical rehabilitation for patients with traumatic brain and spinal cord injury. Arch Phys Med Rehabil. 1997;78(2):143–149.
- , , , . Interrater reliability of the 7‐level functional independence measure (FIM). Scand J Rehabil Med. 1994;26(3):115–119.
- , , , , , . Comparison of logistic regression and neural networks to predict rehospitalization in patients with stroke. J Clin Epidemiol. 2001;54(11):1159–1165.
- , , . Comparison of the responsiveness of the Barthel Index and the motor component of the Functional Independence Measure in stroke: the impact of using different methods for measuring responsiveness. J Clin Epidemiol. 2002;55(9):922–928.
- , . Prediction of hospital readmission for heart failure: development of a simple risk score based on administrative data. J Am Coll Cardiol. 1999;33(6):1560–1566.
- , , . Are all readmissions bad readmissions? N Engl J Med. 2010;363(3):297–298.
- , . Hospital readmission as an accountability measure. JAMA. 2011;305(5):504–505.
- . Susceptibility to critical illness: reserve, response and therapy. Intensive Care Med. 2000;26(suppl 1):S57–S63.
- , , , , . Predictors of discharge to acute care after inpatient rehabilitation in severely affected stroke patients. Am J Phys Med Rehabil. 2012;91(5):387–392.
- , , , et al. Clinical characteristics and outcomes of sepsis‐related vs non‐sepsis‐related ARDS. Chest. 2010;138(3):559–567.
- , . Long‐term outcomes from sepsis. Curr Infect Dis Rep. 2007;9(5):382–386.
- , . Heart failure performance measures and outcomes: real or illusory gains. JAMA. 2009;302(7):792–794.
- , , , , . Patients' self‐assessed functional status in heart failure by new york heart association class: a prognostic predictor of hospitalizations, quality of life and death. J Card Fail. 2010;16(2):150–156.
- , , , et al. Knee arthroplasty: disabilities in comparison to the general population and to hip arthroplasty using a French national longitudinal survey. PLoS One. 2008;3(7):e2561.
- , , , et al. Gait asymmetry in community‐ambulating stroke survivors. Arch Phys Med Rehabil. 2008;89(2):304–310.
- , , , . Recovery of upper extremity function in stroke patients: The Copenhagen Stroke Study. Arch Phys Med Rehabil. 1994;75(4):394–398.
- , , , , , . The effect of admission physiological variables on 30 day outcome after stroke. J Clin Neurosci. 2005;12(8):905–910.
- , , , et al. Unplanned readmissions after hospital discharge among patients identified as being at high risk for readmission using a validated predictive algorithm. Open Med. 2011;5(2):e104–e111.
- . Can hospitalization‐associated disability be prevented? JAMA. 2011;306(16):1800–1801.
- , , . Hospitalization‐associated disability: “she was probably able to ambulate, but I'm not sure.” JAMA. 2011;306(16):1782–1793.
- , , , , , . Importance of functional measures in predicting mortality among older hospitalized patients. JAMA. 1998;279(15):1187–1193.
- . Mobilizing patients in the intensive care unit: improving neuromuscular weakness and physical function. JAMA. 2008;300(14):1685–1690.
- , , . Technology to enhance physical rehabilitation of critically ill patients. Crit Care Med. 2009;37(10 suppl):S436–S441.
- , , , et al. Early physical medicine and rehabilitation for patients with acute respiratory failure: a quality improvement project. Arch Phys Med Rehabil. 2010;91(4):536–542.
- , , , et al. ICU early physical rehabilitation programs: financial modeling of cost savings. Crit Care Med. 2013;41(3):717–724.
- , , , et al. Early physical and occupational therapy in mechanically ventilated, critically ill patients: a randomised controlled trial. Lancet. 2009;373(9678):1874–1882.
- , , , et al. Early intensive care unit mobility therapy in the treatment of acute respiratory failure. Crit Care Med. 2008;36(8):2238–2243.
- , , , et al. Early activity is feasible and safe in respiratory failure patients. Crit Care Med. 2007;35(1):139–145.
- , . Rehabilitation quality improvement in an intensive care unit setting: implementation of a quality improvement model. Top Stroke Rehabil. 2010;17(4):271–281.
- , , , , . Sustainability and scalability of the hospital elder life program at a community hospital. J Am Geriatr Soc. 2011;59(2):359–365.
- , , , et al. A multicomponent intervention to prevent delirium in hospitalized older patients. N Engl J Med. 1999;340(9):669–676.
- , , , et al. Functional disability 5 years after acute respiratory distress syndrome. N Engl J Med. 2011;364(14):1293–1304.
- , , , et al. Rehabilitation therapy and outcomes in acute respiratory failure: an observational pilot project. J Crit Care. 2010;25(2):254–262.
- , , . Exercise for acutely hospitalised older medical patients. Cochrane Database Syst Rev. 2007;(1):CD005955.
- , , . Extra physical therapy reduces patient length of stay and improves functional outcomes and quality of life in people with acute or subacute conditions: a systematic review. Arch Phys Med Rehabil. 2011;92(9):1490–1500.
- , , , , , . Fewer emergency readmissions and better quality of life for older adults at risk of hospital readmission: a randomized controlled trial to determine the effectiveness of a 24‐week exercise and telephone follow‐up program. J Am Geriatr Soc. 2009;57(3):395–402.
- , , , , , . Effects of an acute care for elders unit on costs and 30‐day readmissions. JAMA Intern Med. 2013:1–7.
- , , , , . Risks of acute hospital transfer and mortality during stroke rehabilitation. Arch Phys Med Rehabil. 2003;84(5):712–718.
© 2014 Society of Hospital Medicine
