User login
Interventions for Frequently Hospitalized Patients and Their Effect on Outcomes: A Systematic Review
In recent years, hospitals and health systems have engaged in considerable efforts to reduce readmissions, in part due to financial incentives from the Medicare Hospital Readmission Reduction Program.1,2 Though efforts to improve transitions of care for all patients are laudable, risk for readmission is not distributed equally; a small subset of patients accounts for a disproportionate number of hospital readmissions.3 This phenomenon of frequently hospitalized patients is similar to that seen in other populations in which a small proportion of patients account for a majority of healthcare utilization.3,4
Recognizing that the current system of healthcare delivery does not meet the needs of this population, healthcare organizations have begun to implement interventions that supplement or redesign the system of care for frequently hospitalized patients.5-7 Descriptive reviews of ambulatory "high-need, high-cost" patients emphasize complex case management and interdisciplinary, team-based care.8,9 Prior systematic reviews of studies aimed at patients with high use of emergency care demonstrate improvements in social outcomes such as homelessness but mixed results in reducing emergency department (ED) use.10 However, we were unable to identify any prior reviews that evaluated interventions intended specifically for patients with frequent hospital admissions. Our objective in this systematic review was to characterize interventions for frequently admitted patients and determine whether these interventions decrease use of healthcare resources, improve health outcomes, and/or reduce costs.
METHODS
Literature Search
We registered our study protocol in the PROSPERO database. A librarian (L.O.) collaboratively developed the search strategies with other review authors (A.G., B.H., N.N.) and in January 2018 ran searches on "super users," "high utilizers," and similar terms in the following databases: PubMed MEDLINE, Embase (embase.com), and Cochrane Central Register of Controlled Trials (CENTRAL) on the Wiley platform. The complete search strategies used are available in Appendix A.
We attempted to discover additional studies by searching the reference lists of key publications and contacted authors of relevant abstracts to determine whether studies had been published or were planned for peer-reviewed publication. We also contacted authors of included studies to locate additional studies meeting inclusion criteria.
Data Collection Process
Studies were eligible for inclusion in our review if they were (1) published in a peer-reviewed source, (2) defined a study population of patients frequently admitted to inpatient medical services, (3) evaluated an intervention targeting frequently hospitalized patients, and (4) included patients who were >18 years old and (5) admitted as inpatients on medical services. Of note, studies with patients admitted to psychiatric, obstetric, or surgical wards were not included, as the authors did not define these as "general medicine" units. Studies focused solely on an ambulatory population were similarly excluded. Given the heterogeneity of how studies defined frequently hospitalized patients, we did not establish a prespecified number of admissions for inclusion to ensure that we did not exclude interventions not meeting a strict set of criteria. The goal was not to examine interventions to reduce all readmissions, but rather, to look at patients who were recurrently hospitalized. Thus, patients had to be repeatedly admitted, but we let the studies define that usage explicitly.
Two members of a four-physician team (A.G., B.H., K.O., and N.N.) screened all initial results for eligibility through title and abstract review; potentially relevant articles were retained for full-text review to assess each study's eligibility. If a study's abstract did not clearly indicate whether inclusion criteria were met, we retained the article for full-text review. Two team members (A.G. and B.H.) independently reviewed the full text of each selected article to determine final inclusion in the study. The previously described inclusion criteria were again applied, and a final set of articles was identified for data extraction. Disagreements regarding inclusion in the final review (such as whether a study measured medical or psychiatric hospitalizations) were resolved through discussion among the entire four-physician review team to achieve consensus or, when required, by contacting authors of individual studies.
Data Abstraction and Risk of Bias Assessment
After selecting the final set of articles, we abstracted data using a tool developed by the Cochrane Effective Practice and Organization of Care Group.11 We then compiled study-level data into a single database for reporting. Extracted elements included study design, setting, patient characteristics, inclusion and exclusion criteria, control group identification, outcome measures, results, and length of follow-up. We also extracted individual characteristics of each intervention, including common intervention elements such as intervention setting, use of health information technology resources, and whether programs developed interdisciplinary care plans. We assessed the risk of bias of each study and the quality of studies using the Downs and Black Scale.12,13 Two team members (A.G. and B.H.) independently assessed the risk of bias for all nine studies, and differences were resolved by consensus. Due to the variation in the outcomes used, we were unable to conduct a meta-analysis.
RESULTS
Search Results
We found a total of 4,762 references in the three databases. After de-duplication using the EndNote software, there were 3,314 references to screen. We identified 116 studies for full-text review. Of those, we selected nine studies that met the criteria for this study (Figure). The most common reason for exclusion of an article for full-text review was that the patients studied were not defined as high utilizers of inpatient resources and were instead high-utilizers of ambulatory or emergency care (32 studies). We identified five of the included studies through the primary search and four through review of the references of the included papers.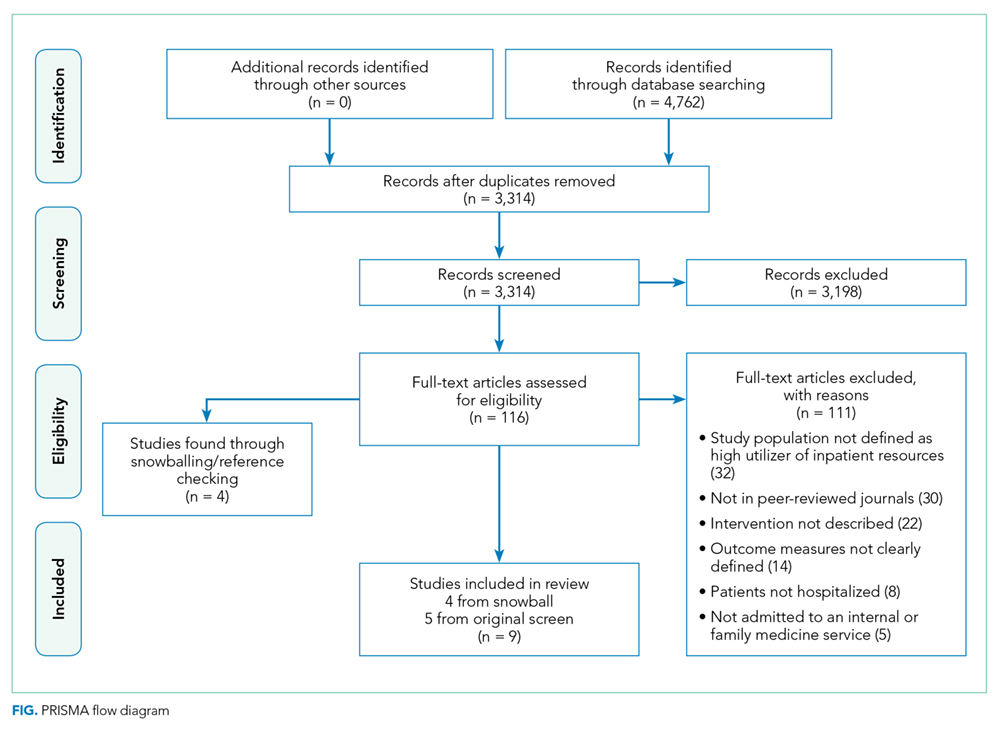
Study Designs and Included Studies
Of the nine included studies, three were randomized controlled trials, three were controlled retrospective cohort studies, and three were uncontrolled pre-post studies. The key characteristics of each study are described in Table 1.14-22 The included studies had different definitions for patients who were high utilizers of hospital care. Eight used a "threshold" model that predicted future admissions using past patterns; these studies included patients with at least two admissions over a period of 6 to 12 months, although many had higher thresholds. Zulman et al. used a prediction algorithm to identify patients at risk of future admission. Four studies also included some measure of medical complexity, such as a certain number of chronic medical conditions;14,17,18,22 in contrast, Sledge et al. excluded the most complex and high-cost patients.20
All studies measured hospital admissions as a primary or a secondary outcome (Table 1). Although all studies demonstrated a reduction in hospital admissions following implementation, those with the greatest reductions did not have a control group.14,15,17 All three randomized controlled trials showed equal reductions in admission rates between the intervention and control groups.18,20,22 Among those specifically examining readmissions to the hospital, similar trends emerged, although one study (Plant et al.) found a nonsignificant decrease in hospital readmissions (17% reduction in 24 months, P = .07).18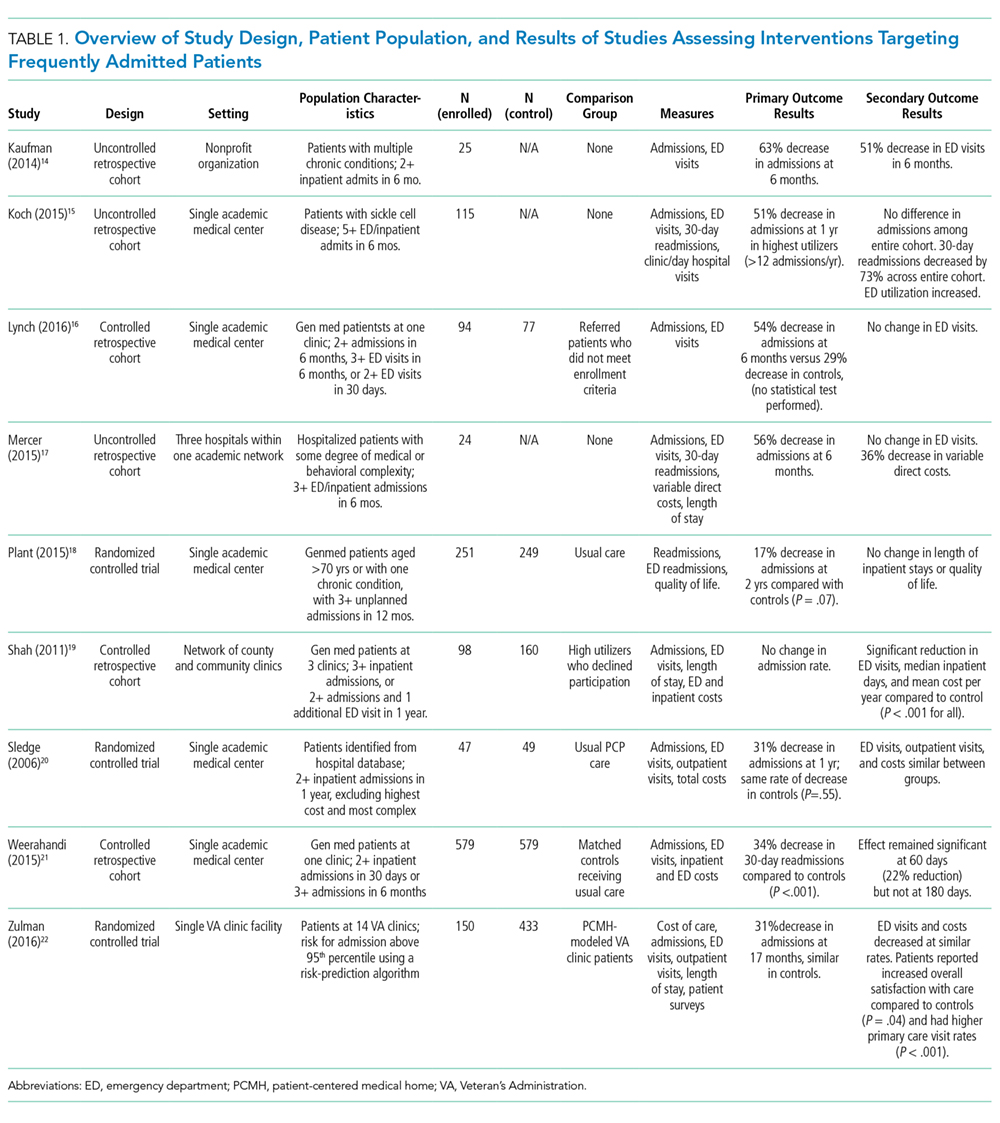
In the secondary outcome analysis, six of the nine studies found nonsignificant reductions in ED admissions (Table 1). Four studies measured costs to the hospital or the local hospital system, though none examined costs to patients or payors. Studies estimated cost differently, including the use of estimated hospital costs,17,20 "facility patient costs" at the VA,22 and a combination of inpatient and ED costs.19 The latter study (Shah et al., which implemented complex case management services) was the only one to find a statistically significant decrease in mean cost per year pre- and postintervention ($20,298 versus $7,053, P < .001).19
Only one study measured the quality of life, finding no significant change in summary scores after the intervention compared with controls (93.4 versus 92, P = .32).21 Another study conducted at a VA clinic network found no difference in a patient activation scale following the intervention but found significantly increased satisfaction with overall VA care (3.16 versus 2.90, P = .04).22
Intervention Characteristics
Intervention characteristics are summarized in Table 2. Although there was heterogeneity in study interventions, we identified common themes. Five of the nine interventions14-17,22 consisted of interdisciplinary teams that included community health workers, nurses, social workers, and physicians. Physicians were not included on every team; three interventions used them in direct care roles while two others contained physicians as advisors or in indirect roles. Intervention teams also had a variable level of involvement in a patient's care. Mercer et al. developed care plans for patients without physical interaction,17 whereas Zulman et al. recruited patients to a separate, intensive outpatient clinic outside the usual VA care team structure.22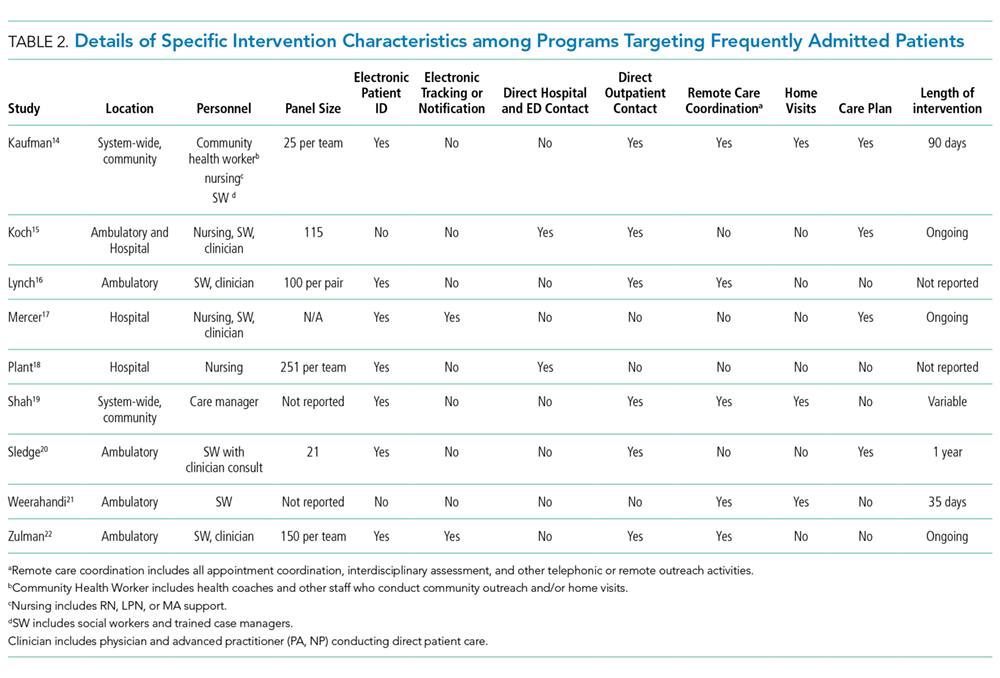
The majority of interventions added direct services or support - most commonly, a social worker - to usual care processes. Patient panel sizes were relatively small, with most of the teams recruiting fewer than 150 patients per interdisciplinary team (range, 25-251). There was variation in the length of intervention, from 35 days of case management following hospital discharge to one year of intensive social work support to others of an indefinite length.15,17,22
Additional common themes included caring for patients across settings and incorporating information technology (IT) into workflows. Four interventions reported either interacting with patients in multiple settings, such as the hospital, clinic, and day hospital, ED, at home, or in the community.14,19,21,22 Two others16,20 interacted with patients only in the clinic but expanded the scope of a "traditional" primary care practice to include open scheduling, flexible appointment times, interdisciplinary visits, or outreach. In addition, IT resources assisted seven of the nine interventions, most commonly by identifying eligible patients via an electronic data tracking system or by automated alerts when their patients arrived at affiliated care locations.
Risk of Study Bias
We systematically assessed the risk of bias of the nine included studies (Appendix B). Using the scale published by Downs and Black, a point-based scale in which a score of 18 denotes a high-quality study, the studies in this review scored 15.55 on average (range 6-22, standard deviation [SD] 5.0). Four of the nine studies met the benchmark for high quality.12,13,18-22 The risk of bias was highest for measures of internal validity and confounding (range 0-5, mean 2.83, SD 1.94). The risk of bias was lowest for reporting measures (range 0-13, mean 7.40, SD 3.43).
DISCUSSION
Overall, studies reported mixed results related to readmissions and hospital utilization. While low-quality studies found reductions in hospital use over time, higher quality studies found similar reductions in utilization between the intervention and control groups. Johnson et al. showed that frequent hospitalization rates in a cohort of high-utilizer patients declined naturally over the course of 1-2 years; only 10% of individuals in the initial cohort remained "chronically hospitalized."6 Thus, expanding on these findings, the decline in hospitalizations over time as observed in some of the studies included in this review may be due to study patients being identified during a "spike" in utilization, which naturally decreases as the underlying medical or social factors driving rehospitalization resolve. Alternatively, reduction in hospitalizations may represent patients choosing to pursue care at other neighboring hospitals.23 No study included in our review evaluated healthcare use at institutions other than their study hospital or health system.
A striking theme of this review was the heterogeneity in each study's patient population. Thresholds for "high utilizers" varied from two hospital admissions in six months to two to three admissions in 30 days, to a combination of ED and hospital admissions, and to the use of predictive algorithms. A standard "case definition" for this population could guide future research, enabling comparison of outcomes across settings. Thus, we propose that future studies use three or more hospital admissions within six months when evaluating interventions targeting "high utilizer" patients. Although patients with one prior hospitalization in the past year are at elevated risk of rehospitalization,2 we feel that a higher "threshold" for this population will identify those at the highest strata of risk. Although predictive models may be better than "threshold" models, more work in validating these tools needs to be done before these can be put to use across settings.
In contrast to interventions designed to reduce readmissions for heart failure, pneumonia, or other diagnoses, frequently admitted patients do not encompass one disease or pathology pattern. Rinehart et al., in a study characterizing frequently admitted patients across a health system, identified five "subgroups" of patients, including those with (1) unstable housing, (2) comorbid medical and psychiatric illness, (3) severe complex medical illness, (4) dual-diagnosis psychiatric illness and substance abuse, and (5) a combination of medical and psychosocial barriers.25 In light of this population's heterogeneity, interventions may need to be flexible and tailored to the needs of individual patients, while simultaneously accounting for the capabilities and priorities of the health system. More specific and standardized interventions, targeting more homogenous groups, may be appropriate for populations defined according to pathology (such as heart failure or sickle cell disease).27
The components of interventions used for frequently hospitalized patients were diverse. Although most of the studies used interdisciplinary teams, they focused their efforts in a variety of settings, often crossing modern "boundaries of care" by providing direct or indirect input on care across healthcare settings. Care fragmentation probably plays an important role in the risk for readmissions in this population;9 as such, interventions that address factors across the continuum of care may be more likely to succeed.21 Notably, six of nine studies were conducted at academic medical centers and an additional one at a VA facility affiliated with an academic center. Only two were located at community-based clinical networks, indicating a theoretical potential for publication bias as academic centers may be more likely to study and publish their work. There may be successful interventions that have not been formally studied or published in the peer-reviewed literature.
The breadth of the outcome measures in the included studies raises questions about what metrics should define success. Although all the studies looked at hospital utilization and readmission, measure definitions varied. Importantly, a minority of studies investigated quality of life and patient satisfaction, outcomes that may ultimately provide a more fertile ground for inquiry and intervention. Two studies looked at quality of life as an outcome,19,22 but only one found that patients reported increased satisfaction despite showing nonsignificant reductions in hospital use.22 As shown in multiple prior studies, patient engagement is associated with increased satisfaction and can be associated with lower healthcare costs.26,27 Hibbard et al. have demonstrated that patient activation is a specific component of patient engagement and inversely impacts healthcare cost, with lower levels of patient activation showing increased costs in comparison to those patients more engaged in their own care.27 By focusing on changing patients' perceptions about their own health and involvement in their own care team as a partner, programs may be able to make a greater impact.
Our systematic review has several limitations. Although we used a search strategy designed to identify all relevant studies, reviewed the references of included studies, and contacted the authors, we identified only nine studies meeting our inclusion criteria. Four of the nine studies were identified from a manual review of references of the included studies, suggesting the possibility of a suboptimal search strategy. Although the inclusion of articles that appear in a check of reference lists is a valid step in the systematic review article acquisition process, we conducted a post hoc investigation of alternate search strategies. We checked the titles, abstracts, and subject headings of the four articles found by reference review to determine whether the original search could have been improved. An analysis of the articles revealed that the terminology used was not consistent with the super user/utilizer terminology we were operating under, and that the four articles used terms such as "high risk" and "complex patients," which are more generic than our targeted terms. Only on a careful read of the abstracts and full-text did we find that these articles were useful to the study. Adjusting the original search to include these general terms would have resulted in an unwieldy set of results; hence, we felt it best to adhere to our original search strategy.
Additional limitations include that only four of the nine included studies were at low risk of bias. In addition to limitations based on study design and small sample sizes, the interventions were often limited to a short period. In light of the multiple factors that contribute to frequent hospitalizations, some of which cannot be addressed quickly, studies to evaluate interventions for longer durations are warranted.
CONCLUSIONS
We found mixed results for the effect of interventions on outcomes for frequently hospitalized patients. While low-quality studies found reductions in hospital use over time, higher quality studies generally found similar reductions in utilization between the intervention and control groups. The range of definitions, interventions, and outcomes used for frequently hospitalized patients is partly explained by the heterogeneity of the population. More rigorous studies using multifaceted interventions that adapt to patients' unique needs should be conducted to assess the effect on outcomes relevant to both providers and patients.
Acknowledgments
The authors would like the thank Dr. Luke Hansen, Dr. Margaret Chapman, and McKay Barra for their support and contributions to this paper and to Northwestern Memorial Hospital's CHAMP (Complex High Admission Management Program).
Disclosures
The authors have nothing to disclose.
Funding
The authors received no funding from external or internal sources for the completion of this project.
1. Center for Medicare and Medicaid Services. Readmissions Reduction Program (HRRP). https://www.cms.gov/medicare/medicare-fee-for-service-payment/acuteinpatientpps/readmissions-reduction-program.html. Accessed March 23, 2018.
2. Hansen LO, Young RS, Hinami K, Leung A, Williams MV. Interventions to reduce 30-day rehospitalization: a systematic review. Ann Intern Med. 2011;155(8):520-528. doi: 10.7326/0003-4819-155-8-201110180-00008. PubMed
3. Blumenthal D, Chernof B, Fulmer T, Lumpkin J, Selberg J. Caring for high-need, high-cost patients - an urgent priority. N Engl J Med. 2016;375(10):909-911. doi: 10.1056/NEJMp1608511. PubMed
4. Gawande A. The Hot Spotters. The New Yorker. 2011 Jan: 40-51.
5. Szekendi MK, Williams MV, Carrier D, Hensley L, Thomas S, Cerese J. The characteristics of patients frequently admitted to academic medical centers in the United States. J Hosp Med. 2015;10(9):563-568. doi: 10.1002/jhm.2375. PubMed
6. Johnson TL, Rinehart DJ, Durfee J, et al. For many patients who use large amounts of health care services, the need is intense yet temporary. Health Aff (Millwood). 2015;34(8):1312-1319. doi: 10.1377/hlthaff.2014.1186. PubMed
7. Tinetti ME, Reuben DB. The hospital-dependent patient. N Engl J Med. 2014;370:694-697. doi: 10.1056/NEJMp1315568. PubMed
8. Hong CS, Siegel AL, Ferris TG. Caring for high-need, high-cost patients: what makes for a successful care management program? Issue Brief (Commonw Fund). 2014;19:1-19. PubMed
9. Hochman M, Asch SM. Disruptive models in primary care: caring for high-needs, high-cost populations. J Gen Intern Med. 2017;32(4):392-397. doi: 10.1007/s11606-016-3945-2. PubMed
10. Althaus F1, Paroz S, Hugli O, et al. Effectiveness of interventions targeting frequent users of emergency departments: a systematic review. Ann Emerg Med. 2011 Jul;58(1):41-52.e42. doi: 10.1016/j.annemergmed.2011.03.007 PubMed
11. Cochrane Effective Practice and Organisation of Care (EPOC). What study designs should be included in an EPOC review? EPOC resources for review authors. Available at:http://epoc.cochrane.org/epoc-resources-review-authors. Accessed March 23, 2018.
12. Downs SH, Black N. The feasibility of creating a checklist for the assessment of the methodological quality both of randomised and non-randomised studies of health care interventions. J Epidemiol Community Health. 1998;52(6):377-384. doi: 10.1136/jech.52.6.377. PubMed
13. Goyal AA, Tur K, Mann J, Townsend W, Flanders SA, Chopra V. Do bedside visual tools improve patient and caregiver satisfaction? A systematic review of the literature. J Hosp Med 2017;12(11):930-936. doi: 10.12788/jhm.2871. PubMed
14. Kaufman S, Ali N, DeFiglio V, Craig K, Brenner J. Early efforts to target and enroll high-risk diabetic patients into urban community-based programs. Health Promot Pract. 2014;15(2 Suppl):62S-70S. doi: 10.1177/1524839914535776. PubMed
15. Koch KL, Karafin MS, Simpson P, Field JJ. Intensive management of high-utilizing adults with sickle cell disease lowers admissions. Am J Hematol. 2015;90(3):215-219. doi: 10.1002/ajh.23912. PubMed
16. Lynch CS, Wajnberg A, Jervis R, et al. Implementation science workshop: a novel multidisciplinary primary care program to improve care and outcomes for super-utilizers. J Gen Intern Med. 2016;31(7):797-802. doi: 10.1007/s11606-016-3598-1. PubMed
17. Mercer T, Bae J, Kipnes J, Velazquez M, Thomas S, Setji N. The highest utilizers of care: individualized care plans to coordinate care, improve healthcare service utilization, and reduce costs at an academic tertiary care center. J Hosp Med. 2015;10(7):419-424. doi: 10.1002/jhm.2351. PubMed
18. Plant NA, Kelly PJ, Leeder SR, et al. Coordinated care versus standard care in hospital admissions of people with chronic illness: a randomised controlled trial. Med J Aust. 2015;203(1):33-38. doi: 10.5694/mja14.01049. PubMed
19. Shah R, Chen C, O'Rourke S, Lee M, Mohanty SA, Abraham J. Evaluation of care management for the uninsured. Med Care. 2011;49(2):166-171. doi: 10.1097/MLR.0b013e3182028e81. PubMed
20. Sledge WH, Brown KE, Levine JM, et al. A randomized trial of primary intensive care to reduce hospital admissions in patients with high utilization of inpatient services. Dis Manag. 2006;9(6):328-338. doi: 10.1089/dis.2006.9.328. PubMed
21. Weerahandi H, Basso Lipani M, Kalman J, et al. Effects of a psychosocial transitional care model on hospitalizations and cost of care for high utilizers. Soc Work Health Care. 2015;54(6):485-498. doi: 10.1080/00981389.2015.1040141. PubMed
22. Zulman DM, Ezeji-Okoye SC, Shaw JG, et al. Partnered research in healthcare delivery redesign for high-need, high-cost patients: development and feasibility of an Intensive Management Patient-Aligned Care Team (ImPACT). J Gen Intern Med. 2014;29(4):861-869. doi: 10.1007/s11606-014-3022-7. PubMed
23. Mautner DB, Pang H, Brenner JC, et al. Generating hypotheses about care needs of high utilizers: lessons from patient interviews. Popul Health Manag. 2013;16 Suppl 1:S26-33. doi: 10.1089/pop.2013.0033. PubMed
24. Bodenheimer T. Strategies to reduce costs and improve care for high-utilizing Medicaid patients: Reflections on pioneering programs. Center for Health Care Strategies, Inc.;2013.
25. Rinehart DJ, Oronce C, Durfee MJ, et al. Identifying subgroups of adult superutilizers in an urban safety-net system using latent class analysis: implications for clinical practice. Med Care. 2018;56(1):e1-e9. doi: 10.1097/MLR.0000000000000628. PubMed
26. Boutwell A, Kunst E, Sorin J, Shniffer A, Logozzo J, Woodhouse D. DSRIP-Medicaid Accelerated eXchange (MAX) Series Program: Improving Care for Super Utilizers. January 2017. https://www.health.ny.gov/health_care/medicaid/redesign/dsrip/pps_workshops/docs/2017-01_imp_care.pdf. Accessed January 24, 2018.
27. Hibbard JH, Stockard J, Mahoney ER, Tusler M. Development of the Patient Activation Measure (PAM): conceptualizing and measuring activation in patients and consumers. Health Serv Res. 2004;39(4 Pt 1):1005-1026. doi: 10.1111/j.1475-6773.2004.00269.x PubMed
In recent years, hospitals and health systems have engaged in considerable efforts to reduce readmissions, in part due to financial incentives from the Medicare Hospital Readmission Reduction Program.1,2 Though efforts to improve transitions of care for all patients are laudable, risk for readmission is not distributed equally; a small subset of patients accounts for a disproportionate number of hospital readmissions.3 This phenomenon of frequently hospitalized patients is similar to that seen in other populations in which a small proportion of patients account for a majority of healthcare utilization.3,4
Recognizing that the current system of healthcare delivery does not meet the needs of this population, healthcare organizations have begun to implement interventions that supplement or redesign the system of care for frequently hospitalized patients.5-7 Descriptive reviews of ambulatory "high-need, high-cost" patients emphasize complex case management and interdisciplinary, team-based care.8,9 Prior systematic reviews of studies aimed at patients with high use of emergency care demonstrate improvements in social outcomes such as homelessness but mixed results in reducing emergency department (ED) use.10 However, we were unable to identify any prior reviews that evaluated interventions intended specifically for patients with frequent hospital admissions. Our objective in this systematic review was to characterize interventions for frequently admitted patients and determine whether these interventions decrease use of healthcare resources, improve health outcomes, and/or reduce costs.
METHODS
Literature Search
We registered our study protocol in the PROSPERO database. A librarian (L.O.) collaboratively developed the search strategies with other review authors (A.G., B.H., N.N.) and in January 2018 ran searches on "super users," "high utilizers," and similar terms in the following databases: PubMed MEDLINE, Embase (embase.com), and Cochrane Central Register of Controlled Trials (CENTRAL) on the Wiley platform. The complete search strategies used are available in Appendix A.
We attempted to discover additional studies by searching the reference lists of key publications and contacted authors of relevant abstracts to determine whether studies had been published or were planned for peer-reviewed publication. We also contacted authors of included studies to locate additional studies meeting inclusion criteria.
Data Collection Process
Studies were eligible for inclusion in our review if they were (1) published in a peer-reviewed source, (2) defined a study population of patients frequently admitted to inpatient medical services, (3) evaluated an intervention targeting frequently hospitalized patients, and (4) included patients who were >18 years old and (5) admitted as inpatients on medical services. Of note, studies with patients admitted to psychiatric, obstetric, or surgical wards were not included, as the authors did not define these as "general medicine" units. Studies focused solely on an ambulatory population were similarly excluded. Given the heterogeneity of how studies defined frequently hospitalized patients, we did not establish a prespecified number of admissions for inclusion to ensure that we did not exclude interventions not meeting a strict set of criteria. The goal was not to examine interventions to reduce all readmissions, but rather, to look at patients who were recurrently hospitalized. Thus, patients had to be repeatedly admitted, but we let the studies define that usage explicitly.
Two members of a four-physician team (A.G., B.H., K.O., and N.N.) screened all initial results for eligibility through title and abstract review; potentially relevant articles were retained for full-text review to assess each study's eligibility. If a study's abstract did not clearly indicate whether inclusion criteria were met, we retained the article for full-text review. Two team members (A.G. and B.H.) independently reviewed the full text of each selected article to determine final inclusion in the study. The previously described inclusion criteria were again applied, and a final set of articles was identified for data extraction. Disagreements regarding inclusion in the final review (such as whether a study measured medical or psychiatric hospitalizations) were resolved through discussion among the entire four-physician review team to achieve consensus or, when required, by contacting authors of individual studies.
Data Abstraction and Risk of Bias Assessment
After selecting the final set of articles, we abstracted data using a tool developed by the Cochrane Effective Practice and Organization of Care Group.11 We then compiled study-level data into a single database for reporting. Extracted elements included study design, setting, patient characteristics, inclusion and exclusion criteria, control group identification, outcome measures, results, and length of follow-up. We also extracted individual characteristics of each intervention, including common intervention elements such as intervention setting, use of health information technology resources, and whether programs developed interdisciplinary care plans. We assessed the risk of bias of each study and the quality of studies using the Downs and Black Scale.12,13 Two team members (A.G. and B.H.) independently assessed the risk of bias for all nine studies, and differences were resolved by consensus. Due to the variation in the outcomes used, we were unable to conduct a meta-analysis.
RESULTS
Search Results
We found a total of 4,762 references in the three databases. After de-duplication using the EndNote software, there were 3,314 references to screen. We identified 116 studies for full-text review. Of those, we selected nine studies that met the criteria for this study (Figure). The most common reason for exclusion of an article for full-text review was that the patients studied were not defined as high utilizers of inpatient resources and were instead high-utilizers of ambulatory or emergency care (32 studies). We identified five of the included studies through the primary search and four through review of the references of the included papers.
Study Designs and Included Studies
Of the nine included studies, three were randomized controlled trials, three were controlled retrospective cohort studies, and three were uncontrolled pre-post studies. The key characteristics of each study are described in Table 1.14-22 The included studies had different definitions for patients who were high utilizers of hospital care. Eight used a "threshold" model that predicted future admissions using past patterns; these studies included patients with at least two admissions over a period of 6 to 12 months, although many had higher thresholds. Zulman et al. used a prediction algorithm to identify patients at risk of future admission. Four studies also included some measure of medical complexity, such as a certain number of chronic medical conditions;14,17,18,22 in contrast, Sledge et al. excluded the most complex and high-cost patients.20
All studies measured hospital admissions as a primary or a secondary outcome (Table 1). Although all studies demonstrated a reduction in hospital admissions following implementation, those with the greatest reductions did not have a control group.14,15,17 All three randomized controlled trials showed equal reductions in admission rates between the intervention and control groups.18,20,22 Among those specifically examining readmissions to the hospital, similar trends emerged, although one study (Plant et al.) found a nonsignificant decrease in hospital readmissions (17% reduction in 24 months, P = .07).18
In the secondary outcome analysis, six of the nine studies found nonsignificant reductions in ED admissions (Table 1). Four studies measured costs to the hospital or the local hospital system, though none examined costs to patients or payors. Studies estimated cost differently, including the use of estimated hospital costs,17,20 "facility patient costs" at the VA,22 and a combination of inpatient and ED costs.19 The latter study (Shah et al., which implemented complex case management services) was the only one to find a statistically significant decrease in mean cost per year pre- and postintervention ($20,298 versus $7,053, P < .001).19
Only one study measured the quality of life, finding no significant change in summary scores after the intervention compared with controls (93.4 versus 92, P = .32).21 Another study conducted at a VA clinic network found no difference in a patient activation scale following the intervention but found significantly increased satisfaction with overall VA care (3.16 versus 2.90, P = .04).22
Intervention Characteristics
Intervention characteristics are summarized in Table 2. Although there was heterogeneity in study interventions, we identified common themes. Five of the nine interventions14-17,22 consisted of interdisciplinary teams that included community health workers, nurses, social workers, and physicians. Physicians were not included on every team; three interventions used them in direct care roles while two others contained physicians as advisors or in indirect roles. Intervention teams also had a variable level of involvement in a patient's care. Mercer et al. developed care plans for patients without physical interaction,17 whereas Zulman et al. recruited patients to a separate, intensive outpatient clinic outside the usual VA care team structure.22
The majority of interventions added direct services or support - most commonly, a social worker - to usual care processes. Patient panel sizes were relatively small, with most of the teams recruiting fewer than 150 patients per interdisciplinary team (range, 25-251). There was variation in the length of intervention, from 35 days of case management following hospital discharge to one year of intensive social work support to others of an indefinite length.15,17,22
Additional common themes included caring for patients across settings and incorporating information technology (IT) into workflows. Four interventions reported either interacting with patients in multiple settings, such as the hospital, clinic, and day hospital, ED, at home, or in the community.14,19,21,22 Two others16,20 interacted with patients only in the clinic but expanded the scope of a "traditional" primary care practice to include open scheduling, flexible appointment times, interdisciplinary visits, or outreach. In addition, IT resources assisted seven of the nine interventions, most commonly by identifying eligible patients via an electronic data tracking system or by automated alerts when their patients arrived at affiliated care locations.
Risk of Study Bias
We systematically assessed the risk of bias of the nine included studies (Appendix B). Using the scale published by Downs and Black, a point-based scale in which a score of 18 denotes a high-quality study, the studies in this review scored 15.55 on average (range 6-22, standard deviation [SD] 5.0). Four of the nine studies met the benchmark for high quality.12,13,18-22 The risk of bias was highest for measures of internal validity and confounding (range 0-5, mean 2.83, SD 1.94). The risk of bias was lowest for reporting measures (range 0-13, mean 7.40, SD 3.43).
DISCUSSION
Overall, studies reported mixed results related to readmissions and hospital utilization. While low-quality studies found reductions in hospital use over time, higher quality studies found similar reductions in utilization between the intervention and control groups. Johnson et al. showed that frequent hospitalization rates in a cohort of high-utilizer patients declined naturally over the course of 1-2 years; only 10% of individuals in the initial cohort remained "chronically hospitalized."6 Thus, expanding on these findings, the decline in hospitalizations over time as observed in some of the studies included in this review may be due to study patients being identified during a "spike" in utilization, which naturally decreases as the underlying medical or social factors driving rehospitalization resolve. Alternatively, reduction in hospitalizations may represent patients choosing to pursue care at other neighboring hospitals.23 No study included in our review evaluated healthcare use at institutions other than their study hospital or health system.
A striking theme of this review was the heterogeneity in each study's patient population. Thresholds for "high utilizers" varied from two hospital admissions in six months to two to three admissions in 30 days, to a combination of ED and hospital admissions, and to the use of predictive algorithms. A standard "case definition" for this population could guide future research, enabling comparison of outcomes across settings. Thus, we propose that future studies use three or more hospital admissions within six months when evaluating interventions targeting "high utilizer" patients. Although patients with one prior hospitalization in the past year are at elevated risk of rehospitalization,2 we feel that a higher "threshold" for this population will identify those at the highest strata of risk. Although predictive models may be better than "threshold" models, more work in validating these tools needs to be done before these can be put to use across settings.
In contrast to interventions designed to reduce readmissions for heart failure, pneumonia, or other diagnoses, frequently admitted patients do not encompass one disease or pathology pattern. Rinehart et al., in a study characterizing frequently admitted patients across a health system, identified five "subgroups" of patients, including those with (1) unstable housing, (2) comorbid medical and psychiatric illness, (3) severe complex medical illness, (4) dual-diagnosis psychiatric illness and substance abuse, and (5) a combination of medical and psychosocial barriers.25 In light of this population's heterogeneity, interventions may need to be flexible and tailored to the needs of individual patients, while simultaneously accounting for the capabilities and priorities of the health system. More specific and standardized interventions, targeting more homogenous groups, may be appropriate for populations defined according to pathology (such as heart failure or sickle cell disease).27
The components of interventions used for frequently hospitalized patients were diverse. Although most of the studies used interdisciplinary teams, they focused their efforts in a variety of settings, often crossing modern "boundaries of care" by providing direct or indirect input on care across healthcare settings. Care fragmentation probably plays an important role in the risk for readmissions in this population;9 as such, interventions that address factors across the continuum of care may be more likely to succeed.21 Notably, six of nine studies were conducted at academic medical centers and an additional one at a VA facility affiliated with an academic center. Only two were located at community-based clinical networks, indicating a theoretical potential for publication bias as academic centers may be more likely to study and publish their work. There may be successful interventions that have not been formally studied or published in the peer-reviewed literature.
The breadth of the outcome measures in the included studies raises questions about what metrics should define success. Although all the studies looked at hospital utilization and readmission, measure definitions varied. Importantly, a minority of studies investigated quality of life and patient satisfaction, outcomes that may ultimately provide a more fertile ground for inquiry and intervention. Two studies looked at quality of life as an outcome,19,22 but only one found that patients reported increased satisfaction despite showing nonsignificant reductions in hospital use.22 As shown in multiple prior studies, patient engagement is associated with increased satisfaction and can be associated with lower healthcare costs.26,27 Hibbard et al. have demonstrated that patient activation is a specific component of patient engagement and inversely impacts healthcare cost, with lower levels of patient activation showing increased costs in comparison to those patients more engaged in their own care.27 By focusing on changing patients' perceptions about their own health and involvement in their own care team as a partner, programs may be able to make a greater impact.
Our systematic review has several limitations. Although we used a search strategy designed to identify all relevant studies, reviewed the references of included studies, and contacted the authors, we identified only nine studies meeting our inclusion criteria. Four of the nine studies were identified from a manual review of references of the included studies, suggesting the possibility of a suboptimal search strategy. Although the inclusion of articles that appear in a check of reference lists is a valid step in the systematic review article acquisition process, we conducted a post hoc investigation of alternate search strategies. We checked the titles, abstracts, and subject headings of the four articles found by reference review to determine whether the original search could have been improved. An analysis of the articles revealed that the terminology used was not consistent with the super user/utilizer terminology we were operating under, and that the four articles used terms such as "high risk" and "complex patients," which are more generic than our targeted terms. Only on a careful read of the abstracts and full-text did we find that these articles were useful to the study. Adjusting the original search to include these general terms would have resulted in an unwieldy set of results; hence, we felt it best to adhere to our original search strategy.
Additional limitations include that only four of the nine included studies were at low risk of bias. In addition to limitations based on study design and small sample sizes, the interventions were often limited to a short period. In light of the multiple factors that contribute to frequent hospitalizations, some of which cannot be addressed quickly, studies to evaluate interventions for longer durations are warranted.
CONCLUSIONS
We found mixed results for the effect of interventions on outcomes for frequently hospitalized patients. While low-quality studies found reductions in hospital use over time, higher quality studies generally found similar reductions in utilization between the intervention and control groups. The range of definitions, interventions, and outcomes used for frequently hospitalized patients is partly explained by the heterogeneity of the population. More rigorous studies using multifaceted interventions that adapt to patients' unique needs should be conducted to assess the effect on outcomes relevant to both providers and patients.
Acknowledgments
The authors would like the thank Dr. Luke Hansen, Dr. Margaret Chapman, and McKay Barra for their support and contributions to this paper and to Northwestern Memorial Hospital's CHAMP (Complex High Admission Management Program).
Disclosures
The authors have nothing to disclose.
Funding
The authors received no funding from external or internal sources for the completion of this project.
1. Center for Medicare and Medicaid Services. Readmissions Reduction Program (HRRP). https://www.cms.gov/medicare/medicare-fee-for-service-payment/acuteinpatientpps/readmissions-reduction-program.html. Accessed March 23, 2018.
2. Hansen LO, Young RS, Hinami K, Leung A, Williams MV. Interventions to reduce 30-day rehospitalization: a systematic review. Ann Intern Med. 2011;155(8):520-528. doi: 10.7326/0003-4819-155-8-201110180-00008. PubMed
3. Blumenthal D, Chernof B, Fulmer T, Lumpkin J, Selberg J. Caring for high-need, high-cost patients - an urgent priority. N Engl J Med. 2016;375(10):909-911. doi: 10.1056/NEJMp1608511. PubMed
4. Gawande A. The Hot Spotters. The New Yorker. 2011 Jan: 40-51.
5. Szekendi MK, Williams MV, Carrier D, Hensley L, Thomas S, Cerese J. The characteristics of patients frequently admitted to academic medical centers in the United States. J Hosp Med. 2015;10(9):563-568. doi: 10.1002/jhm.2375. PubMed
6. Johnson TL, Rinehart DJ, Durfee J, et al. For many patients who use large amounts of health care services, the need is intense yet temporary. Health Aff (Millwood). 2015;34(8):1312-1319. doi: 10.1377/hlthaff.2014.1186. PubMed
7. Tinetti ME, Reuben DB. The hospital-dependent patient. N Engl J Med. 2014;370:694-697. doi: 10.1056/NEJMp1315568. PubMed
8. Hong CS, Siegel AL, Ferris TG. Caring for high-need, high-cost patients: what makes for a successful care management program? Issue Brief (Commonw Fund). 2014;19:1-19. PubMed
9. Hochman M, Asch SM. Disruptive models in primary care: caring for high-needs, high-cost populations. J Gen Intern Med. 2017;32(4):392-397. doi: 10.1007/s11606-016-3945-2. PubMed
10. Althaus F1, Paroz S, Hugli O, et al. Effectiveness of interventions targeting frequent users of emergency departments: a systematic review. Ann Emerg Med. 2011 Jul;58(1):41-52.e42. doi: 10.1016/j.annemergmed.2011.03.007 PubMed
11. Cochrane Effective Practice and Organisation of Care (EPOC). What study designs should be included in an EPOC review? EPOC resources for review authors. Available at:http://epoc.cochrane.org/epoc-resources-review-authors. Accessed March 23, 2018.
12. Downs SH, Black N. The feasibility of creating a checklist for the assessment of the methodological quality both of randomised and non-randomised studies of health care interventions. J Epidemiol Community Health. 1998;52(6):377-384. doi: 10.1136/jech.52.6.377. PubMed
13. Goyal AA, Tur K, Mann J, Townsend W, Flanders SA, Chopra V. Do bedside visual tools improve patient and caregiver satisfaction? A systematic review of the literature. J Hosp Med 2017;12(11):930-936. doi: 10.12788/jhm.2871. PubMed
14. Kaufman S, Ali N, DeFiglio V, Craig K, Brenner J. Early efforts to target and enroll high-risk diabetic patients into urban community-based programs. Health Promot Pract. 2014;15(2 Suppl):62S-70S. doi: 10.1177/1524839914535776. PubMed
15. Koch KL, Karafin MS, Simpson P, Field JJ. Intensive management of high-utilizing adults with sickle cell disease lowers admissions. Am J Hematol. 2015;90(3):215-219. doi: 10.1002/ajh.23912. PubMed
16. Lynch CS, Wajnberg A, Jervis R, et al. Implementation science workshop: a novel multidisciplinary primary care program to improve care and outcomes for super-utilizers. J Gen Intern Med. 2016;31(7):797-802. doi: 10.1007/s11606-016-3598-1. PubMed
17. Mercer T, Bae J, Kipnes J, Velazquez M, Thomas S, Setji N. The highest utilizers of care: individualized care plans to coordinate care, improve healthcare service utilization, and reduce costs at an academic tertiary care center. J Hosp Med. 2015;10(7):419-424. doi: 10.1002/jhm.2351. PubMed
18. Plant NA, Kelly PJ, Leeder SR, et al. Coordinated care versus standard care in hospital admissions of people with chronic illness: a randomised controlled trial. Med J Aust. 2015;203(1):33-38. doi: 10.5694/mja14.01049. PubMed
19. Shah R, Chen C, O'Rourke S, Lee M, Mohanty SA, Abraham J. Evaluation of care management for the uninsured. Med Care. 2011;49(2):166-171. doi: 10.1097/MLR.0b013e3182028e81. PubMed
20. Sledge WH, Brown KE, Levine JM, et al. A randomized trial of primary intensive care to reduce hospital admissions in patients with high utilization of inpatient services. Dis Manag. 2006;9(6):328-338. doi: 10.1089/dis.2006.9.328. PubMed
21. Weerahandi H, Basso Lipani M, Kalman J, et al. Effects of a psychosocial transitional care model on hospitalizations and cost of care for high utilizers. Soc Work Health Care. 2015;54(6):485-498. doi: 10.1080/00981389.2015.1040141. PubMed
22. Zulman DM, Ezeji-Okoye SC, Shaw JG, et al. Partnered research in healthcare delivery redesign for high-need, high-cost patients: development and feasibility of an Intensive Management Patient-Aligned Care Team (ImPACT). J Gen Intern Med. 2014;29(4):861-869. doi: 10.1007/s11606-014-3022-7. PubMed
23. Mautner DB, Pang H, Brenner JC, et al. Generating hypotheses about care needs of high utilizers: lessons from patient interviews. Popul Health Manag. 2013;16 Suppl 1:S26-33. doi: 10.1089/pop.2013.0033. PubMed
24. Bodenheimer T. Strategies to reduce costs and improve care for high-utilizing Medicaid patients: Reflections on pioneering programs. Center for Health Care Strategies, Inc.;2013.
25. Rinehart DJ, Oronce C, Durfee MJ, et al. Identifying subgroups of adult superutilizers in an urban safety-net system using latent class analysis: implications for clinical practice. Med Care. 2018;56(1):e1-e9. doi: 10.1097/MLR.0000000000000628. PubMed
26. Boutwell A, Kunst E, Sorin J, Shniffer A, Logozzo J, Woodhouse D. DSRIP-Medicaid Accelerated eXchange (MAX) Series Program: Improving Care for Super Utilizers. January 2017. https://www.health.ny.gov/health_care/medicaid/redesign/dsrip/pps_workshops/docs/2017-01_imp_care.pdf. Accessed January 24, 2018.
27. Hibbard JH, Stockard J, Mahoney ER, Tusler M. Development of the Patient Activation Measure (PAM): conceptualizing and measuring activation in patients and consumers. Health Serv Res. 2004;39(4 Pt 1):1005-1026. doi: 10.1111/j.1475-6773.2004.00269.x PubMed
© 2018 Society of Hospital Medicine
Improving VTE Prevention
Venous thromboembolism (VTE), which includes deep vein thrombosis (DVT) and pulmonary embolism, is a significant cause of morbidity and mortality in the United States among hospitalized patients.[1, 2, 3, 4, 5, 6] Although it may not be possible to completely eradicate VTE events,[7] chemical and/or mechanical prophylaxis can reduce VTE rates by up to 74% to 86%,[8, 9, 10] and meta‐analyses have demonstrated the benefit of VTE prophylaxis in the inpatient population.[11, 12] Despite evidence‐based guidelines regarding the appropriate type, duration, and dosing of prophylaxis, thromboprophylaxis has been found to be underutilized in the inpatient setting.[13, 14, 15]
Northwestern Memorial Hospital (NMH) historically performed poorly on VTE outcome measures. VTE in the surgical patient population was an especially glaring problem, as NMH was persistently found to be a risk‐adjusted poor performer in the American College of Surgeons National Surgical Quality Improvement Project (ACS‐NSQIP).
However, VTE outcome measures have been shown to be problematic due to their susceptibility to surveillance bias; that is, variation in the ordering of screening or diagnostic VTE imaging studies between hospitals leads to variable VTE rates (the more you look, the more you find).[16, 17, 18, 19] More vigilant hospitals that have a lower threshold to order an imaging study may find higher occurrences of VTE, and paradoxically be deemed a poor performer. Surveillance bias and the lack of validity of the VTE outcome measurement highlighted the importance of utilizing process‐of‐care measures in assessing hospital VTE prevention efforts.[20, 21] Thus, when the Joint Commission enacted 6 new VTE core process‐of‐care measures on January 1, 2013 to monitor hospital performance on VTE prophylaxis administration and VTE treatment (Table 1), NMH undertook a hospital‐wide quality‐improvement (QI) project utilizing the define‐measure‐analyze‐improve‐control (DMAIC) process improvement (PI) methodology to optimize their performance on these core measures as well as the Surgical Care Improvement Project (SCIP) SCIP‐VTE‐2 measure. In this article, we describe the QI effort undertaken at NMH to improve hospital‐level measure performance and the outcomes of this effort.
| VTE Measure | Measure Calculation | Description of Issues | Interventions | Preintervention Performance, % (N)* | Postintervention Performance, % (N) |
|---|---|---|---|---|---|
| |||||
| VTE‐1: VTE PPX | Patients who received VTE prophylaxis or have documentation why no VTE prophylaxis was given | Missing documentation (both chemical and mechanical); prophylaxis ordered, but not administered; patient refusals and opportunity to increase patient education regarding prophylaxis | 1. Enhanced, individualized VTE prophylaxis alert: alert incorporated order, administration, mechanical PPX, lab exclusion and contraindication details | NMH: 86.6% (174) | NMH: 93.6% (162) |
| All patients | Undocumented contraindication reasons | 2. Nursing education initiative: back‐to‐basics VTE education initiative to help increase the administration of VTE prophylaxis and improve patient education resulting in fewer patient refusals and missed doses | NMH general surgery: 94.4% (34) | NMH general surgery: 97.6% (41) | |
| Inconsistent monitoring and patient education | 3. Updated VTE prophylaxis surgical and medicine order set: updated order listing, heparin TID setting and contraindications | NMH general medicine: 82.5% (115) | NMH general medicine: 90.2% (85) | ||
| VTE‐2: ICU VTE PPX | Patients who received VTE prophylaxis or have documentation why no VTE prophylaxis was given | See interventions 1 through 3 | NMH: 100% (58) | NMH: 95.8% (69) | |
| Patients directly admitted or transferred to the ICU | NMH general surgery: 100% (11) | NMH general surgery: 100% (10) | |||
| NMH general medicine: 100% (40) | NMH general medicine: 100% (51) | ||||
| VTE‐3: VTE patients with anticoagulation overlap therapy | Patients who received overlap therapy of parenteral anticoagulation and warfarin therapy | Gaps in documentation and administration of overlap therapy for 5 days | 4. Overlap therapy alert at discharge: document VTE on diagnosis list with alert to either (1) document reason for discontinuation of parental therapy or (2) prescribe parental anticoagulation during hospitalization or at discharge | NMH: 95.8% (159) | NMH: 100% (105) |
| Patients with confirmed VTE who received warfarin | 5. Overlap therapy alert during hospitalization: documentation alert on the day therapy discontinued | NMH general surgery: 85.7% (12) | NMH general surgery: 100% (16) | ||
| NMH general medicine: 97.0% (129) | NMH general medicine: 100% (79) | ||||
| VTE‐4: VTE patients receiving unfractionated dosages/platelet count monitoring by protocol or nomogram | Patients who have IV UFH therapy dosages and platelet counts monitored according to defined parameters such as a nomogram or protocol | Missing required language on IV UFH orders and order may not include preselected CBC order | 6. Updated heparin order sets: reminder to monitor platelet counts per nomogram and preselect CBC order | NMH: 73.7% (98) | NMH: 100% (74) |
| Patients with confirmed VTE receiving IV UFH therapy | NMH general surgery: 56.3% (7) | NMH general surgery: 100% (9) | |||
| NMH general medicine: 83.8% (88) | NMH general medicine: 100% (52) | ||||
| VTE‐5: VTE warfarin discharge instructions | Patients with documentation that they or their caregivers were given written discharge instructions or other educational material about warfarin | Discharge process is not standardized | 7. Warfarin Patient Education Task: automate nursing task for warfarin order set, check individual warfarin education excluding consult orders | NMH: 9.6% (12) | NMH: 87.5% (63) |
| Patients with confirmed VTE discharged on warfarin therapy | Patient education during hospitalization varies | 8. Warfarin dotphrase: new warfarin/Coumadin dotphrase aligned with department and core measure requirements | NMH general surgery: 0% (0) | NMH general surgery: 100% (11) | |
| No standardized process for initiating and tracking warfarin education during hospitalization | 9. Department Warfarin Instructions Phase II: update department warfarin language, automate warfarin education task | NMH general medicine: 11.3% (12) | NMH general medicine: 85.5% (50) | ||
| Warfarin special instructions for discharge is not aligned with the EMR dotphrase | 10. Physician Referral Order Update: Add follow‐up reason to order | ||||
| Follow‐up appointments are inconsistent | |||||
| VTE‐6: Incidence of potentially preventable VTE | Patients who received no VTE PPX prior to the VTE diagnostic test order date | Failure reasons related to other measures | NMH: 8% (8) | NMH: 2.4% (2) | |
| Patients who developed confirmed VTE during hospitalization | NMH general surgery: 6.7% (1) | NMH general surgery: 0% (0) | |||
| NMH general medicine: 13.5% (7) | NMH general medicine: 0% (0) | ||||
| SCIP‐VTE‐2 | Surgery patients who receive appropriate VTE prophylaxis within 24 hours prior to anesthesia start time to 24 hours after anesthesia end time | Standard enoxaparin administration time is 1300 and there is a gap between surgery end time to enoxaparin administration (i.e. patient may wait up to 23 hours for prophylaxis) | 11. Updated VTE prophylaxis‐surgical and medicine order set: added 1‐time and 2‐time heparin doses to enoxaparin order section | NMH: 99.5% (202) | NMH: 100% (104) |
| All selected surgery patients | NMH General Surgery: 98.5% (67) | NMH General Surgery: 100% (100) | |||
| NMH General Medicine: N/A | NMH General Medicine: N/A | ||||
| Additional interventions | Incomplete VTE prophylaxis information | 12. Updated IPC view | |||
| Inconsistent documentation across forms | 13. Updated ADL forms and iView nursing responses updated | ||||
| 14. Updated unit snapshot to mirror IPC view | |||||
| 15. Updated MPET: updated nursing task: standardize Not Given and Not Done Nursing Responses | |||||
METHODS
Setting
NMH is a tertiary referral and teaching hospital affiliated with the Feinberg School of Medicine of Northwestern University. It is the flagship of Northwestern Medicine, which also includes 4 community hospitals, a dedicated women's hospital, and outpatient and urgent care centers.[22] NMH is an 885‐bed hospital with approximately 50,000 inpatients admitted annually. This project, to evaluate the outcomes of the NMH VTE QI initiative, was reviewed and approved by the Northwestern University Institutional Review Board as an exempt activity.
Measures
The Joint Commission VTE measures were a product of the National Consensus Standards for the Prevention and Care of Deep Vein Thrombosis project between the Joint Commission and National Quality Forum (NQF). These 6 measures are endorsed by the NQF and aligned with the Centers of Medicare and Medicaid Services.[23] SCIP also has measures focusing on VTE prophylaxis. SCIP‐VTE‐2 focuses on prophylaxis in the perioperative period (the 24 hours prior to anesthesia start time to 24 hours postanesthesia end time). Specific measure definitions are in Table 1. All patients hospitalized at NMH were eligible for case abstraction; specific inclusion and exclusion criteria were based on measure specifics set forth by The Joint Commission and SCIP, and random cases were selected for abstraction utilizing the standard sampling methodology required for these measures. Case abstraction was performed by a nurse and validated by physicians.
The Intervention
Review of baseline performance on the core measures began in January 2013. Common failure points were identified first by electronic medical record (EMR) evaluation. Subsequently, focus groups with front‐line staff, close examination of EMR ordering logic for chemical and mechanical prophylaxis with the IT department, hospital floor observations, and evaluation of the patient education process during discharge were performed to further define the reasons for common failure points.
Fifteen data‐driven, focused interventions were then designed, pilot tested, and implemented throughout the hospital in May 2013, with iterative improvement of each component over the next 18 months (Table 1). This project utilized DMAIC PI methodology, and was carried out by a multidisciplinary team with representatives from the departments of surgery, internal medicine, anesthesia, gynecology, PI, clinical quality, pharmacy, analytics, information technology (IT), and nursing. Broadly, the 15 interventions consisted of (1) EMR alerts, (2) education initiatives, (3) new EMR order sets, and (4) other EMR changes.
EMR Alerts
Novel provider alerts were built into NMH's inpatient EMR platform (Cerner PowerChart; Cerner Corp., North Kansas City, MO) to address common mistakes contributing to failures on VTE‐1 (chemoprophylaxis) and VTE‐3 (overlap therapy). Although VTE‐1 failures were often multifactorial, missing documentation regarding reasons for no chemoprophylaxis given and failures to order chemoprophylaxis were 2 common drivers of failures. To address these 2 problems, a logic‐driven alert to force patient‐specific ordering of appropriate VTE prophylaxis was developed (Figure 1). VTE‐3 (overlap therapy) failures occurred due to clinician failure to order a full 5 days of overlap therapy when switching from parenteral anticoagulation to warfarin therapy; hence, to target VTE‐3 performance, new alerts reminding clinicians to meticulously order and document the overlap of parenteral VTE therapy and warfarin were developed. As part of the logic‐driven alert to improve patient‐specific ordering of appropriate VTE prophylaxis, we allowed for the inclusion of documentation of a contraindication to explain why VTE prophylaxis was not ordered.

Educational Initiatives
After consulting with attending physicians, residents, nurses, and practice managers at NMH to understand the potential drivers of VTE‐1 (chemoprophylaxis) failures, a team of clinicians and PI experts held 2‐part interactive educational sessions with nurses to address knowledge deficits. The first part focused on general VTE education (eg, the significance of the problem nationwide as well as at NMH, general signs and symptoms of VTE, risk factors for VTE, and NMH‐specific failure rates for mechanical and chemoprophylaxis). The second portion used a myth‐busting approach, in which common misunderstandings that frequently impede VTE prophylaxis (eg, a patient capable of ambulating does not need sequential compression devices (SCDs), or SCDs cannot be applied to a patient with acute or chronic DVT) were discussed. Educational efforts also addressed VTE‐5 (warfarin discharge instructions) performance; although nurses provided patient education with regard to home warfarin use, the timing was inconsistent. The VTE‐5 education provided nurses with a standardized method and time for educating patients about postdischarge warfarin use. EMR changes ensured that when warfarin was ordered, warfarin education automatically populated the nurse's task list, reminding them to educate their patients prior to discharge.
New EMR Order Sets
Previously existing order sets often made it difficult for physicians to order the correct dosing and timing of VTE prophylaxis, document contraindications to prophylaxis, and lacked the appropriate laboratory orders with therapy orders. New order sets were designed to facilitate compliance with VTE‐1 (chemoprophylaxis), VTE‐4 (platelet monitoring), VTE‐5 (warfarin discharge instructions), and SCIP‐VTE‐2 (perioperative prophylaxis) by updating lab and medication order listings, dosing choices, prophylaxis contraindications, reminders to monitor platelet counts per nomogram, and physician follow‐up reasons. When we considered our hospital's specific local factors, we came to the conclusion that risk stratification would be a difficult strategy to apply effectively as a component of the new order sets, mainly due to barriers related to buy‐in from physicians and nurses.
Other EMR Changes
Other interventions targeted at specific issues were programmed into the EMR. For example, a shortcut (known as a dotphrase in Cerner PowerChart) for inserting warfarin instructions into patient care documentation was available to physicians, but was misaligned to the standard warfarin instructions. In addition, the physician responsible for following up on a patient's first outpatient international normalized ratio was often omitted from the discharge instructions, potentially leaving patients without a physician to adjust their dosing appropriately. Adding this physician information, as well as aligning and updating all discharge instructions, allowed for clear, consistent patient instructions for home warfarin use. Moreover, EMR forms used by physicians and forms used by nurses to check for VTE prophylaxis were inconsistent, thus leading to potential confusion between physicians and nurses. Accordingly, regularly used EMR forms (eg, the interdisciplinary plan of care, and the unit summary page or unit snapshot) were updated and standardized.
Control Mechanisms
Concurrent with the implementation of the 15 interventions was the development of several control mechanisms to ensure sustained improvement. These mechanisms consisted of (1) an electronic proxy measure for VTE‐1 (chemoprophylaxis) and (2) monitoring of clinician (including physicians, nurses, and midlevel providers) responses to the EMR alerts, and (3) a comprehensive EMR unit report (Figure 2).
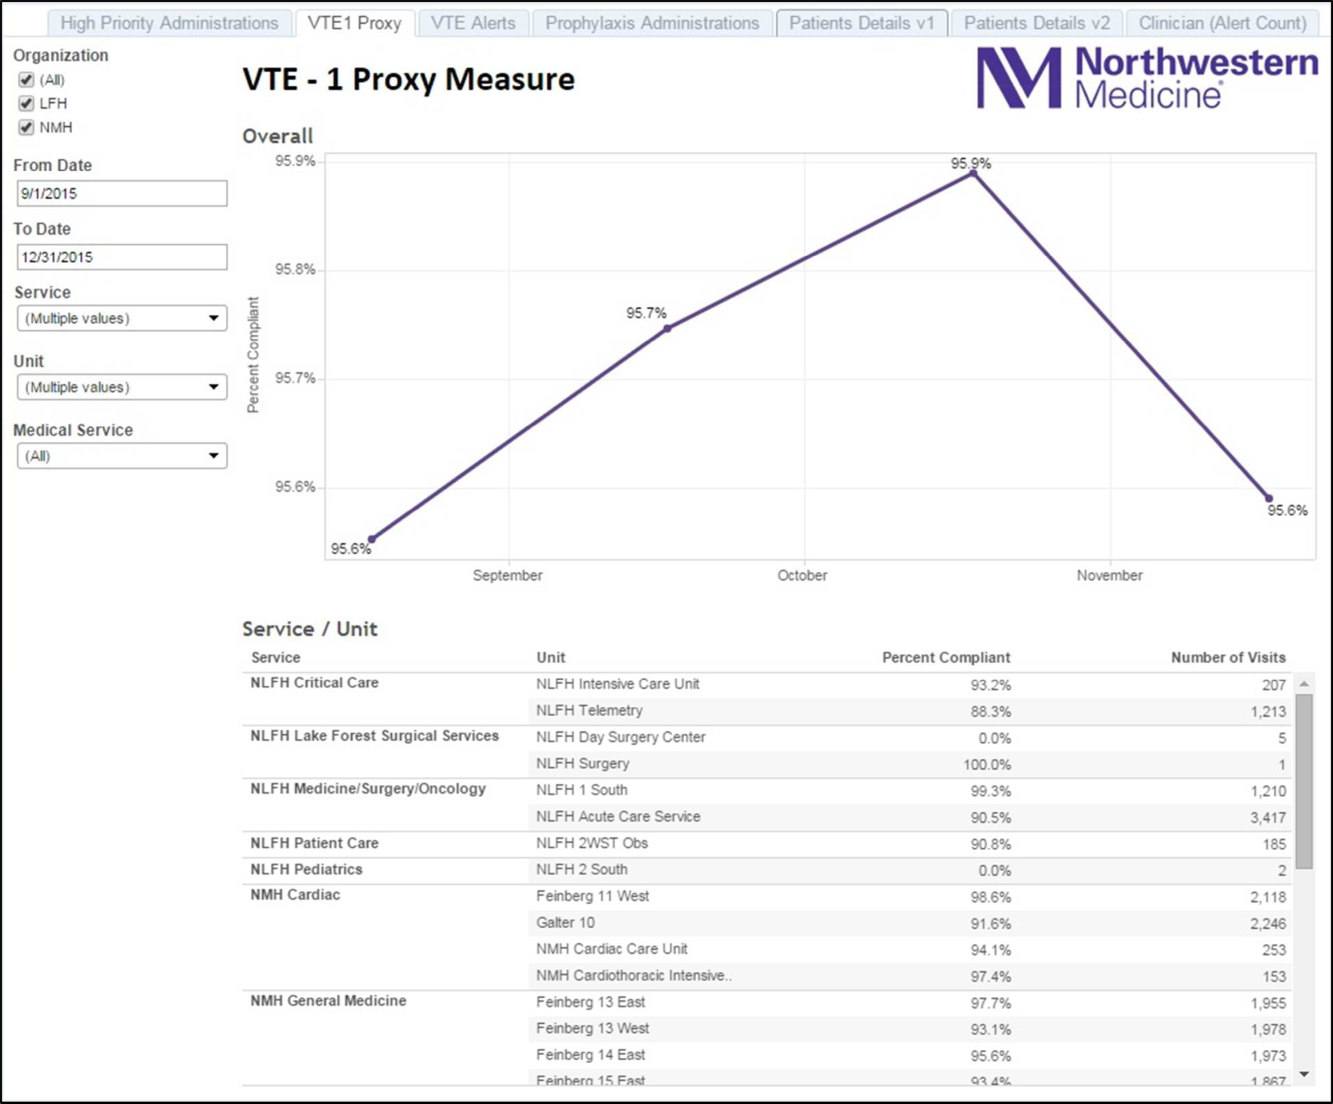
Proxy Measure
Because the Joint Commission core measures are abstracted from only a sample of cases, and a time lag existed between each failure on VTE‐1 (chemoprophylaxis) to the time the QI team learned of the failure, a proxy measure was created. This proxy measure is used as a stand‐in for actual VTE‐1 measure performance, but is generated in real time and reflects performance throughout the entire hospital instead of a random sample of cases. Using the Northwestern Electronic Data Warehouse (EDW), the NMH analytics team created a report reflecting thromboprophylaxis administration on each hospital unit currently and over time. Performance could also be examined for each individual hospital service line. Being able to track longitudinal performance by unit and by service line enabled the QI team to understand trends in performance. Having the ability to examine patients who missed doses over the preceding few hours allowed unit leadership to proactively act upon the failures in a timely fashion, instead of waiting to receive their performance on the Joint Commission core measures.
Physician Alert Response Monitoring
Monitoring of clinical responses to EMR alerts was embedded as standard practice. Because alert fatigue is a documented unintended consequence of heavy reliance on EMR alerts,[24, 25] physicians and nurses who failed to respond to alerts regarding VTE prophylaxis were identified. Interventions targeted toward this group of nonresponders are currently being developed and tested.
EDW Unit Report
This report allows unit managers to track potential failures real time and act prior to a failure occurring (eg, missed chemoprophylaxis dose) through the NMH EDW (Figure 2). These reports contained detailed order and administration data at the individual patient, nurse, and physician levels. Missed doses of VTE chemoprophylaxis were immediately fed back to unit nursing managers who utilized the report to perform a rapid drilldown to identify the root cause(s) of the failure, and then rectify the failure while the patient was still hospitalized.
Statistical Analyses
Hospital performance on the VTE core measures and SCIP‐VTE‐2 was determined by trained nurse abstractors, who abstract cases randomly sampled by the University of HealthCare Consortium, and adjudicate findings as per the Specifications Manual for National Hospital Inpatient Quality Measures. Performance in the period prior to the QI intervention and in the period following the QI intervention was documented as proportions of abstracted cases found to be compliant with measure specifications. Differences between the pre‐ and postintervention periods were compared using a binomial test, with a P value <0.05 considered significant. All analyses were performed using Stata version 13 (StataCorp, College Station, TX).
RESULTS
A total of 1679 cases were abstracted to obtain core measure performance in the time period before the DMAIC intervention phase (January 1, 2013May 1, 2013), and 1424 cases were abstracted to obtain core measure performance in the time period after the DMAIC intervention phase (October 1, 2014April 1, 2015).
Overall NMH performance on measures VTE‐1 (chemoprophylaxis) and VTE36 (overlap therapy, platelet monitoring, warfarin discharge instructions, hospital‐acquired [HA]‐VTE) improved significantly (P < 0.05) (Table 1). No improvement was seen on VTE‐2 (intensive care unit chemoprophylaxis) given that pre‐ and postintervention performance was 100%, which likely reflects previous hospital efforts to improve adherence to this measure. The percentage of patients who failed measure VTE‐6 (number of patients with HA‐VTE who did not have VTE prophylaxis ordered prior to diagnosis of their VTE) decreased from 8% to 2.4%, demonstrating improved VTE prevention prescribing habits in NMH providers rather than a change in VTE event rates (ie, if more patients receive prophylaxis, they cannot be included in the numerator). Performance on SCIP‐VTE‐2 (perioperative chemoprophylaxis) increased from 99.5% to 100% as well but did not reach significance given the baseline high performance.
Measure performance on the general surgery services was comparable to the general medical services, with 1 exception. VTE‐1 (chemoprophylaxis) performance was lower both prior to and following the QI intervention on general medicine services (medicine: 82.5% to 90.2% vs surgery: 94.4% to 97.6%). Recent performance on the VTE‐1 proxy measure has proven to be stable between 95% and 97% on surgery services. Physician response to alerts has increased slightly among the NMH general medicine practitioners (15.2%19.1%) but has been stable among NMH general surgery providers.
DISCUSSION
Our study demonstrates that a formal DMAIC QI project taken on by a multidisciplinary team (including clinicians from multiple specialties as well as personnel from IT, nursing, analytics, and PI) can be successfully implemented and can result in marked improvement in VTE core process measure performance. We used a multifaceted approach undertaken by the NMH VTE QI team, utilizing 15 data‐driven interventions including EMR alerts, education initiatives, and new EMR order sets. These were combined with strong control mechanisms to sustain gains.
Previously published studies on VTE prophylaxis practices found that projects combining both passive (ie, helping clinicians to remember to risk‐assess their patients' for VTE) and active (ie, assisting clinicians in appropriate prescribing practices) strategies are the most successful.[26] Our improvement on VTE‐1 can be compared to previous studies examining changes in ordering rates of VTE prophylaxis. Other QI projects that featured a combination of interventions observed similar significant increases in prophylaxis ordering.[27, 28] Our improvement on VTE‐1 (chemoprophylaxis) was significant, although the difference between pre‐ and postintervention performance varied by service type (general surgery vs general medicine vs other). The small increment of improvement on surgical services was likely attributable to a high baseline performance. Prior to 2013, surgically focused VTE prophylaxis QI efforts spurred by poor ACS‐NSQIP performance proved to be successful, thus resulting in high surgical prophylaxis rates at the outset of the hospital‐wide VTE DMAIC project.
One of the most significant unanticipated barriers to improving performance on VTE‐1 (chemoprophylaxis) included the different hospital subcultures on the medical floors as compared to the surgical floors. The surgical floors had higher rates of compliance with VTE‐1 than the general medicine floors both before and after the QI interventions. When the root causes were explored, the medical floors were found to have different ordering and administration patterns. These, in part, stemmed from differing guidelines[29] and standards in the literature regarding VTE prophylaxis for medical and surgical patients. Multiple discussions within the multidisciplinary QI team and with each involved department were held, focusing on the data regarding safe care in medical patients at low risk for a VTE. Subsequent EMR alerts alterations reflected the internal medicine VTE prophylaxis recommendations for medical patients, allowing that low‐risk patients could be assessed by the provider and given as a reason for foregoing VTE prophylaxis.
Barriers to VTE prophylaxis administration were encountered on the nursing front as well. Floor observations illustrated that chemoprophylaxis injections were often offered as an optional medication. Patients, when given the choice of receiving an injection or not, would understandably choose to forgo their heparin or enoxaparin shot. This missed dose was then documented as a patient refusal. This may not be a problem unique to NMH; 1 study demonstrated that almost 12% of chemoprophylaxis doses may not be administered, and a frequent reason may be due to patient refusal.[30] The lack of patient education regarding the importance of receiving chemical prophylaxis was an improvement opportunity at both the nursing and physician level. Not only did physicians and nurses take the responsibility to educate patients on the importance of receiving the proper prophylaxis, but nursing managers were made responsible for acting on missed doses that were listed on the real‐time performance reports for their units. Missed prophylaxis doses thus became an actionable item instead of an acceptable occurrence.
Culture change in an organization is difficult and necessitates sustained efforts. An important component of our project is our control mechanism, in which a real‐time, continuously updated unit report leverages data from our EDW to generate ongoing performance reports that are regularly reviewed by hospital leadership, clinical process owners, and, most importantly, frontline nurse managers. The unit‐specific reports allow nurse managers and clinical project owners to review prophylaxis failures on a case‐by‐case basis daily and to address and rectify the cause. In addition, the QI team tracks individual physician action taken in response to EMR alerts. As performance feedback to surgical trainees has been demonstrated to have a positive effect on ordering practices,[31] efforts to improve resident alert response rates by means of feedback and education are underway.
Limitations
Our results have to be interpreted within certain limitations. First, given that hospital performance on the VTE core measures is determined by abstracting only a sample of eligible cases, it is possible that our results were affected by sampling error. Second, because of problems with the VTE outcome measure due to surveillance bias, we are unable to draw any valid conclusions about changes in VTE event rates as a result of this QI project. Third, because many of our interventions were tailored to NMH's EMR platform and local hospital culture, it is possible that parts of our project are not readily generalizable to other hospitals; however, we believe that many components, such as the alert logics, can be easily tailored to other EMR platforms.
CONCLUSION
This institutional project was a large, multidisciplinary, and sustained undertaking that improved our performance on the VTE core measures. We believe that our bundle of EMR modifications, alerts (particularly the underlying alert logics), order sets, and standardization of summary EMR view can be adopted in other settings with appropriate adaptations to each hospital's specific local environment. Our focused educational interventions can also be easily adapted to other hospital settings. Perhaps the most important part of the project was the construction of novel control mechanisms that allow for tracking of physical alert response and for real‐time evaluation, audit, and feedback of prophylaxis ordering and administration practices at NMH. Taken as a whole, this bundle of resources to improve adherence to optimal VTE prophylaxis will facilitate future interventions targeted at reaching defect‐free care.
Disclosures: Nothing to report.
- , , , , . Executive summary: Antithrombotic Therapy and Prevention of Thrombosis, 9th ed: American College of Chest Physicians Evidence‐Based Clinical Practice Guidelines. Chest. 2012;141:7S–47S.
- , , , , . Estimated annual numbers of US acute‐care hospital patients at risk for venous thromboembolism. Am J Hematol. 2007;82:777–782.
- , , , et al. All‐cause and potentially disease‐related health care costs associated with venous thromboembolism in commercial, Medicare, and Medicaid beneficiaries. J Manag Care Pharm. 2012;18:363–374.
- , . Pulmonary embolism and deep vein thrombosis. Lancet. 2012;379:1835–1846.
- , , , . Long‐term outcomes after deep vein thrombosis: postphlebitic syndrome and quality of life. J Gen Intern Med. 2000;15:425–429.
- , , , et al. The long‐term clinical course of acute deep venous thrombosis. Ann Intern Med. 1996;125:1–7.
- , . The CMS ruling on venous thromboembolism after total knee or hip arthroplasty: weighing risks and benefits. JAMA. 2009;301:1063–1065.
- , , , et al. Hidden costs associated with venous thromboembolism: impact of lost productivity on employers and employees. J Occup Environ Med. 2014;56(9):979–985.
- , . Designing and implementing effective venous thromboembolism prevention protocols: lessons from collaborative efforts. J Thromb Thrombolysis. 2010;29:159–166.
- , , , . Reduction in fatal pulmonary embolism and venous thrombosis by perioperative administration of subcutaneous heparin. Overview of results of randomized trials in general, orthopedic, and urologic surgery. N Engl J Med. 1988;318:1162–1173.
- , , , , . Meta‐analysis: anticoagulant prophylaxis to prevent symptomatic venous thromboembolism in hospitalized medical patients. Ann Intern Med. 2007;146:278–288.
- , , , , . Meta‐analysis of low molecular weight heparin in the prevention of venous thromboembolism in general surgery. Br J Surg. 2001;88:913–930.
- , , , et al. Preventability of hospital‐acquired venous thromboembolism. JAMA Surg. 2015;150(9):912–915.
- , , , et al. Venous thromboembolism risk and prophylaxis in the acute care hospital setting (ENDORSE survey): findings in surgical patients. Ann Surg. 2010;251:330–338.
- , , , . Are surgical patients at risk of venous thromboembolism currently meeting the Surgical Care Improvement Project performance measure for appropriate and timely prophylaxis? J Thromb Thrombolysis. 2010;30:55–66.
- , , , et al. Evaluation of surveillance bias and the validity of the venous thromboembolism quality measure. JAMA. 2013;310:1482–1489.
- , , , , , . Evaluation of hospital factors associated with hospital postoperative venous thromboembolism imaging utilisation practices. BMJ Qual Saf. 2014;23(11):947–956.
- , , , et al. Association between hospital imaging use and venous thromboembolism events rates based on clinical data. Ann Surg. 2014;260:558–564; discussion 64–66.
- , , , , . Postoperative venous thromboembolism outcomes measure: analytic exploration of potential misclassification of hospital quality due to surveillance bias. Ann Surg. 2015;261(3):443–444.
- , , . The need to revisit VTE quality measures. JAMA. 2014;312:286–287.
- . Facilitating quality improvement: pushing the pendulum back toward process measures. JAMA. 2015;314:1333–1334.
- Northwestern Medicine website. Available at: https://www.nm.org/locations‐at‐northwestern‐medicine. Accessed February 23, 2016.
- Venous thromboembolism. The Joint Commission website. Available at: http://www.jointcommission.org/venous_thromboembolism. Accessed February 23, 2016.
- , , , , . Some unintended consequences of clinical decision support systems. AMIA Annu Symp Proc. 2007:26–30.
- , , , . Overriding of drug safety alerts in computerized physician order entry. J Am Med Inform Assoc. 2006;13:138–147.
- , , , et al. A systematic review of strategies to improve prophylaxis for venous thromboembolism in hospitals. Ann Surg. 2005;241:397–415.
- , , , et al. Optimizing prevention of hospital‐acquired venous thromboembolism (VTE): prospective validation of a VTE risk assessment model. J Hosp Med. 2010;5:10–18.
- , , . Improving the use of venous thromboembolism prophylaxis in an Australian teaching hospital. Qual Saf Health Care. 2009;18:408–412.
- , , , , . Venous thromboembolism prophylaxis in hospitalized patients: a clinical practice guideline from the American College of Physicians. Ann Intern Med. 2011;155:625–632.
- , , , et al. Patterns of non‐administration of ordered doses of venous thromboembolism prophylaxis: implications for novel intervention strategies. PLoS One. 2013;8:e66311.
- , , , et al. Individualized performance feedback to surgical residents improves appropriate venous thromboembolism prophylaxis prescription and reduces potentially preventable VTE: a prospective cohort study [published online November 25, 2015]. Ann Surg. doi: 10.1097/SLA.0000000000001512.
Venous thromboembolism (VTE), which includes deep vein thrombosis (DVT) and pulmonary embolism, is a significant cause of morbidity and mortality in the United States among hospitalized patients.[1, 2, 3, 4, 5, 6] Although it may not be possible to completely eradicate VTE events,[7] chemical and/or mechanical prophylaxis can reduce VTE rates by up to 74% to 86%,[8, 9, 10] and meta‐analyses have demonstrated the benefit of VTE prophylaxis in the inpatient population.[11, 12] Despite evidence‐based guidelines regarding the appropriate type, duration, and dosing of prophylaxis, thromboprophylaxis has been found to be underutilized in the inpatient setting.[13, 14, 15]
Northwestern Memorial Hospital (NMH) historically performed poorly on VTE outcome measures. VTE in the surgical patient population was an especially glaring problem, as NMH was persistently found to be a risk‐adjusted poor performer in the American College of Surgeons National Surgical Quality Improvement Project (ACS‐NSQIP).
However, VTE outcome measures have been shown to be problematic due to their susceptibility to surveillance bias; that is, variation in the ordering of screening or diagnostic VTE imaging studies between hospitals leads to variable VTE rates (the more you look, the more you find).[16, 17, 18, 19] More vigilant hospitals that have a lower threshold to order an imaging study may find higher occurrences of VTE, and paradoxically be deemed a poor performer. Surveillance bias and the lack of validity of the VTE outcome measurement highlighted the importance of utilizing process‐of‐care measures in assessing hospital VTE prevention efforts.[20, 21] Thus, when the Joint Commission enacted 6 new VTE core process‐of‐care measures on January 1, 2013 to monitor hospital performance on VTE prophylaxis administration and VTE treatment (Table 1), NMH undertook a hospital‐wide quality‐improvement (QI) project utilizing the define‐measure‐analyze‐improve‐control (DMAIC) process improvement (PI) methodology to optimize their performance on these core measures as well as the Surgical Care Improvement Project (SCIP) SCIP‐VTE‐2 measure. In this article, we describe the QI effort undertaken at NMH to improve hospital‐level measure performance and the outcomes of this effort.
| VTE Measure | Measure Calculation | Description of Issues | Interventions | Preintervention Performance, % (N)* | Postintervention Performance, % (N) |
|---|---|---|---|---|---|
| |||||
| VTE‐1: VTE PPX | Patients who received VTE prophylaxis or have documentation why no VTE prophylaxis was given | Missing documentation (both chemical and mechanical); prophylaxis ordered, but not administered; patient refusals and opportunity to increase patient education regarding prophylaxis | 1. Enhanced, individualized VTE prophylaxis alert: alert incorporated order, administration, mechanical PPX, lab exclusion and contraindication details | NMH: 86.6% (174) | NMH: 93.6% (162) |
| All patients | Undocumented contraindication reasons | 2. Nursing education initiative: back‐to‐basics VTE education initiative to help increase the administration of VTE prophylaxis and improve patient education resulting in fewer patient refusals and missed doses | NMH general surgery: 94.4% (34) | NMH general surgery: 97.6% (41) | |
| Inconsistent monitoring and patient education | 3. Updated VTE prophylaxis surgical and medicine order set: updated order listing, heparin TID setting and contraindications | NMH general medicine: 82.5% (115) | NMH general medicine: 90.2% (85) | ||
| VTE‐2: ICU VTE PPX | Patients who received VTE prophylaxis or have documentation why no VTE prophylaxis was given | See interventions 1 through 3 | NMH: 100% (58) | NMH: 95.8% (69) | |
| Patients directly admitted or transferred to the ICU | NMH general surgery: 100% (11) | NMH general surgery: 100% (10) | |||
| NMH general medicine: 100% (40) | NMH general medicine: 100% (51) | ||||
| VTE‐3: VTE patients with anticoagulation overlap therapy | Patients who received overlap therapy of parenteral anticoagulation and warfarin therapy | Gaps in documentation and administration of overlap therapy for 5 days | 4. Overlap therapy alert at discharge: document VTE on diagnosis list with alert to either (1) document reason for discontinuation of parental therapy or (2) prescribe parental anticoagulation during hospitalization or at discharge | NMH: 95.8% (159) | NMH: 100% (105) |
| Patients with confirmed VTE who received warfarin | 5. Overlap therapy alert during hospitalization: documentation alert on the day therapy discontinued | NMH general surgery: 85.7% (12) | NMH general surgery: 100% (16) | ||
| NMH general medicine: 97.0% (129) | NMH general medicine: 100% (79) | ||||
| VTE‐4: VTE patients receiving unfractionated dosages/platelet count monitoring by protocol or nomogram | Patients who have IV UFH therapy dosages and platelet counts monitored according to defined parameters such as a nomogram or protocol | Missing required language on IV UFH orders and order may not include preselected CBC order | 6. Updated heparin order sets: reminder to monitor platelet counts per nomogram and preselect CBC order | NMH: 73.7% (98) | NMH: 100% (74) |
| Patients with confirmed VTE receiving IV UFH therapy | NMH general surgery: 56.3% (7) | NMH general surgery: 100% (9) | |||
| NMH general medicine: 83.8% (88) | NMH general medicine: 100% (52) | ||||
| VTE‐5: VTE warfarin discharge instructions | Patients with documentation that they or their caregivers were given written discharge instructions or other educational material about warfarin | Discharge process is not standardized | 7. Warfarin Patient Education Task: automate nursing task for warfarin order set, check individual warfarin education excluding consult orders | NMH: 9.6% (12) | NMH: 87.5% (63) |
| Patients with confirmed VTE discharged on warfarin therapy | Patient education during hospitalization varies | 8. Warfarin dotphrase: new warfarin/Coumadin dotphrase aligned with department and core measure requirements | NMH general surgery: 0% (0) | NMH general surgery: 100% (11) | |
| No standardized process for initiating and tracking warfarin education during hospitalization | 9. Department Warfarin Instructions Phase II: update department warfarin language, automate warfarin education task | NMH general medicine: 11.3% (12) | NMH general medicine: 85.5% (50) | ||
| Warfarin special instructions for discharge is not aligned with the EMR dotphrase | 10. Physician Referral Order Update: Add follow‐up reason to order | ||||
| Follow‐up appointments are inconsistent | |||||
| VTE‐6: Incidence of potentially preventable VTE | Patients who received no VTE PPX prior to the VTE diagnostic test order date | Failure reasons related to other measures | NMH: 8% (8) | NMH: 2.4% (2) | |
| Patients who developed confirmed VTE during hospitalization | NMH general surgery: 6.7% (1) | NMH general surgery: 0% (0) | |||
| NMH general medicine: 13.5% (7) | NMH general medicine: 0% (0) | ||||
| SCIP‐VTE‐2 | Surgery patients who receive appropriate VTE prophylaxis within 24 hours prior to anesthesia start time to 24 hours after anesthesia end time | Standard enoxaparin administration time is 1300 and there is a gap between surgery end time to enoxaparin administration (i.e. patient may wait up to 23 hours for prophylaxis) | 11. Updated VTE prophylaxis‐surgical and medicine order set: added 1‐time and 2‐time heparin doses to enoxaparin order section | NMH: 99.5% (202) | NMH: 100% (104) |
| All selected surgery patients | NMH General Surgery: 98.5% (67) | NMH General Surgery: 100% (100) | |||
| NMH General Medicine: N/A | NMH General Medicine: N/A | ||||
| Additional interventions | Incomplete VTE prophylaxis information | 12. Updated IPC view | |||
| Inconsistent documentation across forms | 13. Updated ADL forms and iView nursing responses updated | ||||
| 14. Updated unit snapshot to mirror IPC view | |||||
| 15. Updated MPET: updated nursing task: standardize Not Given and Not Done Nursing Responses | |||||
METHODS
Setting
NMH is a tertiary referral and teaching hospital affiliated with the Feinberg School of Medicine of Northwestern University. It is the flagship of Northwestern Medicine, which also includes 4 community hospitals, a dedicated women's hospital, and outpatient and urgent care centers.[22] NMH is an 885‐bed hospital with approximately 50,000 inpatients admitted annually. This project, to evaluate the outcomes of the NMH VTE QI initiative, was reviewed and approved by the Northwestern University Institutional Review Board as an exempt activity.
Measures
The Joint Commission VTE measures were a product of the National Consensus Standards for the Prevention and Care of Deep Vein Thrombosis project between the Joint Commission and National Quality Forum (NQF). These 6 measures are endorsed by the NQF and aligned with the Centers of Medicare and Medicaid Services.[23] SCIP also has measures focusing on VTE prophylaxis. SCIP‐VTE‐2 focuses on prophylaxis in the perioperative period (the 24 hours prior to anesthesia start time to 24 hours postanesthesia end time). Specific measure definitions are in Table 1. All patients hospitalized at NMH were eligible for case abstraction; specific inclusion and exclusion criteria were based on measure specifics set forth by The Joint Commission and SCIP, and random cases were selected for abstraction utilizing the standard sampling methodology required for these measures. Case abstraction was performed by a nurse and validated by physicians.
The Intervention
Review of baseline performance on the core measures began in January 2013. Common failure points were identified first by electronic medical record (EMR) evaluation. Subsequently, focus groups with front‐line staff, close examination of EMR ordering logic for chemical and mechanical prophylaxis with the IT department, hospital floor observations, and evaluation of the patient education process during discharge were performed to further define the reasons for common failure points.
Fifteen data‐driven, focused interventions were then designed, pilot tested, and implemented throughout the hospital in May 2013, with iterative improvement of each component over the next 18 months (Table 1). This project utilized DMAIC PI methodology, and was carried out by a multidisciplinary team with representatives from the departments of surgery, internal medicine, anesthesia, gynecology, PI, clinical quality, pharmacy, analytics, information technology (IT), and nursing. Broadly, the 15 interventions consisted of (1) EMR alerts, (2) education initiatives, (3) new EMR order sets, and (4) other EMR changes.
EMR Alerts
Novel provider alerts were built into NMH's inpatient EMR platform (Cerner PowerChart; Cerner Corp., North Kansas City, MO) to address common mistakes contributing to failures on VTE‐1 (chemoprophylaxis) and VTE‐3 (overlap therapy). Although VTE‐1 failures were often multifactorial, missing documentation regarding reasons for no chemoprophylaxis given and failures to order chemoprophylaxis were 2 common drivers of failures. To address these 2 problems, a logic‐driven alert to force patient‐specific ordering of appropriate VTE prophylaxis was developed (Figure 1). VTE‐3 (overlap therapy) failures occurred due to clinician failure to order a full 5 days of overlap therapy when switching from parenteral anticoagulation to warfarin therapy; hence, to target VTE‐3 performance, new alerts reminding clinicians to meticulously order and document the overlap of parenteral VTE therapy and warfarin were developed. As part of the logic‐driven alert to improve patient‐specific ordering of appropriate VTE prophylaxis, we allowed for the inclusion of documentation of a contraindication to explain why VTE prophylaxis was not ordered.
Educational Initiatives
After consulting with attending physicians, residents, nurses, and practice managers at NMH to understand the potential drivers of VTE‐1 (chemoprophylaxis) failures, a team of clinicians and PI experts held 2‐part interactive educational sessions with nurses to address knowledge deficits. The first part focused on general VTE education (eg, the significance of the problem nationwide as well as at NMH, general signs and symptoms of VTE, risk factors for VTE, and NMH‐specific failure rates for mechanical and chemoprophylaxis). The second portion used a myth‐busting approach, in which common misunderstandings that frequently impede VTE prophylaxis (eg, a patient capable of ambulating does not need sequential compression devices (SCDs), or SCDs cannot be applied to a patient with acute or chronic DVT) were discussed. Educational efforts also addressed VTE‐5 (warfarin discharge instructions) performance; although nurses provided patient education with regard to home warfarin use, the timing was inconsistent. The VTE‐5 education provided nurses with a standardized method and time for educating patients about postdischarge warfarin use. EMR changes ensured that when warfarin was ordered, warfarin education automatically populated the nurse's task list, reminding them to educate their patients prior to discharge.
New EMR Order Sets
Previously existing order sets often made it difficult for physicians to order the correct dosing and timing of VTE prophylaxis, document contraindications to prophylaxis, and lacked the appropriate laboratory orders with therapy orders. New order sets were designed to facilitate compliance with VTE‐1 (chemoprophylaxis), VTE‐4 (platelet monitoring), VTE‐5 (warfarin discharge instructions), and SCIP‐VTE‐2 (perioperative prophylaxis) by updating lab and medication order listings, dosing choices, prophylaxis contraindications, reminders to monitor platelet counts per nomogram, and physician follow‐up reasons. When we considered our hospital's specific local factors, we came to the conclusion that risk stratification would be a difficult strategy to apply effectively as a component of the new order sets, mainly due to barriers related to buy‐in from physicians and nurses.
Other EMR Changes
Other interventions targeted at specific issues were programmed into the EMR. For example, a shortcut (known as a dotphrase in Cerner PowerChart) for inserting warfarin instructions into patient care documentation was available to physicians, but was misaligned to the standard warfarin instructions. In addition, the physician responsible for following up on a patient's first outpatient international normalized ratio was often omitted from the discharge instructions, potentially leaving patients without a physician to adjust their dosing appropriately. Adding this physician information, as well as aligning and updating all discharge instructions, allowed for clear, consistent patient instructions for home warfarin use. Moreover, EMR forms used by physicians and forms used by nurses to check for VTE prophylaxis were inconsistent, thus leading to potential confusion between physicians and nurses. Accordingly, regularly used EMR forms (eg, the interdisciplinary plan of care, and the unit summary page or unit snapshot) were updated and standardized.
Control Mechanisms
Concurrent with the implementation of the 15 interventions was the development of several control mechanisms to ensure sustained improvement. These mechanisms consisted of (1) an electronic proxy measure for VTE‐1 (chemoprophylaxis) and (2) monitoring of clinician (including physicians, nurses, and midlevel providers) responses to the EMR alerts, and (3) a comprehensive EMR unit report (Figure 2).
Proxy Measure
Because the Joint Commission core measures are abstracted from only a sample of cases, and a time lag existed between each failure on VTE‐1 (chemoprophylaxis) to the time the QI team learned of the failure, a proxy measure was created. This proxy measure is used as a stand‐in for actual VTE‐1 measure performance, but is generated in real time and reflects performance throughout the entire hospital instead of a random sample of cases. Using the Northwestern Electronic Data Warehouse (EDW), the NMH analytics team created a report reflecting thromboprophylaxis administration on each hospital unit currently and over time. Performance could also be examined for each individual hospital service line. Being able to track longitudinal performance by unit and by service line enabled the QI team to understand trends in performance. Having the ability to examine patients who missed doses over the preceding few hours allowed unit leadership to proactively act upon the failures in a timely fashion, instead of waiting to receive their performance on the Joint Commission core measures.
Physician Alert Response Monitoring
Monitoring of clinical responses to EMR alerts was embedded as standard practice. Because alert fatigue is a documented unintended consequence of heavy reliance on EMR alerts,[24, 25] physicians and nurses who failed to respond to alerts regarding VTE prophylaxis were identified. Interventions targeted toward this group of nonresponders are currently being developed and tested.
EDW Unit Report
This report allows unit managers to track potential failures real time and act prior to a failure occurring (eg, missed chemoprophylaxis dose) through the NMH EDW (Figure 2). These reports contained detailed order and administration data at the individual patient, nurse, and physician levels. Missed doses of VTE chemoprophylaxis were immediately fed back to unit nursing managers who utilized the report to perform a rapid drilldown to identify the root cause(s) of the failure, and then rectify the failure while the patient was still hospitalized.
Statistical Analyses
Hospital performance on the VTE core measures and SCIP‐VTE‐2 was determined by trained nurse abstractors, who abstract cases randomly sampled by the University of HealthCare Consortium, and adjudicate findings as per the Specifications Manual for National Hospital Inpatient Quality Measures. Performance in the period prior to the QI intervention and in the period following the QI intervention was documented as proportions of abstracted cases found to be compliant with measure specifications. Differences between the pre‐ and postintervention periods were compared using a binomial test, with a P value <0.05 considered significant. All analyses were performed using Stata version 13 (StataCorp, College Station, TX).
RESULTS
A total of 1679 cases were abstracted to obtain core measure performance in the time period before the DMAIC intervention phase (January 1, 2013May 1, 2013), and 1424 cases were abstracted to obtain core measure performance in the time period after the DMAIC intervention phase (October 1, 2014April 1, 2015).
Overall NMH performance on measures VTE‐1 (chemoprophylaxis) and VTE36 (overlap therapy, platelet monitoring, warfarin discharge instructions, hospital‐acquired [HA]‐VTE) improved significantly (P < 0.05) (Table 1). No improvement was seen on VTE‐2 (intensive care unit chemoprophylaxis) given that pre‐ and postintervention performance was 100%, which likely reflects previous hospital efforts to improve adherence to this measure. The percentage of patients who failed measure VTE‐6 (number of patients with HA‐VTE who did not have VTE prophylaxis ordered prior to diagnosis of their VTE) decreased from 8% to 2.4%, demonstrating improved VTE prevention prescribing habits in NMH providers rather than a change in VTE event rates (ie, if more patients receive prophylaxis, they cannot be included in the numerator). Performance on SCIP‐VTE‐2 (perioperative chemoprophylaxis) increased from 99.5% to 100% as well but did not reach significance given the baseline high performance.
Measure performance on the general surgery services was comparable to the general medical services, with 1 exception. VTE‐1 (chemoprophylaxis) performance was lower both prior to and following the QI intervention on general medicine services (medicine: 82.5% to 90.2% vs surgery: 94.4% to 97.6%). Recent performance on the VTE‐1 proxy measure has proven to be stable between 95% and 97% on surgery services. Physician response to alerts has increased slightly among the NMH general medicine practitioners (15.2%19.1%) but has been stable among NMH general surgery providers.
DISCUSSION
Our study demonstrates that a formal DMAIC QI project taken on by a multidisciplinary team (including clinicians from multiple specialties as well as personnel from IT, nursing, analytics, and PI) can be successfully implemented and can result in marked improvement in VTE core process measure performance. We used a multifaceted approach undertaken by the NMH VTE QI team, utilizing 15 data‐driven interventions including EMR alerts, education initiatives, and new EMR order sets. These were combined with strong control mechanisms to sustain gains.
Previously published studies on VTE prophylaxis practices found that projects combining both passive (ie, helping clinicians to remember to risk‐assess their patients' for VTE) and active (ie, assisting clinicians in appropriate prescribing practices) strategies are the most successful.[26] Our improvement on VTE‐1 can be compared to previous studies examining changes in ordering rates of VTE prophylaxis. Other QI projects that featured a combination of interventions observed similar significant increases in prophylaxis ordering.[27, 28] Our improvement on VTE‐1 (chemoprophylaxis) was significant, although the difference between pre‐ and postintervention performance varied by service type (general surgery vs general medicine vs other). The small increment of improvement on surgical services was likely attributable to a high baseline performance. Prior to 2013, surgically focused VTE prophylaxis QI efforts spurred by poor ACS‐NSQIP performance proved to be successful, thus resulting in high surgical prophylaxis rates at the outset of the hospital‐wide VTE DMAIC project.
One of the most significant unanticipated barriers to improving performance on VTE‐1 (chemoprophylaxis) included the different hospital subcultures on the medical floors as compared to the surgical floors. The surgical floors had higher rates of compliance with VTE‐1 than the general medicine floors both before and after the QI interventions. When the root causes were explored, the medical floors were found to have different ordering and administration patterns. These, in part, stemmed from differing guidelines[29] and standards in the literature regarding VTE prophylaxis for medical and surgical patients. Multiple discussions within the multidisciplinary QI team and with each involved department were held, focusing on the data regarding safe care in medical patients at low risk for a VTE. Subsequent EMR alerts alterations reflected the internal medicine VTE prophylaxis recommendations for medical patients, allowing that low‐risk patients could be assessed by the provider and given as a reason for foregoing VTE prophylaxis.
Barriers to VTE prophylaxis administration were encountered on the nursing front as well. Floor observations illustrated that chemoprophylaxis injections were often offered as an optional medication. Patients, when given the choice of receiving an injection or not, would understandably choose to forgo their heparin or enoxaparin shot. This missed dose was then documented as a patient refusal. This may not be a problem unique to NMH; 1 study demonstrated that almost 12% of chemoprophylaxis doses may not be administered, and a frequent reason may be due to patient refusal.[30] The lack of patient education regarding the importance of receiving chemical prophylaxis was an improvement opportunity at both the nursing and physician level. Not only did physicians and nurses take the responsibility to educate patients on the importance of receiving the proper prophylaxis, but nursing managers were made responsible for acting on missed doses that were listed on the real‐time performance reports for their units. Missed prophylaxis doses thus became an actionable item instead of an acceptable occurrence.
Culture change in an organization is difficult and necessitates sustained efforts. An important component of our project is our control mechanism, in which a real‐time, continuously updated unit report leverages data from our EDW to generate ongoing performance reports that are regularly reviewed by hospital leadership, clinical process owners, and, most importantly, frontline nurse managers. The unit‐specific reports allow nurse managers and clinical project owners to review prophylaxis failures on a case‐by‐case basis daily and to address and rectify the cause. In addition, the QI team tracks individual physician action taken in response to EMR alerts. As performance feedback to surgical trainees has been demonstrated to have a positive effect on ordering practices,[31] efforts to improve resident alert response rates by means of feedback and education are underway.
Limitations
Our results have to be interpreted within certain limitations. First, given that hospital performance on the VTE core measures is determined by abstracting only a sample of eligible cases, it is possible that our results were affected by sampling error. Second, because of problems with the VTE outcome measure due to surveillance bias, we are unable to draw any valid conclusions about changes in VTE event rates as a result of this QI project. Third, because many of our interventions were tailored to NMH's EMR platform and local hospital culture, it is possible that parts of our project are not readily generalizable to other hospitals; however, we believe that many components, such as the alert logics, can be easily tailored to other EMR platforms.
CONCLUSION
This institutional project was a large, multidisciplinary, and sustained undertaking that improved our performance on the VTE core measures. We believe that our bundle of EMR modifications, alerts (particularly the underlying alert logics), order sets, and standardization of summary EMR view can be adopted in other settings with appropriate adaptations to each hospital's specific local environment. Our focused educational interventions can also be easily adapted to other hospital settings. Perhaps the most important part of the project was the construction of novel control mechanisms that allow for tracking of physical alert response and for real‐time evaluation, audit, and feedback of prophylaxis ordering and administration practices at NMH. Taken as a whole, this bundle of resources to improve adherence to optimal VTE prophylaxis will facilitate future interventions targeted at reaching defect‐free care.
Disclosures: Nothing to report.
- , , , , . Executive summary: Antithrombotic Therapy and Prevention of Thrombosis, 9th ed: American College of Chest Physicians Evidence‐Based Clinical Practice Guidelines. Chest. 2012;141:7S–47S.
- , , , , . Estimated annual numbers of US acute‐care hospital patients at risk for venous thromboembolism. Am J Hematol. 2007;82:777–782.
- , , , et al. All‐cause and potentially disease‐related health care costs associated with venous thromboembolism in commercial, Medicare, and Medicaid beneficiaries. J Manag Care Pharm. 2012;18:363–374.
- , . Pulmonary embolism and deep vein thrombosis. Lancet. 2012;379:1835–1846.
- , , , . Long‐term outcomes after deep vein thrombosis: postphlebitic syndrome and quality of life. J Gen Intern Med. 2000;15:425–429.
- , , , et al. The long‐term clinical course of acute deep venous thrombosis. Ann Intern Med. 1996;125:1–7.
- , . The CMS ruling on venous thromboembolism after total knee or hip arthroplasty: weighing risks and benefits. JAMA. 2009;301:1063–1065.
- , , , et al. Hidden costs associated with venous thromboembolism: impact of lost productivity on employers and employees. J Occup Environ Med. 2014;56(9):979–985.
- , . Designing and implementing effective venous thromboembolism prevention protocols: lessons from collaborative efforts. J Thromb Thrombolysis. 2010;29:159–166.
- , , , . Reduction in fatal pulmonary embolism and venous thrombosis by perioperative administration of subcutaneous heparin. Overview of results of randomized trials in general, orthopedic, and urologic surgery. N Engl J Med. 1988;318:1162–1173.
- , , , , . Meta‐analysis: anticoagulant prophylaxis to prevent symptomatic venous thromboembolism in hospitalized medical patients. Ann Intern Med. 2007;146:278–288.
- , , , , . Meta‐analysis of low molecular weight heparin in the prevention of venous thromboembolism in general surgery. Br J Surg. 2001;88:913–930.
- , , , et al. Preventability of hospital‐acquired venous thromboembolism. JAMA Surg. 2015;150(9):912–915.
- , , , et al. Venous thromboembolism risk and prophylaxis in the acute care hospital setting (ENDORSE survey): findings in surgical patients. Ann Surg. 2010;251:330–338.
- , , , . Are surgical patients at risk of venous thromboembolism currently meeting the Surgical Care Improvement Project performance measure for appropriate and timely prophylaxis? J Thromb Thrombolysis. 2010;30:55–66.
- , , , et al. Evaluation of surveillance bias and the validity of the venous thromboembolism quality measure. JAMA. 2013;310:1482–1489.
- , , , , , . Evaluation of hospital factors associated with hospital postoperative venous thromboembolism imaging utilisation practices. BMJ Qual Saf. 2014;23(11):947–956.
- , , , et al. Association between hospital imaging use and venous thromboembolism events rates based on clinical data. Ann Surg. 2014;260:558–564; discussion 64–66.
- , , , , . Postoperative venous thromboembolism outcomes measure: analytic exploration of potential misclassification of hospital quality due to surveillance bias. Ann Surg. 2015;261(3):443–444.
- , , . The need to revisit VTE quality measures. JAMA. 2014;312:286–287.
- . Facilitating quality improvement: pushing the pendulum back toward process measures. JAMA. 2015;314:1333–1334.
- Northwestern Medicine website. Available at: https://www.nm.org/locations‐at‐northwestern‐medicine. Accessed February 23, 2016.
- Venous thromboembolism. The Joint Commission website. Available at: http://www.jointcommission.org/venous_thromboembolism. Accessed February 23, 2016.
- , , , , . Some unintended consequences of clinical decision support systems. AMIA Annu Symp Proc. 2007:26–30.
- , , , . Overriding of drug safety alerts in computerized physician order entry. J Am Med Inform Assoc. 2006;13:138–147.
- , , , et al. A systematic review of strategies to improve prophylaxis for venous thromboembolism in hospitals. Ann Surg. 2005;241:397–415.
- , , , et al. Optimizing prevention of hospital‐acquired venous thromboembolism (VTE): prospective validation of a VTE risk assessment model. J Hosp Med. 2010;5:10–18.
- , , . Improving the use of venous thromboembolism prophylaxis in an Australian teaching hospital. Qual Saf Health Care. 2009;18:408–412.
- , , , , . Venous thromboembolism prophylaxis in hospitalized patients: a clinical practice guideline from the American College of Physicians. Ann Intern Med. 2011;155:625–632.
- , , , et al. Patterns of non‐administration of ordered doses of venous thromboembolism prophylaxis: implications for novel intervention strategies. PLoS One. 2013;8:e66311.
- , , , et al. Individualized performance feedback to surgical residents improves appropriate venous thromboembolism prophylaxis prescription and reduces potentially preventable VTE: a prospective cohort study [published online November 25, 2015]. Ann Surg. doi: 10.1097/SLA.0000000000001512.
© 2016 Society of Hospital Medicine
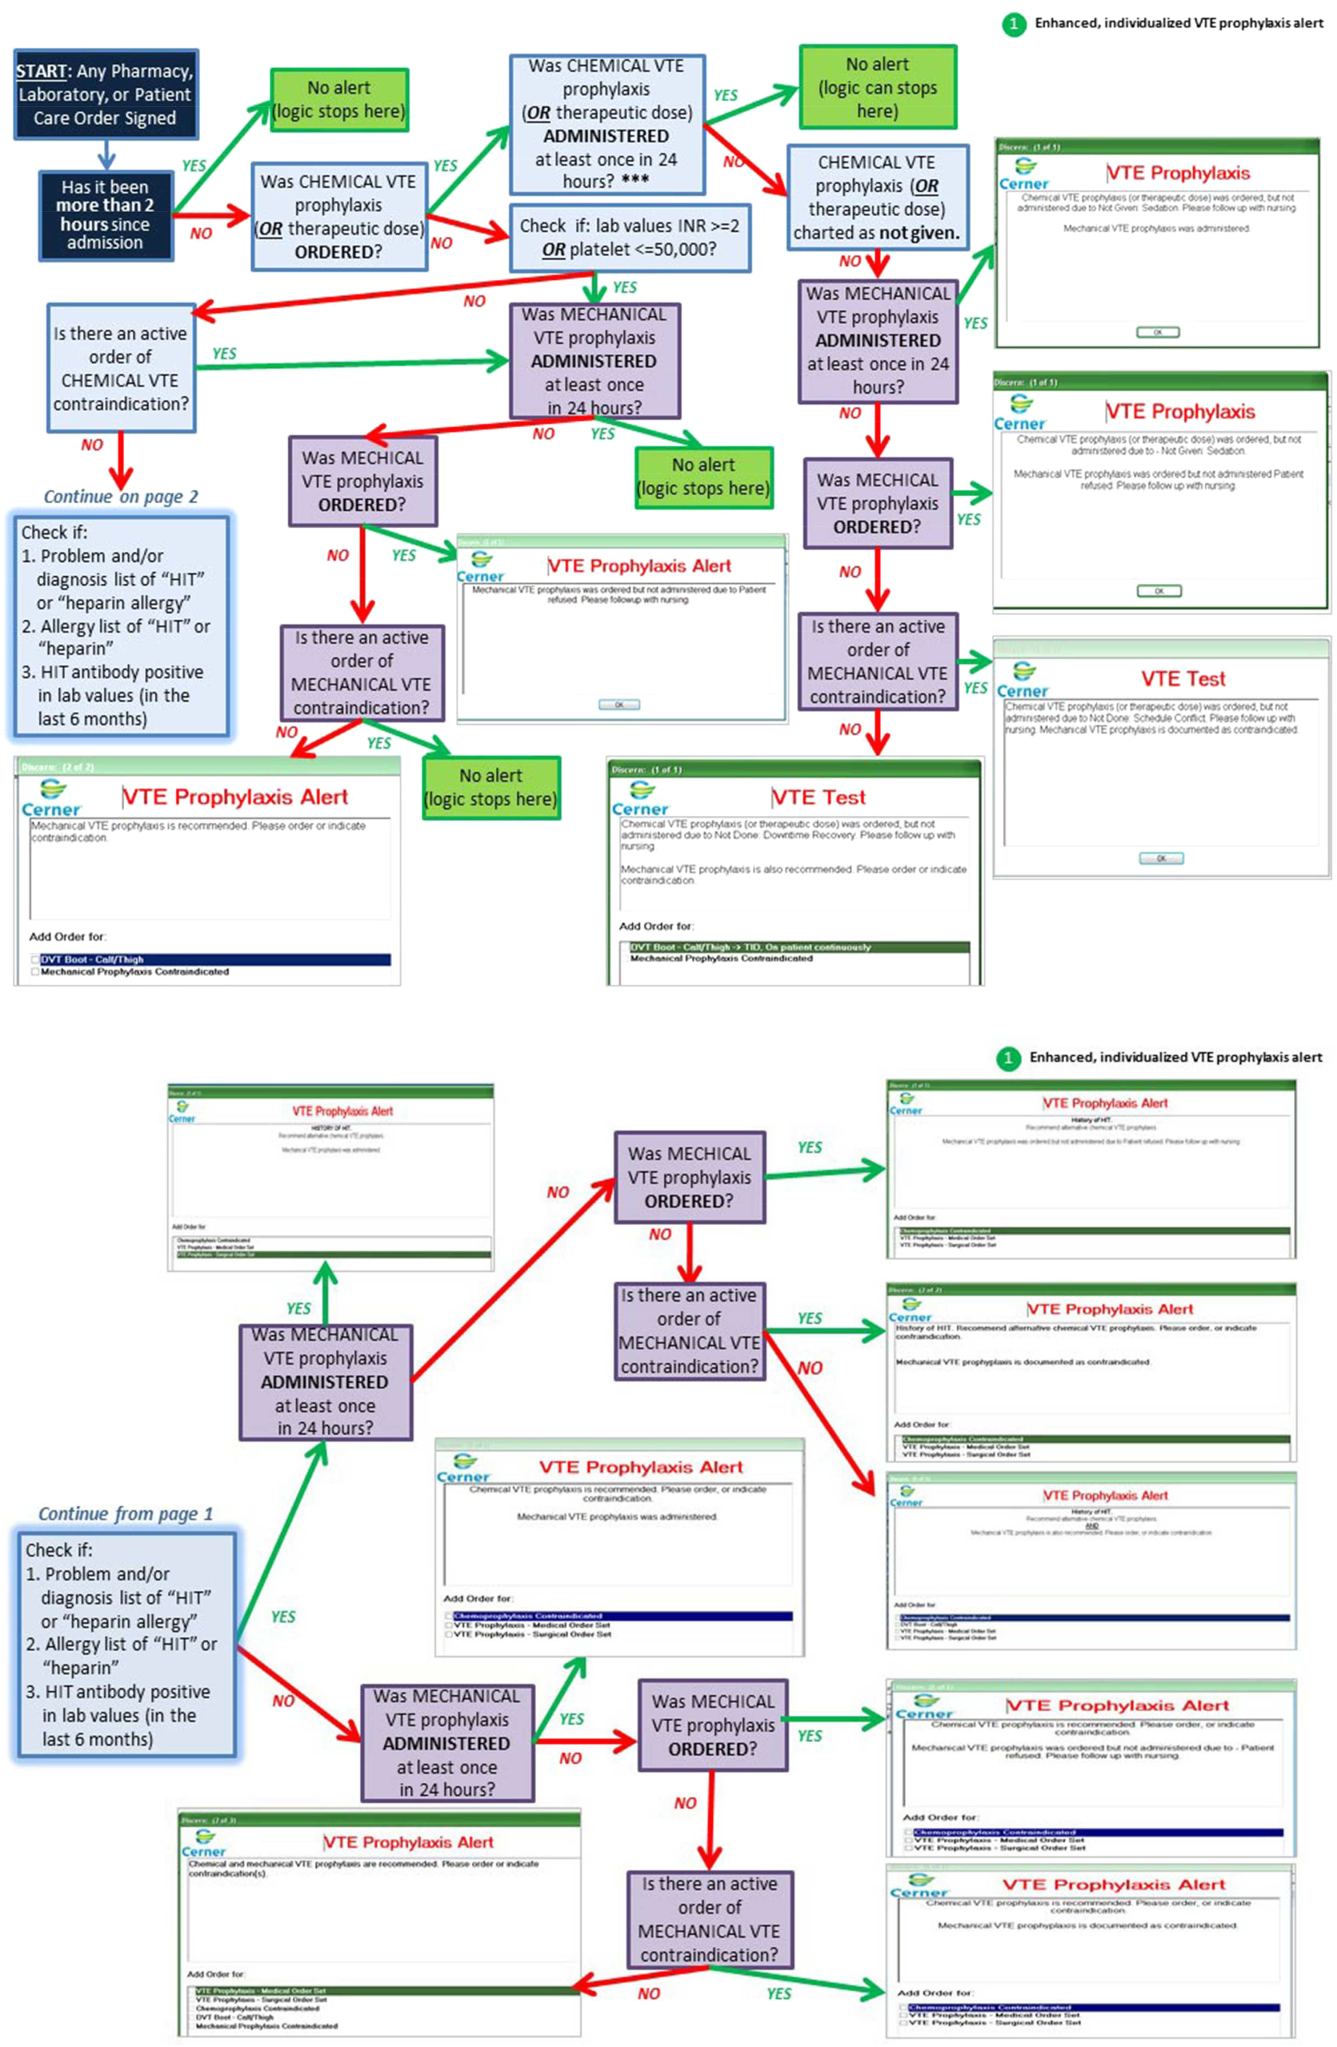
Interdisciplinary Rounds
Care of hospitalized patients requires effective teamwork within groups composed of physicians (eg, residents, hospitalists, specialists), advanced practice providers, nurses, patient‐care technicians, pharmacists, social workers, and therapists. Sadly, hospital‐based team members often fail to communicate. For example, 2 studies found that nurses and physicians communicated with one another on only 50% to 60% of their patients' hospital days, resulting in a lack of a mutual understanding of the plan of care.[1, 2]
Failure to communicate effectively may be because the hospital setting poses important challenges to teamwork, including the use of large teams with membership that changes frequently because of the need to provide care around the clock. Furthermore, individual team members often have high workloads, care for multiple patients simultaneously, and are seldom in the same place at the same time.
Interdisciplinary rounds (IDR) are a microsystem‐level solution with the goal to share information, achieve mutual understanding, and collaboratively revise the plan of care within care teams. Though common, IDR look very different across hospitals, making studies that evaluate novel strategies to improve IDR and measure their impact of great interest to hospital medicine.
In this issue of the Journal of Hospital Medicine, Bhamidipati and colleagues present a systematic review of published studies evaluating the effect of IDR on patient outcomes.[3] The systematic review included 22 studies, including 12 experimental/quasiexperimental and 10 observational studies. Overall, 13 studies were of low to medium quality, and 9 were high quality. Importantly, relatively few studies reported the degree to which IDR were implemented as planned. The investigators found evidence that IDR had a positive effect on length of stay (LOS) and staff satisfaction, but little evidence to support an effect on patient safety or satisfaction. Furthermore, the investigators found significant variability in IDR design and team composition. Some of this variation is to be expected, as IDR, like other interventions to improve quality and safety of patient care in complex settings, should be implemented with an expectation that the team may need to make adaptations based on local contextual factors such as workload (eg, daily census), environment (eg, open vs closed intensive care unit), local politics (eg, uniquely strong support for/against the intervention), and prior experience (eg, prior failed, similar interventions).[4, 5] Moreover, objectives for IDR may differ across settings. Some hospitals may have room (and a need) to improve LOS, whereas others may prioritize improving patient safety or patient experience metrics.
Bhamidipati and colleagues explain that their review did not reveal a causal pathway between IDR design and outcomes. We believe this lack of association is because most of the included studies did not propose a causal pathway between the IDR components implemented and the outcomes assessed. That is, few studies referred to conceptual models that explain how components of the IDR intervention might influence downstream patient outcomes.
IDR have the potential to influence a number of patient outcomes, including those reflecting efficiency (eg, length of stay), patient safety (eg, adverse events), and patient centeredness (eg, patient satisfaction). However, these outcomes are influenced by many factors, including patient characteristics and other efforts to improve care. As explained by the investigators, the results of many of the included studies may have been confounded due to relatively weak study designs and statistical analyses. Importantly, few of the studies included in this review report the more proximal measure of teamwork. If we hypothesize that IDR improve patient outcomes, they do so by improving teamwork. After all, the purpose of IDR is to assemble team members so they can communicate about and coordinate care. Measuring teamwork behaviors is difficult, especially on medical services. Measuring teamwork climate, the measurable aspects of team culture, is relatively easy. A recent systematic review of teamwork climate assessments in internal medicine identified the Safety Attitudes Questionnaire and the Team Climate Inventory as having substantial validity evidence and association with improved patient outcomes.[6]
Bhamidipati and colleagues proposed a definition for IDR and taxonomy for IDR design and reporting based on their systematic review. Although very useful, the IDR definition may be too limiting as evidenced by the fact that very few studies would be included in a systematic review using this definition as the inclusion criteria. Their proposed taxonomy should serve as a useful framework for future research efforts and appropriately recommends reporting of site characteristics, components of IDR design, and outcomes.
The systematic review by Bhamidipati et al. must also be interpreted in conjunction with another recently published systematic review by Pannick and colleagues assessing the effect of interdisciplinary team care interventions on general medical wards.[7] Contrary to the findings of the Bhamidipati et al. study, Pannick and colleagues found that most interdisciplinary team care interventions had no effect on LOS, but that half of the studies found an improvement in complications of care. Importantly, Pannick and colleagues included only experimental and quasiexperimental studies in their systematic review (ie, no observational studies).
There is clearly more work to be done in researching IDR and other interventions to improve teamwork in general medical settings. Larger studies are needed to provide sufficient power to detect improvement in outcomes. Future studies need to report the degree to which interventions are implemented as planned and need to use stronger study designs (eg, cluster randomized control or interrupted time series) to avoid the influence of confounders. Qualitative methods should be used to assess the influence of contextual factors on the success of interventions.[4] Most importantly, future studies should be based on conceptual models that explain how components of the intervention influence proximal measures of teamwork and downstream patient outcomes.
In the meantime, what is a hospital leader to do? We believe efforts to improve IDR are warranted, but that IDR program leaders need to first specify their primary objective(s). For example, in some hospitals, there may be little room to further reduce LOS, so another goalreducing preventable readmissions or reducing adverse eventsmight be specified as the key performance indicator. This crucial first step of creating a shared goal informs the design, implementation, and evaluation of IDR. We also believe that geographic localization of physicians to specific units is foundational to improving IDR. Physicians cannot feasibly attend IDR if their patients are spread across multiple units (or buildings). Finally, hospital leaders also need to view IDR as part of a larger set of interventions to improve teamwork. Leaders need to assess the adequacy of staffing levels, workflow, and team composition.[8] Unit‐based interdisciplinary leadership models should be used to help link efforts at various levels within a larger system.[9] These models designate a unit medical director and nurse manager who are jointly responsible for unit performance.
In conclusion, IDR play an important role in improving patient outcomes, but only do so by improving teamwork. In redesigning IDR, leaders need to be thoughtful about what outcomes IDR can affect, how IDR affect them, and how IDR fit into larger‐scale efforts to improve performance.
Disclosure
Nothing to report.
- , , , , , . Can we talk? Priorities for patient care differed among health care providers. In: Henriksen K, Battles JB, Marks ES, Lewin DI, eds. Advances in Patient Safety: From Research to Implementation. Volume 1: Research Findings. Rockville, MD: Agency for Healthcare Research and Quality; 2005.
- , , , et al. Patterns of nurse‐physician communication and agreement on the plan of care. Qual Saf Health Care. 2010;19(3):195–199.
- , , , , , . Structure and outcomes of inter‐disciplinary rounds in hospitalized medicine patients: a systematic review and suggested taxonomny. J Hosp Med. 2016;11:513–523.
- , , , et al. Advancing the science of patient safety. Ann Intern Med. 2011;154(10):693–696.
- . Improvement interventions are social treatments, not pills. Ann Intern Med. 2014;161(7):526–527.
- , , , et al. Teamwork assessment in internal medicine: a systematic review of validity evidence and outcomes. J Gen Intern Med. 2014;29(6):894–910.
- , , , et al. Effects of interdisciplinary team care interventions on general medical wards: a systematic review. JAMA Intern Med. 2015;175(8):1288–1298.
- , , , . Improving the quality and safety of care on the medical ward: A review and synthesis of the evidence base. Eur J Intern Med. 2014;25(10):874–887.
- , , , , , . Unit‐based interprofessional leadership models in six US hospitals. J Hosp Med. 2014;9(8):545–550.
Care of hospitalized patients requires effective teamwork within groups composed of physicians (eg, residents, hospitalists, specialists), advanced practice providers, nurses, patient‐care technicians, pharmacists, social workers, and therapists. Sadly, hospital‐based team members often fail to communicate. For example, 2 studies found that nurses and physicians communicated with one another on only 50% to 60% of their patients' hospital days, resulting in a lack of a mutual understanding of the plan of care.[1, 2]
Failure to communicate effectively may be because the hospital setting poses important challenges to teamwork, including the use of large teams with membership that changes frequently because of the need to provide care around the clock. Furthermore, individual team members often have high workloads, care for multiple patients simultaneously, and are seldom in the same place at the same time.
Interdisciplinary rounds (IDR) are a microsystem‐level solution with the goal to share information, achieve mutual understanding, and collaboratively revise the plan of care within care teams. Though common, IDR look very different across hospitals, making studies that evaluate novel strategies to improve IDR and measure their impact of great interest to hospital medicine.
In this issue of the Journal of Hospital Medicine, Bhamidipati and colleagues present a systematic review of published studies evaluating the effect of IDR on patient outcomes.[3] The systematic review included 22 studies, including 12 experimental/quasiexperimental and 10 observational studies. Overall, 13 studies were of low to medium quality, and 9 were high quality. Importantly, relatively few studies reported the degree to which IDR were implemented as planned. The investigators found evidence that IDR had a positive effect on length of stay (LOS) and staff satisfaction, but little evidence to support an effect on patient safety or satisfaction. Furthermore, the investigators found significant variability in IDR design and team composition. Some of this variation is to be expected, as IDR, like other interventions to improve quality and safety of patient care in complex settings, should be implemented with an expectation that the team may need to make adaptations based on local contextual factors such as workload (eg, daily census), environment (eg, open vs closed intensive care unit), local politics (eg, uniquely strong support for/against the intervention), and prior experience (eg, prior failed, similar interventions).[4, 5] Moreover, objectives for IDR may differ across settings. Some hospitals may have room (and a need) to improve LOS, whereas others may prioritize improving patient safety or patient experience metrics.
Bhamidipati and colleagues explain that their review did not reveal a causal pathway between IDR design and outcomes. We believe this lack of association is because most of the included studies did not propose a causal pathway between the IDR components implemented and the outcomes assessed. That is, few studies referred to conceptual models that explain how components of the IDR intervention might influence downstream patient outcomes.
IDR have the potential to influence a number of patient outcomes, including those reflecting efficiency (eg, length of stay), patient safety (eg, adverse events), and patient centeredness (eg, patient satisfaction). However, these outcomes are influenced by many factors, including patient characteristics and other efforts to improve care. As explained by the investigators, the results of many of the included studies may have been confounded due to relatively weak study designs and statistical analyses. Importantly, few of the studies included in this review report the more proximal measure of teamwork. If we hypothesize that IDR improve patient outcomes, they do so by improving teamwork. After all, the purpose of IDR is to assemble team members so they can communicate about and coordinate care. Measuring teamwork behaviors is difficult, especially on medical services. Measuring teamwork climate, the measurable aspects of team culture, is relatively easy. A recent systematic review of teamwork climate assessments in internal medicine identified the Safety Attitudes Questionnaire and the Team Climate Inventory as having substantial validity evidence and association with improved patient outcomes.[6]
Bhamidipati and colleagues proposed a definition for IDR and taxonomy for IDR design and reporting based on their systematic review. Although very useful, the IDR definition may be too limiting as evidenced by the fact that very few studies would be included in a systematic review using this definition as the inclusion criteria. Their proposed taxonomy should serve as a useful framework for future research efforts and appropriately recommends reporting of site characteristics, components of IDR design, and outcomes.
The systematic review by Bhamidipati et al. must also be interpreted in conjunction with another recently published systematic review by Pannick and colleagues assessing the effect of interdisciplinary team care interventions on general medical wards.[7] Contrary to the findings of the Bhamidipati et al. study, Pannick and colleagues found that most interdisciplinary team care interventions had no effect on LOS, but that half of the studies found an improvement in complications of care. Importantly, Pannick and colleagues included only experimental and quasiexperimental studies in their systematic review (ie, no observational studies).
There is clearly more work to be done in researching IDR and other interventions to improve teamwork in general medical settings. Larger studies are needed to provide sufficient power to detect improvement in outcomes. Future studies need to report the degree to which interventions are implemented as planned and need to use stronger study designs (eg, cluster randomized control or interrupted time series) to avoid the influence of confounders. Qualitative methods should be used to assess the influence of contextual factors on the success of interventions.[4] Most importantly, future studies should be based on conceptual models that explain how components of the intervention influence proximal measures of teamwork and downstream patient outcomes.
In the meantime, what is a hospital leader to do? We believe efforts to improve IDR are warranted, but that IDR program leaders need to first specify their primary objective(s). For example, in some hospitals, there may be little room to further reduce LOS, so another goalreducing preventable readmissions or reducing adverse eventsmight be specified as the key performance indicator. This crucial first step of creating a shared goal informs the design, implementation, and evaluation of IDR. We also believe that geographic localization of physicians to specific units is foundational to improving IDR. Physicians cannot feasibly attend IDR if their patients are spread across multiple units (or buildings). Finally, hospital leaders also need to view IDR as part of a larger set of interventions to improve teamwork. Leaders need to assess the adequacy of staffing levels, workflow, and team composition.[8] Unit‐based interdisciplinary leadership models should be used to help link efforts at various levels within a larger system.[9] These models designate a unit medical director and nurse manager who are jointly responsible for unit performance.
In conclusion, IDR play an important role in improving patient outcomes, but only do so by improving teamwork. In redesigning IDR, leaders need to be thoughtful about what outcomes IDR can affect, how IDR affect them, and how IDR fit into larger‐scale efforts to improve performance.
Disclosure
Nothing to report.
- , , , , , . Can we talk? Priorities for patient care differed among health care providers. In: Henriksen K, Battles JB, Marks ES, Lewin DI, eds. Advances in Patient Safety: From Research to Implementation. Volume 1: Research Findings. Rockville, MD: Agency for Healthcare Research and Quality; 2005.
- , , , et al. Patterns of nurse‐physician communication and agreement on the plan of care. Qual Saf Health Care. 2010;19(3):195–199.
- , , , , , . Structure and outcomes of inter‐disciplinary rounds in hospitalized medicine patients: a systematic review and suggested taxonomny. J Hosp Med. 2016;11:513–523.
- , , , et al. Advancing the science of patient safety. Ann Intern Med. 2011;154(10):693–696.
- . Improvement interventions are social treatments, not pills. Ann Intern Med. 2014;161(7):526–527.
- , , , et al. Teamwork assessment in internal medicine: a systematic review of validity evidence and outcomes. J Gen Intern Med. 2014;29(6):894–910.
- , , , et al. Effects of interdisciplinary team care interventions on general medical wards: a systematic review. JAMA Intern Med. 2015;175(8):1288–1298.
- , , , . Improving the quality and safety of care on the medical ward: A review and synthesis of the evidence base. Eur J Intern Med. 2014;25(10):874–887.
- , , , , , . Unit‐based interprofessional leadership models in six US hospitals. J Hosp Med. 2014;9(8):545–550.
Letter to the Editor
We greatly appreciate the thoughtful points made by Dr. Kerman regarding our recently published study evaluating the association of hospitalist continuity on adverse events (AEs).[1] We agree that a 7‐on/7‐off staffing model may limit discontinuity relative to models using shorter rotations lengths. Many hospital medicine programs use a 7‐on/7‐off model to optimize continuity. Longer rotation lengths are uncommon, as they may lead to fatigue and negatively affect physician work‐life balance. Shorter rotation lengths do exist, and we acknowledge that a study in a setting with greater fragmentation may have detected an effect.
We respectfully disagree with Dr. Kerman's concern that our methods for AE detection and confirmation may have been insensitive. We did not rely on incident reports, as these systems suffer from under‐reporting and often represent only a fraction of true AEs. We used a modified version of the classic 2‐stage method to identify and confirm AEs.[2] In the first stage, we used computerized screens, based on criteria from the Harvard Medical Practice Study and Institute for Healthcare Improvement global trigger tool, to identify potential AEs.[3, 4, 5] A research nurse created narrative summaries of potential AEs. A physician researcher then reviewed the narrative summaries to confirm whether an AE was truly present. This time‐consuming method is much more sensitive and specific than other options for patient safety measurement, including administrative data analyses and incident reporting systems.[6, 7]
With respect to other outcomes that may be affected by hospitalist continuity, we recently published a separate study showing that lower inpatient physician continuity was significantly associated with modest increases in hospital costs.[8] We found no association between continuity and patient satisfaction, but were likely underpowered to detect one. Interestingly, some of the models in our study suggested a slightly reduced risk of readmission with lower continuity. We were surprised by this finding and hypothesized that countervailing forces may be at play during handoffs of care from 1 hospitalist to another. Transitions of care introduce the opportunity for critical information to be lost, but they also introduce the potential for patient reassessment. A hospitalist newly taking over care from another may not be anchored to the initial diagnostic impressions and management plan established by the first. Of course, the potential benefit of a reassessment could only occur if the new hospitalist has time to perform one. At extremely high patient volumes, this theoretical benefit is unlikely to exist.
We did not include length of stay (LOS) as an outcome because hospitalist continuity and LOS are interdependent. Although discontinuity may lead to longer LOS, longer LOS definitely increases the probability of discontinuity. Thus, we controlled for LOS in our statistical models to isolate the effect of continuity. The study by Epstein and colleagues did not take into account the interdependence between LOS and hospitalist continuity.[9] Observational studies are not ideal for determining the effect of continuity on LOS. The Combing Incentives and Continuity Leading to Efficiency (CICLE) study by Chandra and colleagues was a pre‐post evaluation of a hospitalist staffing model specifically designed to improve continuity.[10] In the CICLE model, physicians work in a 4‐day rotation. On day 1, physicians exclusively admit patients. On day 2, physicians care for patients admitted on day 1 and accept patients admitted overnight. On days 3 and 4, physicians continue to care for patients received on days 1 and 2, but receive no additional patients. The remaining patients are transitioned to the next physician entering the cycle at the end of day 4. Chandra and colleagues found a 7.5% reduction in LOS and an 8.5% reduction in charges. Interestingly, they also found a 13.5% increase in readmissions that did not achieve statistical significance (P=0.08). The CICLE study suggests continuity does affect LOS, but is limited in that it did not account for a potential preexisting trend toward lower LOS.
Dr. Kerman presents data showing that it takes longer for a physician to care for a patient who is new to him or her than for a patient who is previously known. This finding has face validity. However, as we have suggested, the extra time spent by the oncoming physician may have both advantages and disadvantages. The disadvantages include time‐consuming cognitive work for the physician and the potential for information loss affecting patient care. The potential advantage is a second physician reassessing the diagnosis and management decisions established by the first, potentially correcting errors and optimizing care.
Ultimately, more research is needed to illuminate the effect of hospitalist continuity on patient outcomes. For now, we feel that hospital medicine group leaders need not institute lengthy rotations or staffing models that prioritize continuity above all other factors, as continuity appears to have little impact on patient outcomes.
- , , , et al. The effect of hospitalist discontinuity on adverse events. J Hosp Med. 2015;10(3):147–151.
- , , , et al. Comparison of manual abstraction to data warehouse facilitated abstraction to identify hosptial adverse events. BMJ Qual Saf. 2013;22(2):130–138.
- , . IHI global trigger tool for measuring adverse events: IHI innovation series white paper. Cambridge, MA: Institute for Healthcare Improvement; 2007.
- , BA, , et al. A study of medical injury and medical malpractice. N Engl J Med. 1989;321(7):480–484.
- , , , et al. Incidence and types of adverse events and negligent care in Utah and Colorado. Med Care. 2000;38(3):261–271.
- . The elephant of patient safety: what you see depends on how you look. Jt Comm J Qual Patient Saf. 2010;36(9):399–401.
- , . Measuring errors and adverse events in health care. J Gen Intern Med. 2003;18(1):61–67.
- , , , et al. The impact of hospitalist discontinuity on hospital cost, readmissions, and patient satisfaction. J Gen Intern Med. 2014;29(7):1004–1008.
- , , , , . The impact of fragmentation of hospitalist care on length of stay. J Hosp Med. 2010;5(6):335–338.
- , , . The Creating Incentives and Continuity Leading to Efficiency staffing model: a quality improvement initiative in hospital medicine. Mayo Clin Proc. 2012;87(4):364–371.
We greatly appreciate the thoughtful points made by Dr. Kerman regarding our recently published study evaluating the association of hospitalist continuity on adverse events (AEs).[1] We agree that a 7‐on/7‐off staffing model may limit discontinuity relative to models using shorter rotations lengths. Many hospital medicine programs use a 7‐on/7‐off model to optimize continuity. Longer rotation lengths are uncommon, as they may lead to fatigue and negatively affect physician work‐life balance. Shorter rotation lengths do exist, and we acknowledge that a study in a setting with greater fragmentation may have detected an effect.
We respectfully disagree with Dr. Kerman's concern that our methods for AE detection and confirmation may have been insensitive. We did not rely on incident reports, as these systems suffer from under‐reporting and often represent only a fraction of true AEs. We used a modified version of the classic 2‐stage method to identify and confirm AEs.[2] In the first stage, we used computerized screens, based on criteria from the Harvard Medical Practice Study and Institute for Healthcare Improvement global trigger tool, to identify potential AEs.[3, 4, 5] A research nurse created narrative summaries of potential AEs. A physician researcher then reviewed the narrative summaries to confirm whether an AE was truly present. This time‐consuming method is much more sensitive and specific than other options for patient safety measurement, including administrative data analyses and incident reporting systems.[6, 7]
With respect to other outcomes that may be affected by hospitalist continuity, we recently published a separate study showing that lower inpatient physician continuity was significantly associated with modest increases in hospital costs.[8] We found no association between continuity and patient satisfaction, but were likely underpowered to detect one. Interestingly, some of the models in our study suggested a slightly reduced risk of readmission with lower continuity. We were surprised by this finding and hypothesized that countervailing forces may be at play during handoffs of care from 1 hospitalist to another. Transitions of care introduce the opportunity for critical information to be lost, but they also introduce the potential for patient reassessment. A hospitalist newly taking over care from another may not be anchored to the initial diagnostic impressions and management plan established by the first. Of course, the potential benefit of a reassessment could only occur if the new hospitalist has time to perform one. At extremely high patient volumes, this theoretical benefit is unlikely to exist.
We did not include length of stay (LOS) as an outcome because hospitalist continuity and LOS are interdependent. Although discontinuity may lead to longer LOS, longer LOS definitely increases the probability of discontinuity. Thus, we controlled for LOS in our statistical models to isolate the effect of continuity. The study by Epstein and colleagues did not take into account the interdependence between LOS and hospitalist continuity.[9] Observational studies are not ideal for determining the effect of continuity on LOS. The Combing Incentives and Continuity Leading to Efficiency (CICLE) study by Chandra and colleagues was a pre‐post evaluation of a hospitalist staffing model specifically designed to improve continuity.[10] In the CICLE model, physicians work in a 4‐day rotation. On day 1, physicians exclusively admit patients. On day 2, physicians care for patients admitted on day 1 and accept patients admitted overnight. On days 3 and 4, physicians continue to care for patients received on days 1 and 2, but receive no additional patients. The remaining patients are transitioned to the next physician entering the cycle at the end of day 4. Chandra and colleagues found a 7.5% reduction in LOS and an 8.5% reduction in charges. Interestingly, they also found a 13.5% increase in readmissions that did not achieve statistical significance (P=0.08). The CICLE study suggests continuity does affect LOS, but is limited in that it did not account for a potential preexisting trend toward lower LOS.
Dr. Kerman presents data showing that it takes longer for a physician to care for a patient who is new to him or her than for a patient who is previously known. This finding has face validity. However, as we have suggested, the extra time spent by the oncoming physician may have both advantages and disadvantages. The disadvantages include time‐consuming cognitive work for the physician and the potential for information loss affecting patient care. The potential advantage is a second physician reassessing the diagnosis and management decisions established by the first, potentially correcting errors and optimizing care.
Ultimately, more research is needed to illuminate the effect of hospitalist continuity on patient outcomes. For now, we feel that hospital medicine group leaders need not institute lengthy rotations or staffing models that prioritize continuity above all other factors, as continuity appears to have little impact on patient outcomes.
- , , , et al. The effect of hospitalist discontinuity on adverse events. J Hosp Med. 2015;10(3):147–151.
- , , , et al. Comparison of manual abstraction to data warehouse facilitated abstraction to identify hosptial adverse events. BMJ Qual Saf. 2013;22(2):130–138.
- , . IHI global trigger tool for measuring adverse events: IHI innovation series white paper. Cambridge, MA: Institute for Healthcare Improvement; 2007.
- , BA, , et al. A study of medical injury and medical malpractice. N Engl J Med. 1989;321(7):480–484.
- , , , et al. Incidence and types of adverse events and negligent care in Utah and Colorado. Med Care. 2000;38(3):261–271.
- . The elephant of patient safety: what you see depends on how you look. Jt Comm J Qual Patient Saf. 2010;36(9):399–401.
- , . Measuring errors and adverse events in health care. J Gen Intern Med. 2003;18(1):61–67.
- , , , et al. The impact of hospitalist discontinuity on hospital cost, readmissions, and patient satisfaction. J Gen Intern Med. 2014;29(7):1004–1008.
- , , , , . The impact of fragmentation of hospitalist care on length of stay. J Hosp Med. 2010;5(6):335–338.
- , , . The Creating Incentives and Continuity Leading to Efficiency staffing model: a quality improvement initiative in hospital medicine. Mayo Clin Proc. 2012;87(4):364–371.
Improving Patient Satisfaction
Patient satisfaction has received increased attention in recent years, which we believe is well deserved and long overdue. Anyone who has been hospitalized, or has had a loved one hospitalized, can appreciate that there is room to improve the patient experience. Dedicating time and effort to improving the patient experience is consistent with our professional commitment to comfort, empathize, and partner with our patients. Though patient satisfaction itself is an outcome worthy of our attention, it is also positively associated with measures related to patient safety and clinical effectiveness.[1, 2] Moreover, patient satisfaction is the only publicly reported measure that represents the patient's voice,[3] and accounts for a substantial portion of the Centers for Medicare and Medicaid Services payment adjustments under the Hospital Value Based Purchasing Program.[4]
However, all healthcare professionals should understand some key fundamental issues related to the measurement of patient satisfaction. The survey from which data are publicly reported and used for hospital payment adjustment is the Hospital Consumer Assessment of Healthcare Providers and Systems (HCAHPS) survey, developed by the Agency for Healthcare Research and Quality.[5, 6] HCAHPS is sent to a random sample of 40% of hospitalized patients between 48 hours and 6 weeks after discharge. The HCAHPS survey uses ordinal response scales (eg, never, sometimes, usually, always) that generate highly skewed results toward favorable responses. Therefore, results are reported as the percent top box (ie, the percentage of responses in the most favorable category) rather than as a median score. The skewed distribution of results indicates that most patients are generally satisfied with care (ie, most respondents do not have an axe to grind), but also makes meaningful improvement difficult to achieve. Prior to public reporting and determination of effect on hospital payment, results are adjusted for mode of survey administration and patient mix. The same is not true when patient satisfaction data are used for internal purposes. Hospital leaders typically do not perform statistical adjustment and therefore need to be careful not to make apples‐to‐orangestype comparisons. For example, obstetric patient satisfaction scores should not be compared to general medical patient satisfaction scores, as these populations tend to rate satisfaction differently.
The HCAHPS survey questions are organized into domains of care, including satisfaction with nurses and satisfaction with doctors. Importantly, other healthcare team members may influence patients' perception in these domains. For example, a patient responding to nurse communication questions may also reflect on experiences with patient care technicians, social workers, and therapists. A patient responding to physician communication questions might also reflect on experiences with advanced practice providers. A common mistake is the practice of attributing satisfaction with doctors to the individual who served as the discharge physician. Many readers have likely seen patient satisfaction reports broken out by discharge physician with the expectation that giving this information to individual physicians will serve as useful formative feedback. The reality is that patients see many doctors during a hospitalization. To illustrate this point, we analyzed data from 420 patients admitted to our nonteaching hospitalist service who had completed an HCAHPS survey in 2014. We found that the discharge hospitalist accounted for only 34% of all physician encounters. Furthermore, research has shown that patients' experiences with specialist physicians also have a strong influence on their overall satisfaction with physicians.[7]
Having reliable patient satisfaction data on specific individuals would be a truly powerful formative assessment tool. In this issue of the Journal of Hospital Medicine, Banka and colleagues report on an impressive approach incorporating such a tool to give constructive feedback to physicians.[8] Since 2006, the study site had administered surveys to hospitalized patients that assess their satisfaction with specific resident physicians.[9] However, residency programs only reviewed the survey results with resident physicians about twice a year. The multifaceted intervention developed by Banka and colleagues included directly emailing the survey results to internal medicine resident physicians in real time while they were in service, a 1‐hour conference on best communication practices, and a reward program in which 3 residents were identified monthly to receive department‐wide recognition via email and a generous movie package. Using difference‐in‐differences regression analysis, the investigators compared changes in patient satisfaction results for internal medicine residents to results for residents from other specialties (who were not part of the intervention). The percentage of patients who gave top box responses to all 3 physician‐related questions and to the overall hospital rating was significantly higher for the internal medicine residents.
The findings from this study are important, because no prior study of an intervention, to our knowledge, has shown a significant improvement in patient satisfaction scores. In this study, feedback was believed to be the most powerful factor. The importance of meaningful, timely feedback in medical education is well recognized.[10] Without feedback there is poor insight into how intended results from specific actions compare with actual results. When feedback is lacking from external sources (in this case the voice of the patient), an uncontested sense of mastery develops, allowing mistakes to go uncorrected. This false sense of mastery contributes to an emotional and defensive response when performance is finally revealed to be less than optimal. The simple act of giving more timely feedback in this study encouraged self‐motivated reflection and practice change aimed at improving patient satisfaction, with remarkable results.
The study should inspire physician leaders from various hospital settings, and researchers, to develop and evaluate similar programs to improve patient satisfaction. We agree with the investigators that the approach should be multifaceted. Feedback to specific physicians is a powerful motivator, but needs to be combined with strategies to enhance communication skills. Brief conferences are less likely to have a lasting impact on behaviors than strategies like coaching and simulation based training.[11] Interventions should include recognition and reward to acknowledge exceptional performance and build friendly competition.
The biggest challenge to adopting an intervention such as the one used in the Banka study relates to the feasibility of implementing physician‐specific patient satisfaction reporting. Several survey instruments are available for use as tools to assess satisfaction with specific physicians.[9, 12, 13] However, who will administer these instruments? Most hospitals do not have undergraduate students available. Hospitals could use their volunteers, but this is not likely to be a sustainable solution. Hospitals could consider administering the survey via email, but many hospitals are just starting to collect patient email addresses and many patients do not use email. Once data are collected, who will conduct analyses and create comparative reports? Press Ganey recently developed a survey assessing satisfaction with specific hospitalists, using photographs, and offers the ability to create comparative reports.[14] Their service addresses the analytic challenge, but the quandary of survey administration remains.
In conclusion, we encourage hospital medicine leaders to develop and evaluate multifaceted interventions to improve patient satisfaction such as the one reported by Banka et al. Timely, specific feedback to physicians is an essential feature. The collection of physician‐specific data is a major challenge, but not an insurmountable one. Novel use of personnel and/or technology is likely to play a role in these efforts.
Disclosure: Nothing to report.
- , , . A systematic review of evidence on the links between patient experience and clinical safety and effectiveness. BMJ Open. 2013;3(1).
- , , , . Patients' perception of hospital care in the United States. N Engl J Med. 2008;359(18):1921–1931.
- Medicare.gov. Hospital Compare. Available at: http://www.medicare.gov/hospitalcompare/search.html. Accessed April 27, 2015.
- Centers for Medicare 67(1):27–37.
- , , , et al. Who's behind an HCAHPS score? Jt Comm J Qual Patient Saf. 2011;37(10):461–468.
- , , , et al. Improving patient satisfaction through physician education, feedback, and incentives. J Hosp Med. 2015;10(8):497–502.
- , , , . Promoting patient‐centred care through trainee feedback: assessing residents' C‐I‐CARE (ARC) program. BMJ Qual Saf. 2012;21(3):225–233.
- . Feedback in clinical medical education. JAMA. 1983;250(6):777–781.
- , , , . Impact of hospitalist communication‐skills training on patient‐satisfaction scores. J Hosp Med. 2013;8(6):315–320.
- , , , , , . Assessing patient perceptions of hospitalist communication skills using the Communication Assessment Tool (CAT). J Hosp Med. 2010;5(9):522–527.
- , , , , , . Development and validation of the tool to assess inpatient satisfaction with care from hospitalists. J Hosp Med. 2014;9(9):553–558.
- Press Ganey. A true performance solution for hospitalists. Available at: http://www.pressganey.com/ourSolutions/patient‐voice/census‐based‐surveying/hospitalist.aspx. Accessed April 27, 2015.
Patient satisfaction has received increased attention in recent years, which we believe is well deserved and long overdue. Anyone who has been hospitalized, or has had a loved one hospitalized, can appreciate that there is room to improve the patient experience. Dedicating time and effort to improving the patient experience is consistent with our professional commitment to comfort, empathize, and partner with our patients. Though patient satisfaction itself is an outcome worthy of our attention, it is also positively associated with measures related to patient safety and clinical effectiveness.[1, 2] Moreover, patient satisfaction is the only publicly reported measure that represents the patient's voice,[3] and accounts for a substantial portion of the Centers for Medicare and Medicaid Services payment adjustments under the Hospital Value Based Purchasing Program.[4]
However, all healthcare professionals should understand some key fundamental issues related to the measurement of patient satisfaction. The survey from which data are publicly reported and used for hospital payment adjustment is the Hospital Consumer Assessment of Healthcare Providers and Systems (HCAHPS) survey, developed by the Agency for Healthcare Research and Quality.[5, 6] HCAHPS is sent to a random sample of 40% of hospitalized patients between 48 hours and 6 weeks after discharge. The HCAHPS survey uses ordinal response scales (eg, never, sometimes, usually, always) that generate highly skewed results toward favorable responses. Therefore, results are reported as the percent top box (ie, the percentage of responses in the most favorable category) rather than as a median score. The skewed distribution of results indicates that most patients are generally satisfied with care (ie, most respondents do not have an axe to grind), but also makes meaningful improvement difficult to achieve. Prior to public reporting and determination of effect on hospital payment, results are adjusted for mode of survey administration and patient mix. The same is not true when patient satisfaction data are used for internal purposes. Hospital leaders typically do not perform statistical adjustment and therefore need to be careful not to make apples‐to‐orangestype comparisons. For example, obstetric patient satisfaction scores should not be compared to general medical patient satisfaction scores, as these populations tend to rate satisfaction differently.
The HCAHPS survey questions are organized into domains of care, including satisfaction with nurses and satisfaction with doctors. Importantly, other healthcare team members may influence patients' perception in these domains. For example, a patient responding to nurse communication questions may also reflect on experiences with patient care technicians, social workers, and therapists. A patient responding to physician communication questions might also reflect on experiences with advanced practice providers. A common mistake is the practice of attributing satisfaction with doctors to the individual who served as the discharge physician. Many readers have likely seen patient satisfaction reports broken out by discharge physician with the expectation that giving this information to individual physicians will serve as useful formative feedback. The reality is that patients see many doctors during a hospitalization. To illustrate this point, we analyzed data from 420 patients admitted to our nonteaching hospitalist service who had completed an HCAHPS survey in 2014. We found that the discharge hospitalist accounted for only 34% of all physician encounters. Furthermore, research has shown that patients' experiences with specialist physicians also have a strong influence on their overall satisfaction with physicians.[7]
Having reliable patient satisfaction data on specific individuals would be a truly powerful formative assessment tool. In this issue of the Journal of Hospital Medicine, Banka and colleagues report on an impressive approach incorporating such a tool to give constructive feedback to physicians.[8] Since 2006, the study site had administered surveys to hospitalized patients that assess their satisfaction with specific resident physicians.[9] However, residency programs only reviewed the survey results with resident physicians about twice a year. The multifaceted intervention developed by Banka and colleagues included directly emailing the survey results to internal medicine resident physicians in real time while they were in service, a 1‐hour conference on best communication practices, and a reward program in which 3 residents were identified monthly to receive department‐wide recognition via email and a generous movie package. Using difference‐in‐differences regression analysis, the investigators compared changes in patient satisfaction results for internal medicine residents to results for residents from other specialties (who were not part of the intervention). The percentage of patients who gave top box responses to all 3 physician‐related questions and to the overall hospital rating was significantly higher for the internal medicine residents.
The findings from this study are important, because no prior study of an intervention, to our knowledge, has shown a significant improvement in patient satisfaction scores. In this study, feedback was believed to be the most powerful factor. The importance of meaningful, timely feedback in medical education is well recognized.[10] Without feedback there is poor insight into how intended results from specific actions compare with actual results. When feedback is lacking from external sources (in this case the voice of the patient), an uncontested sense of mastery develops, allowing mistakes to go uncorrected. This false sense of mastery contributes to an emotional and defensive response when performance is finally revealed to be less than optimal. The simple act of giving more timely feedback in this study encouraged self‐motivated reflection and practice change aimed at improving patient satisfaction, with remarkable results.
The study should inspire physician leaders from various hospital settings, and researchers, to develop and evaluate similar programs to improve patient satisfaction. We agree with the investigators that the approach should be multifaceted. Feedback to specific physicians is a powerful motivator, but needs to be combined with strategies to enhance communication skills. Brief conferences are less likely to have a lasting impact on behaviors than strategies like coaching and simulation based training.[11] Interventions should include recognition and reward to acknowledge exceptional performance and build friendly competition.
The biggest challenge to adopting an intervention such as the one used in the Banka study relates to the feasibility of implementing physician‐specific patient satisfaction reporting. Several survey instruments are available for use as tools to assess satisfaction with specific physicians.[9, 12, 13] However, who will administer these instruments? Most hospitals do not have undergraduate students available. Hospitals could use their volunteers, but this is not likely to be a sustainable solution. Hospitals could consider administering the survey via email, but many hospitals are just starting to collect patient email addresses and many patients do not use email. Once data are collected, who will conduct analyses and create comparative reports? Press Ganey recently developed a survey assessing satisfaction with specific hospitalists, using photographs, and offers the ability to create comparative reports.[14] Their service addresses the analytic challenge, but the quandary of survey administration remains.
In conclusion, we encourage hospital medicine leaders to develop and evaluate multifaceted interventions to improve patient satisfaction such as the one reported by Banka et al. Timely, specific feedback to physicians is an essential feature. The collection of physician‐specific data is a major challenge, but not an insurmountable one. Novel use of personnel and/or technology is likely to play a role in these efforts.
Disclosure: Nothing to report.
- , , . A systematic review of evidence on the links between patient experience and clinical safety and effectiveness. BMJ Open. 2013;3(1).
- , , , . Patients' perception of hospital care in the United States. N Engl J Med. 2008;359(18):1921–1931.
- Medicare.gov. Hospital Compare. Available at: http://www.medicare.gov/hospitalcompare/search.html. Accessed April 27, 2015.
- Centers for Medicare 67(1):27–37.
- , , , et al. Who's behind an HCAHPS score? Jt Comm J Qual Patient Saf. 2011;37(10):461–468.
- , , , et al. Improving patient satisfaction through physician education, feedback, and incentives. J Hosp Med. 2015;10(8):497–502.
- , , , . Promoting patient‐centred care through trainee feedback: assessing residents' C‐I‐CARE (ARC) program. BMJ Qual Saf. 2012;21(3):225–233.
- . Feedback in clinical medical education. JAMA. 1983;250(6):777–781.
- , , , . Impact of hospitalist communication‐skills training on patient‐satisfaction scores. J Hosp Med. 2013;8(6):315–320.
- , , , , , . Assessing patient perceptions of hospitalist communication skills using the Communication Assessment Tool (CAT). J Hosp Med. 2010;5(9):522–527.
- , , , , , . Development and validation of the tool to assess inpatient satisfaction with care from hospitalists. J Hosp Med. 2014;9(9):553–558.
- Press Ganey. A true performance solution for hospitalists. Available at: http://www.pressganey.com/ourSolutions/patient‐voice/census‐based‐surveying/hospitalist.aspx. Accessed April 27, 2015.
RRTs in Teaching Hospitals
In this issue of the Journal of Hospital Medicine, Butcher and colleagues report on residents' perceptions of a rapid response team's (RRT) impact on their training.[1] RRTs mobilize key clinicians in an attempt to rescue acutely decompensating hospitalized patients. Early recognition is essential, and most systems allow any concerned health professional to activate the RRT. Although the evidence for benefit is somewhat controversial,[2, 3] an overwhelming majority of hospitals have implemented RRTs.[4, 5]
The use of RRTs in teaching hospitals raises important concerns. The ability of nurses and other professionals to activate the RRT without need for prior approval from a physician could potentially undermine resident physician autonomy. Residents may feel that their clinical judgment has been usurped or second guessed. Whether nurse led or physician led, RRTs always introduce new members to the care team.[6] These new team members share in decision making, which may theoretically reduce residents' opportunities to hone their decision‐making skills when caring for potentially critically ill patients.
Despite these potential disadvantages, Butcher and colleagues report that the vast majority of residents found working with the RRT to be a valuable educational experience and disagreed that the RRT decreased their clinical autonomy. Interestingly, surgical residents were less likely to agree that working with the RRT was a valuable educational experience and much more likely to feel that nurses should contact them before activating the RRT.
The results of the study by Butcher et al. highlight several evolving paradigms in medical education and quality improvement. Over the past 10 to 15 years, and fostered in large part by Accreditation Council for Graduate Medical Education (ACGME) duty‐hour revisions,[7] teaching hospitals have moved away from the traditional practice of using residents primarily to fill their clinical service needs to an approach that treats residents more as learners. Resident training requires clinical care, but the provision of clinical care in teaching hospitals does not necessarily require residents. At the same time, healthcare organizations have moved away from the traditional culture characterized by reliance on individual skill, physician autonomy, and steep hierarchies, to an enlightened culture emphasizing teamwork with flattened hierarchies and systems redesigned to provide safe and effective care.[8]
For the most part, the paradigm shifts in medical education and quality improvement have been aligned. In fact, the primary goal of duty‐hour policy revisions was to improve patient safety.[9] Yet, Butcher and colleagues' study highlights the need to continuously and deliberately integrate our efforts to enhance medical education and quality of care, and more rigorously study the effects. Rather than be pleasantly surprised that residents understand the intrinsic value of an RRT to patient care and their education, we should ensure that residents understand the rationale for an RRT and consider using the RRT to complement other efforts to educate resident physicians in managing unstable patients. RRTs introduce a wonderful opportunity to develop novel interprofessional curricula. Learning objectives should include the management of common clinical syndromes represented in RRT calls, but should also focus on communication, leadership, and other essential teamwork skills. Simulation‐based training is an ideal teaching strategy for these objectives, and prior studies support the effectiveness of this approach.[10, 11]
The ACGME has now implemented the Next Accreditation System (NAS) across all specialties. Of the 22 reporting milestones within internal medicine, 12 relate directly to quality improvement and patient safety objectives, whereas 6 relate directly to pathophysiology and disease management.[12] Educating residents on systems of care is further highlighted by the Clinical Learning Environment Review (CLER), a key component of the NAS. The CLER program uses site visits to identify teaching hospitals' efforts to engage residents in 6 focus areas: patient safety; healthcare quality; transitions of care; supervision; duty hours, fatigue management, and mitigation; and professionalism.[13] CLER site visits include discussions and observations with hospital executive leadership, residents, graduate medical education leadership, nursing, and other hospital staff. The CLER program raises the bar for integrating medical education and quality improvement efforts even further. Quality improvement activities that previously supported an informal curriculum must now be made explicit to, and deliberately engage, our residents. Teaching hospitals are being tasked with including residents in safety initiatives and on all quality committees, especially those with cross‐departmental boundaries such as the Emergency Response Team/RRT Committee. Residents should meaningfully participate, and whenever possible, lead quality improvement projects, the focus of which may ideally be identified by residents themselves. An important resource for medical educators is the Quality and Safety Educators Academy, a program developed by the Society of Hospital Medicine and the Alliance for Academic Internal Medicine, which provides educators with the knowledge and tools to integrate quality improvement and patient safety objectives into their training programs.[14]
In conclusion, we are reassured that residents understand the intrinsic value of an RRT to patient care and their education. We encourage medical educators to use RRTs as an opportunity to develop interprofessional curricula, including those that aim to enhance teamwork skills. Beyond curricular innovation, quality‐improvement activities in teaching hospitals must deliberately engage our residents at every level of the organization.
Disclosure
Disclosure: Nothing to report.
- , , , . The effect of a rapid response team on resident perceptions of education and autonomy. J Hosp Med. 2015;10(1):8–12.
- , , , , . Rapid response teams: a systematic review and meta‐analysis. Arch Intern Med. 2010;170(1):18–26.
- , , , , , . Rapid‐response systems as a patient safety strategy: a systematic review. Ann Intern Med. 2013;158(5 pt 2):417–425.
- , , , et al. Hospital cardiac arrest resuscitation practice in the United States: a nationally representative survey. J Hosp Med. 2014;9(6):353–357.
- . Achieving a safe culture: theory and practice. Work Stress. 1998;12(3):293–306.
- , , , . Rapid response systems in adult academic medical centers. Jt Comm J Qual Patient Saf. 2009;35(9):475–482, 437.
- , , . The new recommendations on duty hours from the ACGME Task Force. N Engl J Med. 2010;363(2):e3.
- , , , et al. The AHRQ hospital survey on patient safety culture: a tool to plan and evaluate patient safety programs. In: Henriksen K, Battles JB, Keyes MA, et al., eds. Advances in Patient Safety: New Directions and Alternative Approaches (Vol. 2: Culture and Redesign). Rockville, MD: Agency for Healthcare Research and Quality; 2008. Available at: http://www.ncbi.nlm.nih.gov/books/NBK43699. Accessed November 4, 2014.
- The ACGME 2011 Duty Hour Standards: Enhancing Quality of Care, Supervision, and Resident Professional Development. Chicago, IL: Accreditation Council for Graduate Medical Education; 2011.
- , , , , . Improving medical emergency team (MET) performance using a novel curriculum and a computerized human patient simulator. Qual Saf Health Care. 2005;14(5):326–331.
- , , , . System‐based interprofessional simulation‐based training program increases awareness and use of rapid response teams. Jt Comm J Qual Patient Saf. 2014;40(6):279–287.
- Internal Medicine Milestone Group. The Internal Medicine Milestone Project. A Joint Initiative of the Accreditation Council for Graduate Medical Education and The American Board of Internal Medicine. Available at: https://www.acgme.org/acgmeweb/Portals/0/PDFs/Milestones/InternalMedicineMilestones.pdf. Accessed November 4, 2014.
- , , . The clinical learning environment: the foundation of graduate medical education. JAMA. 2013;309(16):1687–1688.
- , , , et al. The Quality and Safety Educators Academy: fulfilling an unmet need for faculty development. Am J Med Qual. 2014;29(1):5–12.
In this issue of the Journal of Hospital Medicine, Butcher and colleagues report on residents' perceptions of a rapid response team's (RRT) impact on their training.[1] RRTs mobilize key clinicians in an attempt to rescue acutely decompensating hospitalized patients. Early recognition is essential, and most systems allow any concerned health professional to activate the RRT. Although the evidence for benefit is somewhat controversial,[2, 3] an overwhelming majority of hospitals have implemented RRTs.[4, 5]
The use of RRTs in teaching hospitals raises important concerns. The ability of nurses and other professionals to activate the RRT without need for prior approval from a physician could potentially undermine resident physician autonomy. Residents may feel that their clinical judgment has been usurped or second guessed. Whether nurse led or physician led, RRTs always introduce new members to the care team.[6] These new team members share in decision making, which may theoretically reduce residents' opportunities to hone their decision‐making skills when caring for potentially critically ill patients.
Despite these potential disadvantages, Butcher and colleagues report that the vast majority of residents found working with the RRT to be a valuable educational experience and disagreed that the RRT decreased their clinical autonomy. Interestingly, surgical residents were less likely to agree that working with the RRT was a valuable educational experience and much more likely to feel that nurses should contact them before activating the RRT.
The results of the study by Butcher et al. highlight several evolving paradigms in medical education and quality improvement. Over the past 10 to 15 years, and fostered in large part by Accreditation Council for Graduate Medical Education (ACGME) duty‐hour revisions,[7] teaching hospitals have moved away from the traditional practice of using residents primarily to fill their clinical service needs to an approach that treats residents more as learners. Resident training requires clinical care, but the provision of clinical care in teaching hospitals does not necessarily require residents. At the same time, healthcare organizations have moved away from the traditional culture characterized by reliance on individual skill, physician autonomy, and steep hierarchies, to an enlightened culture emphasizing teamwork with flattened hierarchies and systems redesigned to provide safe and effective care.[8]
For the most part, the paradigm shifts in medical education and quality improvement have been aligned. In fact, the primary goal of duty‐hour policy revisions was to improve patient safety.[9] Yet, Butcher and colleagues' study highlights the need to continuously and deliberately integrate our efforts to enhance medical education and quality of care, and more rigorously study the effects. Rather than be pleasantly surprised that residents understand the intrinsic value of an RRT to patient care and their education, we should ensure that residents understand the rationale for an RRT and consider using the RRT to complement other efforts to educate resident physicians in managing unstable patients. RRTs introduce a wonderful opportunity to develop novel interprofessional curricula. Learning objectives should include the management of common clinical syndromes represented in RRT calls, but should also focus on communication, leadership, and other essential teamwork skills. Simulation‐based training is an ideal teaching strategy for these objectives, and prior studies support the effectiveness of this approach.[10, 11]
The ACGME has now implemented the Next Accreditation System (NAS) across all specialties. Of the 22 reporting milestones within internal medicine, 12 relate directly to quality improvement and patient safety objectives, whereas 6 relate directly to pathophysiology and disease management.[12] Educating residents on systems of care is further highlighted by the Clinical Learning Environment Review (CLER), a key component of the NAS. The CLER program uses site visits to identify teaching hospitals' efforts to engage residents in 6 focus areas: patient safety; healthcare quality; transitions of care; supervision; duty hours, fatigue management, and mitigation; and professionalism.[13] CLER site visits include discussions and observations with hospital executive leadership, residents, graduate medical education leadership, nursing, and other hospital staff. The CLER program raises the bar for integrating medical education and quality improvement efforts even further. Quality improvement activities that previously supported an informal curriculum must now be made explicit to, and deliberately engage, our residents. Teaching hospitals are being tasked with including residents in safety initiatives and on all quality committees, especially those with cross‐departmental boundaries such as the Emergency Response Team/RRT Committee. Residents should meaningfully participate, and whenever possible, lead quality improvement projects, the focus of which may ideally be identified by residents themselves. An important resource for medical educators is the Quality and Safety Educators Academy, a program developed by the Society of Hospital Medicine and the Alliance for Academic Internal Medicine, which provides educators with the knowledge and tools to integrate quality improvement and patient safety objectives into their training programs.[14]
In conclusion, we are reassured that residents understand the intrinsic value of an RRT to patient care and their education. We encourage medical educators to use RRTs as an opportunity to develop interprofessional curricula, including those that aim to enhance teamwork skills. Beyond curricular innovation, quality‐improvement activities in teaching hospitals must deliberately engage our residents at every level of the organization.
Disclosure
Disclosure: Nothing to report.
- , , , . The effect of a rapid response team on resident perceptions of education and autonomy. J Hosp Med. 2015;10(1):8–12.
- , , , , . Rapid response teams: a systematic review and meta‐analysis. Arch Intern Med. 2010;170(1):18–26.
- , , , , , . Rapid‐response systems as a patient safety strategy: a systematic review. Ann Intern Med. 2013;158(5 pt 2):417–425.
- , , , et al. Hospital cardiac arrest resuscitation practice in the United States: a nationally representative survey. J Hosp Med. 2014;9(6):353–357.
- . Achieving a safe culture: theory and practice. Work Stress. 1998;12(3):293–306.
- , , , . Rapid response systems in adult academic medical centers. Jt Comm J Qual Patient Saf. 2009;35(9):475–482, 437.
- , , . The new recommendations on duty hours from the ACGME Task Force. N Engl J Med. 2010;363(2):e3.
- , , , et al. The AHRQ hospital survey on patient safety culture: a tool to plan and evaluate patient safety programs. In: Henriksen K, Battles JB, Keyes MA, et al., eds. Advances in Patient Safety: New Directions and Alternative Approaches (Vol. 2: Culture and Redesign). Rockville, MD: Agency for Healthcare Research and Quality; 2008. Available at: http://www.ncbi.nlm.nih.gov/books/NBK43699. Accessed November 4, 2014.
- The ACGME 2011 Duty Hour Standards: Enhancing Quality of Care, Supervision, and Resident Professional Development. Chicago, IL: Accreditation Council for Graduate Medical Education; 2011.
- , , , , . Improving medical emergency team (MET) performance using a novel curriculum and a computerized human patient simulator. Qual Saf Health Care. 2005;14(5):326–331.
- , , , . System‐based interprofessional simulation‐based training program increases awareness and use of rapid response teams. Jt Comm J Qual Patient Saf. 2014;40(6):279–287.
- Internal Medicine Milestone Group. The Internal Medicine Milestone Project. A Joint Initiative of the Accreditation Council for Graduate Medical Education and The American Board of Internal Medicine. Available at: https://www.acgme.org/acgmeweb/Portals/0/PDFs/Milestones/InternalMedicineMilestones.pdf. Accessed November 4, 2014.
- , , . The clinical learning environment: the foundation of graduate medical education. JAMA. 2013;309(16):1687–1688.
- , , , et al. The Quality and Safety Educators Academy: fulfilling an unmet need for faculty development. Am J Med Qual. 2014;29(1):5–12.
Effect of Hospitalist Discontinuity on AE
Although definitions vary, continuity of care can be thought of as the patient's experience of a continuous caring relationship with an identified healthcare professional.[1] Research in ambulatory settings has found that patients who see their primary care physician for a higher proportion of office visits have higher patient satisfaction, better hypertensive control, lower risk of hospitalization, and fewer emergency department visits.[2, 3, 4, 5] Continuity with a single hospital‐based physician is difficult to achieve because of the need to provide care 24 hours a day, 7 days a week. Key clinical information may be lost during physician‐to‐physician handoffs (eg, at admission, at the end of rotations on service) during hospitalization. Our research group recently found that lower hospital physician continuity was associated with modestly increased hospital costs, but also a trend toward lower readmissions.[6] We speculated that physicians newly taking over patient care from colleagues reassess diagnoses and treatment plans. This reassessment may identify errors missed by the previous hospital physician. Thus, discontinuity may theoretically help or hinder the provision of safe hospital care.
We sought to examine the relationship between hospital physician continuity and the incidence of adverse events (AEs). We combined data from 2 previously published studies by our research group; one investigated the relationship between hospital physician continuity and costs and 30‐day readmissions, the other assessed the impact of unit‐based interventions on AEs.[6, 7]
METHODS
Setting and Study Design
This retrospective, observational study was conducted at Northwestern Memorial Hospital, an 876‐bed tertiary care teaching hospital in Chicago, Illinois, and was approved by the institutional review board of Northwestern University. Subjects included patients admitted to an adult nonteaching hospitalist service between March 1, 2009 and December 31, 2011. Hospitalists on this service worked without resident physicians in rotations usually lasting 7 consecutive days beginning on Mondays and ending on Sundays. Hospitalists were allowed to switch portions of their schedule with one another, creating the possibility that certain rotations may have been slightly shorter or longer than 7 days. Hospitalists gave verbal sign‐out via telephone to the hospitalist taking over their service on the afternoon of the last day of their rotation. These handoffs customarily involved both hospitalists viewing the electronic health record during the discussion but were not standardized. Night hospitalists performed admissions and cross‐coverage each night from 7 pm to 7 am. Night hospitalists printed history and physicals for day hospitalists, but typically did not give verbal sign‐out on new admissions.
Acquisition of Study Population Data
We identified all patients admitted to the nonteaching hospitalist service using the Northwestern Medicine Enterprise Data Warehouse (EDW), an integrated repository of all clinical and research data sources on the campus. We excluded patients admitted under observation status, those initially admitted to other services (eg, intensive care, general surgery), those discharged from other services, and those cared for by advanced practice providers (ie, nurse practitioners and physician assistants).
Predictor Variables
We identified physicians completing the primary service history and physicals (H&P) and progress notes throughout patients' hospitalizations to calculate 2 measures of continuity: the Number of Physicians Index (NPI), and the Usual Provider of Continuity (UPC) Index.[8, 9] The NPI represented the total number of unique hospitalists completing H&Ps and/or progress notes for a patient. The UPC was calculated as the largest number of notes signed by a single hospitalist divided by the total number of hospitalist notes for a patient. For example, if Dr. John Smith wrote notes on the first 4 days of a patient's hospital stay, and Dr. Mary Jones wrote notes on the following 2 days (total stay=6 days), the NPI would be 2 and the UPC would be 0.67. Therefore, higher NPI and lower UPC designate lower continuity. Significant events occurring during the nighttime were documented in separate notes titled cross‐cover notes. These cross‐cover notes were not included in the calculation of NPI or UPC. In the rare event that 2 or more progress notes were written on the same day, we selected the one used for billing to calculate UPC and NPI.
Outcome Variables
We used AE data from a study we conducted to assess the impact of unit‐based interventions to improve teamwork and patient safety, the methods of which have been previously described.[7] Briefly, we used a 2‐stage medical record review similar to that performed in prior studies.[10, 11, 12, 13] In the first stage, we identified potential AEs using automated queries of the Northwestern Medicine EDW. These queries were based on screening criteria used in the Harvard Medical Practice Study and the Institute for Healthcare Improvement (IHI) Global Trigger Tool.[12, 13] Examples of queries included abnormal laboratory values (eg, international normalized ratio [INR] >6 after hospital day 2 and excluding patients with INR >4 on day 1), administration of rescue medications (eg, naloxone), certain types of incident reports (eg, pressure ulcer), International Classification of Diseases, Ninth Revision (ICD‐9) codes indicating hospital‐acquired conditions (eg, venous thromboembolism), and text searches of progress notes and discharge summaries using natural language processing.[14] Prior research by our group confirmed these automated screens identify a similar number of AEs as manual medical record screening.[14] For each patient with 1 or more potential AE, a research nurse performed a medical record abstraction and created a description of each potential AE.
In the second stage, 2 physician researchers independently reviewed each potential AE in a blinded fashion to determine whether or not an AE was present. An AE was defined as injury due to medical management rather than the natural history of the illness,[15] and included injuries that prolonged the hospital stay or produced disability as well as those resulting in transient disability or abnormal lab values.[16] After independent review, physician reviewers discussed discrepancies in their ratings to achieve consensus.
We tested the reliability of medical record abstractions in our prior study by conducting duplicate abstractions and consensus ratings for a randomly selected sample of 294 patients.[7] The inter‐rater reliability was good for determining the presence of AEs (=0.63).
Statistical Analyses
We calculated descriptive statistics for patient characteristics. Primary discharge diagnosis ICD‐9 codes were categorized using the Healthcare Cost and Utilization Project Clinical Classification Software.[17] We created multivariable logistic regression models with the independent variable being the measure of continuity (NPI or UPC) and the dependent variable being experiencing 1 or more AEs. Covariates included patient age, sex, race, payer, night admission, weekend admission, intensive care unit stay, Medicare Severity Diagnosis Related Group (MS‐DRG) weight, and total number of Elixhauser comorbidities.[18] The length of stay (LOS) was also included as a covariate, as longer LOS increases the probability of discontinuity and may increase the risk for AEs. Because MS‐DRG weight and LOS were highly correlated, we created several models; the first including both as continuous variables, the second including both categorized into quartiles, and a third excluding MS‐DRG weight and including LOS as a continuous variable. Our prior study assessing the impact of unit‐based interventions did not show a statistically significant difference in the pre‐ versus postintervention period, thus we did not include study period as a covariate.
RESULTS
Patient Characteristics
Our analyses included data from 474 hospitalizations. Patient characteristics are shown in Table 1. Patients were a mean 51.118.8 years of age, hospitalized for a mean 3.43.1 days, included 241 (50.8%) women, and 233 (49.2%) persons of nonwhite race. The mean and standard deviation of NPI and UPC were 2.51.0 and 0.60.2. Overall, 47 patients (9.9%) experienced 55 total AEs. AEs included 31 adverse drug events, 6 falls, 5 procedural injuries, 4 manifestations of poor glycemic control, 3 hospital‐acquired infections, 2 episodes of acute renal failure, 1 episode of delirium, 1 pressure ulcer, and 2 categorized as other.
| Characteristic | Value |
|---|---|
| |
| Mean age (SD), y | 55.1 (18.8) |
| Mean length of stay (SD), d | 3.4 (3.1) |
| Women, n (%) | 241 (50.8) |
| Nonwhite race, n (%) | 233 (49.2) |
| Payer, n (%) | |
| Private | 180 (38) |
| Medicare | 165 (34.8) |
| Medicaid | 47 (9.9) |
| Self‐pay/other | 82 (17.3) |
| Night admission, n (%) | 245 (51.7) |
| Weekend admission, n (%) | 135 (28.5) |
| Intensive care unit stay, n (%) | 18 (3.8) |
| Diagnosis, n (%) | |
| Diseases of the circulatory system | 95 (20.0) |
| Diseases of the digestive system | 65 (13.7) |
| Diseases of the respiratory system | 49 (10.3) |
| Injury and poisoning | 41 (8.7) |
| Diseases of the skin and soft tissue | 31 (6.5) |
| Symptoms, signs, and ill‐defined conditions and factors influencing health status | 28 (5.9) |
| Endocrine, nutritional, and metabolic diseases and immunity disorders | 25 (5.3) |
| Diseases of the genitourinary system | 24 (5.1) |
| Diseases of the musculoskeletal system and connective tissue | 23 (4.9) |
| Diseases of the nervous system | 23 (4.9) |
| Other | 70 (14.8) |
| Mean no. of Elixhauser comorbidities (SD) | 2.3 (1.7) |
| Mean MS‐DRG weight (SD) | 1.0 (1.0) |
| Mean NPI (SD) | 2.5 (1.0) |
| Mean UPC (SD) | 0.6 (0.2) |
Association Between Continuity and Adverse Events
In unadjusted models, each 1‐unit increase in the NPI (ie, less continuity) was significantly associated with the incidence of 1 or more AEs (odds ratio [OR]=1.75; P<0.001). However, UPC was not associated with incidence of AEs (OR=1.03; P=0.68) (Table 2). Across all adjusted models, neither NPI nor UPC was significantly associated with the incidence of AEs. The direction of the effect of discontinuity on AEs was inconsistent across models. Though all 3 adjusted models using NPI as the independent variable showed a trend toward increased odds of experiencing 1 or more AE with discontinuity, 2 of the 3 models using UPC showed trends in the opposite direction.
| NPI OR (95% CI)* | P Value | UPC OR (95% CI)* | P Value | ||
|---|---|---|---|---|---|
| |||||
| Unadjusted model | 1.75 (1.332.29) | <0.0001 | 1.03 (0.89‐1.21) | 0.68 | |
| Adjusted models | |||||
| Model 1 | MS‐DRG and LOS continuous | 1.16 (0.781.72) | 0.47 | 0.96 (0.791.14) | 0.60 |
| Model 2 | MS‐DRG and LOS in quartiles | 1.38 (0.981.94) | 0.07 | 1.05 (0.881.26) | 0.59 |
| Model 3 | MS‐DRG dropped, LOS continuous | 1.14 (0.771.70) | 0.51 | 0.95 (0.791.14) | 0.56 |
DISCUSSION
We found that hospitalist physician continuity was not associated with the incidence of AEs. Our findings are somewhat surprising because of the high value placed on continuity of care and patient safety concerns related to handoffs. Key clinical information may be lost when patient care is transitioned to a new hospitalist shortly after admission (eg, from a night hospitalist) or at the end of a rotation. Thus, it is logical to assume that discontinuity inherently increases the risk for harm. On the other hand, a physician newly taking over patient care from another may not be anchored to the initial diagnosis and treatment plan established by the first. This second look could potentially prevent missed/delayed diagnoses and optimize the plan of care.[19] These countervailing forces may explain our findings.
Several other potential explanations for our findings should be considered. First, the quality of handoffs may have been sufficient to overcome the potential for information loss. We feel this is unlikely given that little attention had been dedicated to improving the quality of patient handoffs among hospitalists in our institution. Notably, though a number of studies have evaluated resident physician handoffs, most of the work has focused on night coverage, and little is known about the quality of attending handoffs.[20] Second, access to a fully integrated electronic health record may have assisted hospitalists in complementing information received during handoffs. For example, a hospitalist about to start his or her rotation may have remotely accessed and reviewed patient medical records prior to receiving the phone handoff from the outgoing hospitalist. Third, other efforts to improve patient safety may have reduced the overall risk and provided some resilience in the system. Unit‐based interventions, including structured interdisciplinary rounds and nurse‐physician coleadership, improved teamwork climate and reduced AEs in the study hospital over time.[7]
Another factor to consider relates to the fact that hospital care is provided by teams of clinicians (eg, nurses, specialist physicians, therapists, social workers). Hospital teams are often large and have dynamic team membership. Similar to hospitalists, nurses, physician specialists, and other team members handoff care throughout the course of a patient's hospital stay. Yet, discontinuity for each professional type may occur at different times and frequencies. For example, a patient may be handed off from one hospitalist to another, yet the care continues with the same cardiologist or nurse. Future research should better characterize hospital team complexity (eg, size, relationships among members) and dynamics (eg, continuity for various professional types) and the impact of these factors on patient outcomes.
Our findings are important because hospitalist physician discontinuity is common during hospital stays. Hospital medicine groups vary in their staffing and scheduling models. Policies related to admission distribution and rotation length (consecutive days worked) systematically impact physician continuity. Few studies have evaluated the effect on continuity on hospitalized patient outcomes, and no prior research, to our knowledge, has explored the association of continuity on measures of patient safety.[6, 21, 22] Though our study might suggest that staffing models have little impact on patient safety, as previously mentioned, other team factors may influence patient outcomes.
Our study has several limitations. First, we assessed the impact of continuity on AEs in a single site. Although the 7 days on/7 days off model is the most common scheduling pattern used by adult hospital medicine groups,[23] staffing models and patient safety practices vary across hospitals, potentially limiting the generalizability of our study. Second, continuity can be defined and measured in a variety of ways. We used 2 different measures of physician continuity. As previously mentioned, assessing continuity of other clinicians may allow for a more complete understanding of the potential problems related to fragmentation of care. Third, this study excluded patients who experienced care transitions from other hospitals or other units within the hospital. Patients transferred from other hospitals are often complex, severely ill, and may be at higher risk for loss of key clinical information. Fourth, we used automated screens of an EDW to identify potential AEs. Although our prior research found that this method identified a similar number of AEs as manual medical record review screening, there was poor agreement between the 2 methods. Unfortunately, there is no gold standard to identify AEs. The EDW‐facilitated method allowed us to feasibly screen a larger number of charts, increasing statistical power, and minimized any potential bias that might occur during a manual review to identify potential AEs. Finally, we used data available from 2 prior studies and may have been underpowered to detect a significant association between continuity and AEs due to the relatively low percentage of patients experiencing an AE. In a post hoc power calculation, we estimated that we had 70% power to detect a 33% change in the proportion of patients with 1 or more AE for each 1‐unit increase in NPI, and 80% power to detect a 20% change for each 0.1‐unit decrease in UPC.
CONCLUSION
In conclusion, we found that hospitalist physician continuity was not associated with the incidence of AEs. We speculate that hospitalist continuity is only 1 of many team factors that may influence patient safety, and that prior efforts within our institution may have reduced our ability to detect an association. Future research should better characterize hospital team complexity and dynamics and the impact of these factors on patient outcomes.
Disclosures
This project was supported by a grant from the Agency for Healthcare Research and Quality and an Excellence in Academic Medicine Award, administered by Northwestern Memorial Hospital. The authors report no conflicts of interest.
- , , . What is “continuity of care”? J Health Serv Res Policy. 2006;11:248–250.
- , . Interpersonal continuity of care and care outcomes: a critical review. Ann Fam Med. 2005;3:159–166.
- , , , . The association between continuity of care and outcomes: a systematic and critical review. J Eval Clin Pract. 2010;16:947–956.
- , . Interpersonal continuity of care and patient satisfaction: a critical review. Ann Fam Med. 2004;2:445–451.
- , , , . Continuity of care in a family practice residency program. Impact on physician satisfaction. J Fam Pract. 1990;31:69–73.
- , , , et al. The impact of hospitalist discontinuity on hospital cost, readmissions, and patient satisfaction. J Gen Intern Med. 2014;29:1004–1008.
- , , , et al. Implementation of unit‐based interventions to improve teamwork and patient safety on a medical service [published online ahead of print June 11, 2014]. Am J Med Qual. doi: 10.1177/1062860614538093.
- . Measuring provider continuity in ambulatory care: an assessment of alternative approaches. Med Care. 1979;17:551–565.
- . Defining and measuring interpersonal continuity of care. Ann Fam Med. 2003;1:134–143.
- U.S. Department of Health and Human Services. Agency for Healthcare Research and Quality. Adverse events in hospitals: national incidence among medical beneficiaries. Available at: http://psnet.ahrq.gov/resource.aspx?resourceID=19811. Published November 2010. Accessed on December 15, 2014.
- , , , et al. “Global trigger tool” shows that adverse events in hospitals may be ten times greater than previously measured. Health Aff (Millwood). 2011;30:581–589.
- , , , et al. A study of medical injury and medical malpractice. N Engl J Med. 1989;321:480–484.
- , , , et al. Incidence and types of adverse events and negligent care in Utah and Colorado. Med Care. 2000;38:261–271.
- , , , et al. Comparison of traditional trigger tool to data warehouse based screening for identifying hospital adverse events. BMJ Qual Saf. 2013;22:130–138.
- , , , et al. Incidence of adverse events and negligence in hospitalized patients. Results of the Harvard Medical Practice Study I. N Engl J Med. 1991;324:370–376.
- , , . Safety of patients isolated for infection control. JAMA. 2003;290:1899–1905.
- HCUP Clinical Classification Software. Agency for Healthcare Research and Quality, Rockville, MD. http://www.hcup-us.ahrq.gov/toolssoftware/ccs/ccs.jsp. Accessed on December 15, 2014.
- , , , . Comorbidity measures for use with administrative data. Med Care. 1998;36:8–27.
- . Does continuity of care matter? No: discontinuity can improve patient care. West J Med. 2001;175:5.
- , , , , , . Hospitalist handoffs: a systematic review and task force recommendations. J Hosp Med. 2009;4:433–440.
- , , , , . The impact of fragmentation of hospitalist care on length of stay. J Hosp Med. 2010;5:335–338.
- , , . The Creating Incentives and Continuity Leading to Efficiency staffing model: a quality improvement initiative in hospital medicine. Mayo Clin Proc. 2012;87:364–371.
- Society of Hospital Medicine. 2014 state of hospital medicine report. Philadelphia, PA: Society of Hospital Medicine; 2014.
Although definitions vary, continuity of care can be thought of as the patient's experience of a continuous caring relationship with an identified healthcare professional.[1] Research in ambulatory settings has found that patients who see their primary care physician for a higher proportion of office visits have higher patient satisfaction, better hypertensive control, lower risk of hospitalization, and fewer emergency department visits.[2, 3, 4, 5] Continuity with a single hospital‐based physician is difficult to achieve because of the need to provide care 24 hours a day, 7 days a week. Key clinical information may be lost during physician‐to‐physician handoffs (eg, at admission, at the end of rotations on service) during hospitalization. Our research group recently found that lower hospital physician continuity was associated with modestly increased hospital costs, but also a trend toward lower readmissions.[6] We speculated that physicians newly taking over patient care from colleagues reassess diagnoses and treatment plans. This reassessment may identify errors missed by the previous hospital physician. Thus, discontinuity may theoretically help or hinder the provision of safe hospital care.
We sought to examine the relationship between hospital physician continuity and the incidence of adverse events (AEs). We combined data from 2 previously published studies by our research group; one investigated the relationship between hospital physician continuity and costs and 30‐day readmissions, the other assessed the impact of unit‐based interventions on AEs.[6, 7]
METHODS
Setting and Study Design
This retrospective, observational study was conducted at Northwestern Memorial Hospital, an 876‐bed tertiary care teaching hospital in Chicago, Illinois, and was approved by the institutional review board of Northwestern University. Subjects included patients admitted to an adult nonteaching hospitalist service between March 1, 2009 and December 31, 2011. Hospitalists on this service worked without resident physicians in rotations usually lasting 7 consecutive days beginning on Mondays and ending on Sundays. Hospitalists were allowed to switch portions of their schedule with one another, creating the possibility that certain rotations may have been slightly shorter or longer than 7 days. Hospitalists gave verbal sign‐out via telephone to the hospitalist taking over their service on the afternoon of the last day of their rotation. These handoffs customarily involved both hospitalists viewing the electronic health record during the discussion but were not standardized. Night hospitalists performed admissions and cross‐coverage each night from 7 pm to 7 am. Night hospitalists printed history and physicals for day hospitalists, but typically did not give verbal sign‐out on new admissions.
Acquisition of Study Population Data
We identified all patients admitted to the nonteaching hospitalist service using the Northwestern Medicine Enterprise Data Warehouse (EDW), an integrated repository of all clinical and research data sources on the campus. We excluded patients admitted under observation status, those initially admitted to other services (eg, intensive care, general surgery), those discharged from other services, and those cared for by advanced practice providers (ie, nurse practitioners and physician assistants).
Predictor Variables
We identified physicians completing the primary service history and physicals (H&P) and progress notes throughout patients' hospitalizations to calculate 2 measures of continuity: the Number of Physicians Index (NPI), and the Usual Provider of Continuity (UPC) Index.[8, 9] The NPI represented the total number of unique hospitalists completing H&Ps and/or progress notes for a patient. The UPC was calculated as the largest number of notes signed by a single hospitalist divided by the total number of hospitalist notes for a patient. For example, if Dr. John Smith wrote notes on the first 4 days of a patient's hospital stay, and Dr. Mary Jones wrote notes on the following 2 days (total stay=6 days), the NPI would be 2 and the UPC would be 0.67. Therefore, higher NPI and lower UPC designate lower continuity. Significant events occurring during the nighttime were documented in separate notes titled cross‐cover notes. These cross‐cover notes were not included in the calculation of NPI or UPC. In the rare event that 2 or more progress notes were written on the same day, we selected the one used for billing to calculate UPC and NPI.
Outcome Variables
We used AE data from a study we conducted to assess the impact of unit‐based interventions to improve teamwork and patient safety, the methods of which have been previously described.[7] Briefly, we used a 2‐stage medical record review similar to that performed in prior studies.[10, 11, 12, 13] In the first stage, we identified potential AEs using automated queries of the Northwestern Medicine EDW. These queries were based on screening criteria used in the Harvard Medical Practice Study and the Institute for Healthcare Improvement (IHI) Global Trigger Tool.[12, 13] Examples of queries included abnormal laboratory values (eg, international normalized ratio [INR] >6 after hospital day 2 and excluding patients with INR >4 on day 1), administration of rescue medications (eg, naloxone), certain types of incident reports (eg, pressure ulcer), International Classification of Diseases, Ninth Revision (ICD‐9) codes indicating hospital‐acquired conditions (eg, venous thromboembolism), and text searches of progress notes and discharge summaries using natural language processing.[14] Prior research by our group confirmed these automated screens identify a similar number of AEs as manual medical record screening.[14] For each patient with 1 or more potential AE, a research nurse performed a medical record abstraction and created a description of each potential AE.
In the second stage, 2 physician researchers independently reviewed each potential AE in a blinded fashion to determine whether or not an AE was present. An AE was defined as injury due to medical management rather than the natural history of the illness,[15] and included injuries that prolonged the hospital stay or produced disability as well as those resulting in transient disability or abnormal lab values.[16] After independent review, physician reviewers discussed discrepancies in their ratings to achieve consensus.
We tested the reliability of medical record abstractions in our prior study by conducting duplicate abstractions and consensus ratings for a randomly selected sample of 294 patients.[7] The inter‐rater reliability was good for determining the presence of AEs (=0.63).
Statistical Analyses
We calculated descriptive statistics for patient characteristics. Primary discharge diagnosis ICD‐9 codes were categorized using the Healthcare Cost and Utilization Project Clinical Classification Software.[17] We created multivariable logistic regression models with the independent variable being the measure of continuity (NPI or UPC) and the dependent variable being experiencing 1 or more AEs. Covariates included patient age, sex, race, payer, night admission, weekend admission, intensive care unit stay, Medicare Severity Diagnosis Related Group (MS‐DRG) weight, and total number of Elixhauser comorbidities.[18] The length of stay (LOS) was also included as a covariate, as longer LOS increases the probability of discontinuity and may increase the risk for AEs. Because MS‐DRG weight and LOS were highly correlated, we created several models; the first including both as continuous variables, the second including both categorized into quartiles, and a third excluding MS‐DRG weight and including LOS as a continuous variable. Our prior study assessing the impact of unit‐based interventions did not show a statistically significant difference in the pre‐ versus postintervention period, thus we did not include study period as a covariate.
RESULTS
Patient Characteristics
Our analyses included data from 474 hospitalizations. Patient characteristics are shown in Table 1. Patients were a mean 51.118.8 years of age, hospitalized for a mean 3.43.1 days, included 241 (50.8%) women, and 233 (49.2%) persons of nonwhite race. The mean and standard deviation of NPI and UPC were 2.51.0 and 0.60.2. Overall, 47 patients (9.9%) experienced 55 total AEs. AEs included 31 adverse drug events, 6 falls, 5 procedural injuries, 4 manifestations of poor glycemic control, 3 hospital‐acquired infections, 2 episodes of acute renal failure, 1 episode of delirium, 1 pressure ulcer, and 2 categorized as other.
| Characteristic | Value |
|---|---|
| |
| Mean age (SD), y | 55.1 (18.8) |
| Mean length of stay (SD), d | 3.4 (3.1) |
| Women, n (%) | 241 (50.8) |
| Nonwhite race, n (%) | 233 (49.2) |
| Payer, n (%) | |
| Private | 180 (38) |
| Medicare | 165 (34.8) |
| Medicaid | 47 (9.9) |
| Self‐pay/other | 82 (17.3) |
| Night admission, n (%) | 245 (51.7) |
| Weekend admission, n (%) | 135 (28.5) |
| Intensive care unit stay, n (%) | 18 (3.8) |
| Diagnosis, n (%) | |
| Diseases of the circulatory system | 95 (20.0) |
| Diseases of the digestive system | 65 (13.7) |
| Diseases of the respiratory system | 49 (10.3) |
| Injury and poisoning | 41 (8.7) |
| Diseases of the skin and soft tissue | 31 (6.5) |
| Symptoms, signs, and ill‐defined conditions and factors influencing health status | 28 (5.9) |
| Endocrine, nutritional, and metabolic diseases and immunity disorders | 25 (5.3) |
| Diseases of the genitourinary system | 24 (5.1) |
| Diseases of the musculoskeletal system and connective tissue | 23 (4.9) |
| Diseases of the nervous system | 23 (4.9) |
| Other | 70 (14.8) |
| Mean no. of Elixhauser comorbidities (SD) | 2.3 (1.7) |
| Mean MS‐DRG weight (SD) | 1.0 (1.0) |
| Mean NPI (SD) | 2.5 (1.0) |
| Mean UPC (SD) | 0.6 (0.2) |
Association Between Continuity and Adverse Events
In unadjusted models, each 1‐unit increase in the NPI (ie, less continuity) was significantly associated with the incidence of 1 or more AEs (odds ratio [OR]=1.75; P<0.001). However, UPC was not associated with incidence of AEs (OR=1.03; P=0.68) (Table 2). Across all adjusted models, neither NPI nor UPC was significantly associated with the incidence of AEs. The direction of the effect of discontinuity on AEs was inconsistent across models. Though all 3 adjusted models using NPI as the independent variable showed a trend toward increased odds of experiencing 1 or more AE with discontinuity, 2 of the 3 models using UPC showed trends in the opposite direction.
| NPI OR (95% CI)* | P Value | UPC OR (95% CI)* | P Value | ||
|---|---|---|---|---|---|
| |||||
| Unadjusted model | 1.75 (1.332.29) | <0.0001 | 1.03 (0.89‐1.21) | 0.68 | |
| Adjusted models | |||||
| Model 1 | MS‐DRG and LOS continuous | 1.16 (0.781.72) | 0.47 | 0.96 (0.791.14) | 0.60 |
| Model 2 | MS‐DRG and LOS in quartiles | 1.38 (0.981.94) | 0.07 | 1.05 (0.881.26) | 0.59 |
| Model 3 | MS‐DRG dropped, LOS continuous | 1.14 (0.771.70) | 0.51 | 0.95 (0.791.14) | 0.56 |
DISCUSSION
We found that hospitalist physician continuity was not associated with the incidence of AEs. Our findings are somewhat surprising because of the high value placed on continuity of care and patient safety concerns related to handoffs. Key clinical information may be lost when patient care is transitioned to a new hospitalist shortly after admission (eg, from a night hospitalist) or at the end of a rotation. Thus, it is logical to assume that discontinuity inherently increases the risk for harm. On the other hand, a physician newly taking over patient care from another may not be anchored to the initial diagnosis and treatment plan established by the first. This second look could potentially prevent missed/delayed diagnoses and optimize the plan of care.[19] These countervailing forces may explain our findings.
Several other potential explanations for our findings should be considered. First, the quality of handoffs may have been sufficient to overcome the potential for information loss. We feel this is unlikely given that little attention had been dedicated to improving the quality of patient handoffs among hospitalists in our institution. Notably, though a number of studies have evaluated resident physician handoffs, most of the work has focused on night coverage, and little is known about the quality of attending handoffs.[20] Second, access to a fully integrated electronic health record may have assisted hospitalists in complementing information received during handoffs. For example, a hospitalist about to start his or her rotation may have remotely accessed and reviewed patient medical records prior to receiving the phone handoff from the outgoing hospitalist. Third, other efforts to improve patient safety may have reduced the overall risk and provided some resilience in the system. Unit‐based interventions, including structured interdisciplinary rounds and nurse‐physician coleadership, improved teamwork climate and reduced AEs in the study hospital over time.[7]
Another factor to consider relates to the fact that hospital care is provided by teams of clinicians (eg, nurses, specialist physicians, therapists, social workers). Hospital teams are often large and have dynamic team membership. Similar to hospitalists, nurses, physician specialists, and other team members handoff care throughout the course of a patient's hospital stay. Yet, discontinuity for each professional type may occur at different times and frequencies. For example, a patient may be handed off from one hospitalist to another, yet the care continues with the same cardiologist or nurse. Future research should better characterize hospital team complexity (eg, size, relationships among members) and dynamics (eg, continuity for various professional types) and the impact of these factors on patient outcomes.
Our findings are important because hospitalist physician discontinuity is common during hospital stays. Hospital medicine groups vary in their staffing and scheduling models. Policies related to admission distribution and rotation length (consecutive days worked) systematically impact physician continuity. Few studies have evaluated the effect on continuity on hospitalized patient outcomes, and no prior research, to our knowledge, has explored the association of continuity on measures of patient safety.[6, 21, 22] Though our study might suggest that staffing models have little impact on patient safety, as previously mentioned, other team factors may influence patient outcomes.
Our study has several limitations. First, we assessed the impact of continuity on AEs in a single site. Although the 7 days on/7 days off model is the most common scheduling pattern used by adult hospital medicine groups,[23] staffing models and patient safety practices vary across hospitals, potentially limiting the generalizability of our study. Second, continuity can be defined and measured in a variety of ways. We used 2 different measures of physician continuity. As previously mentioned, assessing continuity of other clinicians may allow for a more complete understanding of the potential problems related to fragmentation of care. Third, this study excluded patients who experienced care transitions from other hospitals or other units within the hospital. Patients transferred from other hospitals are often complex, severely ill, and may be at higher risk for loss of key clinical information. Fourth, we used automated screens of an EDW to identify potential AEs. Although our prior research found that this method identified a similar number of AEs as manual medical record review screening, there was poor agreement between the 2 methods. Unfortunately, there is no gold standard to identify AEs. The EDW‐facilitated method allowed us to feasibly screen a larger number of charts, increasing statistical power, and minimized any potential bias that might occur during a manual review to identify potential AEs. Finally, we used data available from 2 prior studies and may have been underpowered to detect a significant association between continuity and AEs due to the relatively low percentage of patients experiencing an AE. In a post hoc power calculation, we estimated that we had 70% power to detect a 33% change in the proportion of patients with 1 or more AE for each 1‐unit increase in NPI, and 80% power to detect a 20% change for each 0.1‐unit decrease in UPC.
CONCLUSION
In conclusion, we found that hospitalist physician continuity was not associated with the incidence of AEs. We speculate that hospitalist continuity is only 1 of many team factors that may influence patient safety, and that prior efforts within our institution may have reduced our ability to detect an association. Future research should better characterize hospital team complexity and dynamics and the impact of these factors on patient outcomes.
Disclosures
This project was supported by a grant from the Agency for Healthcare Research and Quality and an Excellence in Academic Medicine Award, administered by Northwestern Memorial Hospital. The authors report no conflicts of interest.
- , , . What is “continuity of care”? J Health Serv Res Policy. 2006;11:248–250.
- , . Interpersonal continuity of care and care outcomes: a critical review. Ann Fam Med. 2005;3:159–166.
- , , , . The association between continuity of care and outcomes: a systematic and critical review. J Eval Clin Pract. 2010;16:947–956.
- , . Interpersonal continuity of care and patient satisfaction: a critical review. Ann Fam Med. 2004;2:445–451.
- , , , . Continuity of care in a family practice residency program. Impact on physician satisfaction. J Fam Pract. 1990;31:69–73.
- , , , et al. The impact of hospitalist discontinuity on hospital cost, readmissions, and patient satisfaction. J Gen Intern Med. 2014;29:1004–1008.
- , , , et al. Implementation of unit‐based interventions to improve teamwork and patient safety on a medical service [published online ahead of print June 11, 2014]. Am J Med Qual. doi: 10.1177/1062860614538093.
- . Measuring provider continuity in ambulatory care: an assessment of alternative approaches. Med Care. 1979;17:551–565.
- . Defining and measuring interpersonal continuity of care. Ann Fam Med. 2003;1:134–143.
- U.S. Department of Health and Human Services. Agency for Healthcare Research and Quality. Adverse events in hospitals: national incidence among medical beneficiaries. Available at: http://psnet.ahrq.gov/resource.aspx?resourceID=19811. Published November 2010. Accessed on December 15, 2014.
- , , , et al. “Global trigger tool” shows that adverse events in hospitals may be ten times greater than previously measured. Health Aff (Millwood). 2011;30:581–589.
- , , , et al. A study of medical injury and medical malpractice. N Engl J Med. 1989;321:480–484.
- , , , et al. Incidence and types of adverse events and negligent care in Utah and Colorado. Med Care. 2000;38:261–271.
- , , , et al. Comparison of traditional trigger tool to data warehouse based screening for identifying hospital adverse events. BMJ Qual Saf. 2013;22:130–138.
- , , , et al. Incidence of adverse events and negligence in hospitalized patients. Results of the Harvard Medical Practice Study I. N Engl J Med. 1991;324:370–376.
- , , . Safety of patients isolated for infection control. JAMA. 2003;290:1899–1905.
- HCUP Clinical Classification Software. Agency for Healthcare Research and Quality, Rockville, MD. http://www.hcup-us.ahrq.gov/toolssoftware/ccs/ccs.jsp. Accessed on December 15, 2014.
- , , , . Comorbidity measures for use with administrative data. Med Care. 1998;36:8–27.
- . Does continuity of care matter? No: discontinuity can improve patient care. West J Med. 2001;175:5.
- , , , , , . Hospitalist handoffs: a systematic review and task force recommendations. J Hosp Med. 2009;4:433–440.
- , , , , . The impact of fragmentation of hospitalist care on length of stay. J Hosp Med. 2010;5:335–338.
- , , . The Creating Incentives and Continuity Leading to Efficiency staffing model: a quality improvement initiative in hospital medicine. Mayo Clin Proc. 2012;87:364–371.
- Society of Hospital Medicine. 2014 state of hospital medicine report. Philadelphia, PA: Society of Hospital Medicine; 2014.
© 2014 Society of Hospital Medicine
Hospitalists and Liability
In this issue of the Journal of Hospital Medicine, Schaffer and colleagues report their analysis of malpractice claims against hospitalists compared to other physician specialties.[1] In contrast to previous work examining medical liability,[2, 3] Schaffer and colleagues have been able to identify hospitalists specifically.[2, 3]
Perhaps surprisingly, their main finding was that the rate of claims against hospitalists was significantly lower than for nonhospitalist internists, emergency medicine physicians, general surgeons, and obstetriciansgynecologists. We say surprisingly, because health systems utilizing hospitalists generally include features that might increase the risk for malpractice claims.
For example, new patients are typically assigned to whichever hospitalist is up for the next admission. Research shows that strained patientphysician relationships increase the risk for malpractice claims.[4, 5] Schaffer's data suggest that lack of a preexisting relationship is a challenge, but one to which most hospitalists have grown accustomed. Hospitalists develop and hone skills that allow them to quickly establish rapport with patients and families. Moreover, though patients seldom choose their hospitalist, they often do select the hospital in which they receive their care. The research group of 1 of the authors was recently surprised to find patients had high levels of trust with their hospital physicians, despite frequently being unable to name them or identify their role.[6] We suspect patients in the study had high levels of trust with the hospital and transferred this trust to their assigned physicians as representatives of the organization. Certainly, this hypothesis needs to be tested, and in no way does it minimize the importance of a strong patient‐physician relationship.
In addition, patientphysician continuity has long been felt to be paramount to safe and effective care; however, it is difficult to achieve in hospitalist systems. Hospitalized patients experience multiple handoffs, including those at admission, for night coverage, and at the time of service change (ie, end of rotation/stint). The potential for loss of information is enormous. Though increased attention has been dedicated to handoffs among housestaff, little work has been done to describe issues related to handoffs among practicing physicians. However, some discontinuity may be advantageous. A physician newly taking over patient care from another may not be anchored to the initial diagnosis and treatment plan established by the first. This free second look may actually prevent missed/delayed diagnoses and optimize plans of care, further reducing harm from care and risk of malpractice.[7]
Hospital discharge is another highly risky time, due to issues such as tests pending at the time of discharge and the need to manage ongoing workup and treatment of unresolved issues.[8, 9] The responsibility for tying up these loose ends may be unclear as patients are transitioned from the care of hospitalists to outpatient physicians. Prior research has shown that patients are at particularly high risk for preventable adverse events after hospital discharge.[10, 11] More recently, healthcare policy has focused on measuring and incentivizing the reduction of readmissions.[12] Although only a portion of readmissions are truly preventable,[13] and many patients who suffer adverse events after discharge are not readmitted,[11] the efforts resulting from these policy initiatives may have improved the overall safety of transitions of care.
A particularly important contribution of Schaffer and colleagues' study is that it helps us identify patient safety issues related to hospital medicine. Despite intense national efforts over the past 10 to 15 years, progress has been slow in reducing the rate of adverse events among hospitalized patients.[14, 15, 16] Although adverse events and medical liability do not always correlate,[17, 18] the contributing factors identified in Schaffer and colleagues' study help direct our patient safety efforts.
Clinical judgment was the most common factor associated with hospitalist malpractice claims, with examples including failure or delay in ordering a necessary diagnostic test or specialist consultation. These results may be misinterpreted by some to suggest that ordering more tests and services may reduce risk for malpractice claims. However, there is no evidence to support the belief that these defensive medicine behaviors actually reduce risk. In fact, the opposite may be true. Research shows that abnormal tests are frequently overlooked,[9, 19] and failure to act on abnormal results is a common cause of diagnostic error.[20] Experts have called for the development of diagnosis‐related quality measures and better strategies to enhance trainees' clinical reasoning skills.[21] We suggest that future research also clarify the effect of interruptions, distractions, and workload on cognitive errors in hospital settings.
Communication failures were the second most common contributing factor. As previously mentioned, communication failures may occur between hospitalists during handoffs. We also have major opportunities to improve interprofessional teamwork, especially between physicians and nurses.[22, 23] An increasing number of hospitalist groups are collaborating with other hospital‐based professionals to implement novel strategies to improve teamwork,[24, 25] many of which were recently summarized in a review published in this journal.[26]
Documentation was the third most common contributing factor. Most malpractice claims are filed long after the alleged injury has occurred.[18] Unless the clinicians involved and the hospital in which they work are aware of an event that might result in a malpractice claim, the investigation may be severely delayed. As time goes on, professionals are less able to recall details pertinent to understanding contributing factors to an event. Thus, documentation is critical. As the saying goes, if it wasn't documented, it didn't happen. The flipside of too little documentation is, of course, too much. The increasing use of electronic health records makes it easy to copy and paste outdated information, the sloppiness of which can only hurt when attempting to defend a malpractice claim.[27]
In conclusion, despite a model with inherent features that might contribute to medical malpractice risk, hospital medicine has a claim rate lower than many other specialties. Though reassuring, hospitalists should remember that the most productive way to approach malpractice risk is reframe the problem as one that attempts to reduce risk for patients, rather than for physicians. Improving patient safety is a core value for hospital medicine. Schaffer and colleagues' study identifies factors contributing to patient safety risk in hospital medicine, allowing us to renew our efforts in focused areas.
- , , , . Liability impact of the hospitalist model of care. J Hosp Med. 2014;9(12):750–755.
- , , . Paid malpractice claims for adverse events in inpatient and outpatient settings. JAMA. 2011;305(23):2427–2431.
- , , , . Malpractice risk according to physician specialty. N Engl J Med. 2011;365(7):629–636.
- , , , . The doctor‐patient relationship and malpractice. Lessons from plaintiff depositions. Arch Intern Med. 1994;154(12):1365–1370.
- , , , , . Physician‐patient communication. The relationship with malpractice claims among primary care physicians and surgeons. JAMA. 1997;277(7):553–559.
- , , , , , . The impact of facecards on patients' knowledge, satisfaction, trust, and agreement with hospital physicians: a pilot study. J Hosp Med. 2014;9(3):137–141.
- . Does continuity of care matter? No: discontinuity can improve patient care. West J Med. 2001;175(1):5.
- , , . Tying up loose ends: discharging patients with unresolved medical issues. Arch Intern Med. 2007;167(12):1305–1311.
- , , , et al. Patient safety concerns arising from test results that return after hospital discharge. Ann Intern Med. 2005;143(2):121–128.
- , , , et al. Adverse events among medical patients after discharge from hospital. CMAJ. 2004;170(3):345–349.
- , , , , . The incidence and severity of adverse events affecting patients after discharge from the hospital. Ann Intern Med. 2003;138(3):161–167.
- U.S. Department of Health 183(7):E391–E402.
- U.S. Department of Health 363(22):2124–2134.
- , , , et al. National trends in patient safety for four common conditions, 2005–2011. N Engl J Med. 2014;370(4):341–351.
- , , , et al. Relation between malpractice claims and adverse events due to negligence. Results of the Harvard Medical Practice Study III. N Engl J Med. 1991;325(4):245–251.
- , , , et al. Claims, errors, and compensation payments in medical malpractice litigation. N Engl J Med. 2006;354(19):2024–2033.
- , , , , , . “I wish I had seen this test result earlier!”: Dissatisfaction with test result management systems in primary care. Arch Intern Med. 2004;164(20):2223–2228.
- , , , et al. Diagnostic error in medicine: analysis of 583 physician‐reported errors. Arch Intern Med. 2009;169(20):1881–1887.
- , , . Bringing diagnosis into the quality and safety equations. JAMA. 2012;308(12):1211–1212.
- , , , , , . Teamwork on inpatient medical units: assessing attitudes and barriers. Qual Saf Health Care. 2010;19(2):117–121.
- , , , et al. Patterns of nurse‐physician communication and agreement on the plan of care. Qual Saf Health Care. 2010;19(3):195–199.
- , , , et al. Effects of a multicentre teamwork and communication programme on patient outcomes: results from the Triad for Optimal Patient Safety (TOPS) project. BMJ Qual Saf. 2012;21(2):118–126.
- , , , , , . Unit‐based interprofessional leadership models in six US hospitals. J Hosp Med. 2014;9(8):545–550.
- , , , . Interdisciplinary teamwork in hospitals: A review and practical recommendations for improvement. J Hosp Med. 2012;7(1):48–54.
- , . Legal, ethical, and financial dilemmas in electronic health record adoption and use. Pediatrics. 2011;127(4):e1042–e1047.
In this issue of the Journal of Hospital Medicine, Schaffer and colleagues report their analysis of malpractice claims against hospitalists compared to other physician specialties.[1] In contrast to previous work examining medical liability,[2, 3] Schaffer and colleagues have been able to identify hospitalists specifically.[2, 3]
Perhaps surprisingly, their main finding was that the rate of claims against hospitalists was significantly lower than for nonhospitalist internists, emergency medicine physicians, general surgeons, and obstetriciansgynecologists. We say surprisingly, because health systems utilizing hospitalists generally include features that might increase the risk for malpractice claims.
For example, new patients are typically assigned to whichever hospitalist is up for the next admission. Research shows that strained patientphysician relationships increase the risk for malpractice claims.[4, 5] Schaffer's data suggest that lack of a preexisting relationship is a challenge, but one to which most hospitalists have grown accustomed. Hospitalists develop and hone skills that allow them to quickly establish rapport with patients and families. Moreover, though patients seldom choose their hospitalist, they often do select the hospital in which they receive their care. The research group of 1 of the authors was recently surprised to find patients had high levels of trust with their hospital physicians, despite frequently being unable to name them or identify their role.[6] We suspect patients in the study had high levels of trust with the hospital and transferred this trust to their assigned physicians as representatives of the organization. Certainly, this hypothesis needs to be tested, and in no way does it minimize the importance of a strong patient‐physician relationship.
In addition, patientphysician continuity has long been felt to be paramount to safe and effective care; however, it is difficult to achieve in hospitalist systems. Hospitalized patients experience multiple handoffs, including those at admission, for night coverage, and at the time of service change (ie, end of rotation/stint). The potential for loss of information is enormous. Though increased attention has been dedicated to handoffs among housestaff, little work has been done to describe issues related to handoffs among practicing physicians. However, some discontinuity may be advantageous. A physician newly taking over patient care from another may not be anchored to the initial diagnosis and treatment plan established by the first. This free second look may actually prevent missed/delayed diagnoses and optimize plans of care, further reducing harm from care and risk of malpractice.[7]
Hospital discharge is another highly risky time, due to issues such as tests pending at the time of discharge and the need to manage ongoing workup and treatment of unresolved issues.[8, 9] The responsibility for tying up these loose ends may be unclear as patients are transitioned from the care of hospitalists to outpatient physicians. Prior research has shown that patients are at particularly high risk for preventable adverse events after hospital discharge.[10, 11] More recently, healthcare policy has focused on measuring and incentivizing the reduction of readmissions.[12] Although only a portion of readmissions are truly preventable,[13] and many patients who suffer adverse events after discharge are not readmitted,[11] the efforts resulting from these policy initiatives may have improved the overall safety of transitions of care.
A particularly important contribution of Schaffer and colleagues' study is that it helps us identify patient safety issues related to hospital medicine. Despite intense national efforts over the past 10 to 15 years, progress has been slow in reducing the rate of adverse events among hospitalized patients.[14, 15, 16] Although adverse events and medical liability do not always correlate,[17, 18] the contributing factors identified in Schaffer and colleagues' study help direct our patient safety efforts.
Clinical judgment was the most common factor associated with hospitalist malpractice claims, with examples including failure or delay in ordering a necessary diagnostic test or specialist consultation. These results may be misinterpreted by some to suggest that ordering more tests and services may reduce risk for malpractice claims. However, there is no evidence to support the belief that these defensive medicine behaviors actually reduce risk. In fact, the opposite may be true. Research shows that abnormal tests are frequently overlooked,[9, 19] and failure to act on abnormal results is a common cause of diagnostic error.[20] Experts have called for the development of diagnosis‐related quality measures and better strategies to enhance trainees' clinical reasoning skills.[21] We suggest that future research also clarify the effect of interruptions, distractions, and workload on cognitive errors in hospital settings.
Communication failures were the second most common contributing factor. As previously mentioned, communication failures may occur between hospitalists during handoffs. We also have major opportunities to improve interprofessional teamwork, especially between physicians and nurses.[22, 23] An increasing number of hospitalist groups are collaborating with other hospital‐based professionals to implement novel strategies to improve teamwork,[24, 25] many of which were recently summarized in a review published in this journal.[26]
Documentation was the third most common contributing factor. Most malpractice claims are filed long after the alleged injury has occurred.[18] Unless the clinicians involved and the hospital in which they work are aware of an event that might result in a malpractice claim, the investigation may be severely delayed. As time goes on, professionals are less able to recall details pertinent to understanding contributing factors to an event. Thus, documentation is critical. As the saying goes, if it wasn't documented, it didn't happen. The flipside of too little documentation is, of course, too much. The increasing use of electronic health records makes it easy to copy and paste outdated information, the sloppiness of which can only hurt when attempting to defend a malpractice claim.[27]
In conclusion, despite a model with inherent features that might contribute to medical malpractice risk, hospital medicine has a claim rate lower than many other specialties. Though reassuring, hospitalists should remember that the most productive way to approach malpractice risk is reframe the problem as one that attempts to reduce risk for patients, rather than for physicians. Improving patient safety is a core value for hospital medicine. Schaffer and colleagues' study identifies factors contributing to patient safety risk in hospital medicine, allowing us to renew our efforts in focused areas.
- , , , . Liability impact of the hospitalist model of care. J Hosp Med. 2014;9(12):750–755.
- , , . Paid malpractice claims for adverse events in inpatient and outpatient settings. JAMA. 2011;305(23):2427–2431.
- , , , . Malpractice risk according to physician specialty. N Engl J Med. 2011;365(7):629–636.
- , , , . The doctor‐patient relationship and malpractice. Lessons from plaintiff depositions. Arch Intern Med. 1994;154(12):1365–1370.
- , , , , . Physician‐patient communication. The relationship with malpractice claims among primary care physicians and surgeons. JAMA. 1997;277(7):553–559.
- , , , , , . The impact of facecards on patients' knowledge, satisfaction, trust, and agreement with hospital physicians: a pilot study. J Hosp Med. 2014;9(3):137–141.
- . Does continuity of care matter? No: discontinuity can improve patient care. West J Med. 2001;175(1):5.
- , , . Tying up loose ends: discharging patients with unresolved medical issues. Arch Intern Med. 2007;167(12):1305–1311.
- , , , et al. Patient safety concerns arising from test results that return after hospital discharge. Ann Intern Med. 2005;143(2):121–128.
- , , , et al. Adverse events among medical patients after discharge from hospital. CMAJ. 2004;170(3):345–349.
- , , , , . The incidence and severity of adverse events affecting patients after discharge from the hospital. Ann Intern Med. 2003;138(3):161–167.
- U.S. Department of Health 183(7):E391–E402.
- U.S. Department of Health 363(22):2124–2134.
- , , , et al. National trends in patient safety for four common conditions, 2005–2011. N Engl J Med. 2014;370(4):341–351.
- , , , et al. Relation between malpractice claims and adverse events due to negligence. Results of the Harvard Medical Practice Study III. N Engl J Med. 1991;325(4):245–251.
- , , , et al. Claims, errors, and compensation payments in medical malpractice litigation. N Engl J Med. 2006;354(19):2024–2033.
- , , , , , . “I wish I had seen this test result earlier!”: Dissatisfaction with test result management systems in primary care. Arch Intern Med. 2004;164(20):2223–2228.
- , , , et al. Diagnostic error in medicine: analysis of 583 physician‐reported errors. Arch Intern Med. 2009;169(20):1881–1887.
- , , . Bringing diagnosis into the quality and safety equations. JAMA. 2012;308(12):1211–1212.
- , , , , , . Teamwork on inpatient medical units: assessing attitudes and barriers. Qual Saf Health Care. 2010;19(2):117–121.
- , , , et al. Patterns of nurse‐physician communication and agreement on the plan of care. Qual Saf Health Care. 2010;19(3):195–199.
- , , , et al. Effects of a multicentre teamwork and communication programme on patient outcomes: results from the Triad for Optimal Patient Safety (TOPS) project. BMJ Qual Saf. 2012;21(2):118–126.
- , , , , , . Unit‐based interprofessional leadership models in six US hospitals. J Hosp Med. 2014;9(8):545–550.
- , , , . Interdisciplinary teamwork in hospitals: A review and practical recommendations for improvement. J Hosp Med. 2012;7(1):48–54.
- , . Legal, ethical, and financial dilemmas in electronic health record adoption and use. Pediatrics. 2011;127(4):e1042–e1047.
Hospital Unit‐Based Leadership Models
Hospital‐based care has become more complex over time. Patients are sicker, with more chronic comorbid conditions requiring greater collaboration to provide coordinated patient care.[1, 2] Care coordination requires an interdisciplinary approach during hospitalization and especially during transitions of care.[3, 4] In addition, hospitals are tasked with managing and improving clinical workflow efficiencies, and implementing electronic health records (EHR)[5] that require healthcare professionals to learn new systems of care and technology. Payment models have also started to shift toward an incentive and penalty‐based structure in the form of value‐based purchasing, readmission penalties, hospital‐acquired conditions, and meaningful use.[4, 6]
In response to these pressures, hospitals are searching for ways to reliably deliver quality care that is safe, effective, patient centered, timely, efficient, and equitable.[7] Previous efforts to improve quality in the general medical inpatient setting have included redesign of the clinical work environment and new workflows through the use of checklists and whiteboards to enhance communication, patient‐centered bedside rounds, standardized protocols and handovers, and integrated clinical decision support using health information technology.[8, 9, 10, 11, 12, 13] Although each of these care coordination activities has potential value, integrating them at the unit level often remains a challenge. Some hospitals have addressed this challenge by establishing and supporting a unit‐based leadership model, where a medical director and nurse manager work together to assess and improve the quality, safety, efficiency, and patient experience‐based mission of the organization.[14, 15] However, there are few descriptions of this leadership model in the current literature. Herein, we present the unit‐based leadership model that has been developed and implemented at 6 hospitals.
MODELS OF UNIT‐BASED LEADERSHIP
The unit‐based leadership model is grounded on the idea that culture and clinical care are products of frontline structure, process, and relationships, and that leaders at the site of care can have the greatest influence on the local work environment.[16, 17] The objective is to influence care and culture at the bedside and the unit, where care is delivered and where alignment with organizational vision and mission must occur. The concept of the inpatient unit medical director is not new, and hospitals in the past have recruited physician leaders to become clinical champions for quality improvement and help establish a collaborative work environment for physicians and unit‐based staff.[18, 19, 20, 21, 22] These studies report on the challenges and benefits of incorporating a medical director to inpatient psychiatry or general care units, but do not provide specific details about the recruitment and responsibilities for unit‐based dyad partnerships, which are critical factors for success on multidisciplinary inpatient care units.
There are several logistical matters to consider when instituting a unit‐based leadership model. These include the composition of the leadership team, selection process of the leaders, the presence of trainees and permanent faculty, and whether the units are able to geographically cohort patients. Other considerations include a clear role description with established shared goals and expectations, and a compensation model that includes effort and incentives. In addition, there should be a clearly established reporting structure to senior leadership, and the unit leaders should be given opportunities for professional growth and development. Table 1 provides a summary overview of 6 hospitals' experiences to date.
| Structure | Hospital of the University of Pennsylvania | Northwestern Memorial Hospital | Emory University Hospital | University of Michigan Health System | Christiana Care Health System | St. Joseph Mercy Health System/Integrated Health Associates |
|---|---|---|---|---|---|---|
| ||||||
| Description of hospital(s) | Academic medical center, 784 beds, 40,000 annual admissions | Academic medical center, 897 beds, 53,000 annual admissions | Academic medical center, 579 beds, 24,000 annual admissions | Academic medical center, 839 beds, 45,000 annual admissions | Independent academic medical center, 1,100 beds, 53,000 annual admissions | Tertiary community hospital that is part of a larger health care system (Trinity Health), 579 beds, 33,000 annual admissions |
| Unit leadership model | Triad of medical director, nurse manager, and quality improvement specialist/project manager | Dyad of medical director and nurse manager | Dyad of medical director and nurse manager | Dyad of medical director and nurse manager | Dyad of medical director and nurse manager | Dyad of medical director and nurse manager |
| Percent effort time supported for unit medical director | 10% | 17% | 10% | 20% | 20% | 10% |
| Incentives built into unit leaders' performance in outcomes metrics | No | Yes | No | No | No | Yes |
| Professional development/leadership training | Quality improvement method: PDSA, Six Sigma, Lean Healthcare | Quality improvement method: Six Sigma | Situational leadership training with 1:1 mentoring | Quality improvement method: Lean Healthcare, service excellence program | Quality Improvement method: Six Sigma, Lean Healthcare | Quality improvement method: Six Sigma |
| Additional leadership development through Penn Medicine Leadership Academy and Wharton Executive Education | Additional leadership development through Northwestern's professional development center and simulation training center | Conflict resolution skill development | Attend patient and Family Centered Care conference | Additional leadership development through Christiana Care Learning Institute | Attend educational course on Crucial Conversations | |
| Personality profile with coaching | Additional leadership development through University of Michigan Health System's human resources group | |||||
| Outcomes metrics monitored | Patient satisfaction | Patient satisfaction | Patient satisfaction | Patient satisfaction | Patient satisfaction | Patient satisfaction |
| Efficiency of multidisciplinary rounds | Teamwork climate (survey) | Teamwork and implementation of structured interdisciplinary bedside rounds | Multidisciplinary rounds | Interdisciplinary rounds | Participation in interdisciplinary rounds | |
| RNMD work environment surveys | Adverse events | Unit‐based patient safety culture survey | Patient‐centered, bedside rounds | Readmission rates | ||
| Hospital‐acquired conditions (CAUTI, CLABSI, VAP, DVT, pressure ulcers) | Hospital‐acquired conditions (fall rates, pressure ulcers | Hospital‐acquired conditions (CAUTI, CLABSI, fall rates, pressure ulcers) | Hospital‐acquired conditions (CAUTI) | Hospital‐acquired conditions (fall rates, pressure ulcers) | Core measures | |
| Readmission rates | Readmission rates | Mortality | Readmission rates | Readmission rates | Medication reconciliation | |
| Core measures, patient safety indicators | Core measures | Length of stay | DVT prophylaxis | Hand hygiene | Discharge by 11 am | |
| Mortality (observed to expected, transfer, inpatient) | Hand hygiene | Glycemic control | Meeting attendance | Length of stay | Use of patient teach‐back | |
| Medication reconciliation | Restraint use | Communication with PCPs | ||||
| Home care, hospice, post‐acute care referral rates | ||||||
| Organizational leadership structure support for clinical unit partnership program | CMO, CNO, vice president of quality/patient safety, directors of medical and surgical nursing | Associate chair of medicine, director of medicine nursing; all medical directors are members of the department of medicine quality management committee | CMO, CNO, CEO, CQO | CMO, CNO | All teams report to and are supported by 3 overarching, system‐wide committees: (1) safety first, (2) think of yourself as a patient, (3) clinical excellence. Those committees, in turn, report up to the senior management quality/safety coordinating council. | Director of hospitalist program (reports to CMO); nursing director of acute care (reports to CNO) |
DISCUSSION
In reviewing our 6 organization's collective experiences, we identified several common themes and some notable differences across sites. The core of the leadership team was primarily composed of the medical director and nurse manager on the unit. Across all 6 organizations, medical directors had a portion of their effort supported for their leadership work on the unit. Leadership development training was provided at all of our sites, with particular emphasis on quality improvement (QI) methods such as Six‐Sigma, Lean, or Plan, Do, Study, Act (PDSA). Additional leadership development sessions were provided through the organization's human resources or affiliated university. Common outcome measures of interest include patient satisfaction, interdisciplinary practice, and collaboration on the unit, and some hospital‐acquired condition measures. Last, there is a direct reporting relationship to a chief or senior nurse or physician leader within each organization. These commonalities and variances are further detailed below.
Establishing the Unit‐Based Leadership Model
The composition of the unit‐based leadership model in our 6 organizations is predominantly a dyad partnership of medical directors and nurse managers. Although informal physician‐nurse collaborative practices have likely been in existence at many hospitals, formalizing this dyad partnership is an important step to fostering collaborative efforts to improve quality of care. It is also essential for hospital leadership to clearly articulate the need for this unit‐based leadership model. Whether the motivation for change is from a previously untenable practice environment, or part of an ongoing improvement program, the model should be presented in a manner that supports the organization's commitment to improve collaborative practices for better patient care. One of our 6 hospitals initiated this leadership model based on troubling relationships between nurses and physicians on some of their inpatient care units, which threatened to stall the organization's Magnet application. Implementation of the leadership model at the unit level yielded improvements in nursephysician interactions, patient satisfaction, and staff turnover.[15, 23] Another of the hospitals first evaluated why a previous attempt at this model did not deliver the intended outcomes, and redesigned the model based on its analysis.[14]
Across all of the organizations featured here, a common driver behind the adoption of the unit‐based leadership model was to bridge the divide between physician services and nursing and other allied health providers. We found that many of the physicians routinely had patients on multiple units, limiting the quantity and quality of collaborative practices between unit‐based staff and physician teams. The unit‐based dyad leaders are ideally positioned to build and foster a culture of collaboration, and our organizations have been inclusive to ensure the participation of a multidisciplinary group of providers, including representatives from pharmacy, environmental services, physical therapy, respiratory therapy, social work, case management, and nutrition at leadership meetings or in daily patient‐care discussions. In addition, 2 of the organizations have added quality improvement specialist/project managers to their teams to support the physiciannurse manager leaders on the unit.
Selection Process and Professional Development
The traditional approach to hiring a physician leader or a nurse manager has been an isolated process of drafting a job description for each position and hiring within their respective departments. For the dyad partnership to be successful, there should be established goals and expectations that require shared responsibilities between the 2 partners, which should guide the selection of these leaders. Other leadership attributes and essential character traits that should be modeled by the unit‐based leaders include good communication skills, respect among coworkers, and a collaborative approach to decision making and action. In addition, both physician leaders and nurse managers in these roles should have the ability to take a system's view, recognizing that within the complex network of healthcare providers and processes on their unit, these elements interact with each other, which lead to the outcomes achieved on their units.[24, 25] Table 2 lists some general shared responsibilities, highlighting specific activities that can be used to achieve the established outcomes. As the unit's dyad leadership works together to address these shared responsibilities, they should keep their sights focused on the overall strategic goals of the healthcare organization. Bohmer has defined 4 habits of the high‐value healthcare organization that in turn can be reflected through the inpatient unit leadership model to capture these activities at the local level: (1) planning care for specific patient populations, (2) microsystem design, (3) measurement and oversight, and (4) self‐study.[26] In determining specific shared responsibilities for each dyad partner, it is important for these leaders to understand the clinical microsystem of their unit such as their patient population, interdisciplinary care team, approach to process improvement, and performance patterns over time.[27]
| General Shared Responsibilities of Physician and Nurse Unit Directors | Examples of Specific Activities |
|---|---|
| |
| Serve as management partners to enhance culture of the unit | Co‐craft and deliver consistent leadership message |
| Co‐establish and enforce unit processes and protocols | |
| Co‐lead recruitment and retention efforts | |
| Co‐orient trainees and faculty rotating through unit | |
| Co‐educate on the management of common medical and surgical conditions | |
| Facilitate interstaff conflict resolution sessions | |
| Regular leadership meetings | |
| Actively manage unit processes and outcomes | Quality: improve core quality measure performance |
| Safety: improve culture of patient safety within the unit as measured by surveys and incident reporting systems | |
| Efficiency: reduce unnecessary length of stay and variability in resource use | |
| Patient experience: focus on improving patient‐family experience with targeted outcomes in patient experience metrics (eg, HCAHPS) | |
| Education: develop trainee and staff clinical and teamwork competencies | |
| Continuous process improvement initiatives (eg, PDSA cycles) | Improve the discharge transitions process, tailoring the process to each individual patient's identified risk factors |
| Focus improvement efforts on reduction in specific hospital acquired conditions such as CAUTI, VTE, CLABSI, pressure ulcers, falls | |
| Measure, analyze, reassess, and improve in all described areas of shared responsibilities | |
| Perform unit level chart reviews to evaluate readmissions and LOS and identify improvement opportunities | |
In our collective experience, the dyad leaders bring passion and commitment to improving care; however, many (the medical directors in particular) have minimal prior formal training in leadership, quality improvement, or hospital management. Recognizing that unit leaders require specialized knowledge and skills, each of our organizations has enrolled unit medical directors and nurse managers in leadership development courses or educational programs. Many healthcare organizations have become more grounded in a QI methodology including Six‐Sigma, Lean Healthcare, PDSA, and other scientifically based methods, and the unit‐based leaders should receive advanced training in the preferred methods of their institution. Additional training in quality improvement, patient safety, and physician leadership can also be obtained through supplemental coursework specifically designed to train hospital leaders, with some programs leading to a certification or additional credentials.[28]
Beyond such formal educational opportunities, hospitals should not overlook the opportunity to learn from and share experiences with the other dyad leadership units within the hospital. One of the organizations described here holds monthly meetings with all of the unit dyad leaders, and 2 other organizations conduct quarterly meetings to share experiences and best practices related to specific improvement initiatives in a learning network model. Those units with more experience in specific initiatives are asked to share their lessons learned with others, as well as support each other in their efforts to collectively meet the strategic goals of the hospital.
Time and Organizational Support
In addition to leadership development, hospitals and the clinical department leadership need to support the medical directors with dedicated time away from their usual clinical duties. Some organizations in this report are providing up to 20% effort for the medical director's unit‐based leadership work; however, there is some variation in practice with regard to physician effort across sites. The University of Pennsylvania has a smaller effort support at 10%; however, some of that effort differential may be offset through the allocation of the quality improvement specialist/project manager assigned to work with the medical director and nurse manager dyad. St. Joseph Mercy Hospital also has a lower allocation, as there is additional financial compensation for the role that is at risk and not included in this 10% allocation.
It is also important to assure that the medical directors have institutional support to carry out their work in partnership with their nursing leadership. The 6 health systems described here report that although most of the physicians have appointments within a physician group or clinical department, there is hospital leadership oversight from a chief medical, nursing, or operating officer. This organizational structure may be an important aspect of the model as the unit‐based leaders seek to align their efforts with that of the hospital. Further, this form of organizational oversight can ensure that the unit leaders will receive timely and essential unit‐ and hospital‐based performance measures to manage local improvement efforts. These measures may include some components of patient experiences as reported in the Hospital Consumer Assessment of Healthcare Providers and Systems survey, readmission rates, hospital‐acquired condition rates, length of stay, observed to expected mortality rates, and results of staff satisfaction and safety culture surveys. As highlighted by several studies and commentaries, our collective experiences also identified interdisciplinary teamwork, collaboration, and communication as desirable outcome measures through the unit‐based leadership structure.[21, 22, 24, 29, 30] The medical director and nurse manager dyads can prioritize their improvement efforts based on the data provided to them, and mobilize the appropriate group of multidisciplinary practitioners and support staff on the unit.
OTHER CONSIDERATIONS
Other infrastructure variables that may increase the effectiveness of the unit leadership dyad include unit‐based clinical services (geographic localization), engaging the frontline team members in the design and implementation of change innovations, a commitment to patient and family centered practices on the unit, and enhancing clinical workflow through the support of EHR functions such as concurrent documentation and provider order entry. Geographic localization, placing the fewest possible clinical service providers on the unit to work alongside unit‐based staff, allows for a cohesive interdisciplinary unit‐based team to develop under the dyad leadership, and has been shown to improve communication practices.[9, 31] Beyond geographic localization of patients, it is critical to ensure team members are committed to the changes in workflow by directly involving them through the design and implementation of new models of care taking place on the unit. This commitment starts from the top senior nurse and physician leaders in the organization, and extends to the unit‐based dyad partners, and down to each individual interdisciplinary team member on the unit.[1] Thus, it is critical to clarify roles and responsibilities and how team members on the unit will interact with each other. For some situations, conflict management training will be helpful to the unit‐based leaders to resolve issues. To appreciate potential barriers to successful rollout of this unit leadership model, a phased implementation of pilot units, followed by successive waves, should be considered. Many of the units that instituted unit‐based interdisciplinary team rounds solicited and implemented direct feedback from frontline team members in efforts to improve communication and be more patient centered. Conversely, there are also likely to be situations where the unit‐based leaders will be confronted with hindrances to their unit‐based collaborative improvement efforts. To help prepare the dyad leaders, many of our unit‐based leaders have received specific training on how to coach and conduct difficult conversations with individuals who have performance gaps or are perceived to be hindering the progress of the unit's work. These crucial negotiation skills are not innate among most managers and should be explicitly provided to new leaders across organizations.
The goals and merits of patient‐ and family‐centered care (PFCC) have been well described.[32, 33, 34] Organizational support to teach and disseminate PFCC practices throughout all settings of care may help the leadership dyads implement rounding strategies that engage all staff, patients, and family members throughout the hospital course and during the transitions out of the hospital.
Clinical workflow has become heavily dependent on the EHR systems. For those organizations that have yet to adopt a particular EHR system, the leadership dyads should be involved throughout the EHR design process to help ensure that the technological solutions will be built to assist the clinical workflow, and once the system has been built, the leadership dyad should monitor and enhance the interface between workflow and EHR system so that it can support the creation and advancement of interdisciplinary plans of care on the unit.
CONCLUSION
The care of the hospitalized patient has become more complex over time. Interdisciplinary teamwork needs to be improved at the unit level to achieve the strategic goals of the hospital. Although quality improvement is an organizational goal, change takes place locally. Physician leaders, in partnership with nurse managers, are needed now more than ever to take on this task to improve the hospital‐care experience for patients by functioning as the primary effector arms for changing the landscape of hospital‐based care. We have described characteristics of unit‐based leadership programs adopted across 6 organizations. Hospitalists with clinical experience as the principal providers of inpatient‐based care and quality improvement experience and training, have been key participants in the development and implementation of the local leadership models in each of these hospital systems. We hope the comparison of the various models featured in this article serves as a valuable reference to hospitals and healthcare organizations who are contemplating the incorporation of this model into their strategic plan.
- , , , et al. Organizational predictors of coordination in inpatient medicine [published online ahead of print February 26, 2014]. Health Care Manage Rev. doi: 10.1097/HMR.0000000000000004.
- . Trends in case‐mix in the medicare population. Paper presented at: American Hospital Association, Federation of American Hospitals, Association of American Medical Colleges; http://www.aha.org/content/00‐10/100715‐CMItrends.pdf. July 15, 2010.
- . A requirement to reduce readmissions: take care of the patient, not just the disease. JAMA. 2013;309(4):394–396.
- , . Value‐based purchasing—national programs to move from volume to value. N Engl J Med. 2012;367(4):292–295.
- Medicare and Medicaid programs; electronic health record incentive program. Final rule. Fed Regist. 2010;75(144):44313–44588.
- . The Center for Medicare and Medicaid innovation's blueprint for rapid‐cycle evaluation of new care and payment models. Health Aff (Millwood). 2013;32(4):807–812.
- Institute of Medicine. Crossing the Quality Chasm: A New Health System for the 21st Century. Washington, DC: National Academies Press; 2001.
- , , , , , . Improving teamwork: impact of structured interdisciplinary rounds on a medical teaching unit. J Gen Intern Med. 2010;25(8):826–832.
- , , , et al. Impact of localizing physicians to hospital units on nurse‐physician communication and agreement on the plan of care. J Gen Intern Med. 2009;24(11):1223–1227.
- , , , . A review on systematic reviews of health information system studies. J Am Med Inform Assoc. 2010;17(6):637–645.
- , , , , . Patient whiteboards as a communication tool in the hospital setting: a survey of practices and recommendations. J Hosp Med. Apr 2010;5(4):234–239.
- , , . Development of a checklist for documenting team and collaborative behaviors during multidisciplinary bedside rounds. J Nurs Adm. 2013;43(5):280–285.
- , , , , . Assessment of teamwork during structured interdisciplinary rounds on medical units. J Hosp Med. 2012;7(9):679–683.
- , , , et al. Leadership at the front line: a clinical partnership model on general care inpatient units. Am J Med Qual. 2012;27(2):106–111.
- , . AHRQ health care innovations exchange: improvement projects led by unit‐based teams of nurse, physician, and quality leaders reduce infections, lower costs, improve patient satisfaction, and nurse‐physician communication. Available at: http://www.innovations.ahrq.gov/content.aspx?id=2719. Published April 14, 2010. Accessed November 26, 2011.
- , , , , , . Microsystems in health care: part 8. Developing people and improving work life: what front‐line staff told us. Jt Comm J Qual Saf. 2003;29(10):512–522.
- , , , et al. Microsystems in health care: part 5. How leaders are leading. Jt Comm J Qual Saf. 2003;29(6):297–308.
- , , . The academic dilemma of the inpatient unit director. Am J Psychiatry. 1989;146(1):73–76.
- , , , , . Improving and sustaining core measure performance through effective accountability of clinical microsystems in an academic medical center. Jt Comm J Qual Patient Saf. 2010;36(9):387–398.
- , , . Physician leadership and quality improvement in the acute child and adolescent psychiatric care setting. Child Adolesc Psychiatr Clin N Am. 2010;19(1):1–19; table of contents.
- , , , . Effect of a multidisciplinary intervention on communication and collaboration among physicians and nurses. Am J Crit Care. 2005;14(1):71–77.
- , . Nurse‐physician leadership: insights into interprofessional collaboration. J Nurs Adm. 2013;43(12):653–659.
- The Advisory Board. University of Pennsylvania Health System pilots unit clinical leadership model to spur quality gains. Nurs Exec Watch. 2008;9(2):4–6.
- , . Physicians as leaders in improving health care: a new series in Annals of Internal Medicine. Ann Intern Med. 1998;128(4):289–292.
- . Understanding medical systems. Ann Intern Med. 1998;128(4):293–298.
- . The four habits of high‐value health care organizations. N Engl J Med. 2011;365(22):2045–2047.
- , , , et al. Microsystems in health care: Part 1. Learning from high‐performing front‐line clinical units. Jt Comm J Qual Improv. 2002;28(9):472–493.
- , , , et al. The quality and safety educators academy: fulfilling an unmet need for faculty development. Am J Med Qual. 2014;29(1):5–12.
- , , , . Cooperation: the foundation of improvement. Ann Intern Med. 1998;128(12 pt 1):1004–1009.
- , , , , , . Ten principles of good interdisciplinary team work. Hum Resour Health 2013;11(1):19.
- , , , et al. Impact of localizing general medical teams to a single nursing unit. J Hosp Med. 2012;7(7):551–556.
- , , , . Integrating patient‐ and family‐centered care with health policy: four proposed policy approaches. Qual Manag Health Care. 2013;22(2):137–145.
- , , . Incorporating patient‐ and family‐centered care into resident education: approaches, benefits, and challenges. J Grad Med Educ. 2011;3(2):272–278.
- Smith M, Saunders R, Stuckhardt L, McGinnis JM, eds. Best Care at Lower Cost: The Path to Continuously Learning Health Care in America. Washington, DC: National Academies Press; 2012.
Hospital‐based care has become more complex over time. Patients are sicker, with more chronic comorbid conditions requiring greater collaboration to provide coordinated patient care.[1, 2] Care coordination requires an interdisciplinary approach during hospitalization and especially during transitions of care.[3, 4] In addition, hospitals are tasked with managing and improving clinical workflow efficiencies, and implementing electronic health records (EHR)[5] that require healthcare professionals to learn new systems of care and technology. Payment models have also started to shift toward an incentive and penalty‐based structure in the form of value‐based purchasing, readmission penalties, hospital‐acquired conditions, and meaningful use.[4, 6]
In response to these pressures, hospitals are searching for ways to reliably deliver quality care that is safe, effective, patient centered, timely, efficient, and equitable.[7] Previous efforts to improve quality in the general medical inpatient setting have included redesign of the clinical work environment and new workflows through the use of checklists and whiteboards to enhance communication, patient‐centered bedside rounds, standardized protocols and handovers, and integrated clinical decision support using health information technology.[8, 9, 10, 11, 12, 13] Although each of these care coordination activities has potential value, integrating them at the unit level often remains a challenge. Some hospitals have addressed this challenge by establishing and supporting a unit‐based leadership model, where a medical director and nurse manager work together to assess and improve the quality, safety, efficiency, and patient experience‐based mission of the organization.[14, 15] However, there are few descriptions of this leadership model in the current literature. Herein, we present the unit‐based leadership model that has been developed and implemented at 6 hospitals.
MODELS OF UNIT‐BASED LEADERSHIP
The unit‐based leadership model is grounded on the idea that culture and clinical care are products of frontline structure, process, and relationships, and that leaders at the site of care can have the greatest influence on the local work environment.[16, 17] The objective is to influence care and culture at the bedside and the unit, where care is delivered and where alignment with organizational vision and mission must occur. The concept of the inpatient unit medical director is not new, and hospitals in the past have recruited physician leaders to become clinical champions for quality improvement and help establish a collaborative work environment for physicians and unit‐based staff.[18, 19, 20, 21, 22] These studies report on the challenges and benefits of incorporating a medical director to inpatient psychiatry or general care units, but do not provide specific details about the recruitment and responsibilities for unit‐based dyad partnerships, which are critical factors for success on multidisciplinary inpatient care units.
There are several logistical matters to consider when instituting a unit‐based leadership model. These include the composition of the leadership team, selection process of the leaders, the presence of trainees and permanent faculty, and whether the units are able to geographically cohort patients. Other considerations include a clear role description with established shared goals and expectations, and a compensation model that includes effort and incentives. In addition, there should be a clearly established reporting structure to senior leadership, and the unit leaders should be given opportunities for professional growth and development. Table 1 provides a summary overview of 6 hospitals' experiences to date.
| Structure | Hospital of the University of Pennsylvania | Northwestern Memorial Hospital | Emory University Hospital | University of Michigan Health System | Christiana Care Health System | St. Joseph Mercy Health System/Integrated Health Associates |
|---|---|---|---|---|---|---|
| ||||||
| Description of hospital(s) | Academic medical center, 784 beds, 40,000 annual admissions | Academic medical center, 897 beds, 53,000 annual admissions | Academic medical center, 579 beds, 24,000 annual admissions | Academic medical center, 839 beds, 45,000 annual admissions | Independent academic medical center, 1,100 beds, 53,000 annual admissions | Tertiary community hospital that is part of a larger health care system (Trinity Health), 579 beds, 33,000 annual admissions |
| Unit leadership model | Triad of medical director, nurse manager, and quality improvement specialist/project manager | Dyad of medical director and nurse manager | Dyad of medical director and nurse manager | Dyad of medical director and nurse manager | Dyad of medical director and nurse manager | Dyad of medical director and nurse manager |
| Percent effort time supported for unit medical director | 10% | 17% | 10% | 20% | 20% | 10% |
| Incentives built into unit leaders' performance in outcomes metrics | No | Yes | No | No | No | Yes |
| Professional development/leadership training | Quality improvement method: PDSA, Six Sigma, Lean Healthcare | Quality improvement method: Six Sigma | Situational leadership training with 1:1 mentoring | Quality improvement method: Lean Healthcare, service excellence program | Quality Improvement method: Six Sigma, Lean Healthcare | Quality improvement method: Six Sigma |
| Additional leadership development through Penn Medicine Leadership Academy and Wharton Executive Education | Additional leadership development through Northwestern's professional development center and simulation training center | Conflict resolution skill development | Attend patient and Family Centered Care conference | Additional leadership development through Christiana Care Learning Institute | Attend educational course on Crucial Conversations | |
| Personality profile with coaching | Additional leadership development through University of Michigan Health System's human resources group | |||||
| Outcomes metrics monitored | Patient satisfaction | Patient satisfaction | Patient satisfaction | Patient satisfaction | Patient satisfaction | Patient satisfaction |
| Efficiency of multidisciplinary rounds | Teamwork climate (survey) | Teamwork and implementation of structured interdisciplinary bedside rounds | Multidisciplinary rounds | Interdisciplinary rounds | Participation in interdisciplinary rounds | |
| RNMD work environment surveys | Adverse events | Unit‐based patient safety culture survey | Patient‐centered, bedside rounds | Readmission rates | ||
| Hospital‐acquired conditions (CAUTI, CLABSI, VAP, DVT, pressure ulcers) | Hospital‐acquired conditions (fall rates, pressure ulcers | Hospital‐acquired conditions (CAUTI, CLABSI, fall rates, pressure ulcers) | Hospital‐acquired conditions (CAUTI) | Hospital‐acquired conditions (fall rates, pressure ulcers) | Core measures | |
| Readmission rates | Readmission rates | Mortality | Readmission rates | Readmission rates | Medication reconciliation | |
| Core measures, patient safety indicators | Core measures | Length of stay | DVT prophylaxis | Hand hygiene | Discharge by 11 am | |
| Mortality (observed to expected, transfer, inpatient) | Hand hygiene | Glycemic control | Meeting attendance | Length of stay | Use of patient teach‐back | |
| Medication reconciliation | Restraint use | Communication with PCPs | ||||
| Home care, hospice, post‐acute care referral rates | ||||||
| Organizational leadership structure support for clinical unit partnership program | CMO, CNO, vice president of quality/patient safety, directors of medical and surgical nursing | Associate chair of medicine, director of medicine nursing; all medical directors are members of the department of medicine quality management committee | CMO, CNO, CEO, CQO | CMO, CNO | All teams report to and are supported by 3 overarching, system‐wide committees: (1) safety first, (2) think of yourself as a patient, (3) clinical excellence. Those committees, in turn, report up to the senior management quality/safety coordinating council. | Director of hospitalist program (reports to CMO); nursing director of acute care (reports to CNO) |
DISCUSSION
In reviewing our 6 organization's collective experiences, we identified several common themes and some notable differences across sites. The core of the leadership team was primarily composed of the medical director and nurse manager on the unit. Across all 6 organizations, medical directors had a portion of their effort supported for their leadership work on the unit. Leadership development training was provided at all of our sites, with particular emphasis on quality improvement (QI) methods such as Six‐Sigma, Lean, or Plan, Do, Study, Act (PDSA). Additional leadership development sessions were provided through the organization's human resources or affiliated university. Common outcome measures of interest include patient satisfaction, interdisciplinary practice, and collaboration on the unit, and some hospital‐acquired condition measures. Last, there is a direct reporting relationship to a chief or senior nurse or physician leader within each organization. These commonalities and variances are further detailed below.
Establishing the Unit‐Based Leadership Model
The composition of the unit‐based leadership model in our 6 organizations is predominantly a dyad partnership of medical directors and nurse managers. Although informal physician‐nurse collaborative practices have likely been in existence at many hospitals, formalizing this dyad partnership is an important step to fostering collaborative efforts to improve quality of care. It is also essential for hospital leadership to clearly articulate the need for this unit‐based leadership model. Whether the motivation for change is from a previously untenable practice environment, or part of an ongoing improvement program, the model should be presented in a manner that supports the organization's commitment to improve collaborative practices for better patient care. One of our 6 hospitals initiated this leadership model based on troubling relationships between nurses and physicians on some of their inpatient care units, which threatened to stall the organization's Magnet application. Implementation of the leadership model at the unit level yielded improvements in nursephysician interactions, patient satisfaction, and staff turnover.[15, 23] Another of the hospitals first evaluated why a previous attempt at this model did not deliver the intended outcomes, and redesigned the model based on its analysis.[14]
Across all of the organizations featured here, a common driver behind the adoption of the unit‐based leadership model was to bridge the divide between physician services and nursing and other allied health providers. We found that many of the physicians routinely had patients on multiple units, limiting the quantity and quality of collaborative practices between unit‐based staff and physician teams. The unit‐based dyad leaders are ideally positioned to build and foster a culture of collaboration, and our organizations have been inclusive to ensure the participation of a multidisciplinary group of providers, including representatives from pharmacy, environmental services, physical therapy, respiratory therapy, social work, case management, and nutrition at leadership meetings or in daily patient‐care discussions. In addition, 2 of the organizations have added quality improvement specialist/project managers to their teams to support the physiciannurse manager leaders on the unit.
Selection Process and Professional Development
The traditional approach to hiring a physician leader or a nurse manager has been an isolated process of drafting a job description for each position and hiring within their respective departments. For the dyad partnership to be successful, there should be established goals and expectations that require shared responsibilities between the 2 partners, which should guide the selection of these leaders. Other leadership attributes and essential character traits that should be modeled by the unit‐based leaders include good communication skills, respect among coworkers, and a collaborative approach to decision making and action. In addition, both physician leaders and nurse managers in these roles should have the ability to take a system's view, recognizing that within the complex network of healthcare providers and processes on their unit, these elements interact with each other, which lead to the outcomes achieved on their units.[24, 25] Table 2 lists some general shared responsibilities, highlighting specific activities that can be used to achieve the established outcomes. As the unit's dyad leadership works together to address these shared responsibilities, they should keep their sights focused on the overall strategic goals of the healthcare organization. Bohmer has defined 4 habits of the high‐value healthcare organization that in turn can be reflected through the inpatient unit leadership model to capture these activities at the local level: (1) planning care for specific patient populations, (2) microsystem design, (3) measurement and oversight, and (4) self‐study.[26] In determining specific shared responsibilities for each dyad partner, it is important for these leaders to understand the clinical microsystem of their unit such as their patient population, interdisciplinary care team, approach to process improvement, and performance patterns over time.[27]
| General Shared Responsibilities of Physician and Nurse Unit Directors | Examples of Specific Activities |
|---|---|
| |
| Serve as management partners to enhance culture of the unit | Co‐craft and deliver consistent leadership message |
| Co‐establish and enforce unit processes and protocols | |
| Co‐lead recruitment and retention efforts | |
| Co‐orient trainees and faculty rotating through unit | |
| Co‐educate on the management of common medical and surgical conditions | |
| Facilitate interstaff conflict resolution sessions | |
| Regular leadership meetings | |
| Actively manage unit processes and outcomes | Quality: improve core quality measure performance |
| Safety: improve culture of patient safety within the unit as measured by surveys and incident reporting systems | |
| Efficiency: reduce unnecessary length of stay and variability in resource use | |
| Patient experience: focus on improving patient‐family experience with targeted outcomes in patient experience metrics (eg, HCAHPS) | |
| Education: develop trainee and staff clinical and teamwork competencies | |
| Continuous process improvement initiatives (eg, PDSA cycles) | Improve the discharge transitions process, tailoring the process to each individual patient's identified risk factors |
| Focus improvement efforts on reduction in specific hospital acquired conditions such as CAUTI, VTE, CLABSI, pressure ulcers, falls | |
| Measure, analyze, reassess, and improve in all described areas of shared responsibilities | |
| Perform unit level chart reviews to evaluate readmissions and LOS and identify improvement opportunities | |
In our collective experience, the dyad leaders bring passion and commitment to improving care; however, many (the medical directors in particular) have minimal prior formal training in leadership, quality improvement, or hospital management. Recognizing that unit leaders require specialized knowledge and skills, each of our organizations has enrolled unit medical directors and nurse managers in leadership development courses or educational programs. Many healthcare organizations have become more grounded in a QI methodology including Six‐Sigma, Lean Healthcare, PDSA, and other scientifically based methods, and the unit‐based leaders should receive advanced training in the preferred methods of their institution. Additional training in quality improvement, patient safety, and physician leadership can also be obtained through supplemental coursework specifically designed to train hospital leaders, with some programs leading to a certification or additional credentials.[28]
Beyond such formal educational opportunities, hospitals should not overlook the opportunity to learn from and share experiences with the other dyad leadership units within the hospital. One of the organizations described here holds monthly meetings with all of the unit dyad leaders, and 2 other organizations conduct quarterly meetings to share experiences and best practices related to specific improvement initiatives in a learning network model. Those units with more experience in specific initiatives are asked to share their lessons learned with others, as well as support each other in their efforts to collectively meet the strategic goals of the hospital.
Time and Organizational Support
In addition to leadership development, hospitals and the clinical department leadership need to support the medical directors with dedicated time away from their usual clinical duties. Some organizations in this report are providing up to 20% effort for the medical director's unit‐based leadership work; however, there is some variation in practice with regard to physician effort across sites. The University of Pennsylvania has a smaller effort support at 10%; however, some of that effort differential may be offset through the allocation of the quality improvement specialist/project manager assigned to work with the medical director and nurse manager dyad. St. Joseph Mercy Hospital also has a lower allocation, as there is additional financial compensation for the role that is at risk and not included in this 10% allocation.
It is also important to assure that the medical directors have institutional support to carry out their work in partnership with their nursing leadership. The 6 health systems described here report that although most of the physicians have appointments within a physician group or clinical department, there is hospital leadership oversight from a chief medical, nursing, or operating officer. This organizational structure may be an important aspect of the model as the unit‐based leaders seek to align their efforts with that of the hospital. Further, this form of organizational oversight can ensure that the unit leaders will receive timely and essential unit‐ and hospital‐based performance measures to manage local improvement efforts. These measures may include some components of patient experiences as reported in the Hospital Consumer Assessment of Healthcare Providers and Systems survey, readmission rates, hospital‐acquired condition rates, length of stay, observed to expected mortality rates, and results of staff satisfaction and safety culture surveys. As highlighted by several studies and commentaries, our collective experiences also identified interdisciplinary teamwork, collaboration, and communication as desirable outcome measures through the unit‐based leadership structure.[21, 22, 24, 29, 30] The medical director and nurse manager dyads can prioritize their improvement efforts based on the data provided to them, and mobilize the appropriate group of multidisciplinary practitioners and support staff on the unit.
OTHER CONSIDERATIONS
Other infrastructure variables that may increase the effectiveness of the unit leadership dyad include unit‐based clinical services (geographic localization), engaging the frontline team members in the design and implementation of change innovations, a commitment to patient and family centered practices on the unit, and enhancing clinical workflow through the support of EHR functions such as concurrent documentation and provider order entry. Geographic localization, placing the fewest possible clinical service providers on the unit to work alongside unit‐based staff, allows for a cohesive interdisciplinary unit‐based team to develop under the dyad leadership, and has been shown to improve communication practices.[9, 31] Beyond geographic localization of patients, it is critical to ensure team members are committed to the changes in workflow by directly involving them through the design and implementation of new models of care taking place on the unit. This commitment starts from the top senior nurse and physician leaders in the organization, and extends to the unit‐based dyad partners, and down to each individual interdisciplinary team member on the unit.[1] Thus, it is critical to clarify roles and responsibilities and how team members on the unit will interact with each other. For some situations, conflict management training will be helpful to the unit‐based leaders to resolve issues. To appreciate potential barriers to successful rollout of this unit leadership model, a phased implementation of pilot units, followed by successive waves, should be considered. Many of the units that instituted unit‐based interdisciplinary team rounds solicited and implemented direct feedback from frontline team members in efforts to improve communication and be more patient centered. Conversely, there are also likely to be situations where the unit‐based leaders will be confronted with hindrances to their unit‐based collaborative improvement efforts. To help prepare the dyad leaders, many of our unit‐based leaders have received specific training on how to coach and conduct difficult conversations with individuals who have performance gaps or are perceived to be hindering the progress of the unit's work. These crucial negotiation skills are not innate among most managers and should be explicitly provided to new leaders across organizations.
The goals and merits of patient‐ and family‐centered care (PFCC) have been well described.[32, 33, 34] Organizational support to teach and disseminate PFCC practices throughout all settings of care may help the leadership dyads implement rounding strategies that engage all staff, patients, and family members throughout the hospital course and during the transitions out of the hospital.
Clinical workflow has become heavily dependent on the EHR systems. For those organizations that have yet to adopt a particular EHR system, the leadership dyads should be involved throughout the EHR design process to help ensure that the technological solutions will be built to assist the clinical workflow, and once the system has been built, the leadership dyad should monitor and enhance the interface between workflow and EHR system so that it can support the creation and advancement of interdisciplinary plans of care on the unit.
CONCLUSION
The care of the hospitalized patient has become more complex over time. Interdisciplinary teamwork needs to be improved at the unit level to achieve the strategic goals of the hospital. Although quality improvement is an organizational goal, change takes place locally. Physician leaders, in partnership with nurse managers, are needed now more than ever to take on this task to improve the hospital‐care experience for patients by functioning as the primary effector arms for changing the landscape of hospital‐based care. We have described characteristics of unit‐based leadership programs adopted across 6 organizations. Hospitalists with clinical experience as the principal providers of inpatient‐based care and quality improvement experience and training, have been key participants in the development and implementation of the local leadership models in each of these hospital systems. We hope the comparison of the various models featured in this article serves as a valuable reference to hospitals and healthcare organizations who are contemplating the incorporation of this model into their strategic plan.
- , , , et al. Organizational predictors of coordination in inpatient medicine [published online ahead of print February 26, 2014]. Health Care Manage Rev. doi: 10.1097/HMR.0000000000000004.
- . Trends in case‐mix in the medicare population. Paper presented at: American Hospital Association, Federation of American Hospitals, Association of American Medical Colleges; http://www.aha.org/content/00‐10/100715‐CMItrends.pdf. July 15, 2010.
- . A requirement to reduce readmissions: take care of the patient, not just the disease. JAMA. 2013;309(4):394–396.
- , . Value‐based purchasing—national programs to move from volume to value. N Engl J Med. 2012;367(4):292–295.
- Medicare and Medicaid programs; electronic health record incentive program. Final rule. Fed Regist. 2010;75(144):44313–44588.
- . The Center for Medicare and Medicaid innovation's blueprint for rapid‐cycle evaluation of new care and payment models. Health Aff (Millwood). 2013;32(4):807–812.
- Institute of Medicine. Crossing the Quality Chasm: A New Health System for the 21st Century. Washington, DC: National Academies Press; 2001.
- , , , , , . Improving teamwork: impact of structured interdisciplinary rounds on a medical teaching unit. J Gen Intern Med. 2010;25(8):826–832.
- , , , et al. Impact of localizing physicians to hospital units on nurse‐physician communication and agreement on the plan of care. J Gen Intern Med. 2009;24(11):1223–1227.
- , , , . A review on systematic reviews of health information system studies. J Am Med Inform Assoc. 2010;17(6):637–645.
- , , , , . Patient whiteboards as a communication tool in the hospital setting: a survey of practices and recommendations. J Hosp Med. Apr 2010;5(4):234–239.
- , , . Development of a checklist for documenting team and collaborative behaviors during multidisciplinary bedside rounds. J Nurs Adm. 2013;43(5):280–285.
- , , , , . Assessment of teamwork during structured interdisciplinary rounds on medical units. J Hosp Med. 2012;7(9):679–683.
- , , , et al. Leadership at the front line: a clinical partnership model on general care inpatient units. Am J Med Qual. 2012;27(2):106–111.
- , . AHRQ health care innovations exchange: improvement projects led by unit‐based teams of nurse, physician, and quality leaders reduce infections, lower costs, improve patient satisfaction, and nurse‐physician communication. Available at: http://www.innovations.ahrq.gov/content.aspx?id=2719. Published April 14, 2010. Accessed November 26, 2011.
- , , , , , . Microsystems in health care: part 8. Developing people and improving work life: what front‐line staff told us. Jt Comm J Qual Saf. 2003;29(10):512–522.
- , , , et al. Microsystems in health care: part 5. How leaders are leading. Jt Comm J Qual Saf. 2003;29(6):297–308.
- , , . The academic dilemma of the inpatient unit director. Am J Psychiatry. 1989;146(1):73–76.
- , , , , . Improving and sustaining core measure performance through effective accountability of clinical microsystems in an academic medical center. Jt Comm J Qual Patient Saf. 2010;36(9):387–398.
- , , . Physician leadership and quality improvement in the acute child and adolescent psychiatric care setting. Child Adolesc Psychiatr Clin N Am. 2010;19(1):1–19; table of contents.
- , , , . Effect of a multidisciplinary intervention on communication and collaboration among physicians and nurses. Am J Crit Care. 2005;14(1):71–77.
- , . Nurse‐physician leadership: insights into interprofessional collaboration. J Nurs Adm. 2013;43(12):653–659.
- The Advisory Board. University of Pennsylvania Health System pilots unit clinical leadership model to spur quality gains. Nurs Exec Watch. 2008;9(2):4–6.
- , . Physicians as leaders in improving health care: a new series in Annals of Internal Medicine. Ann Intern Med. 1998;128(4):289–292.
- . Understanding medical systems. Ann Intern Med. 1998;128(4):293–298.
- . The four habits of high‐value health care organizations. N Engl J Med. 2011;365(22):2045–2047.
- , , , et al. Microsystems in health care: Part 1. Learning from high‐performing front‐line clinical units. Jt Comm J Qual Improv. 2002;28(9):472–493.
- , , , et al. The quality and safety educators academy: fulfilling an unmet need for faculty development. Am J Med Qual. 2014;29(1):5–12.
- , , , . Cooperation: the foundation of improvement. Ann Intern Med. 1998;128(12 pt 1):1004–1009.
- , , , , , . Ten principles of good interdisciplinary team work. Hum Resour Health 2013;11(1):19.
- , , , et al. Impact of localizing general medical teams to a single nursing unit. J Hosp Med. 2012;7(7):551–556.
- , , , . Integrating patient‐ and family‐centered care with health policy: four proposed policy approaches. Qual Manag Health Care. 2013;22(2):137–145.
- , , . Incorporating patient‐ and family‐centered care into resident education: approaches, benefits, and challenges. J Grad Med Educ. 2011;3(2):272–278.
- Smith M, Saunders R, Stuckhardt L, McGinnis JM, eds. Best Care at Lower Cost: The Path to Continuously Learning Health Care in America. Washington, DC: National Academies Press; 2012.
Benefit of Teamwork Training
Teamwork is tightly linked to patient safety for hospitalized patients. Barriers to teamwork in hospital settings abound, including large team sizes and dynamic team membership because of the need to provide care 24 hours a day, 7 days a week. Team members are often dispersed across clinical service areas and care for multiple patients at the same time. Compounding the potential for these structural barriers to impede teamwork, professionals seldom receive any formal training to enhance teamwork skills, and students and trainees have relatively few interactions during their formative years with individuals outside of their own profession. In this issue of the Journal of Hospital Medicine, Tofil et al. describe the effect of a novel interprofessional training program to improve teamwork among medical and nursing students at the University of Alabama.[1] The curriculum included 4, 1‐hour simulation sessions and resulted in improved ratings of self‐efficacy with communication and teamwork attitudes. The authors report that the curriculum has continued and expanded to include other health professionals.
Beyond the short‐term results, the curriculum developed by Tofil and colleagues may have lasting effects on individual participants. Students, exposed to one another during a particularly impressionable period of their professional development, may develop better appreciation for the priorities, responsibilities, needs, and expertise of others. The experience may inoculate them from adopting unfavorable behaviors and attitudes that are common among practicing clinicians and comprise the hidden curriculum, which often undermines the goals of the formal curriculum.[2] An early, positive experience with other team members may be especially important for medical students, as physicians tend to be relatively unaware of deficiencies in interprofessional collaboration.[3]
Though undoubtedly valuable to the learners and contributing to our collective knowledge on the subject, the study by Tofil and colleagues includes limitations common to teamwork training curricula.[4] To make the potential of teamwork training a reality in improving patient outcomes, we must first revisit some key teamwork concepts and principles of curriculum development. Baker and colleagues define a team as consisting of 2 or more individuals, who have specific roles, perform interdependent tasks, are adaptable, and share a common goal.[5] For a team to be successful, individual team members must have specific knowledge, skills, and attitudes (ie, competencies).[6] For team training curricula to be successful, existing frameworks like TeamSTEPPS (Team Strategies and Tools to Enhance Performance and Patient Safety) should be used to define learning objectives.[7] Because teamwork is largely behavioral and affective, simulation is the most appropriate instruction method. Simulation involves deliberate practice and expert feedback so that learners can iteratively enhance teamwork skills. Other instructional methods (eg, didactics, video observation and debriefing, brief role play without feedback) are too weak to be effective.
Importantly, Tofil and colleagues used an accepted teamwork framework to develop learning objectives, simulation as the instructional method, and an interprofessional team (ie, a physician, nurse, and an adult learning professional with simulation expertise) to perform simulation debriefings. However, for team training to achieve its full potential, leaders of future efforts need to aim for higher level outcomes. Positive reactions are encouraging, but what we really want to know is that learners truly adopted new skills and attitudes, applied them in real‐world clinical settings, and that patients benefited from them. These are high but achievable goals and absolutely necessary to advance the credibility of team training. Relatively few studies have evaluated the impact of team training on patient outcomes, and the available evidence is equivocal.[8, 9] The intensity and duration of deliberate practice during simulation exercises must be sufficient to change ingrained behaviors and to ensure transfer of enhanced skills to the clinical setting if our goal is to improve patient outcomes.
Leaders of future efforts must also develop innovative simulation exercises that reflect the real‐life challenges and contexts for medical teamwork including dispersion of team members, challenges of communication in hierarchical teams, and competing demands under increasing time pressure. Simulated communication events could include a nurse deciding whether and how to contact a physician not immediately present (and vice versa). Sessions should include interruptions and require participants to multitask to replicate the clinical environment. Notably, simulation exercises provide an opportunity for assessment using a behaviorally anchored rating scale, which is often impractical in real clinical settings because team members are seldom in the same place at the same time. Booster simulation sessions should be provided to ensure skills do not decay over time. In situ simulation (ie, simulation events in the real clinical setting) offers the ability to reveal latent conditions impeding the efficiency or quality of communication among team members.
Most importantly, simulation‐based teamwork training must be combined with system redesign and improvement. Enhanced communication skills will only go so far if team members never have a chance to use them. Leaders should work with their hospitals to remove systemic barriers to teamwork. Opportunities for improvement include geographic localization of physicians, assigning patients to nurses to maximize homogeneity of team members, optimizing interprofessional rounds, and leveraging information and communication technologies. Simulation training should be seen as a complement to these interventions rather than a substitute.
Challenges to teamwork are multifactorial and therefore require multifaceted interventions. Simulation is essential to enhance teamwork skills and attitudes. For efforts to translate into improved patient outcomes, leaders must use innovative approaches and combine simulation training with system redesign and improvement.
- , , , et al. Interprofessional simulation training improves knowledge and teamwork in nursing and medical students during internal medicine clerkship. J Hosp Med. 2014;9(3):189–192.
- . Beyond curriculum reform: confronting medicine's hidden curriculum. Acad Med. 1998;73(4):403–407.
- , , , , , . Teamwork on inpatient medical units: assessing attitudes and barriers. Qual Saf Health Care. 2010;19(2):117–121.
- , , . Contributions of simulation‐based training to teamwork. In: Baker DP, Battles JB, King HB, Wears RL, eds. Improving Patient Safety Through Teamwork and Team Training. New York, NY: Oxford University Press; 2013:218–227.
- , , . Teamwork as an essential component of high‐reliability organizations. Health Serv. Res. 2006;41(4 pt 2):1576–1598.
- , , , , . The role of teamwork in the professional education of physicians: current status and assessment recommendations. Jt Comm J Qual Patient Saf. 2005;31(4):185–202.
- , , , et al. TeamSTEPPS: Team Strategies and Tools to Enhance Performance and Patient Safety Advances in Patient Safety: New Directions and Alternative Approaches. Vol. 3. Performance and Tools. Rockville, MD: Agency for Healthcare Research and Quality; 2008.
- , , , et al. Effects of a multicentre teamwork and communication programme on patient outcomes: results from the Triad for Optimal Patient Safety (TOPS) project. BMJ Qual Saf. 2012;21(2):118–126.
- , , , . Simulation exercises as a patient safety strategy: a systematic review. Ann Intern Med. 2013;158(5 pt 2):426–432.
Teamwork is tightly linked to patient safety for hospitalized patients. Barriers to teamwork in hospital settings abound, including large team sizes and dynamic team membership because of the need to provide care 24 hours a day, 7 days a week. Team members are often dispersed across clinical service areas and care for multiple patients at the same time. Compounding the potential for these structural barriers to impede teamwork, professionals seldom receive any formal training to enhance teamwork skills, and students and trainees have relatively few interactions during their formative years with individuals outside of their own profession. In this issue of the Journal of Hospital Medicine, Tofil et al. describe the effect of a novel interprofessional training program to improve teamwork among medical and nursing students at the University of Alabama.[1] The curriculum included 4, 1‐hour simulation sessions and resulted in improved ratings of self‐efficacy with communication and teamwork attitudes. The authors report that the curriculum has continued and expanded to include other health professionals.
Beyond the short‐term results, the curriculum developed by Tofil and colleagues may have lasting effects on individual participants. Students, exposed to one another during a particularly impressionable period of their professional development, may develop better appreciation for the priorities, responsibilities, needs, and expertise of others. The experience may inoculate them from adopting unfavorable behaviors and attitudes that are common among practicing clinicians and comprise the hidden curriculum, which often undermines the goals of the formal curriculum.[2] An early, positive experience with other team members may be especially important for medical students, as physicians tend to be relatively unaware of deficiencies in interprofessional collaboration.[3]
Though undoubtedly valuable to the learners and contributing to our collective knowledge on the subject, the study by Tofil and colleagues includes limitations common to teamwork training curricula.[4] To make the potential of teamwork training a reality in improving patient outcomes, we must first revisit some key teamwork concepts and principles of curriculum development. Baker and colleagues define a team as consisting of 2 or more individuals, who have specific roles, perform interdependent tasks, are adaptable, and share a common goal.[5] For a team to be successful, individual team members must have specific knowledge, skills, and attitudes (ie, competencies).[6] For team training curricula to be successful, existing frameworks like TeamSTEPPS (Team Strategies and Tools to Enhance Performance and Patient Safety) should be used to define learning objectives.[7] Because teamwork is largely behavioral and affective, simulation is the most appropriate instruction method. Simulation involves deliberate practice and expert feedback so that learners can iteratively enhance teamwork skills. Other instructional methods (eg, didactics, video observation and debriefing, brief role play without feedback) are too weak to be effective.
Importantly, Tofil and colleagues used an accepted teamwork framework to develop learning objectives, simulation as the instructional method, and an interprofessional team (ie, a physician, nurse, and an adult learning professional with simulation expertise) to perform simulation debriefings. However, for team training to achieve its full potential, leaders of future efforts need to aim for higher level outcomes. Positive reactions are encouraging, but what we really want to know is that learners truly adopted new skills and attitudes, applied them in real‐world clinical settings, and that patients benefited from them. These are high but achievable goals and absolutely necessary to advance the credibility of team training. Relatively few studies have evaluated the impact of team training on patient outcomes, and the available evidence is equivocal.[8, 9] The intensity and duration of deliberate practice during simulation exercises must be sufficient to change ingrained behaviors and to ensure transfer of enhanced skills to the clinical setting if our goal is to improve patient outcomes.
Leaders of future efforts must also develop innovative simulation exercises that reflect the real‐life challenges and contexts for medical teamwork including dispersion of team members, challenges of communication in hierarchical teams, and competing demands under increasing time pressure. Simulated communication events could include a nurse deciding whether and how to contact a physician not immediately present (and vice versa). Sessions should include interruptions and require participants to multitask to replicate the clinical environment. Notably, simulation exercises provide an opportunity for assessment using a behaviorally anchored rating scale, which is often impractical in real clinical settings because team members are seldom in the same place at the same time. Booster simulation sessions should be provided to ensure skills do not decay over time. In situ simulation (ie, simulation events in the real clinical setting) offers the ability to reveal latent conditions impeding the efficiency or quality of communication among team members.
Most importantly, simulation‐based teamwork training must be combined with system redesign and improvement. Enhanced communication skills will only go so far if team members never have a chance to use them. Leaders should work with their hospitals to remove systemic barriers to teamwork. Opportunities for improvement include geographic localization of physicians, assigning patients to nurses to maximize homogeneity of team members, optimizing interprofessional rounds, and leveraging information and communication technologies. Simulation training should be seen as a complement to these interventions rather than a substitute.
Challenges to teamwork are multifactorial and therefore require multifaceted interventions. Simulation is essential to enhance teamwork skills and attitudes. For efforts to translate into improved patient outcomes, leaders must use innovative approaches and combine simulation training with system redesign and improvement.
- , , , et al. Interprofessional simulation training improves knowledge and teamwork in nursing and medical students during internal medicine clerkship. J Hosp Med. 2014;9(3):189–192.
- . Beyond curriculum reform: confronting medicine's hidden curriculum. Acad Med. 1998;73(4):403–407.
- , , , , , . Teamwork on inpatient medical units: assessing attitudes and barriers. Qual Saf Health Care. 2010;19(2):117–121.
- , , . Contributions of simulation‐based training to teamwork. In: Baker DP, Battles JB, King HB, Wears RL, eds. Improving Patient Safety Through Teamwork and Team Training. New York, NY: Oxford University Press; 2013:218–227.
- , , . Teamwork as an essential component of high‐reliability organizations. Health Serv. Res. 2006;41(4 pt 2):1576–1598.
- , , , , . The role of teamwork in the professional education of physicians: current status and assessment recommendations. Jt Comm J Qual Patient Saf. 2005;31(4):185–202.
- , , , et al. TeamSTEPPS: Team Strategies and Tools to Enhance Performance and Patient Safety Advances in Patient Safety: New Directions and Alternative Approaches. Vol. 3. Performance and Tools. Rockville, MD: Agency for Healthcare Research and Quality; 2008.
- , , , et al. Effects of a multicentre teamwork and communication programme on patient outcomes: results from the Triad for Optimal Patient Safety (TOPS) project. BMJ Qual Saf. 2012;21(2):118–126.
- , , , . Simulation exercises as a patient safety strategy: a systematic review. Ann Intern Med. 2013;158(5 pt 2):426–432.